Article

Insight into the Desolvation of Organic Electrolyte Cations with Propylene Carbonate as a Solvent in Flat Pores: A First-Principles Calculation

1
College of Mining, Liaoning Technical University, Fuxin 123000, China
2
School of Metallurgy and Materials Engineering, Liaoning Institute of Science and Technology, Benxi 117004, China
3
College of Materials Science and Engineering, Liaoning Technical University, Fuxin 123000, China
*
Author to whom correspondence should be addressed.
Coatings 2023, 13(8), 1384; https://doi.org/10.3390/coatings13081384
Submission received: 18 July 2023 / Revised: 3 August 2023 / Accepted: 6 August 2023 / Published: 7 August 2023

Abstract

:
Supercapacitors have many applications in new energy and other high-tech fields. The desolvation effect on ions affects the capacity size of supercapacitors, and there are few relevant studies published in this field at present. In this experiment, bilayer graphene (BG) with a layer spacing of 4–10 Å was used as a model of flat pores and was calculated with first-principles calculations, which can effectively simulate the adsorption behaviour of porous carbon. The reaction energies of ions, propylene carbonate, and ionic complexes in bilayer graphene with different layer spacings were calculated, and the desolvation behaviour of lithium salt cations (Li+), tetraethyl quaternary ammonium salt cations (TEA+), triethyl methyl quaternary ammonium salt cations (TEMA+), and bipyrrolidinium quaternary ammonium salt cations (SBP+) was investigated. The calculation was based on density functional compact bound (DFTB+) software. The calculated results show that in the stacked system, the complete desolvation size of the TEA+ reaches 5.6 Å, the complete desolvation size of the TEMA+ reaches 4.9 Å, the complete desolvation size of the SBP+ reaches 4.8 Å, and the complete desolvation size of the Li+ reaches 5.4 Å, with the organic electrolyte cations showing a positive trend in the complete desolvation size as the ion radius increases. An in-depth analysis of the data shows that Li+, TEA+, TEMA+, and SBP+ ion radii play a dominant role in the size of desolvation. The results of this paper provide an effective aid for the selection of organic electrolytes to increase the capacity of supercapacitors.

1. Introduction

The supercapacitor is an energy-saving device with advantages including a long cycle life, high capacity, the ability to be charged and discharged quickly, and low pollution. It has a wide range of applications in high-tech fields such as electronics, electric vehicles, the military, and the new energy sector [1,2,3,4]. The performance of supercapacitors is mainly determined by the performance of both the electrolyte and electrode materials. Organic electrolytes are usually used as electrolytes for supercapacitors due to their broad electrochemical window, high ionic conductivity, and low price. At the same time, the water content requirements of organic electrolytes have always been very strict: too much water content will lead to issues with the performance of the capacitors and the working voltage, and even to security problems [5]. Organic electrolytes, such as lithium salts and quaternary ammonium salts, are generally chosen as electrolytes, and solvents, such as propylene carbonate, are added according to the needs of the application [6]. Graphene has excellent optical, electrical, and mechanical properties. It has important application prospects in materials science, micro- and nanoprocessing, energy, biomedicine, and drug delivery, and is considered a revolutionary material for the future [7,8]. In capacitor systems using lithium-salt-cation-based electrolytes, there is frequently a risk of metal deposition on the negative electrode; in addition, incompatibility between graphene and lithium salt cation electrolytes can occur [9,10]. The drawbacks of lithium-sodium-cation-based electrolytes are avoided by using quaternary-ammonium-based electrolytes. Quaternary-ammonium-based electrolytes do not contain the metal ions found in capacitors, so metal deposition does not occur during the charging process. In addition, unlike lithium salt cations that can interact with PC solvent molecules in the electrolyte [11], quaternary ammonium cations do not appear to be present in the graphene layer at the same time as PC solvent molecules. When the solvent’s ion diameter is larger than the average pore diameter (1 nm), the ion solvent’s film gradually becomes smaller until it disappears, the desolvation ions inside the micropores increase, and the capacitance of the supercapacitor increases significantly. The interlayer spacing between the upper and lower graphene layers can be adjusted, which is different from other carbon materials, and by adjusting the layer spacing, the desired size of the flat pores can be obtained [12]. In a previous related work, the group of authors used two different forms of bilayer graphene to simulate flat micropores and investigate their desolvation behaviour towards [Li(H₂O)]+ [13]. Little has been reported on the desolvation behaviour of functionalised flat micropores towards [Li(PC)]+ and [R4(PC)]+.
This study aimed to analyse the desolvation behaviour of organic electrolyte cations (Li+, TEA+, TEMA+, and SBP+) in plate pores through first-principles calculations. In solution, the plate pores have different upper and lower stacking patterns. Therefore, the AA-stacked bilayer graphene model was used to simulate the corresponding forms of flat pores, and the AB-stacked bilayer graphene model was used to simulate the interleaved forms of flat pores. By calculating the reaction energy of organic electrolyte cations (Li+, TEA+, TEMA+, and SBP+) in the process of desolvation, the size of the corresponding desolvation pore in the solution was determined in order to obtain the complete desolvation pore size and the relative capacitance lifting mechanism of the substrate plate pore. Thus, it is shown that the study of desolvation in the micropores of carbon materials is a broad research area.

2. Calculation Method

The computations were carried out using density-generalised-function-based tight-binding (DFTB+) [14,15] software (Version 2019), which is a semi-empirical quantum mechanical program that combines the accuracy of the density generalised function method (DFT) [16,17,18] with the efficiency of the tight-binding method (TB). The exchange-correlation energy was determined using the Perdew–Burke–Ernzerhof (PBE) generalised function under the generalised gradient approximation (GGA) [19,20,21,22]. The interactions between valence electrons and atoms were described using LIB 2019 (a self-consistent charge model for lithium-ion battery electrolytes), which uses dispersion correction, spin-unrestricted calculations, and spin polarisation. Considering the presence of a large number of atoms in the architecture, the K-point grid [23] in the Brillouin zone was chosen to be 1 × 1 × 1 [24,25,26], and convergence was verified. During the optimisation of the geometrical structure, a smart algorithm was used. All of the algorithms used in the smart cascade are publicly available. The gradient descent algorithm was used for any initial optimisations [27]. The convergence accuracy of the forces acting on each atom was 0.5 kcal/mol/Å, the error in the total energy was less than 0.05 kcal/mol, the total stress tensor was reduced to 0.1 GPa, and the maximum ion displacement was within 0.01 Å. In this experiment, only flexible holes were considered for simulation, and atoms at the edges of the fixed bilayer graphene model were used to fix the pore diameter and release atoms in the central region to simulate the corresponding flexible pores [28]. Both the AA stack and the AB stack studied in this experiment consisted of periodic hexagonal supercell structures, as shown in Figure 1 (the grey atoms that comprise the pore base in Figure 1 are carbon atoms, and the blue atoms are restricted carbon atoms), and different pore sizes (4–10 Å) were simulated by adjusting the layer spacing of the flat pores.

3. Results and Discussion

3.1. Reaction Principle

Three reactions may occur during the embedding of organic electrolyte cations in the bilayer graphene model: Firstly, the organic electrolyte cations can stay stable in the pores as the PC molecules exit. Secondly, the PC molecules can be incorporated into the pores while the organic electrolytic cations leave the pores. The embedding of the PC and organic electrolyte cations in the pores is the third reaction, which is represented in Equations (1)–(3), respectively:
A(PC) + BG → A(BG) + PC
A(PC) + BG → PC(BG) + A
A(PC) + BG → A(PC) BG
where A denotes organic electrolyte cations (Li+, TEA+, TEMA+, and SBP+); A(PC) denotes cationic complexes; BG denotes bilayer graphene flat pores; A(BG) denotes cation-embedded compounds within the pores; PC(BG) denotes PC-molecule-embedded compounds within the pores; and A(PC)BG denotes cationic-complex-embedded compounds within the pores. To evaluate the feasibility of incorporating organic electrolytic cations, organic electrolytic cations, and solvents in pores of different sizes, the reaction energies were calculated for each of the three reactions and defined as Eint1, Eint2, and Eint3, respectively, which can be expressed by Equations (4)–(6) as follows:
Eint1 = EA(BG) + EPC − EA(PC) − EBG
Eint2 = EPC(BG) + EA − EA(PC) − EBG
Eint3 = EA (PC) BG − EA(PC) − EBG
EA(PC) represents the energy of the organoelectrolyte cation complex; EBG represents the energy of the bilayer graphene platelet pore; EA(BG) represents the energy of the embedded compound of the organoelectrolyte cation in the pore; EPC represents the energy of the PC molecule; EPC(BG) represents the energy of the embedded compound of the PC molecule in the pore; EA represents the energy of the organoelectrolyte cation; and EA(PC)BG represents the energy of the embedded compound of the organoelectrolyte cation complex in the pore. Higher values of Eint1, Eint2, and Eint3 indicate a lower probability of the reaction occurring.

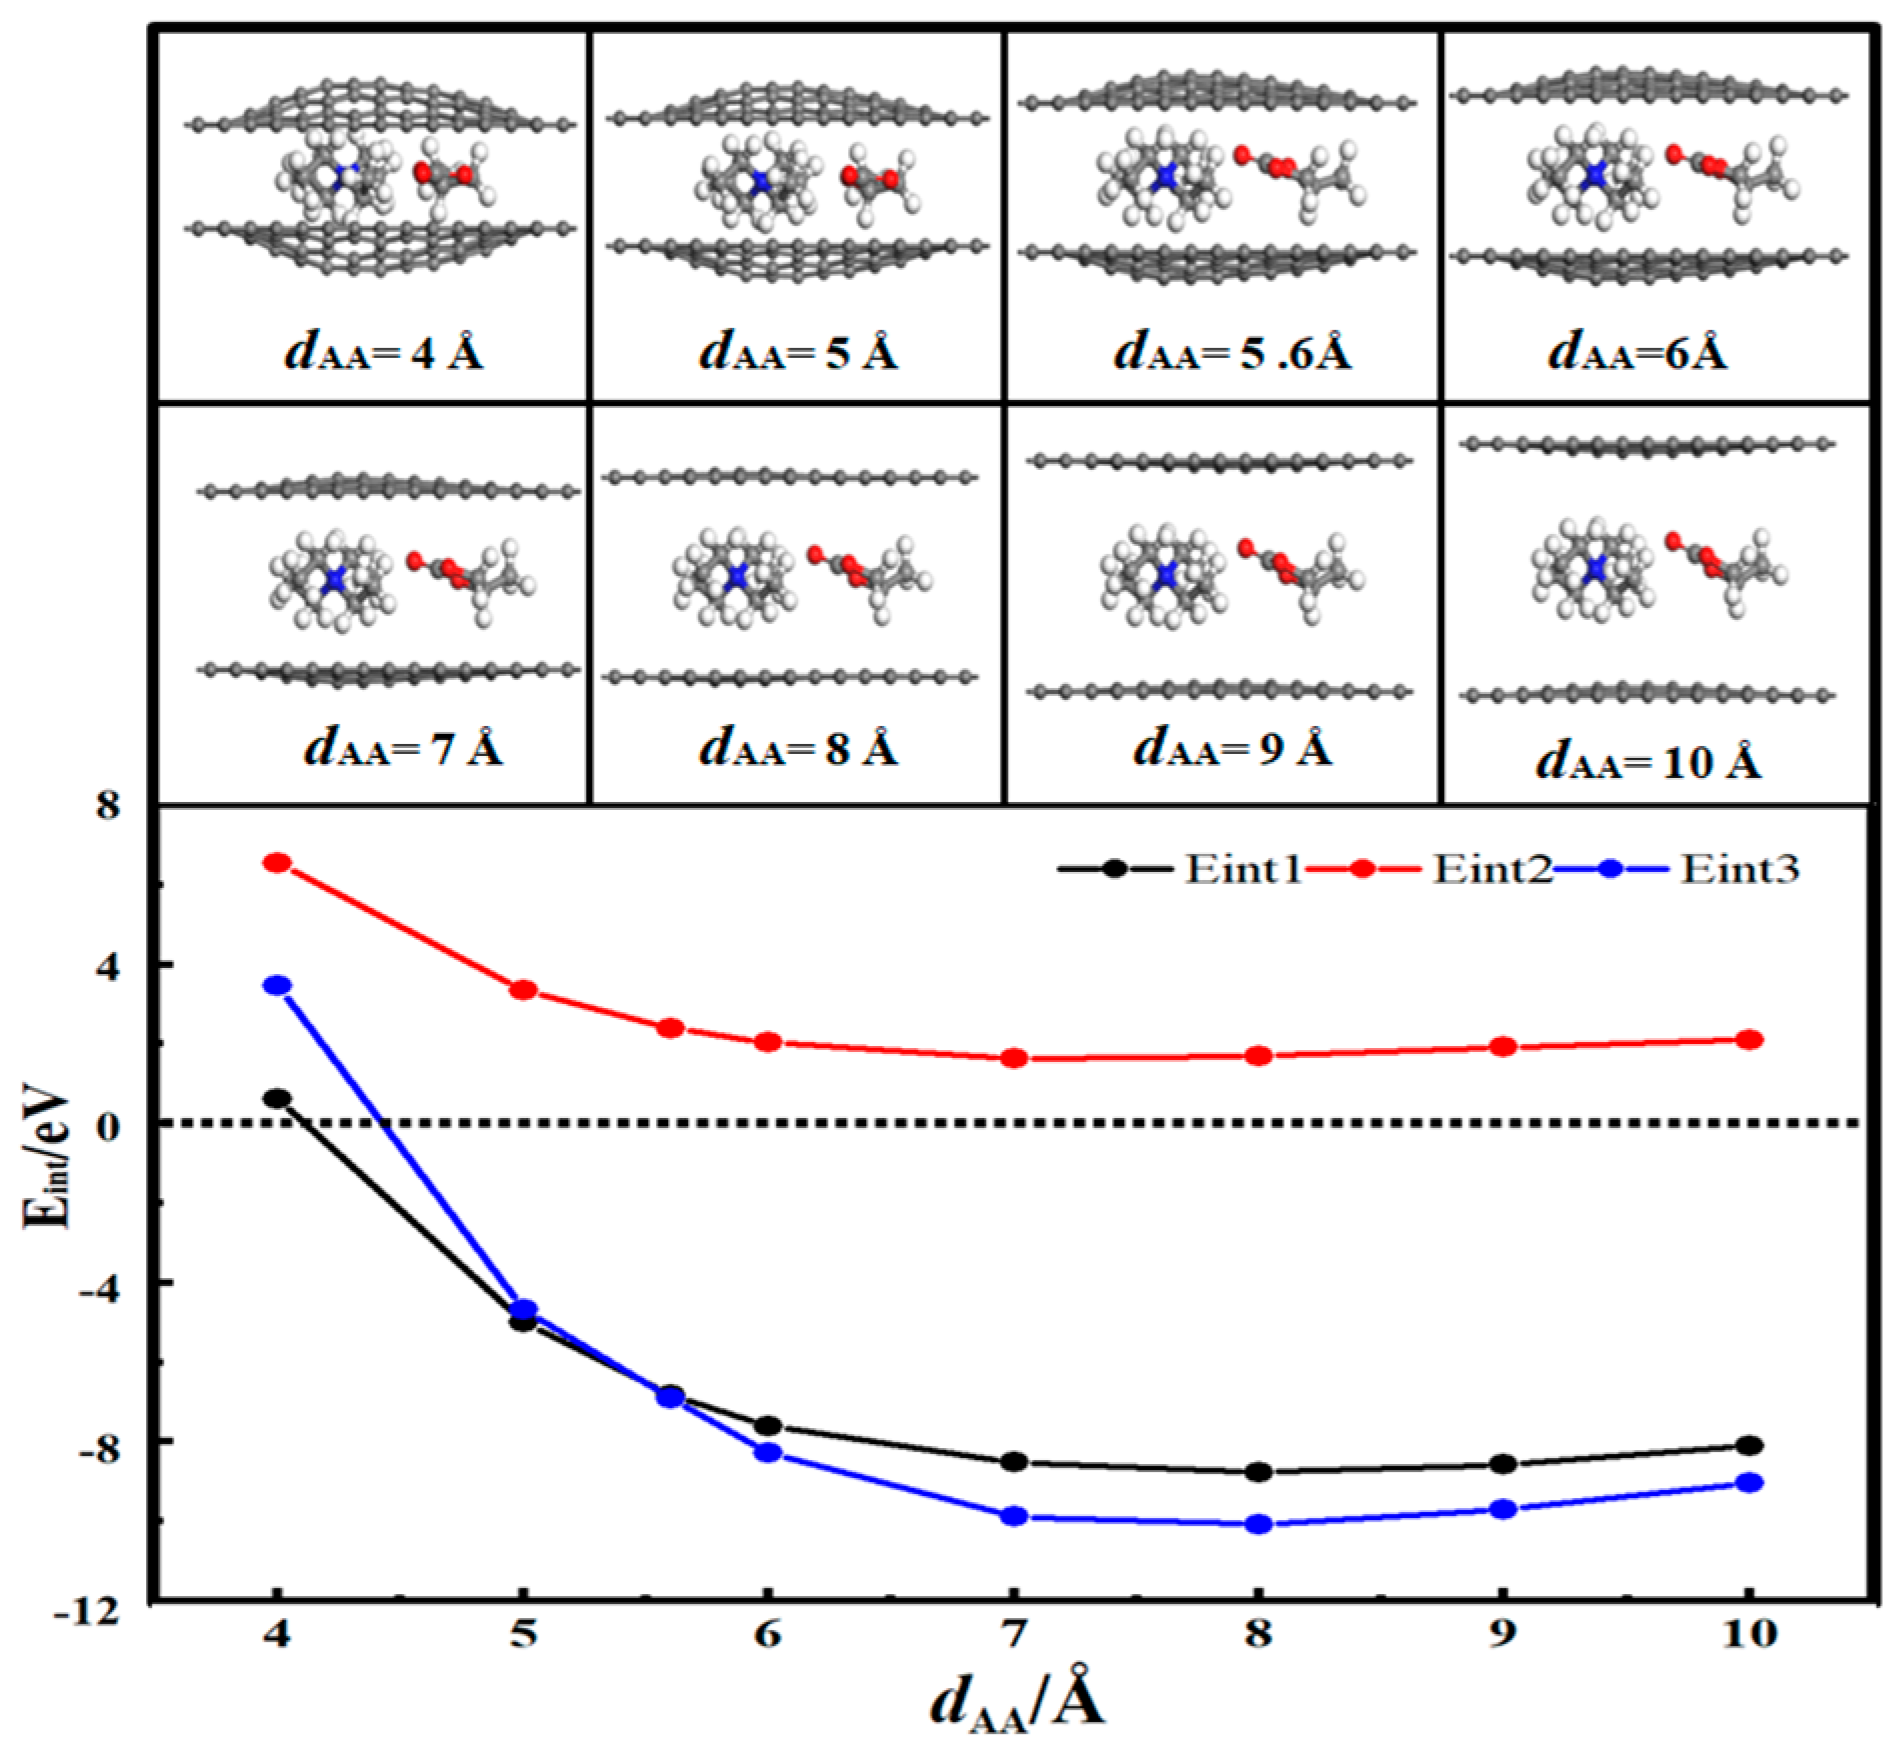
3.2. Desolvation of Li+ Complexes

Figure 2 shows the desolvation reaction energy curves of the AA-stacked bilayer graphene model for [Li(PC)]+. Eint1, Eint2, and Eint3 were calculated for a flat pore size (dAA) of 5.5 Å. The reaction energy curves for PC molecules embedded in different-sized pores are Eint2, Eint1, and Eint3 for Li+ and [Li(PC)]+. Clearly, the energy values of Eint1 (−3.43 eV) compared to Eint2 are similar to those of Eint3 (−3.42 eV), i.e., 5.5 Å is the critical point for the desolvation of [Li(PC)]+ within the AA stack, but at this layer spacing, Eint2 < 0. These results suggest that the Li+ and PC solvents can enter the bilayer graphene model alone at this spacing. When the pore size of the bilayer graphene model in the AA stack is less than 5.5 Å and Eint1 < Eint3 < 0, Li+ is more stably present in the pore than [Li(PC)]+, and the complete desolvation of [Li(PC)]+ can occur in the AA stack when the pore size is less than 5.5 Å.
Figure 3 shows the desolvation reaction energy curve of the AB stacks for [Li(PC)]+. When the pore size is greater than 5.4 Å, Eint2 > 0, the solvent molecules cannot exist in the AB stack alone. The energy of [Li(PC)]+ is the lowest at 7 Å, which means that it is the easiest for [Li(PC)]+ to enter the flat pore at 7 Å. Figure 3 shows that when the pore size (dAB) of the flat pores of the AB stack is 5.4 Å, the value of Eint1 is −3.36 eV, and the value of Eint3 is −3.31 eV. At this point, Eint1 and Eint3 are the closest, so 5.4 Å is the critical size for the desolvation of [Li(PC)]+ in the AB stack. For pore sizes smaller than 5.4 Å, Eint1 < Eint3 < 0, and Li+ is more stable in the pore than [Li(PC)]+, indicating that the complete desolvation size of [Li(PC)]+ in the AB stack is 5.4 Å. In summary, the flat pores of the two different stack forms, AA and AB, can exist in solution at the same time. Therefore, this experiment suggests that the fully desolvated pore size of [Li(PC)]+ is 5.4 Å, and the partially desolvated pore size is 5.4–5.5 Å.

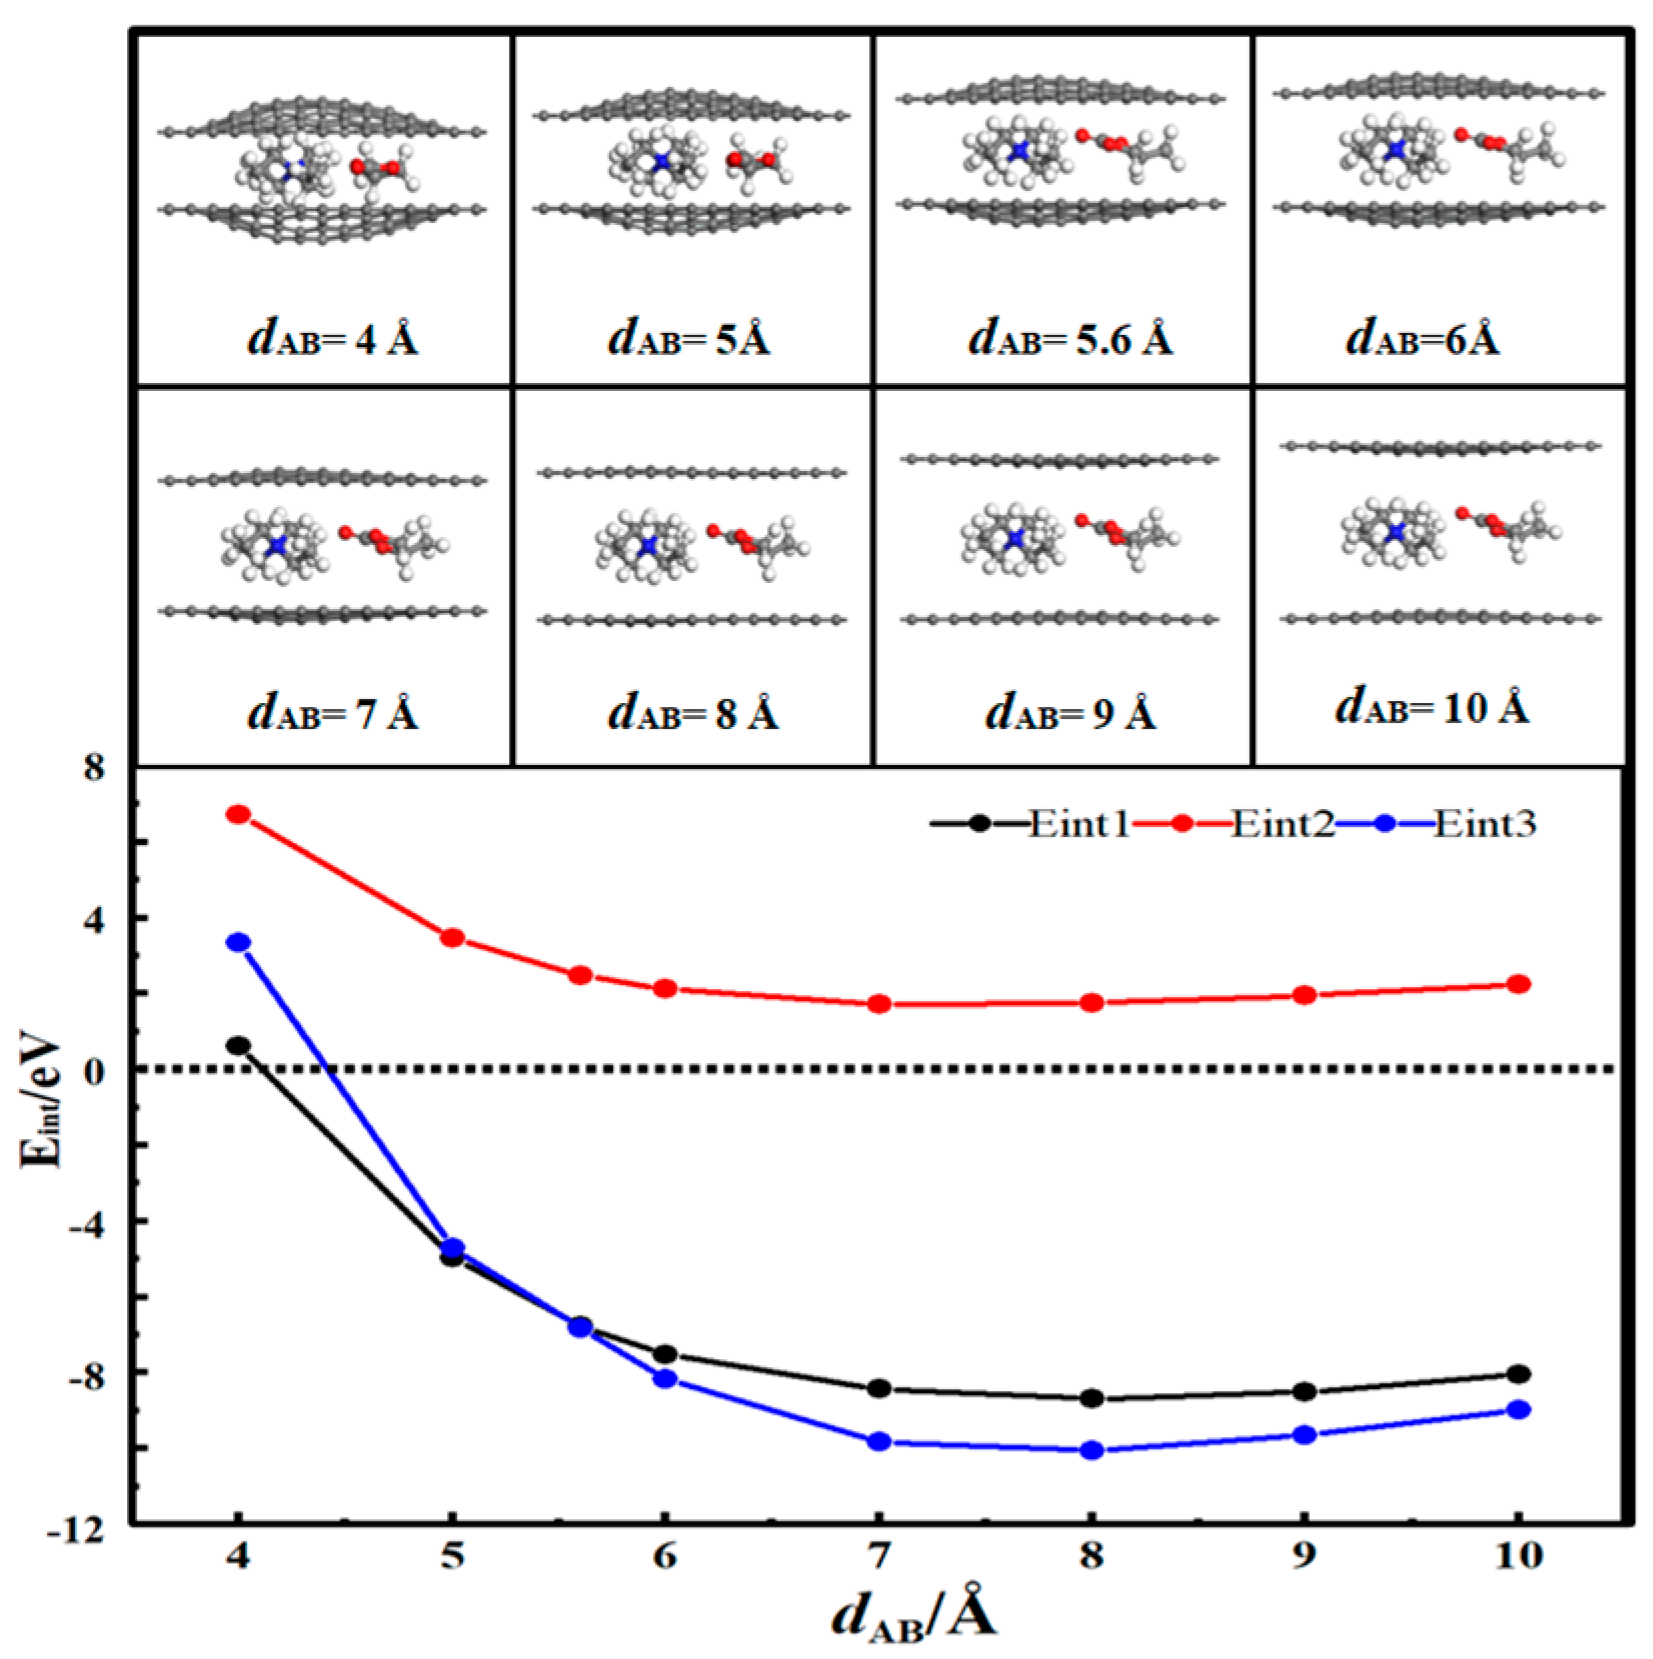
3.3. Desolvation of TEA+ Complexes

Figure 4 shows the desolvation reaction energy curve of the AA-stacked bilayer graphene model for [TEA(PC)]+. The reaction energy curves for the PC molecules embedded in differently sized holes are Eint2, and Eint2 > 0, which indicates that the PC molecules cannot exist alone within the AA stack as compared to Li+. TEA+ cannot enter the bilayer graphene alone, and the energy required for TEA+ to enter the bilayer graphene decreases as the layer spacing increases. The energy of [TEA(PC)]+ is the lowest at 8 Å, which means that it is the easiest for [TEA(PC)]+ to enter the flat pore at 8 Å. Eint1 (−6.82 eV) is similar to Eint3 (−6.90 eV) for AA stacks with a flat pore size (dAA) of 5.6 Å. That is, 5.6 Å is the threshold at which desolvation of [TEA(PC)]+ occurs in the case of AA stacks. When the aperture of the AA stack is less than 5.6 Å and Eint1 < Eint3 < 0, TEA+ is more stable than [TEA(PC)]+ in the aperture, and therefore, [TEA(PC)]+ can undergo complete desolvation in the AA stack when the aperture is less than 5.6 Å.
Figure 5 shows the desolvation reaction energy curve of the AB-stacked bilayer graphene model for [TEA(PC)]+. Similar to the AA stack, the PC molecule cannot exist alone within the AB-stacked bilayer graphene model. At a pore size (dAB) of 5.6 Å for the flat pores of the AB stack, the value of Eint1 is −6.77 eV, and the value of Eint3 is −6.82 eV. At this point, Eint1 and Eint3 are the closest, so 5.6 Å is considered the critical size for the desolvation of [TEA(PC)]+ to occur in the AB stack. At pore sizes less than 5.6 Å, Eint3 < Eint3 < 0, and TEA+ is more stable than [TEA(PC)]+ in the pore, indicating that the complete desolvation size of [TEA(PC)]+ in the AB stack is 5.6 Å. In summary, the pore size for the complete desolvation of [TEA(PC)]+ is considered to be 5.6 Å in this experiment. The pore size for the complete desolvation of [TEA(PC)]+ is slightly higher than that of [Li(PC)]+.

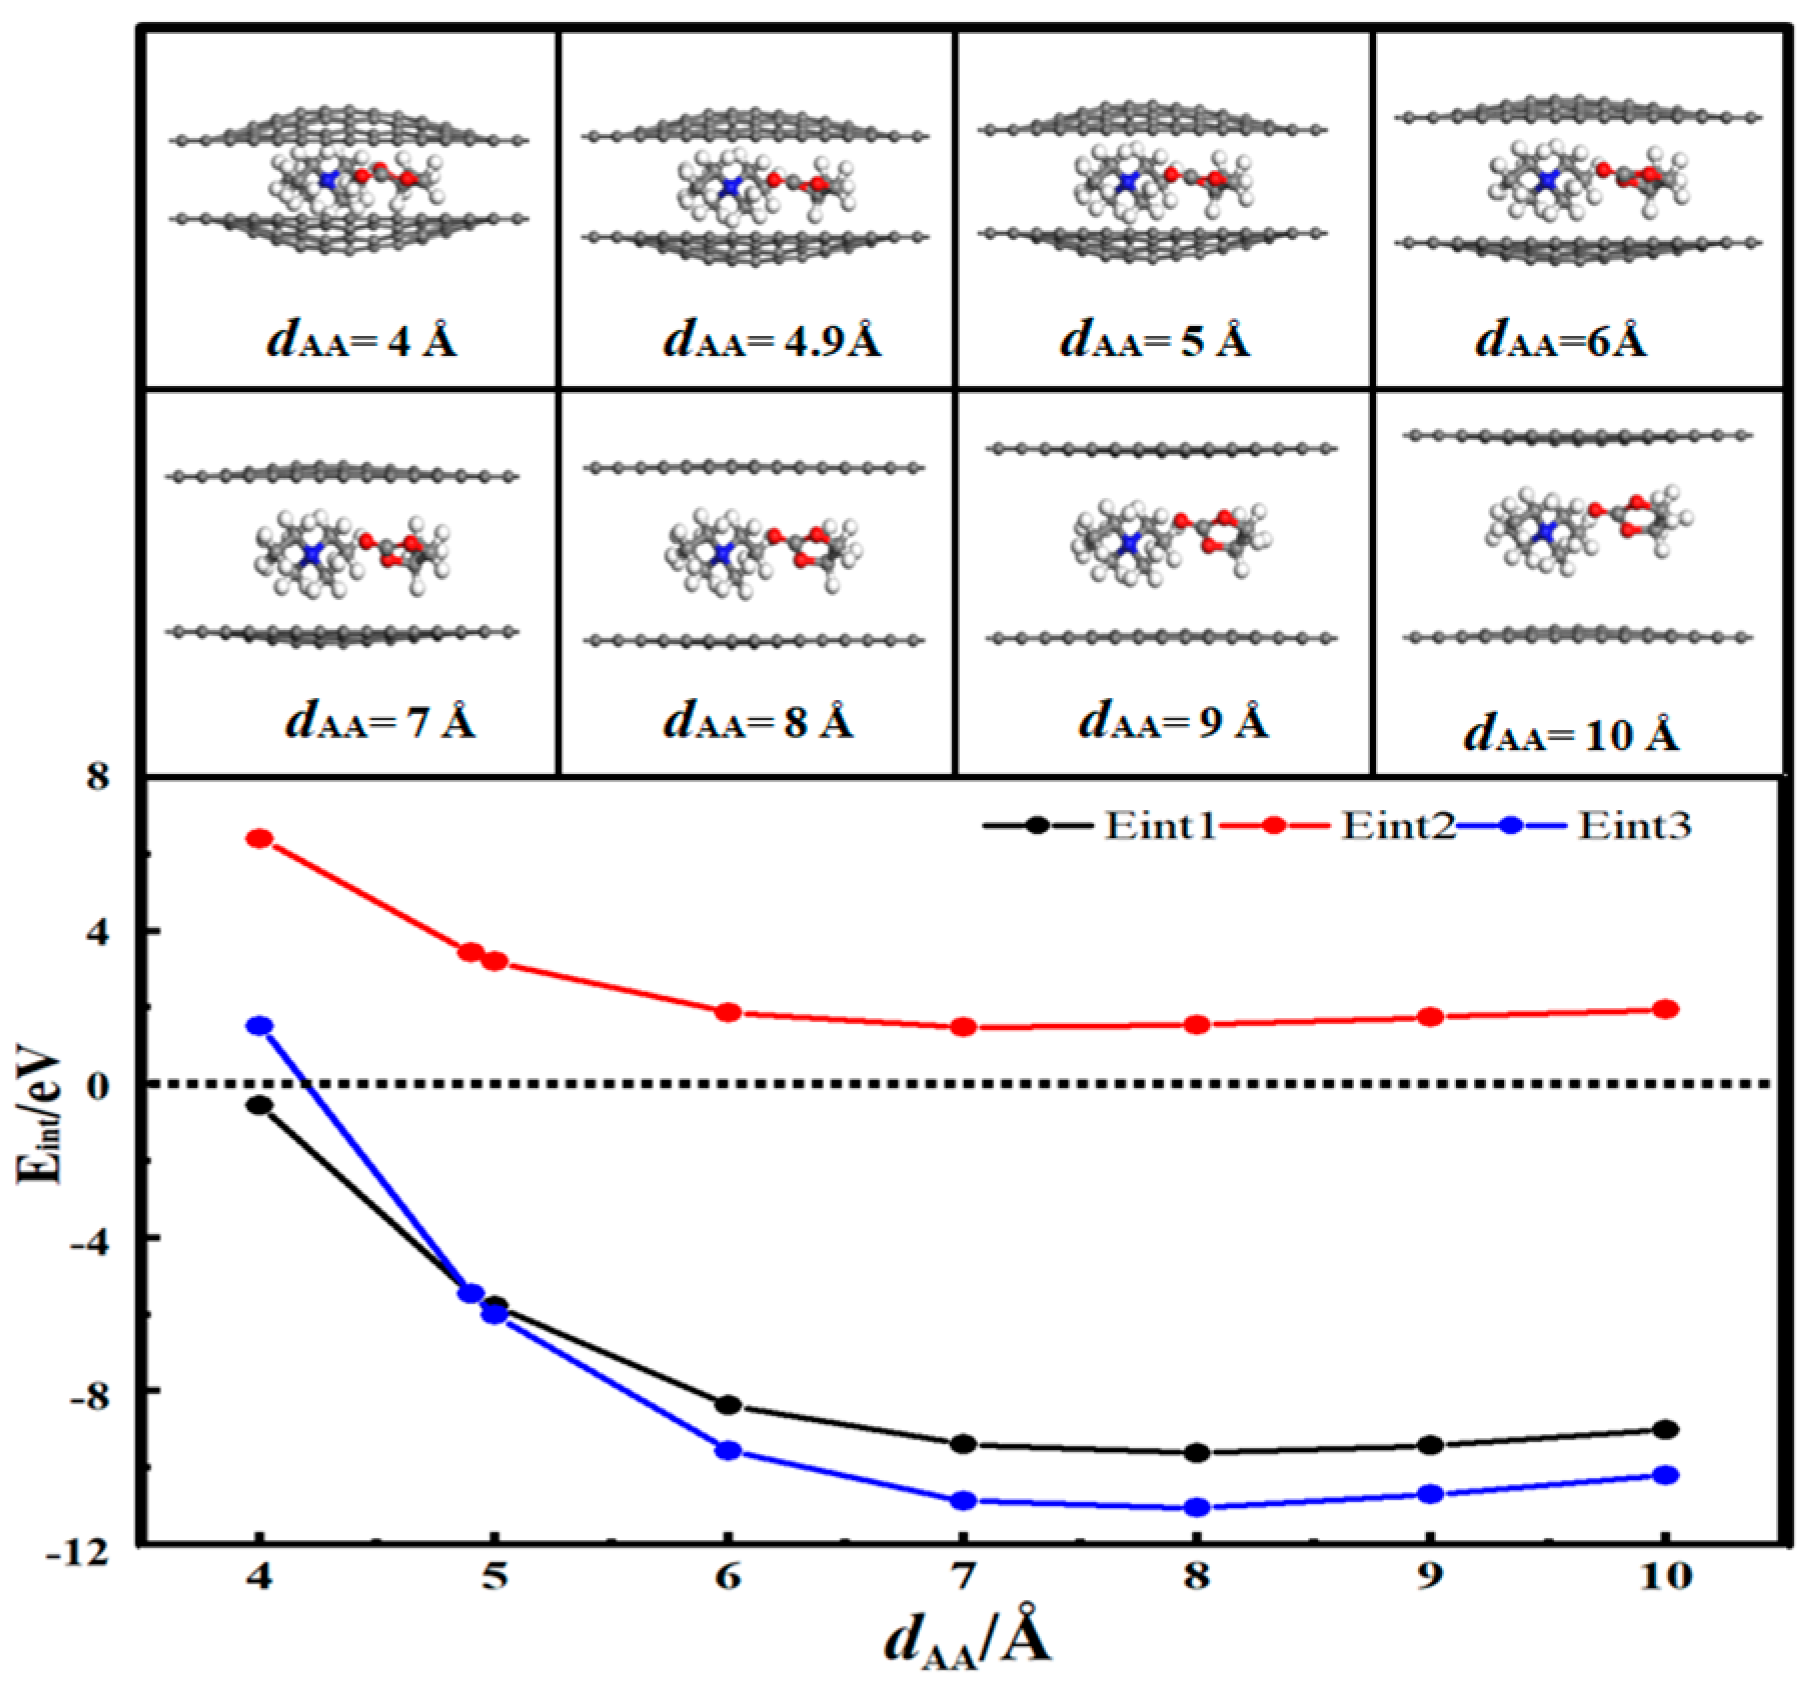
3.4. Desolvation of TEMA+ Complexes

Figure 6 shows the desolvation reaction energy curve for the AA-stacked bilayer graphene model for [TEMA(PC)]+. Figure 7 shows the desolvation energy profile of the AB-stacked bilayer graphene model for [TEMA(PC)]+. The energy of [TEMA(PC)]+ is the lowest at 8 Å, which means that it is the easiest for [TEMA(PC)]+ to enter the flat pore at 8 Å. The positive values of Eint2 in both Figure 6 and Figure 7 indicate that PC solvent molecules cannot be present in the AA- and AB-stacked bilayer graphene models alone. We calculated points in the range from 4 to 5 Å and verified that the intersection of Eint1 and Eint3 has values of −5.45 eV for both Eint1 and Eint3 for a size of 4.9 Å in the AA-stacked bilayer graphene model and values of −5.42 eV for both Eint1 and Eint3 for a size of 4.9 Å in the AB-stacked bilayer graphene system. Thus, [TEMA(PC)]+ in Figure 6 and Figure 7 can undergo complete dephasing at a pore size of 4.9 Å. Compared to [TEA(PC)]+, the size of the desolvated pores of [TEMA(PC)]+ is significantly reduced.

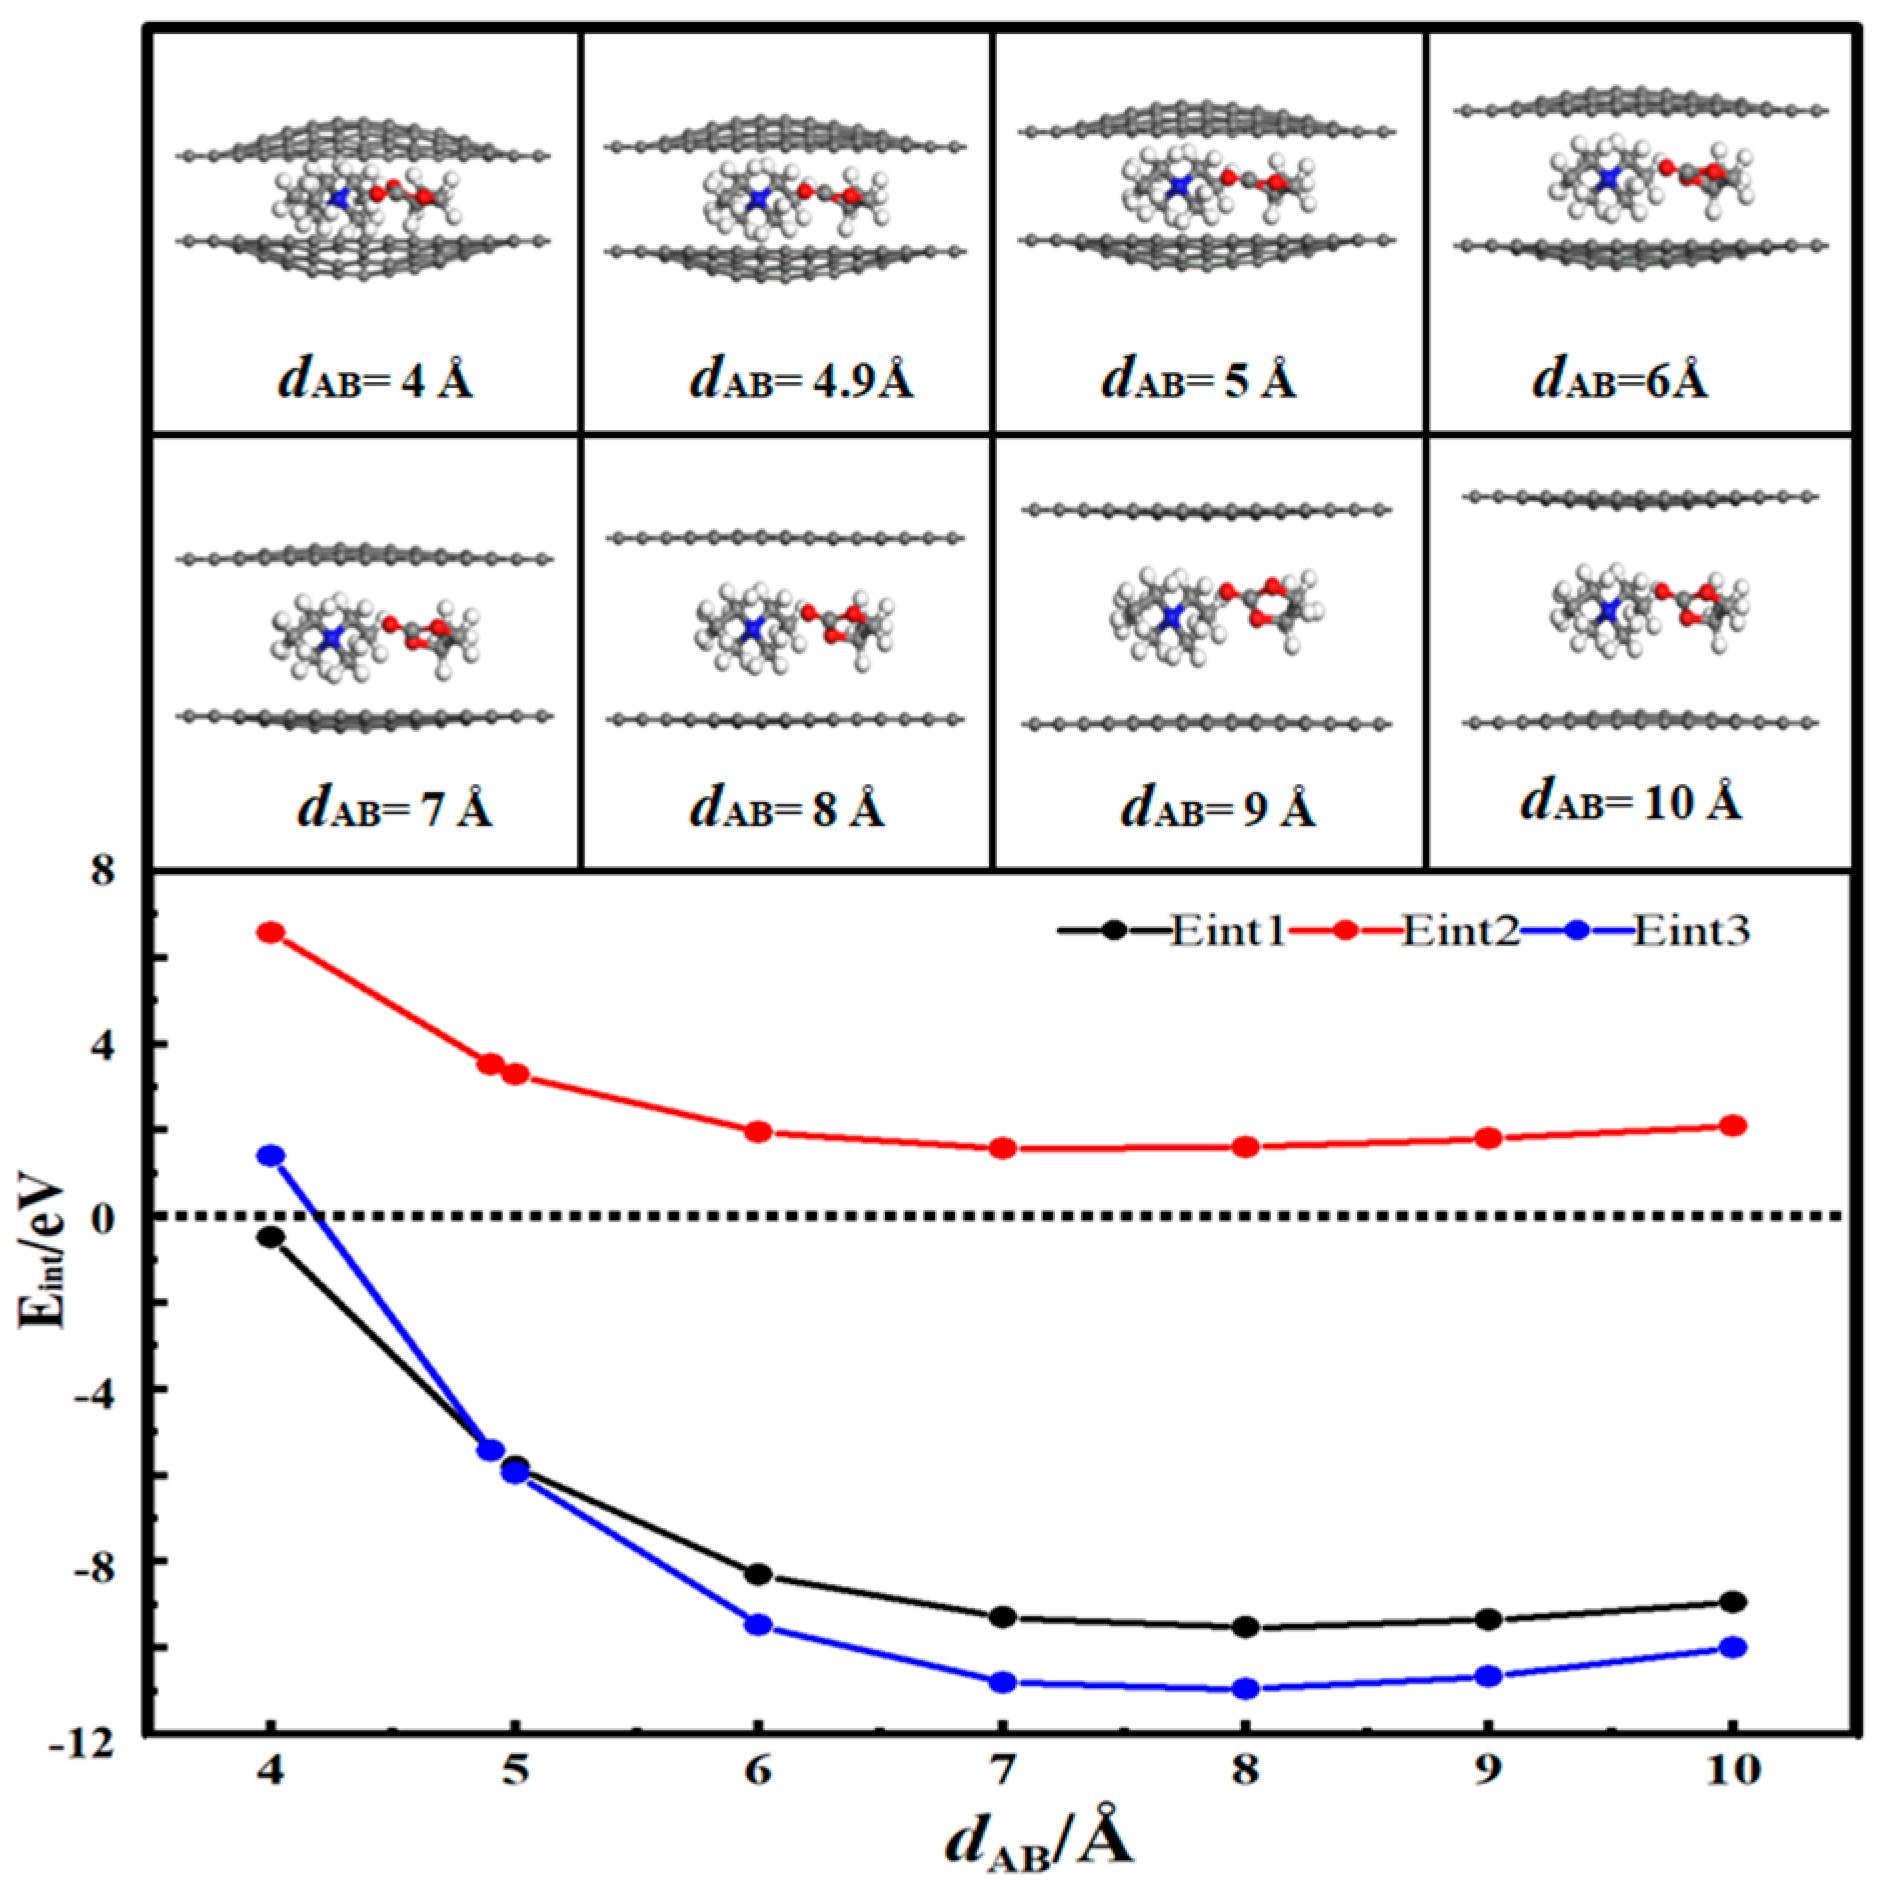
3.5. Desolvation of SBP+ Complexes

Figure 8 shows the desolvation energy profile of AA-stacked bilayer graphene for [SBP(PC)]+. Figure 9 shows the desolvation energy profile of AB-stacked bilayer graphene for [SBP(PC)]+. The positive values of Eint2 in both Figure 8 and Figure 9 indicate that PC solvent molecules cannot be present in the AA- and AB-stacked bilayer graphene systems alone. The energy of [SBP(PC)]+ is the lowest at 8 Å, which means that it is the easiest for [SBP(PC)]+ to enter the flat pore at 8 Å. We calculated points in the range from 4 to 5 Å and verified that the intersection of Eint1 and Eint3 has values of −5.15 eV for both Eint1 and Eint3 for a size of 4.8 Å in the AA-stacked bilayer graphene system and values of −5.06 eV for both Eint1 and Eint3 for a size of 4.8 Å in the AB-stacked bilayer graphene system. Thus, [SBP(PC)]+ in Figure 8 and Figure 9 can undergo complete dephasing at a pore size of 4.8 Å. Compared to [TEMA(PC)]+, the size of the desolvated pore of [SBP(PC)]+ is slightly reduced.

3.6. Critical Size Analysis for Different Ionic Desolvation Processes

To analyse the desolvation critical size of Li+, TEA+, TEMA+, and SBP+, the ionic radii of the ions at different bilayer graphene layer spacings in relation to the desolvation state are given in Figure 10. We found that the morphology of the four surfaces changed depending on the electrolyte used. Among the four cations, only Li+ contains a partial desolvation region, and its critical size for complete desolvation is only slightly smaller than that of TEA+. As the radii of the quaternary ammonium salt cations decreased [29], the critical desolvation sizes of TEA+, TEMA+, and SBP+ in the bilayer graphene model with AA and AB stacks decreased sharply. Therefore, the critical size for desolvation depends mainly on the ionic radius. In the micropore range (0–20 Å), the capacitance of the PC electrolyte in which the same organic electrolyte cation is present decreases with increasing pore size [30,31], while the relationship between the magnitude of the specific capacitance of the PC electrolyte in which the four organic electrolyte cations are present under the same conditions is SBP+ > TEMA+ > Li+ > TEA+ [32,33]. In summary, SBP+ has the smallest desolvation critical size, and its property of having the largest capacitance among the PC solvents where the three quaternary ammonium cations reside is consistent with the findings of Janes et al. [34].

4. Conclusions

In this experiment, the desolvation behaviour of organic electrolyte cations between AA- and AB-stacked bilayer graphene layers was investigated using first-principles calculations. The results can be summarised as follows:
  • In solution, the bilayer graphene system showed a fully desolvated pore size of 5.4 Å for [Li(PC)]+ and a partially desolvated pore size range from 5.4 to 5.5 Å. The fully desolvated pore size of [TEA(PC)]+ in bilayer graphene was 5.6 Å. The fully desolvated pore size of [TEMA(PC)]+ in bilayer graphene was 4.9 Å. The fully desolvated pore size of [SBP(PC)]+ in bilayer graphene was 4.8 Å.
  • The relationship between the desolvation sizes of the four cations was TEA+ > Li+ > TEMA+ > SBP+.
  • The three quaternary ammonium cations showed a positive trend in the complete desolvation size, with an increase in the ionic radius and an inverse trend in the size of the electric capacity, which is crucial for the development and application of supercapacitors that are used as an auxiliary power source in electric vehicles.

Author Contributions

Conceptualization, F.L. and S.Y.; Methodology, F.L.; Software, F.L. and S.W.; Validation, X.Z.; Formal analysis, S.T. and S.W.; Data curation, S.T.; Funding acquisition, S.Y. All authors have read and agreed to the published version of the manuscript.

Funding

This work was supported by the National Natural Science Foundation of China (No. 51774175).

Institutional Review Board Statement

Not applicable.

Informed Consent Statement

Not applicable.

Data Availability Statement

Not applicable.

Conflicts of Interest

The authors declare no conflict of interest.

References

  1. Zhang, J.; Zhang, Z.; Jiao, Y.; Yang, H.; Li, Y.; Zhang, J.; Gao, P. The grapheme/lanthanum oxide nanocomposites as electrode materials of supercapacitor. J. Power Sources 2019, 419, 99–105. [Google Scholar] [CrossRef]
  2. Scarpa, D.; Cirillo, C.; Ponticorvo, E.; Cirillo, C.; Attanasio, C.; Iuliano, M.; Sarno, M. Iron Selenide Particles for High-Performance Supercapacitors. Materials 2023, 16, 5309. [Google Scholar] [CrossRef]
  3. Liu, F.; Yang, S.; Zhang, X.; Tang, S.; Xia, Y. Insight into the Desolvation of Quaternary Ammonium Cation with Acetonitrile as a Solvent in Hydroxyl-Flat Pores: A First-Principles Calculation. Materials 2023, 16, 3858. [Google Scholar] [CrossRef] [PubMed]
  4. Singh, P.; Sharma, K.; Arora, A.; Tripathi, S.K. Review of supercapacitors: Materials and devices. J. Energy Storage 2019, 21, 801–825. [Google Scholar]
  5. Zhong, C.; Deng, Y.; Hu, W. A review of electrolyte materials and compositions for electrochemical supercapacitors. Chem. Soc. Rev. 2015, 44, 7484–7539. [Google Scholar] [CrossRef]
  6. Beguin, F.; Presser, V.; Balduccl, A. Carbons and electrolytes for advanced supercapacitors. Adv. Mater. 2014, 26, 2219–2251. [Google Scholar] [CrossRef]
  7. Mayer, C.J.; Geim, K.A.; Katanelson, I.M. The structure of suspended grapheme sheets. Nat. Mater. 2007, 446, 60–63. [Google Scholar]
  8. Novoselov, S.K.; Geim, K.A.; Morozov, V.S. Two-dimensional gas of massless dirac fermions in grapheme. Nat. Mater. 2005, 438, 197–200. [Google Scholar]
  9. Fong, R.; Von, S.U.; Dahn, J.R. Studies of Lithium Intercalation into Carbons Using Nonaqueous Electrochemical Cells. J. Electro. Soc. 1990, 137, 2009. [Google Scholar] [CrossRef]
  10. Besenhard, J.O.; Winter, M.; Yang, J.; Biberacher, W. Filming mechanism of lithium-carbon anodes in organic and inorganic electrolytes. J. Power Sources 1995, 54, 228. [Google Scholar] [CrossRef]
  11. Wang, H.; Yoshio, M. Effect of cation on the performance of AC/graphite capacitor. Electro. Com. 2008, 10, 382–386. [Google Scholar] [CrossRef]
  12. Liang, C.; Guo, S.S.; Jie, S. Ion sieving in graphene oxide membranes via cationic control of interlayer spacing. Nature 2017, 550, 380–383. [Google Scholar]
  13. Zhao, P.; Su, Y.; Zhang, Y.; Li, S.J.; Chen, G. CO catalytic oxidation on iron-embedded hexagonal boron nitride sheet. Chem. Phys. Lett. 2011, 515, 159–162. [Google Scholar] [CrossRef]
  14. Mattsson, A.E.; Schultz, P.A.; Desjarlais, M.P.; Mattsson, T.R.; Leung, K. Designing meaningful density functional theory calculations in materials science-a primer. Modell. Simul. Mater. Sci. Eng. 2004, 13, 1–31. [Google Scholar] [CrossRef]
  15. Rajagopal, A.K.; Callaway, J. Inhomogeneous Electron Gas. Phys. Rev. B 1973, 7, 1912–1919. [Google Scholar] [CrossRef]
  16. Seifert, G.; Porezag, D.; Frauenheim, T. Calculations of molecules, clusters, and solids with a simplified LCAO-DFT-LDA Scheme. Int. J. Quantum. Chem. 1996, 58, 185–192. [Google Scholar] [CrossRef]
  17. Elstner, M.; Porezag, D.; Jungnickel, G.; Elsner, J.; Haugk, M.T.; Frauenheim, S.; Su, H.; Seifert, G. Self-consistent charge density functional tight-binding method for simulation of complex material properties. Phys. Rev. B 1998, 58, 7260. [Google Scholar] [CrossRef]
  18. Seifert, G. Tight-binding density functional theory: An approximate Kohn-Sham DFT scheme. J. Phys. Chem. A 2007, 111, 5609. [Google Scholar] [CrossRef]
  19. Segall, D.M.; Lindan, D.J.P.; Probert, J.M.; Pickard, J.C.; Hasnip, J.P.; Clark, J.S.; Payne, C.M. First-principles simulation: Ideas, illustrations and the CASTEP code. J. Phys. Condens. Matter. 2002, 14, 2717. [Google Scholar] [CrossRef]
  20. Yang, S.B.; Liu, X.L.; Zhang, X.; Tang, S.W. Insights into the effect of hydroxyl-, epoxy-, and carboxyl-pores on the desolvation of K+ with water as a solvent: A first-principles study. J. Phys. Condens. Matter. 2021, 33, 445201. [Google Scholar] [CrossRef]
  21. Wu, S.; Yan, G.; Cheng, X. First-principles investigation of the superconducting properties of thallium sulfide. Phys. C 2019, 562, 1–6. [Google Scholar] [CrossRef]
  22. Schira, R.; Latouche, C. DFT and hybrid-DFT calculations on the electronic Properties of vanadate materials: Theory meets experiments. New J. Chem. 2020, 44, 11602. [Google Scholar] [CrossRef]
  23. Monkhorst, J.H.; Pack, D.J. Special points for Brillouin-zone integrations. Phys. Rev. B 1976, 13, 5188–5192. [Google Scholar] [CrossRef]
  24. Tonel, M.Z.; Zanella, I.; Fagan, S.B. Theoretical study of small aromatic molecules adsorbed in pristineand functionalized graphene. J. Mol. Model. 2021, 27, 193. [Google Scholar] [CrossRef] [PubMed]
  25. Calborean, A.; Buimaga⁃Iarinca, L.; Graur, F. DFT charge transfer of hybrid molecular ferrocene/Si structures. Phys. Scr. 2015, 90, 055803. [Google Scholar] [CrossRef]
  26. Rabone, J.; Uffelen, P.V. DFT-based Metadynamics simulation of proton diffusion in tetragonal zirconia at 1500 K. J. Nucl. Mater. 2015, 459, 30–36. [Google Scholar] [CrossRef]
  27. Dolgonos, G.; Aradi, B.; Moreira, N.H.; Frauenheim, T. An Improved Self-Consistent-Charge Density-Functional Tight-Binding (SCC-DFTB) Set of Parameters for Simulation of Bulk and Molecular Systems Involving Titanium. J. Chem. Theory Comput. 2010, 6, 266. [Google Scholar] [CrossRef]
  28. Zhang, X.; Yang, S.B.; Shan, X.Y. Insights into the effect of the interlayer spacings of bilayer graphene on the desolvation of H+, Li+, Na+, and K+ ions with water as a solvent: A first-principles study. Phy. Chem. 2019, 21, 23697. [Google Scholar] [CrossRef]
  29. Ivanova, S.; Laguna, H.O.; Centeno, A.M. Microprocess technology for hydrogen purification. Renew. Hydrogen. Technol. 2013, 10, 225–243. [Google Scholar]
  30. Rufford, E.T.; Hulicova-Jurcakova, D.; Zhu, H.Z.; Lus, G.Q. Empirical Analysis of the Contributions of Mesopores and Micropores to the Double-Layer Capacitance of Carbons. J. Phys. Chem. C 2009, 113, 19335. [Google Scholar] [CrossRef]
  31. Chmiola, J.; Largeot, C.; Taberna, L.P.; Simon, P.; Gogotsi, Y. Desolvation of Ions in Subnanometer Pores and Its Effect on Capacitance and Double-Layer Theory. Angew. Chem. Int. Ed. 2008, 47, 3392. [Google Scholar] [CrossRef]
  32. Nono, Y.; Kouzu, M.; Takei, K.; Chiba, K.; Sato, Y. EDLC Performance of Various Activated Carbons in SpiroType Quaternary Ammonium Salt Electrolyte Solutions. Electrochemistry 2010, 78, 336–338. [Google Scholar] [CrossRef] [Green Version]
  33. Chiba, K.; Ueda, T.; Yamamoto, H. Performance of electrolyte composed of spiro-type quaternary ammonium salt and electric double-layer capacitor using it. Electrochemistry 2007, 75, 664–667. [Google Scholar] [CrossRef] [Green Version]
  34. Janes, A.; Lust, E. Use of organic esters as co-solvents for electrical double layer capacitors with low temperature performance. J. Electro. Chem. 2006, 588, 285–295. [Google Scholar] [CrossRef]
Figure 1. (a) Stable structure of AA-stacked flat pores. (b) Stable structure of AB-stacked flat pores.
Coatings 13 01384 g001
Figure 2. Reaction energy curves for Li+, PC and [Li(PC)]+ in AA-stacking BG layers. dAA represents the initial interlayer spacing of AA-stacking BG.
Coatings 13 01384 g002
Figure 3. Reaction energy curves for Li+, PC and [Li(PC)]+ in AB-stacking BG layers. dAB represents the initial interlayer spacing of AB-stacking BG. The C, Li, O, and H atoms in the optimised structures are coloured grey, pink, red, and white, respectively.
Coatings 13 01384 g003
Figure 4. Reaction energy curves for TEA+, PC and [TEA(PC)]+ in AA-stacking BG layers. dAA represents the initial interlayer spacings of AA-stacking BG.
Coatings 13 01384 g004
Figure 5. Reaction energy curves for TEA+, PC and [TEA(PC)]+ in AB-stacking BG layers. dAB represents the initial interlayer spacing of AB-stacking BG. The C, N, O, and H atoms in the optimised structures are coloured grey, blue, red, and white, respectively.
Coatings 13 01384 g005
Figure 6. Reaction energy curves for TEMA+, PC and [TEMA(PC)]+ in AA-stacking BG layers. dAA represents the initial interlayer spacing of AA-stacking BG. The C, N, O, and H atoms in the optimised structures are coloured grey, blue, red, and white, respectively.
Coatings 13 01384 g006
Figure 7. Reaction energy curves for TEMA+, PC and [TEMA(PC)]+ in AB-stacking BG layers. dAB represents the initial interlayer spacing of AB-stacking BG.
Coatings 13 01384 g007
Figure 8. Reaction energy curves for SBP+, PC and [SBP(PC)]+ in AA-stacking BG layers. dAA represents the initial interlayer spacings of AA-stacking BG. The C, N, O, and H atoms in the optimised structures are coloured grey, blue, red, and white, respectively.
Coatings 13 01384 g008
Figure 9. Reaction energy curves for SBP+, PC, and [SBP(PC)]+ in AB-stacking BG layers. dAB represents the initial interlayer spacing of AB-stacking BG.
Coatings 13 01384 g009
Figure 10. Relationship between desolvation state and ionic radius at different interlayer spacings.
Coatings 13 01384 g010
Disclaimer/Publisher’s Note: The statements, opinions and data contained in all publications are solely those of the individual author(s) and contributor(s) and not of MDPI and/or the editor(s). MDPI and/or the editor(s) disclaim responsibility for any injury to people or property resulting from any ideas, methods, instructions or products referred to in the content.

