Abstract
The crack resistance of asphalt pavement mixtures directly impact pavement service condition and pavement distress. And characterizing the crack resistance of a pavement mixture can reflect the crack resistance potential of asphalt pavement. This study analyzes several representative highway sections based on time, material, and service conditions to identify the mixture type of three layers. Semi-circular bending tests are conducted at 15 °C, and load–displacement curves are recorded. Factor independence analysis is performed, and combinations showcasing the cracking performance of the surface layer, middle layer, and bottom layer are selected. Analysis of variance (ANOVA) evaluating the indices versus selected factors for the three layers identifies significant influencing factors, and the crack resistance is analyzed based on these significant factors. The crack resistance of the middle layer with the highest truck loads is significantly lower than the two other lanes and the shoulder. Transverse crack spacing (TCS) can be used to directly evaluate the crack resistance of the mixture. The Factor dots upper rate (FUDR) and absolute Factor dots upper rate (absFUDR) indices are introduced to quantify the percentage deviation of a factor specimen from the average crack resistance index–fracture energy ratio, indicating whether the crack curve becomes sharper or flatter. The factor dots upper rate index is then applied to characterize the factors, and the results are reasonable. It is found only on the surface and middle layers that the service age has significant impacts on crack resistance, the Transverse crack spacing has significant impacts on crack resistance index, and the Factor dots upper rate can identify the brittleness of mixtures with different factors.
Keywords:
crack resistance; cores; SCB; service age; asphalt aggregate ratio; load displacement curve; TCS 1. Introduction
After asphalt pavement construction, the asphalt mixture in pavement undergoes a complex process of distress until the end of its service life. The main types of distress are rutting, transverse and longitude crack, stripping and potholes [1]. Among these forms of distress, crack-resistance performance plays an important role in pavement condition, as pavement service often leads to obvious crack distress, including fracture and fatigue cracks [2,3,4]. Crack resistance distress in pavements is mainly caused by environmental and loading factors such as traffic volume, oxidation aging, and in the case of pavements with a semi-rigid base, the presence of many transverse cracks. Additionally, the materials or structural factors of the pavement, such as mixture type and structural combination, can also affect the pavement crack resistance distress [5]. To further investigate the difference in crack resistance and the factors causing this difference, the field service, which is complex and affected by numerous factors, was analyzed. Four important factors were examined: accumulated traffic loads (ESALs), pavement service age (years), pavement section area (area), and materials used in different layers (mixture type). The significant factors were selected for pavement crack evaluation [6,7,8].
Previous research has found a good relationship between the crack resistance of the mixture and weather conditions, such as low temperature or intermediate temperature, allowing crack-resistance performance to be used to evaluate pavement crack condition [9,10]. Insufficient crack resistance may result in small or longitudinal cracks. Field core testing is a direct and reasonable approach used to illustrate actual pavement condition [3]. The semi-circular bending (SCB) test is an effective method used to evaluate mixture fracture performance compared to other crack tests, such as the indirect tensile test (IDT), bending beam test, thermal stress restrained sample test (TSRST) or overlayer test (OT) [9,11,12]. The SCB test offers advantages such as material and time saving, and accuracy of results [13]. And the un-notched SCB could be a promising alternative to distinguish asphalt mixtures with regard to crack resistance, which is more convenient in mass specimens testing without increasing testing variance [14,15] Thus, all the semi-circular specimens tested in this study are un-notched SCB specimens at an intermediate temperature of 15 ℃. The cores were prepared as SCB specimens and tested at intermediate temperature to evaluate fracture and fatigue performance [16]. Three indices, namely tensile strength, fracture energy and crack resistance index (CRI) [17], calculated based on the load–displacement curve, were used for all the tested specimens. Each index has its own advantages and disadvantages [15].
The aged and reclaimed asphalt pavement (RAP) containing mixture specimens exhibits different fracture types, which can be identified using these crack indices [18,19]. Unmodified aged asphalt is harder than unaged asphalt, and unmodified aged asphalt mixture has a high modulus and is more likely to experience brittle fracture. Modified aged asphalt and asphalt mixture may not be harder than modified aged asphalt and asphalt mixture, but they also tend to experience brittle fracture in the intermediate-temperature crack test. This means that when the load–displacement curves of aged specimens’ SCB tests are plotted, they are likely to have a short or nonexistent post-peak curve [20,21,22]. The fracture energy of aged specimens is smaller than that of unaged specimens of the same mixture type, and the crack indices of aged specimens also differ [16]. The tensile strength of aged mixture specimens is likely to be higher than that of unaged mixture for both modified and unmodified asphalt mixture over service age. The fracture energy of aged mixture specimens is likely to be lower than that of new mixture specimens [23]. The CRI of aged mixture specimens does not follow a consistent pattern. The indices study of crack resistance mostly focusses on lab-aged mixtures and mixtures containing RAP, and the indices study of crack resistance on field cores focuses on the effects of low temperature [10]. Studies investigating the crack resistance of field cores at intermediate temperature are needed to improve our understanding of the crack resistance change on asphalt pavement through service.
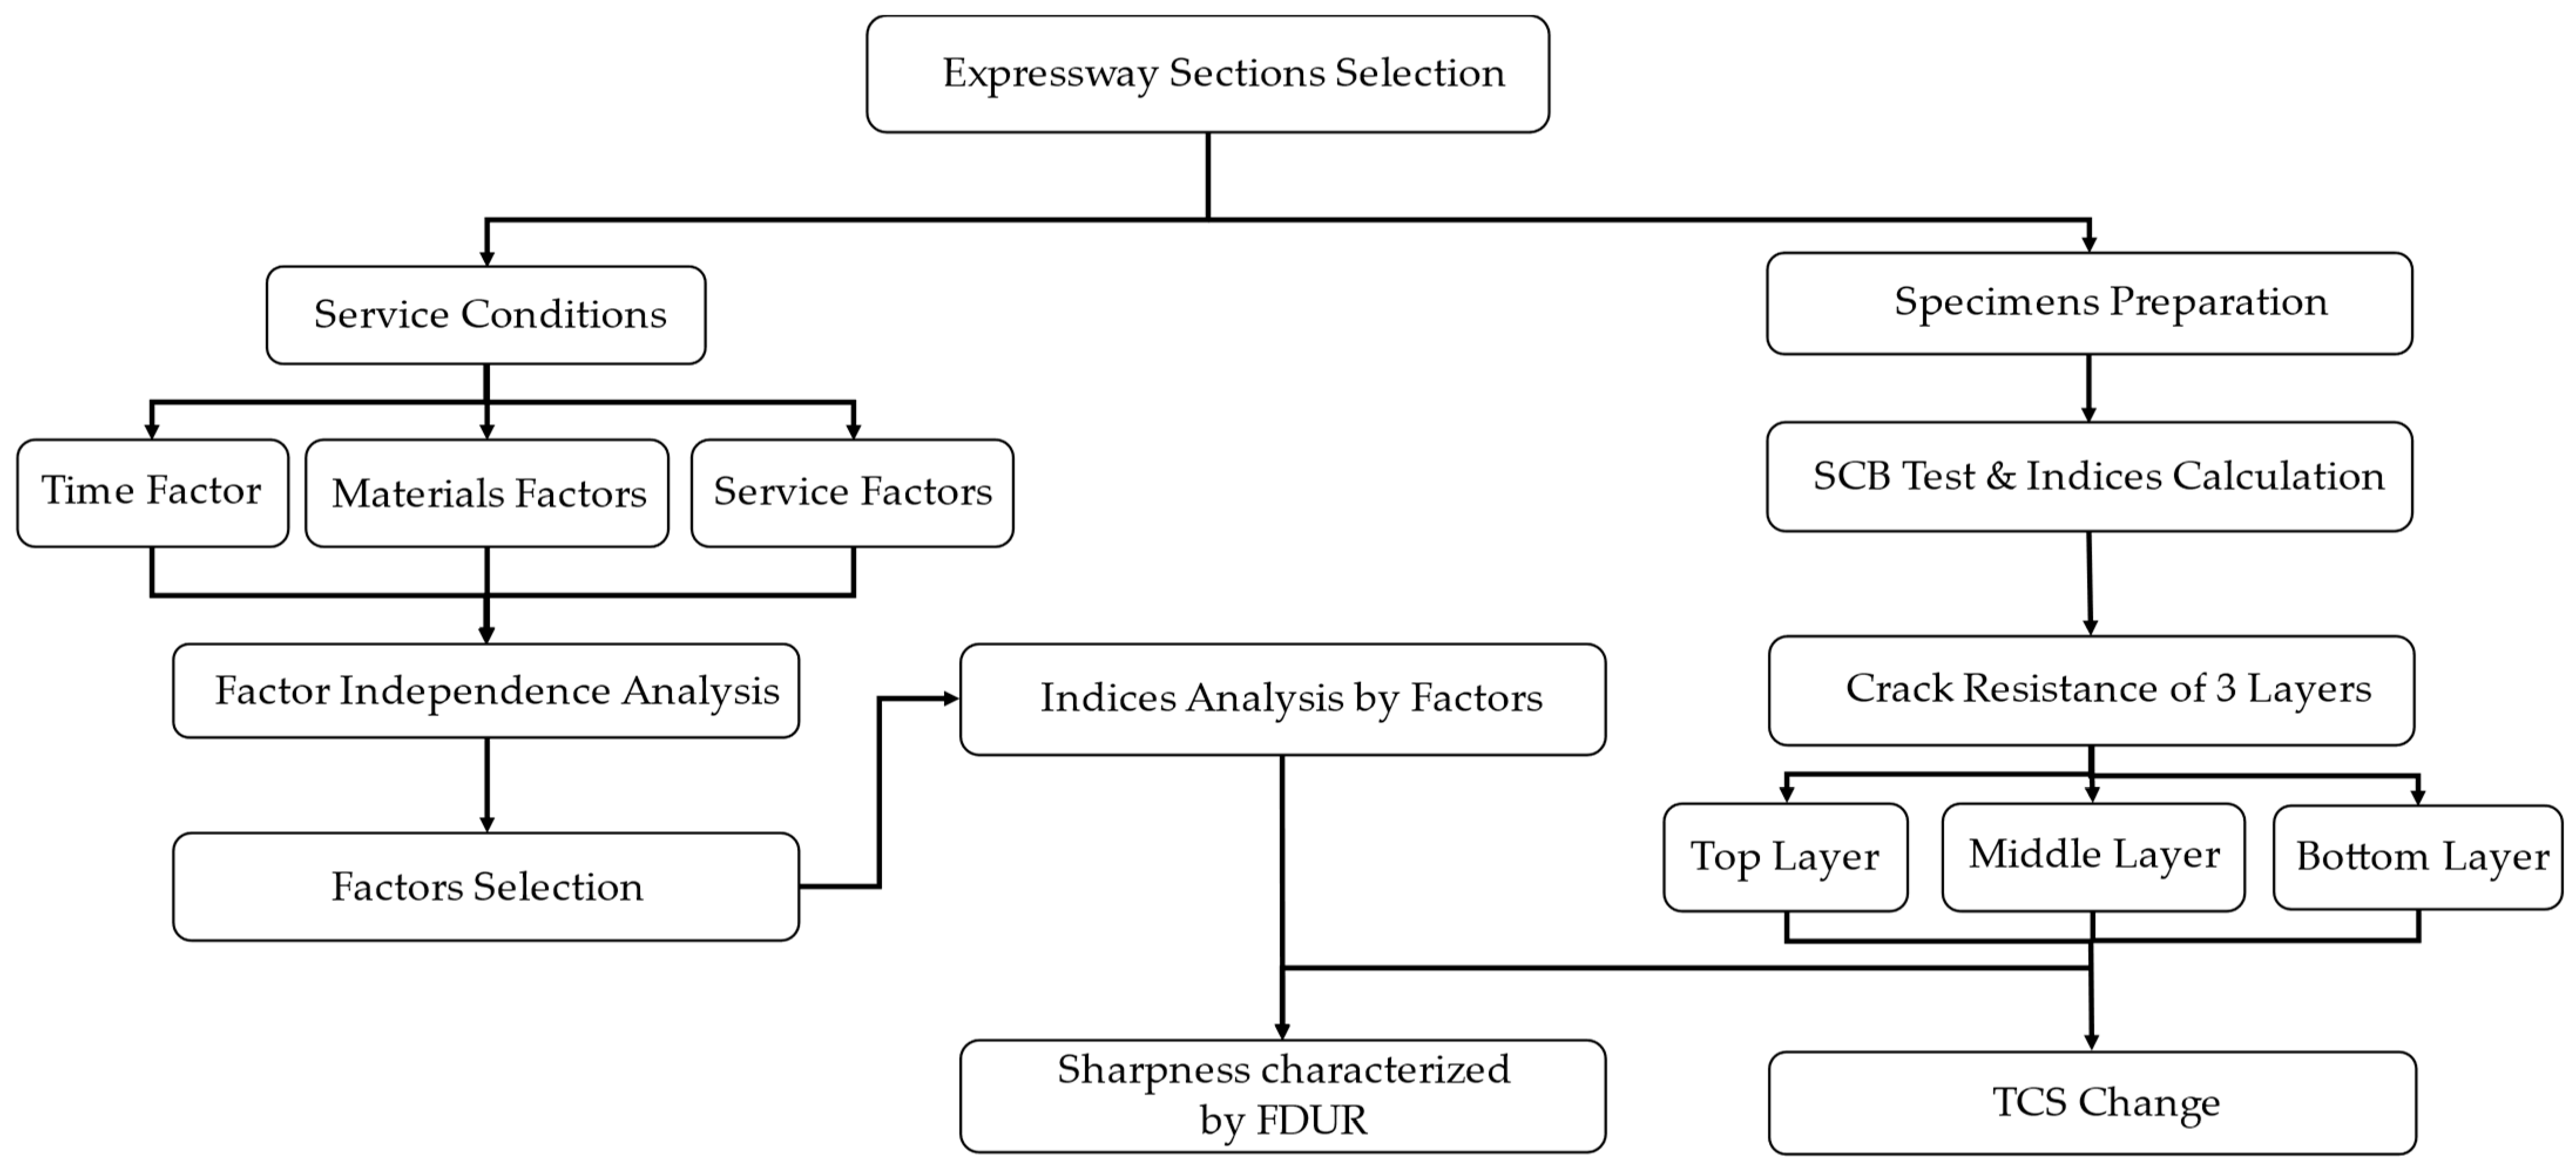
The objective of this research is to identify the factors that independently and significantly influence the crack resistance of pavement specimens and to conduct a statistical analysis of crack curve classification. A schematic diagram of the study is shown in Figure 1. Firstly, the independent significant influence is explored via factors independent analysis to determine whether these factors are significant to the crack resistance of a certain layer. Secondly, an analysis of variance (ANOVA) and Tukey–Kramer comparison analysis of factors on crack resistance is conducted to determine whether a factor significantly affects the crack resistance of specimens. Thirdly, the crack curve statistical analysis aims to distinguish between brittle fractures and ductile fractures on mixture specimens with different factor conditions.
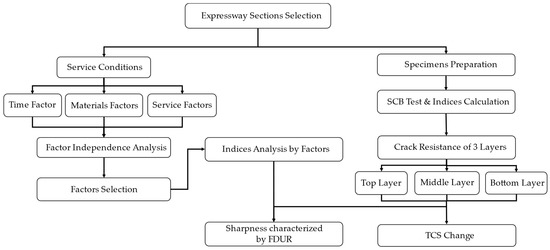
Figure 1.
Schematic diagram of this study.
2. Materials Preparation and Test Method
2.1. Pavement Section Selection and Factors Indentification
To evaluate mixture performance in pavement, several sections without any maintenance were selected. These sections were collected from 9 highways, as shown in Table 1. After the year 2000, all newly built and maintained projects used a modified asphalt mixture for the surface layer. Similarly, after the year 2007, all newly constructed and maintained middle layers also used modified asphalt mixture. Therefore, the surface and middle layer mixtures with a service age of less than 15 years are all modified.

Table 1.
The selected pavement section information.
The crack resistance of pavement in service is affected by various factors, which can be categorized as the time factor, materials factors, and service factors. The time factor only consists of one factor: service age. The materials factors are influenced by the original materials properties, such as air void, mixture type, and asphalt aggregate ratio. The service factors describe the service loads and environment, including the climate, average temperature and equivalent single-axle loads (ESALs). Most expressways have a service age of less than 20 years. If a pavement’s service age is greater than 20 years, maintenance is conducted.
2.2. Specimens Preparation
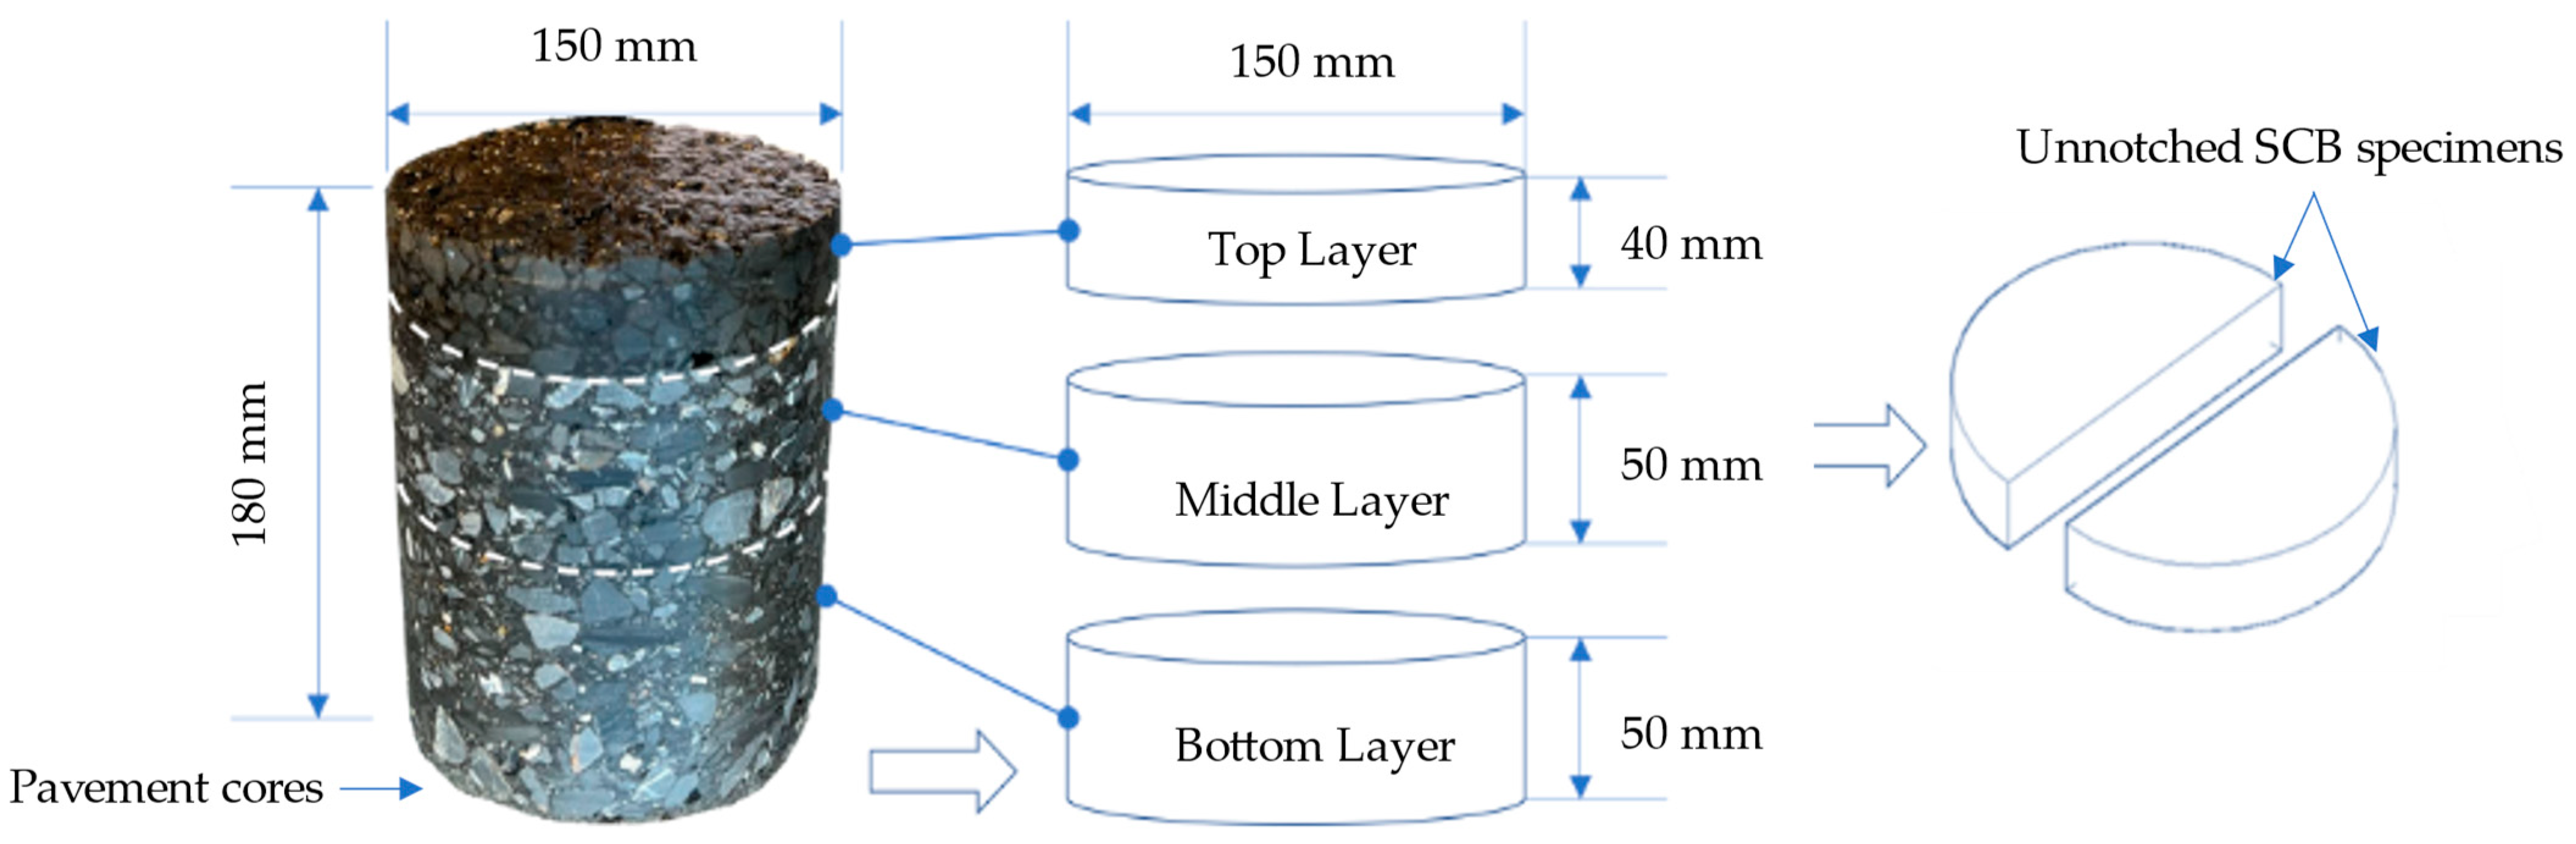
Sections within a 300 m-long drilling zone from the selected sections were chosen. At least 30 m was maintained between each drilled core. The cores were examined to ensure that there was no obvious crack on the core surface and were then labeled with the expressway name, position, and lane. These cores drilled from different pavement sections were then marked and cut into specimens [10]. Since the optimal width for the SCB test is 50 mm and common surface-layer thickness in Jiangsu is 40 mm, the specimen thickness of the surface, middle and bottom layer is 40 mm, 50 mm and 50 mm, respectively. The radius of the SCB specimen was 75 mm. A total of 144 specimens were prepared, with 48 specimens for each layer. Each selected section layer mixture had two parallel specimens to minimize deviation. The specimen preparation is shown in Figure 2.
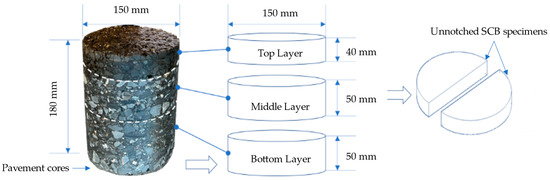
Figure 2.
Schematic of SCB specimens’ preparation [15].
2.3. SCB Test and Indices
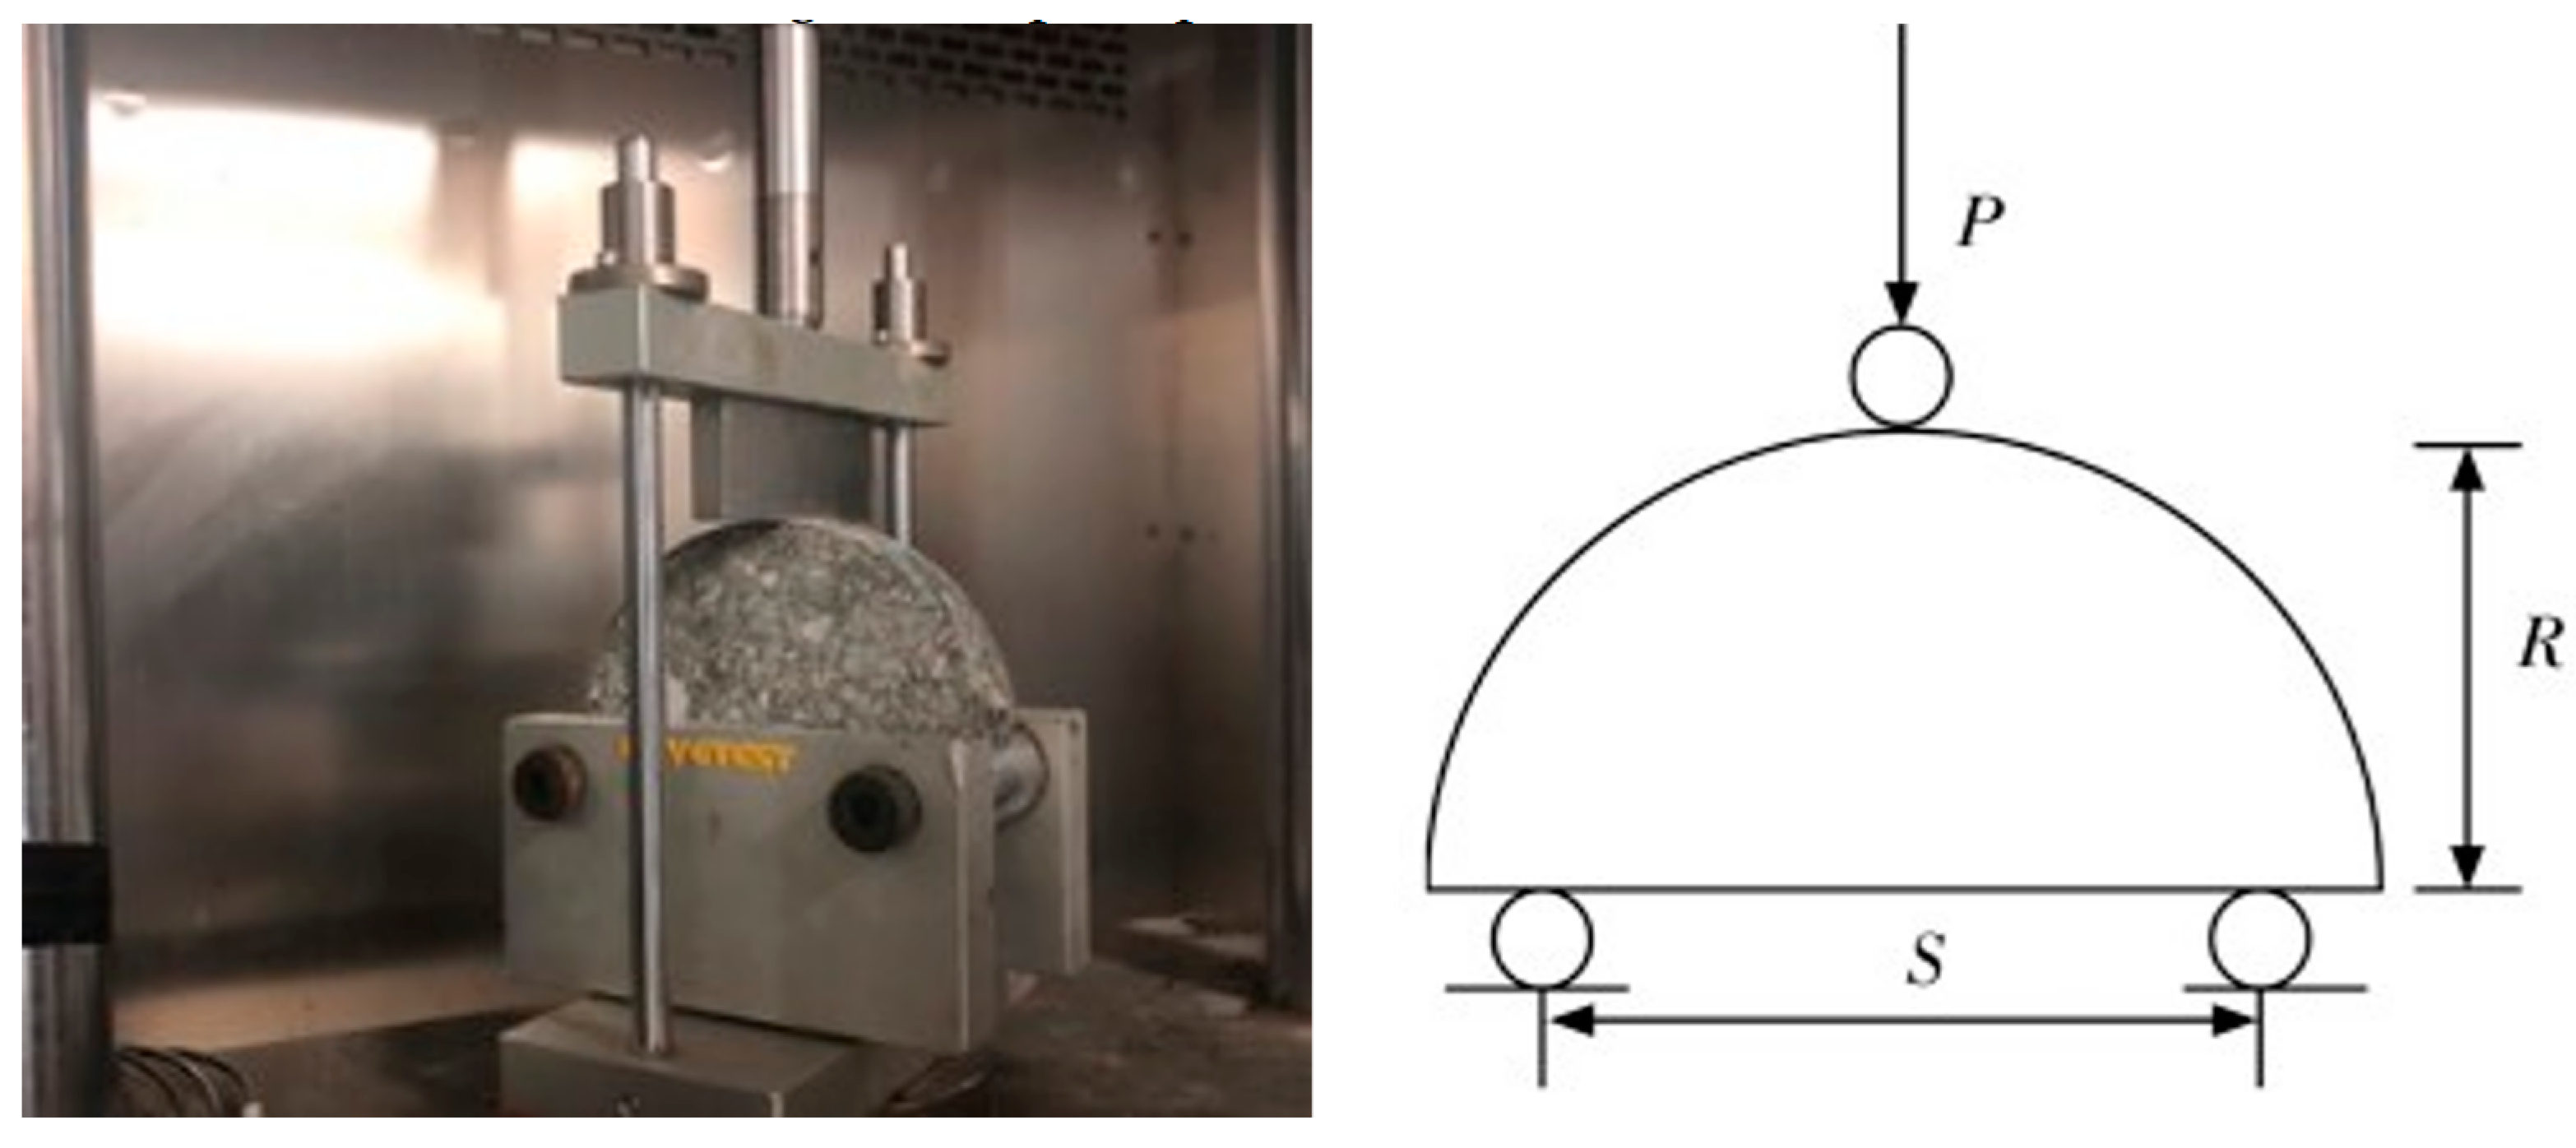
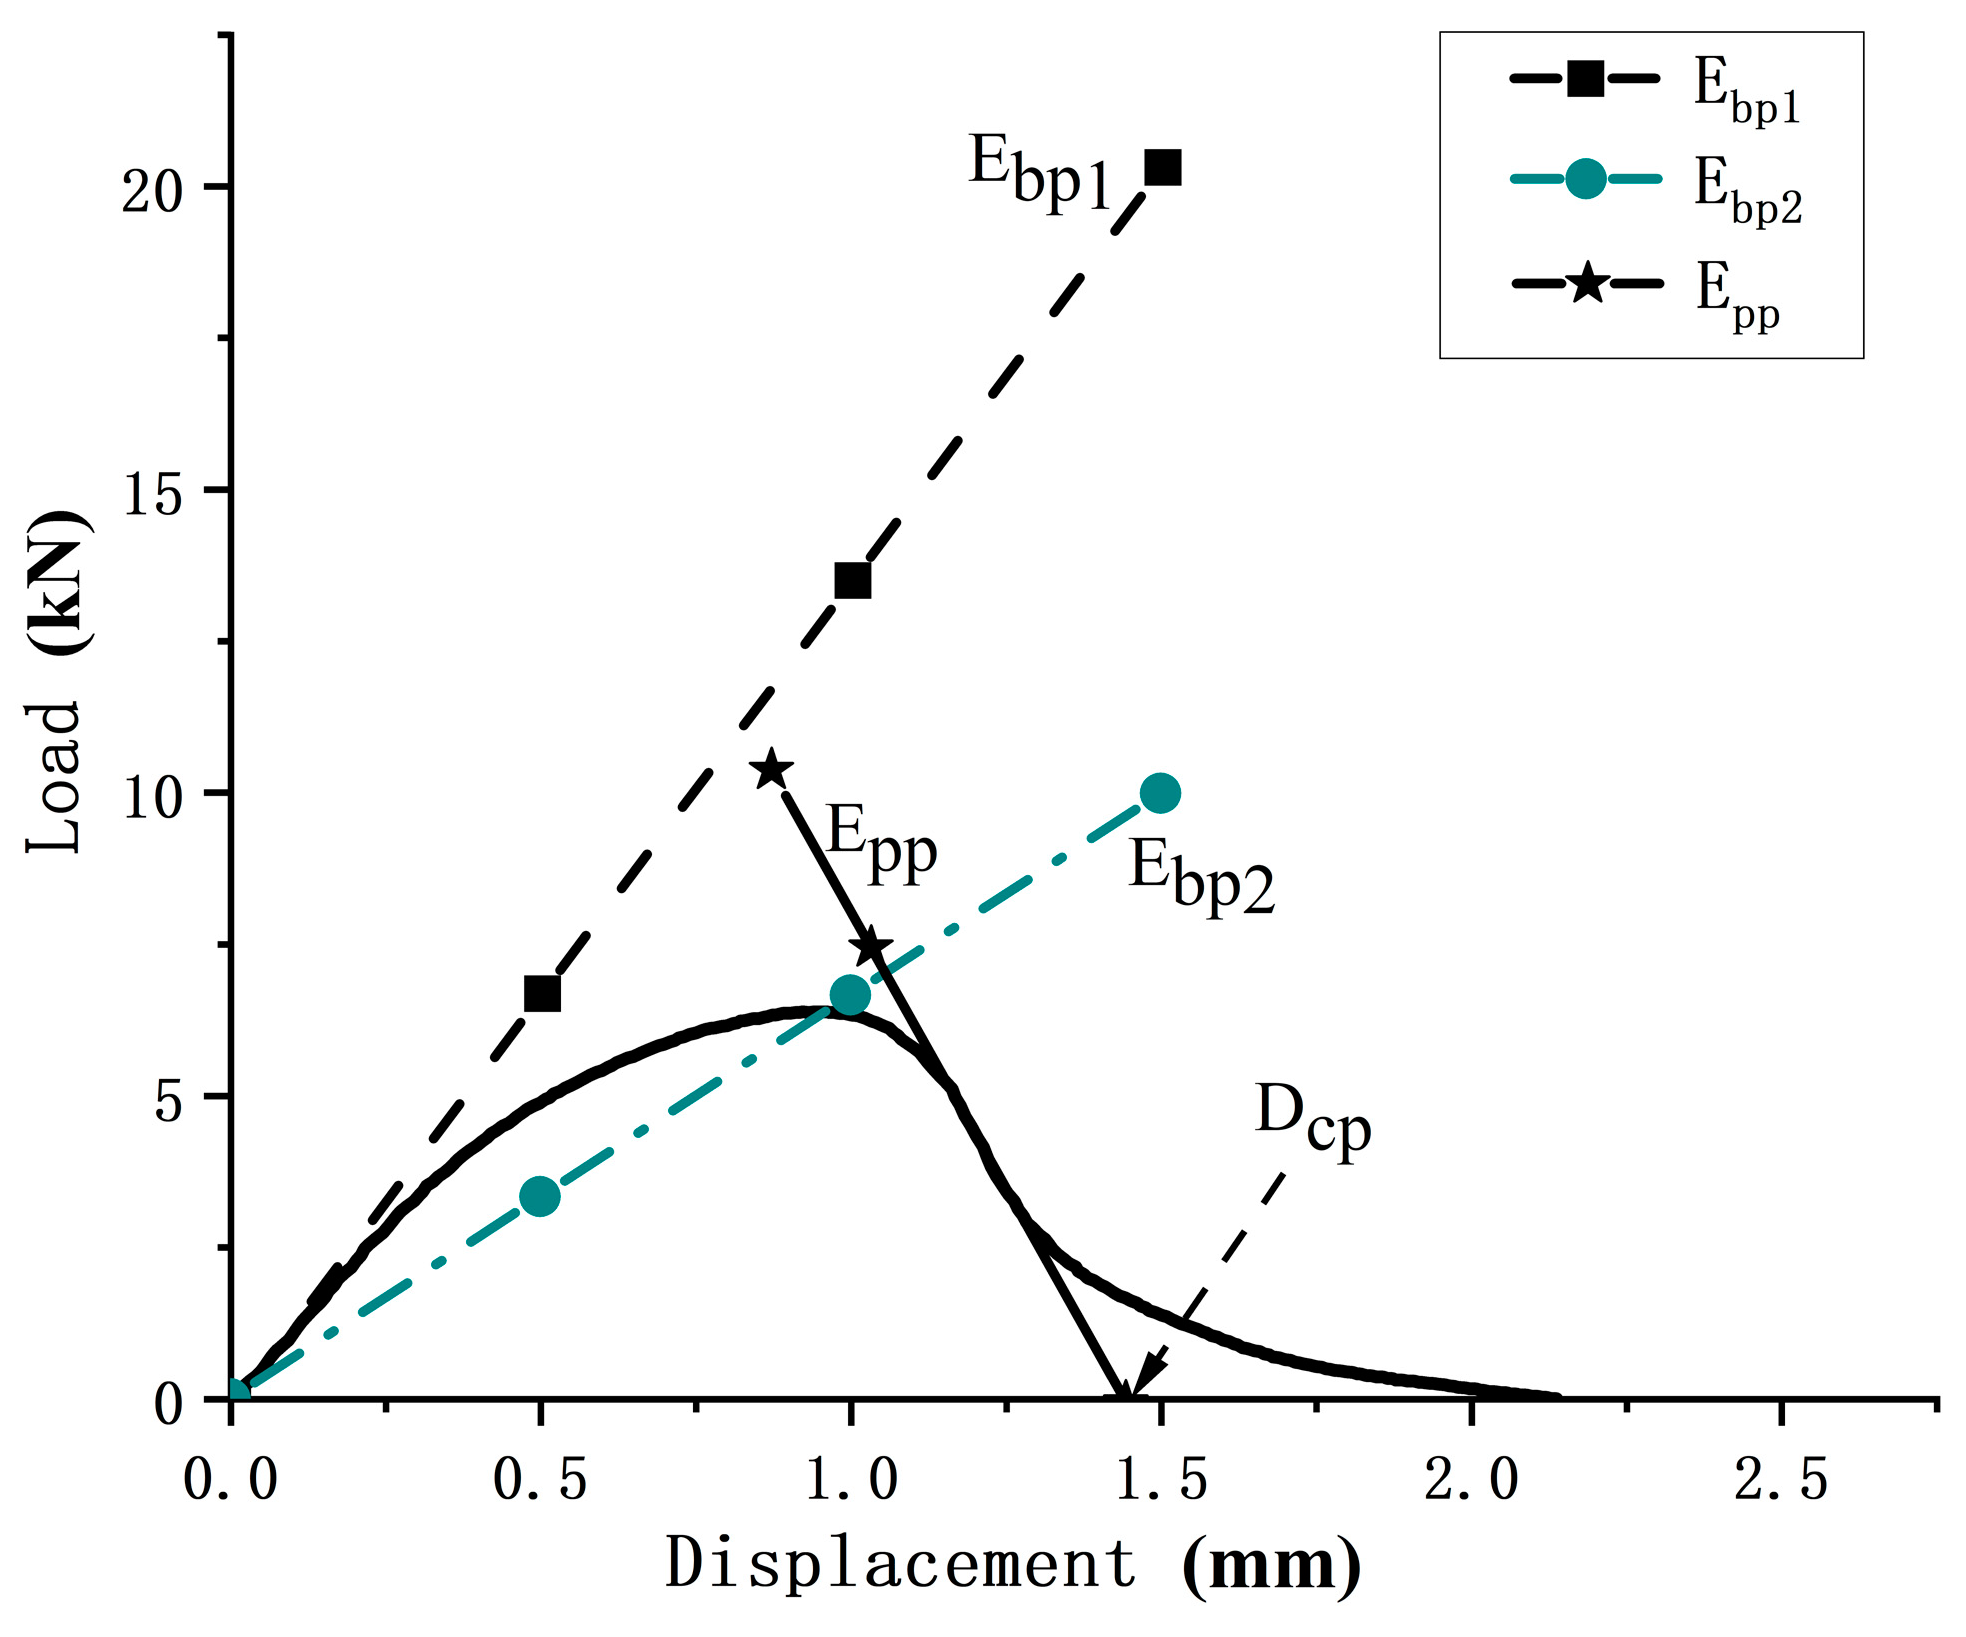
The un-notched SCB test components are shown in Figure 3. The test specimen has a diameter (R) of 75 mm and is placed on two cylinder supports with a width of 0.8 diameter (120 mm). The actuator is placed on top of the specimen and applies a vertical load. To ensure uniform temperature in specimens, the specimens were placed in the environmental chamber at the test temperature for 4 h prior to testing. The test temperature is 15 ℃, and the loading speed is 50 mm/min [24]. In a typical SCB test, the load–displacement curve appears similar to that in Figure 4, showing a single peak curve. This peak can be divided into the before peak zone and the post-peak zone, with the dividing point being the maximum force point. For the intermediate temperature crack test on asphalt mixture, the load–displacement curve shows a continuous ascending curve before peak and a smooth continuous descending curve post peak.
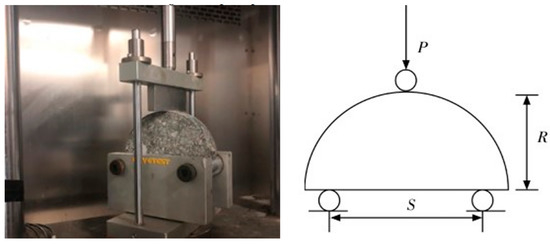
Figure 3.
Un-notched SCB test component and load graph.
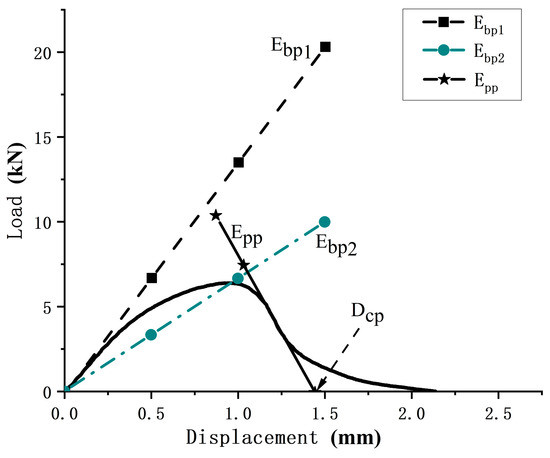
Figure 4.
SCB test component and load graph.
After loading is completed, the curve is plotted, and three indices are calculated to evaluate the crack resistance of the mixture. These indices are tensile strength, fracture energy and CRI (crack index), as shown in Equations (1)–(3) below [8,25,26,27]:
where = SCB tensile strength (MPa); F = peak load (kN); B = specimen thickness (mm); D = specimen diameter (mm).
where = fracture energy (J/m2); = work of fracture (J); ; P = applied load (kN); u = vertical displacement (mm); = ligament area (m2); .
where CRI = crack index (1/m)
The tensile strength indicates the ability of the mixture to resist strength and is used to measure the load capacity of the specimen. A higher tensile strength indicates a better load resistance for the tested specimen. The CRI is a combined index that divides the fracture energy by the peak load [28,29,30]. Because crack progress could be divided into three phases: uncrack working, crack work and failure, a higher CRI, at the same fracture or tensile strength, indicates a better overall fracture resistance performance for the tested specimen.
2.4. Significance Factors Analysis
In terms of SCB test data, they were collected from different pavements under service conditions, resulting in a range of data variation. To address this, it is necessary to identify and remove possible outliers from the original test data. The JMP software platform was utilized for this purpose to reduce bias, and all test data were entered into JMP as numerical variables. ANOVA was employed as a statistical significance analysis model to determine the relationship between dependent factors and one (or more) independent factors [31,32].
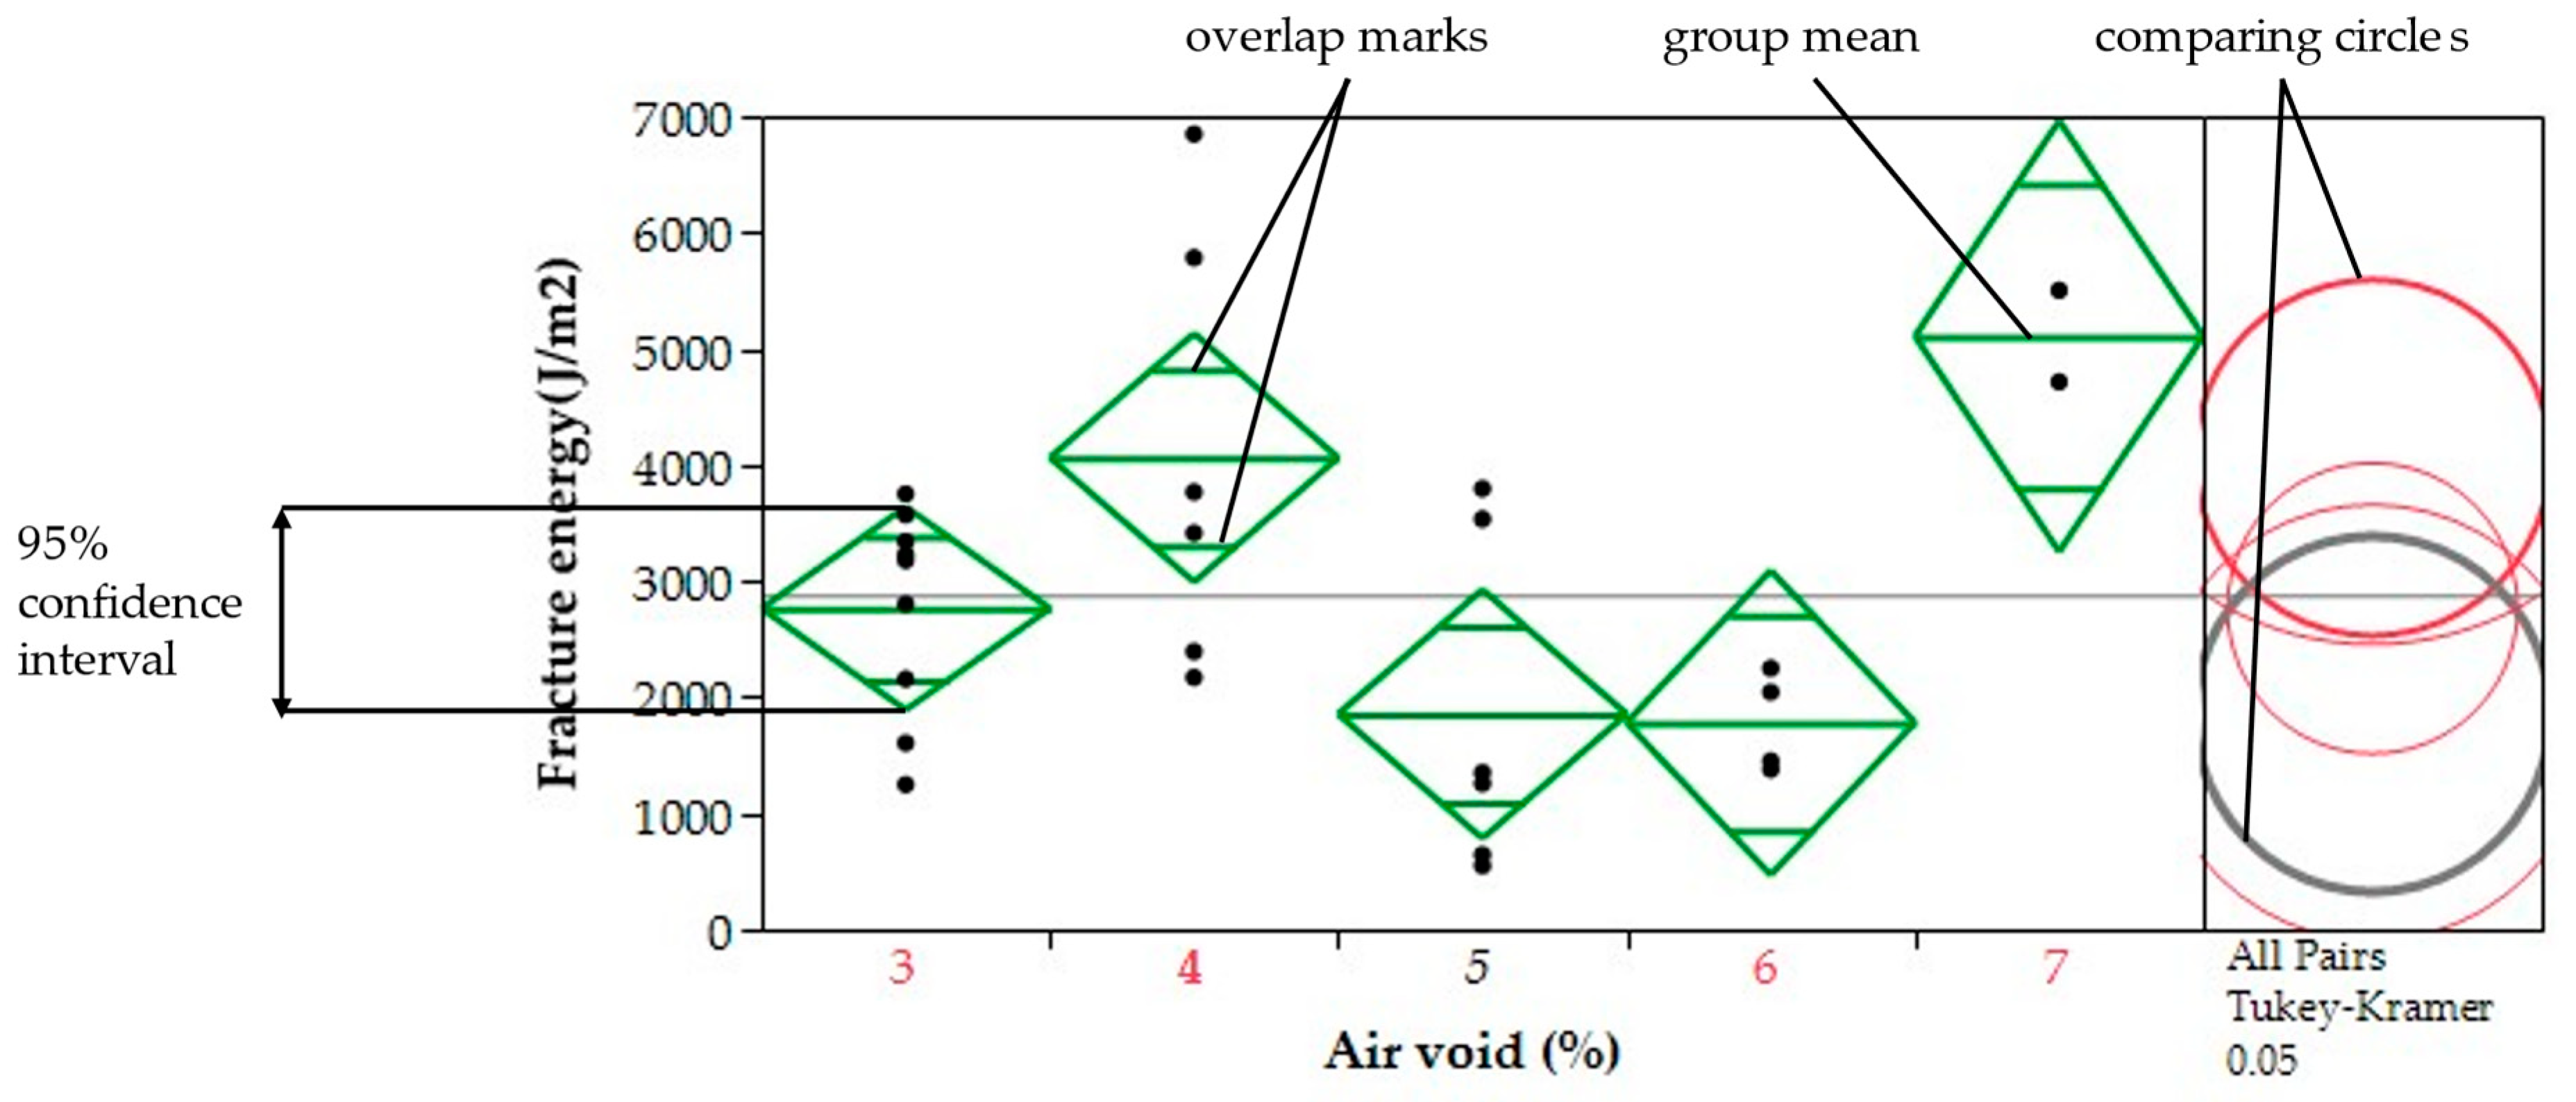
To illustrate the distribution of the selected data, means diamonds and Tukey–Kramer comparison circles were plotted. In the diamond graph, the top and bottom points represent the (α)*100 confidence interval for each group, and a confidence interval α = 95% was selected. The mean lines across the center of the diamond represent the group mean. Overlap marks appear as lines above and below the group mean, and they are calculated as group mean , where CI represents the confidence interval. For data groups of equal sizes, overlap marks indicate that the group means are not significantly different at the given confidence level. Similar to the mean diamonds, the Tukey–Kramer comparison circle was used to compare the significance between two variables. The Tukey–Kramer comparison circle is depicted in Figure 5 on the inner-right side of the mean diamond, with the circle radius equal to corresponding various CI. When observing the comparison circles of two variables, if the circles do not intersect or only have a small intersection, this indicates that the two variables are significantly different.
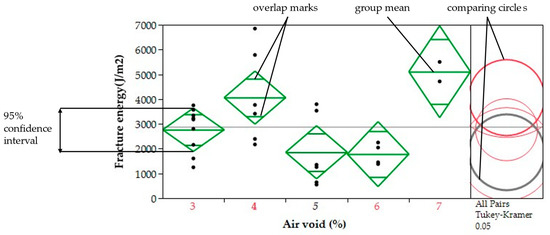
Figure 5.
Means diamond of 95% confidence interval and Tukey–Kramer circles.
In the graph showing the Tukey–Kramer comparison circles, test results were used to reveal the sensitivities of variables such as mixture type, service age (year), asphalt aggregate ratio and so on. The circles were plotted on the right side of the diamond graph, with each circle corresponding to a diamond on the left. The center of the circle was set to the same value as the mean value, and the diameter was equal to the confidence interval. By analyzing the intersection of any circles, the significance of the parameters could be determined. If any two circles did not intersect or had only a small intersection area, this indicated that the two corresponding parameters were significantly different. When a circle was selected, it was highlighted in red, while the circles representing significant parameters were colored gray and bold [33].
3. Results and Discussion
3.1. Factor Independence Analysis
Since the asphalt mixtures for each layer have different structure, function and mechanism requirements, in this section, the results of three layers are discussed separately. Firstly, the factor independence analysis was conducted on all selected factors, because the performance of pavement mixture is complex and influenced by multiple factors [30]. To avoid the correlated factors, several factors of each layer were selected via factor independence analysis for further analysis. The stepwise regression method was used to test if one factor was significantly different from another. The stepwise regression used minimum Bayesian information criterions (BIC) as the stopping rule and forward direction. This regression can handle both numeric and nominal types of factors, and BIC can control the complexity of model at an appropriate level. The correlation of selected factors by three layers is listed in Table 2, Table 3 and Table 4. The asterisk in the table means that the row and column of the two factors are not independent. Then, the independent factors of the three layers were selected; the independent factors of the surface layer were service age, mixture type and air void, while the independent factors of the middle layer were service age, lane and air void, and the independent factors of the bottom layer were service age, air void and asphalt aggregate ratio. The total selected factors of three layers are shown in Table 5.
Table 2.
Factors independence analysis of surface-layer specimens.
Table 3.
Factors independence analysis of middle-layer specimens.
Table 4.
Factors independence analysis of bottom-layer specimens.
Table 5.
Factor selection results of three layers.
In the analysis of factor significance, it was found that some independent factors, such as service age and air void, were selected for all three layers. In addition to these common factors, the surface layer had also had the mixture type and asphalt aggregate ratio as independent factors. This might be the result of two different mixture types, AC13 and SMA13. The middle layer had an independent factor lane, which meant loads on lanes had an impact on the crack resistance of middle-layer specimens. Since trucks on the expressway were recommended to drive in lane 3, the shear loads had the most impact on the middle layer. This might result in crack resistance in the middle layer. The independent factors of all three layers were mostly materials factor and service age; the performance of materials and service age were the most important factors for selected expressway crack-resistance performance.
3.2. Indices Analysis Results by Factors
To clarify the influence of each factor on the crack-resistance performance, ANOVA tests were conducted on three crack indices versus selected factors of three layers. The ANOVA tests were conducted with an alpha value of 0.05 at the 95% confidence level. The results of ANOVA Tests of crack-resistance performance indices versus selected factors of three layers were shown in Table 6, Table 7 and Table 8, the annotations were attached behind Table 6. The p-value was used to evaluate the significance of factors. A small p-value (<0.05) indicated that the selected factor has a statistically significant impact on the crack index. The smaller p-value (<0.01 or <0.001) indicated that the selected factor has a relatively higher significant impact.
Table 6.
ANOVA results of crack-resistance performance of surface layer.
Table 7.
ANOVA results of crack-resistance performance of middle layer.
Table 8.
ANOVA results of crack-resistance performance of bottom layer.
From Table 6, we could see that the tensile strength was significant to the mixture type and asphalt aggregate ratio, the fracture energy and CRI were more significant to service age and the tensile strength was significant with regard to the mixture and asphalt aggregate ratio. Crack indices of surface layer specimens did not have a significant relationship with air voids. Table 7 showed that tensile strength and fracture energy are both significant to service age; fracture energy was more significant to service age, tensile strength and CRI. And tensile strength was significant to lane. Table 8 shows tensile strength, fracture energy and CRI were significant to service age, and all three indices were significant at the highest level. The fracture energy and CRI were also significant to air voids.
3.3. Crack-resistance performance on Three-Layer Specimens
3.3.1. Crack-resistance performance Change on Surface Layer Specimens
From Table 6, we learn that tensile strength is significant to the mixture type and asphalt aggregate ratio, while fracture energy and CRI are significant to service age. The ANOVA and Tukey–Kramer results of surface layer were shown in Figure 6, Figure 7 and Figure 8. The means and 95% confidence intervals were shown in green diamonds. And the Tukey–Kramer circles were shown in the right side; when selecting a parameter, the circles of parameters with significant differences to the selected parameter were painted gray and others were painted red. Thus, the impact of service age, mixture type and air void was introduced when considering the impact of mixture type and air void. Figure 6 shows the tensile versus mixture type; Figure 7 shows the tensile strength versus air voids. From Figure 8, we learn that surface-layer specimens’ tensile strength was significantly different in terms of mixture type, while the tensile strength of AC13M was significantly larger for SMA13Ms. And the circles in Tukey–Kramer circles did not interact.
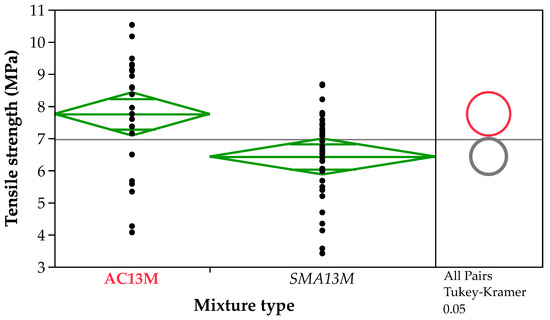
Figure 6.
ANOVA and Tukey–Kramer comparison of tensile strength of surface-layer specimens by mixture type.
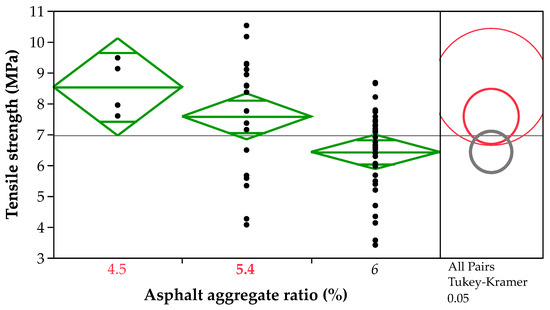
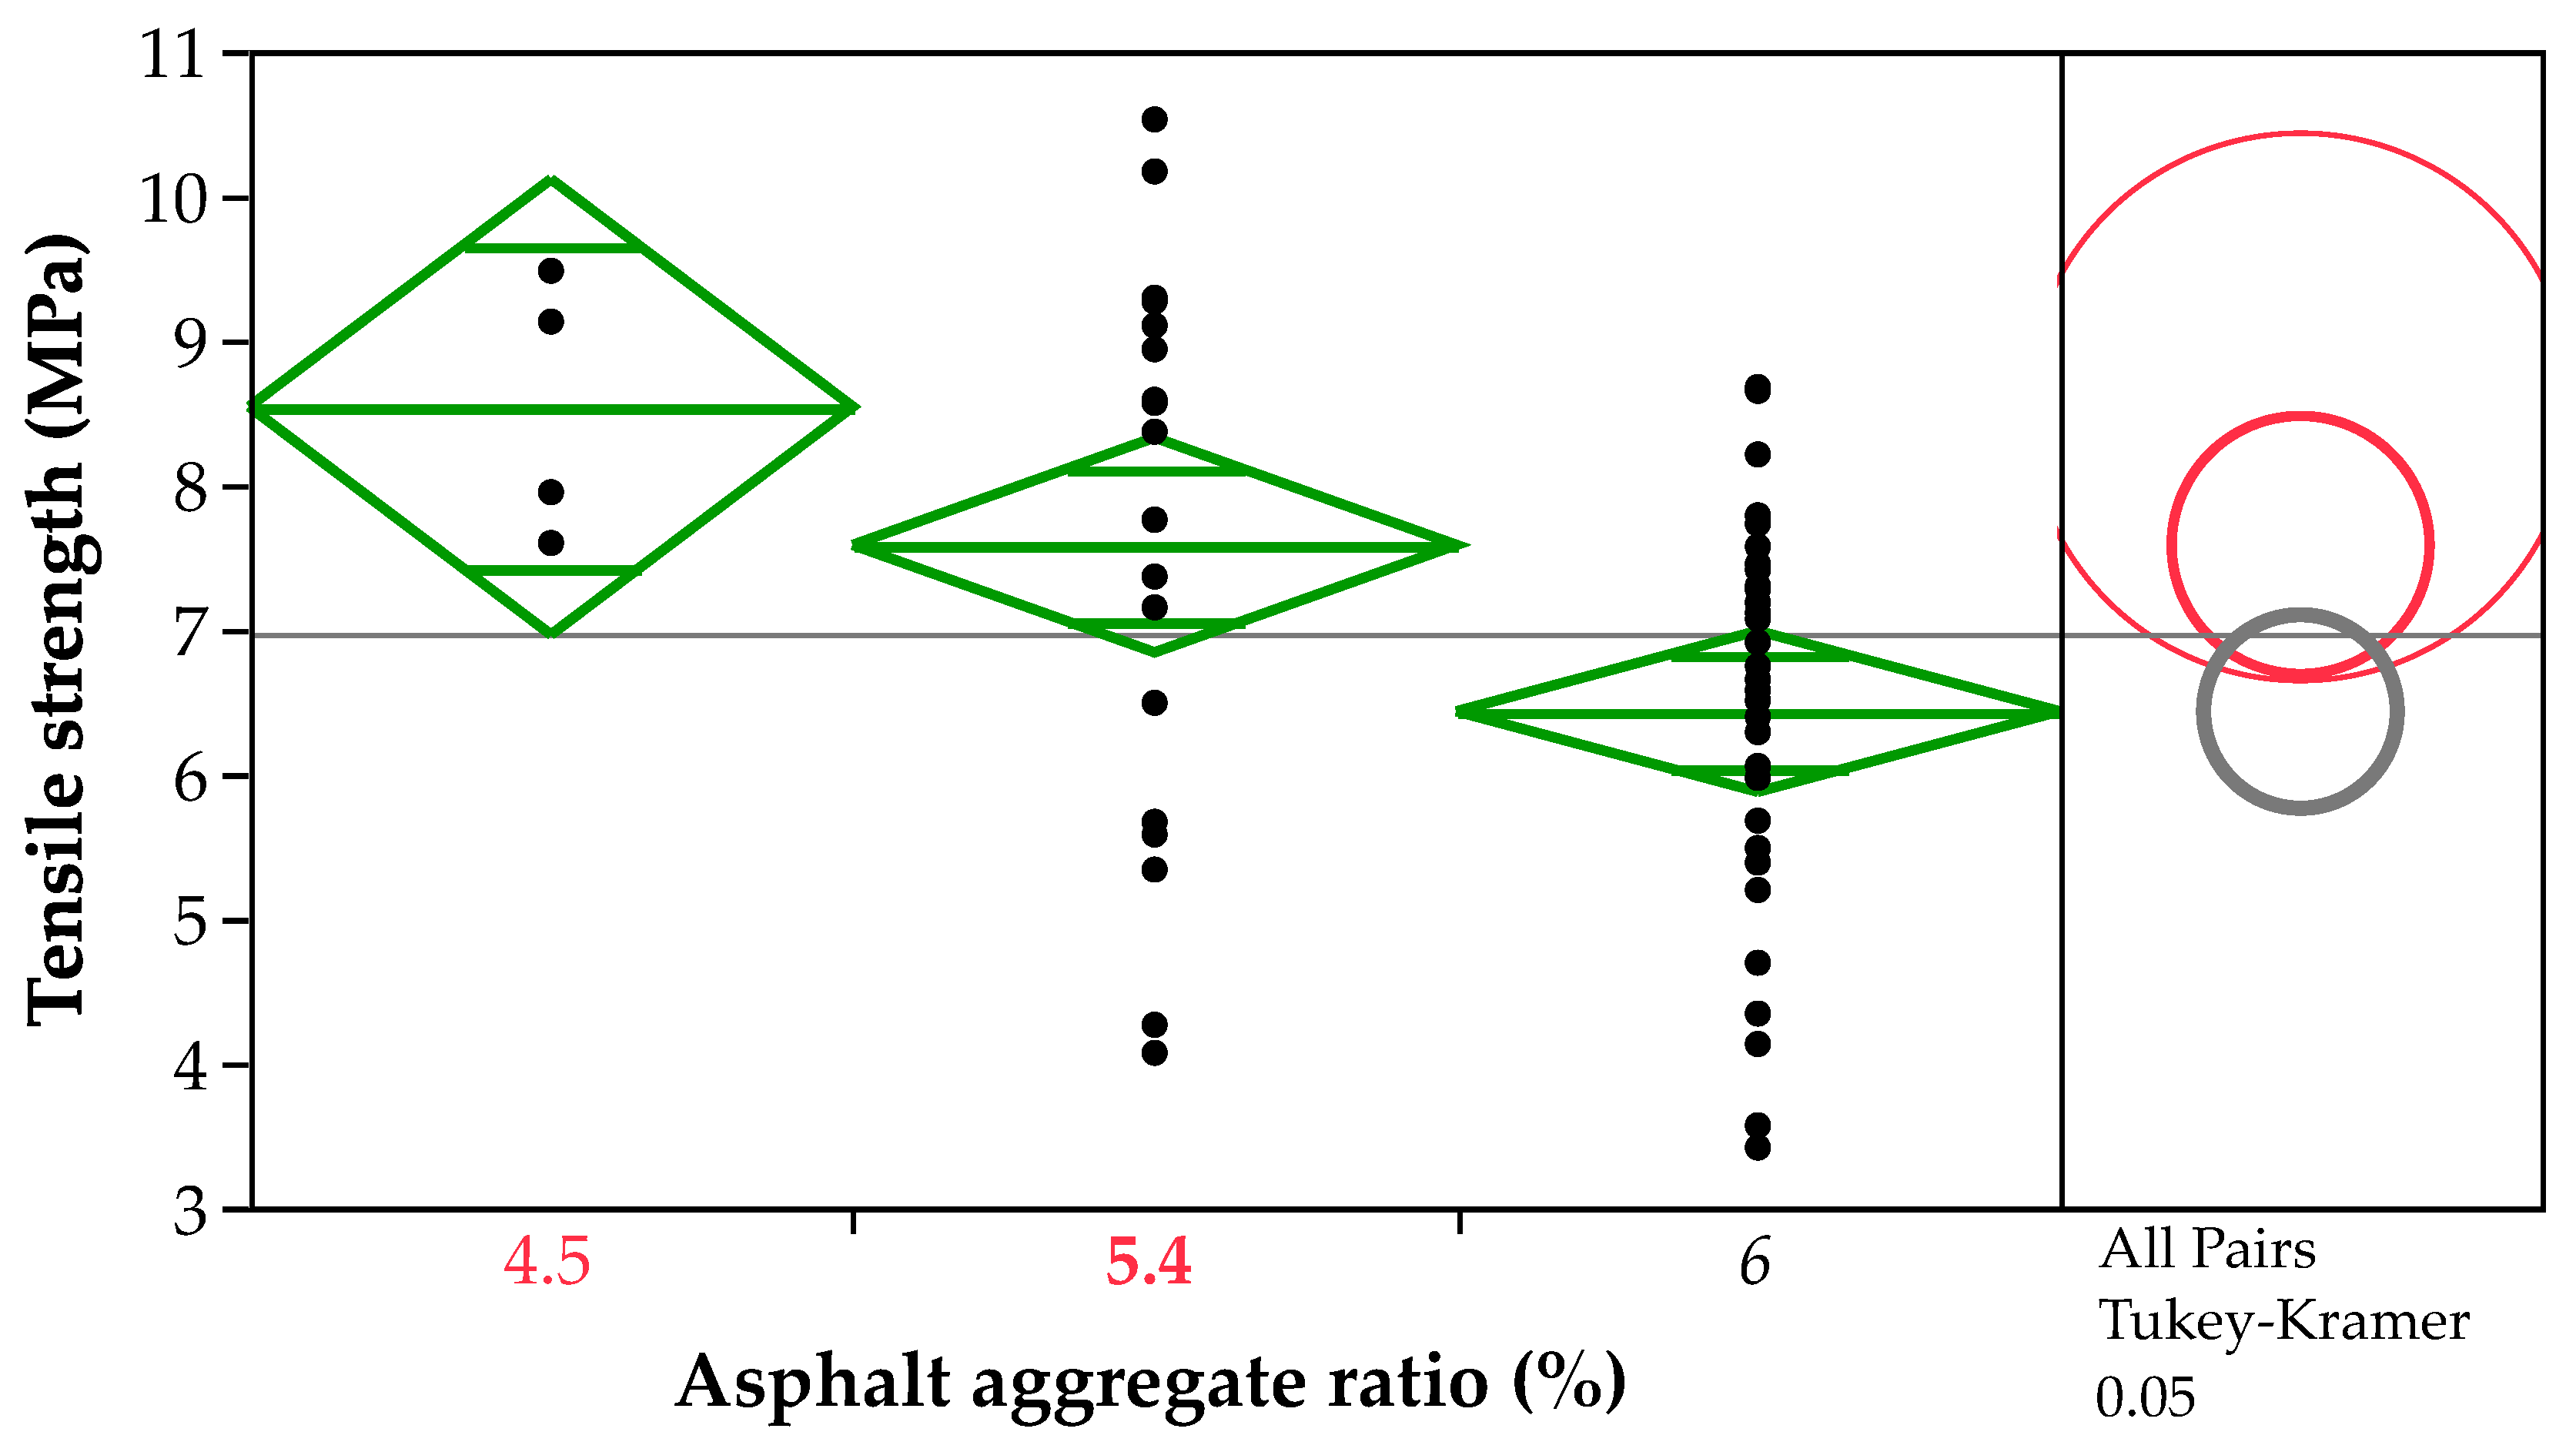
Figure 7.
ANOVA and Tukey–Kramer comparison of tensile strength of surface-layer specimens based on the asphalt aggregate ratio.
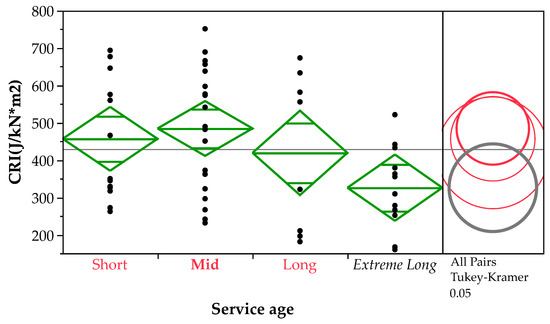
Figure 8.
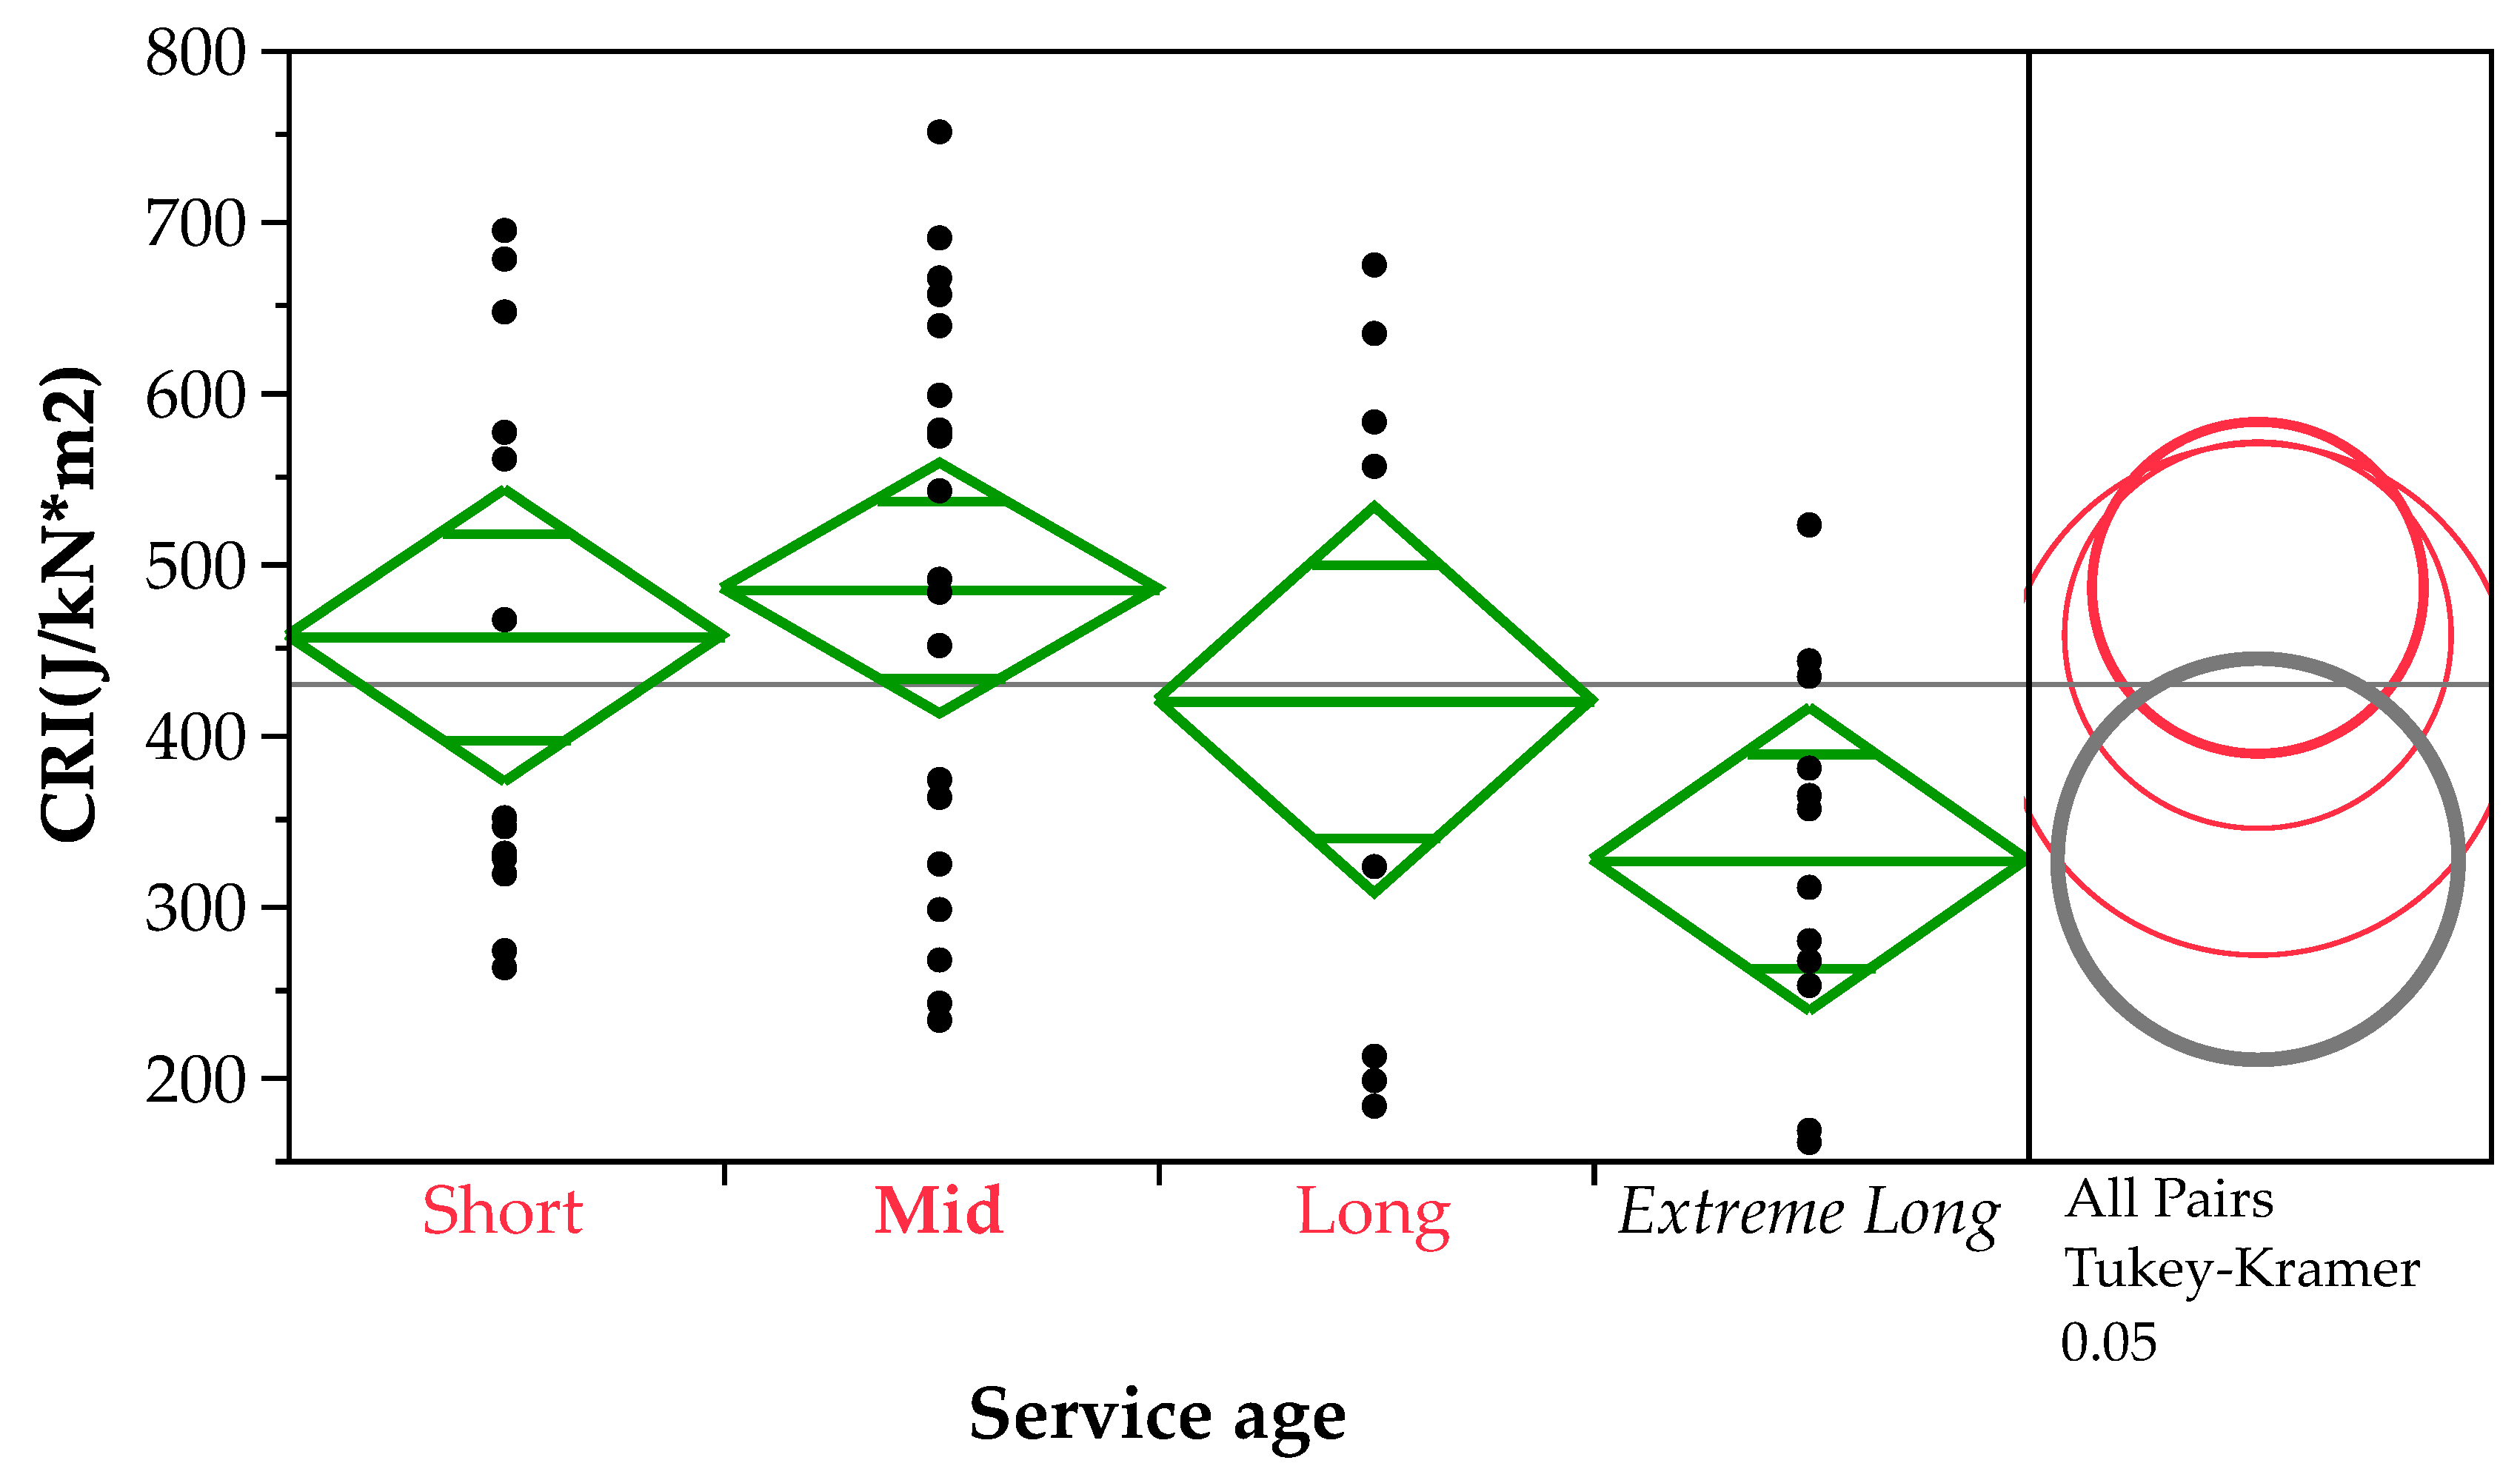
ANOVA and Tukey–Kramer comparison of CRI of surface-layer specimens by service age.
From Figure 6, we learn that surface-layer specimens’ tensile strength differed significantly based on the asphalt aggregate ratio. The higher the asphalt aggregate ratio was, the lower the tensile strength was. And the tensile strengths of 4.5% asphalt aggregate ratio and 5.4% specimens were significantly different to the tensile strength of the 6% asphalt aggregate ratio. This result also indicates that the AC13M’s specimens had a higher tensile strength because Figure 7 showed that the lower the asphalt aggregate ratio was, the higher the tensile strength was.
From Figure 8, we learn that surface-layer specimens’ CRI was significantly different based on service age. The mid service age surface-layer specimens had the highest CRI and extremely long service age surface-layer specimens had the lowest CRI. The average CRI increased from short to mid service age and then decreased from mid to extremely long. The CRI of mid service age and extremely long service age had significant differences. And this crack resistance difference was significant at extremely long service age. This result indicated the crack-resistance performance did not decrease for pavement which had a service age of 0 years; the surface-layer specimens’ crack resistance reinforced over the first few years, reached the highest level at mid service age and then decreased with the accumulating service age from mid service age. This decreasing tendency led to significant differences in the crack resistance of surface-layer specimens when their service age reached about 15 years.
3.3.2. Crack-Resistance Performance Change in Middle-Layer Specimens
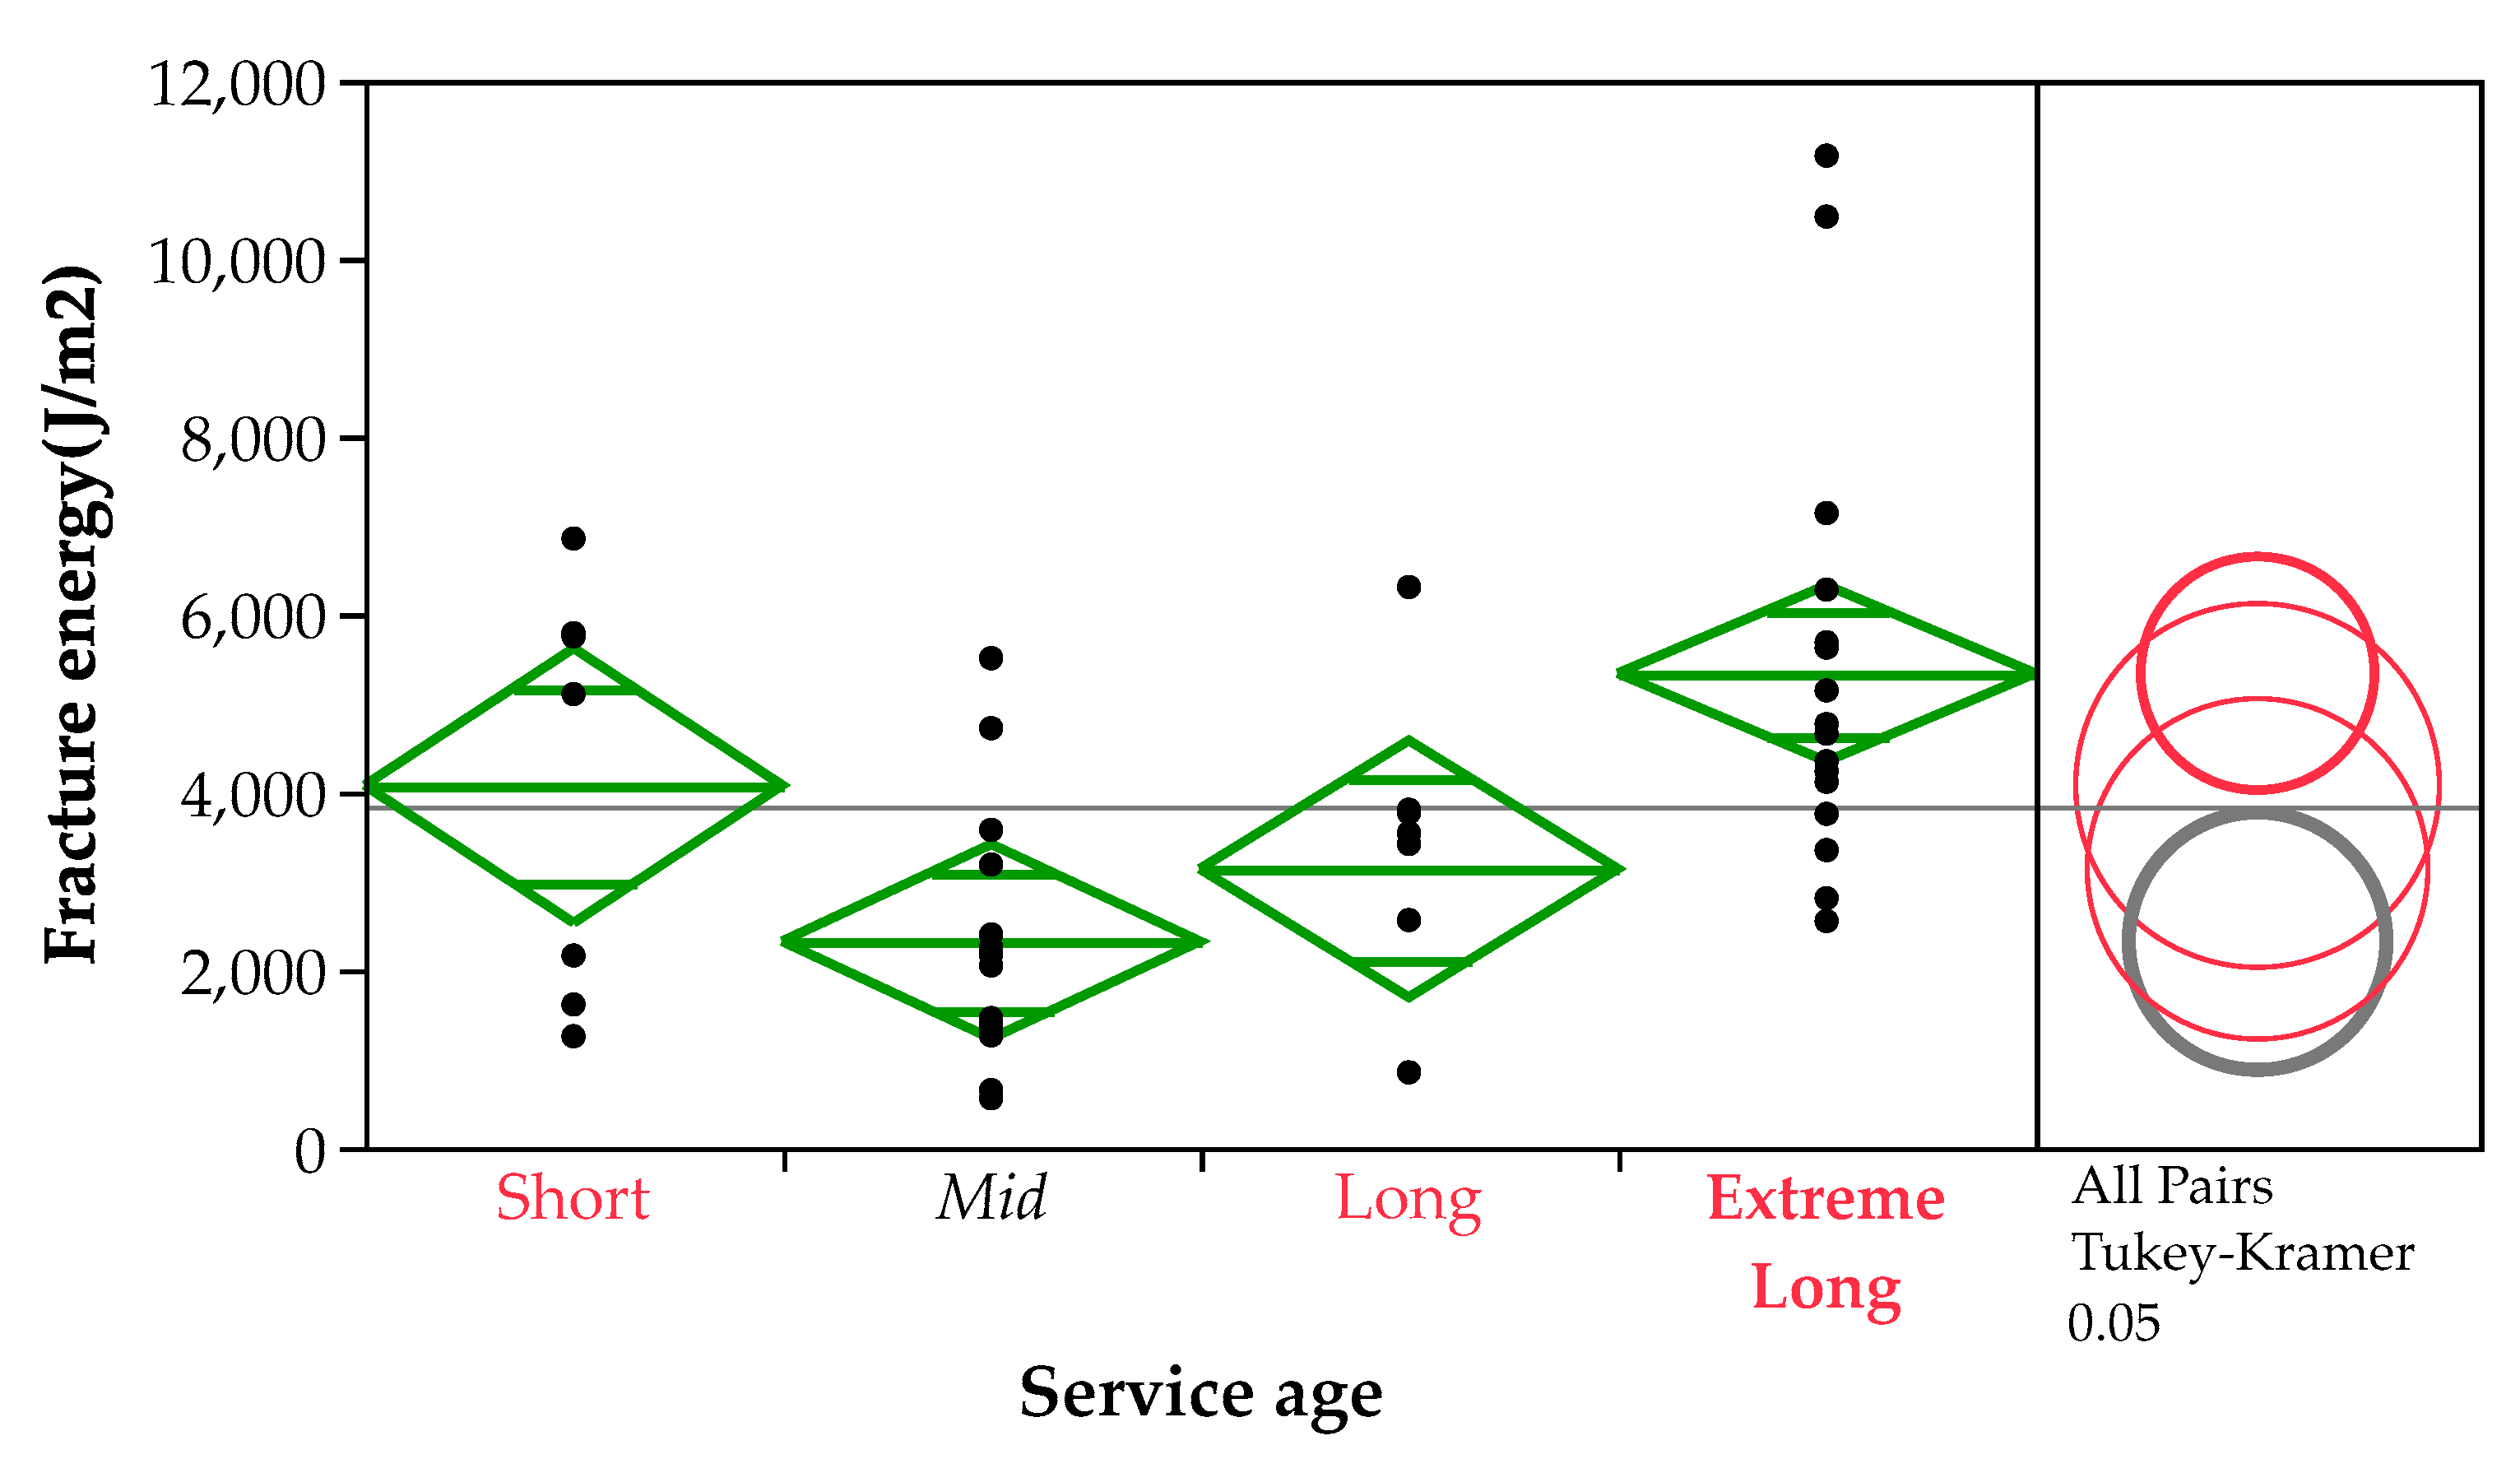
From Table 7, we learn that tensile strength was significant to service age and lane, fracture energy and CRI were also significant to service age. Figure 9 showed the average fracture energy of specimens of mid service age was significant to that of the short, long and extremely long service age. When the middle layers were paved, the mixtures of the middle layer exhibited a fracture energy decrease in the first 5 years and then increased from 5 years to 20 years. This tendency was the opposite to the tendency of surface-layer specimens.
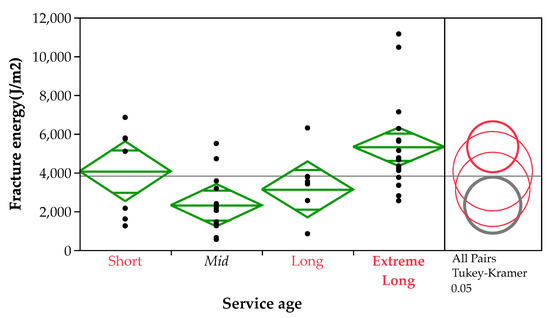
Figure 9.
ANOVA and Tukey–Kramer comparison of fracture energy of middle-layer specimens by service age.
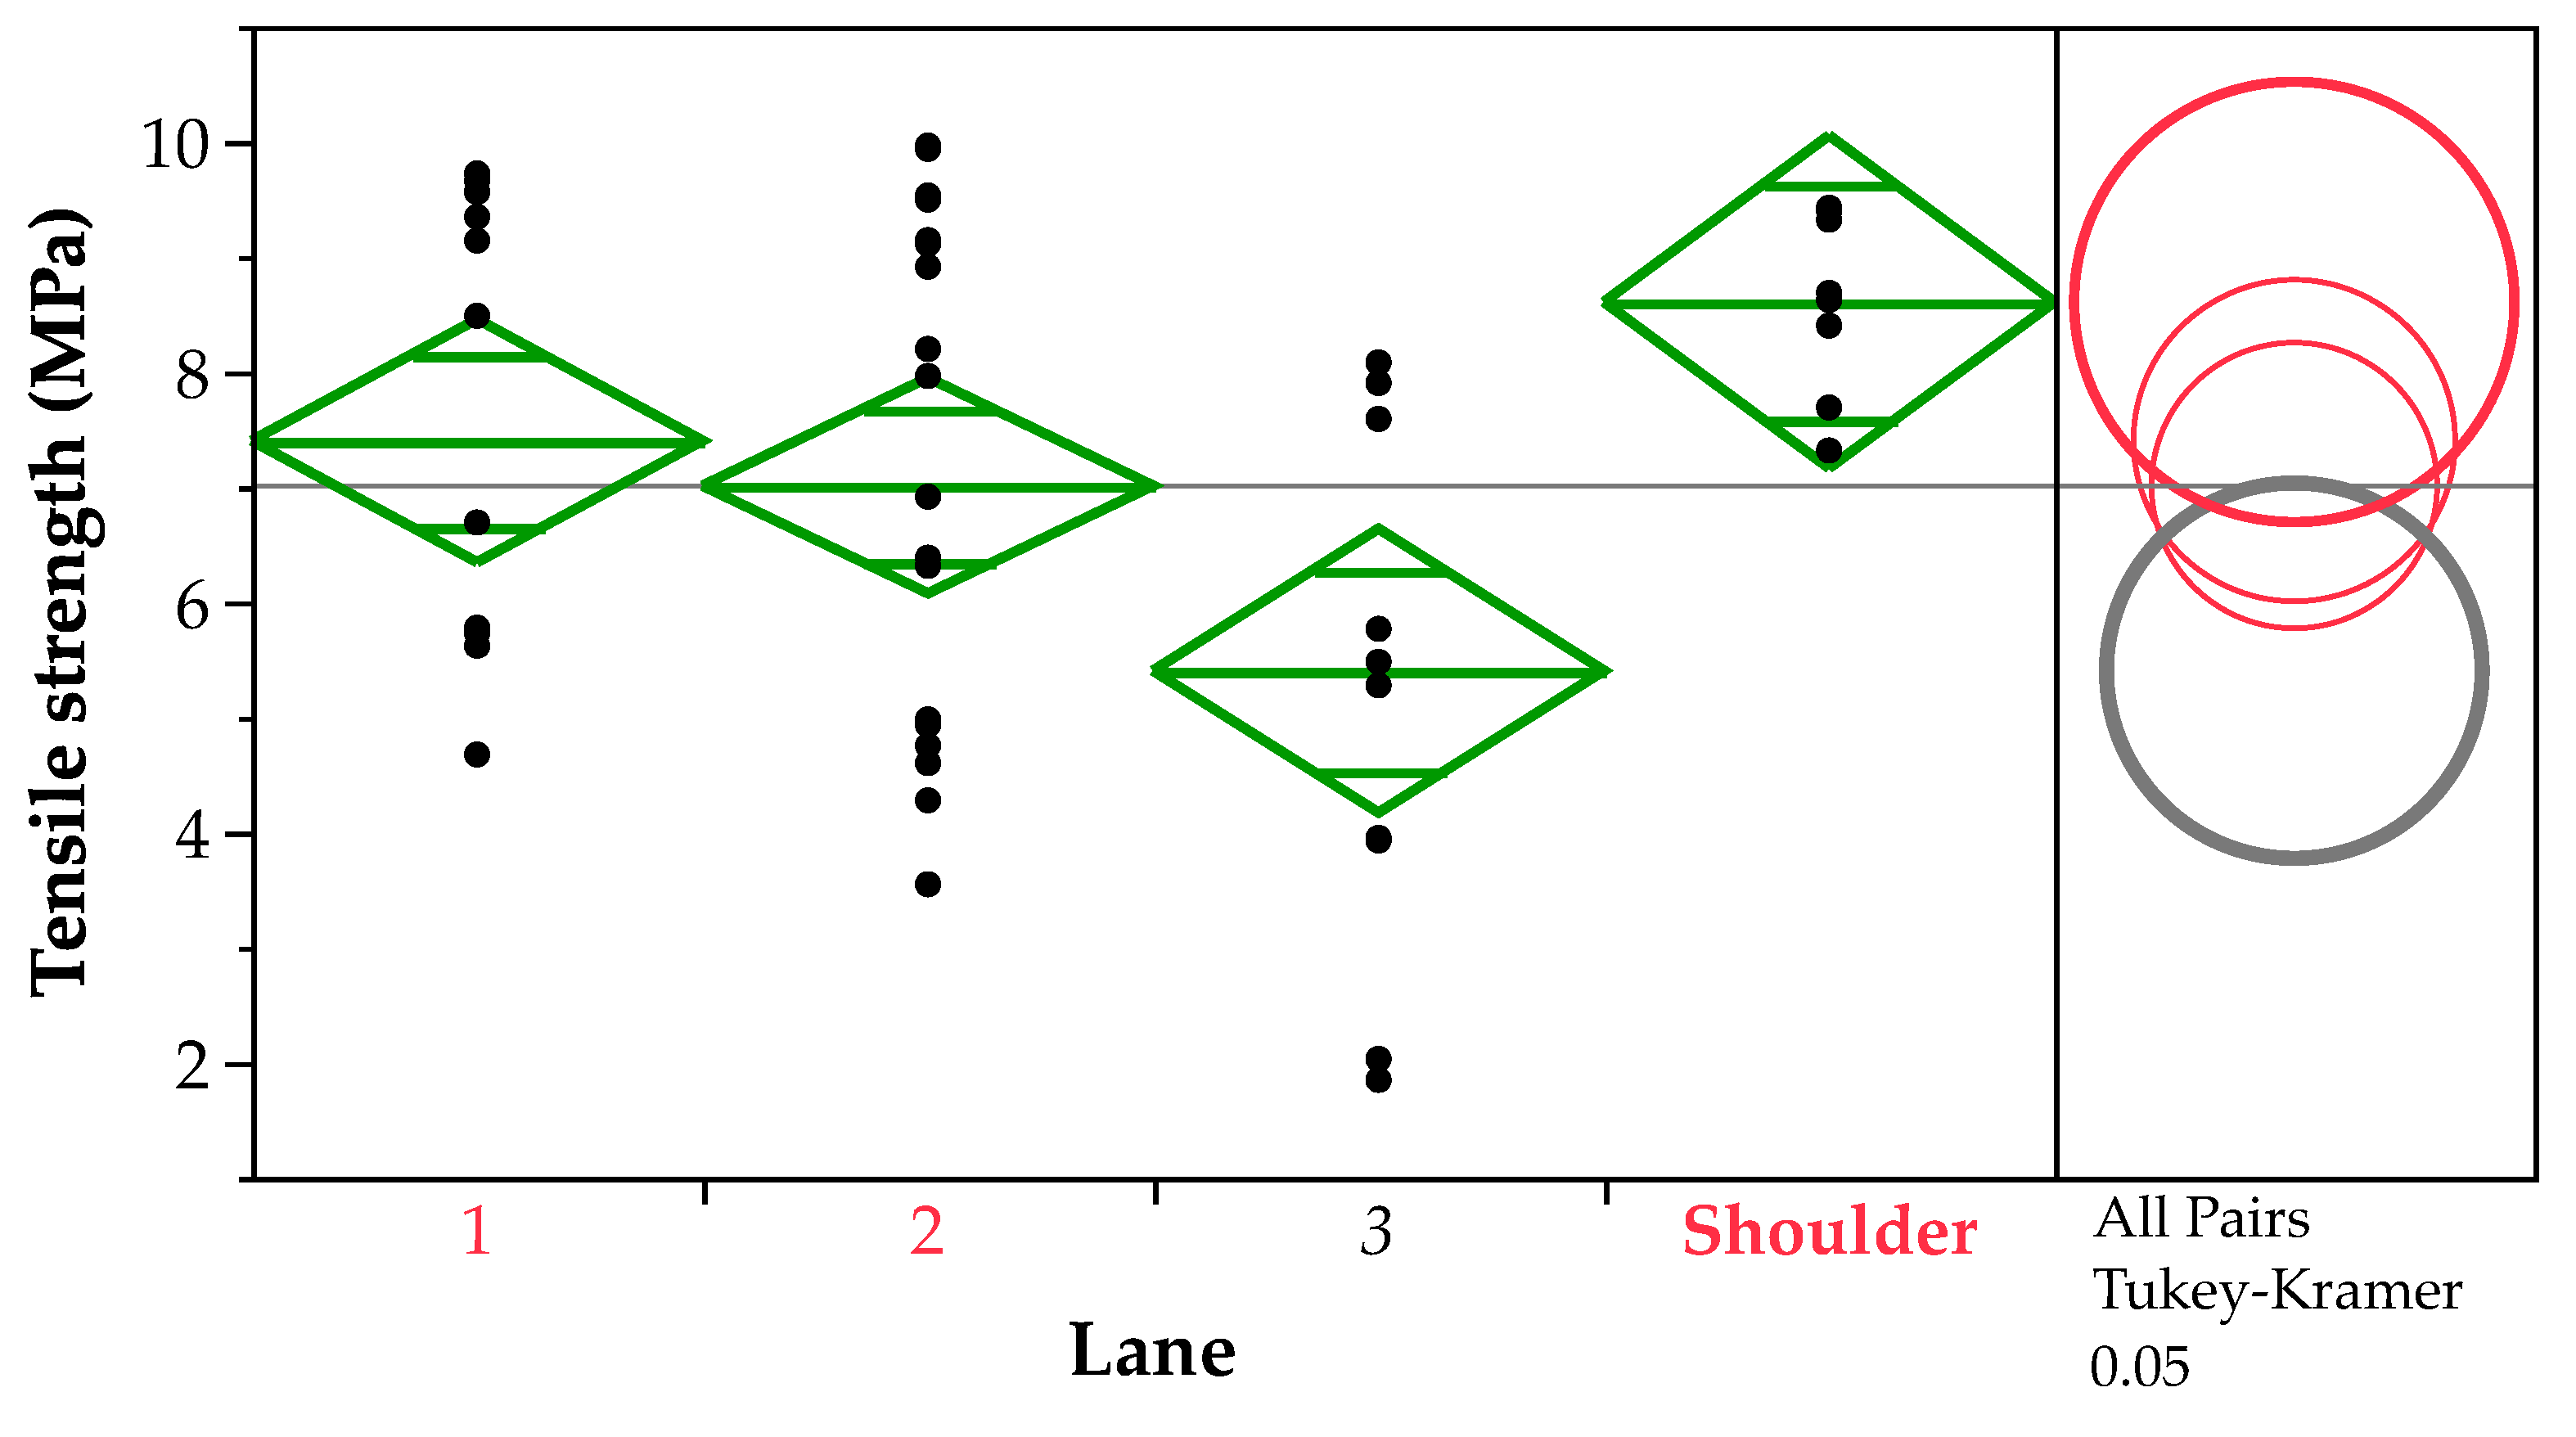
The middle-layer specimens from Figure 10 showed that different lanes exhibited significant difference in tensile strength. Lane 3 was arranged as the lane for trucks and vehicles from China’s regular traffic, and lane 1 and 2 were arranged as the lanes for vehicles.

Figure 10.
ANOVA and Tukey–Kramer comparison of tensile strength of middle-layer specimens by lane.
Thus, greater loads were applied to lane 3. And more trucks led to fracture of aggregates which generated small cracks and degraded the tensile strength. Lane 2 also had a small number of trucks, so the tensile strength of lane 2 specimens was smaller than the tensile strength of lane 1 specimens and larger than the tensile strength of lane 3 specimens.
From Figure 11 we can learn the fracture energy of middle-layer specimens first decreased with air voids at a percentage lower than 6%, then increased with the presence of air voids of more than 6%.
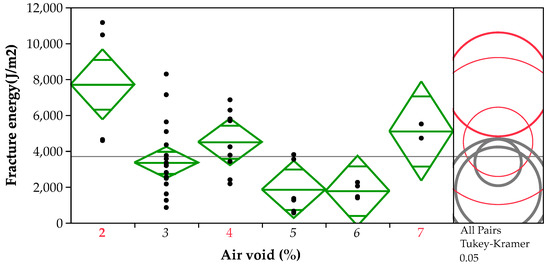
Figure 11.
ANOVA and Tukey–Kramer comparison of fracture energy of middle-layer specimens by air void.
3.3.3. Crack Resistance Change on Bottom-Layer Specimens
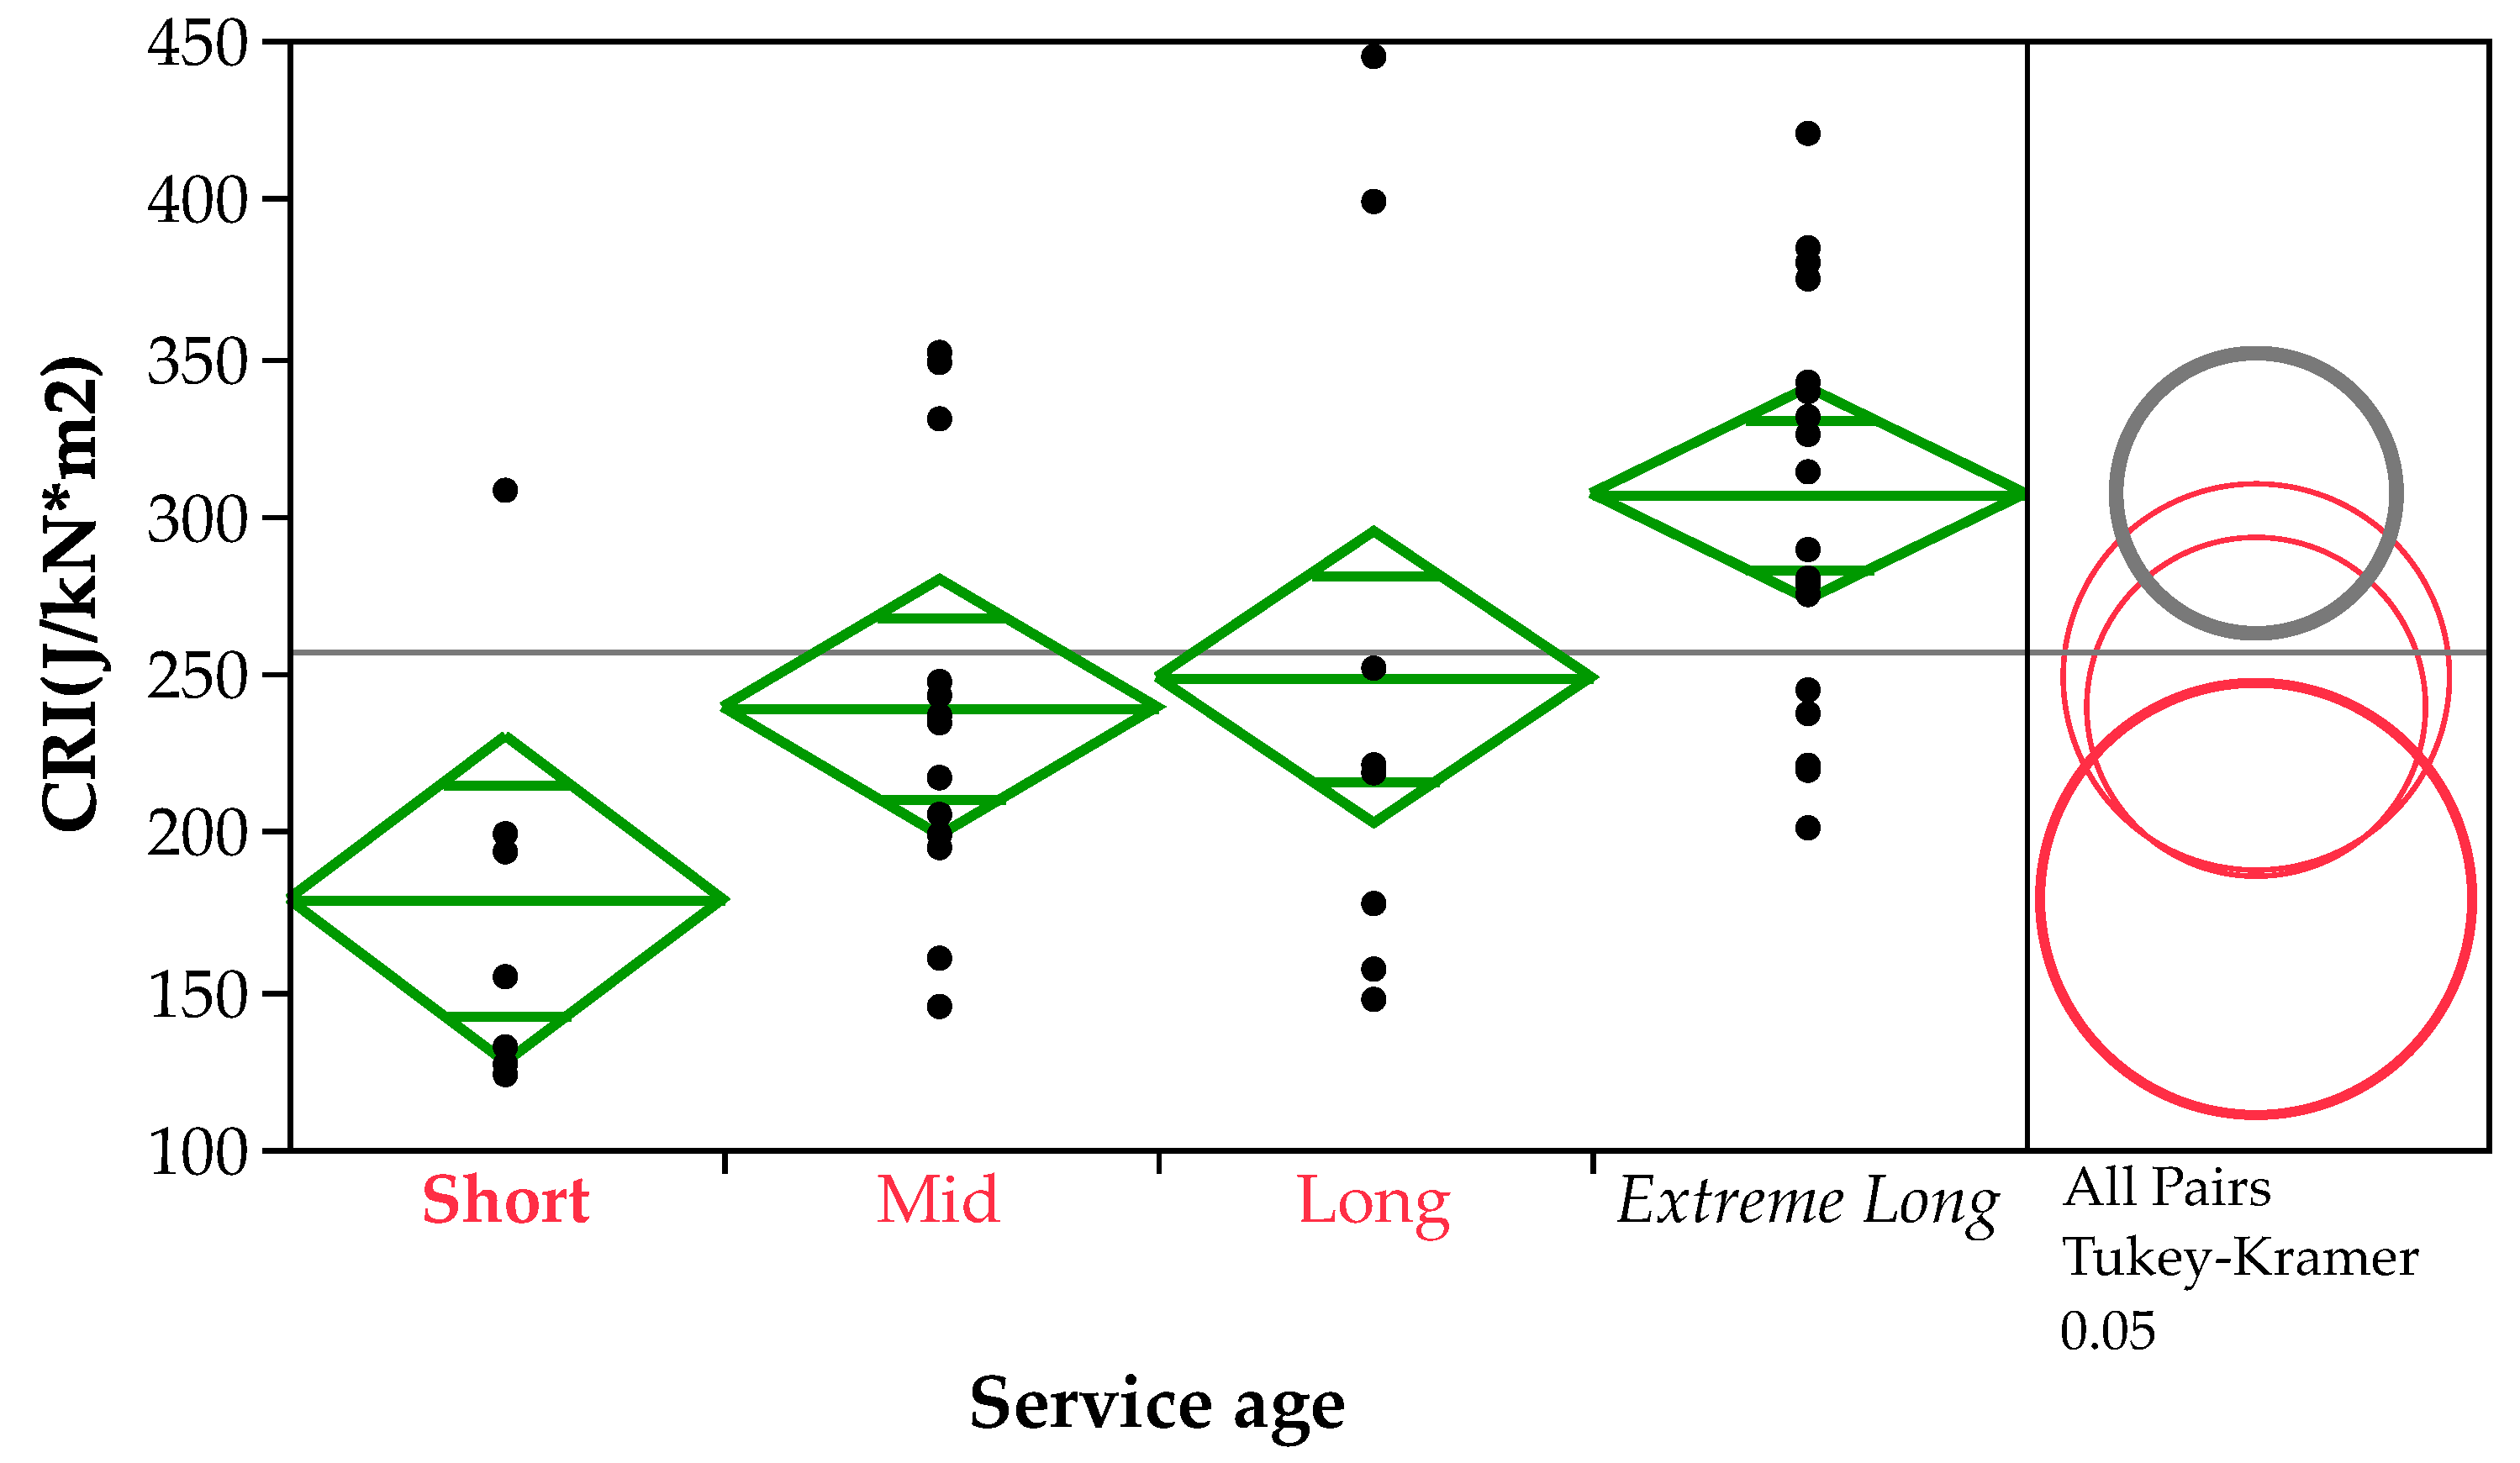
From Table 8, we learn that the tensile strength, fracture energy and CIR were significant to service age and asphalt aggregate ratio, fracture energy and CRI were significant to the asphalt aggregate ratio. The bottom-layer specimens’ crack resistance indices were significant to service age and the asphalt aggregate ratio. All the indices were not significant to the air void of bottom-layer specimens. The CRI of bottom-layer specimens was selected based on the service age and asphalt aggregate ratio. From Figure 12, we learn that the CRI of extremely long service age was more significant than CRI of short, mid and long service age. The crack resistance of bottom-layer specimens experienced significant distress at about 15 to 20 years, like the crack resistance of surface-layer specimens.

Figure 12.
ANOVA and Tukey–Kramer comparison of CRI of bottom-layer specimens by service age.
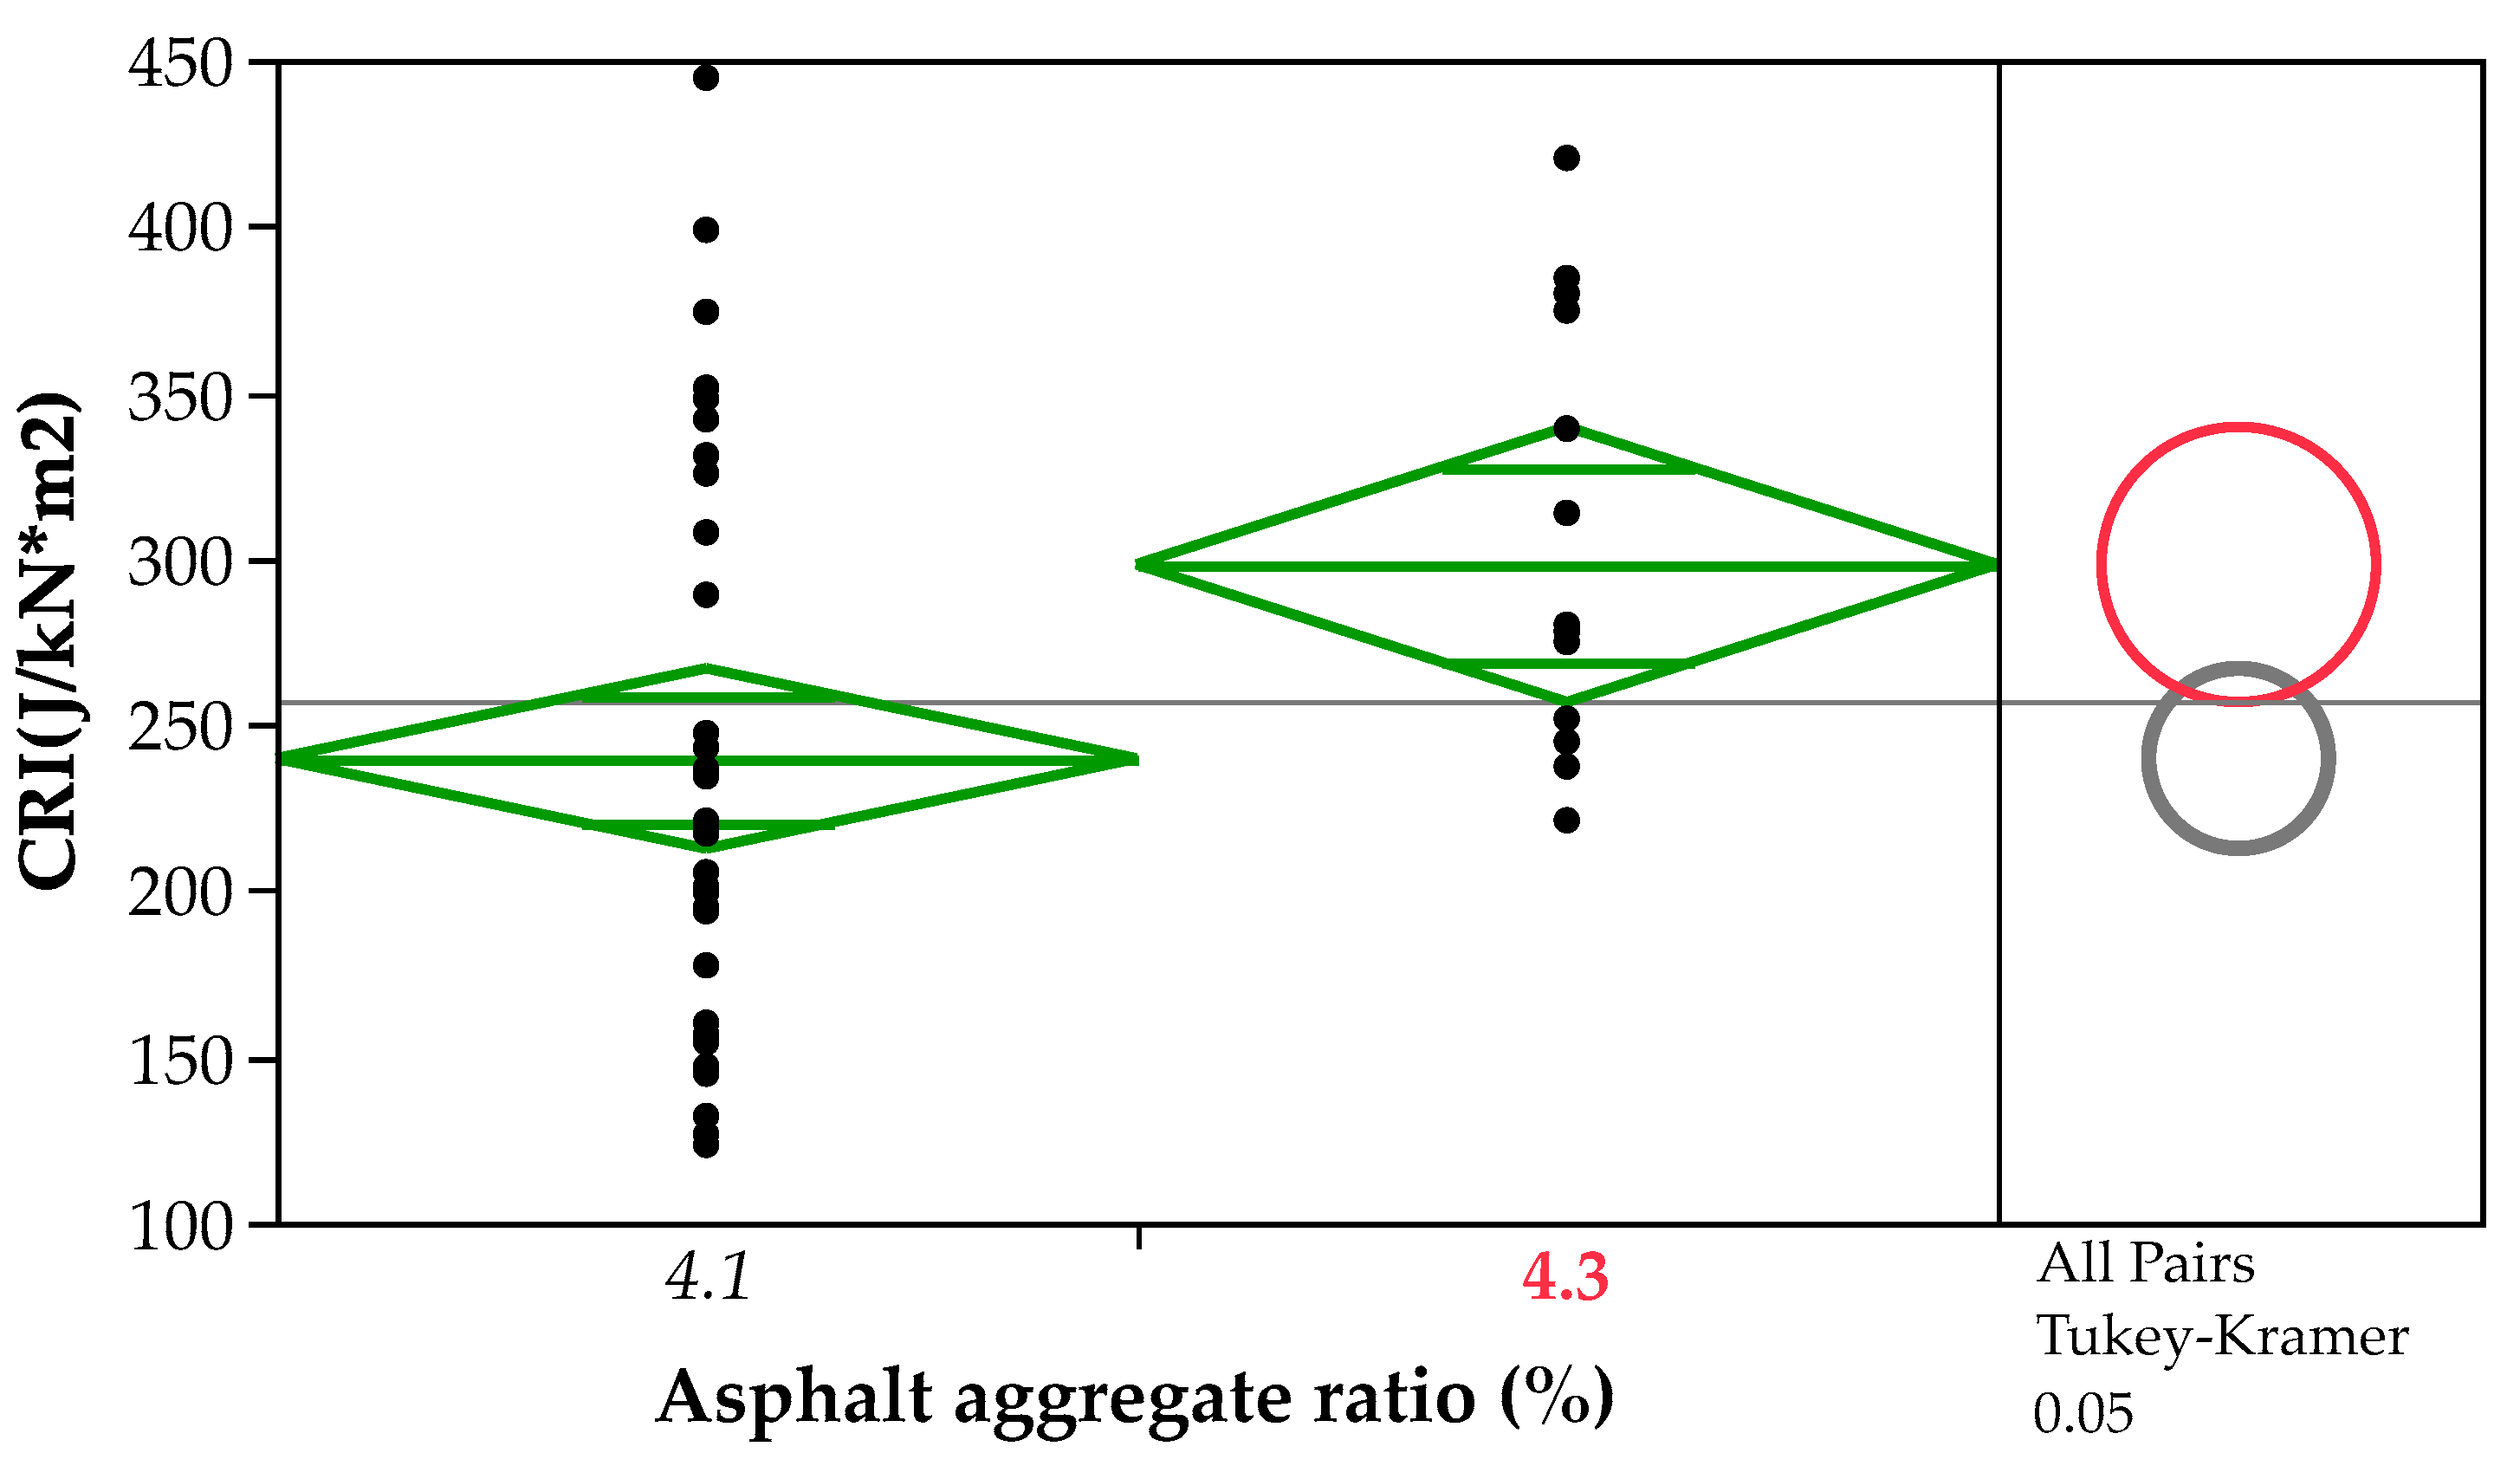
From Figure 13, we learn that the CRI of specimens with a 4.3% asphalt aggregate ratio was significantly larger compared to the CRI of specimens with a 4.1% asphalt aggregate ratio. This indicates the asphalt content of the original plant mixture had a long-term effect on the bottom-layer mixture.
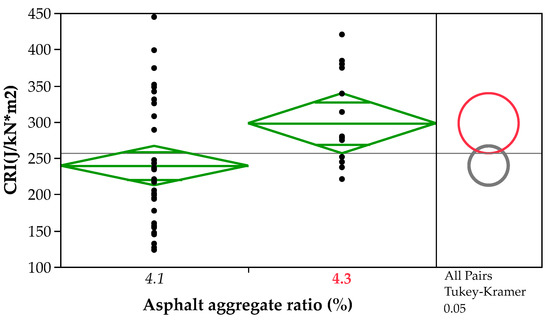
Figure 13.
ANOVA and Tukey–Kramer comparison of CRI of bottom-layer specimens based on the asphalt aggregate ratio.
3.3.4. TCS Indicated by Fracture Indices of Mixture
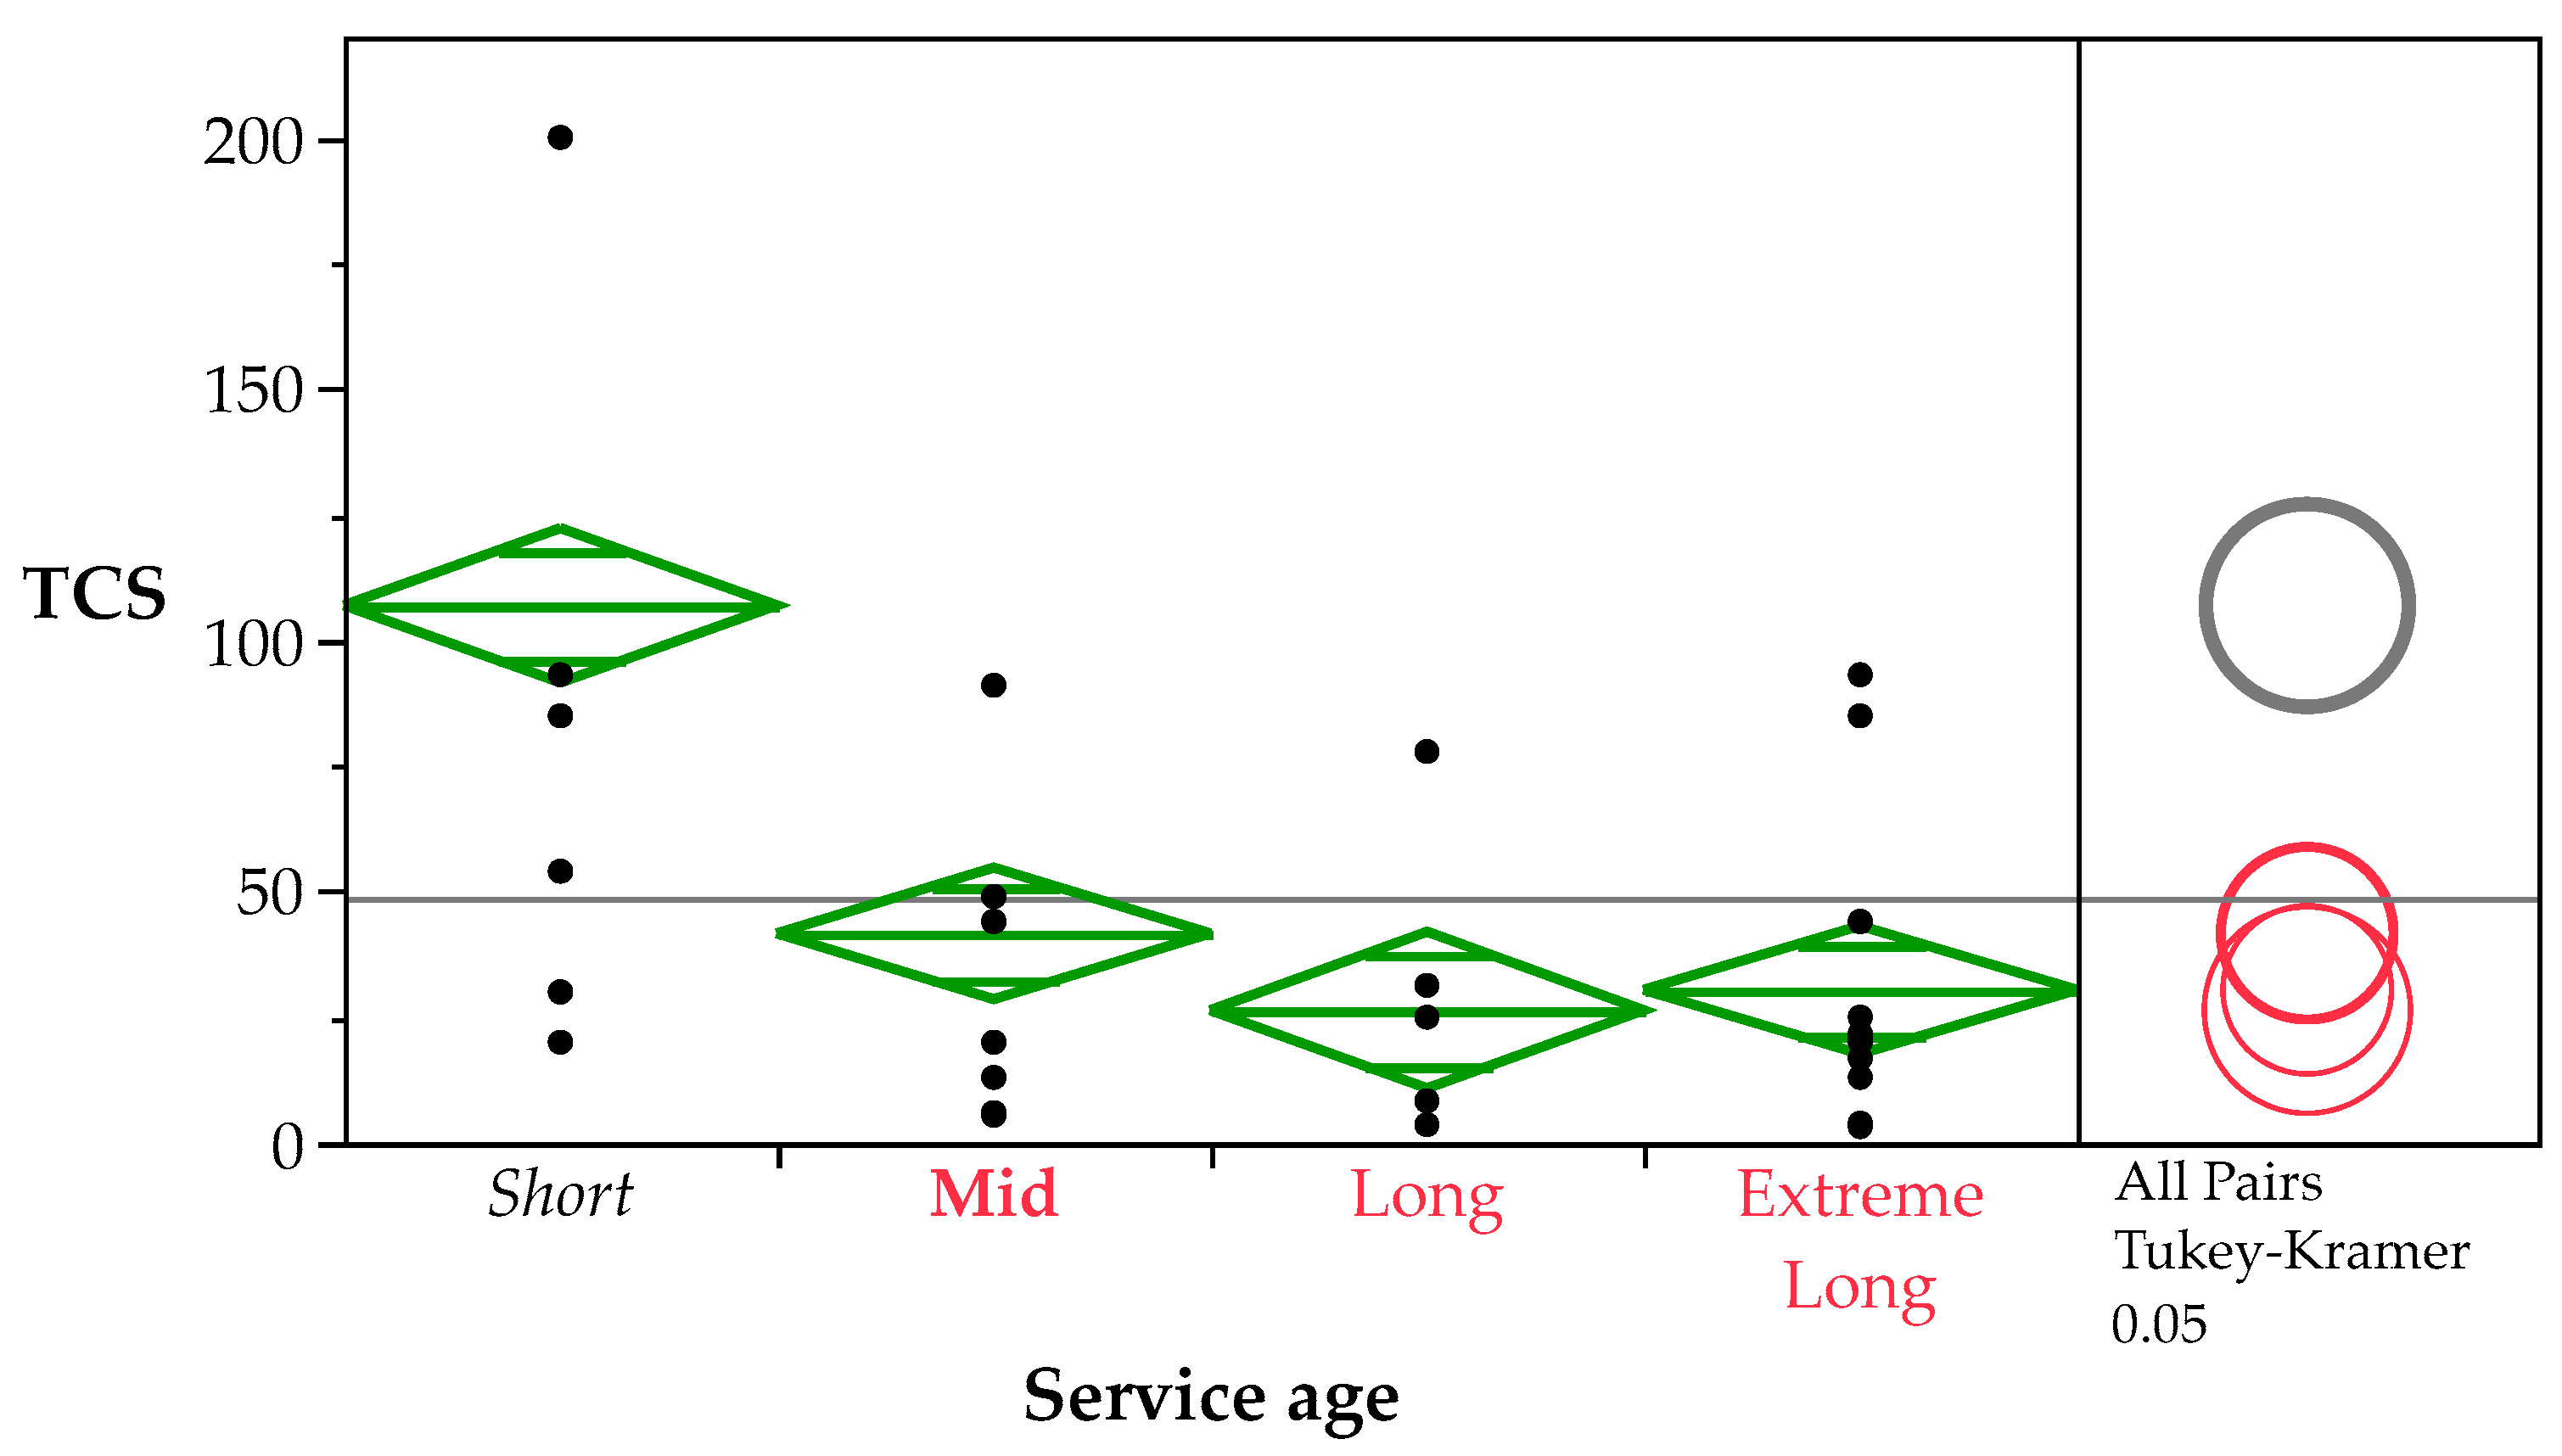
The TCS is an index representing the density of transverse cracks. A larger value means a better pavement condition, with larger average spacing between transverse cracks, and a smaller value means a worse pavement condition with smaller average spacing between transverse cracks. The TCS grades in the local standard of Jiangsu are recommended as follows: TCS ≥ 250 as excellent, 100 ≤ TCS ≤ 250 as good, 60 ≤ TCS ≤ 100 as medium, 30 ≤ TCS ≤ 60 as inferior and TCS ≤ 30 as bad. TCS and TCS grade was used for evaluating good and bad conditions of a section over a continuous distance. Thus, it also reduced by time and the TCS-service age is shown in Figure 14 the TCS grade was significant to service age. The short service age pavement had relatively high TCS and mid, long and extremely long service age pavements had similar TCS.
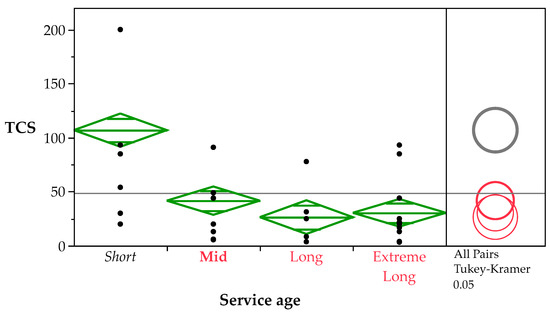
Figure 14.
ANOVA and Tukey–Kramer comparison of TCS by section service age.
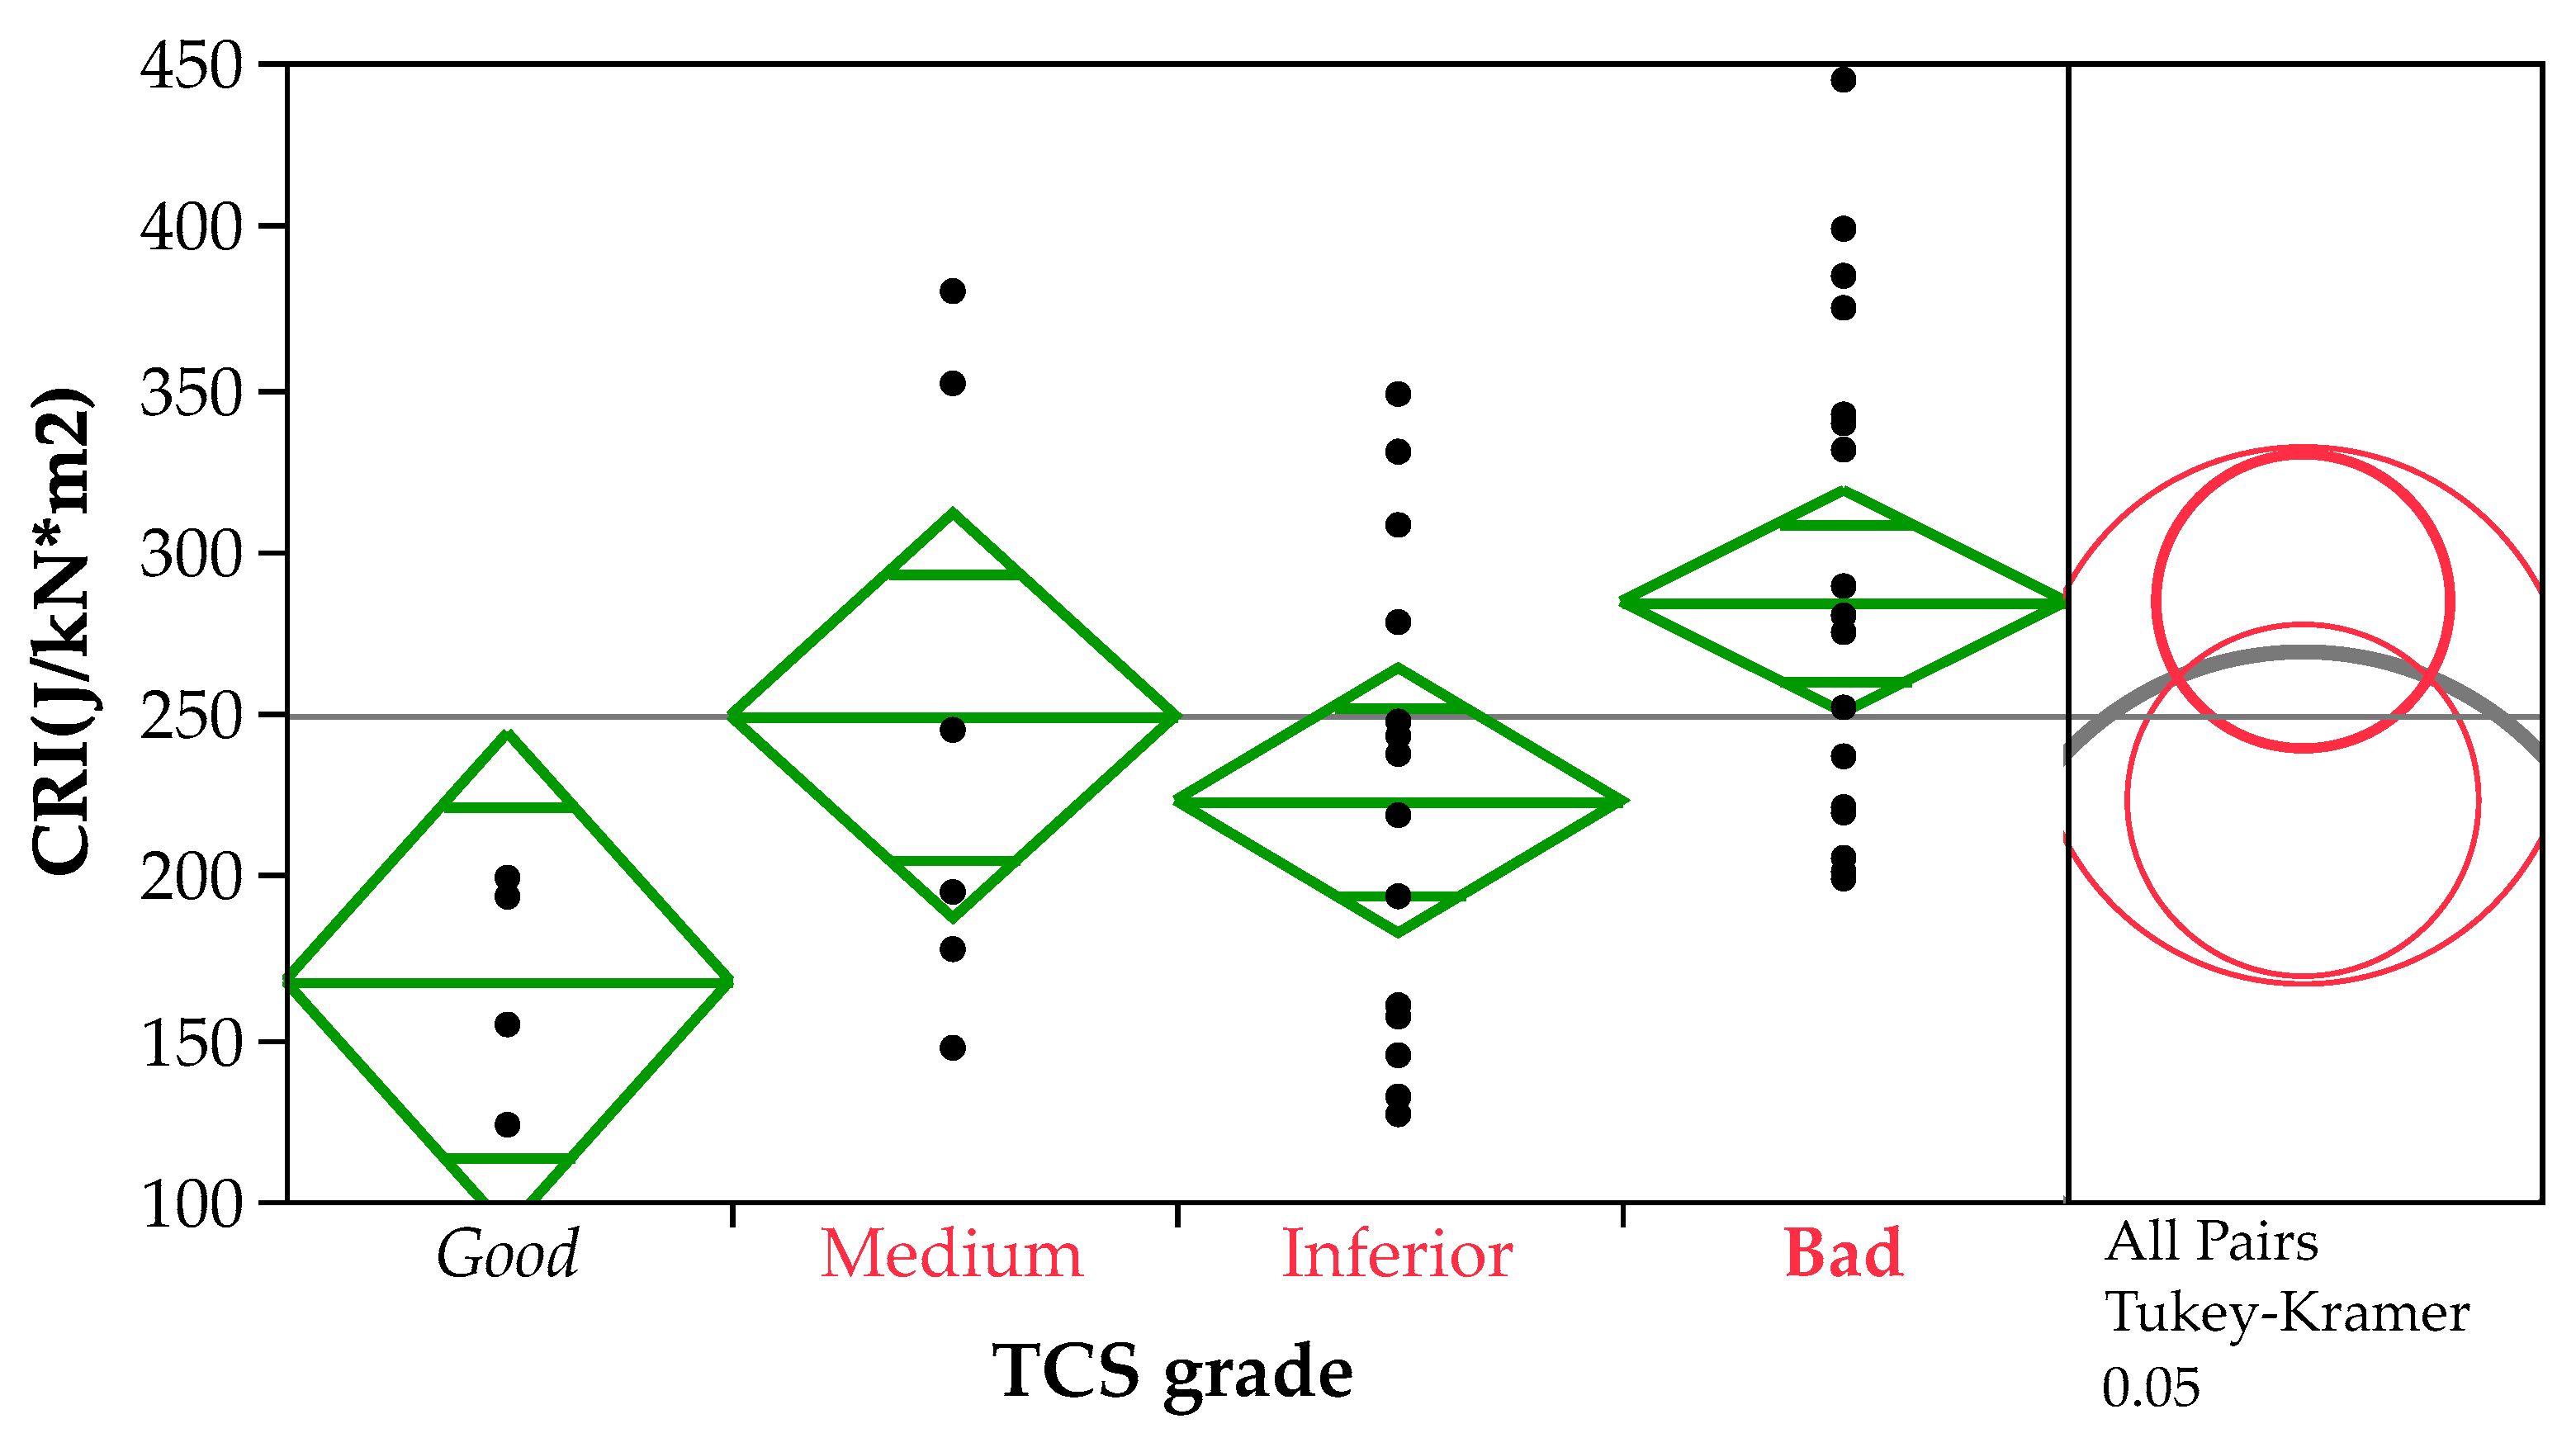
The relationships between TCS grade and mixture crack indices were also examined and the results showed only the CRI of the bottom layer is significant to TCS, while other indices were not significant to the TCS grade. This also shows the pavement sections with many transverse cracks might not have low crack-resistance mixtures and the crack resistance of selected sections could not evaluated via TCS. Figure 15 shows the ANOVA results of bottom CRI and TCS grade; it is shown that the bottom-layer specimens had lower CRI of the section with TCS at good condition, but the bottom CRI increased while TCS decreased and the TCS grade became worse. Since TCS decreased with service age, as Figure 14 shows, and the bottom CRI increased by service age, as Figure 12 shows, the crack resistance of bottom-layer specimens increased but the number of transverse cracks also increased. This showed the TCS or TCS grade of the pavement section had no direct effect on the crack resistance of this section.

Figure 15.
ANOVA and Tukey–Kramer comparison of CRI of bottom-layer sections’ TCS grade.
3.3.5. Correlation between CRI with Fracture Energy and Index FUDR Analysis
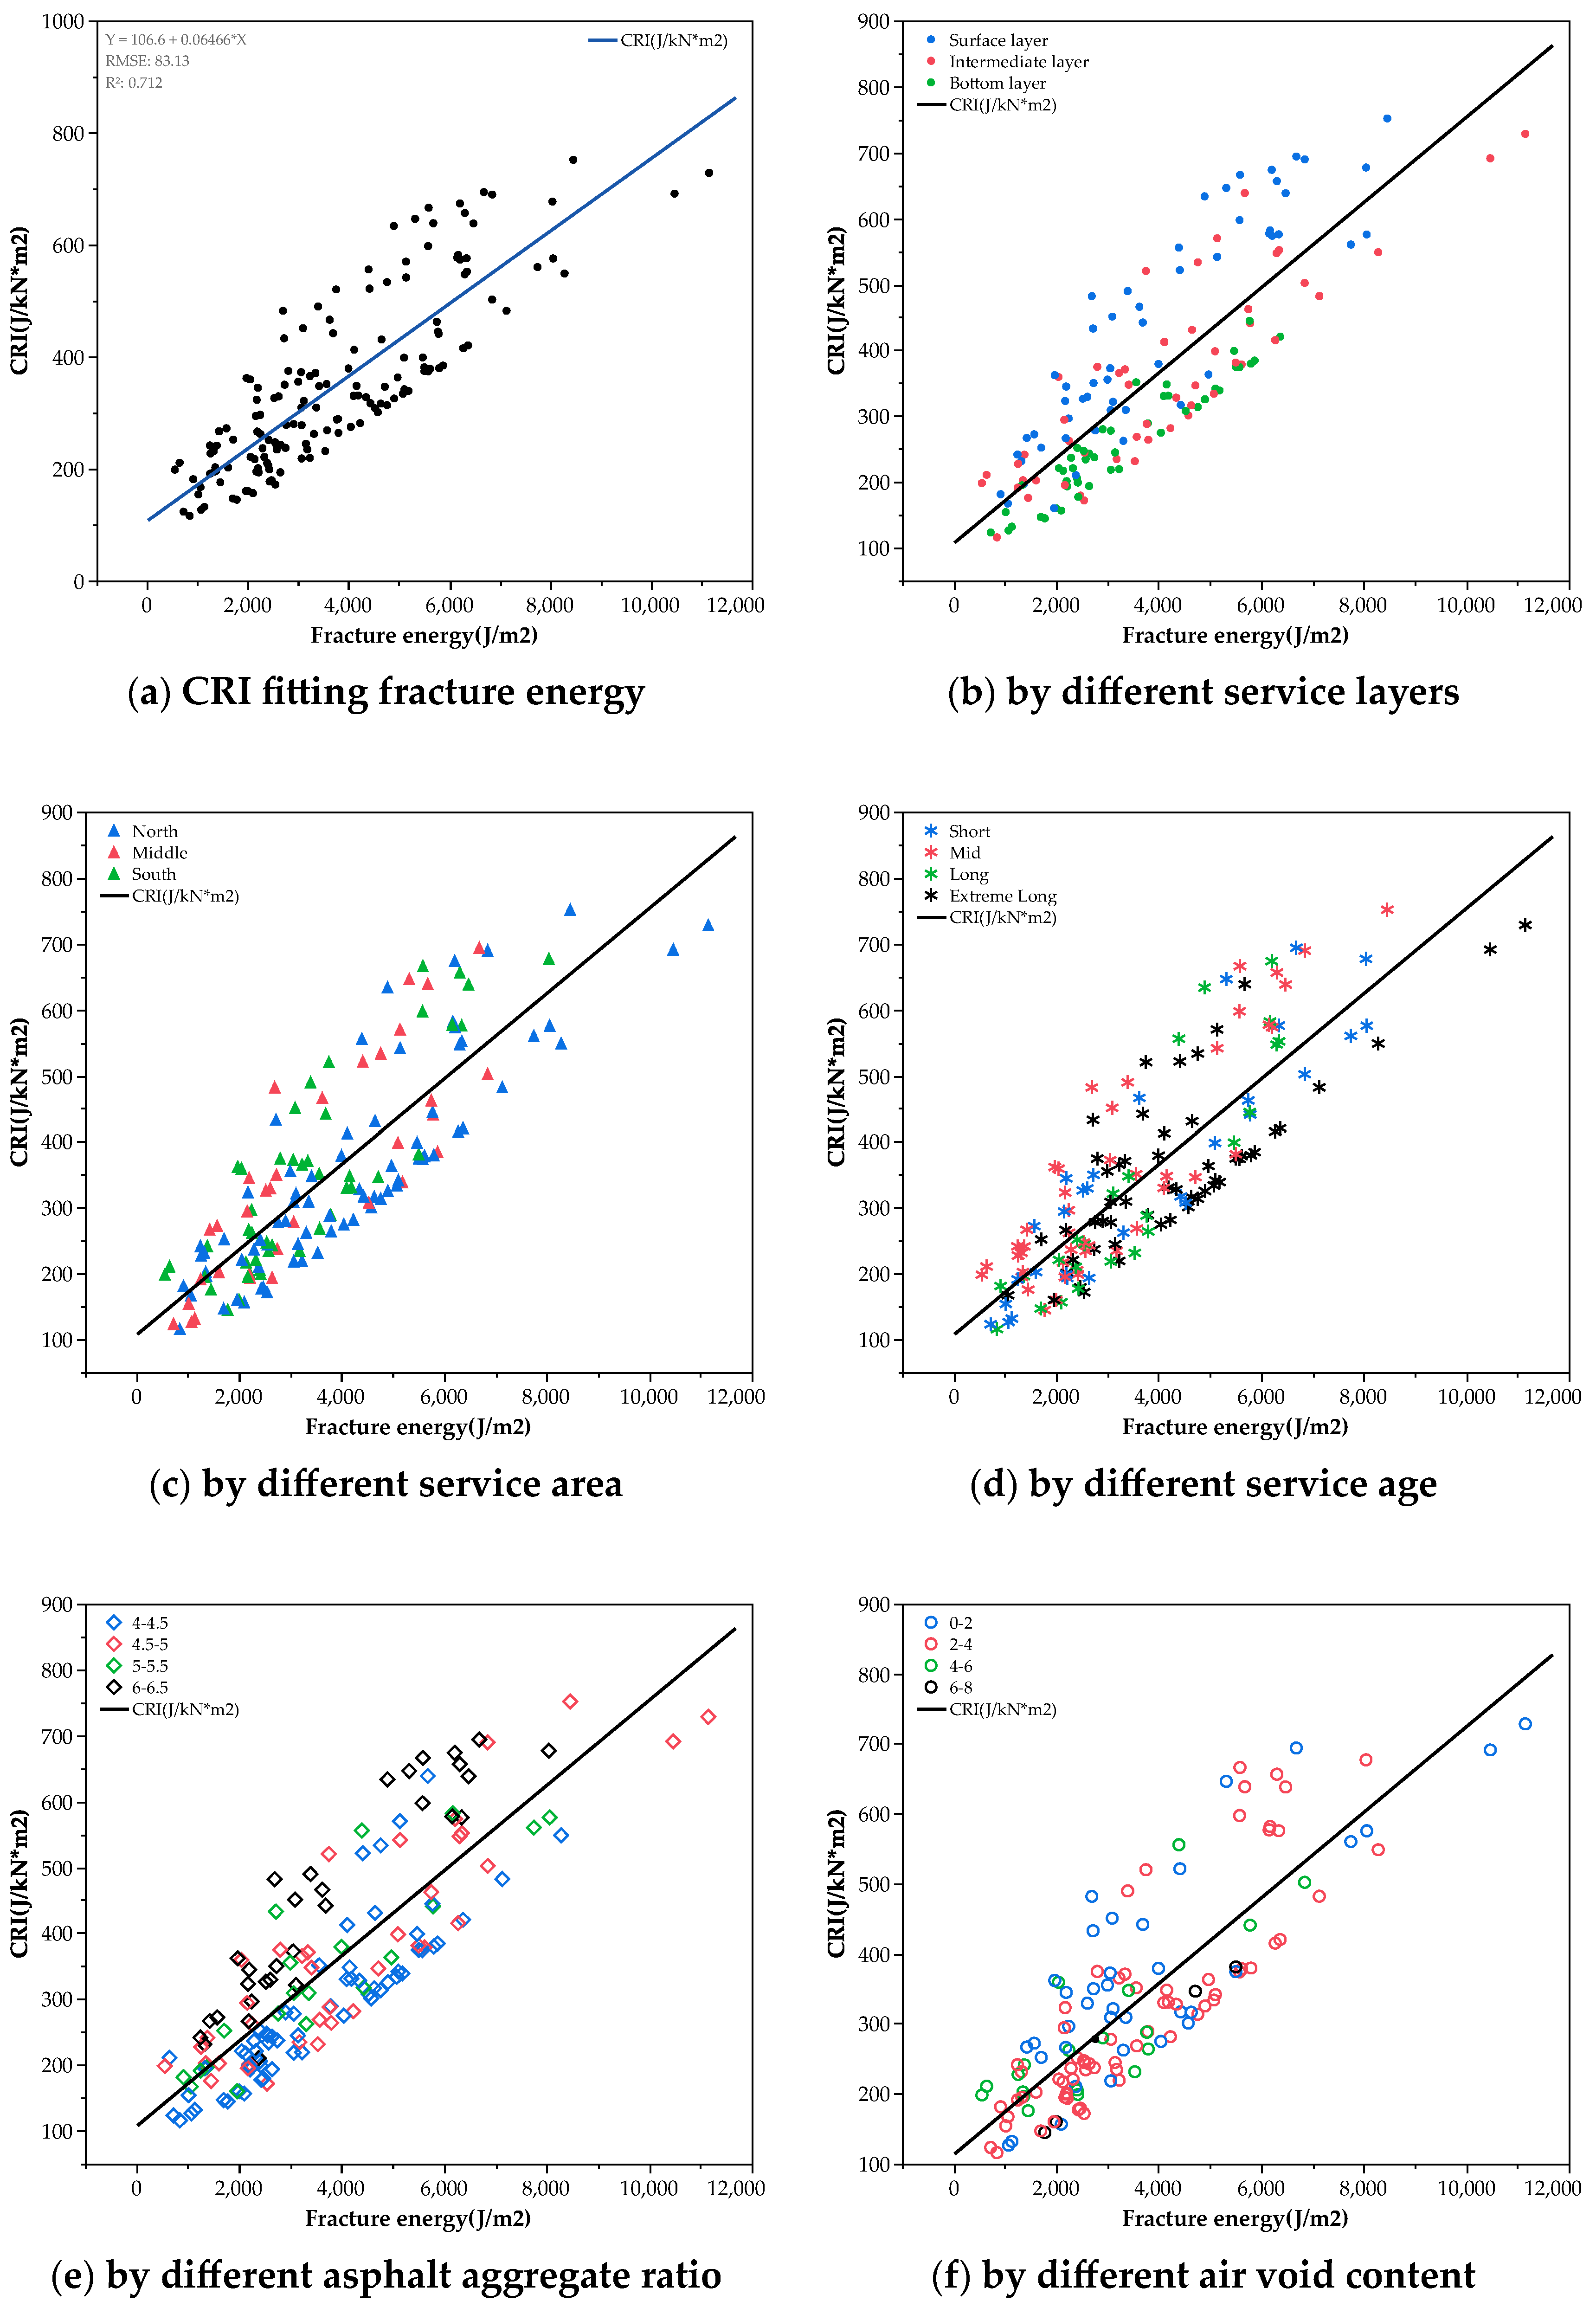
Since all the indices reflect some aspects of mixture crack resistance, some of them may have a linear relationship [11]. The results of factor analysis in Table 2, Table 3 and Table 4 show that some indices have the same distinguishment on one factor, which means the two indices, CRI and fracture energy have same significance to the factors and they could be replaced by one another. Some researchers found fracture energy could not characterize whole fracture resistance performance, and the mixture specimens which have the same fracture energy may have totally different fracture phenomena. They found CRI is sensitive to mixture type and can be used to identify the mixture containing RAP. The mixtures containing RAP have greater hardness compared to mixtures containing no RAP and mixtures containing RAP have smaller CRI compared to mixtures containing no RAP when they have the same fracture energy. Based on a similar thought, the CRI combined fracture energy can be used to distinguish SCB specimens with different factors like service area, service layer, asphalt aggregate ratio or air void. In this section, all the specimens were analyzed to reveal the general rule, including the impact of the service layer. The correlation between CRI and fracture energy of all specimens was plotted in Figure 16, which shows a linear relationship between CRI and fracture energy, and the R2 is 0.712.
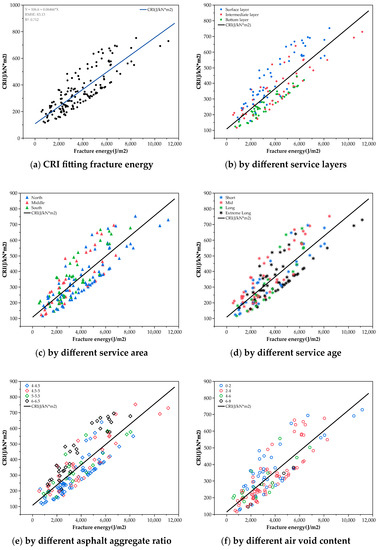
Figure 16.
CRI fitting fracture energy based on different factors.
Figure 16 features colored data dots that indicate factor categories. The factors are service age, asphalt aggregate ratio and air void. Since CRI is calculated by fracture energy divided by peak load, data dots in the upper lines zone mean the peak load is smaller than that on the fit line and the curve is flatter than that on the line. Data dots in the lower line zone mean that the peak load is bigger than that on the fit line and the curve is higher than that on the line. And the fit line is the average CRI versus fracture energy, which is the average peak load. The surface layers dots in Figure 15 are mostly in the upper zone; the bottom layer dots are mostly in the lower zone and the middle layer does not have obvious deviation, which indicates surface-layer specimens’ curves are higher than average and bottom-layer specimens’ curves are flatter.
The index factor dots upper rate (FDUR) was promoted to evaluate the percentage of factor data dots set on the upper side of the fit line. Most previous research focused on specimens and the difference between various asphalt mixtures was characterized by means, variance or correlation of fracture indices. This index, FDUR, tried to characterize a large number of specimens with different factor conditions. Since the best fitting factor has factor dots with an upper rate equaling 50%, −50% was added for normalization. The larger the absolute FDUR (absFDURfactor) one factor was, the greater the impact the factor had on the fracture pattern. FDUR and absFDUR were calculated in Equation (4) and (5).
The CRI-fracture energy graph classified by factors is shown in Figure 15 and the FDUR is shown in Table 9.
Table 9.
FDUR value versus different factors.
The FDUR and absFDUR data were used to study curve form. The absFDUR indicated the impact level one factor has. The larger absFDUR one factor type was, the more bias this factor type caused. The positive or negative sign of FDUR indicated the curve was sharp or flat. If one specimen was FDUR positive, the load–displacement curve was flatter comparing to the average level; otherwise, it was sharper. For further analysis, the FDUR of three layers was plotted and shown in Table 9 and Figure 16.
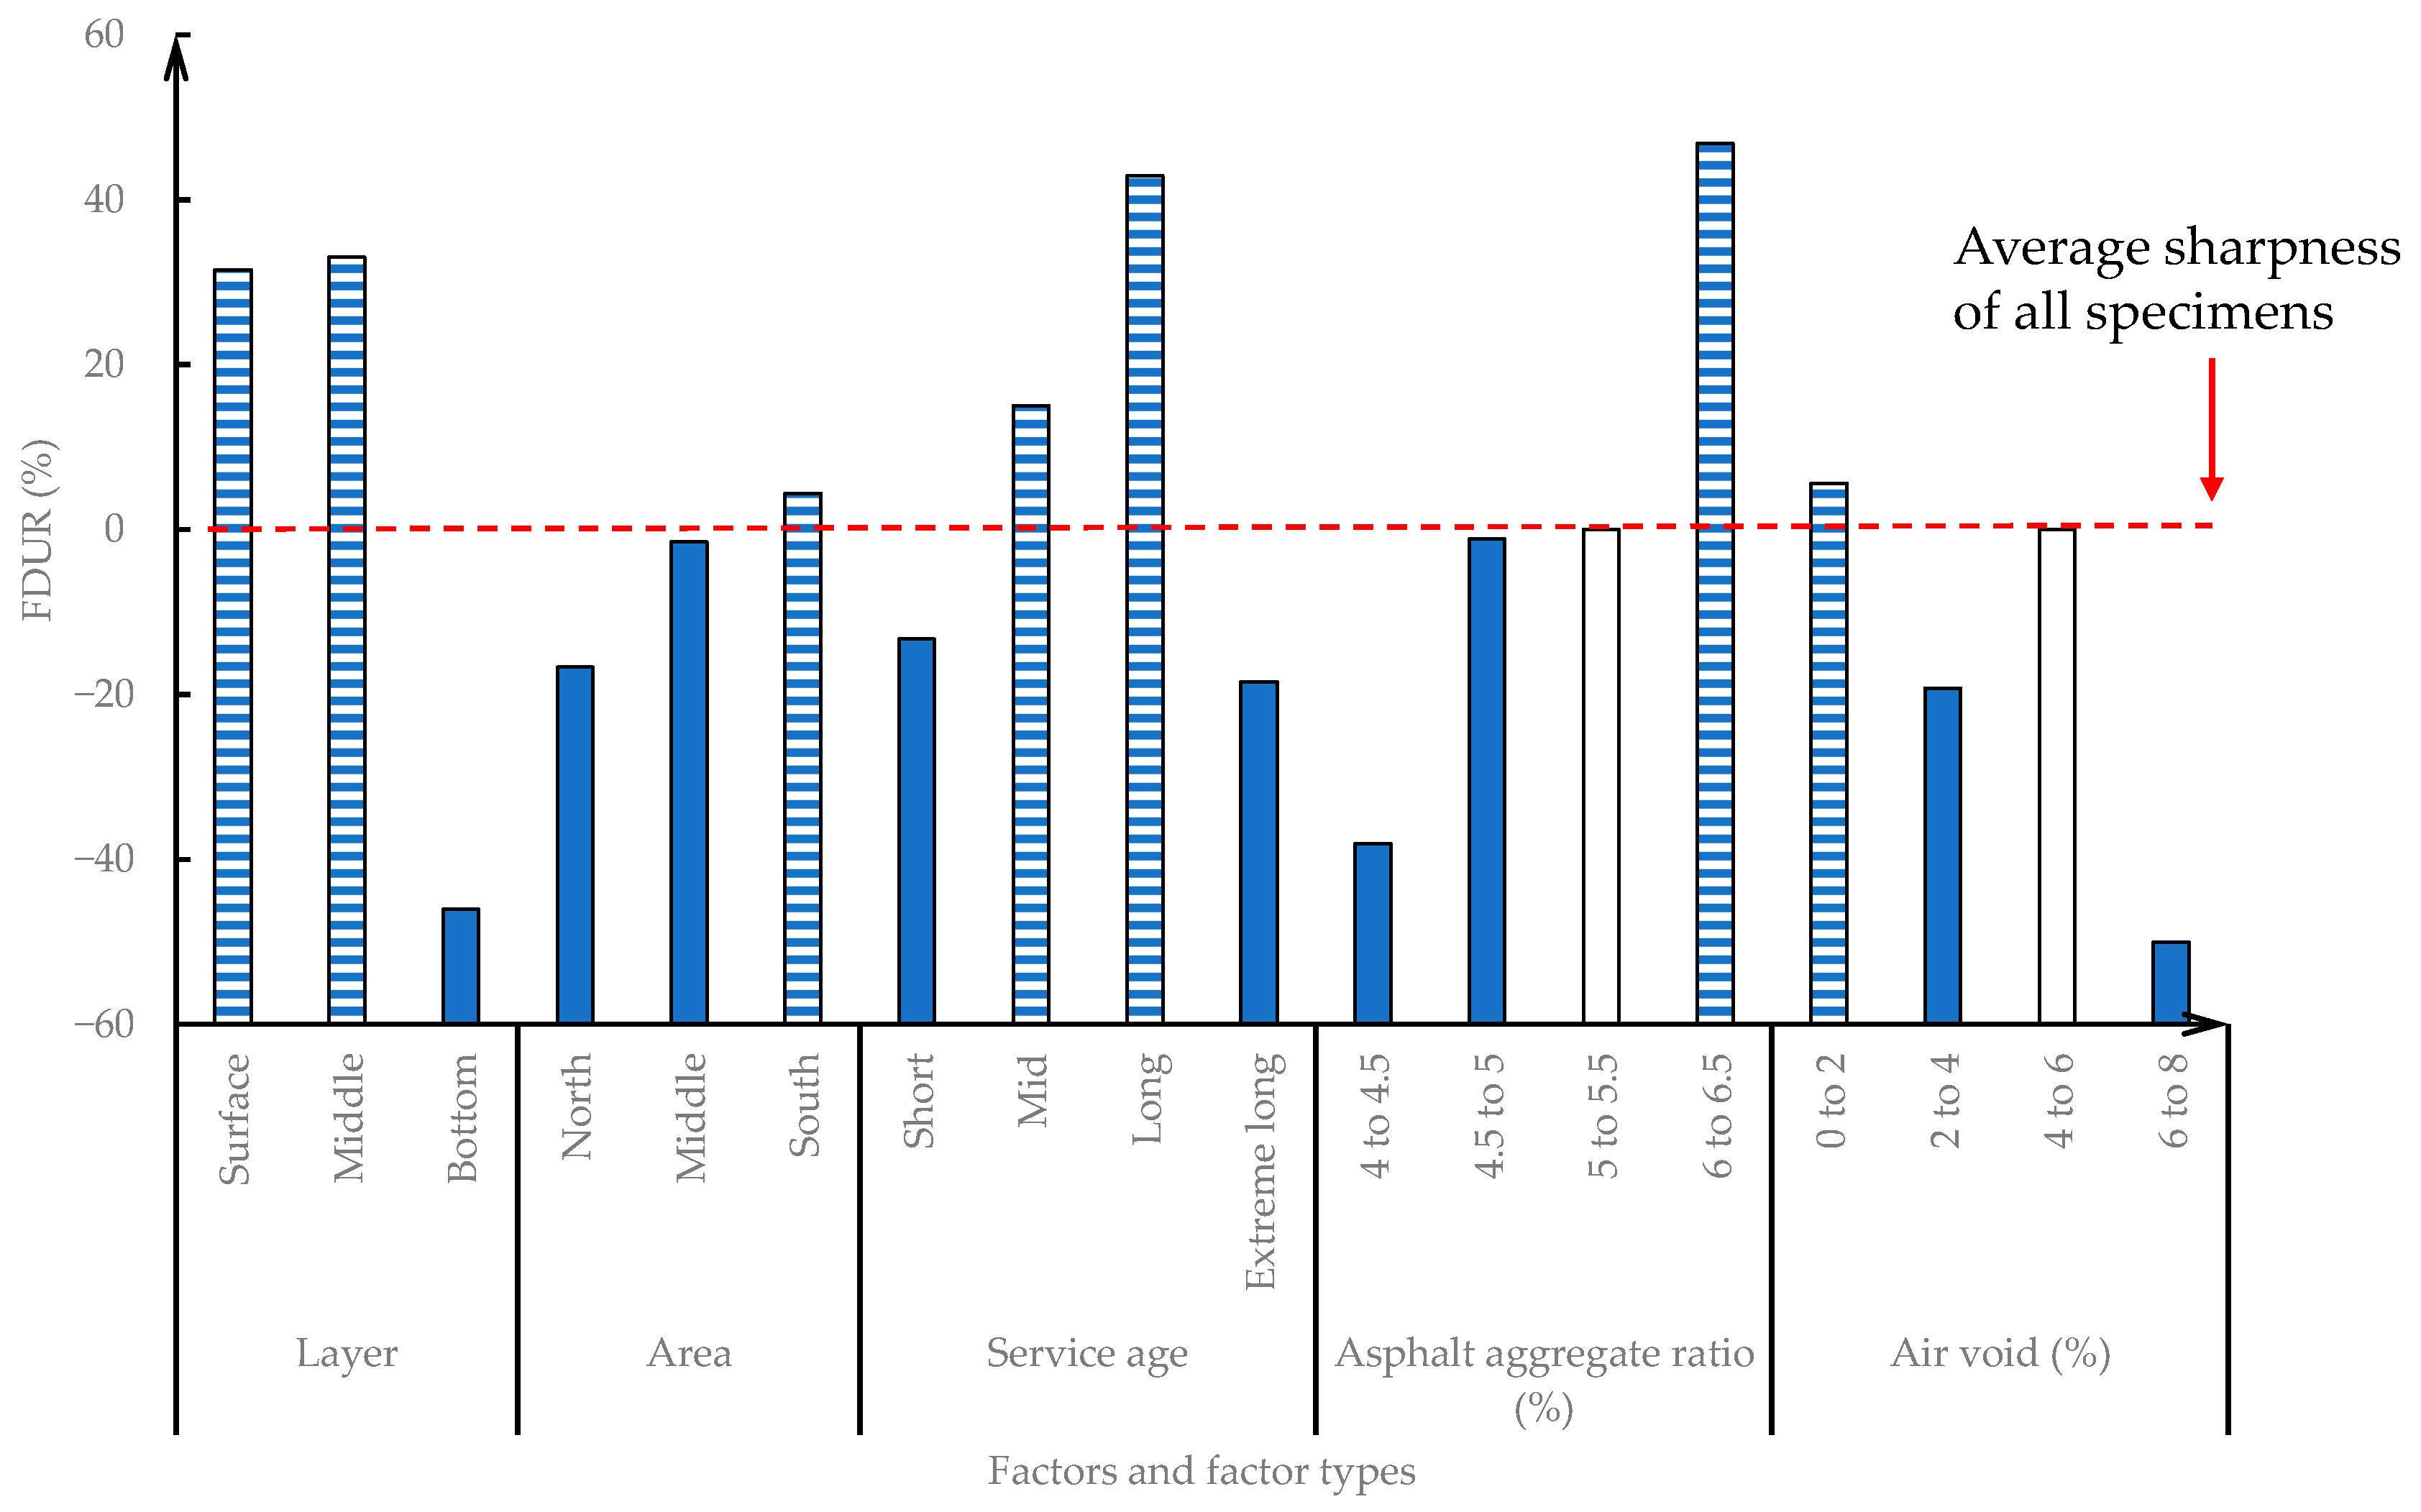
In Figure 17, the positive value is plotted as a solid column, the negative value is plotted as a transverse line column and the 0 value is plotted as a hollow column. Since each layer mixture has its unique mixture type with a specific aggregate–asphalt ratio, the mixture type was not introduced for the whole CRI-fracture energy curve analysis.
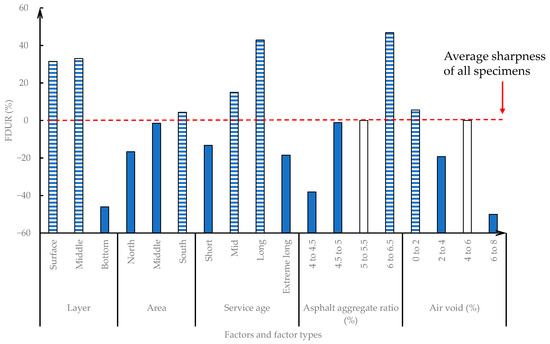
Figure 17.
FDUR versus factors and factor types.
From Figure 16b and Table 9, it is shown that the factor “layer” has largest curve form impact. The FUDR of the surface and middle specimens is 31.5% and 33%, respectively. And the FUDR of the bottom specimens is −16%. The surface-layer mixture AC13 and SMA13 are entirely composed of modified asphalt mixtures and the middle-layer AC20 and SUP20 are mostly composed of modified asphalt mixture. This indicates the surface and middle layer mixture have flatter fracture curves compared to the bottom-layer mixture.
From Figure 16c and Table 9, it is shown the factor “area” specimens have no significant difference area. The north area specimens have a relatively large absFUDR. The north and middle area specimens are tougher than others with −16.7% and −1.2% FUDR. South area specimens are softer than others with 4.4% FUDR. The north and middle area specimens are sharper compared to others and south area specimens are flatter. And the north area specimens have more bias curve phenomena.
From Figure 16d and Table 9, it is shown the factor “service age” specimens have significant difference; the short and extremely long service age specimens have negative FDUR and mid and long service age specimens have positive FDUR. The specimens of long service age have largest absFUDR 42.9%. This indicates short and extremely long service age specimens are harder than others and mid and long service age specimens are softer than others. The long service age specimens have the most data above the CRI-fracture energy fit line.
From Figure 16e and Table 9, it is shown the factor “asphalt aggregate ratio” also refers to the mixture types, the 4% to 4.5% asphalt aggregate ratio often suits the bottom layer of the AC25 and SUP25 mixture, the 5% to 5.5% asphalt aggregate ratio often suits the middle layer of the AC20 and SUP20 mixture, the 5% to 5.5% asphalt aggregate ratio often suits the surface-layer AC13 mixture and the 6% to 6.5% asphalt aggregate ratio often suits the surface-layer SMA mixture. The 4% to 4.5% and 6% to 6.5% asphalt aggregate ratios have relatively large absFUDR, which indicates the fracture phenomena of the bottom-layer mixture and surface-layer SMA13 are different in terms of their average curve phenomena. The 4% to 4.5% asphalt aggregate ratio AC25 and SUP25 specimens are harder than others with −38.1% FUDR, and 6% to 6.5% asphalt aggregate ratio SMA13 specimens are softer than others with 48.6% FUDR.
From Figure 16f and Table 9, it is shown the factor “air void” also has a curve form impact. The 4% to 6% air void specimens have 0 FUDR, so their data have average distribution on both sides of the CRI-fracture energy curve. The 0% to 2% air void specimens are slightly softer than others with 5.6% FUDR; correspondingly, the 2% to 4% and 6% to 8% specimens are tougher than others with −19.3% and −50% FUDR.
Figure 17 gives a total review of FUDR. As shown by the analysis above, the high absFUDR values in terms of the layer, service age and asphalt aggregate ratios are as follows: the factor layer with surface, middle and bottom types; the factor service age with long and extremely long types; the factor asphalt aggregate ratio with 4% to 4.5% and 6% to 6.5% types and the factor air void with 6% to 8% types. These types of factors can obviously affect the fracture curve form.
4. Conclusions
- Several representative expressway sections were selected and the SCB intermediate temperature fracture test was conducted. The factors independence analysis and different indices for different layers were applied. Service age and air void are independent factors for all three layers. The mixture type is a significant factor in relation to tensile strength on surface-layer specimens, lane is a significant factor to tensile strength on middle layers and the asphalt aggregate ratio is a significant factor to CRI on bottom layers.
- ANOVA and Tukey–Kramer comparison analysis of three layers was conducted and the indices of each layer and factors were analyzed. The most important factors affecting mixture crack resistance were one time factor (service age) and one material factor like air voids or the asphalt aggregate ratio. Only middle-layer specimens have another environmental factor lane, and lane 3 with the most truck loads has the lowest crack resistance of all lanes.
- For the surface layer, AC13M’s crack resistance is significantly larger than SMA13M’s, the crack resistance of 4.5% and 5% asphalt aggregate ratio specimens is significantly larger than that of the 6% ratio specimens, the crack resistance of extremely long service age specimens is significantly smaller than short, mid and long service age specimens. For the middle layer, the crack resistance of mid service age specimens is significantly smaller than the crack resistance of short, long and extremely long service age specimens. For the bottom layer, the crack resistance of 4.1% asphalt aggregate ratio specimens is significantly smaller than the crack resistance of 4.3% asphalt aggregate ratio specimens, while the crack resistance of extremely long service age specimens is significantly smaller than the crack resistance of short, mid and long service age specimens.
- Only the CRI index of the bottom-layer mixture has a significant relationship with TCS of the section from which the mixture was cored, while other mixture indices cannot represent the pavement transverse crack spacing of the section. The pavement sections with many transverse cracks may not have low crack-resistance mixtures.
- The index FUDR and its absolute value absFUDR are promoted as an index for determining if a mixture of a certain factor type is softer or tougher than average on a statistical level. And this index is sensitive to many factors. The specimens with surface layer, middle layer, long service age or a 6% to 6.5% asphalt aggregate ratio are obviously softer than others and have an obviously flatter load–displacement curve on a statistical level.
Author Contributions
Conceptualization, L.S. and F.N.; Formal analysis, L.S., H.D. and Y.H.; Investigation, H.D.; Methodology, L.S., F.N. and H.D.; Supervision, F.N.; Writing—original draft, L.S.; Writing—review and editing, Y.H. All authors have read and agreed to the published version of the manuscript.
Funding
This research received no external funding.
Institutional Review Board Statement
Not applicable.
Informed Consent Statement
Not applicable.
Data Availability Statement
The data presented in this study are available in the article.
Conflicts of Interest
The authors declare no conflict of interest.
References
- Wang, H.P.; Guo, Y.X.; Wu, M.Y.; Xiang, K.; Sun, S.R. Review on Structural Damage Rehabilitation and Performance Assessment of Asphalt Pavements. Rev. Adv. Mater. Sci. 2021, 60, 438–449. [Google Scholar] [CrossRef]
- Idris, I.I.; Sadek, H.; Hassan, M. State-of-the-Art Review of the Evaluation of Asphalt Mixtures’ Resistance to Reflective Cracking in Laboratory. J. Mater. Civ. Eng. 2020, 32, 03120004. [Google Scholar] [CrossRef]
- Gong, M.; Xiong, Z.; Chen, H.; Deng, C.; Chen, X.; Yang, J.; Zhu, H.; Hong, J. Evaluation on the Cracking Resistance of Semi-Flexible Pavement Mixture by Laboratory Research and Field Validation. Constr. Build. Mater. 2019, 207, 387–395. [Google Scholar] [CrossRef]
- Wu, S.; Wen, H.; Zhang, W.; Shen, S.; Mohammad, L.N.; Faheem, A.; Muhunthan, B. Field Performance of Top-down Fatigue Cracking for Warm Mix Asphalt Pavements. Int. J. Pavement Eng. 2019, 20, 33–43. [Google Scholar] [CrossRef]
- Zhou, L.; Ni, F.; Zhao, Y. Evaluation Method for Transverse Cracking in Asphalt Pavements on Freeways. Transp. Res. Rec. 2010, 2153, 97–105. [Google Scholar] [CrossRef]
- Canestrari, F.; Ingrassia, L.P.; Virgili, A. A Semi-Empirical Model for Top-down Cracking Depth Evolution in Thick Asphalt Pavements with Open-Graded Friction Courses. J. Traffic Transp. Eng. (Engl. Ed.) 2022, 9, 244–260. [Google Scholar] [CrossRef]
- Willis, J.R.; Taylor, A.J.; Nash, T.M. Laboratory and Field Evaluation of Florida Mixtures at the 2012 National Center for Asphalt Technology Pavement Test Track. Transp. Res. Rec. 2016, 2590, 65–73. [Google Scholar] [CrossRef]
- Saha, G.; Biligiri, K.P. Fracture Properties of Asphalt Mixtures Using Semi-Circular Bending Test: A State-of-the-Art Review and Future Research. Constr. Build. Mater. 2016, 105, 103–112. [Google Scholar] [CrossRef]
- Zaumanis, M.; Valters, A. Comparison of Two Low-Temperature Cracking Tests for Use in Performance-Based Asphalt Mixture Design. Int. J. Pavement Eng. 2020, 21, 1461–1469. [Google Scholar] [CrossRef]
- Du, H.; Ni, F.; Zhao, Y. Characterization of the Influence Factors of Low-Temperature Fracture Properties for Serving Asphalt Pavements Using Layer Core Samples. J. Transp. Eng. Part B Pavements 2021, 147, 04021016. [Google Scholar] [CrossRef]
- Seitllari, A.; Boz, I.; Habbouche, J.; Diefenderfer, S.D. Assessment of Cracking Performance Indices of Asphalt Mixtures at Intermediate Temperatures. Int. J. Pavement Eng. 2022, 23, 70–79. [Google Scholar] [CrossRef]
- Budziński, B.; Ratajczak, M.; Majer, S.; Wilmański, A. Influence of Bitumen Grade and Air Voids on Low-Temperature Cracking of Asphalt. Case Stud. Constr. Mater. 2023, 19, e02255. [Google Scholar] [CrossRef]
- Zhou, Z.; Gu, X.; Dong, Q.; Ni, F.; Jiang, Y. Low- and Intermediate-Temperature Behaviour of Polymer-Modified Asphalt Binders, Mastics, Fine Aggregate Matrices, and Mixtures with Reclaimed Asphalt Pavement Material. Road Mater. Pavement Des. 2020, 21, 1872–1901. [Google Scholar] [CrossRef]
- Yan, C.; Zhang, Y.; Bahia, H.U. Comparison between SCB-IFIT, Un-Notched SCB-IFIT and IDEAL-CT for Measuring Cracking Resistance of Asphalt Mixtures. Constr. Build. Mater. 2020, 252, 119060. [Google Scholar] [CrossRef]
- Xu, D.; Ni, F.; Du, H.; Zhao, Z.; Wang, J.; Chen, S. Investigation of Factors Affecting the Intermediate-Temperature Cracking Resistance of In-Situ Asphalt Mixtures Based on Semi-Circular Bending Test. Coatings 2023, 13, 384. [Google Scholar] [CrossRef]
- Zhou, F.; Im, S.; Hu, S.; Newcomb, D.; Scullion, T. Selection and Preliminary Evaluation of Laboratory Cracking Tests for Routine Asphalt Mix Designs. Road Mater. Pavement Des. 2017, 18, 62–86. [Google Scholar] [CrossRef]
- Batioja-Alvarez, D.; Lee, J.; Haddock, J.E. Understanding the Illinois Flexibility Index Test (I-FIT) Using Indiana Asphalt Mixtures. Transp. Res. Rec. 2019, 2673, 337–346. [Google Scholar] [CrossRef]
- Zhou, Z.; Gu, X.; Ni, F.; Li, Q.; Ma, X. Cracking Resistance Characterization of Asphalt Concrete Containing Reclaimed Asphalt Pavement at Intermediate Temperatures. Transp. Res. Rec. 2017, 2633, 46–57. [Google Scholar] [CrossRef]
- Gao, L.; Li, H.; Xie, J.; Yu, Z.; Charmot, S. Evaluation of Pavement Performance for Reclaimed Asphalt Materials in Different Layers. Constr. Build. Mater. 2018, 159, 561–566. [Google Scholar] [CrossRef]
- Ding, H.; Gyasi, J.; Hesp, S.A.M.; Marks, P.; Nie, Y.; Somuah, M.; Tabib, S.; Tetteh, N.; Ubaid, I. Performance Grading of Extracted and Recovered Asphalt Cements. Constr. Build. Mater. 2018, 187, 996–1003. [Google Scholar] [CrossRef]
- Jaskula, P.; Szydlowski, C.; Stienss, M. Influence of Bitumen Type on Cracking Resistance of Asphalt Mixtures Used in Pavement Overlays. IOP Conf. Ser. Mater. Sci. Eng. 2018, 356, 012010. [Google Scholar] [CrossRef]
- Saeidi, H.; Aghayan, I. Investigating the Effects of Aging and Loading Rate on Low-Temperature Cracking Resistance of Core-Based Asphalt Samples Using Semi-Circular Bending Test. Constr. Build. Mater. 2016, 126, 682–690. [Google Scholar] [CrossRef]
- Dave, E.V.; Hoplin, C.; Helmer, B.; Dailey, J.; Van Deusen, D.; Geib, J.; Dai, S.; Johanneck, L. Effects of Mix Design and Fracture Energy on Transverse Cracking Performance of Asphalt Pavements in Minnesota. Transp. Res. Rec. 2016, 2576, 40–50. [Google Scholar] [CrossRef]
- Jiang, J.; Dong, Q.; Ni, F.; Zhao, Y. Effects of Loading Rate and Temperature on Cracking Resistance Characteristics of Asphalt Mixtures Using Nonnotched Semicircular Bending Tests. J. Test Eval. 2019, 47, 2649–2663. [Google Scholar] [CrossRef]
- Mirzaiyanrajeh, D.; Dave, E.V.; Sias, J.E.; Voels, J.; Dai, S. Effects of Laboratory Compacted Asphalt Mixtures Air-Void Variations on Fracture Properties at Low Temperatures. Adv. Civ. Eng. Mater. 2021, 10, 262–275. [Google Scholar] [CrossRef]
- Radeef, H.R.; Abdul Hassan, N.; Zainal Abidin, A.R.; Mahmud, M.Z.H.; Mohd Satar, M.K.I.; Mohd Warid, M.N.; Al Saffar, Z.H. Determining Fracture Energy in Asphalt Mixture: A Review. IOP Conf. Ser. Earth Env. Sci. 2021, 682, 012069. [Google Scholar] [CrossRef]
- Kaseer, F.; Yin, F.; Arámbula-Mercado, E.; Epps Martin, A.; Daniel, J.S.; Salari, S. Development of an Index to Evaluate the Cracking Potential of Asphalt Mixtures Using the Semi-Circular Bending Test. Constr. Build. Mater. 2018, 167, 286–298. [Google Scholar] [CrossRef]
- Das, B.P.; Siddagangaiah, A.K. Identification of Parameter to Assess Cracking Resistance of Asphalt Mixtures Subjected to Aging and Moisture Conditioning. J. Traffic Transp. Eng. (Engl. Ed.) 2022, 9, 293–304. [Google Scholar] [CrossRef]
- Haslett, K.E. Evaluation of Cracking Indices for Asphalt Mixtures Using SCB Tests at Different Temperatures and Loading Rates Evaluation of Cracking Indices for Asphalt Mixtures Using SCB Tests At Senior Honors Theses of Bachelor of Science; University of New Hampshire: Durham, UK, 2018; Available online: https://scholars.unh.edu/cgi/viewcontent.cgi?article=1385&context=honors (accessed on 3 July 2023).
- Zhou, F.; Newcomb, D.; Gurganus, C.; Banihashemrad, S.; Sakhaeifar, M.; Park, E.S.; Lytton, R.L. National Academies of Sciences, Engineering, and Medicine. In Field Validation of Laboratory Tests to Assess Cracking Resistance of Asphalt Mixtures: An Experimental Design; The National Academies Press: Washington, DC, USA, 2016. [Google Scholar] [CrossRef]
- Guo, R.; Zhou, F.; Nian, T. Indices Relation and Statistical Probability Analysis of Physical and Mechanical Performance of Asphalt Mixtures. Case Stud. Constr. Mater. 2022, 16, e01091. [Google Scholar] [CrossRef]
- Yang, Q.; Deng, Y. Evaluation of Cracking in Asphalt Pavement with Stabilized Base Course Based on Statistical Pattern Recognition. Int. J. Pavement Eng. 2019, 20, 417–424. [Google Scholar] [CrossRef]
- Du, H.; Ni, F.; Ma, X. Crack Resistance Evaluation for In-Service Asphalt Pavements by Using SCB Tests of Layer-Core Samples. J. Mater. Civ. Eng. 2021, 33, 04020418. [Google Scholar] [CrossRef]


Disclaimer/Publisher’s Note: The statements, opinions and data contained in all publications are solely those of the individual author(s) and contributor(s) and not of MDPI and/or the editor(s). MDPI and/or the editor(s) disclaim responsibility for any injury to people or property resulting from any ideas, methods, instructions or products referred to in the content. |
© 2023 by the authors. Licensee MDPI, Basel, Switzerland. This article is an open access article distributed under the terms and conditions of the Creative Commons Attribution (CC BY) license (https://creativecommons.org/licenses/by/4.0/).