Abstract
Focusing on the degradation of organic dyes in wastewater, a novel titania composite nanofiber small area film photocatalyst with improvedphotocatalytic activity using strontium ions and graphite as dual cocatalysts has been synthesized by electrospinning and hydrothermal methods.Morphology control, doping causing crystal defect engineering (strontium ion doping), and heterojunction building (graphite surface modification) strategies are simultaneously applied to the synthetic design of new photocatalysts.In degradation tests of rhodamine B, methyl orange, methylene blue, and malachite green, the degradation rate constants were 2.57, 2.85, 3.06, or 3.54 times higher than those of pure titania, respectively.The composite nanofiber small area film exhibited excellent recyclability in fourrecycling tests.The improved photocatalytic activity of titania composite nanofiber small area film is attributed to the morphology of the nanofibers with the addition of more reaction sites, dopingwith more crystal defects, and heterojunctions providing channels for the transfer of photogenerated carriers.Design solutions with the synergistic effects of multiple strategies inform the use of titania in industrial applications.
1. Introduction
Industrial wastewater containing organic dyes is harmful to water safety. These colorful wastewaters, which are not self-degradable, are discharged into water systems, threatening the health of aquatic organisms and humans due to their biological toxicity [1,2]. Various physical and chemical methods are used to remove these organic dyes, such as adsorption, sonolysis, and chemical oxidation. However, these methods have the disadvantages of high energy consumption, high cost, and being easy to cause secondary pollution [3]. Photocatalysis is a green technology used for the treatment of organic dyes due to its low energy consumption, cheapness, and absence of secondary pollution. Photosensitive semiconductors have received widespread attention in photocatalytic technology as a source of photocatalysts because of their good photodegradation capabilities. The photocatalytic abilities of many oxide semiconductors have been discovered as effective photocatalysts, such as TiO2, ZnO, Fe3O4, ZrO2, CeO2, and SrO. These oxides have a wide range of sources, either chemically synthesized or from natural plants. For example, Shimi et al. synthesized a recyclable photocatalyst using natural plants to treat wastewater [4]. Oxide semiconductors have become an important class of photocatalysts. Titania has attracted the attention of researchers as a traditional oxide semiconductor photocatalyst because of its low cost, environmental friendliness, and stable physicochemical properties. However, the special electronic structure of titania with a wide band gap of 3.2 eV has resulted in low photogenerated charge separation efficiency, a short carrier lifetime, and poor absorption of visible light, which affects its wide application. The cocatalyst does not have photocatalytic activity, but it can change some of the properties of the photocatalyst, such as crystal size, crystal defects, ionic valence, and surface structure, so that the photocatalytic activity can be improved. The methods of transforming cocatalysts into photocatalysts are diverse, with doping and surface modification being the most commonly used methods.
Metallic doping and heterojunctions can reconstruct the new electronic structure of titania, which are effective strategies to promote the separation and transfer of photogenerated charges, prolong the carrier lifetime, and enhance visible light absorption. Many researchers have used metal elements doped with titania to try to change the energy band structure and increase the crystal defects, thus improving the photocatalytic efficiency [5,6]. Lee et al. synthesized Cu-doped titania hollow nanostructures using the sol-gel method [7]. Nanophotocatalysts with good physicochemical properties, such as a narrow bandgap and high surface area activity, lead to optimal photocatalytic activity for phenol degradation under visible light. Mancusoet al. synthesized a Fe-doped titania visible photocatalyst by Reverse-Micelle sol-gel method [8]. The doping of metal Fe led to the surface sensitization and band gap reduction of titania, which improved the photocatalytic activity of titania for the degradation of gentian violet dye.
However, the role of single metal doping for photocatalysis is controversial, probably due to the influence of the synthetic route, which affects the application of this method [9]. Designing suitable semiconductor heterojunctions is also a common strategy to improve the photocatalytic activity of titania. An energy band structure optimized by heterojunction can effectively separate photogenerated carriers and enable visible light absorption, resulting in improved photocatalytic efficiency in titania. Graphite is a special semiconductor material with excellent inherent electrical conductivity, thermal conductivity, and chemical stability. The heterojunction structure of graphite and titania has become a widely noticed solution to improve the photocatalytic activity of titania due to the advantages of graphite’s unique electronic structure, non-toxicity, and cheapness. Using chemical vapor deposition, Shaban et al. synthesized titania nanoribbon/carbon nanotube composite photocatalytic materials with broadened light absorption bands and a reduced band gap, which exhibited good photocatalytic activity and stability in the photocatalytic test of methylene blue [10]. The nanotubes formed by graphite become a sink for electrons, and the titania attached to them injects electrons from the conducting band into the carbon, completing the electron transfer. This conductivity of graphite improves transfer channels for photogenerated electrons, which prolongs the lifetime of photogenerated carriers, and thus increases the photocatalytic efficiency of titania. Furthermore, graphite is a semiconductor material with a zero bandgap, and it is possible to change the bandgap structure of titania through the semiconductor heterojunction to increase the absorption of visible light. Chen et al. synthesized carbon nanotube/titania nanocomposites using a sol-gel reflux method with a 50% increase in rhodamine B degradation efficiency compared with titania, which was attributed to the efficient charge separation rate, increased visible light absorption, increased specific surface area, and optical support [11]. As a result, graphite as a cocatalyst has become a well-accepted strategy to enhance the photocatalytic activity of titania. Although this strategy is effective, it has limitations for a single heterojunction. Therefore, researchers are now focusing more on the synergistic application of multiple methods to improve the photocatalytic activity of titania.
Moreover, morphology is also an important reason for the application of titania. The large surface area can increase the active sites of photocatalytic reactions to improve photocatalytic efficiency, and therefore nanomaterials are applied to the design of photocatalyst morphology [12]. Nanoparticles with large specific surface areas can be suspended in wastewater to improve photocatalytic efficiency, but nanoparticles are prone to agglomeration and recovery difficulties [13]. It takes a long time for the photocatalyst to be fully recovered due to the slow settling of the small weight of the nanoparticle. There could be potential biological risks if the nanoparticles are not fully recovered. Electrospinning is a low-cost method for making one-dimensional nanomaterials with controllable diameter, orientation, and chemical composition [14]. Nanofiber film formed by electrospinning has the advantages of a large specific surface, less agglomeration, easy recovery, and potential for large-scale industrial production, which makes it promising to be an effective filter for the treatment of wastewater [15]. Thus, nanofiber film photocatalysts composed of semiconductors become a good candidate for the degradation of organic dyes in wastewater.
Metal doping, heterogeneous building, and morphology are all effective strategies to improve titania. However, the effect of a single strategy is limited and controversial. At present, the combined use of several strategies has become the primary method to improve the properties of titania. In this work, a photocatalyst with strontium-ion-doped titania nanofiber film as a framework and graphite rods as the modification was designed for the first time by a new method combining electrospinning, hydrothermal, and calcination. The efficiency of this photocatalyst for the removal of organic dyes was improved by the combined use of design chemistry, crystal type, heterojunction, and surface morphology strategies. Metal element doping and heterojunction building strategies are used to promote light absorption, increase photogenerated electron-hole pair separation, and prolong photogenerated carrier lifetime, thus improving titania photocatalytic activity. The morphology, optical properties, and crystal structure of this photocatalytic material were characterized. The photocatalyst exhibited high activity in photocatalytic tests using four organic dyes (methylene blue, rhodamine B, methyl orange, and malachite green) as simulated pollutants in water.
2. Materials and Methods
2.1. Materials
All chemicals were used directly after purchase in the market without further purification and processing. The chemicals used in this study include: tetrabutyl titanate (C16H36O4Ti, CAS 5593-70-4, 99.7%), strontium acetate (C4H6O4Sr, CAS 543-94-2, 99.0%), polyvinylpyrrolidone (PVP) ((C6H9NO)n, CAS 9003-39-8, Mw = 1,300,000), rhodamine B (RhB) (C28H31ClN2O3, CAS 81-88-9, 99.0%), methyl orange (MO) (C14H14N3NaO3S, CAS 547-58-0, 98.0%),methylene blue (MB) (C16H18ClN3S·3H2O, CAS 7220-79-3, 90.0%), malachite green (MG) (C52H54N4O12, CAS 2437-29-8, AR), N,N-dimethylformamide (DMF) (C3H7NO, CAS 68-12-2, 99.5%), glacial acetic acid(C2H4O2, CAS 64-19-7, 99.5%), anhydrous ethanol (C2H6O, CAS 64-17-5, 99.5%) and ammonium hydroxide (NH4OH, CAS 1336-21-6,25.0%–28.0%).The water was primary distilled water for the experiments.
2.2. Preparation of Photocatalysts
Tetrabutyl titanate was used as a source of titanium in titania, and strontium acetate as a source of the metal dopant strontium. Since tetrabutyl titanate hydrolyzes in water, anhydrous ethanol was used as a solvent; anhydrous ethanol was used as a solvent; glacial acetic acid was used as an inhibitor to prevent the hydrolysis reaction of tetrabutyl titanate. Polyvinylpyrrolidone was used as a sacrificial agent to build the nanofiber template. 50.0 mL of anhydrous ethanol and 4.0 mL of glacial acetic acid were put into an Erlenmeyer flask with a ground-glass stopper. 0.02 g of strontium acetate and 5.0 mL of tetrabutyl titanate were added successively to the solvent with slow stirring using a magnetic stirrer. Strontium ion content of 1 wt.% in titania is the optimal ratio. The Erlenmeyer flask was corked with a ground glass stopper, and then the mixture was stirred for 10 min to achieve homogeneity. 4.0 g of polyvinylpyrrolidone was added to the solution very slowly with slow stirring to avoid the formation of large agglomerates. Next, the above mixture was continuously stirred for 5 h in a sealed Erlenmeyer flask until a homogeneous light yellow sol was formed. The above light yellow sol was put into a 5 mL syringe for electrospinning to make nanofiber film. The positive and negative high voltages for electrospinning were +10 kV and −10 kV, respectively. The receiver of the nanofibers was a piece of aluminum foil 10 cm from the electrospinning nozzle. A sufficiently thick film of nanofibers was removed from the aluminum foil after many nanofibers were piled up on it. The nanofiber film was calcined in a resistance furnace at a heating rate of 20 °C/h until 500 °C and then held for 1 h at 500 °C to remove the sacrificial agent polyvinylpyrrolidone. The large white film shrank and broke up into many small area white films as a result of calcination. The pure titania nanofiber film used for comparison experiments was prepared in the same way. Pure titania and strontium-doped titania are named T0 and TS, respectively.
0.1 g of TS was dispersed into a solution consisting of 10 mL of anhydrous ethanol and 20 mL of water, and then 10 mL of DMF and 2 mL of ammonium hydroxide were added successively to the above mixture. The above system was poured into a stainless steel hydrothermal reactor lined with tetrafluoroethylene for hydrothermal treatment at 150 °C for 24 h. After the hydrothermal treatment, the sediment was cleaned with water four times so that the pH of the cleaned water was 7. The sediment was dried in a desiccator and then carbonized by calcination at 400 °C for 2 h under nitrogen protection. The carbonized nanofiber film was named TSC. The preparation process is shown in Figure 1.
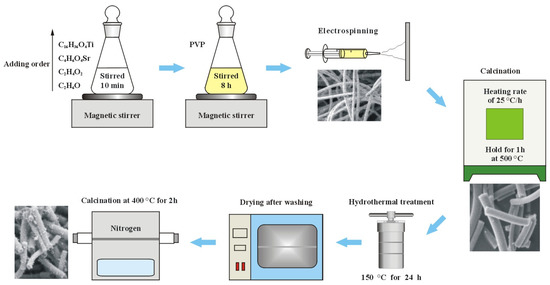
Figure 1.
Preparation process of composite nanofiber film.
2.3. Characterization
The structure and crystal phase were determined by XRD and Raman. XRD operated in Cu Kα radiation with a voltage of 40 kV, a wavelength of 0.1542 nm, a scanning range of 0–80° for 2θ, and a scan angular speed of 6°/min. Raman used a 325 nm laser as the excitation wavelength. The surface morphology of the photocatalyst was observed using SEM, TEM, and HR-TEM.TEM operated at an accelerating voltage of 200 kV. Elements and chemical states were tested by EDS and XPS.XPS tests were performed using Al-Kα radiation. Optical features were detected by UV-Vis DRS and FS.UV-Vis DRS was scanned in the range of 200–600 nm with BaSO4 as a reference. FS used 290 nm as the excitation wavelength in the scanning range of 350–510 nm.
2.4. Photocatalytic ActivityTest
Photocatalytic degradation of simulated pollutants was performed to compare the photocatalytic activity of nanocomposites. RhB, MO, MB, and MG were degraded as simulated pollutants in the photocatalytic experiments. The temperature of the degradation experiments was controlled at 25 ± 3 °C with a water thermostat. A 350 W spherical xenon lamp was used as a photocatalytic light source to simulate sunlight because the spectrum of the spherical xenon lamp is very similar to that of sunlight, which makes the photocatalytic experiments closer to the real environment. The spherical xenon lamp is about 40 cm from the organic dye. Each of the four organic dyes was dissolved in water to prepare a 10 mg/L solution.40 mg of photocatalysts (T0, TS, or TSC) were dispersed into 50 mL of organic dyes (RhB, MO, MB, or MG) for photodegradation. The mixture was placed under the xenon lamp for the photocatalytic reaction with continuous stirring. The photocatalyst was recovered by centrifugation from 3–4 mL of the above mixture, which was collected at 15 (RhB, MO, MB) or 10 (MG) min intervals while the photocatalytic reaction was going on. The concentration of the clarified solution obtained by centrifugation was assayed with a UV-Vis spectrophotometer to evaluate the percentage of organic dye residues. The remaining mixture was stationary and sedimented after the photocatalytic reaction. The sediment was washed with water to remove surface organic dyes. The sediment is weighed, which is the basis for the volume of organic dye in the next recycling test. No photocatalysts were supplemented in the recycling test. The ratio of the photocatalyst mass to the organic dye volume is kept constant by reducing the volume of the organic dye. Recycling experiments were performed four times to examine the recyclability of the photocatalyst.
3. Resultsand Discussion
3.1. XRD Patterns
XRD demonstrates the crystal structure and phase purity of T0, TS, and TSC in Figure 2. The characteristic peaks of all samples have similar diffraction angles and peak height ratios, so the titania crystal phase is not altered after doping with strontium ions and surface loading of graphite. All the diffraction peaks match the JCPDS card number 73–1764 of titania anatase very perfectly. Anatase has higher photocatalytic activity than rutile, so obtaining high purity anatase is beneficial to improving photocatalytic efficiency. The diffraction peaks corresponding to (101), (004), (200), (105), (211), (204), (116), (220), and (215) crystalline planes are sharp, indicating a very high crystallinity of all samples, which is attributed to a suitable calcination temperature and heating rate.T0 and TS have the same peak intensity, indicating that the doping of strontium ions does not affect the crystallinity of titania.
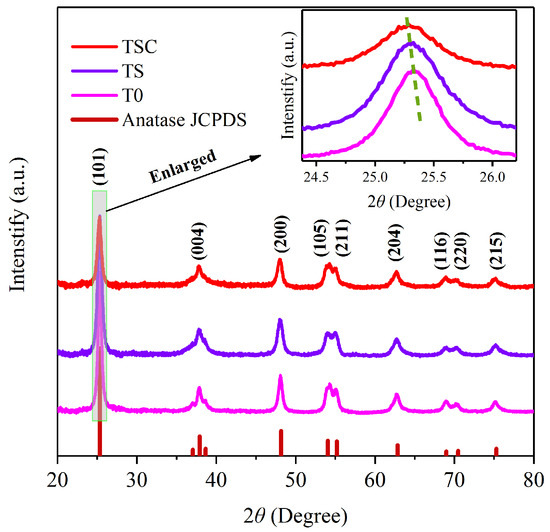
Figure 2.
XRD patterns of T0, TS, TSC.
However, the intensity of the diffraction peak of TSC is weaker than that of T0 and TS due to the graphite covering the surface of strontium-ion-doped titania nanofiber film, which leads to are duction in X-ray diffraction. In the magnified strongest peak (101), the 2θ diffraction angle positions of both TS and TSC have a slight shift toward a lower angle compared with T0. According to Bragg’s law (1), a lower diffraction angle θ indicates an increase in the interplanar spacing d when the incident wavelength λ is constant.
2dsinθ = λ,
The d values for T0, TS, and TSC were calculated as 0.3517, 0.3520, and 0.3522 nm, respectively. The lowered diffraction angle of TS indicates that strontium ions successfully enter the titania lattice, resulting in lattice expansion. The replacement of titanium ions by strontium ions leads to an increase in the interplanar spacing due to the high radius of strontium ions (0.112 nm) compared with titanium ions (0.0605 nm). The diffraction angle of TSC also becomes slightly lower compared with TS, which is attributed to the formation of Ti-C bonds on the nanofiber film surface. The formation of a Ti-C bond can increase the interplanar spacing [16]. The absence of peaks belonging to the Ti-C bond is due to the low Ti-C bond content. The crystallite sizes (D) of all samples were calculated using the Scherrer Equation (2) based on the full wave at half maximum (FWHM, β) of the diffraction peak (101).
D = Kλ/(βcosθ),
The constant K is 0.89, and the X-ray incident wavelength λ is 0.1542 nm. The crystallite sizes of T0, TS, and TSC are 14.4 ± 0.2, 12.2 ± 0.2, and 12.8 ± 0.3 nm, respectively. The lattice strain (ε) of T0, TS, and TSC were calculated using Equation (3) for 0.00239 ± 0.00003, 0.00282 ± 0.00004, and 0.00286 ± 0.00006, respectively.
ε = βcosθ/4,
Similarly, the dislocation densities (ρ) of T0, TS, and TSC were calculated using Equation (4) as 0.0049 ± 0.0001, 0.0067 ± 0.0002, and 0.0061 ± 0.0003 (1/nm)2, respectively [17].
ρ = 1/D2,
The results of the calculations show that strontium ion doping leads to smaller titania crystallite sizes, larger lattice strains, and dislocation density, which means more crystal defects and an increase in oxygen vacancies. The slightly bigger crystallite size of TSC compared with TS is attributed to the additional calcination, as the longer calcination time promotes crystallite growth. The graphite modification on the surface of the nanofibers does not affect the XRD pattern of the sample, so D, ε, and ρ of TSC do not change significantly compared with TS.
3.2. Raman Spectra
Raman spectroscopy reveals information on crystal composition, crystal defects, and crystal deformation via chemical bonding vibrations caused by laser irradiation. Therefore, Raman spectroscopy is often used to characterize the crystal information of complex oxides. Figure 3a shows the Raman spectra of T0, TS, and TSC. All Raman spectra exhibit the vibrational peaks of anatase. Eg, B1g, and A1g vibration peaks are caused by symmetric stretching vibration, symmetric bending vibration, and asymmetric bending vibration of the O-Ti-O bond, respectively [18].
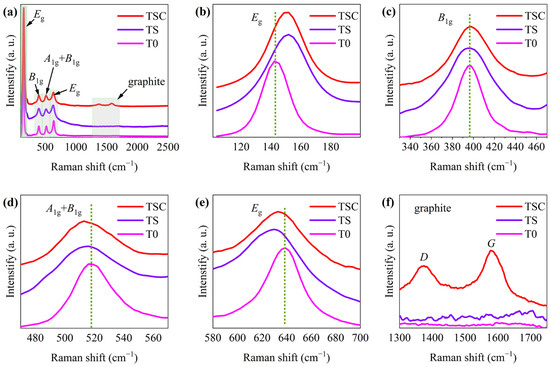
Figure 3.
(a) Raman spectra of T0, TS, and TSC; enlarged image of peak (b) Eg (143.3 cm−1); (c) B1g; (d) A1g+B1g; (e) Eg (638.2 cm−1); (f) graphite.
All vibrational peaks are enlarged in order to further observe the effect on the crystal structure of titania nanofiber film attributed to strontium ion doping and graphite surface modification in Figure 3b–f. The Eg vibration peaks of anatase are located at 143.3 cm−1 and 638.2 cm−1, as shown in Figure 3b,e. One Eg vibrational peak at 143.3 cm−1 shows a blue shift, while the other Eg vibrational peak at 638.2 cm−1 shows a red shift due to strontium ions doping. The different bond lengths of O-Sr-O and O-Ti-O lead to a change in the symmetric stretching vibration after the substitution of strontium ions with a large radius for titanium ions with a small radius. The vibration peak of TSC at 638.2 cm−1 has a very slight blue shift compared with TS, which indicates that a small amount of carbon enters the lattice, causing symmetric stretching vibration changes. The B1g vibrational peak of anatase is located at 396.1 cm−1 in Figure 3c. The relatively stationary cations are usually the center of the Raman vibration, while the anions move relative to the cations, so the substitution of cations has little effect on the symmetric bending vibration [19]. Thus, the B1g peaks of TS and TSC are not significantly shifted compared with T0, indicating that strontium and carbon do not affect the one-dimensional symmetric bending vibration of the O-Ti-O bond, which may be attributed to the symmetric structures of the O-Sr-O and O-C-O bonds that are similar to the O-Ti-O bond. The A1g + B1g vibrational peak of anatase is located at 517.1 cm−1 in Figure 3d.The change in asymmetric bending vibration of A1g leads to the red shift of A1g+B1g vibration peaks in TS and TSC. The entry of strontium ions into the titania lattice affects the asymmetric bending vibration, and this effect is enhanced after the entry of carbon into the titania lattice. Vibrational peaks attributed to graphite D and G are observed, indicating that graphite has been successfully modified to the nanofiber surface in Figure 3f. The D peak belongs to the Raman disorder-induced mode in graphite, indicating the presence of many crystal defects in graphite. The G peak is the Raman ordered-induced mode caused by the sp2 carbon network, indicating the presence of a two-dimensional planar crystal structure of graphite [20].High graphitization improves graphite conductivity, and thus photogenerated carriers are more easily transferred from titania to graphite through semiconductor heterojunctions. So as to evaluate the graphitization (ordered carbon), the peak areas of D and G were calculated to obtain a ratio of 7:10 for disordered to ordered carbon, indicating a high graphitization.
Furthermore, the interaction of phonons with electrons in metal oxides changes the phonon linewidth and peak shape to provide useful information on crystal defects and charge transfer [21]. The lifetime τ of the phonon, which is associated with the phonon linewidth, was calculated by the energy-time uncertainty relation (5), where Γ is FWHM and the speed of light c = 299,792,458 m/s [22].
1/τ = 2πcΓ,
T0, TS, and TSC phonon lifetimes were calculated to be 0.2336 ± 0.0007, 0.1525 ± 0.0006, and 0.1678 ± 0.0007 ps, respectively, using the Eg peak with the maximum intensity. The small crystal size limits the phonon distribution, resulting in a short phonon lifetime. Compared with T0 and TSC, TS has the smallest crystallite size, corresponding to the XRD calculations. Although small crystal sizes implying more crystal defects are beneficial for photocatalytic reactions, the synergistic effect of heterojunctions and doping makes TSC exhibit higher efficiency in photocatalytic reactions after the formation of heterojunctions between graphite and titania.
3.3. SEM and TEM Analysis
SEM with EDS was used to observe the morphology of the nanofiber film. Figure 4 shows the SEM images of the nanofiber film for each step of the preparation process. The PVP/TS 1D nanofibers prepared by electrospinning are thin, long, non-directional, non-interconnected, and relatively uniform in diameter, as shown in Figure 4a. Figure 4b shows smooth surface nanofibers with diameters around 300 nm. The nanofiber diameters are reduced to the range of 150–200 nm due to the removal of PVP after calcination, and the nanofiber surface is still smooth in Figure 4c. The surface is no longer smooth after graphite loading on the nanofiber surface in Figure 4d. As shown in enlarged Figure 4e, many small graphite particles are uniformly modified on the surface of all nanofibers without aggregation, indicating that the graphite was successfully loaded on the TS surface. The semiconductor heterojunction formed at the contact between the TS nanofiber surface and graphite becomes a photogenerated carrier transfer channel. EDS mapping corresponding to SEM was used for the study of the elemental composition of this composite nanofiber, as shown in Figure 4f,g. The nanofiber film consists of Ti, O, C, and Sr elements, where C and Sr are uniformly distributed without aggregation, indicating that Sr doping and heterojunction with graphite are spread throughout the photocatalyst. Therefore, the effect of the composite structure on the photocatalytic performance is broad rather than local.
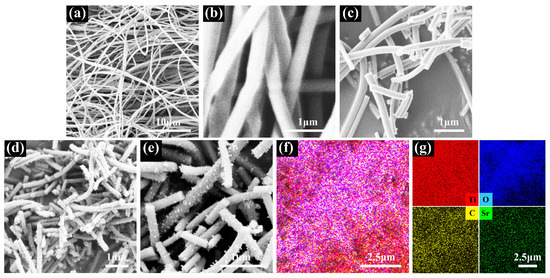
Figure 4.
SEM images of (a) PVP/TS; (b) PVP/TS enlarged; (c) TS; (d) TSC; (e) TSC enlarged; (f) elemental distribution mapping; (g) the corresponding elemental mappings.
The TEM and HRTEM images of the TSC are shown in Figure 5. The 1D structure of the composite is further confirmed by Figure 5a. Figure 5b,c show the morphology of graphite, semiconductor heterojunction position, and connection state. These TEM images are consistent with the SEM images. However, graphite rods are clearly visible due to the large magnification. Graphite is grown into disconnected, short nanorods of uniform diameter on the surface of the nanofibers. HRTEM was used to observe the graphite lattice in the blue circle and the titania lattice in the red circle in Figure 5d. Figure 5e shows the lattice fringes with a d of 0.33 nm, corresponding to the (003) crystal plane of graphite. Figure 5f shows the lattice fringes with d of 0.35, 0.24, and 0.19 nm, corresponding to the (101), (103), and (200) crystal planes of anatase. No lattice fringes belonging to strontium are observed due to the low doping content.
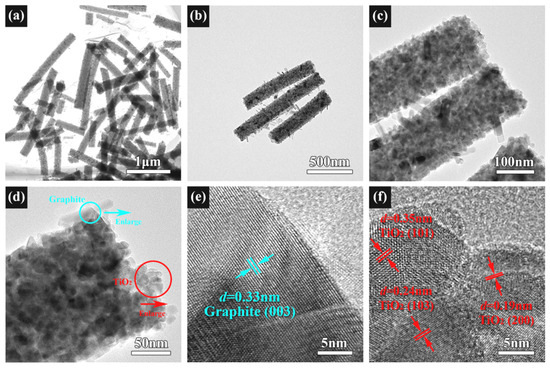
Figure 5.
(a–d) TEM images of TSC; (e) HRTEM of TSC at the blue circle; (f) HRTEM of TSC at the red circle.
3.4. XPS Spectra
The XPS spectra of TSC were measured to confirm the chemical state of the composite nanofiber film elements in Figure 6. The XPS survey reveals that the TSC composite nanofiber film consists of the elements O, Ti, C, and Sr, corresponding to the EDS map in Figure 6a.The peaks located at 529.7, 458.6, 284.8, and 133.6 eV correspond to O1s, Ti2p, C1s, and Sr3d, respectively. The low content of strontium leads to a very low peak in the survey; however, Sr3d can still be observed in the enlarged image. High-resolution spectra were tested to determine the chemical states of Ti, Sr, C, and O elements.
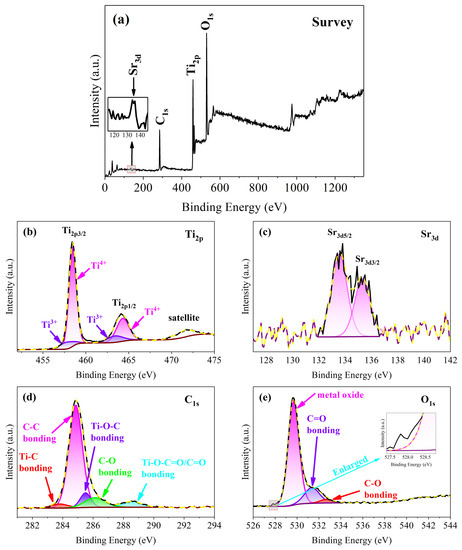
Figure 6.
XPS spectra of TSC (a) survey; (b) Ti2p; (c) Sr3d; (d) C1s; (e) O1s.
Focusing on the high-resolution spectrum of Ti2p, three major peaks are observed located at 458.5, 464.1, and 471.7 eV, belonging to Ti2p3/2, Ti2p1/2, and satellite, respectively, in Figure 6b.The energy difference of 5.6 eV between the Ti2p3/2 and Ti2p1/2 peaks indicates that the element titanium is present in the nanofiber film as an oxide [23]. For a better fit to the Gaussian, the Ti2p3/2 and Ti2p1/2 peaks are divided into four components at 457.8, 458.5, 463.4, and 464.3 eV, respectively. Typical components belong to Ti4+ at 458.5 and 464.3 eV in titania, and a small trace of Ti3+ is found at 457.8 and 463.4 eV [24]. Ti3+ and oxygen vacancies are useful crystal defects on the titania surface for improving photocatalytic activity due to the provision of active sites for photocatalytic reactions [25]. In fact, the conditions for conversion from Ti4+ to Ti3+ are not demanding. UV light irradiation, heat treatment, and carbonization can produce a certain amount of Ti3+ [26]. The suitable calcination and carbonization processes result in the presence of a certain amount of Ti3+ on the surface of the TSC. The content of Ti3+ is 16.1 at. % by the calculation of the peak area of titanium components. As shown in Figure 6c, although the content of strontium is low, two distinct peaks of the high-resolution spectrum are still observed at 133.6 and 135.3 eV, attributed to Sr3d5/2 and Sr3d3/2, indicating that the doped strontium successfully enters the titania lattice. Typical peaks indicate the presence of the Sr2+ chemical state in the titania lattice. Five components to fit the C1s peaks are at 283.8, 248.8, 285.5, 286.1, and 288.6 eV, corresponding to the Ti-C bond, C-C bond, Ti-O-C group, C-O bond, and Ti-O-C=O group, respectively, in Figure 6d [27,28,29,30]. The Ti-C bond, Ti-O-C group, and Ti-O-C=O group indicate that the carbon in graphite enters the titania lattice by hydrothermal and calcination, which is consistent with the XRD and Raman. Carbon entry into the lattice may occur both at the heterojunction interface, where the carbon rods are in contact with titania, and at the surface of the nanofiber without carbon rods. The carbon enters the lattice via calcination after a small amount of organic carbon adheres to the nanofiber surface during the hydrothermal process. The high-resolution spectrum of oxygen is divided into three components at 529.7, 531.4, and 532.7 eV, corresponding to metal oxide, C=O, and C-O, respectively. A small peak is observed at 527.8 eV. Mostly, the peak around the binding energy in the metal-doped case is due to the phase transformation. A phase transformation of strontium may be the cause of the small peaks.
3.5. UV-Vis DRS
UV-vis DRS was tested to study the light absorption ability and the energy band structure of the samples, as shown in Figure 7. All samples have narrow light absorption edges in the UV region, which is typical of the absorption features of titania anatase. The absorption edges of TS and TSC show a significant red shift compared with T0, indicating that doping and surface modification have changed the energy band structure of titania. The higher redshift of TSC is attributed to the heterojunction structure formed between titania and graphite. Tauc’s plots are used to make hv-(αhv)2 curves to calculate the band gap Eg, as shown in Figure 7b. After fitting a straight line to the linear part of the spectrum, the band gap is determined by the intercept of the straight line with the hv axis. The band gap is reduced from 3.19 eV (T0) to 3.00 eV (TSC), which indicates that strontium and graphite are successfully involved in reconstructing the titania energy band structure. The reduced band gap increases the spectral absorption range of the photocatalyst, which improves the utilization of sunlight. However, it is very unfortunate that the absorption edges do not enter the visible region, so no further tests for visible activation are performed.
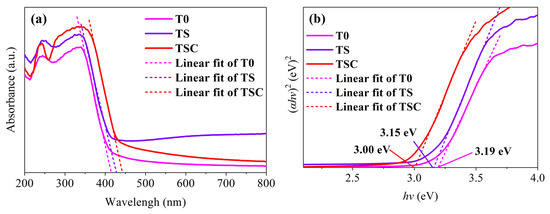
Figure 7.
(a) UV-vis DRS; (b) Tauc’s plots of all samples.
3.6. FS Spectra
Photoluminescence is due to the light energy released when electrons excited by light on the surface of a material transition from the excited state back to the ground state. Thus, photoluminescence responds to the energy difference between energy level states. All samples were tested by fluorescence spectroscopy to study the energy level states on the surface of nanofiber film, as shown in Figure 8. Six emission peaks are observed at around 392, 404, 445, 463, 477, and 488 nm, corresponding to energy values of 3.16, 3.07, 2.79, 2.68, 2.60, and 2.54 eV, respectively. The emission peak at 392.1 nm (3.16 eV) in the UV region describes the band-edge emission of titania, which matches the band gap calculated by UV-Vis. The emission peak at 404 nm is attributed to the indirect transition of titania [31]. The self-trapped exciton forms an emission peak at 445 nm near the edge of the UV region in the TiO6 octahedra [32]. The 463 and 477 nm emission peaks in the visible region are due to electron traps formed by oxygen vacancies, where photons are released after the electrons are trapped [33]. When photogenerated electrons are captured by oxygen vacancies, recombination of photogenerated electron-hole pairs is prevented, which is beneficial for hole transfer, so photocatalytic activity is improved [34]. The sharp emission peak indicates a high oxygen vacancy concentration due to a suitable calcination strategy. The charge transfer transitions form emission peaks at 488 nm from Ti3+ to TiO6 octahedra, indicating the presence of Ti3+, which corresponds to the XPS results [35]. In addition, after the loading with strontium and graphite, both TS and TSC show a decrease in luminescence intensity, with TSC having the lowest luminescence intensity. The low luminescence intensity implies a low electron-hole recombination rate and a high carrier separation rate, suggesting that structural improvement of titania using strontium and graphite is a useful strategy [36].
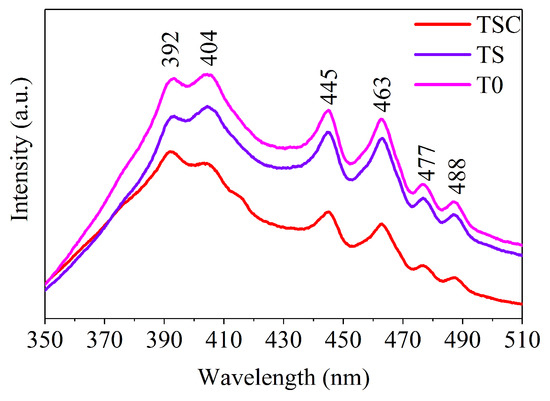
Figure 8.
Fluorescence spectra (FS) of all samples.
3.7. Photocatalytic Test
So as to evaluate the photocatalytic activity of the composite nanofiber film, all samples were tested for photodegradation of the simulated pollutants RhB, MO, MB, and MG, in Figure 9. Light and photocatalyst absence tests were performed to investigate the role of light and photocatalysts in photodegradation reactions. All organic dyes are not significantly degraded by the photocatalyst in the dark for 20 min, indicating that the nanofiber film is photoreactive and weakly adsorbed. RhB0, MO0, MB0, and MG0 are the degradation curves of organics RhB, MO, MB, and MG under light in the absence of a photocatalyst, respectively. The four organic dyes exhibit excellent recyclability under light, and no significant self-degradation is observed, demonstrating that the photocatalytic reaction is a result of the combined action of light and the photocatalyst.T0, TS, and TSC removal efficiencies are 61.70%, 84.66%, and 91.94% for RhB in 120 min; 58.56%, 83.16%, and 92.51% for MO in 105 min; 65.41%, 86.70%, and 97.10% for MB in 90 min; 64.36%, 92.99%, and 97.89% for MG in 50 min. TSC has the highest photocatalytic efficiency. Both TS and TSC show higher photocatalytic efficiencies compared with T0for all organic dyes, indicating that the doping of strontium ions as a cocatalyst has a significant effect on improving the photocatalytic efficiency. When graphite is modified on the surface of TS nanofibers, the photocatalytic efficiency is further improved, indicating that graphite as a cocatalyst can also improve the photocatalytic efficiency. The removal times of organic dyes RhB, MO, MB, and MG using TSC are approximately 120, 105, 90, and 50 min, respectively. The order of degradation efficiency is RhB < MO < MB < MG. RhB, MB, and MG are cationic dyes, and MO is an anionic dye [37,38,39,40]. TSC is effective in degrading both cationic and anionic dyes without bias. Therefore, the time to remove organic dyes is related to the type of organic dyes, their chemical structure, and the energy to break the chemical bonds. RhB is more difficult to degrade due to its multiple, non-breakable ring structures.
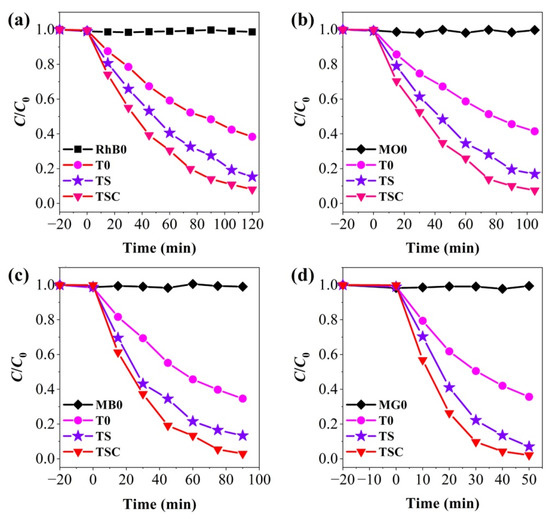
Figure 9.
Photocatalytic activity of (a) RhB; (b) MO; (c) MB; (d) MG.
Moreover, the kinetic curves for the degradation of organic dyes are plotted to further confirm the photocatalytic dynamics of all samples in Figure 10. T0, TS, and TSC all present first-order reactions, corresponding to the Langmuir-Hinshelwood model [41]. The reaction rate constants Kapp were calculated for T0, TS, and TSC as 0.0082, 0.0152, and 0.0211 min−1 for RhB; 0.0087, 0.0173, and 0.0248 min−1 for MO; 0.0123, 0.0238, and 0.0376 min−1 for MB; 0.0216, 0.0508, and 0.0764 min−1 for MG, respectively. The rate constants in the degradation reactions of the four organic dyes exhibit the greatest Kapp of TSC, which is 2.57, 2.85, 3.06, or 3.54 times higher than that of T0 for RhB, MO, MB, or MG, respectively, indicating that the design strategy of dual cocatalysts improved the photocatalytic activity of titania.
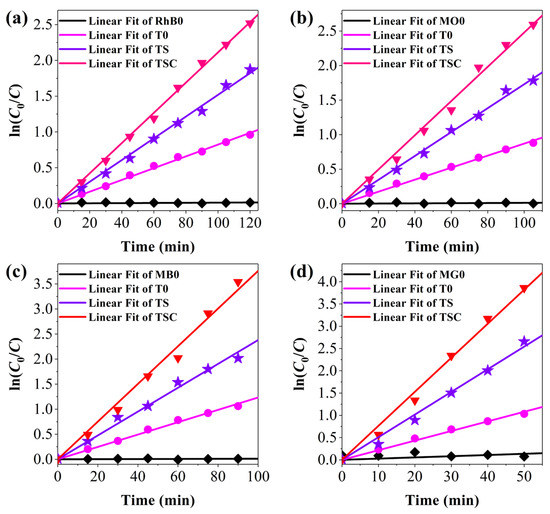
Figure 10.
The kinetic studies for the photocatalytic activity of (a) RhB; (b) MO; (c) MB; (d) MG.
Recyclability is an important feature for practical production applications of photocatalysts, which determines the economic cost. Recycling photocatalytic tests of the TSC were performed to evaluate the recyclability of the photocatalyst using the same photocatalytic protocol. The degradation data were recorded, calculated, and analyzed after each recycling test, as shown in Figure 11. Although there are small changes in the data from each recycling test, no significant degradation rate decreases are observed, indicating excellent recyclability of the TSC. Washing is an important method to remove residual pollutants attached to the photocatalyst surface, which maintains the photocatalytic activity of the surface.
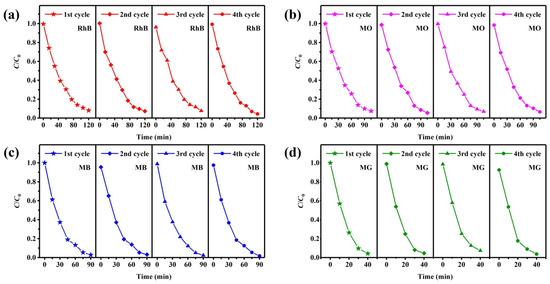
Figure 11.
Recycled photocatalytic degradation testing of TSC for (a) RhB; (b) MO; (c) MB; (d) MG.
3.8. Photocatalytic Mechanism
The crystal structure of TSC and the transfer mechanism of photogenerated carriers are proposed based on the above characterization results. Figure 12 illustrates the octahedra of the titania unit cell TiO6. Strontium ions enter the titania lattice, replacing titanium ions without forming separate crystals due to the low doping content. On the one hand, the different radii of strontium and titanium ions lead to the expansion of the titania lattice, and on the other hand, the different valence states of strontium and titanium ions lead to the charge imbalance, which causes more crystal defects such as more oxygen vacancies and dislocations in the titania lattice. More crystal defects can promote the separation of photogenerated carriers, leading to improved photocatalytic activity. Similar to strontium ions, carbon also enters the lattice to replace titanium ions during calcination, while the formed Ti-C bonds are beneficial for the separation of photogenerated carriers [42]. Doping is a useful strategy to increase the photocatalytic efficiency of titania. However, the heterojunction strategy based on doping can further enhance the photocatalytic efficiency.
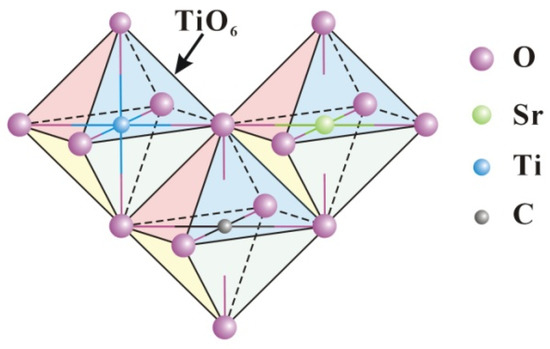
Figure 12.
Schematic diagram of strontium and graphite entering the lattice.
Figure 13 shows the positions, potential barriers, and energy bands of the semiconductor heterojunctions. Graphite is a zero-bandgap semiconductor whose conductivity is closer to that of a metal, so the heterojunction is more similar to a Schottky junction between a metal and a semiconductor [43]. Due to the defects and the presence of Ti3+ ions, titania becomes an n-type semiconductor with electrons as the majority carriers. When titania is in close contact with graphite, the Fermi energy level (Ef) of graphite is more negative than that of the other semiconductor, so electrons diffuse from titania to graphite, leaving holes, which makes titania positively charged and graphite negatively charged, as shown in Figure 13b. An internal electric field (E) is formed at the contact surface, pointing from the titania to the graphite, and the internal electric field increases with the diffusion of electrons, as shown in Figure 13c. However, the accumulated negative charge in the graphite hinders the further diffusion of electrons, and the electrons drift back to the titania under the influence of the internal electric field. When the Fermi energy level reaches the same level, the diffusion and drift of electrons reach dynamic equilibrium, which stabilizes the internal electric field. Schottky junctions are formed at the contact surfaces of titania and graphite, and the internal electric fields form Schottky barriers. After light irradiation of the semiconductor produces photogenerated electron-hole pairs, the Schottky barrier prevents the electrons from entering the graphite but allows holes to flow into the graphite. In this way, the Schottky junction provides a transfer path for the photogenerated carriers, resulting in a longer lifetime of the photogenerated carriers. Holes and electrons are generated when light irradiates the surface of titania. The holes and electrons are then transferred to the surface of the nanofibers through the pathways formed by the heterojunctions. Holes transferred to the surface react with water to produce hydroxyl radicals, while electrons transferred to the surface react with oxygen in water to produce superoxide radicals. Radicals undergo redox reactions with various organic dyes to achieve degradation using TSC.
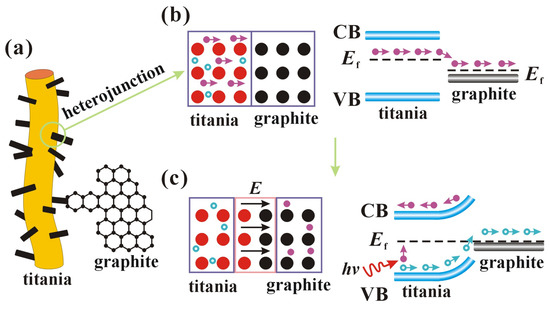
Figure 13.
Schematic diagram of the possible mechanisms of charge movement in a semiconductor heterojunction. (a) nanofiber morphology; (b) charge transfer; (c) internal electric field formation.
4. Conclusions
A novel titania nanofiber small area film photocatalyst with strontium ions and graphite as cocatalysts was successfully synthesized by electrospinning and hydrothermal methods. The composite photocatalysts present excellent photocatalytic efficiency for four organic dyes compared with pure titania. Four recycling tests showed that the composite photocatalysts had excellent recyclability. The synthesized composite nanofiber photocatalysts have the advantages of nanomaterials, such as a significant surface area, multiple reaction sites, and a shorter carrier transport distance, while avoiding the disadvantages of nanomaterials, which are difficult to recycle. The easy sedimentation feature makes the recovery of photocatalysts more cost-saving and convenient, and it also effectively avoids secondary water pollution by photocatalysts. Characterization (XRD, Raman, SEM, TEM, XPS, UV, and FS) showed that the entry of strontium ions and carbon into the photocatalyst lattice changed the crystal size, crystal plane spacing, and appearance of more crystal defects, thus improving the photocatalytic activity. Titania and graphite modified on the surface of nanofiber form a semiconductor heterojunction, which provides a transfer pathway for photogenerated carriers, leading to an improved separation rate and a reduced recombination rate of the photogenerated electron-hole pairs. Moreover, graphite is chemically stable and inexpensive. The photocatalytic efficiency and recyclability of titania are improved by the synergistic effect of multiple strategies such as morphology control, vacancy engineering, heterojunction building, and band gap modulation. These design strategies provide useful guides for enhancing the photocatalytic degradation of organic dyes, which is beneficial for the industrial applications of photocatalytic technology.
Author Contributions
Conceptualization, L.W. and Y.F.; methodology, Y.L.; formal analysis, Y.L.; investigation, J.H.; writing—original draft preparation, Y.L.; writing—review and editing, Y.L. and X.Q.; supervision, L.W. and X.Q.; project administration, Y.L. and L.W. All authors have read and agreed to the published version of the manuscript.
Funding
This research was funded by the Basic Science Research Foundation of Heilongjiang Province, grant number 2021-KYYWF-0570.
Institutional Review Board Statement
Not applicable.
Informed Consent Statement
Not applicable.
Data Availability Statement
Not applicable.
Conflicts of Interest
The authors declare no conflict of interest.
References
- Jia, W.; Shang, Y.; Gong, L.; Chen, X. Synthesis of Al-ZnO and its potential application in photocatalysis and electrochemistry. Inorg. Chem. Commun. 2018, 88, 51–55. [Google Scholar] [CrossRef]
- Kaur, A.; Umar, A.; Anderson, W.A.; Kansal, S.K. Facile synthesis of CdS/TiO2 nanocomposite and their catalytic activity for ofloxacin degradation under visible illumination. J. Photochem. Photobiol. A Chem. 2018, 360, 34–43. [Google Scholar] [CrossRef]
- Al-Musawi, T.J.; Rajiv, P.; Mengelizadeh, N.; Arghavan, F.S.; Balarak, D. Photocatalytic efficiency of CuNiFe2O4 nanoparticles loaded on multi-walled carbon nanotubes as a novel photocatalyst for ampicillin degradation. J. Mol. Liq. 2021, 337, 116470. [Google Scholar] [CrossRef]
- Shimi, A.K.; Parvathiraj, C.; Kumari, S.; Dalal, J.; Kumar, V.; Wabaidurd, S.M.; Alothman, Z.A. Green synthesis of SrO nanoparticles using leaf extract of Albizia julibrissin and its recyclable photocatalytic activity: An eco-friendly approach for treatment of industrial wastewater. Environ. Sci. Adv. 2022, 1, 849–861. [Google Scholar] [CrossRef]
- Mingmongkol, Y.; Trinh, D.T.T.; Phuinthiang, P.; Channei, D.; Ratananikom, K.; Nakaruk, A.; Khanitchaidecha, W. Enhanced Photocatalytic and Photo‘killing Activities of Cu-Doped TiO2 Nanoparticles. Nanomaterials 2022, 12, 1198. [Google Scholar] [CrossRef] [PubMed]
- Kader, S.; Al-Mamun, M.R.; Suhan, M.B.K.; Shuchi, S.B.; Islam, M.S. Enhanced photodegradation of methyl orange dye under UV irradiation using MoO3 and Ag doped TiO2 photocatalysts. Environ. Technol. Innov. 2022, 27, 102476. [Google Scholar] [CrossRef]
- Lee, H.; Jang, H.S.; Kim, N.Y.; Joo, J.B. Cu-doped TiO2 hollow nanostructures for the enhanced photocatalysis under visible light conditions. J. Ind. Eng. Chem. 2021, 99, 352–363. [Google Scholar] [CrossRef]
- Mancuso, A.; Blangetti, N.; Sacco, O.; Freyria, F.S.; Bonelli, B.; Esposito, S.; Sannino, D.; Vaiano, V. Photocatalytic Degradation of Crystal Violet Dye under Visible Light by Fe-Doped TiO2 Prepared by Reverse-Micelle Sol–Gel Method. Nanomaterials 2023, 13, 270. [Google Scholar] [CrossRef]
- Choi, J.; Park, H.; Hoffmann, M.R. Effects of Single Metal-Ion Doping on the Visible-Light Photoreactivity of TiO2. J. Phys. Chem. C 2010, 114, 783–792. [Google Scholar] [CrossRef]
- Shaban, M.; Ashraf, A.M.; Abukhadra, M.R. TiO2 Nanoribbons/Carbon Nanotubes Composite with Enhanced Photocatalytic Activity; Fabrication, Characterization, and Application. Sci. Rep. 2018, 8, 781. [Google Scholar] [CrossRef]
- Chen, Y.; Qian, J.; Wang, N.; Xing, J.; Liu, L. In-situ synthesis of CNT/TiO2 heterojunction nanocomposite and its efficient photocatalytic degradation of Rhodamine B dye. Inorg. Chem. Commun. 2020, 119, 108071. [Google Scholar] [CrossRef]
- Rosales, M.; Zoltan, T.; Yadarola, C.; Mosquera, E.; Gracia, F.; García, A. The influence of the morphology of 1D TiO2 nanostructures on photogeneration of reactive oxygen species and enhanced photocatalytic activity. J. Mol. Liq. 2019, 281, 59–69. [Google Scholar] [CrossRef]
- Rico-Santacruz, M.; García-Muñoz, P.; Keller, V.; Batail, N.; Pham, C.; Robert, D.; Keller, N. Alveolar TiO2-β-SiC photocatalytic composite foams with tunable properties for water treatment. Catal. Today 2019, 328, 235–242. [Google Scholar] [CrossRef]
- Samadi, M.; Moshfegh, A.Z. Recent Developments of Electrospinning-Based Photocatalysts in Degradation of Organic Pollutants: Principles and Strategies. ACS Omega 2022, 7, 45867–45881. [Google Scholar] [CrossRef] [PubMed]
- Hosseini, S.A.; Daneshvar e Asl, S.; Vossoughi, M.; Simchi, A.; Sadrzadeh, M. Green Electrospun Membranes Based on Chitosan/Amino-Functionalized Nanoclay Composite Fibers for Cationic Dye Removal: Synthesis and Kinetic Studies. ACS Omega 2021, 6, 10816–10827. [Google Scholar] [CrossRef] [PubMed]
- Li, X.; Xiong, J.; Xu, Y.; Feng, Z.; Huang, J. Defect-assisted surface modification enhances the visible light photocatalytic performance of g-C3N4@C-TiO2 direct Z-scheme heterojunctions. Chin. J. Catal. 2019, 40, 424–433. [Google Scholar] [CrossRef]
- Al-Asbahi, B.A.; Qaid, S.M.H.; Ghaithan, H.M.; AlSalhi, M.S.; Al dwayyan, A.S. Optical and Structural Properties of CsPbBr3 Perovskite Quantum Dots/PFO polymer composite thin films. J. Colloid Interf. Sci. 2020, 563, 426–434. [Google Scholar]
- Shirpay, A.; Tavakoli, M. The behavior of the active modes of the anatase phase of TiO2 at high temperatures by Raman scattering spectroscopy. Indian J. Phys. 2022, 96, 1673–1681. [Google Scholar] [CrossRef]
- Kompa, A.; Mahesha, M.G.; Kekuda, D.; Rao, K.M. Spectroscopic investigation of defects in spin coated titania based thin films for photocatalytic applications. J. Solid State Chem. 2021, 303, 122488. [Google Scholar] [CrossRef]
- Surekha, G.; Krishnaiah, K.V.; Ravi, N.; Suvarna1, R.P. FTIR, Raman and XRD analysis of graphene oxide films prepared by modified Hummers method. J. Phys. Conf. Ser. 2020, 1495, 012012. [Google Scholar] [CrossRef]
- El-Shazly, A.N.; Hegazy, A.H.; El Shenawy, E.T.; Hamza, M.A.; Allam, N.K. Novel facet-engineered multi-doped TiO2 mesocrystals with unprecedented visible light photocatalytic hydrogen production. Sol. Energ. Mat. Sol. C 2021, 220, 110825. [Google Scholar] [CrossRef]
- Phaltane, S.A.; Vanalakar, S.A.; Bhat, T.S.; Patil, P.S.; Sartale, S.D.; Kadam, L.D. Photocatalytic degradation of methylene blue by hydrothermally synthesized CZTS nanoparticles. J. Mater. Sci-Mater. El. 2017, 28, 8186–8191. [Google Scholar] [CrossRef]
- Hamad, H.; Elsenety, M.M.; Sadik, W.; El-Demerdash, A.G.; Nashed, A.; Mostafa, A.; Elyamny, S. The superior photocatalytic performance and DFT insights of S-scheme CuO@TiO2 heterojunction composites for simultaneous degradation of organics. Sci. Rep. 2022, 12, 2217. [Google Scholar] [CrossRef]
- Oh, S.; Ha, H.; Choi, H.; Jo, C.; Cho, J.; Choi, H.; Ryoo, R.; Kim, H.Y.; Park, J.Y. Oxygen activation on the interface between Pt nanoparticles and mesoporous defective TiO2 during CO oxidation. J. Chem. Phys. 2019, 151, 234716. [Google Scholar] [CrossRef] [PubMed]
- Motola, M.; Čaplovičová, M.; Krbal, M.; Sopha, H.; Thirunavukkarasu, G.K.; Gregor, M.; Plesch, G.; Macak, J.M. Ti3+ doped anodic single-wall TiO2 nanotubes as highly efficient photocatalyst. Electrochim. Acta 2020, 331, 135374. [Google Scholar] [CrossRef]
- Xiong, L.B.; Li, J.L.; Yang, B.; Yu, Y. Ti3+ in the Surface of Titanium Dioxide: Generation, Properties and Photocatalytic Application. J. Nanomater. 2012, 2012, 831524. [Google Scholar] [CrossRef]
- Yao, S.; Ma, Y.; Xu, T.; Wang, Z.; Lv, P.; Zheng, J.; Ma, C.; Yu, K.; Wei, W.; Ostrikov, K.K. Ti-C bonds reinforced TiO2@C nanocomposite Na-ion battery electrodes by fluidized-bed plasma-enhanced chemical vapor deposition. Carbon 2021, 171, 524–531. [Google Scholar] [CrossRef]
- Wang, G.; Wang, F.; Liu, S.; Li, M.; Xie, M.; Yang, Z.; Xiang, Y.; Lv, S.; Han, W. Construction of heterojuncted photocatalyst with TiO2 quantum dots and graphene oxide nanosheets for highly efficient photocatalysis. Scr. Mater. 2021, 199, 113862. [Google Scholar] [CrossRef]
- Xing, M.; Shen, F.; Qiu, B.; Zhang, J. Highly-dispersed Boron-doped Graphene Nanosheets Loaded with TiO2 Nanoparticles for Enhancing CO2 Photoreduction. Sci. Rep. 2014, 4, 6341. [Google Scholar] [CrossRef]
- Chen, L.; Yang, S.; Zhang, Q.; Zhu, J.; Zhao, P. Rational design of {001}-faceted TiO2 nanosheet arrays/graphene foam with superior charge transfer interfaces for efficient photocatalytic degradation of toxic pollutants. Sep. Purif. Technol. 2021, 265, 118444. [Google Scholar] [CrossRef]
- Sadi, A.B.; Bilali, R.K.A.; Abubshait, S.A.; Kochkar, H. Low temperature design of titanium dioxide anatase materials decorated with cyanuric acid for formic acid photodegradation. J. Saudi Chem. Soc. 2020, 24, 351–363. [Google Scholar] [CrossRef]
- Nabi, G.; Raza, W.; Tahir, M.B. Green Synthesis of TiO2 Nanoparticle Using Cinnamon Powder Extract and the Study of Optical Properties. J. Inorg. Organomet. Polym. Mater. 2020, 30, 1425–1429. [Google Scholar] [CrossRef]
- Komaraiah, D.; Radha, E.; Kalarikkal, N.; Sivakumar, J.; Reddy, M.V.R.; Sayanna, R. Structural, optical and photoluminescence studies of sol-gel synthesized pure and iron doped TiO2 photocatalysts. Ceram. Int. 2019, 45, 25060–25068. [Google Scholar] [CrossRef]
- Kumaravel, V.; Rhatigan, S.; Mathew, S.; Michel, M.C.; Bartlett, J.; Nolan, M.; Hinder, S.J.; Gascó, A.; Ruiz-Palomar, C.; Hermosilla, D.; et al. Mo doped TiO2: Impact on oxygen vacancies, anatase phase stability and photocatalytic activity. J. Phys. Mater. 2020, 3, 025008. [Google Scholar] [CrossRef]
- Bhardwaj, S.; Pal, B. Effect of variable oxidation states of Mn+n ion impregnated TiO2 nanocomposites for superior adsorption and photoactivity under visible light. J. Alloys Compd. 2020, 816, 152639. [Google Scholar] [CrossRef]
- Ethiraj, A.S.; Rhen, D.S.; Soldatov, A.V.; Ali, G.A.M.; Bakr, Z.H. Efficient and Recyclable Cu Incorporated TiO2 Nanoparticle Catalyst for Organic Dye Photodegradation. Int. J. Thin. Film Sci. 2021, 10, 169–182. [Google Scholar]
- El-Shafai, N.M.; El-Khouly, M.E.; El-Kemary, M.; Ramadan, M.S.; Masoud, M.S. Graphene oxide-metal oxide nanocomposites: Fabrication, characterization and removal of cationic rhodamine B dye. RSC Adv. 2018, 8, 13323. [Google Scholar] [CrossRef]
- El Amri, A.; Kadiri, L.; Hsissou, R.; Lebkiri, A.; Wardighi, Z.; Rifi, E.H.; Lebkiri, A. Investigation of Typha Latifolia (TL) as potential biosorbent for removal of the methyl orange anionic dye in the aqueous solution. Kinetic and DFT approaches. J. Mol. Struct. 2023, 1272, 134098. [Google Scholar] [CrossRef]
- Sun, X.; Kurokawa, T.; Suzuki, M.; Takagi, M.; Kawase, Y. Removal of cationic dye methylene blue by zero-valent iron: Effects of pH and dissolved oxygen on removal mechanisms. J. Environ. Sci. Health A 2015, 50, 1057–1071. [Google Scholar] [CrossRef]
- Chanajaree, R.; Sriuttha, M.; Lee, V.S.; Wittayanarakul, K. Thermodynamics and kinetics of cationic/anionic dyes adsorption on cross-linked chitosan. J. Mol. Liq. 2021, 322, 114507. [Google Scholar] [CrossRef]
- Kadian, N.; Kumari, R.; Panchal, A.; Dalal, J.; Padalia, D. Structural and optical properties of gadolinium doped-magnetite nano-crystal for photocatalytic application. J. Alloys Compd. 2023, 960, 170811. [Google Scholar] [CrossRef]
- Hafeez, H.Y.; Lakhera, S.K.; Narayanan, N.; Harish, S.; Hayakawa, Y.; Lee, B.K.; Neppolian, B. Environmentally Sustainable Synthesis of a CoFe2O4−TiO2/rGO Ternary Photocatalyst: A Highly Efficient and Stable Photocatalyst for High Production of Hydrogen (Solar Fuel). ACS Omega 2019, 4, 880–891. [Google Scholar] [CrossRef] [PubMed]
- Dong, A.; Tian, J.; Yang, Y.; Sang, Y.; Liu, H.; Gai, G. Fast Charge Transportation and Enhanced Photocatalytic and Photo-Electrochemical Performance of 3D Hierarchical TiO2 Nano-Whisker/Graphite Fiber Heterostructure. Sci. Adv. Mater. 2015, 7, 319–328. [Google Scholar] [CrossRef]


Disclaimer/Publisher’s Note: The statements, opinions and data contained in all publications are solely those of the individual author(s) and contributor(s) and not of MDPI and/or the editor(s). MDPI and/or the editor(s) disclaim responsibility for any injury to people or property resulting from any ideas, methods, instructions or products referred to in the content. |
© 2023 by the authors. Licensee MDPI, Basel, Switzerland. This article is an open access article distributed under the terms and conditions of the Creative Commons Attribution (CC BY) license (https://creativecommons.org/licenses/by/4.0/).