


Preparation and Properties of Textured Ni–W Coatings Electrodeposited on the Steel Surface from a Pyrophosphate Bath

Abstract
:1. Introduction
2. Experimental Procedure
2.1. Preparation of Ni-W Alloy Coatings
2.2. Characterization of Ni–W Coatings
3. Results and Discussion
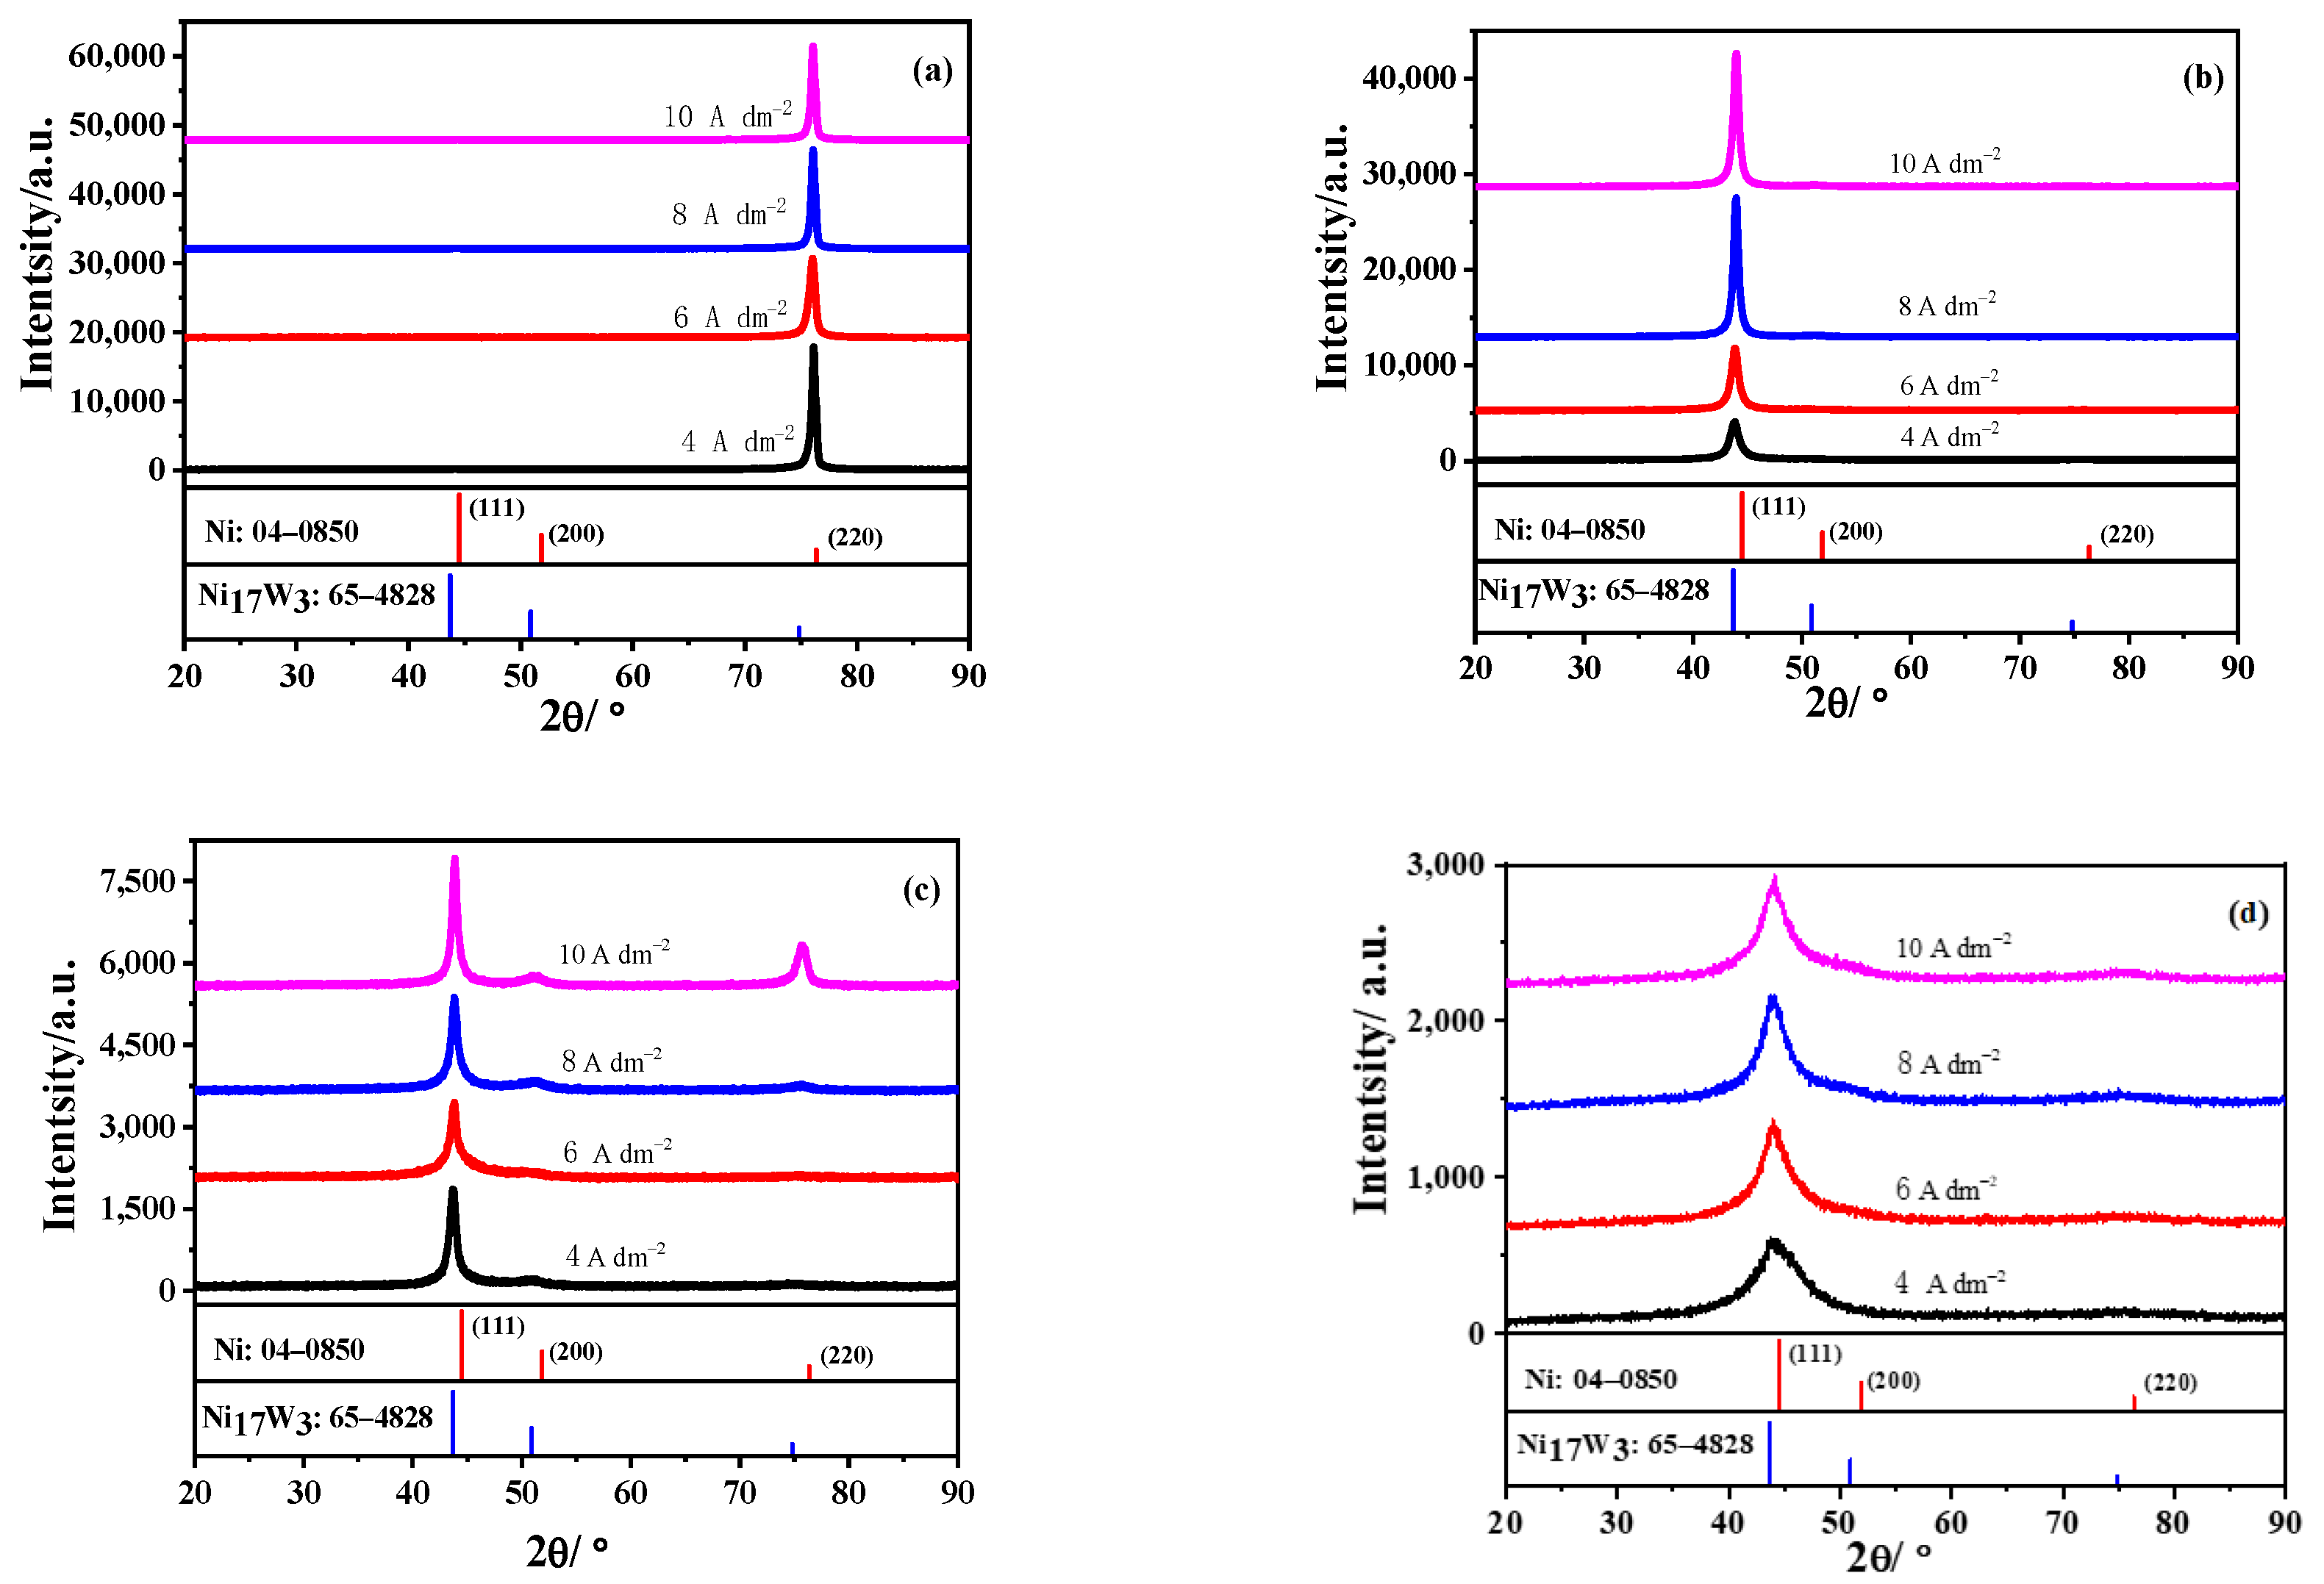
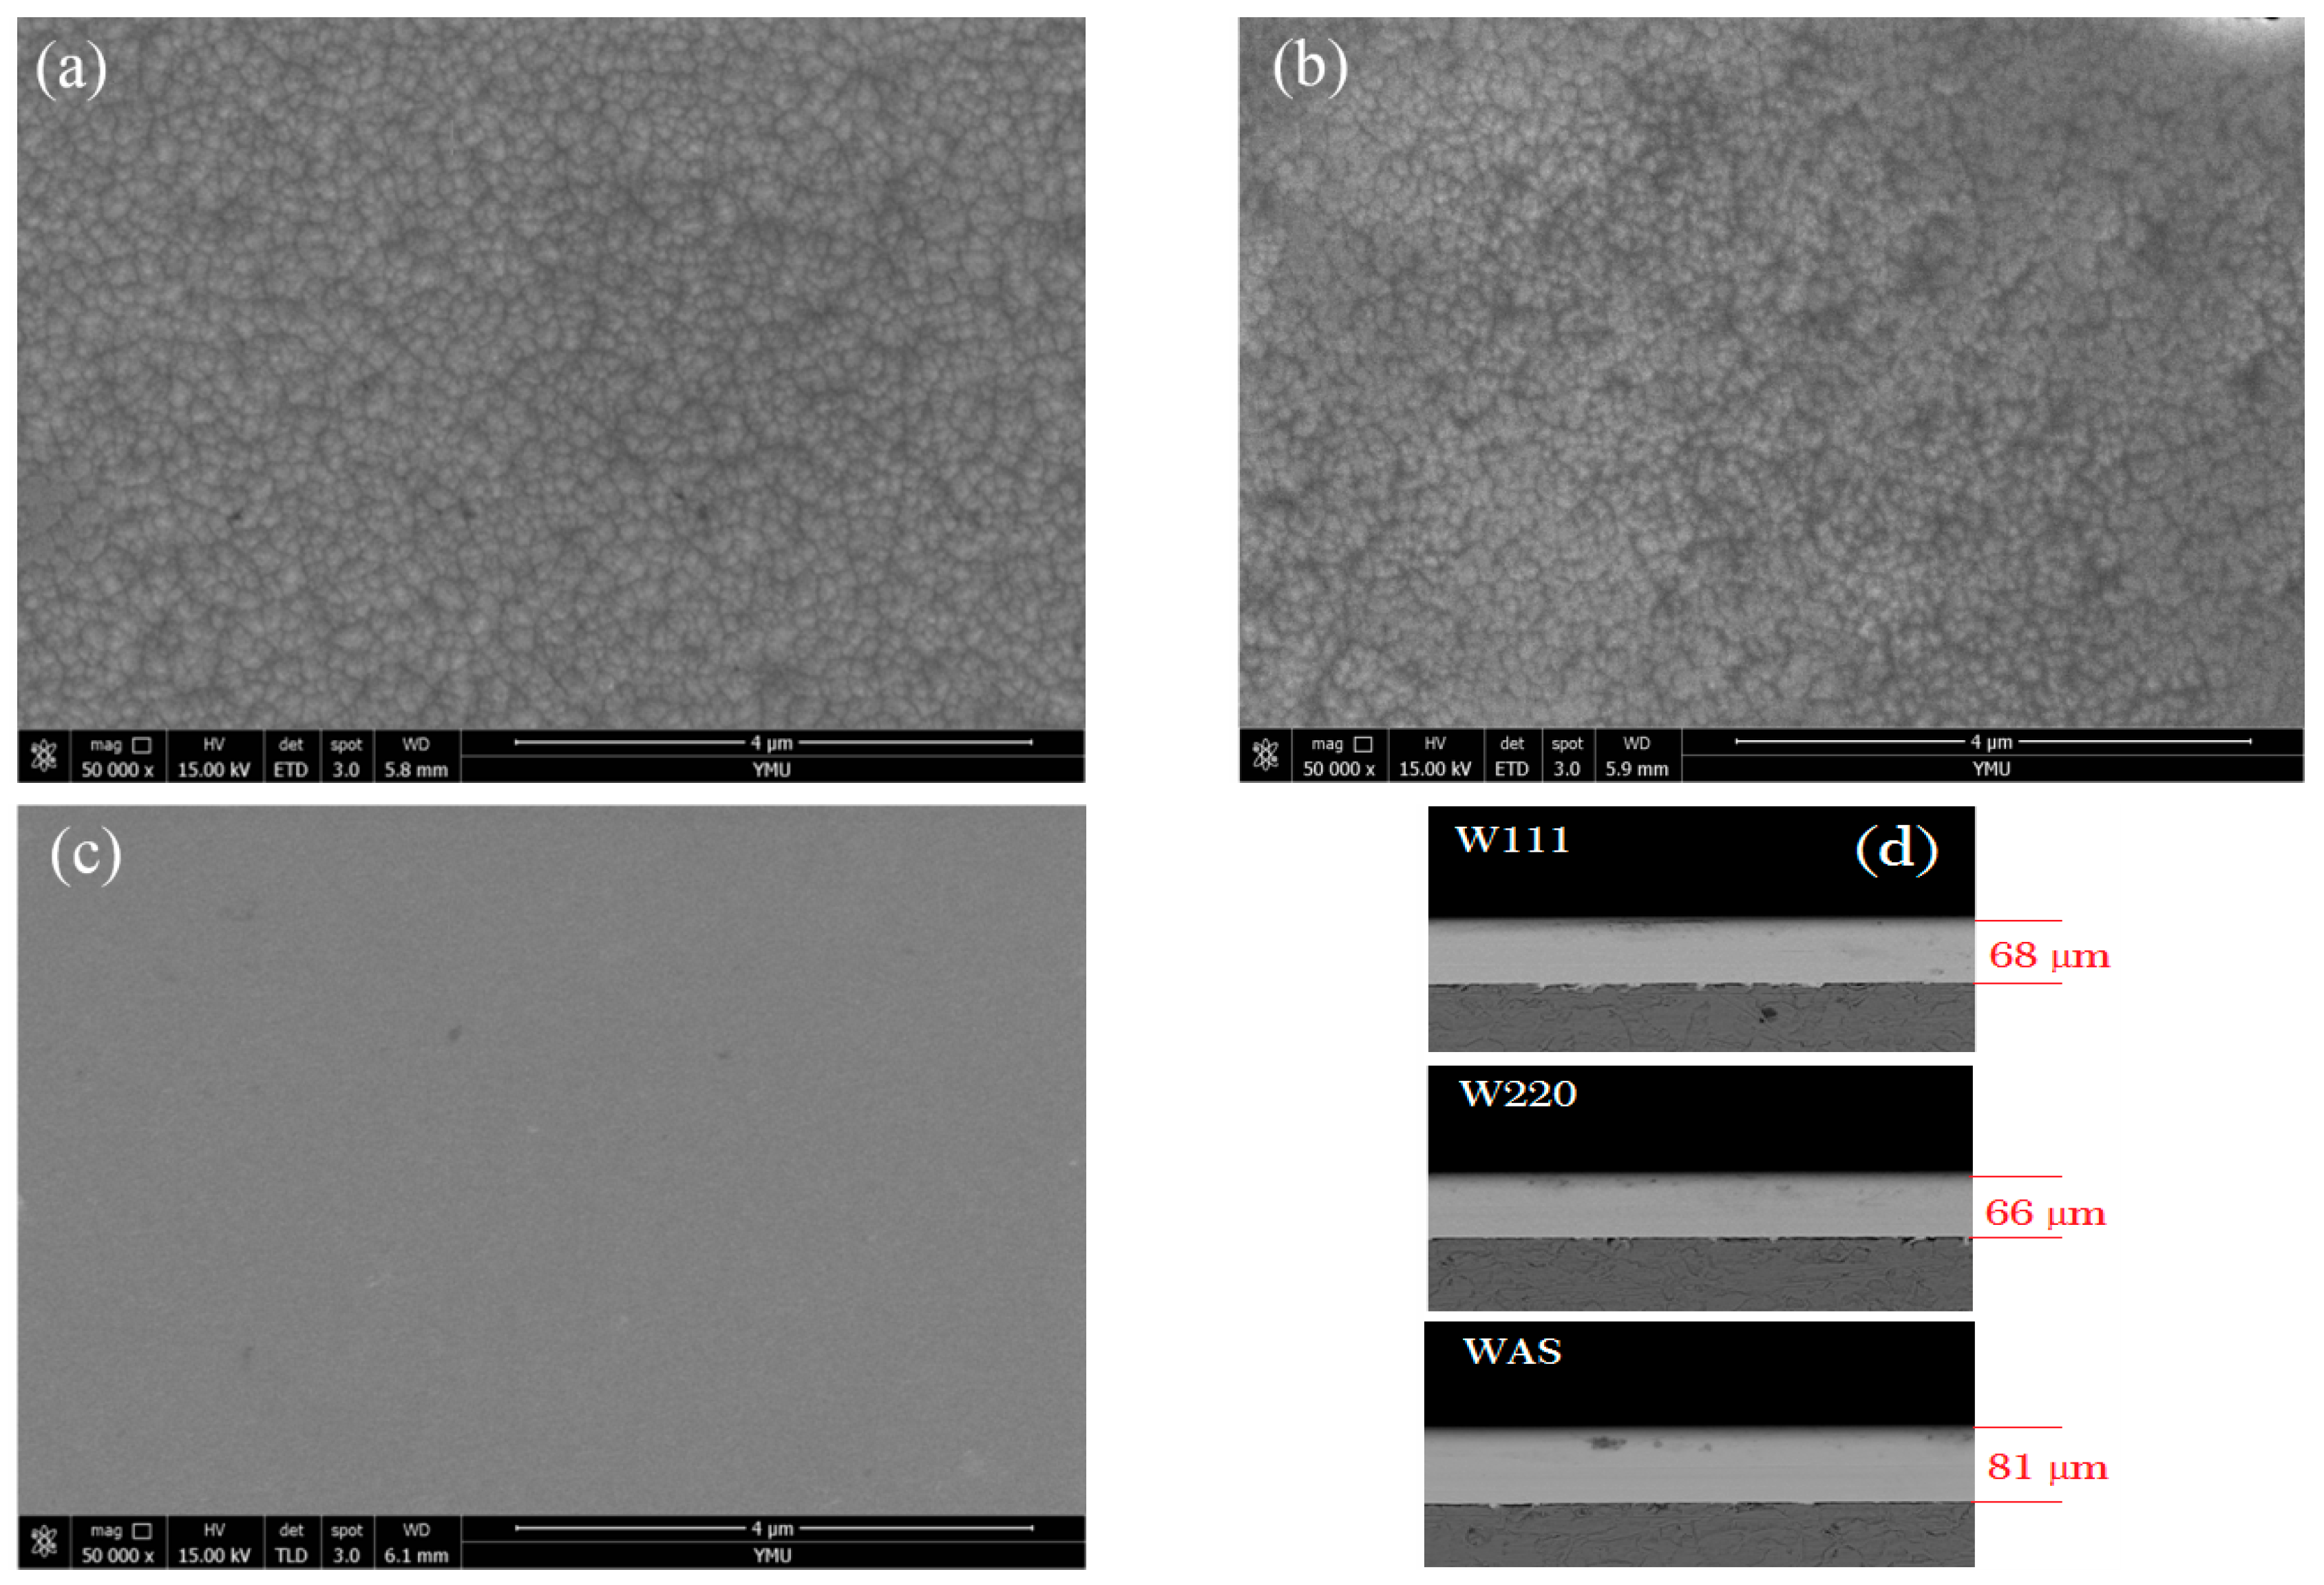
3.1. Structure of Three-Textured Ni–W Alloy Coatings
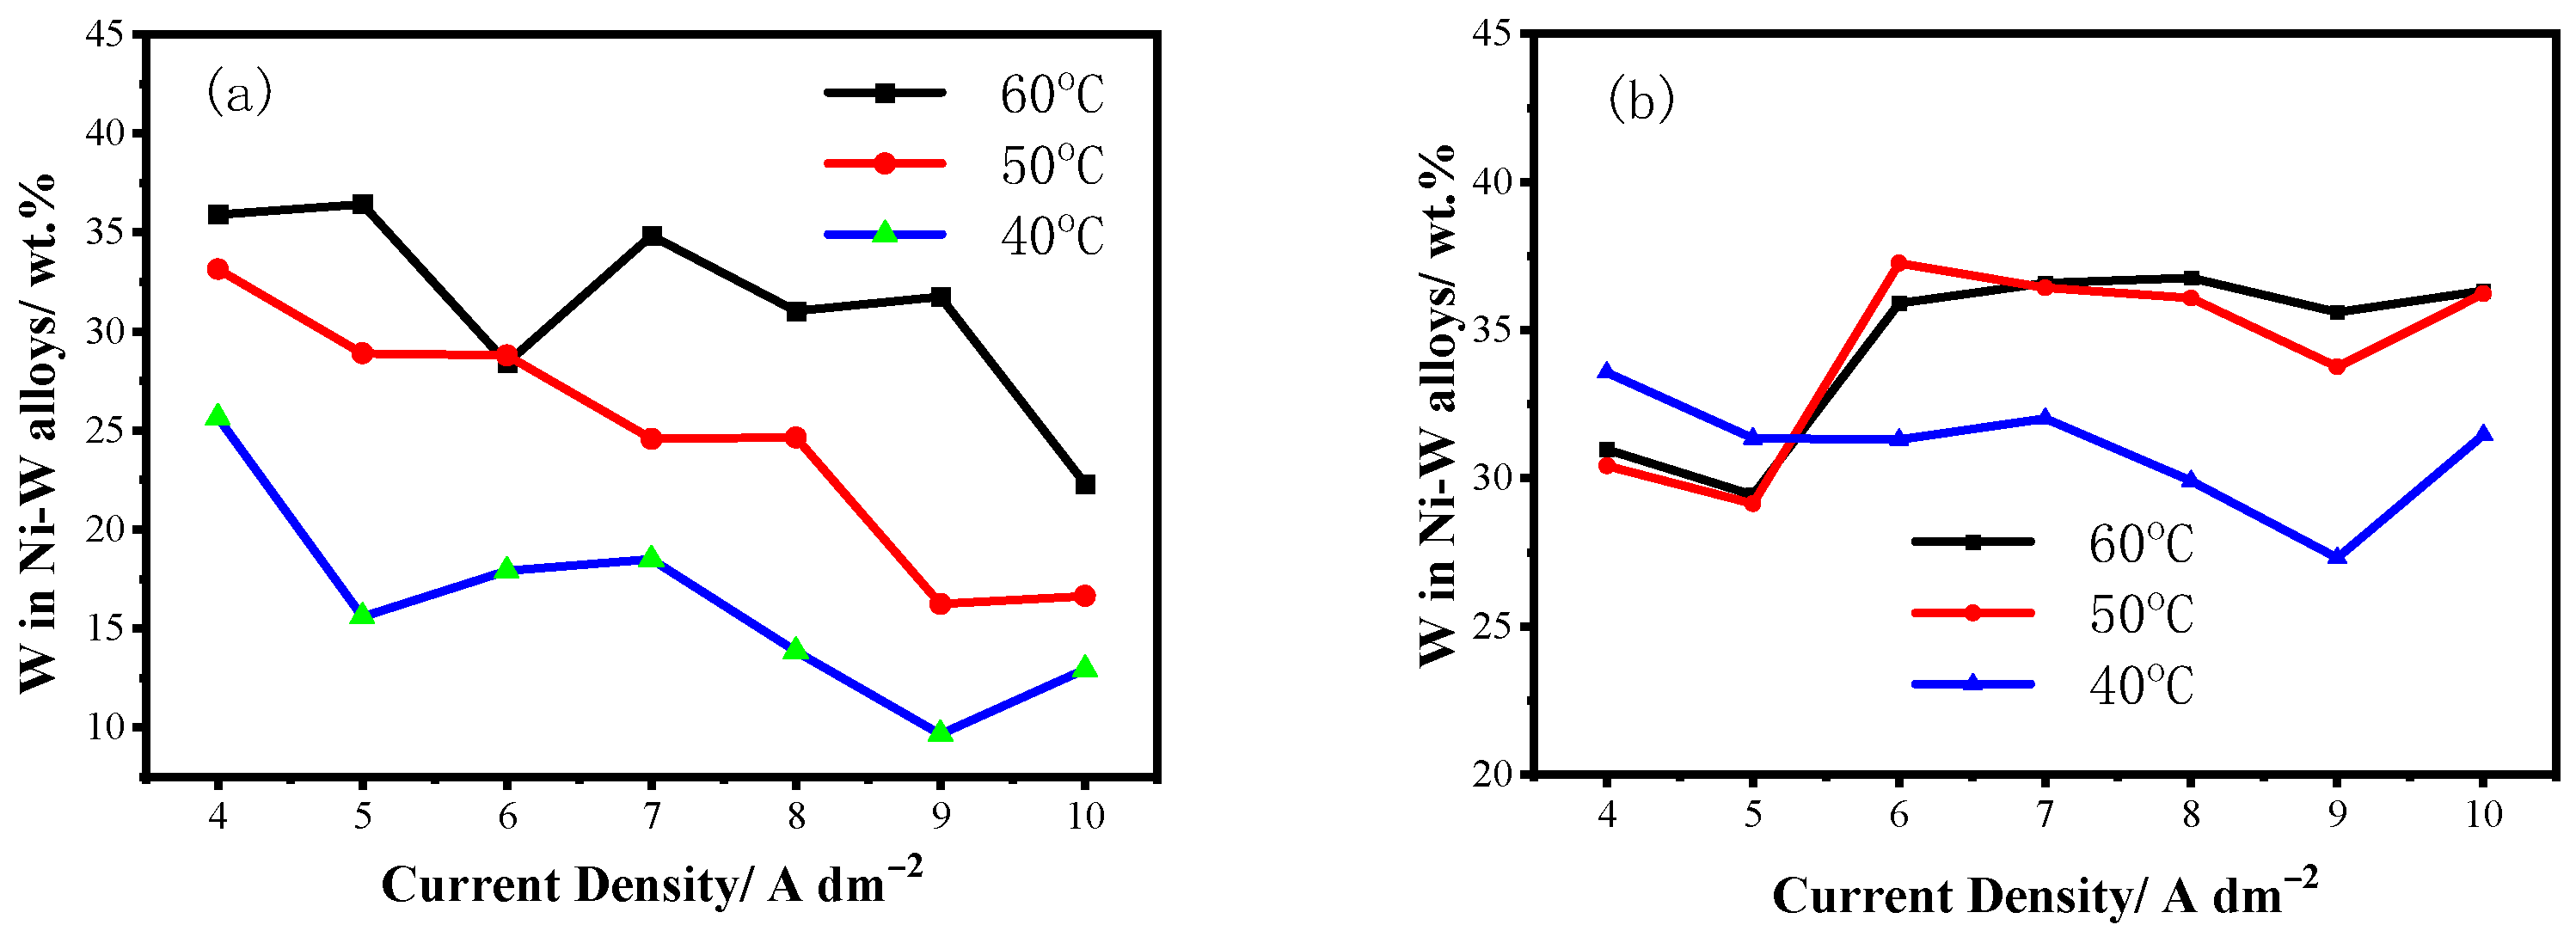
3.1.1. As-Deposited Ni–W Alloy Coatings
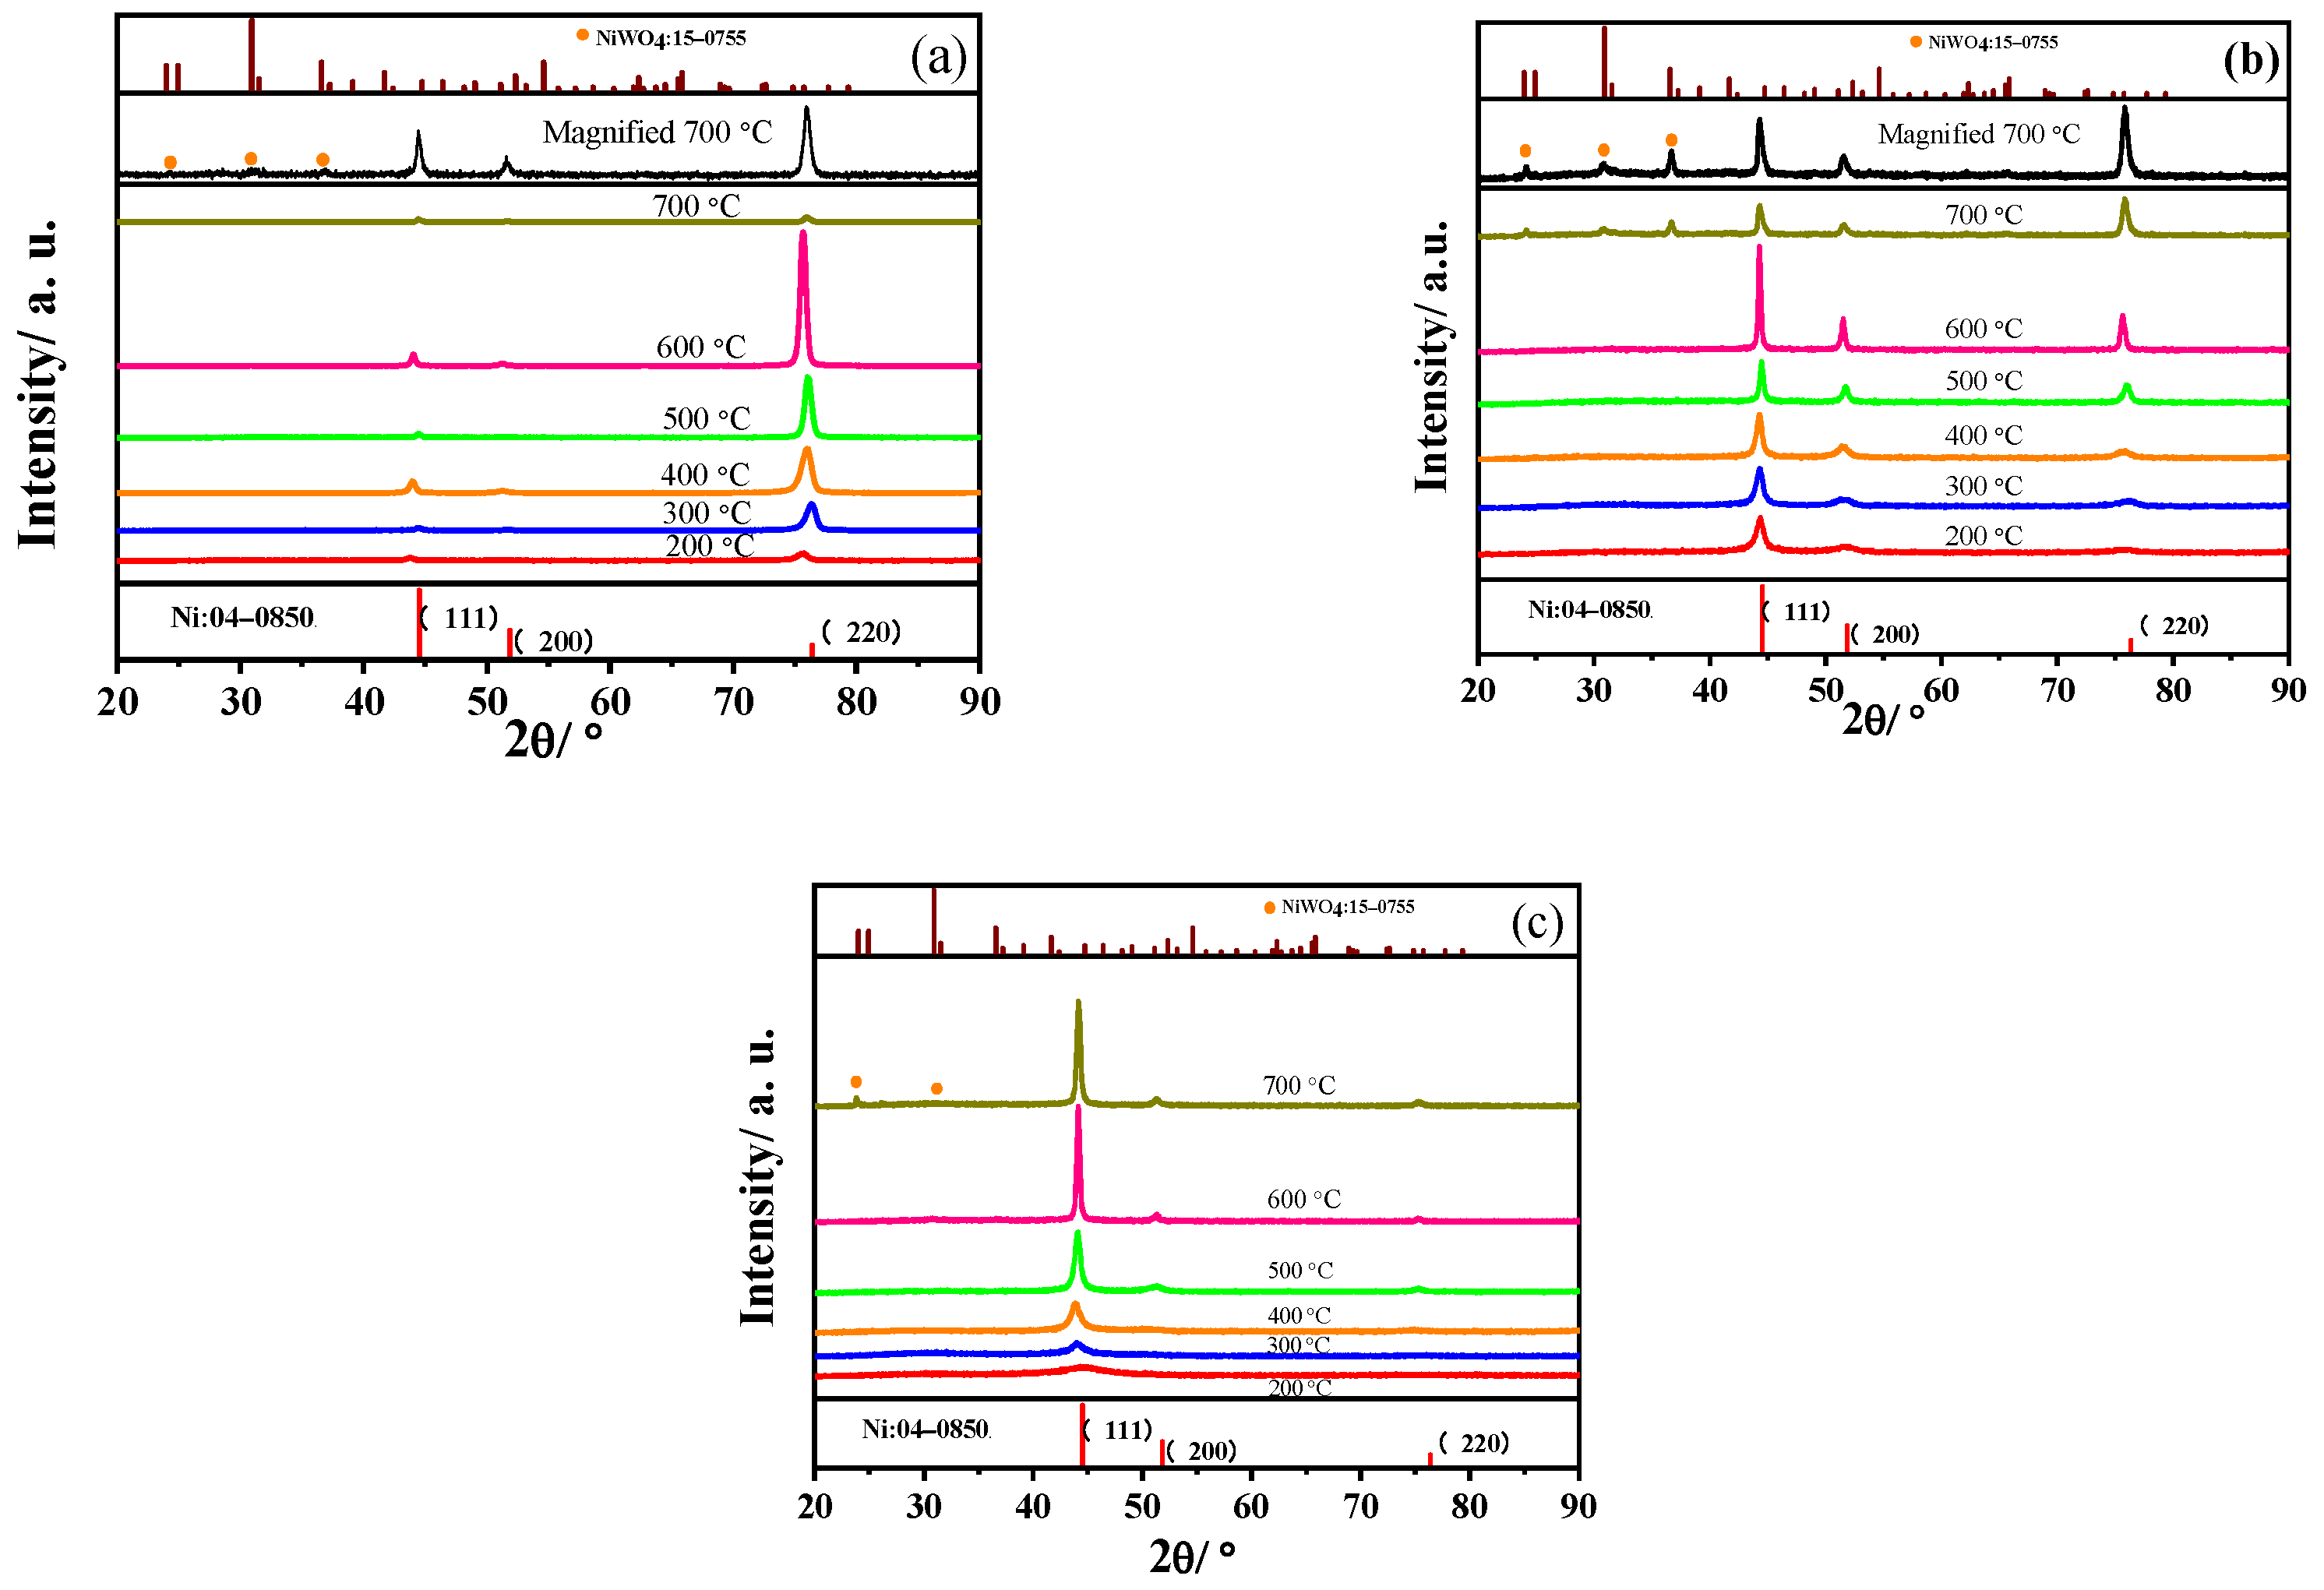
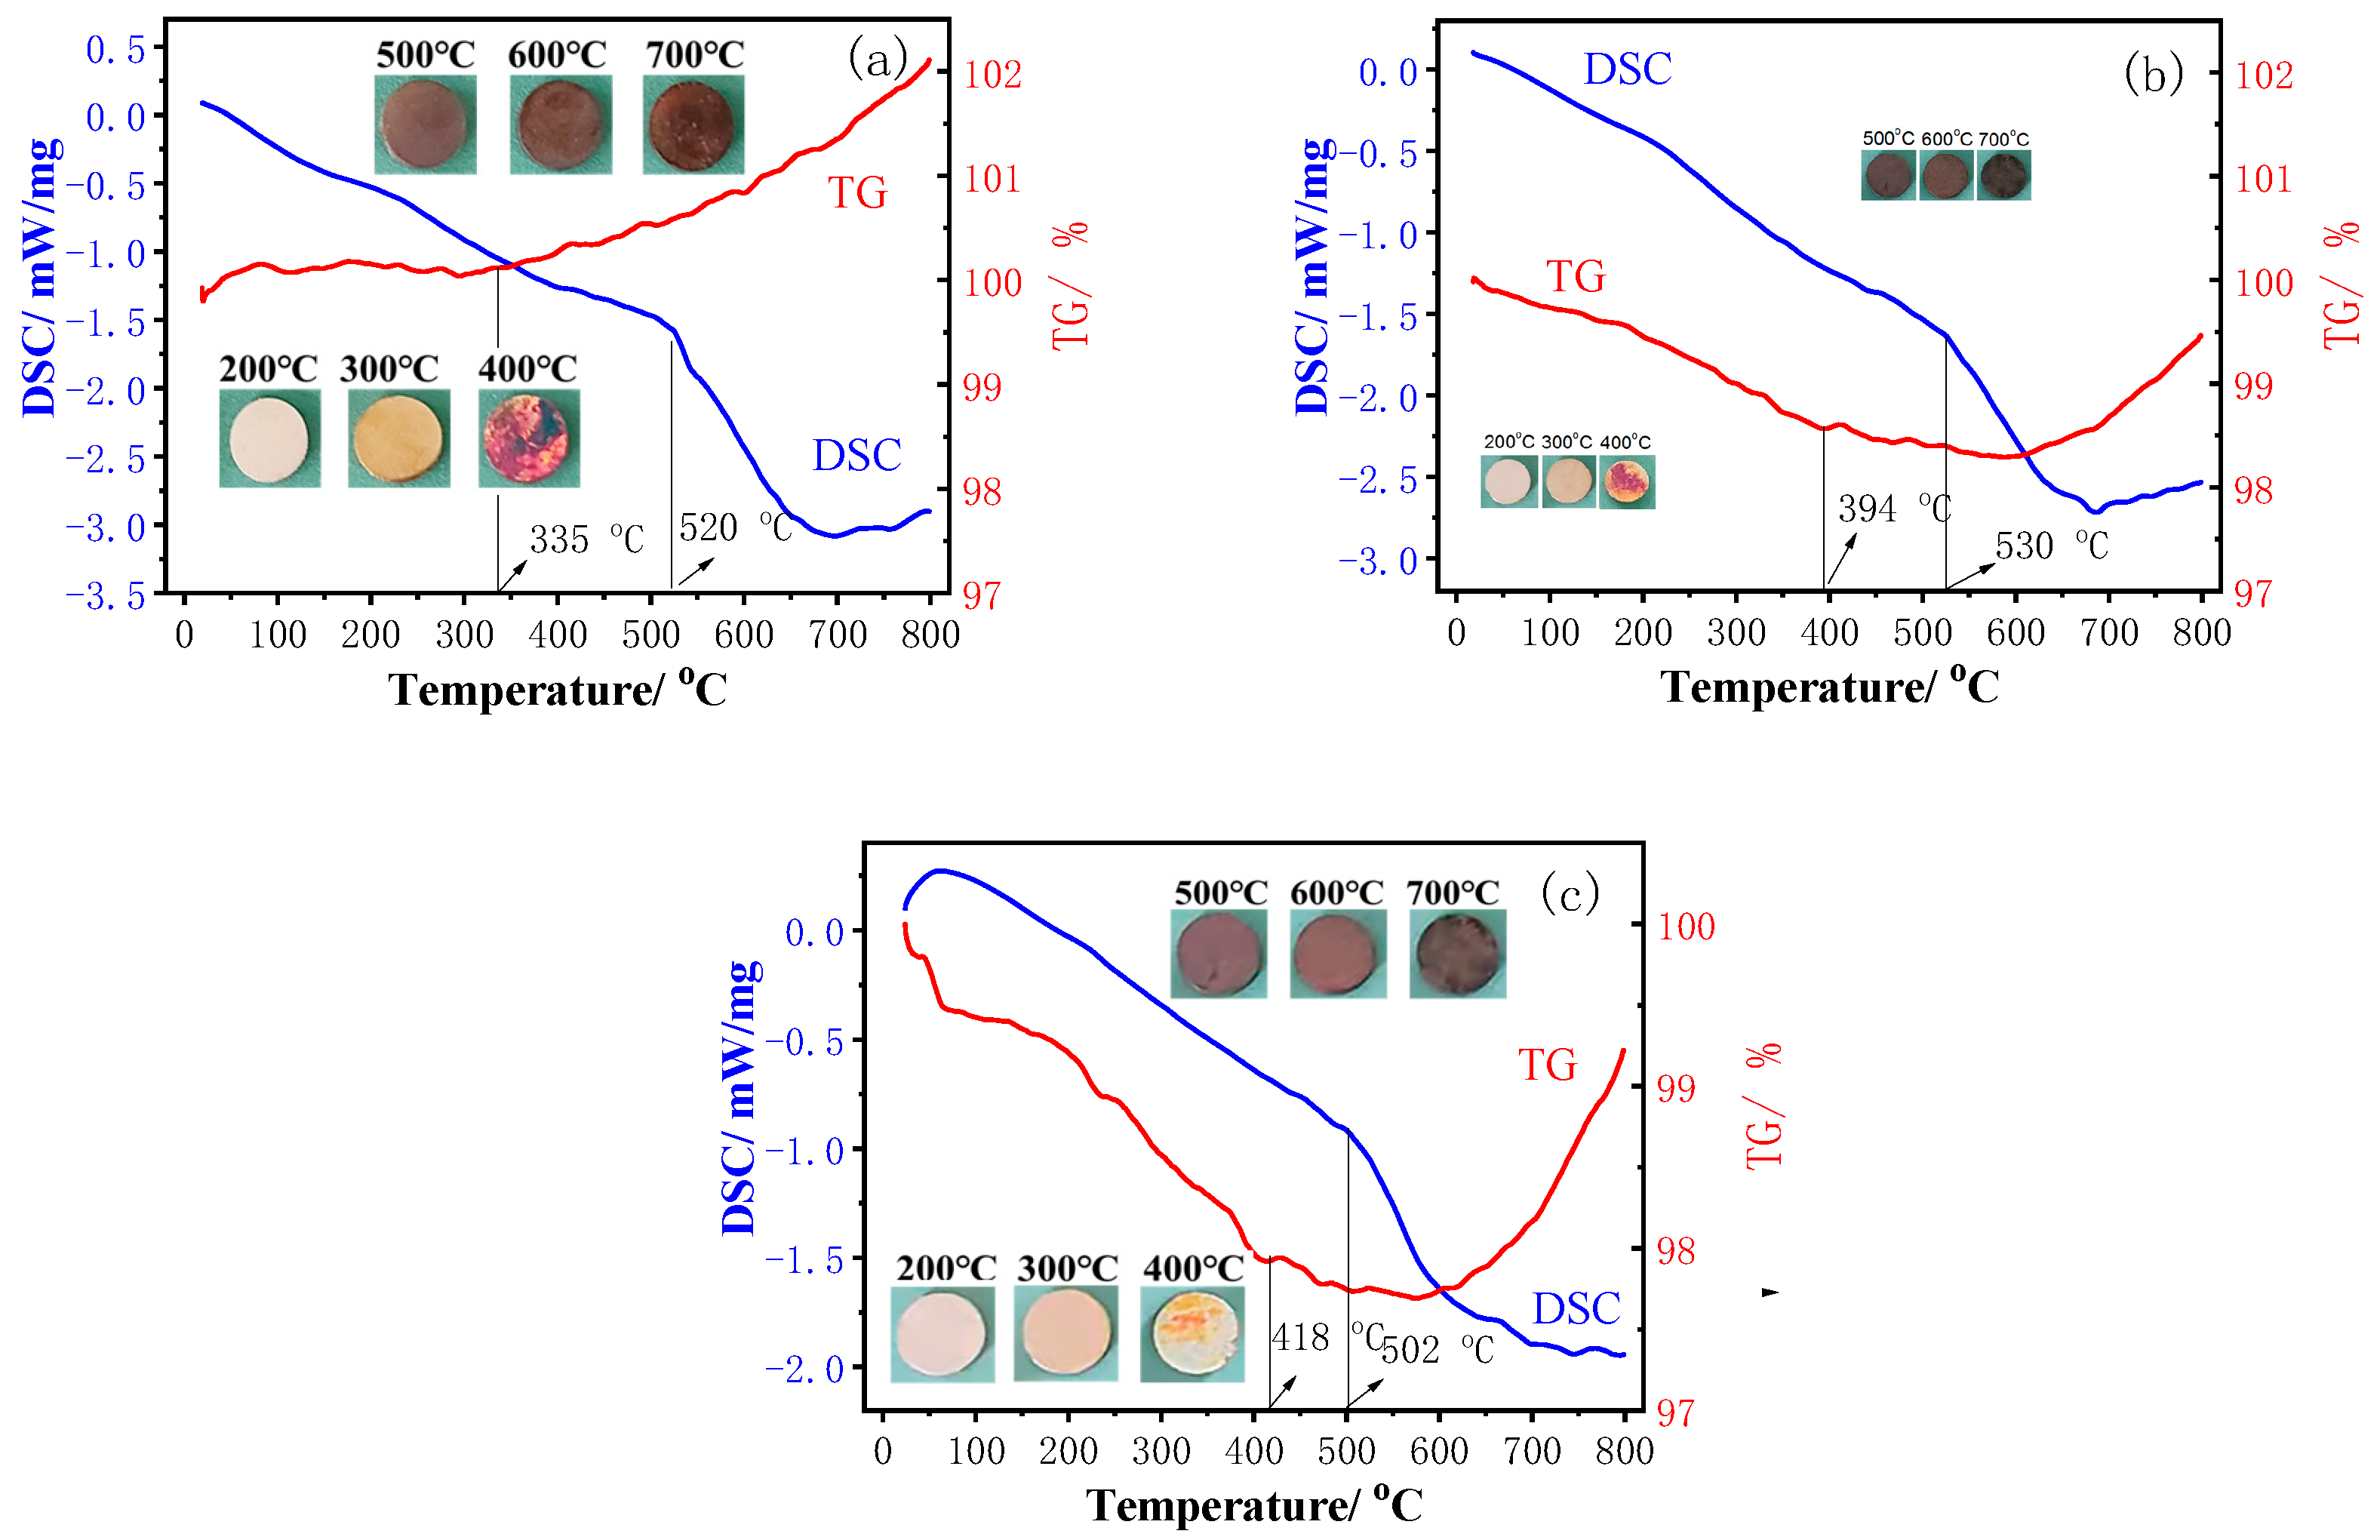
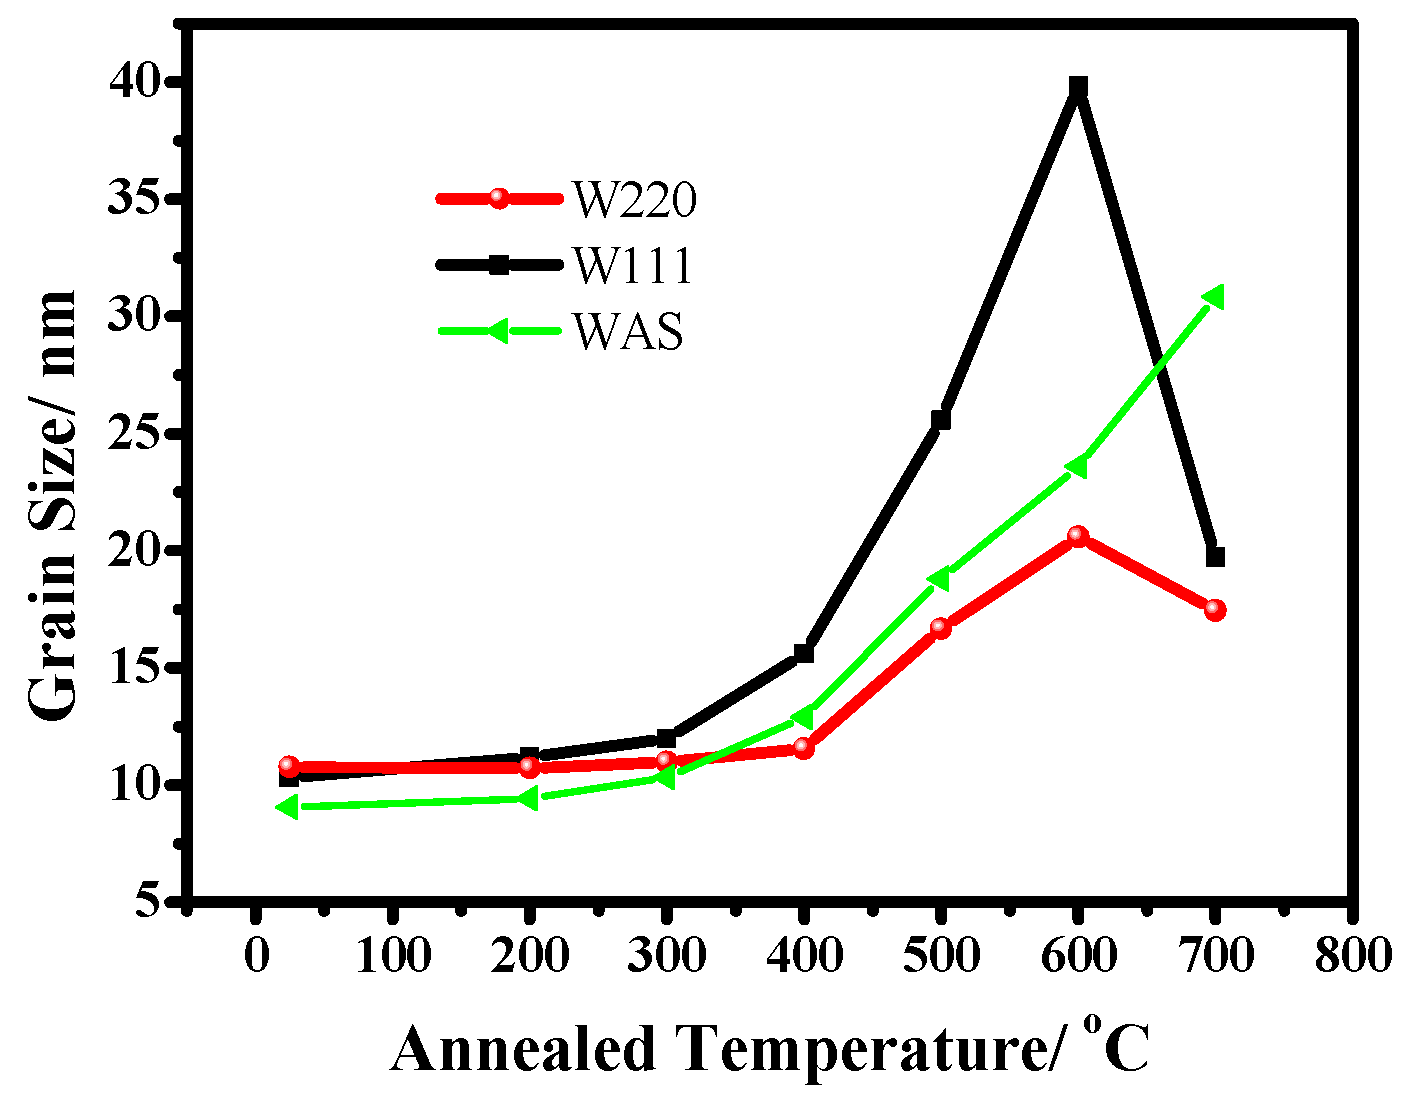
3.1.2. Annealed Ni–W Alloy Coatings
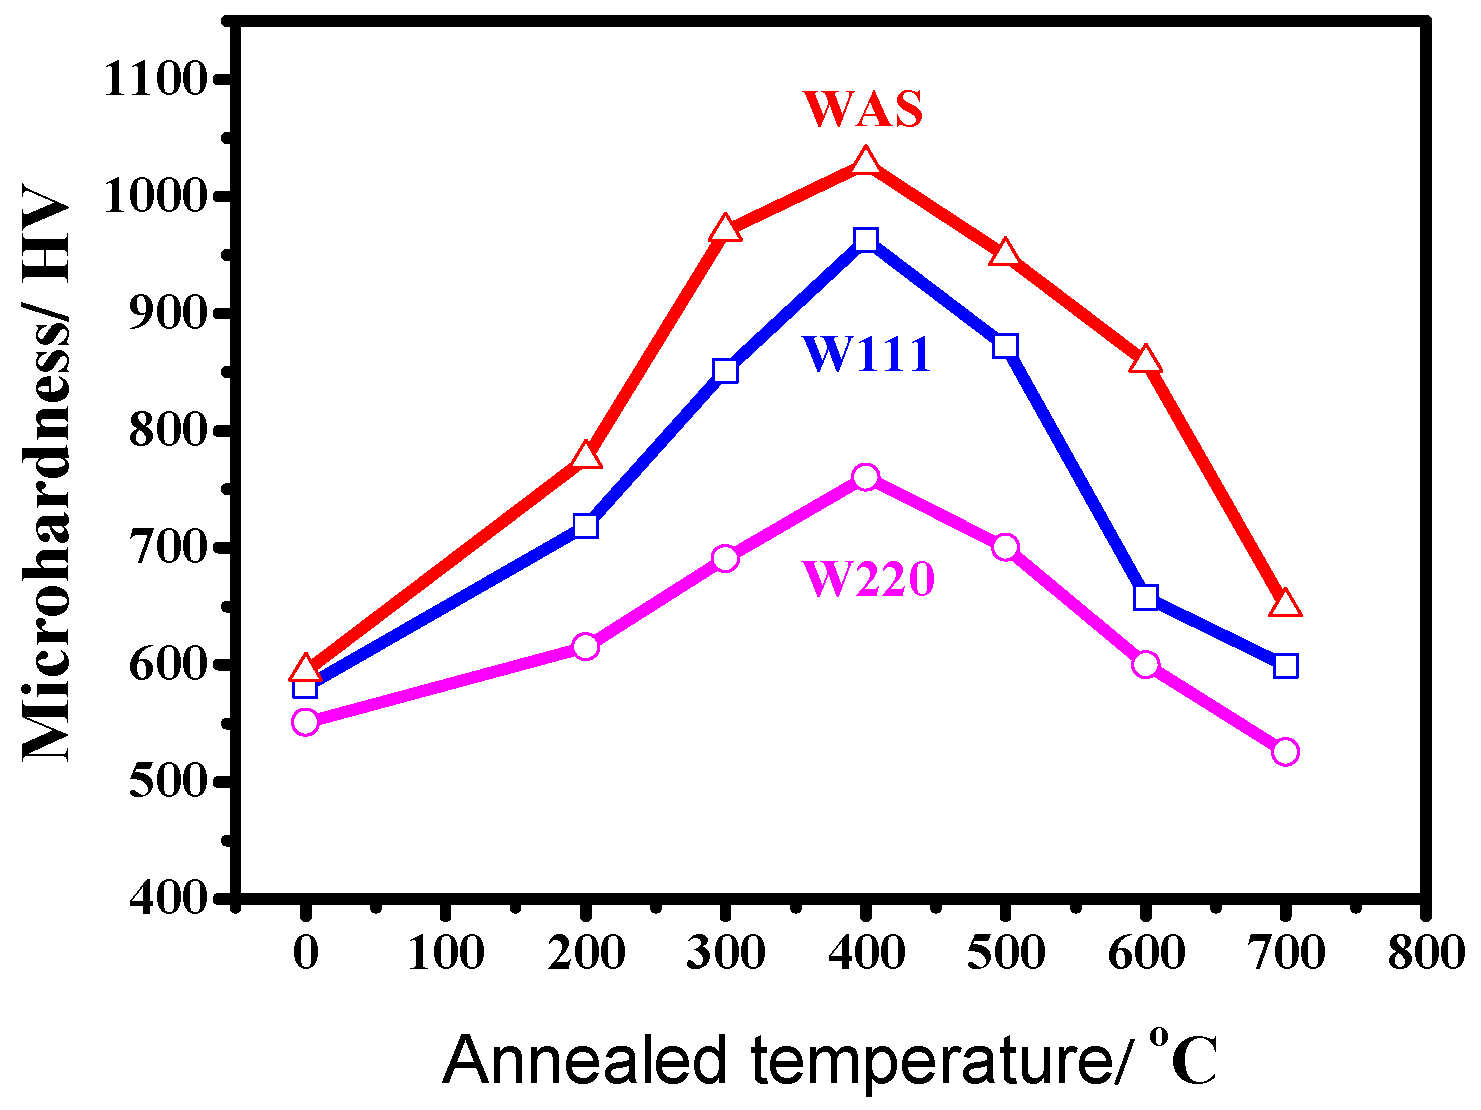
3.2. Microhardness
3.3. Corrosion Resistance
3.3.1. Tafel Curves
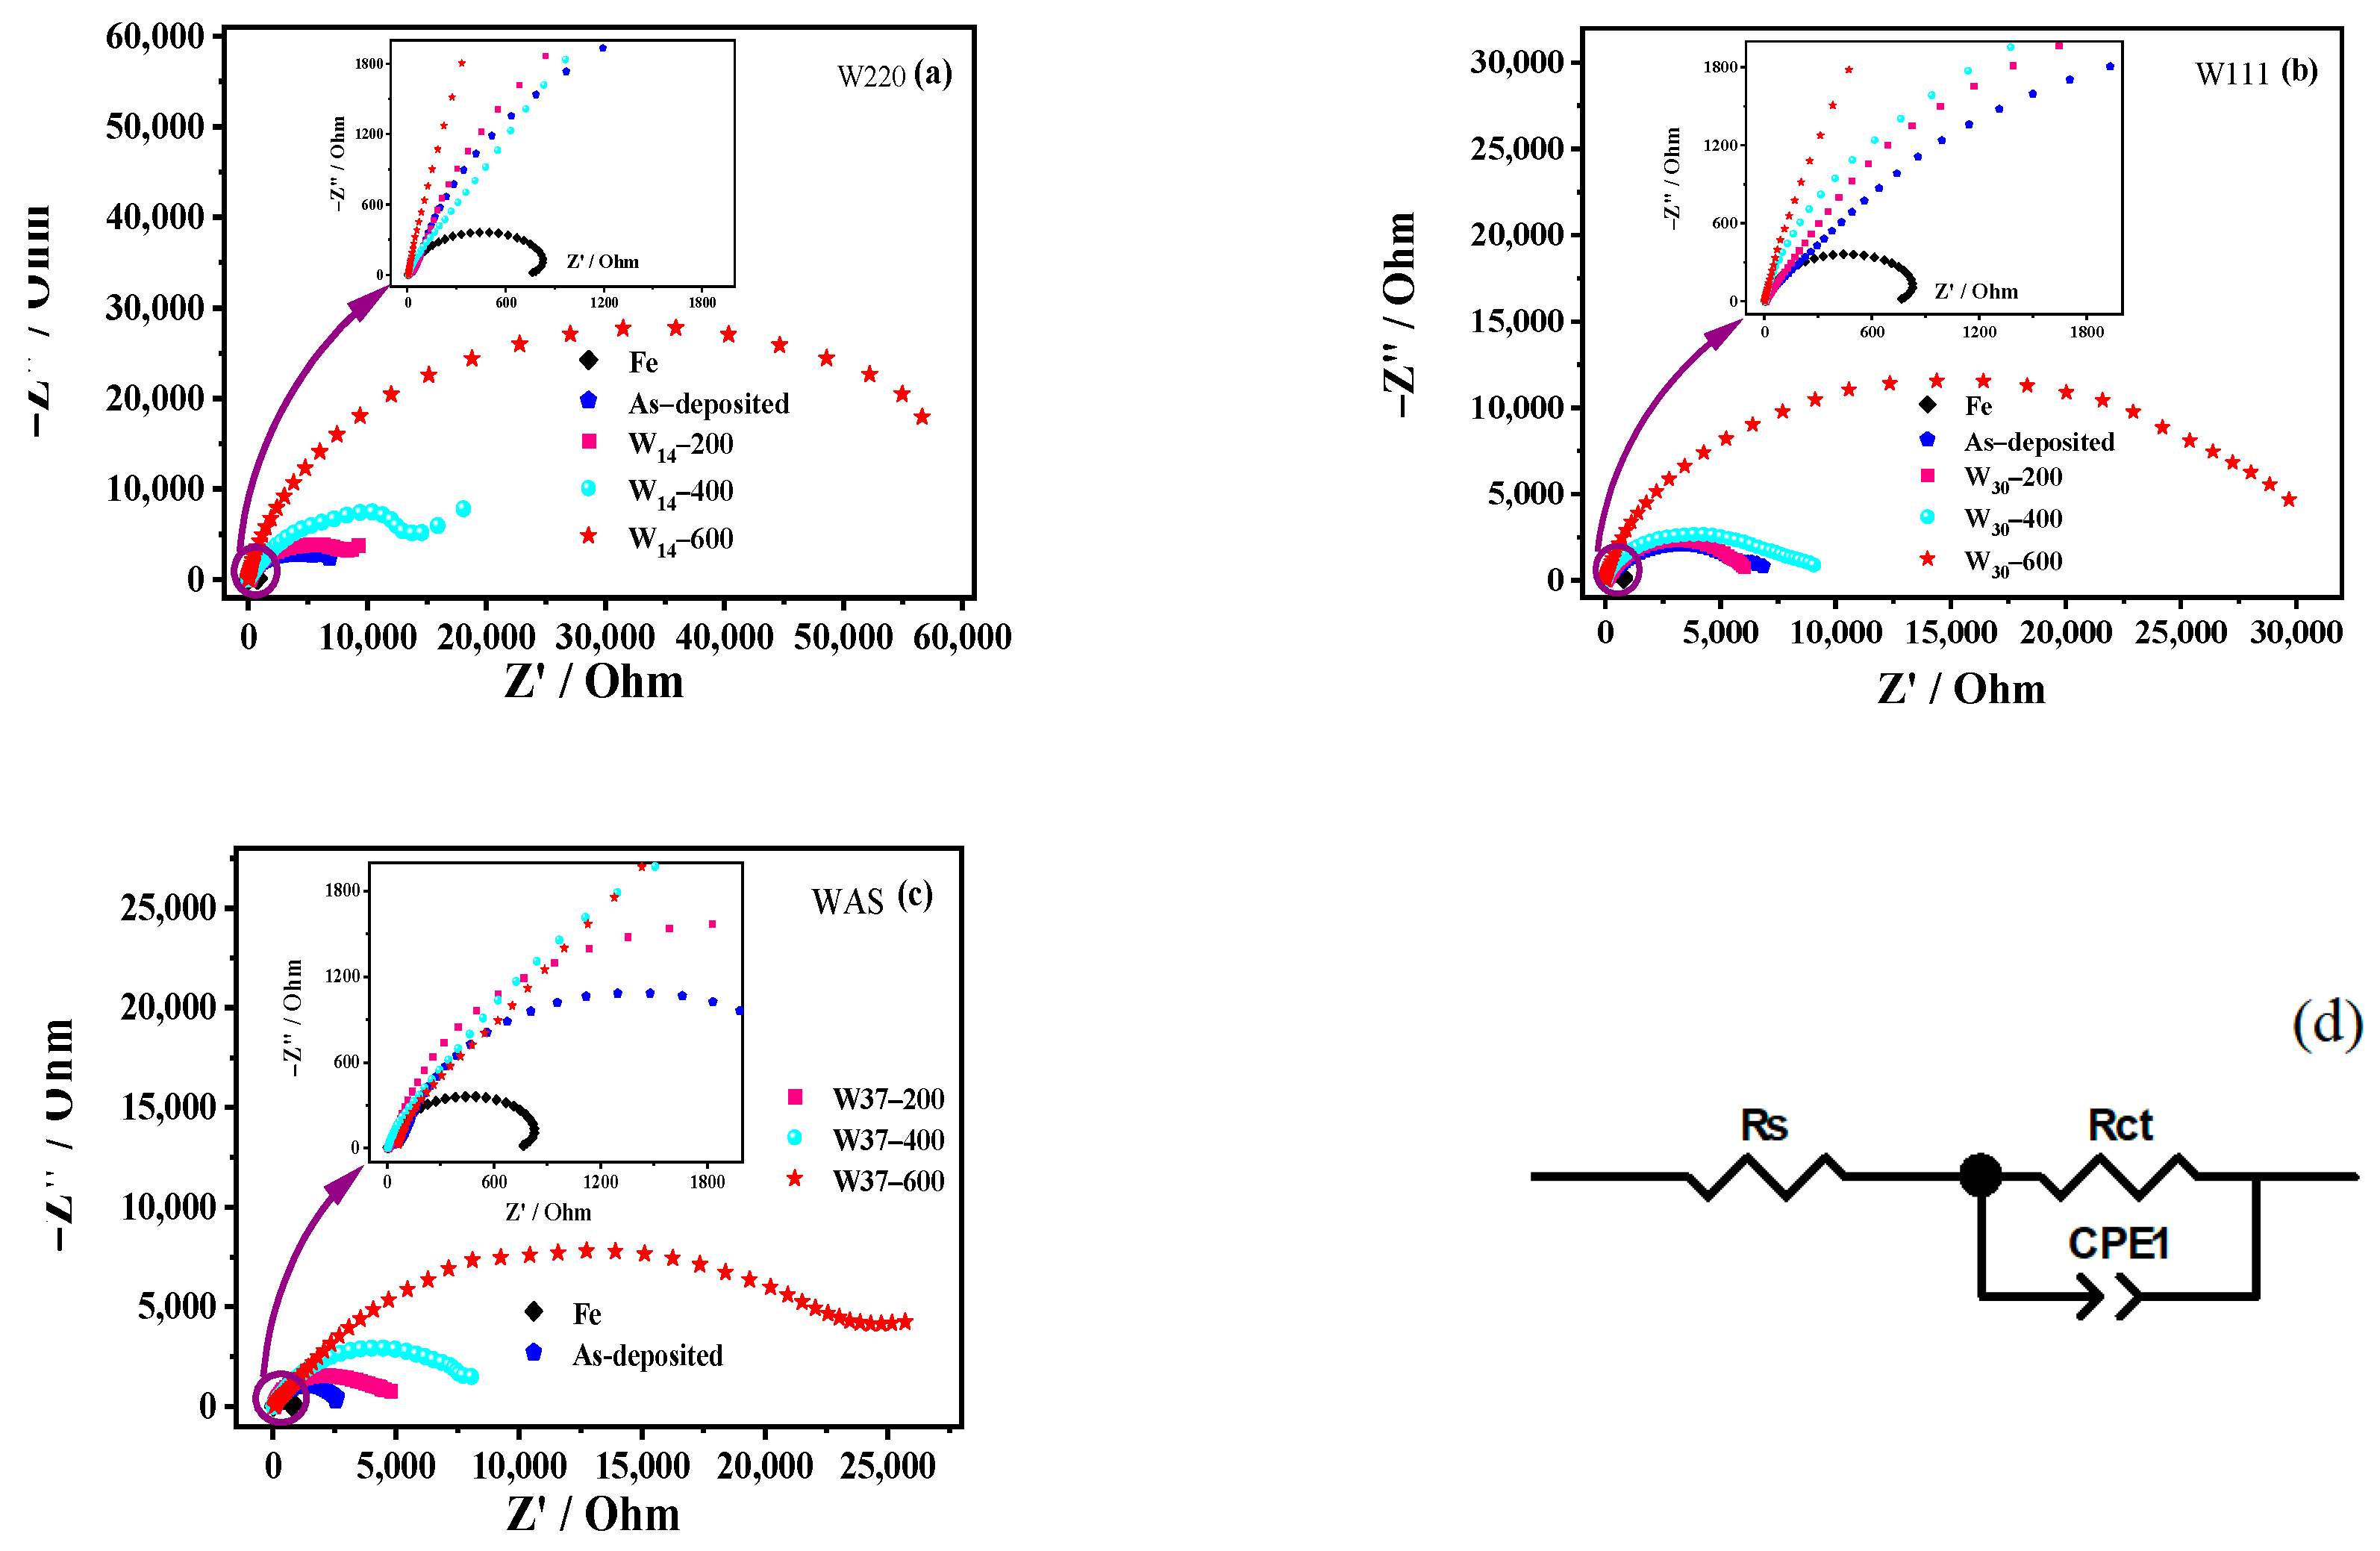
3.3.2. EIS
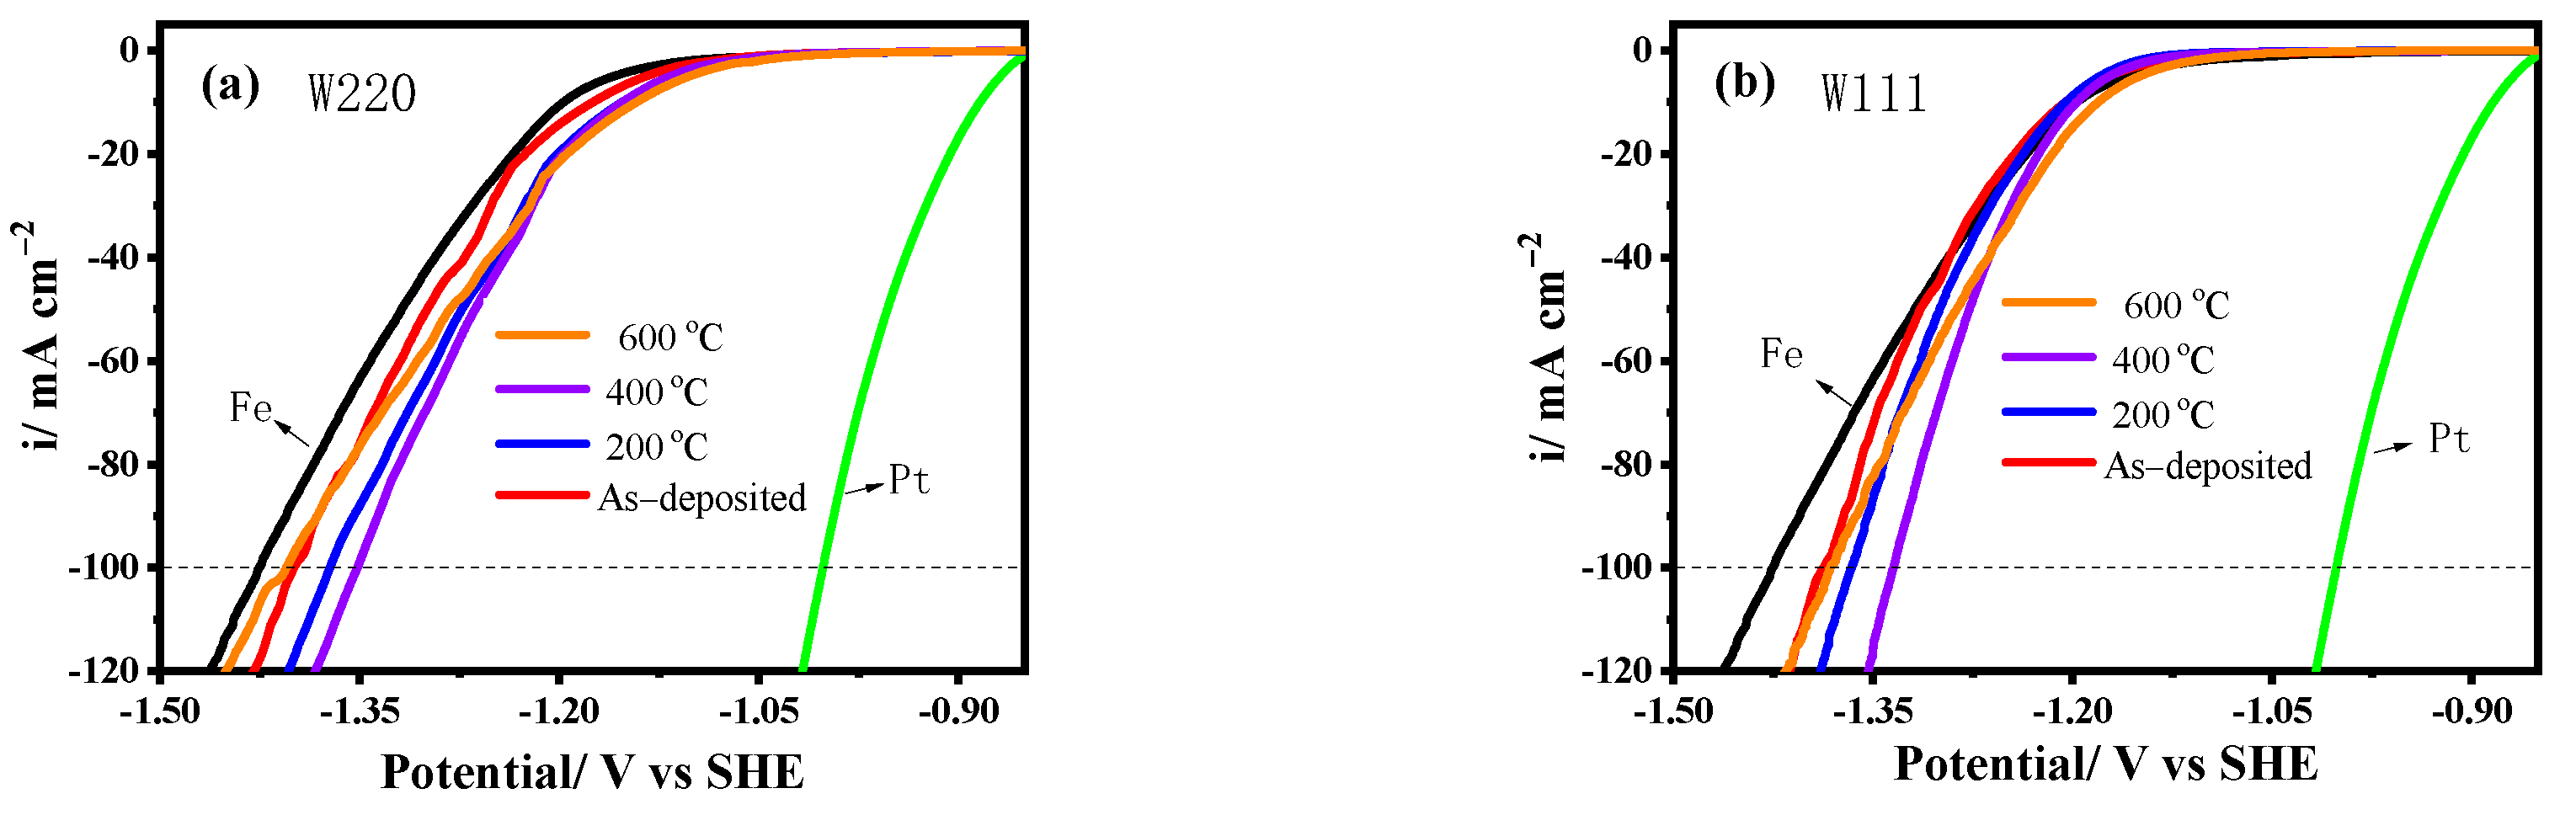
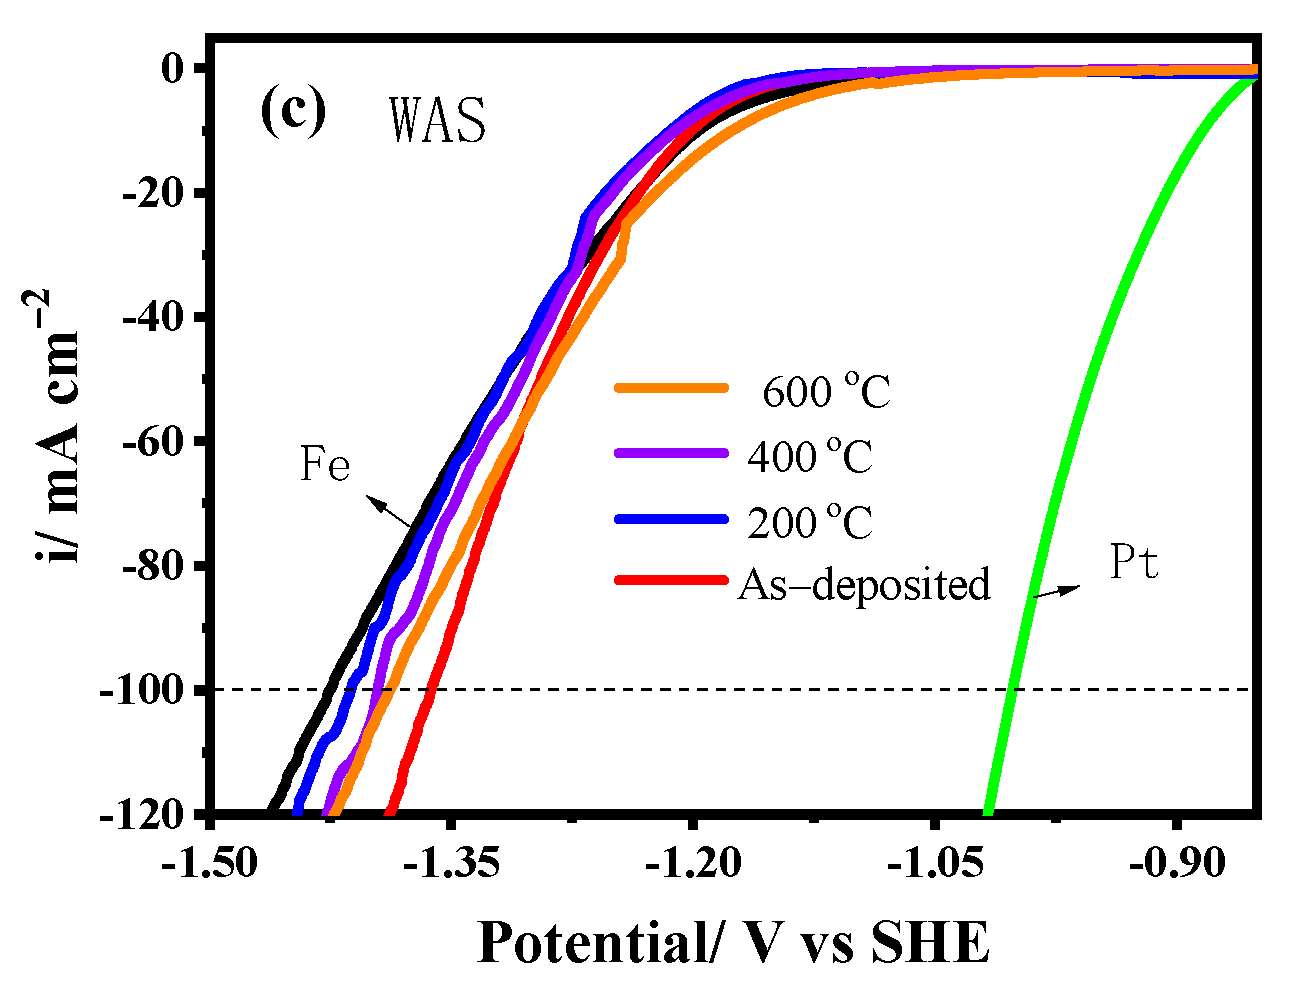
3.4. HER
4. Conclusions
Author Contributions
Funding
Institutional Review Board Statement
Informed Consent Statement
Data Availability Statement
Conflicts of Interest
References
- Xu, C.; Chen, P.; Hu, B.; Xiang, Q.; Cen, Y.; Hu, B.; Liu, L.; Liu, Y.; Yu, D.; Chen, C. Porous nickel electrodes with controlled texture for the hydrogen evolution reaction and sodium borohydride electrooxidation. CrystEngComm 2020, 22, 4228–4237. [Google Scholar] [CrossRef]
- Lahiri, A.; Lakshya, A.K.; Guan, S.; Anguilano, L.; Chowdhury, A. Impact of different metallic forms of nickel on hydrogen evolution reaction. Scr. Mater. 2022, 218, 114829. [Google Scholar] [CrossRef]
- Eckold, P.; Niewa, R.; Hügel, W. Texture of electrodeposited tin layers and its influence on their corrosion behavior. Microelectron. Reliab. 2014, 54, 2578–2585. [Google Scholar] [CrossRef]
- Xu, Y.; Dai, Y.; Zhang, W.; Xia, T. Microstructure and texture evolution of electrodeposited coatings of nickel in the industrial electrolyte. Surf. Coat. Technol. 2017, 330, 170–177. [Google Scholar]
- Nasirpouri, F.; Sanaeian, M.R.; Samardak, A.S.; Sukovatitsina, E.V.; Ognev, A.V.; Chebotkevich, L.A.; Hosseinid, M.-G.; Abdolmaleki, M. An investigation on the effect of surface morphology and crystalline texture on corrosion behavior, structural and magnetic properties of electrodeposited nanocrystalline nickel films. Appl. Surf. Sci. 2014, 292, 795–805. [Google Scholar] [CrossRef]
- Allahyarzadeh, M.H.; Aliofkhazraei, M.; Rezvanian, A.R.; Torabinejad, V.; Sabour, R.A.R. Ni-W electrodeposited coatings: Characterization, properties and applications. Surf. Coat. Technol. 2016, 307, 978–1010. [Google Scholar] [CrossRef]
- Ramaprakash, M.; Deepika, Y.; Balamurugan, C.; Nagaganapathy, N.; Sekar, R.; Panda, S.K.; Rajasekaran, N. Pulse electrodeposition of nano-crystalline Ni-W alloy and the influence of tungsten composition on structure, microhardness and corrosion properties. J. Alloys Compd. 2021, 866, 158987. [Google Scholar] [CrossRef]
- Raveendran, M.; Neethu, A.; Chitharanjan, H. Development of Ni-W alloy coatings and their electrocatalytic activity for water splitting reaction. Physica B Condens. Matter. 2020, 597, 412359. [Google Scholar]
- Jameei, R.P.; Aliofkhazraei, M.; Barati, D.G. Ni-W nanostructure well-marked by Ni selective etching for enhanced hydrogen evolution reaction. Int. J. Hydrogen Energy 2019, 44, 880–894. [Google Scholar] [CrossRef]
- Hong, S.H.; Ahn, S.H.; Choi, J.; Kim, J.Y.; Kim, H.Y.; Kim, H.-J.; Jang, J.H.; Kim, H.; Kim, S.-K. High-activity electrodeposited Ni-W catalysts for hydrogen evolution in alkaline water electrolysis. Appl. Surf. Sci. 2015, 349, 629–635. [Google Scholar] [CrossRef]
- Tang, J.; Niu, J.; Yang, C.; Rajendran, S.; Lei, Y.; Sawangphruk, M.; Zhang, X.; Qin, J. Twin boundaries boost the hydrogen evolution reaction on the solid solution of nickel and tungsten. Fuel 2022, 330, 125510. [Google Scholar] [CrossRef]
- Fraze, L. Shiny Science: A New Substitute for Hexavalent Chromium. Environ. Health Perspect. 2006, 114, A482–A485. [Google Scholar]
- Suvorov, D.; Gololobov, G.; Tarabrin, D.; Slivkin, E.; Karabanov, S.; Tolstoguzov, A. Electrochemical Deposition of Ni–W Crack-Free Coatings. Coatings 2018, 8, 233. [Google Scholar] [CrossRef]
- Su, C.; Sa, Z.; Liu, Y.; Zhao, L.; Wu, F.; Bai, W. Excellent Properties of Ni-15 wt.%W Alloy Electrodeposited from a Low-Temperature Pyrophosphate System. Coatings 2021, 11, 1262. [Google Scholar] [CrossRef]
- Popczyk, M.; Kubisztal, J.; Swinarew, A.S.; Waskiewicz, Z.; Stanula, A.; Knechtle, B. Corrosion Resistance of Heat-Treated Ni-W Alloy Coatings. Materials 2020, 13, 1172. [Google Scholar] [CrossRef]
- Hou, K.-H.; Chang, Y.-F.; Chang, S.-M.; Chang, C.-H. The heat treatment effect on the structure and mechanical properties of electrodeposited nano grain size Ni–W alloy coatings. Thin Solid Films 2010, 518, 7535–7540. [Google Scholar] [CrossRef]
- Su, C.S.; Zhao, L.F.; Bai, Y.; Tian, L.; Wen, B.; Guo, J.M. Microhardness Improvement of Ni-W/SiC Composite Coatings by High Frequency Induction Heat Treatment. J. Electrochem. Soc. 2019, 166, D301–D307. [Google Scholar] [CrossRef]
- Wang, H.; Sheu, H.; Ger, M.; Hou, K. The effect of heat treatment on the microstructure and mechanical properties of electrodeposited nanocrystalline Ni–W/diamond composite coatings. Surf. Coat. Technol. 2014, 259, 268–273. [Google Scholar] [CrossRef]
- Zhou, H.; Liao, Z.; Fang, C.; Li, H.; Feng, B.; Xu, S.; Cao, G.; Kuang, Y. Pulse electroplating of Ni-W-P coating and its anti-corrosion performance. Trans. Nonferrous Met. Soc. China 2018, 28, 88–95. [Google Scholar] [CrossRef]
- He, F.J.; Fang, Y.Z.; Jin, S.J. The study of corrosion–wear mechanism of Ni–W–P alloy. Wear 2014, 311, 14–20. [Google Scholar] [CrossRef]
- Li, B.; Zhang, W. Microstructural, surface and electrochemical properties of pulse electrodeposited Ni–W/Si3N4 nanocomposite coating. Ceram. Int. 2018, 44, 19907–19918. [Google Scholar] [CrossRef]
- Luo, H.; Leitch, M.; Zeng, H.; Luo, J.-L. Characterization of microstructure and properties of electroless duplex Ni-W-P/Ni-P nano-ZrO2 composite coating. Mater. Today Phys. 2018, 4, 36–42. [Google Scholar] [CrossRef]
- Chou, C.-C.; Huang, P.-C.; Dai, H.-B. An Analysis of the Performance Characteristics of Different Cylinder Temperatures for Ni-W and Ni-W-BN(h) Plated Piston Rings in an Air-Cooled Engine. Energies 2022, 15, 1026. [Google Scholar] [CrossRef]
- Sinem, E.; Ürgen, M. Oxidation behavior of electroless Ni–P, Ni–B and Ni–W–B coatings deposited on steel substrates. Surf. Coat. Technol. 2015, 265, 46–52. [Google Scholar]
- Yin, D.; Marvel, C.J.; Cui, F.Y.; Vinci, R.P.; Harmer, M.P. Microstructure and fracture toughness of electrodeposited Ni-21 at. % W alloy thick films. Acta Mater. 2018, 143, 272–280. [Google Scholar] [CrossRef]
- Alimadadi, H.; Ahmadi, M.; Aliofkhazraei, M.; Younesi, S.R. Corrosion properties of electrodeposited nanocrystalline and amorphous patterned Ni-W alloy. Mater. Des. 2009, 30, 1356–1361. [Google Scholar] [CrossRef]


| Component | C/% | Si/% | Mn/% | P/% | S/% | Fe/% |
|---|---|---|---|---|---|---|
| Q235 steel | 0.12–0.2 | <0.3 | 0.3–0.7 | <0.045 | <0.045 | Remaining |
| Chemicals/Parameters | Values (g L−1) |
|---|---|
| NiSO4·6H2O | 12 |
| NaWO4·2H2O | 30, 60 |
| Na4P2O7·10H2O | 40 |
| H3PO4 (85%) | 10 |
| NH3·H2O (25%–28%) | ~20 |
| Bath temperature | 40 °C, 60 °C |
| Current density | 4–10 A dm−2 |
| pH | 8.5–9.0 |
| Name | W wt. % | Orientation | CW | Tb/°C | Current/A dm−2 |
|---|---|---|---|---|---|
| W220 | 13.85 | (2 2 0) | 30 | 40 | 8 |
| W111 | 29.80 | (1 1 1) | 60 | 40 | |
| WAS | 36.75 | Amorphous | 60 | 60 |
| Sample | T/°C | Icorr/uAcm−2 | Ecorr/mV vs. SHE | ΔEcorr/mV | IE/% |
|---|---|---|---|---|---|
| Fe | - | 5.71 | −370 | 0 | - |
| W220 | As-deposited | 13.2 | −205 | 165 | −131.2 |
| 200 | 5.77 | −174 | 196 | −1.1 | |
| 400 | 2.55 | −64 | 306 | 55.3 | |
| 600 | 0.81 | −41 | 329 | 85.8 | |
| W111 | As-deposited | 16.27 | −231 | 139 | −184.9 |
| 200 | 10.93 | −207 | 163 | −91.4 | |
| 400 | 2.00 | −127 | 243 | 65.0 | |
| 600 | 3.22 | −68 | 302 | 43.6 | |
| WAS | As-deposited | 16.82 | −258 | 112 | −194.6 |
| 200 | 11.49 | −236 | 134 | −101.2 | |
| 400 | 11.41 | −223 | 147 | −99.8 | |
| 600 | 2.56 | −96 | 274 | 55.2 |
| Sample | T/°C | Rs/Ω cm2 | CPE-T/uF cm−2 | CPE-P | Rct/Ω cm2 | IERct/% |
|---|---|---|---|---|---|---|
| Fe | - | 5.98 | 1264 | 0.753 | 1059 | - |
| W220 | As-deposited | 6.56 | 419 | 0.69 | 10,743 | 90.1 |
| 200 | 5.26 | 223 | 0.74 | 12,065 | 91.2 | |
| 400 | 6.12 | 110 | 0.78 | 18,012 | 94.1 | |
| 600 | 5.85 | 78 | 0.89 | 43,267 | 97.5 | |
| W111 | As-deposited | 6.284 | 106 | 0.72 | 5826 | 81.8 |
| 200 | 6.748 | 137 | 0.77 | 6511 | 83.7 | |
| 400 | 5.07 | 49 | 0.88 | 6325 | 83.2 | |
| 600 | 6.043 | 46 | 0.88 | 28,178 | 96.2 | |
| WAS | As-deposited | 5.63 | 530 | 0.78 | 2918 | 63.7 |
| 200 | 4.525 | 219 | 0.77 | 4751 | 77.7 | |
| 400 | 5.821 | 137 | 0.78 | 8083 | 86.9 | |
| 600 | 5.91 | 4 | 0.663 | 30,154 | 96.5 |
Disclaimer/Publisher’s Note: The statements, opinions and data contained in all publications are solely those of the individual author(s) and contributor(s) and not of MDPI and/or the editor(s). MDPI and/or the editor(s) disclaim responsibility for any injury to people or property resulting from any ideas, methods, instructions or products referred to in the content. |
© 2023 by the authors. Licensee MDPI, Basel, Switzerland. This article is an open access article distributed under the terms and conditions of the Creative Commons Attribution (CC BY) license (https://creativecommons.org/licenses/by/4.0/).
Share and Cite
Deng, J.; Li, K.; Fu, J.; Li, B.; Jiang, H.; Ju, H.; Wang, E.; Zhang, C.; Liu, Y.; Chen, Y.; et al. Preparation and Properties of Textured Ni–W Coatings Electrodeposited on the Steel Surface from a Pyrophosphate Bath. Coatings 2023, 13, 1519. https://doi.org/10.3390/coatings13091519
Deng J, Li K, Fu J, Li B, Jiang H, Ju H, Wang E, Zhang C, Liu Y, Chen Y, et al. Preparation and Properties of Textured Ni–W Coatings Electrodeposited on the Steel Surface from a Pyrophosphate Bath. Coatings. 2023; 13(9):1519. https://doi.org/10.3390/coatings13091519
Chicago/Turabian StyleDeng, Jiyu, Kunpeng Li, Jianglong Fu, Bing Li, Hongzong Jiang, Hui Ju, Erli Wang, Changke Zhang, Yangyang Liu, Yan Chen, and et al. 2023. "Preparation and Properties of Textured Ni–W Coatings Electrodeposited on the Steel Surface from a Pyrophosphate Bath" Coatings 13, no. 9: 1519. https://doi.org/10.3390/coatings13091519