Abstract
The strength and characteristics of a coating are defined by the impact and temperature of the individual molten particles, as well as by the state of the surface to be coated. The parameters selected for thermal spraying determine the parameters of the particles in flight: temperature and velocity. These parameters can be determined by measuring the thermal radiation intensity of the particles in flight. The parameters that define the thermal spray are the mass flow rate, the intensity, and the flow rate in the gas mixture to be propelled into the spray gun. On the other hand, the strength of the coating obtained can be estimated using its hardness and adhesion. In this study, a design of the experiments is developed to determine the relationships between the operating parameters and the parameters characterising the particles. From this design, the results obtained are analysed. The experimental results confirmed the direct relationship between intensity and particle temperature, consistent with the relationship between intensity and energy generated in the arc in the spray device. The velocities followed a similar relationship. Increasing the proportion of in the feed gas led to a higher heat transfer to the particles, consistent with the information found in the literature. A similar effect was detected for the velocity. The adhesion and hardness increase with the speed and temperature of the particle in flight, which is related to a more efficient spatter-flattening process. The applied procedure provides an efficient methodology for the development of useful surfaces for the optimisation of thermal spraying processes.
1. Introduction
Thermal spraying is a technique based on the propulsion of the liquid particles of metal, alloys, or ceramics, at hundreds of m/s, with a diameter of a few tens of µm. Thermal spray processes include the spray of plasma generated via an electric arc in an atmospheric pressure environment, known as Atmospheric Plasma Spray (APS) for short [1,2,3].
The molten particles impact on a substrate and are crushed with almost no heat transfer. The shape and size of the spatter formed depends on the size and shape of the feed powder, the temperature and velocity of the molten particles, and the roughness and temperature of the substrate. The adhesion of the coating and substrate and the residual stresses at the interface depend on the shape and size of the spatters and their overlap [1]. Tanaka et al. studied the effects of the substrate, powder, and pre-coating via PVD on the flattening of the plasma-sprayed ceramic particles. Their work clarified that wetting plays an important role in the flattening behaviour of the plasma-sprayed ceramic particles [4,5]. Fukumoto et al. analysed the transition behaviour of the splat pattern of nickel particles sprayed onto a flat substrate [6]. Jiang et al. studied the effect of condensates and adsorbates on a substrate surface on the fragmentation of impinging molten droplets of ZrO2 during thermal spray [7]. Pershin et al. sprayed Ni particles onto stainless steel, analysing the effects of the preheated substrate [8]. Okumus studied the performance of protective multilayer coatings with Al2O3–TiO2/Mo/cast iron architecture [9]. Syed et al. analysed the influence of the substrate surface temperature and oxidation state on the flattening of alumina and stainless-steel particles and the morphology of the resulting splats [10]. Fukumoto et al. investigated the effect of both the substrate temperature and the ambient pressure on the flattening behaviour of the particle [11]. Nickel was one of the particle materials used. McDonald et al. analysed the thermal contact resistance between the heated or preheated glass and Inconel 625 and the zirconia splats [12]. Tekmen et al. investigated the effect of process parameters (arc current, spray distance, nozzle type, oxygen gas support, and substrate cooling) on in-flight particle characteristics (temperature and velocity) and in situ alumina formation [13]. Yin et al. detailed the Al2O3 particle characteristics during their flight into the spray and their significance in determining the microstructure and mechanical properties of the resultant coatings [14]. Zhang et al. studied the effect of particle velocity on the characteristics of atmospheric plasma-sprayed yttria-stabilised zirconia [15,16]. Mantry et al. showed the dependence of adhesion strength of as-sprayed nanostructured YSZ coatings on particle temperature, velocity and size of the splat prior to impact the metallic substrate [17]. Finally, Xiao et al. studied particle in-flight behaviour during plasma spraying and its significance in determining the microstructure and mechanical properties of plasma-sprayed yttria-partially-stabilised zirconia [18].
Several attempts have been made to develop methodologies to analyse the relationship between the parameters that characterise the coating process, from setting the operating parameters to the properties achieved in the coating. Pierlot et al. and Heimann et al. reviewed available publications regarding the optimisation of coatings made via APS processes using the design of experiments (DoE). The methods used include factorial design, Taguchi’s method, response surface methodology, and neural network modelling (ANN) [19,20]. Thus, Guessasma et al. used ANN to analyse the relationship between thermal spray parameters and in-flight particle characteristics [21]. The spray parameters selected in this study are electrical intensity, gas flow rates, injector diameter, and distance to the substrate. The properties selected to characterise the particles in flight are velocity, temperature, and diameter. Forghani et al. used factorial design to analyse the relationship between thermal spray parameters and the properties characterising the coating [22]. The spray parameters selected in this study are the power of the thermal spray system, the spraying distance, and the mass flow rate of the coating powder. The properties selected to characterise the coating were porosity, microhardness, roughness, and wear ratio. Karthikeyan et al. used central composite design to analyse the relationship between thermal spray parameters and the properties characterising the coating [23]. The spray parameters selected in this study concerns the power of the spray system as follows: gas flow rates, mass flow rate of the coating powder, and its distance to the substrate. The properties selected to characterise the coating were porosity and microhardness. A recent work by Batra and Taetragool used a response surface methodology to analyse the relationship between thermal spray parameters and in-flight particle characteristics [24]. The spray parameters selected in this study were electrical intensity, gas flow rates, and coating powder mass flow rate. The properties selected to characterise the particles in flight were velocity, temperature, and diameter.
This present paper proposes a methodology for generating structured particle parameter information for a practical range of spraying conditions. Such a requirement conditions provide the maximum amount of useful knowledge can be provided with a manageable number of tests. With that information, it would be possible to take the step of relating these impact conditioning parameters, together with the substrate conditions, to the adhesion and hardness of the coating. In addition, particular results will be evaluated using simple physical mechanisms of heat transfer and fluid mechanics.
2. Materials and Methodology
The objective of the DoE proposed in this methodology is to determine the relationship between the input parameters, which define the manufacturing process on the parameters that determine one of the independent phases of the coating, the particle conditions at the moment of impact. The proposed procedure must be sufficiently flexible to enable it to be applied when any parameter that is not incorporated in this analysis, such as the spraying powder material, is changed. The information from the analysis can be used as input material and interact with the data obtained from relating these impact conditions to the coating characteristics. For these reasons, a factorial design was chosen.
The input variables selected to characterise the APS spraying process were current intensity (A), flow rate of (slpm), and powder mass flow rate (g/min). The output variables, which characterise the impact of the particle on the substrate, were particle velocity (m/s) and temperature (C).
The powder selected for the tests is Metco 450 NS (Oerlikon; Zurich, Switzerland), with its chemical composition being Ni5Al, commonly known as Nickel-Aluminium. There are different powder configurations using these same chemical elements, with the percentage by weight of each of them being the differentiating factor in terms of properties among each of the powders. The nominal range of Metco 450 NS powder is µm. This type of nomenclature utilised to define the distribution of the powder is based on the principle that 90% of the particles have a nominal diameter size equal to or less than 45 µm.
The substrate was an AISI 1045 steel with a grid-blasted and preheated surface.
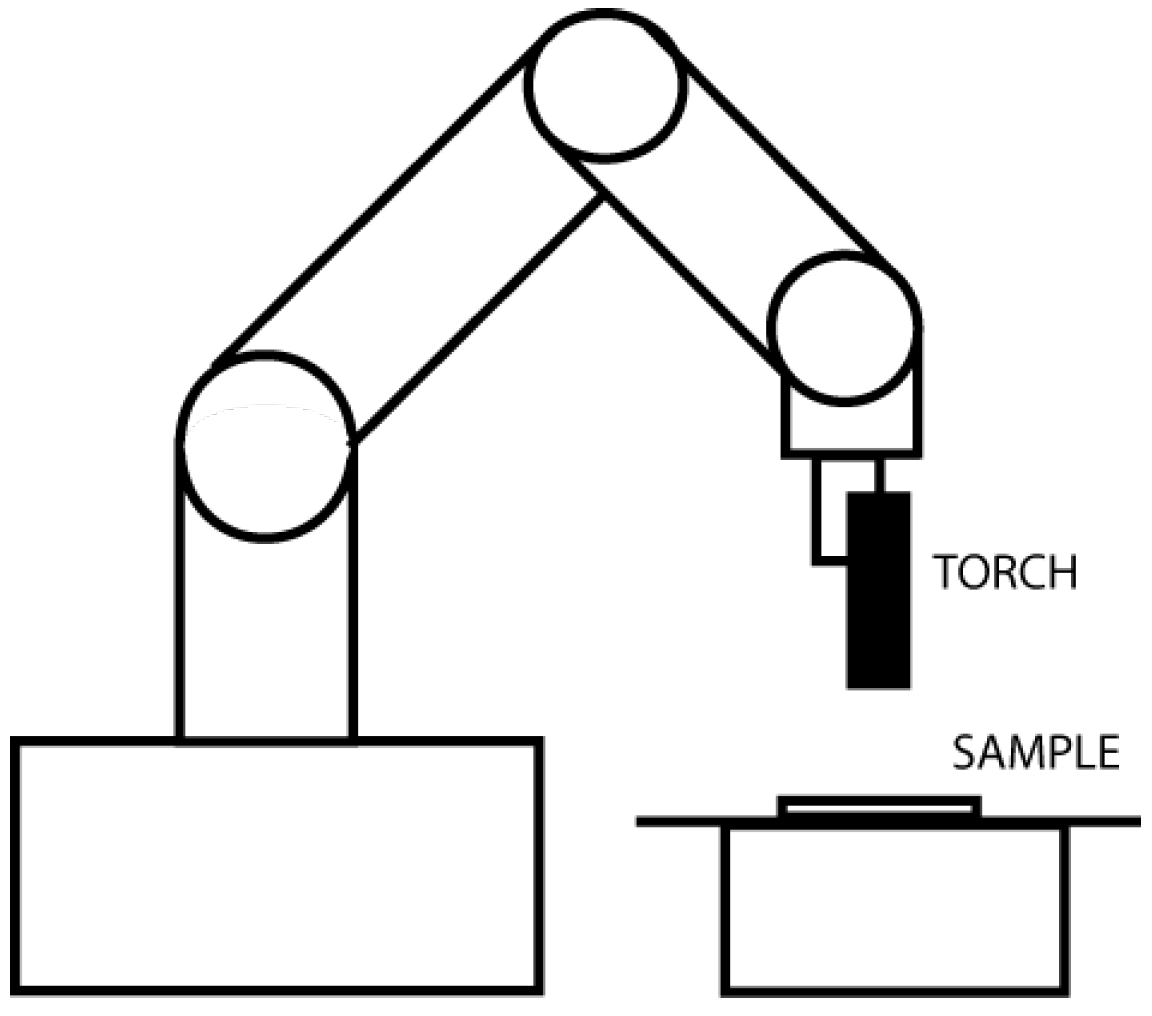
Figure 1 shows the schematic of the sample manufacturing. The stand-off used in the test was 140 mm.

Figure 1.
Schematic of the sample manufacturing.
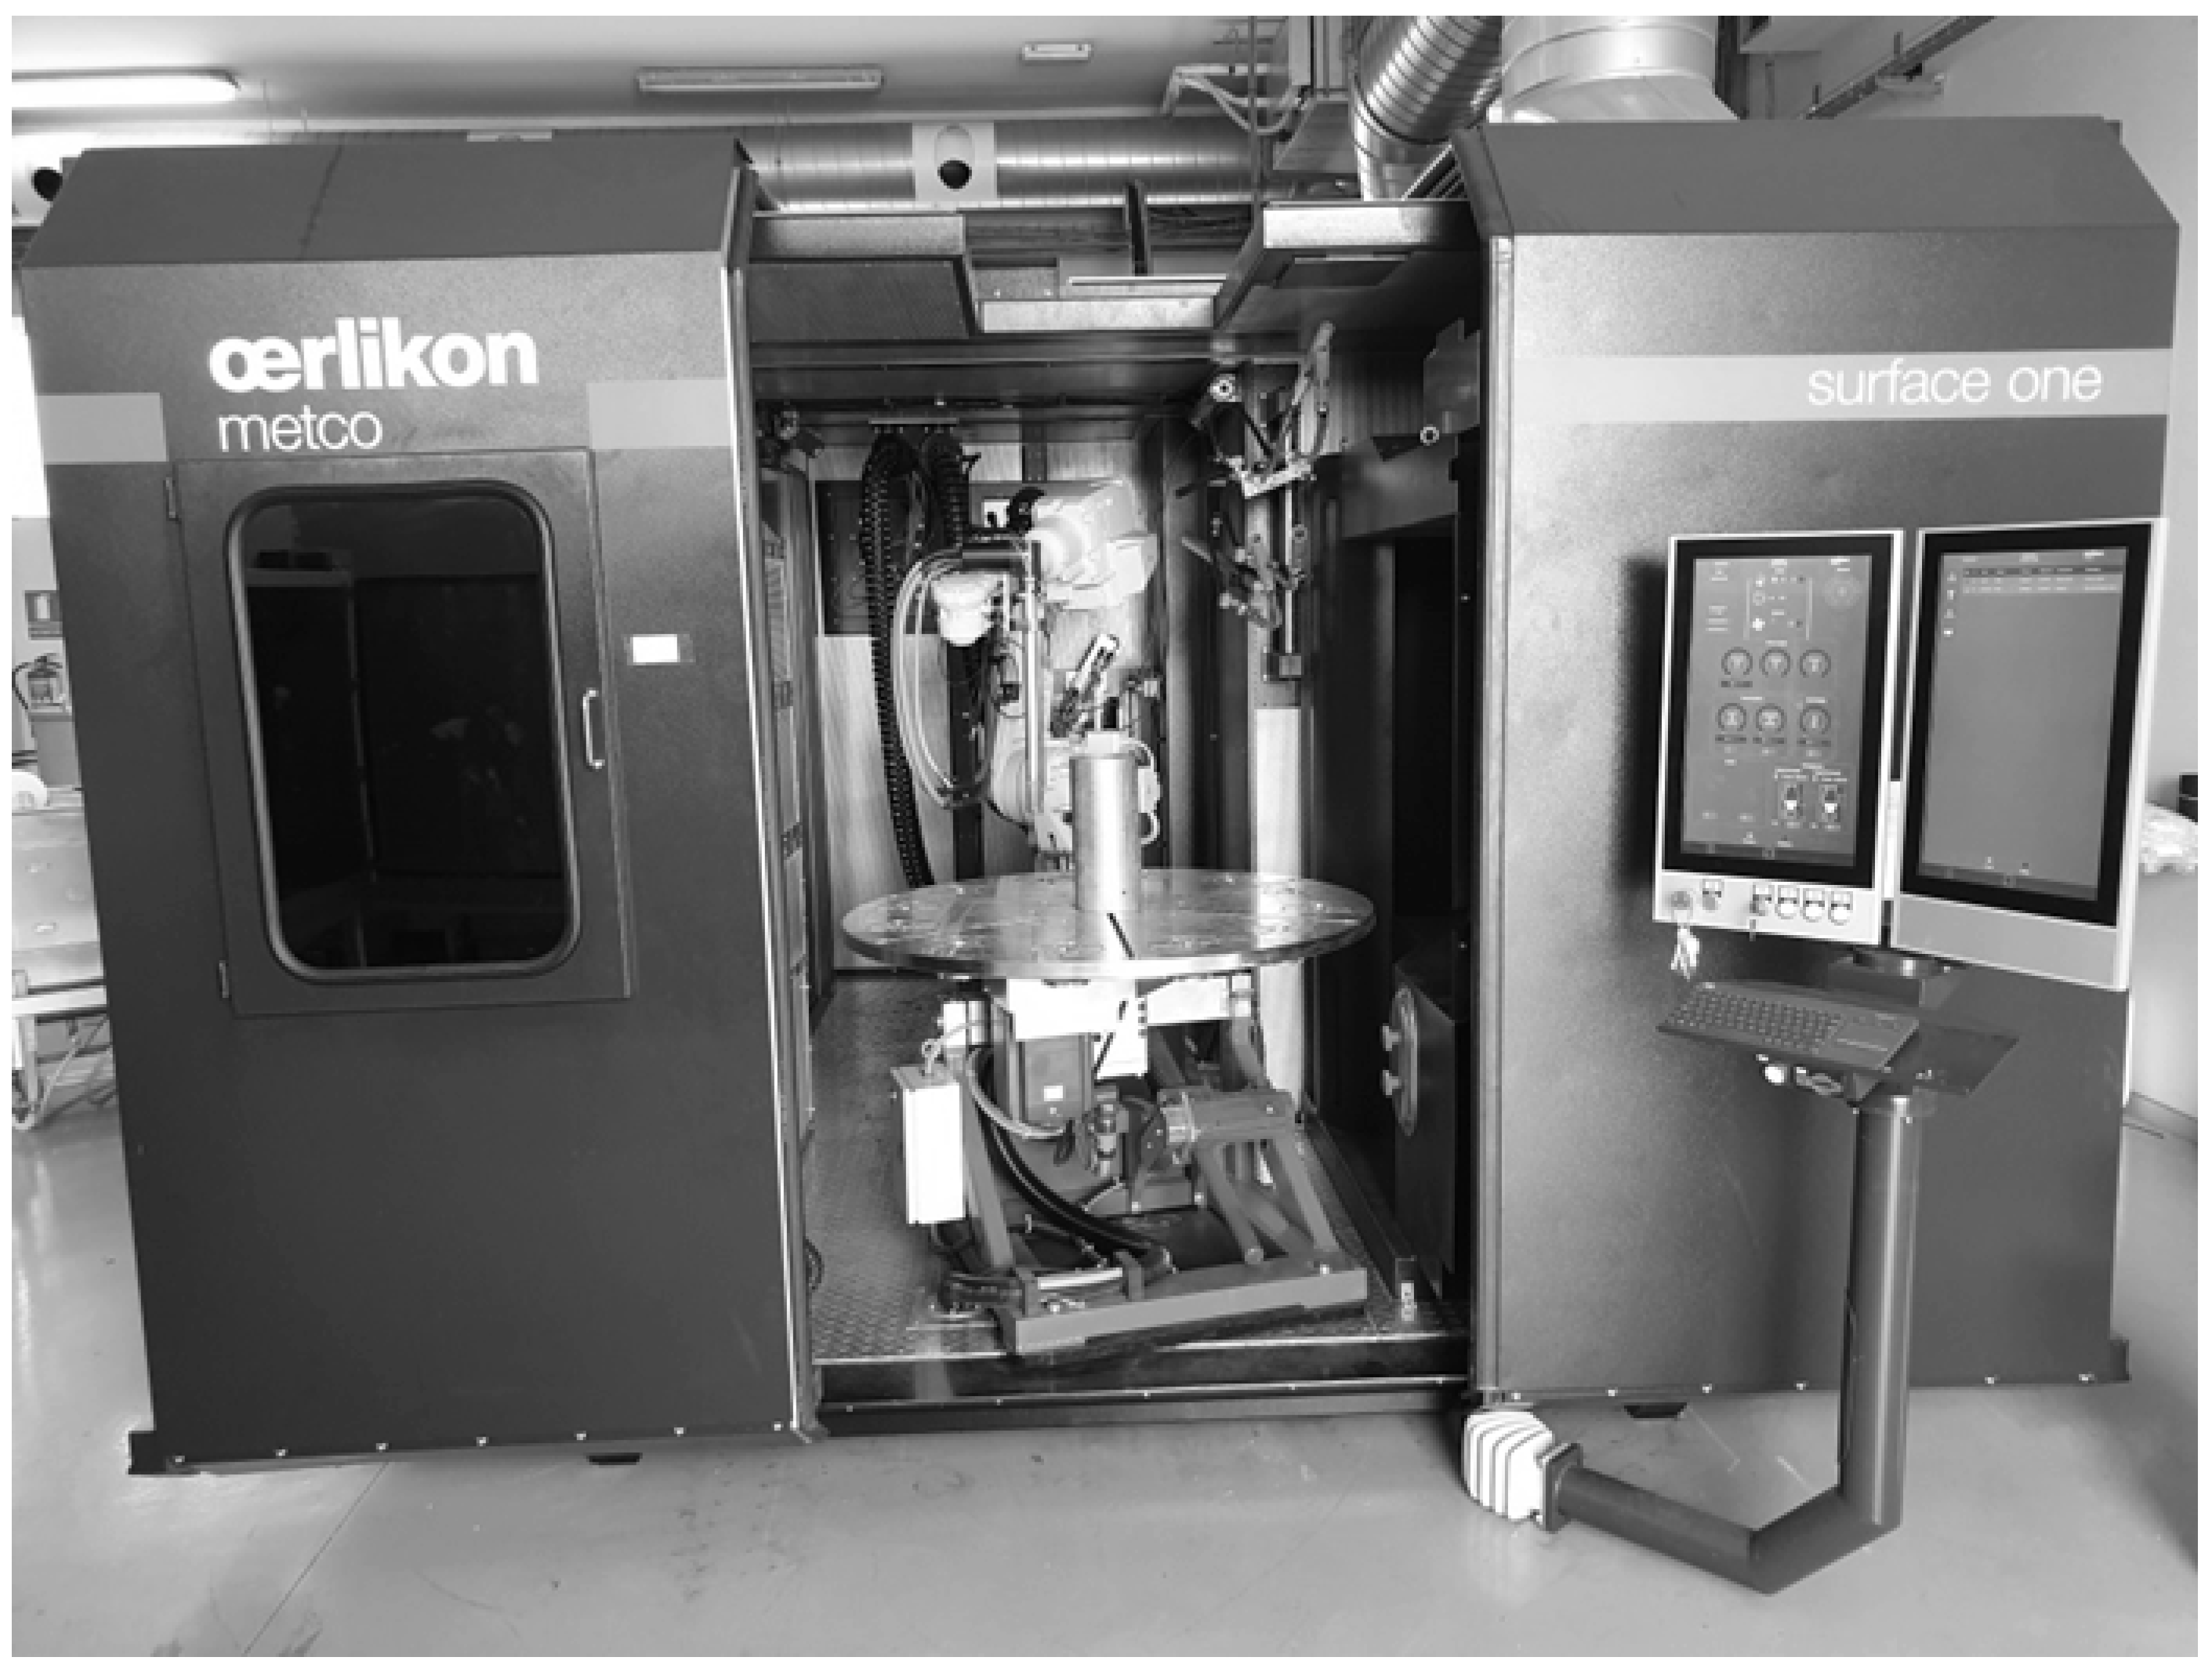
The thermal spraying equipment used was SURFACE ONE from Oerlikon, as shown in Figure 2. This equipment allows APS thermal spraying.

Figure 2.
SURFACE ONE thermal spray equipment at the Miranda de Ebro Technology Centre, Spain.
The operating parameters were automatically collected via the control system of the thermal spray equipment. In-flight particle velocity and temperature measurement was performed using a two-wavelength thermal radiation flux sensor called Accurasprey from Tecnar Automation Ltd. (Saint Bruno, QC, Canada) [25,26,27].
The relationship between heat flux at two wavelengths and temperature is given via [28,29]
where is the emissivity, and and are calibration constants.
From Equation (1), the following can be obtained:
The velocity is determined using the time-of-flight concept [30]. This procedure consists of measuring the thermal radiation emitted by particles at two positions, a known distance apart in the direction of flow; the delay between two signals provides information for calculating the velocity [29].
The working distance of the sensor was the focal length of the equipment, which was 200 mm; this is a standard value for any spraying, regardless of the powder or the gun used.
The combination of tests for the three selected operating parameters and a number of values N for each of the parameters is . The higher the N, the greater the resolution of the surfaces represented, but the number of tests increases, thereby increasing the cost of the information obtained. We have opted for three values since that represents a number of tests that can be carried out to show whether there are linear relationships between the variables studied. The values of each parameter are shown in Table 1.

Table 1.
Parameters selected for performing the DoE, together with their corresponding values and increments.
Once the relationships between the spray parameters and the particle conditions at the moment of impact have been defined, it is possible to define the procedure to relate those conditions to the properties of the coating.
From the results following the methodology proposed above, the number of tests in the second phase can be reduced. A powder mass flow rate of 20 g/min was selected. For the other parameters of spray, intensity, and flow rate, five combinations were selected: 450 A and 6.5 SLPM; 450 A and 12 SLPM; 550 A and 9.5 SLPM; 650 A and 9.5 SLPM; and 650 A and 12 SLPM. These values correspond to the combinations of extreme current and flow rate values by adding the central value of these manufacturing parameters.
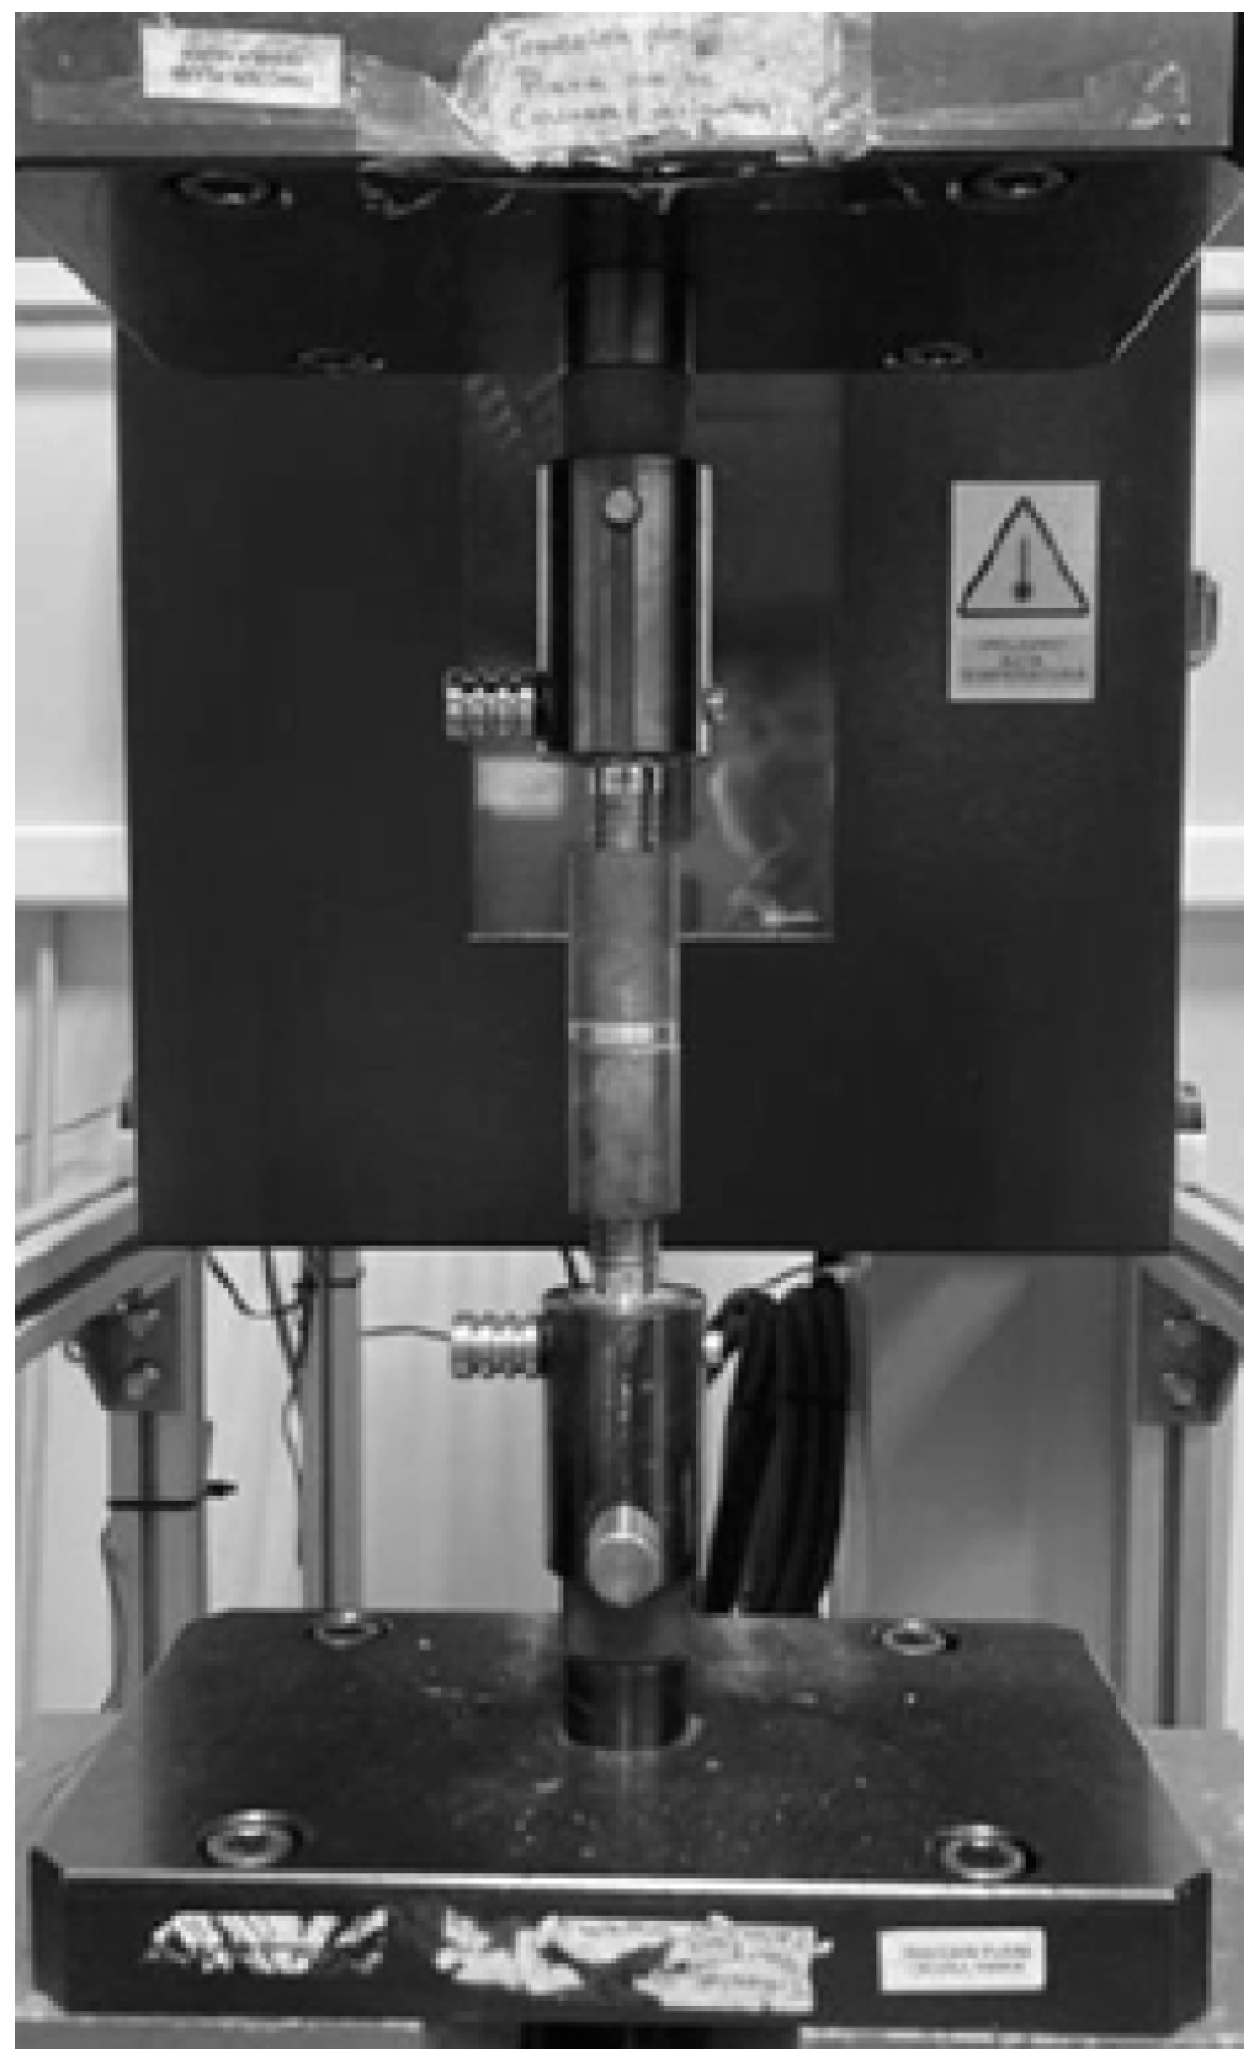
In terms of coating properties, hardness and adhesion were selected. The Vickers hardness was measured according to ASTM E384 at five points on each specimen. The adhesion test was carried out according to ASTM C633. In that test, the specimen is dimensionally limited to a disc that was 25.2 mm in diameter and 5 mm thick. Once projected, the specimens were positioned in the corresponding tooling. FM 1000 adhesive was used as the standard for these tests. The curing time of the adhesive was set at 90 ± 10 min, and the curing temperature was set at 170 ± 6 C. Once the adhesive had cured and the assembly had been allowed to cool, the specimens were positioned in the tensile machine. The test setup can be seen in Figure 3 for one of the specimens.

Figure 3.
Tensile machine adhesion test setup.
The minimum adhesive strength was 69 MPa.
3. Results and Discussion
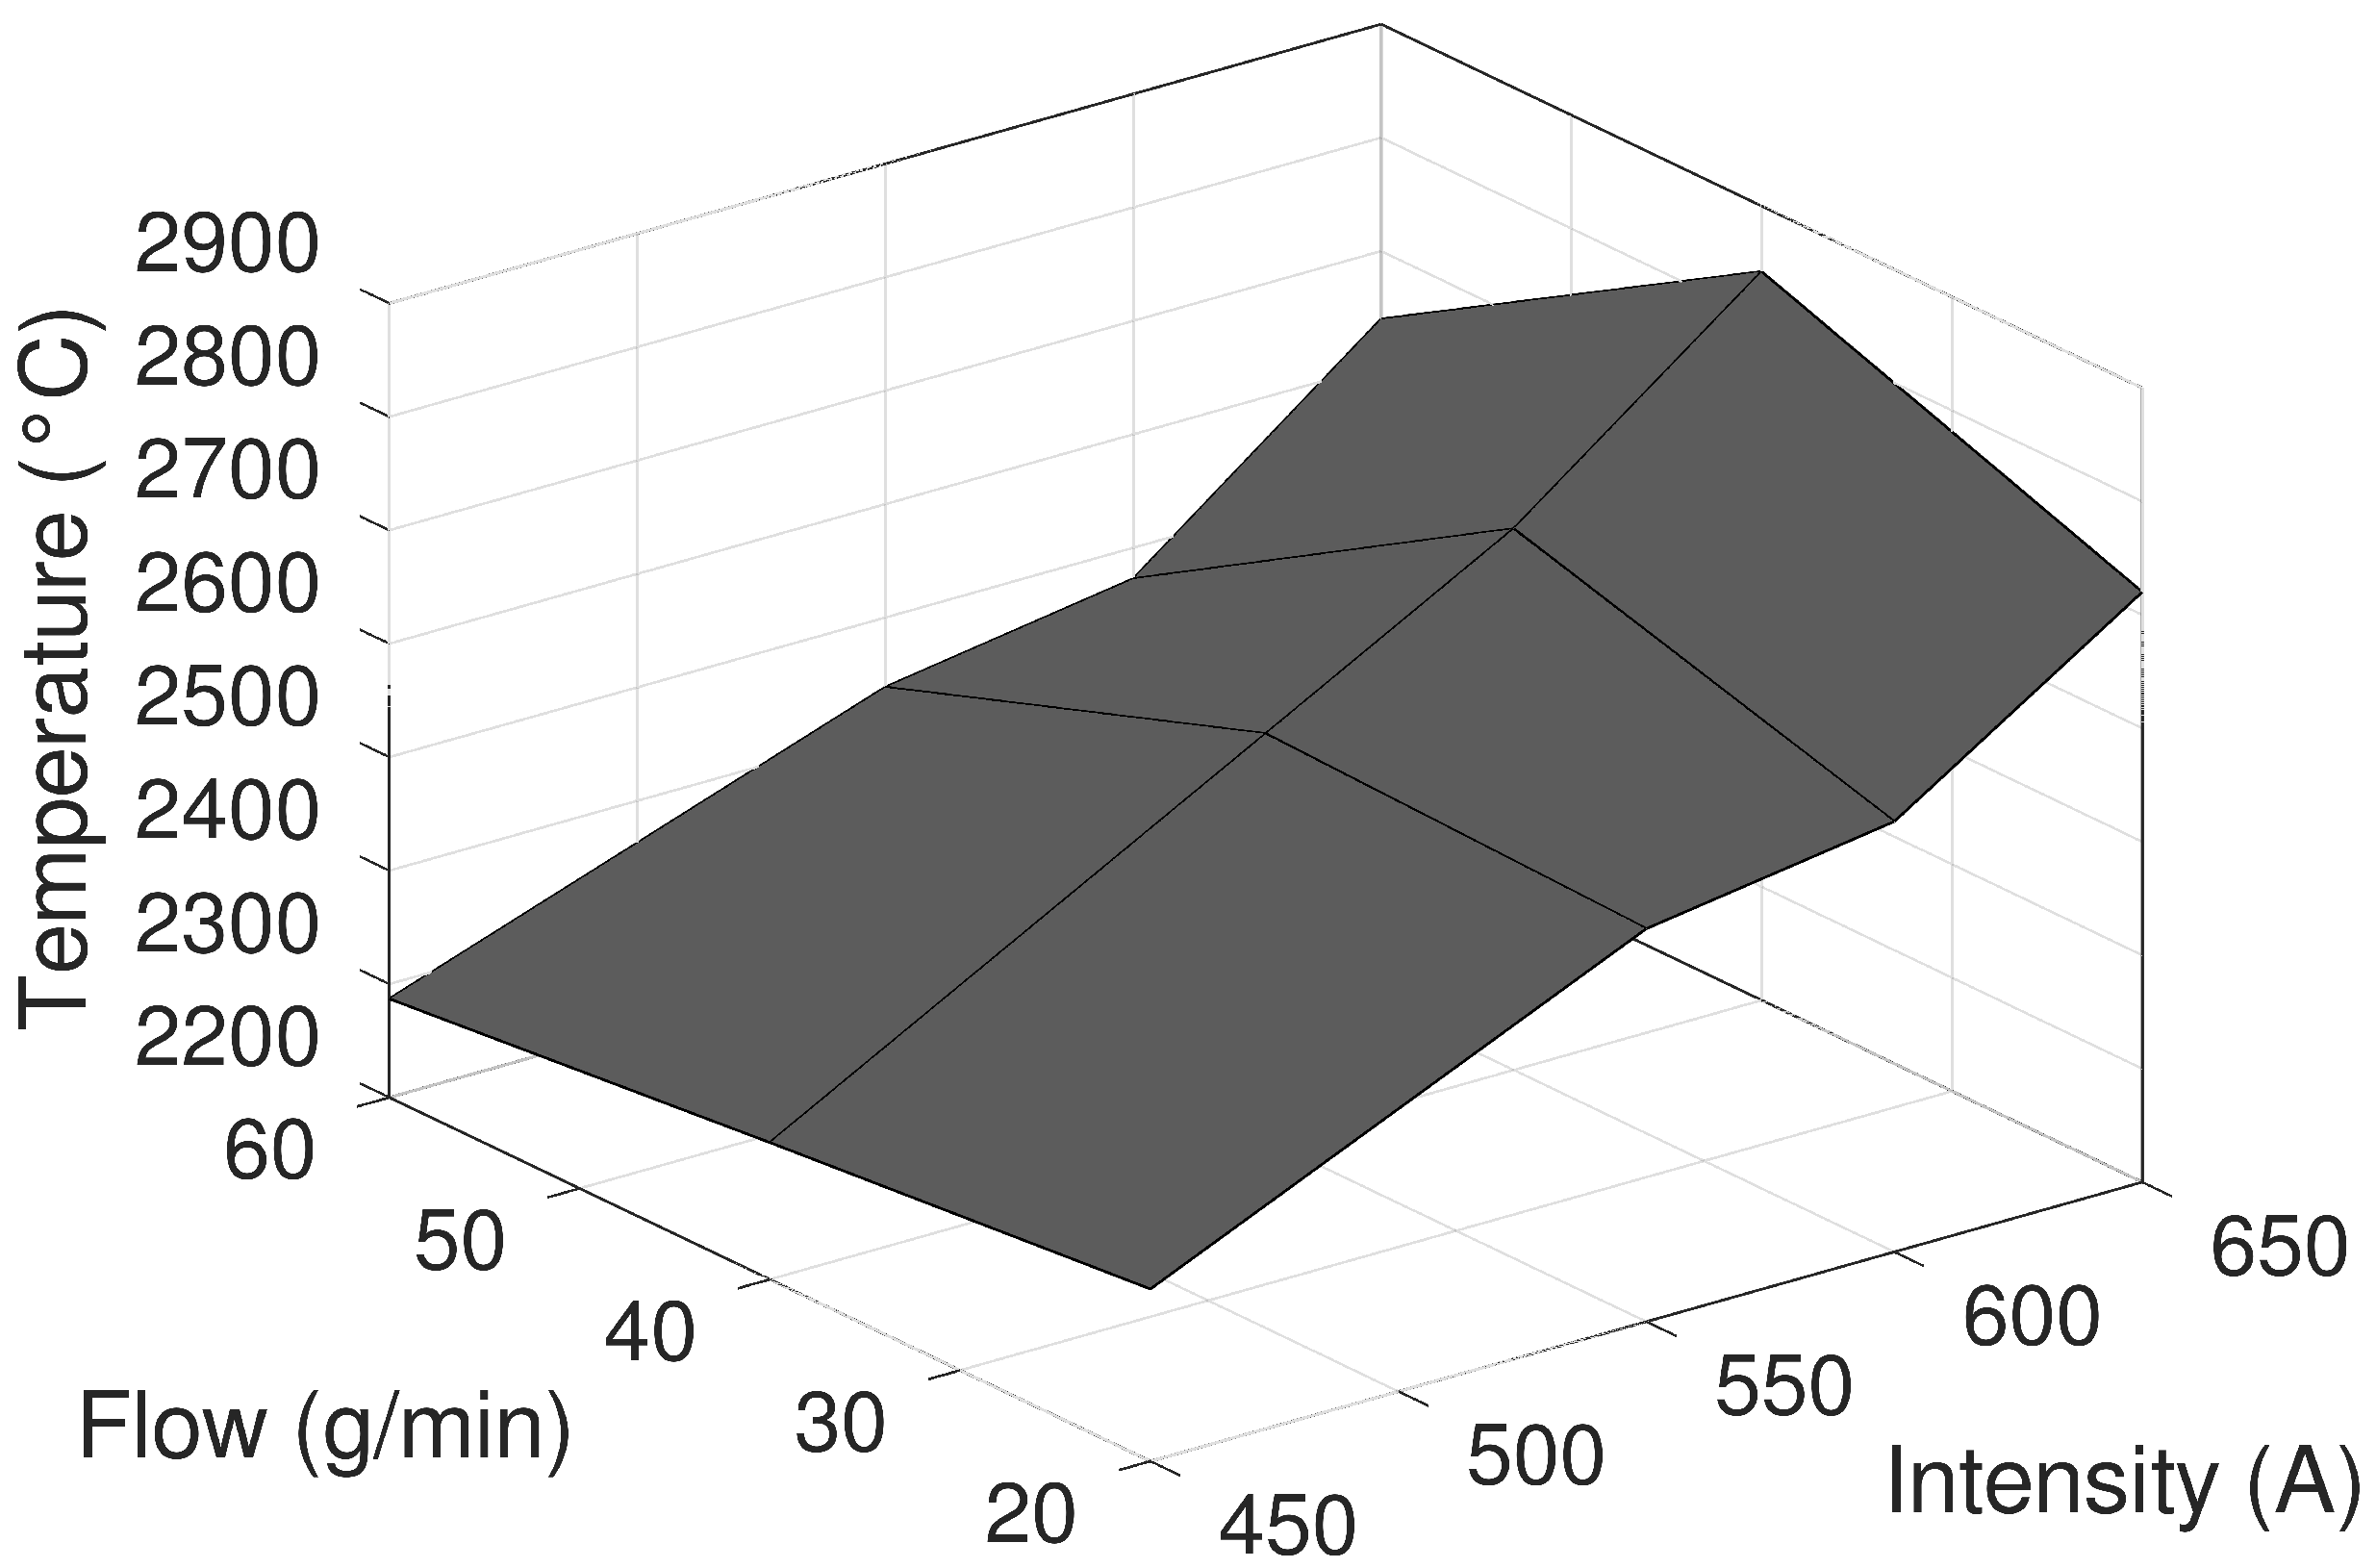
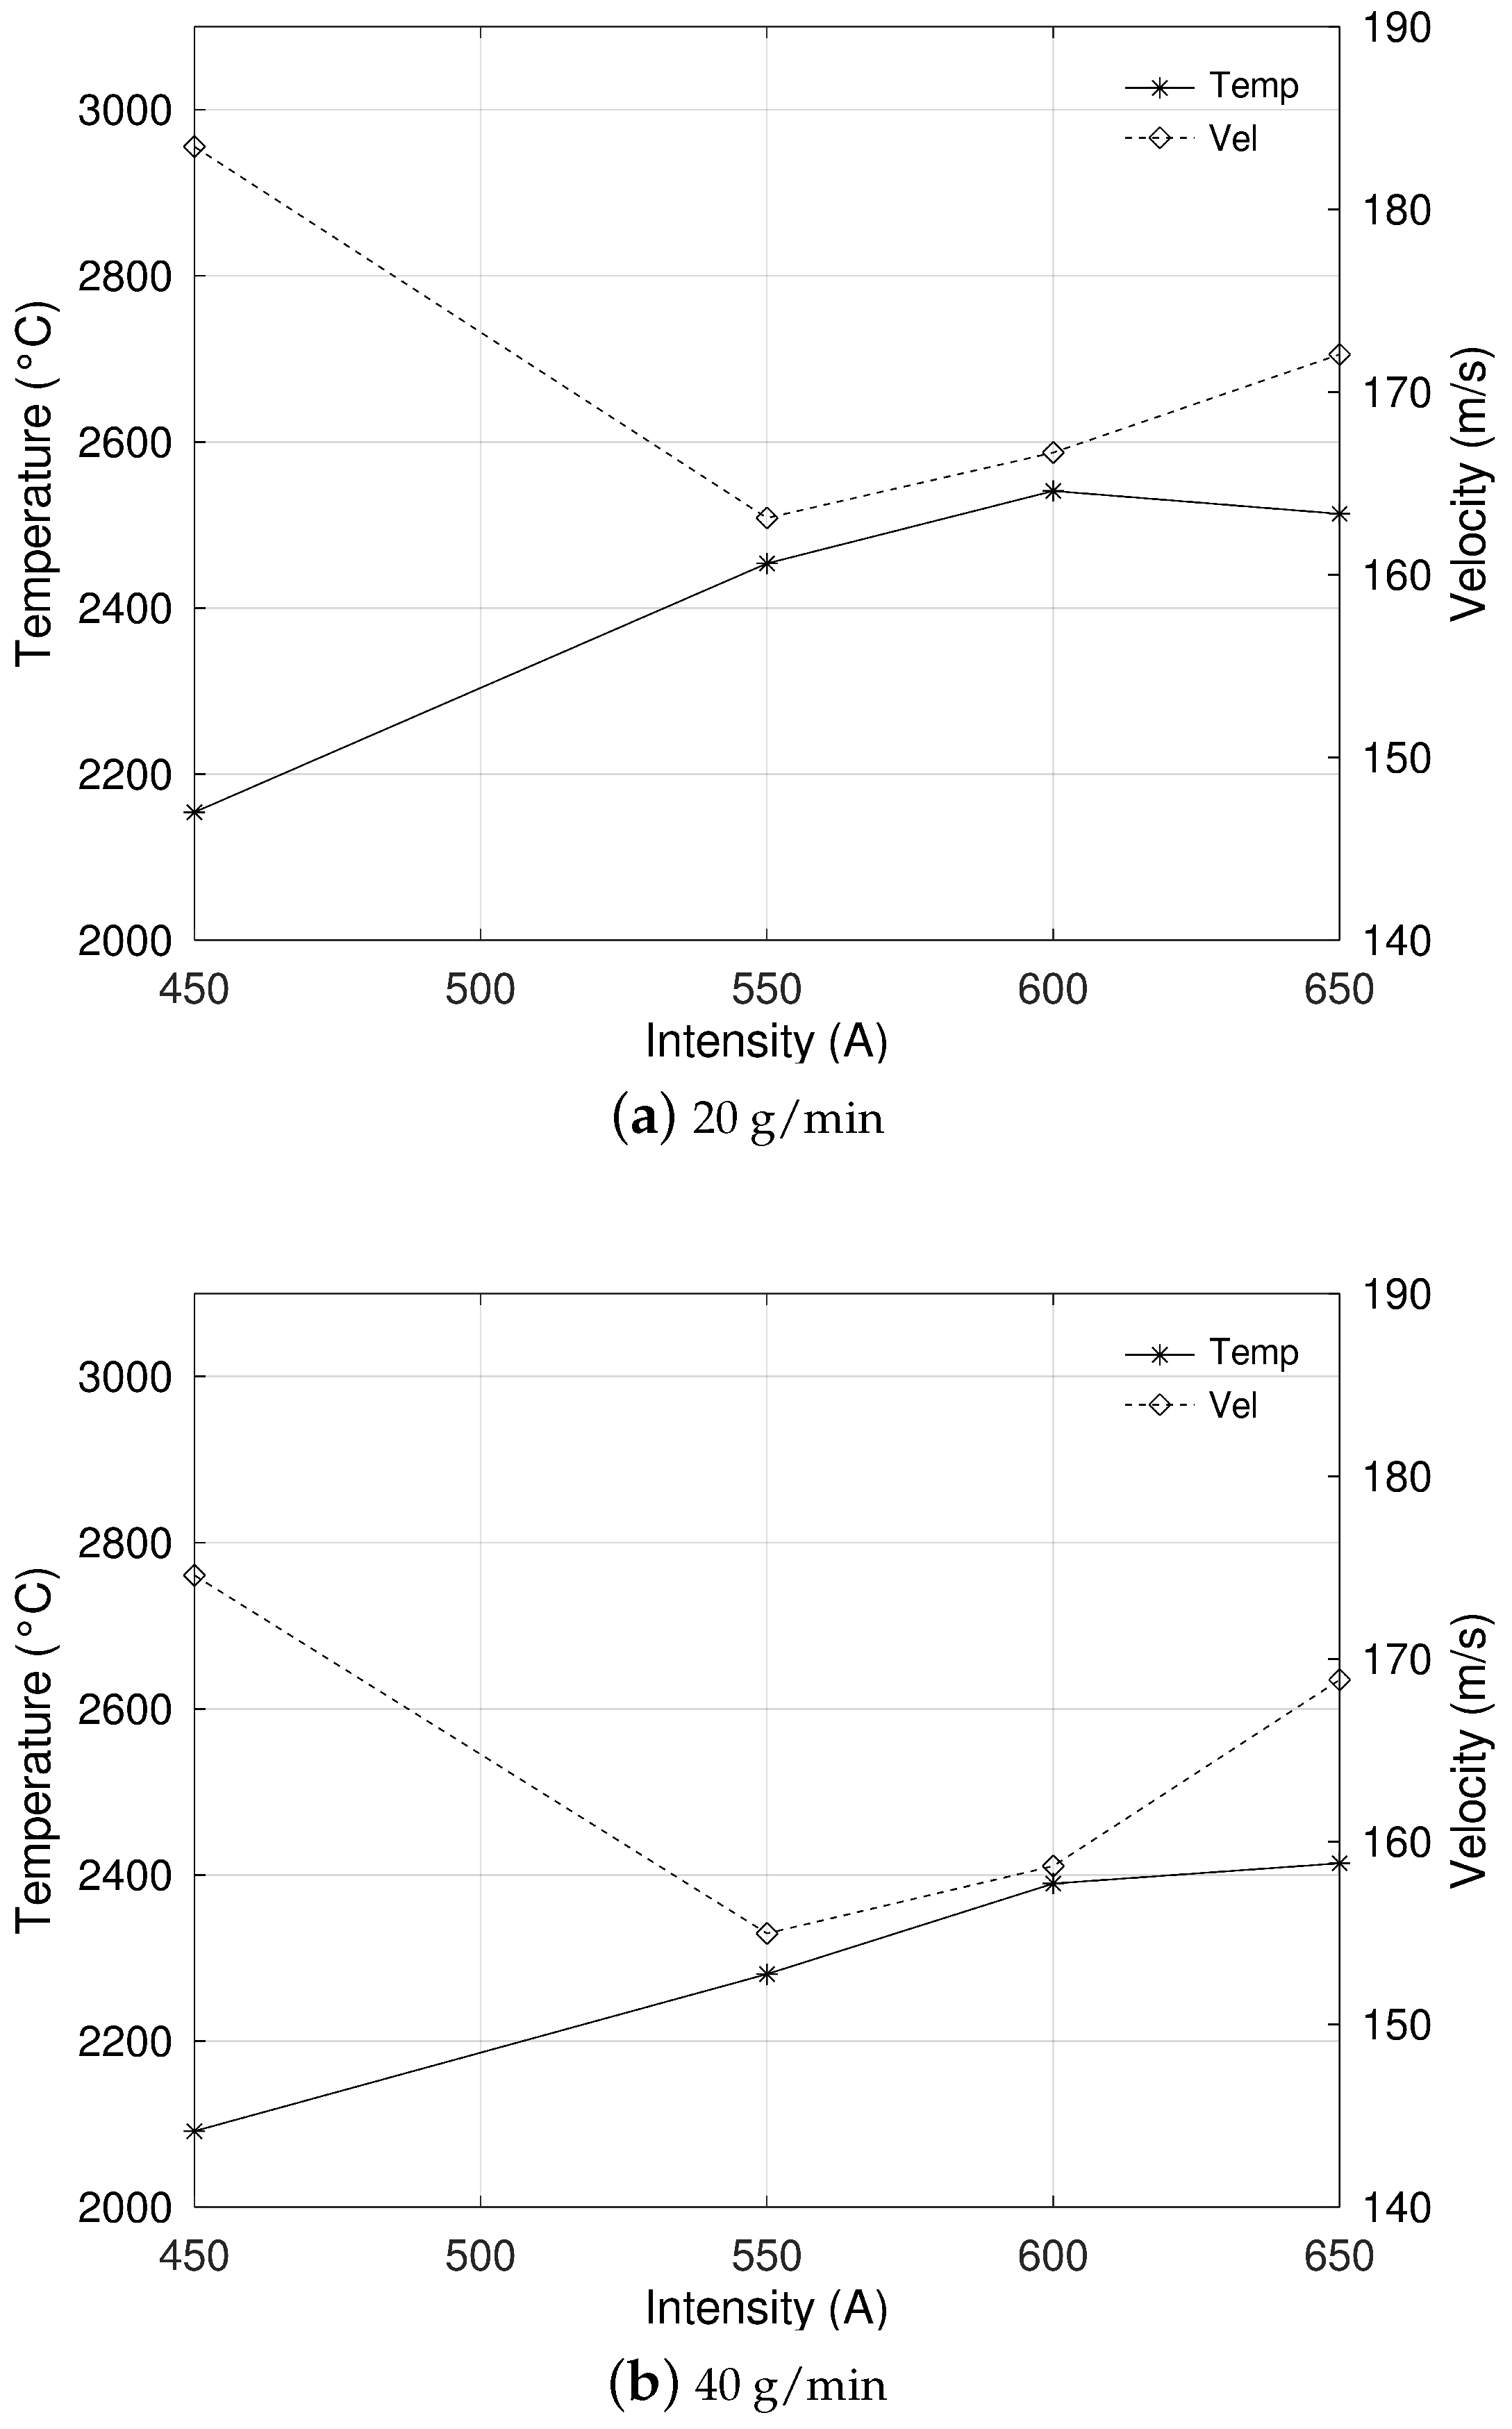
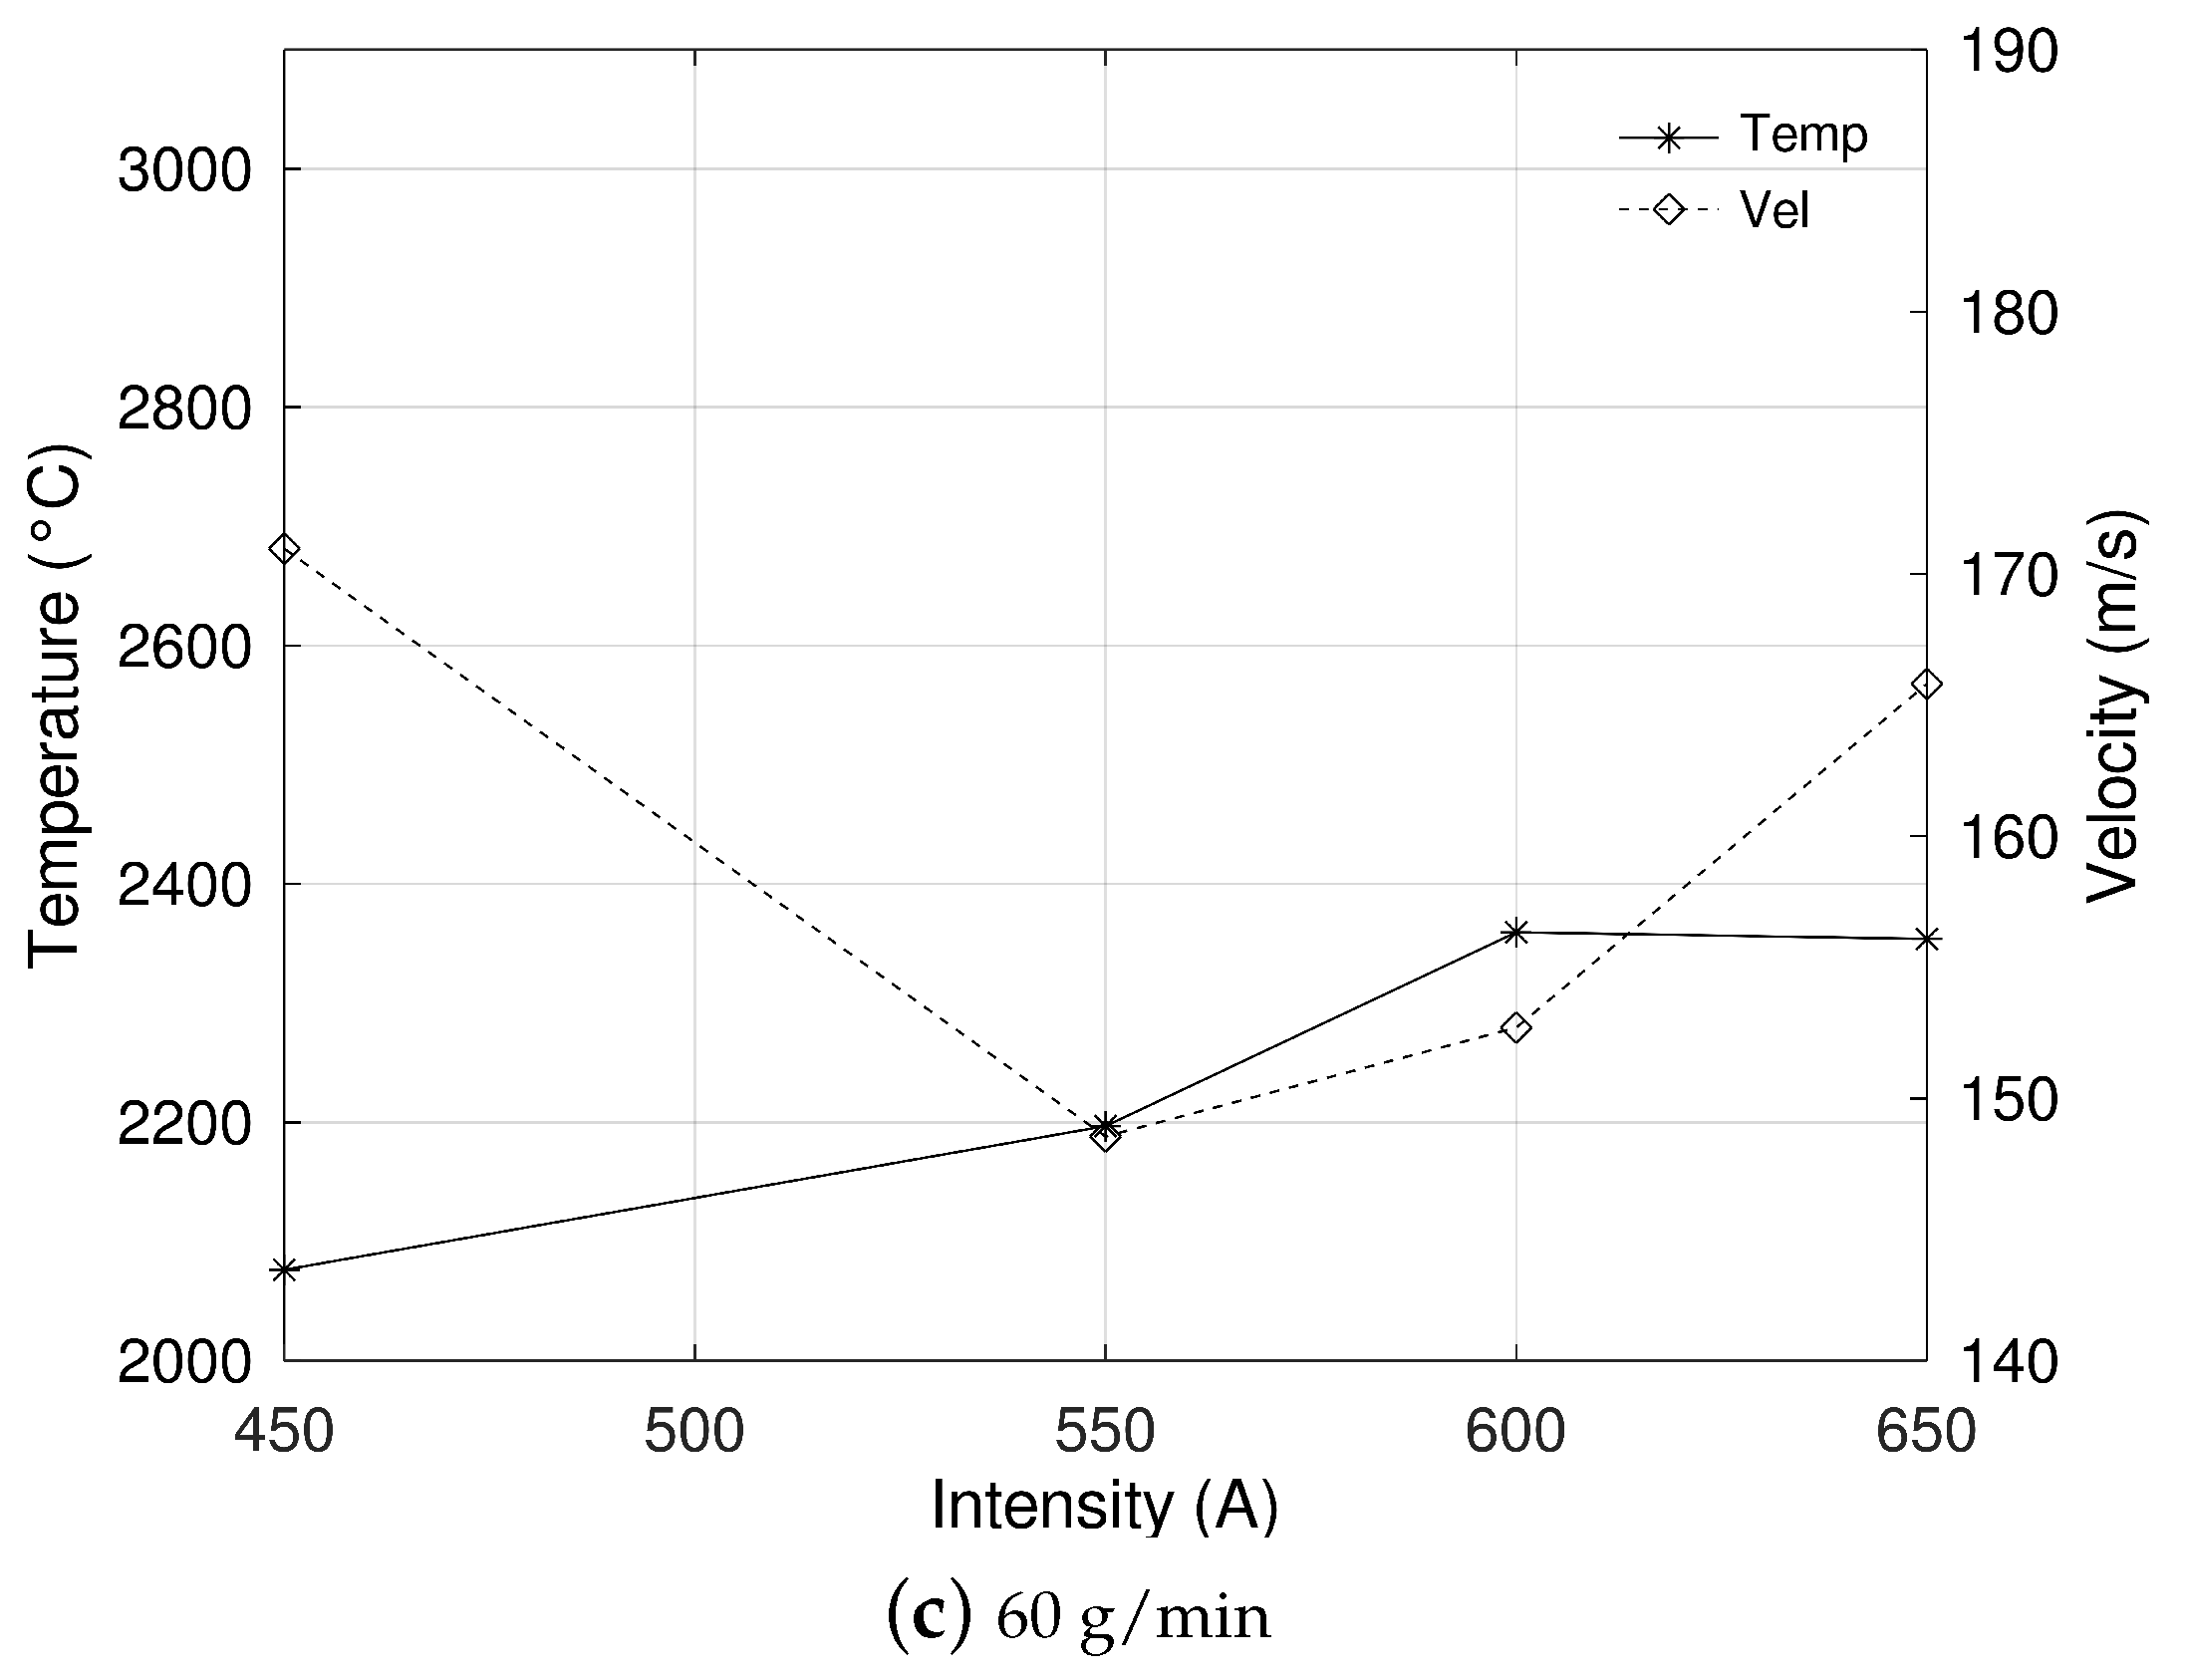
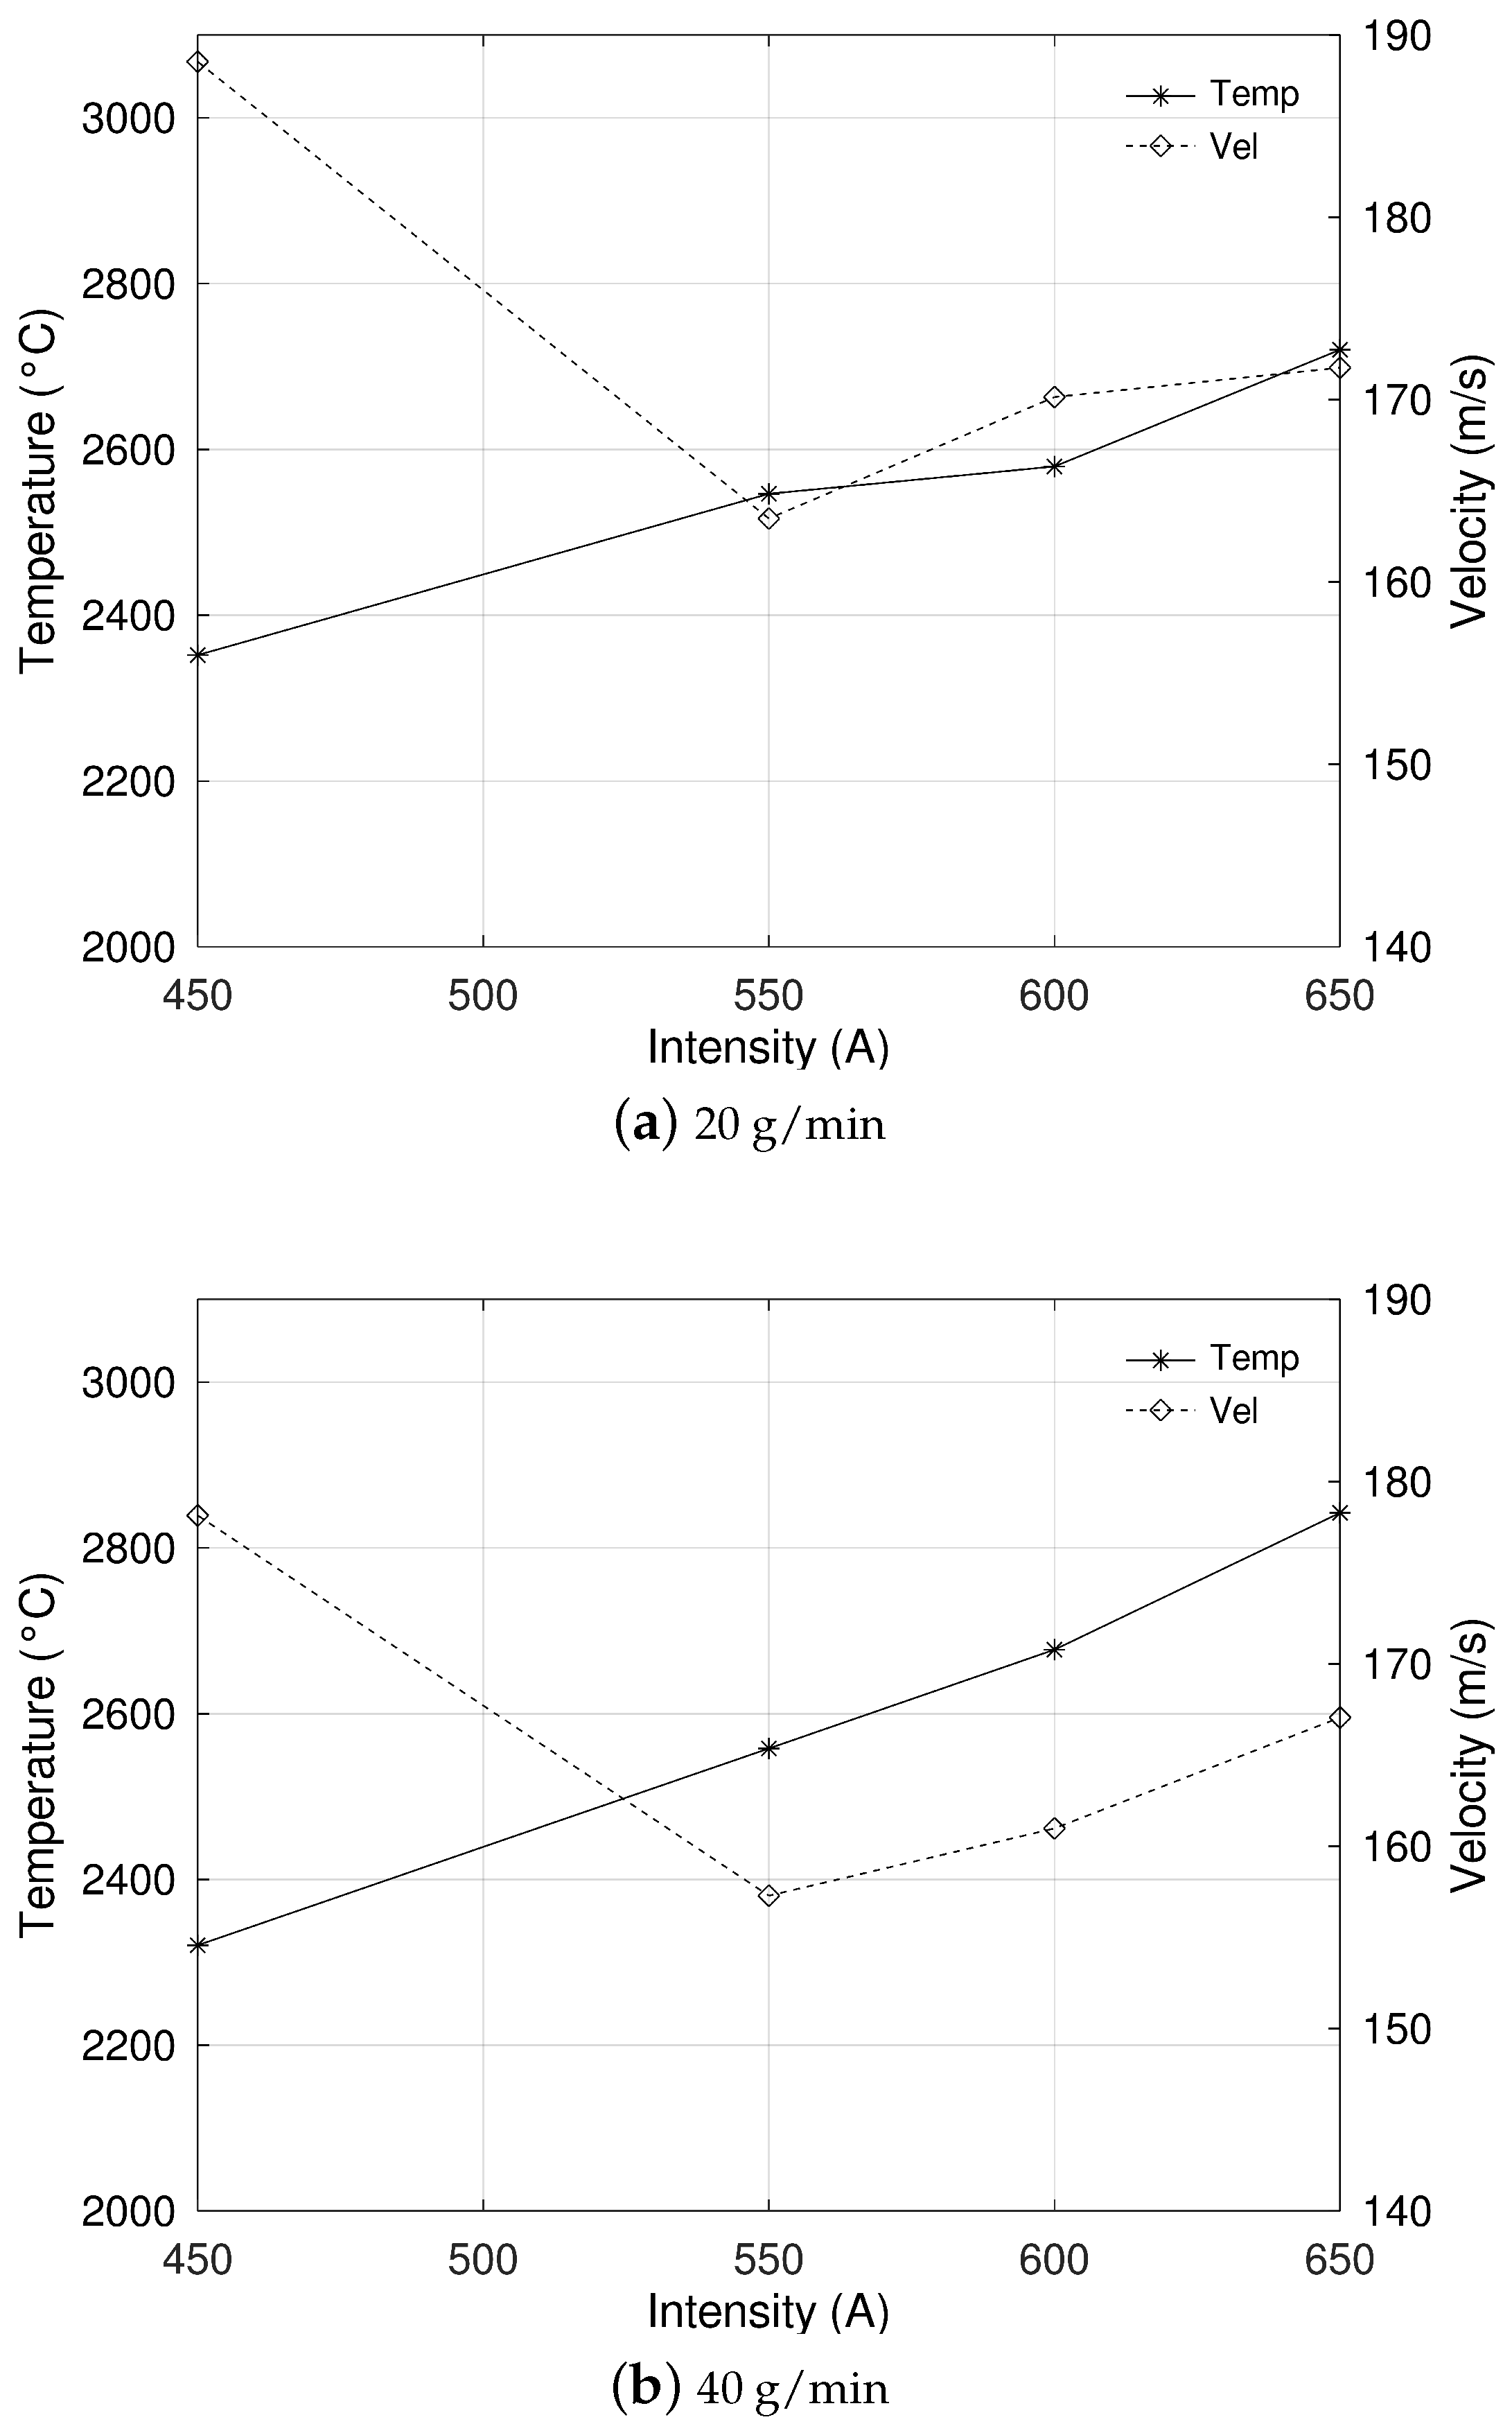
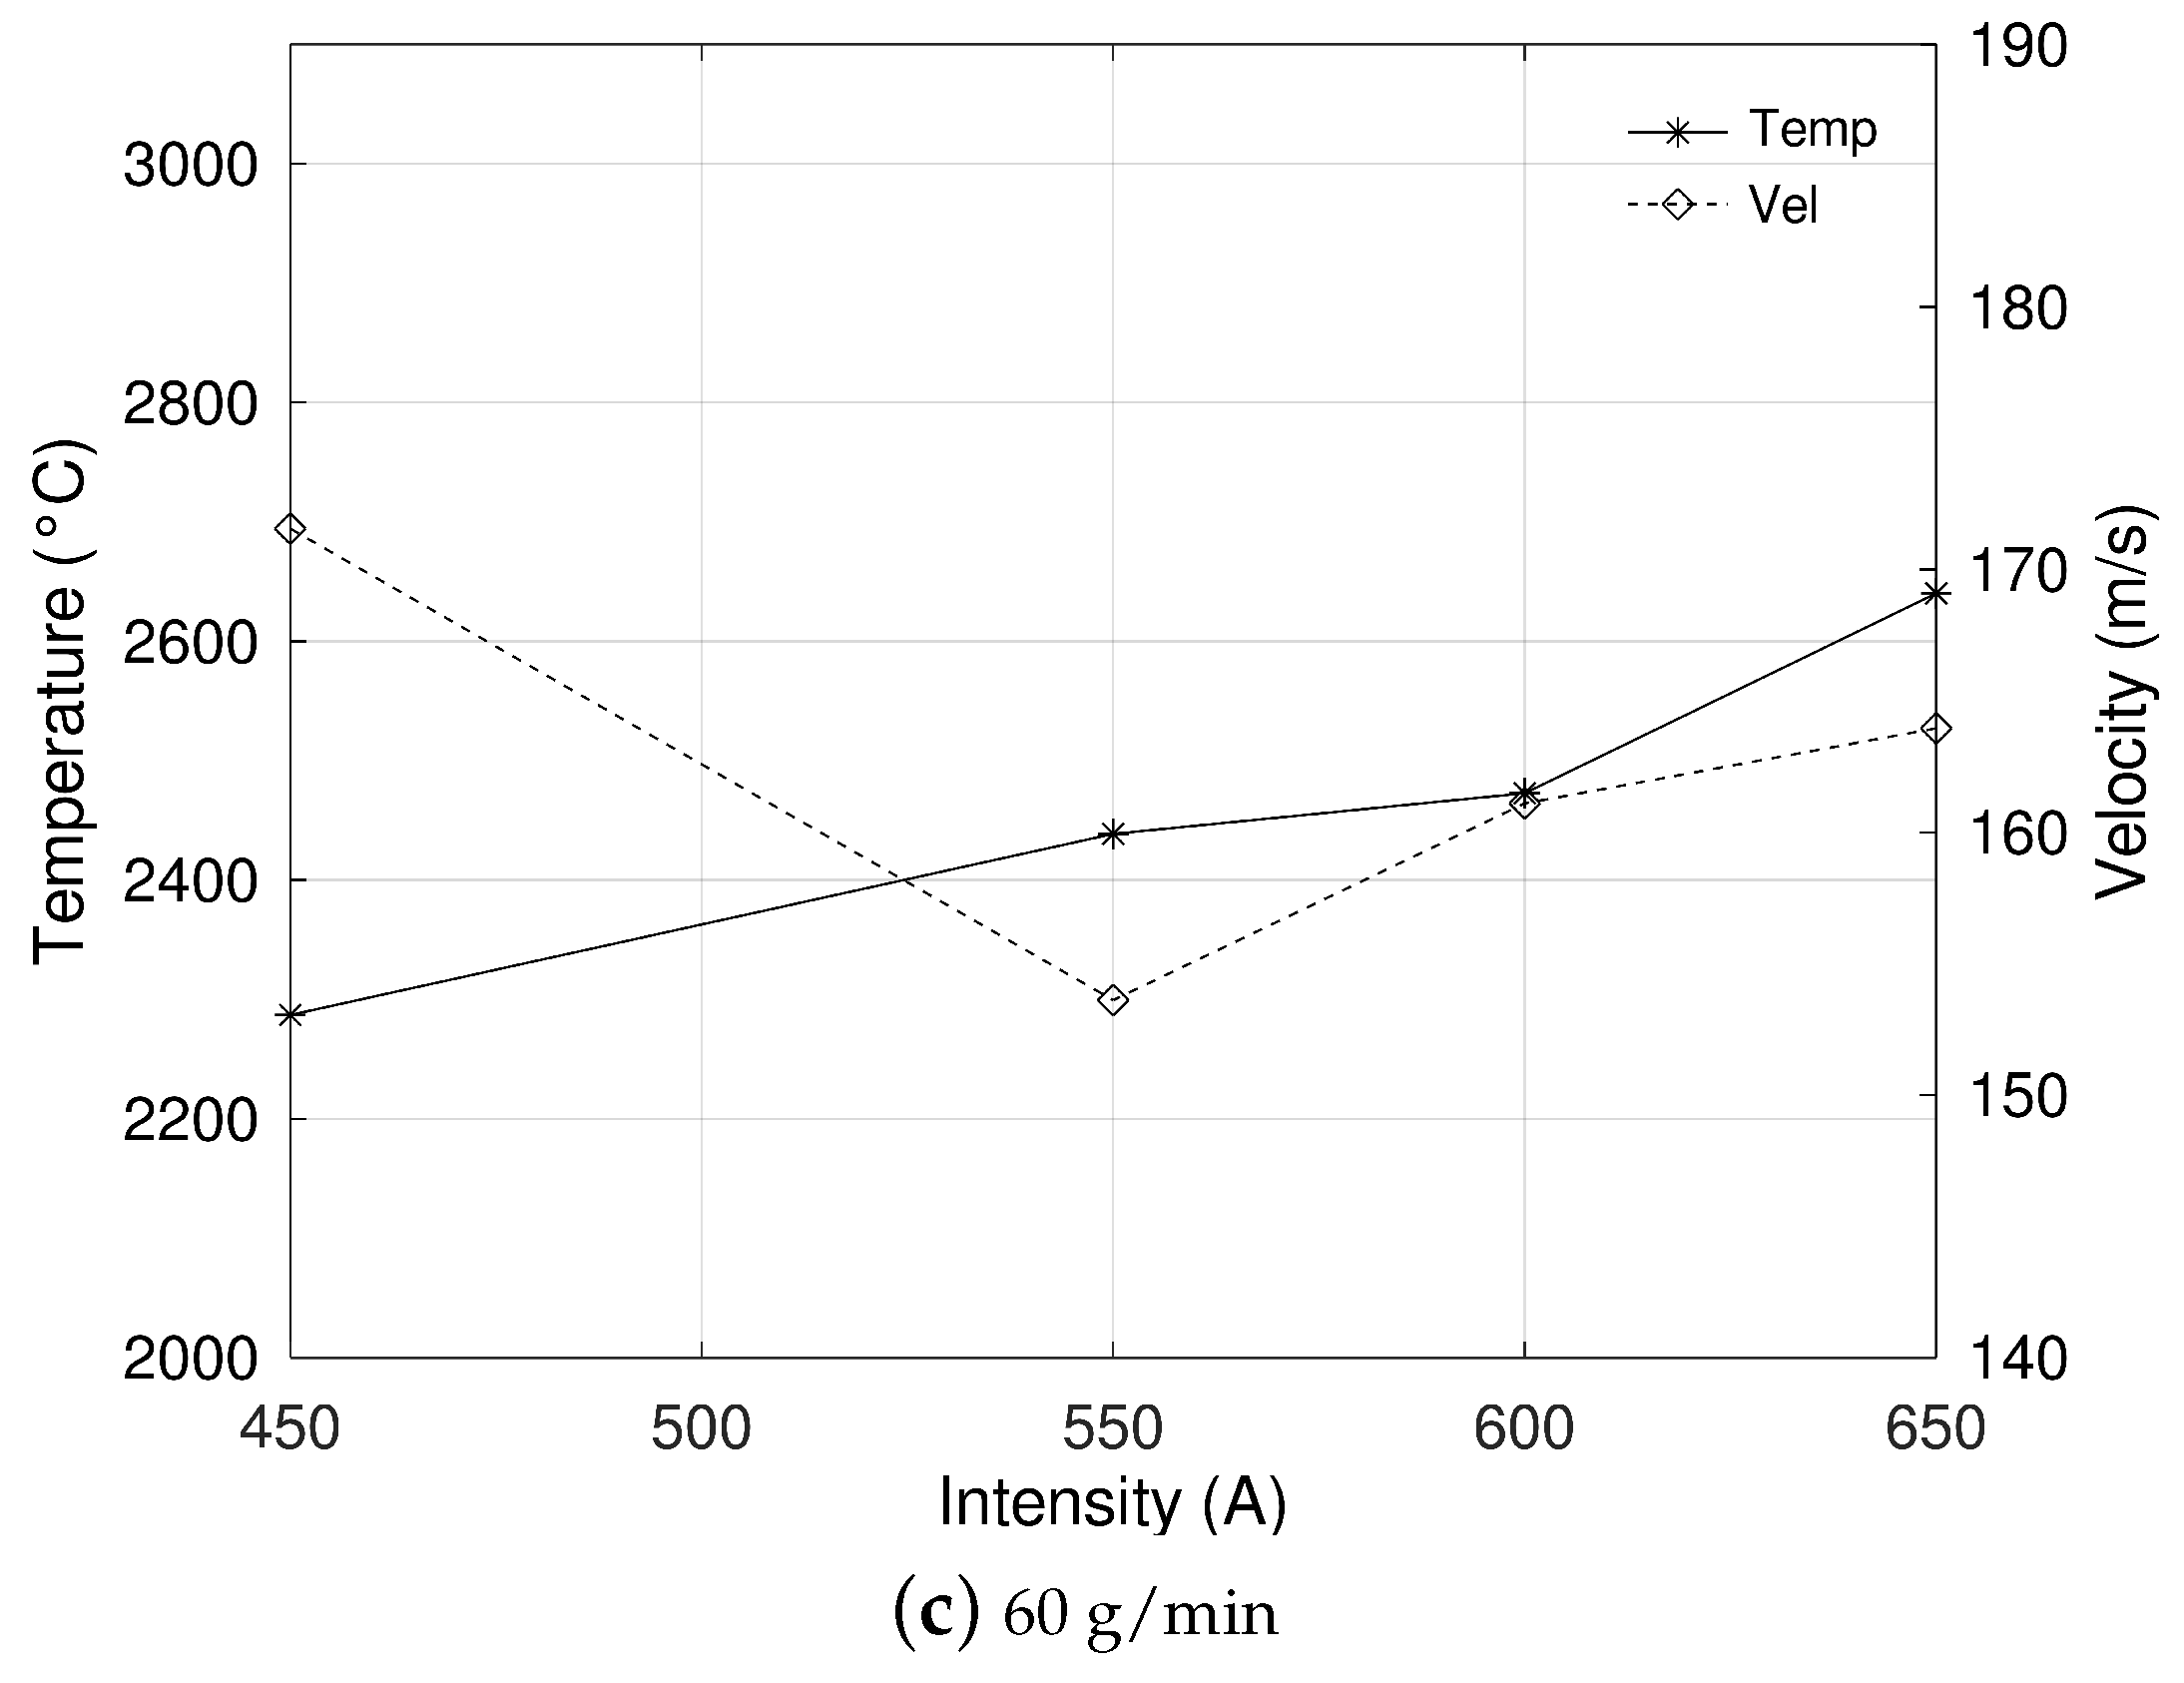
First, the surfaces were plotted with the data corresponding to a specific flow rate in the feed gas (Figure 4, Figure 5 and Figure 6 for velocity and Figure 7, Figure 8 and Figure 9 for temperature). With these surfaces, it is possible to obtain an overall idea of the particle behaviour. Figure 9 shows the vertical sections of these surfaces. Figure 10, Figure 11 and Figure 12 present the vertical sections of these surfaces.
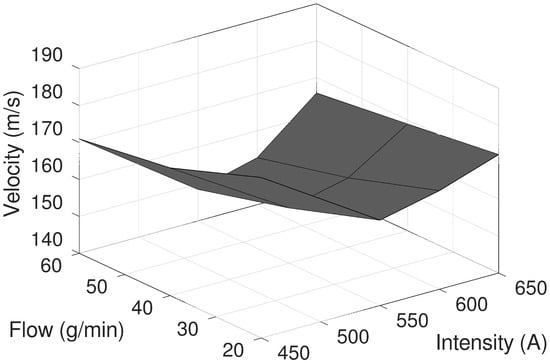
Figure 4.
Particle velocity at an flow rate of 6.5 slpm.
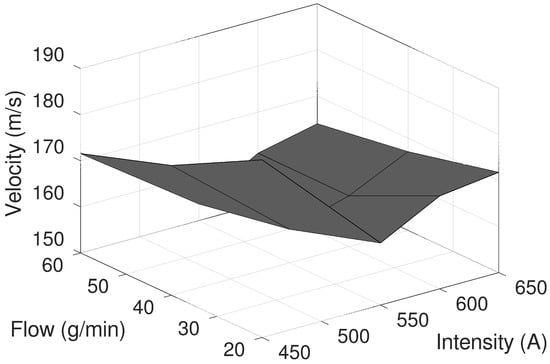
Figure 5.
Particle velocity at an flow rate of 9.5 slpm.
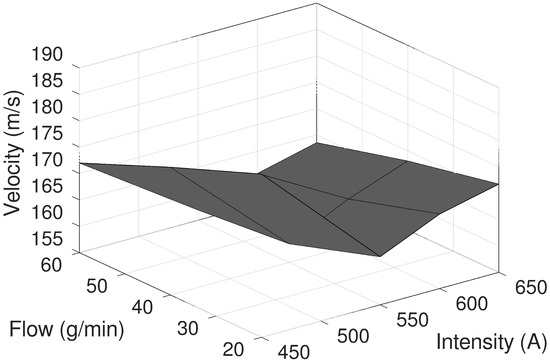
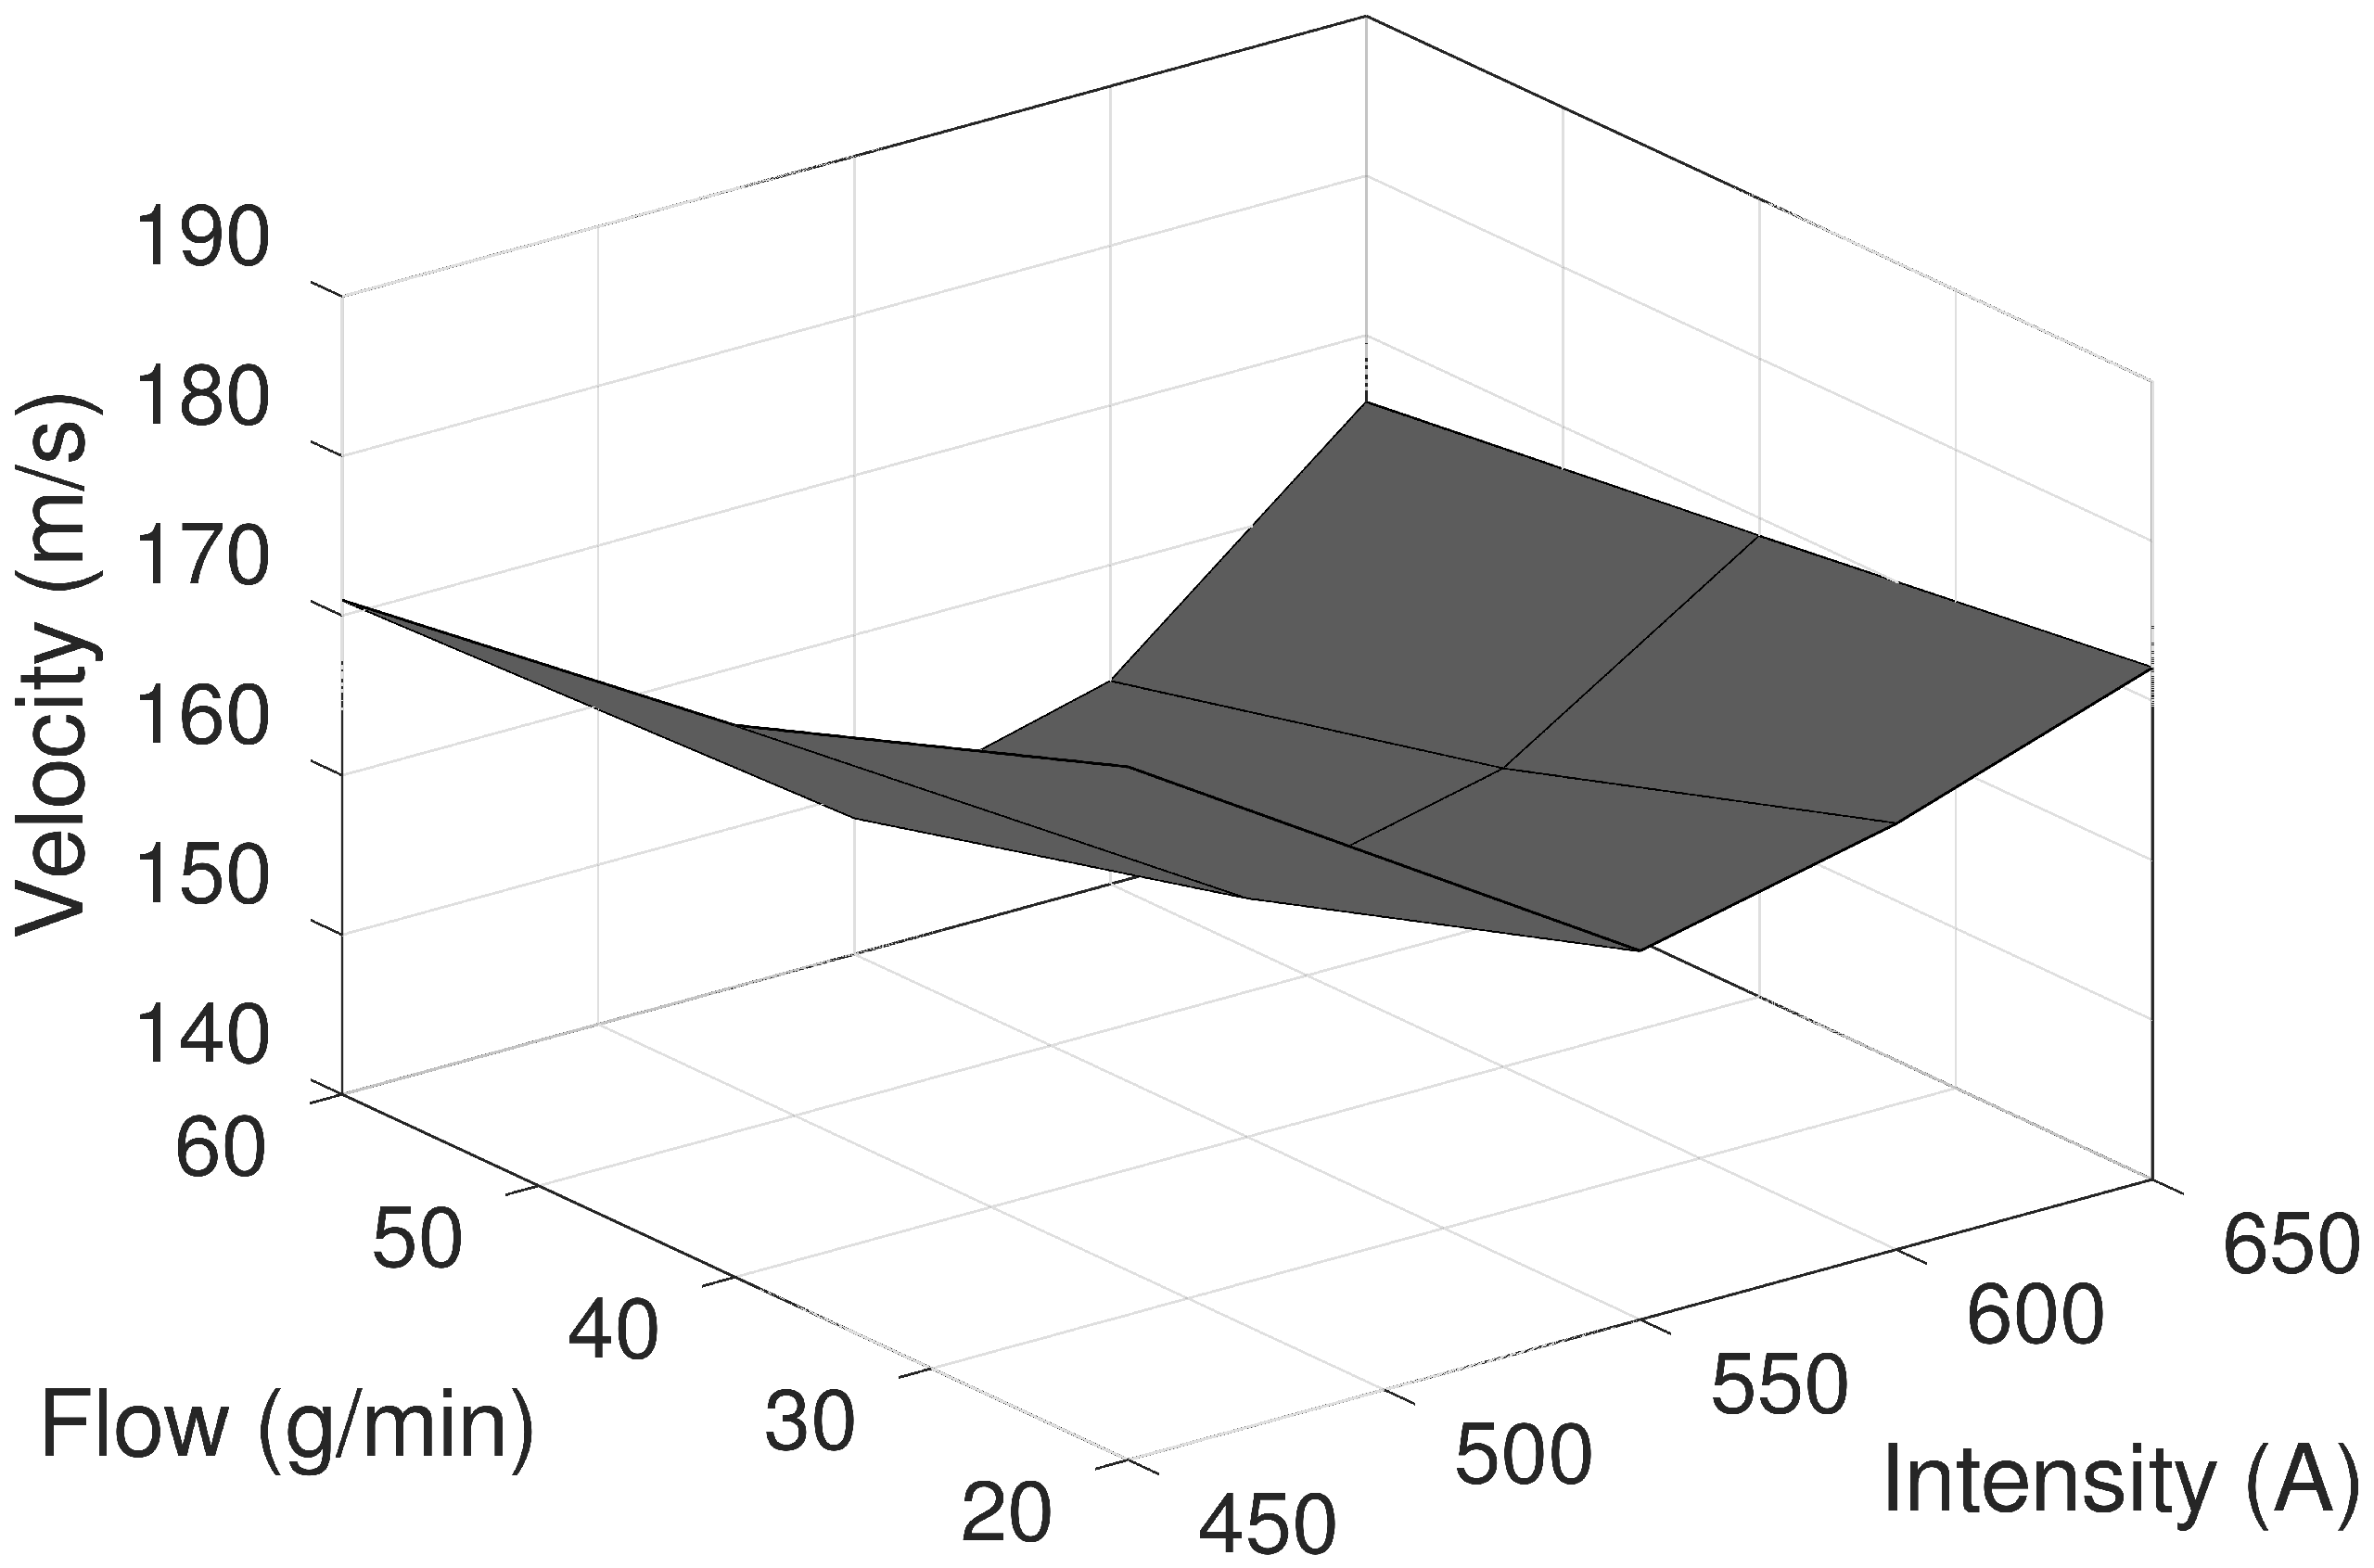
Figure 6.
Particle velocity at an flow rate of 12 slpm.
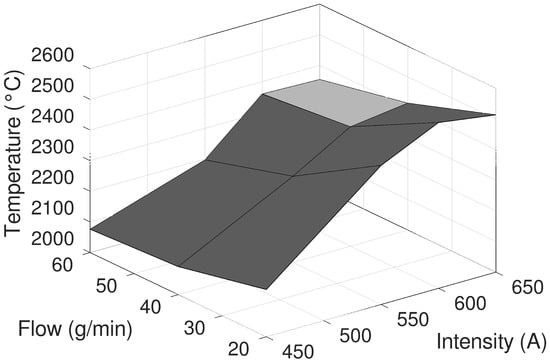
Figure 7.
Particle temperature with an flow rate of 6.5 slpm.

Figure 8.
Particle temperature at an flow rate of 9.5 slpm.
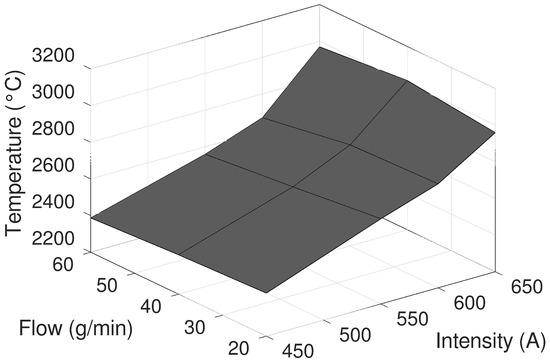
Figure 9.
Particle temperature at flow rate of 12 slpm.
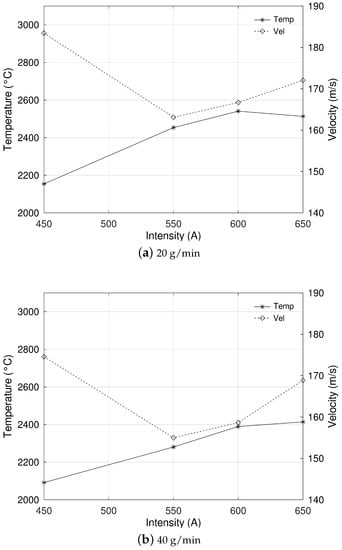
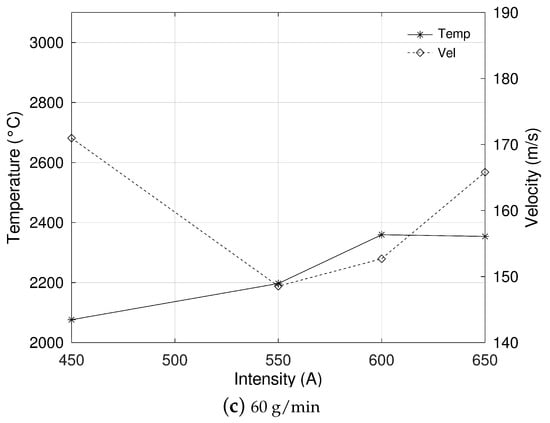
Figure 10.
Sections of figures for an flow rate of 6.5 slpm.
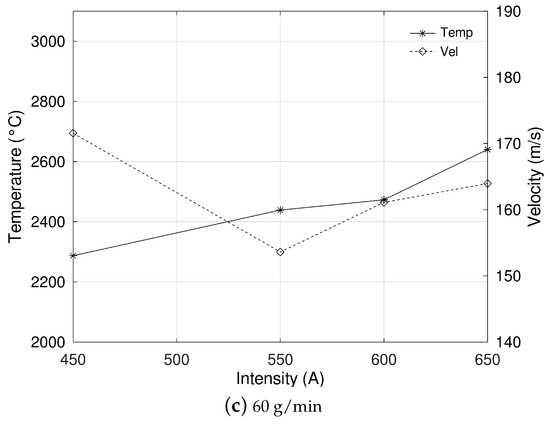
Figure 11.
Sections of figures for an flow rate 9.5 slpm.
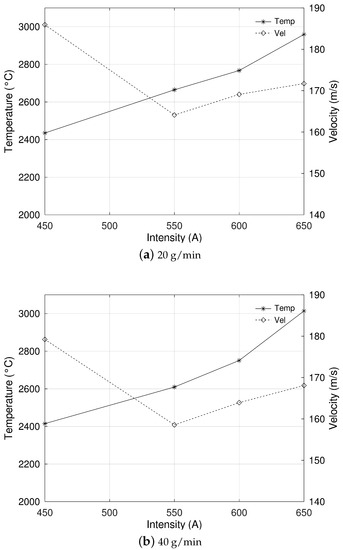
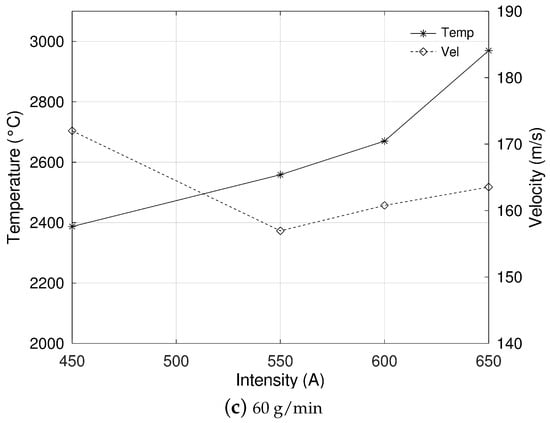
Figure 12.
Sections of figures for an flow rate 12 slpm.
A valley in the particle velocity with increasing intensity is shown in Figure 4. This valley was related to the supersonic flow reached in the gas. The upstream pressure at the point where a Mach number equal to unity was reached increased due to heating, whilst the downstream pressure remained the same. When the sonic lock condition was reached, the gas flow rate remained constant even though the upstream pressure increased. Velocities and temperatures, given in Figure 7, decrease with particle mass flow. One explanation for this is the increasing mass inertia of the particles, which enter the flow perpendicular to the flow and the thermal inertia as they enter at an ambient temperature.
Figure 5 and Figure 8 show a similar trend to Figure 4 and Figure 7, respectively, although in this case, the velocities and temperatures were higher. This can be explained by the higher heat-radiating capacity of the molecule; the literature confirms this [31]. The slopes of the surfaces are less steep, making the system more stable.
The surfaces in Figure 6 and Figure 9, with the same trend as the previous figures, show smaller slopes, although the trend does continue. The higher the mass flow rate, the slower the velocities.
Figure 8 shows atypical results with respect to the rest, showing higher temperature values for a mass flow rate of 40 g/min. The flow value was 9.5 slpm. The trend was observed for all three intensity values, so accidental interference during the measurement should be ruled out. These results can be explained as follows. The particles penetrated less into the jet when the mass flow rate was small, as they had a lower velocity perpendicular to the jet. When the mass flow rate was sufficient to ensure that the particle penetrated the jet, its temperature increased. This explains the direct relationship between mass flow rate and temperature. For a given value of the mass flow rate, the penetration of the cold particle into the centre of the jet was ensured. If the flow rate increased further, the factor of how many cold particles tried to heat up became more important, and the relationship between mass flow rate and particle temperature became inverse. Therefore, the optimum from the point of view of particle temperature, the highest value, corresponded to an intermediate flow.
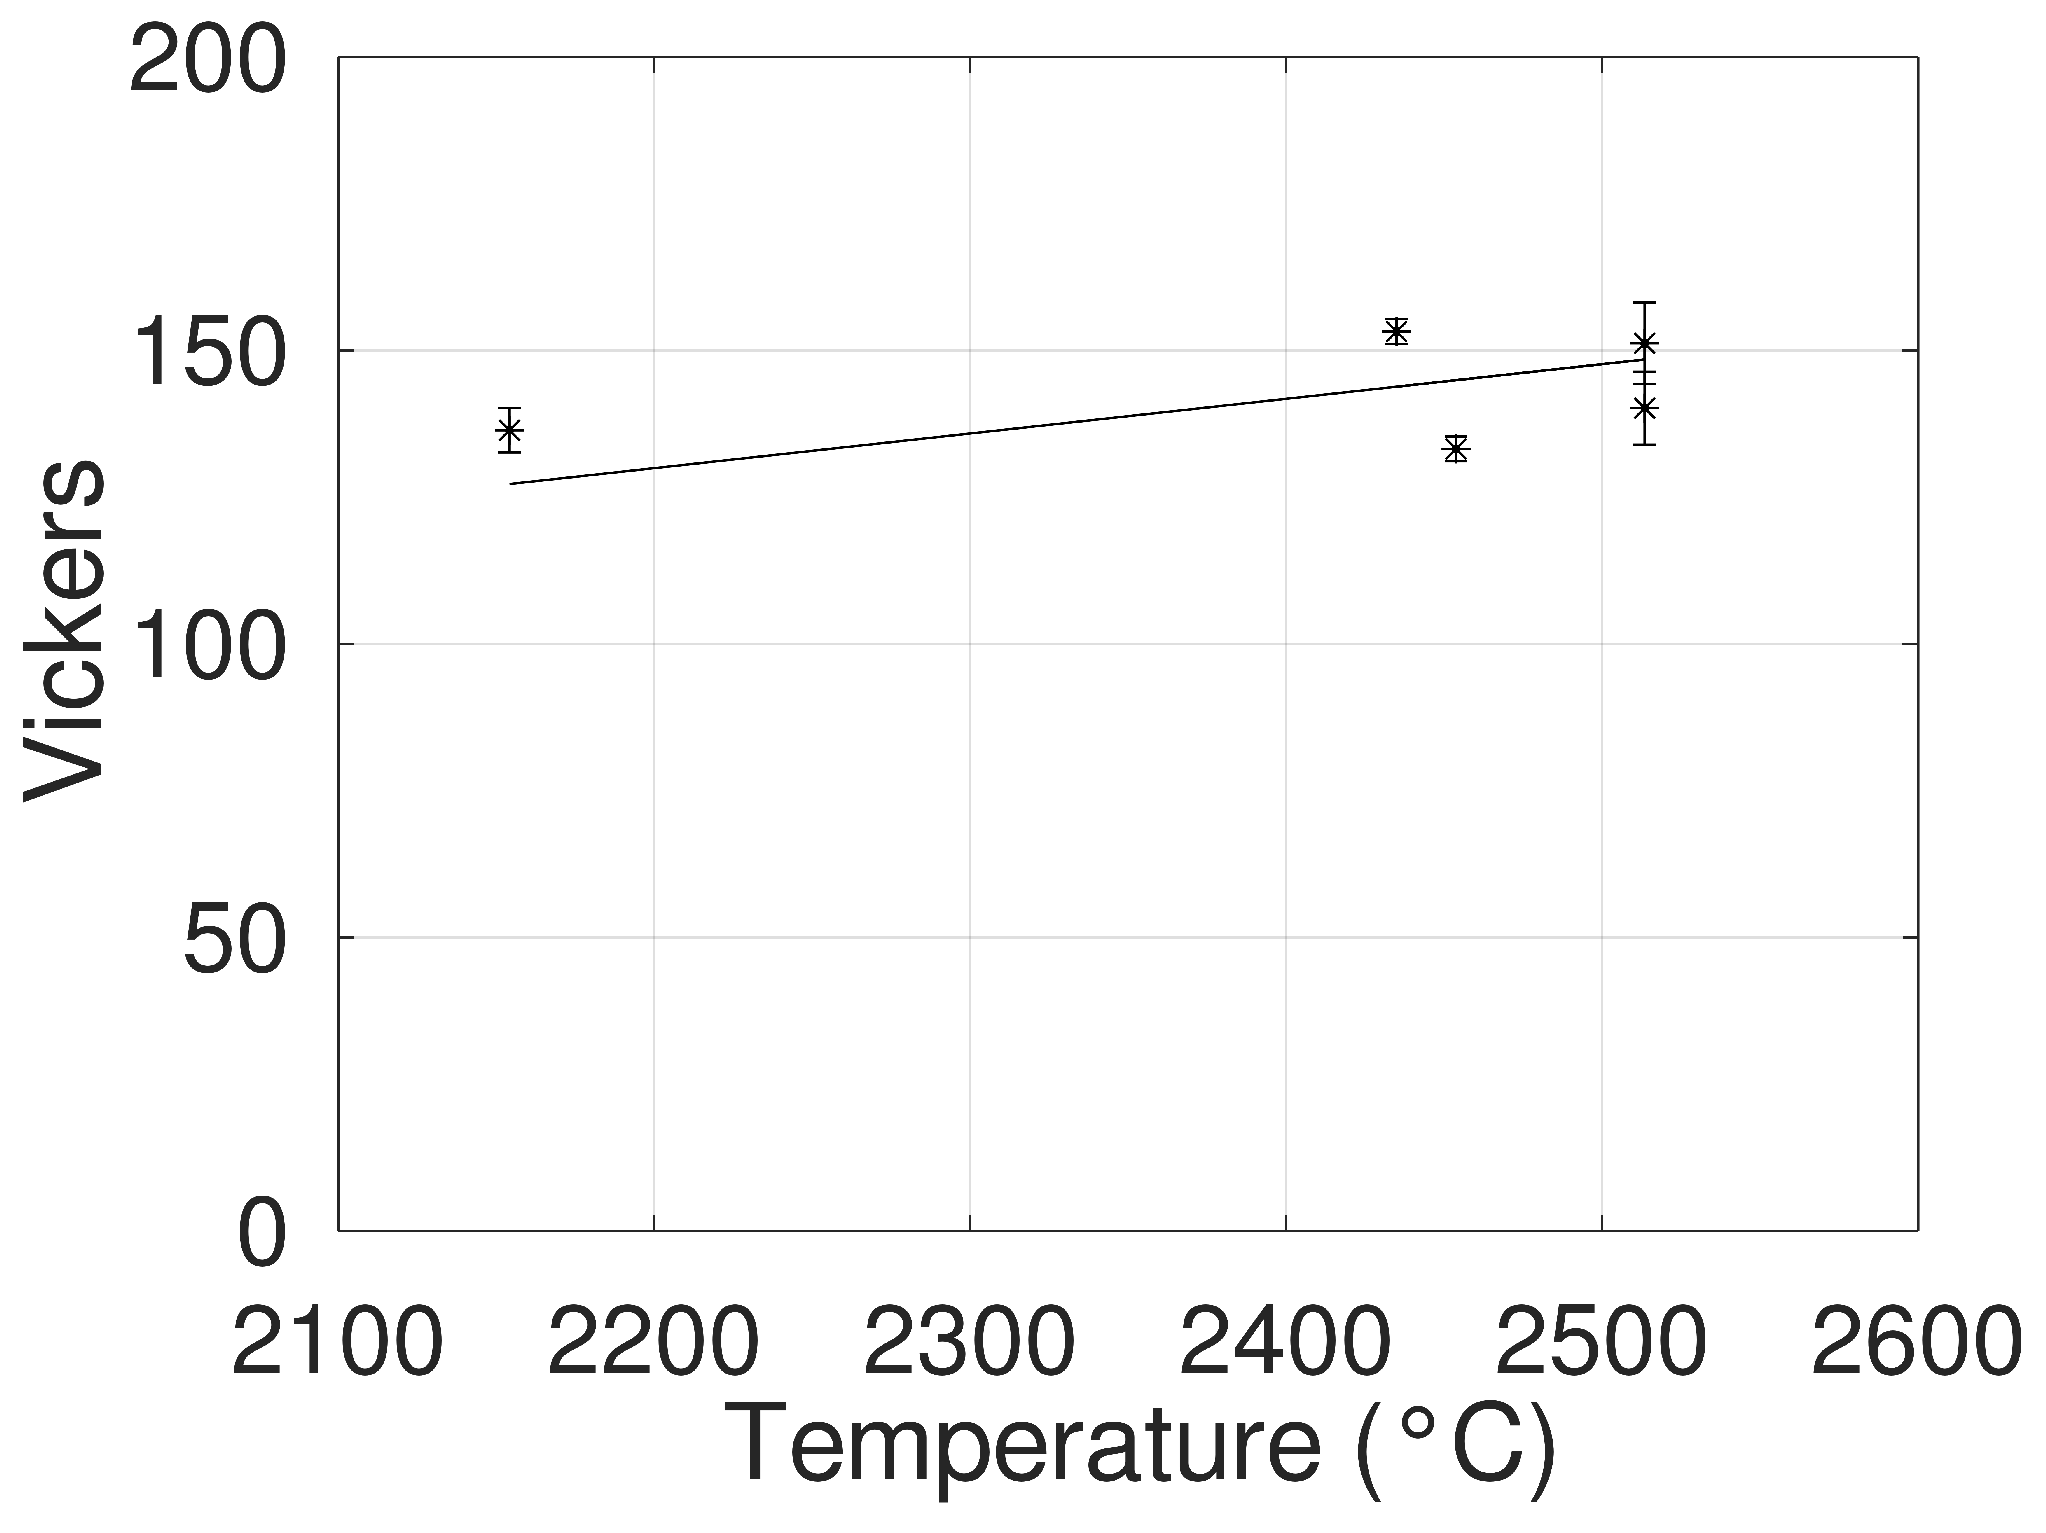
The distribution of hardness values for the particle velocities and temperatures obtained with the selected spray parameters are given in Figure 13 and Figure 14.
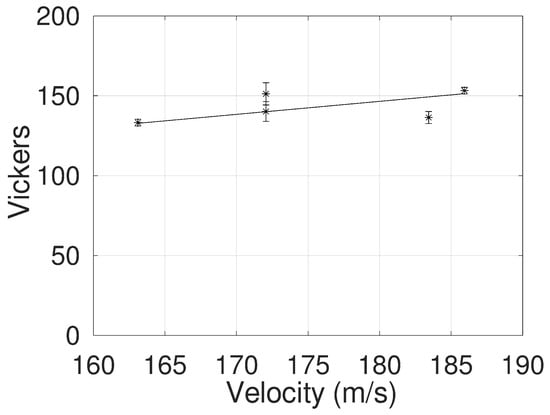
Figure 13.
Relationship between Vickers hardness of the coating and particle velocity: centre of hardness range (*).
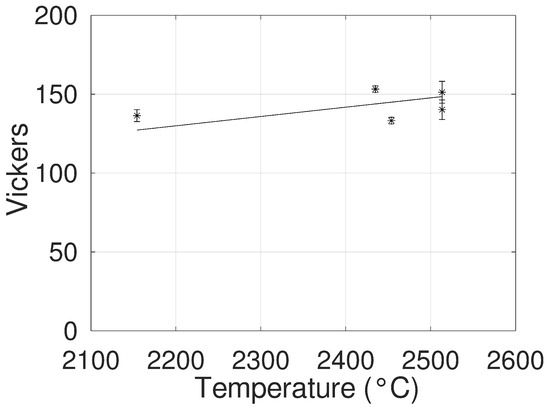
Figure 14.
Relationship between Vickers hardness of the coating and particle temperature: centre of hardness range (*).
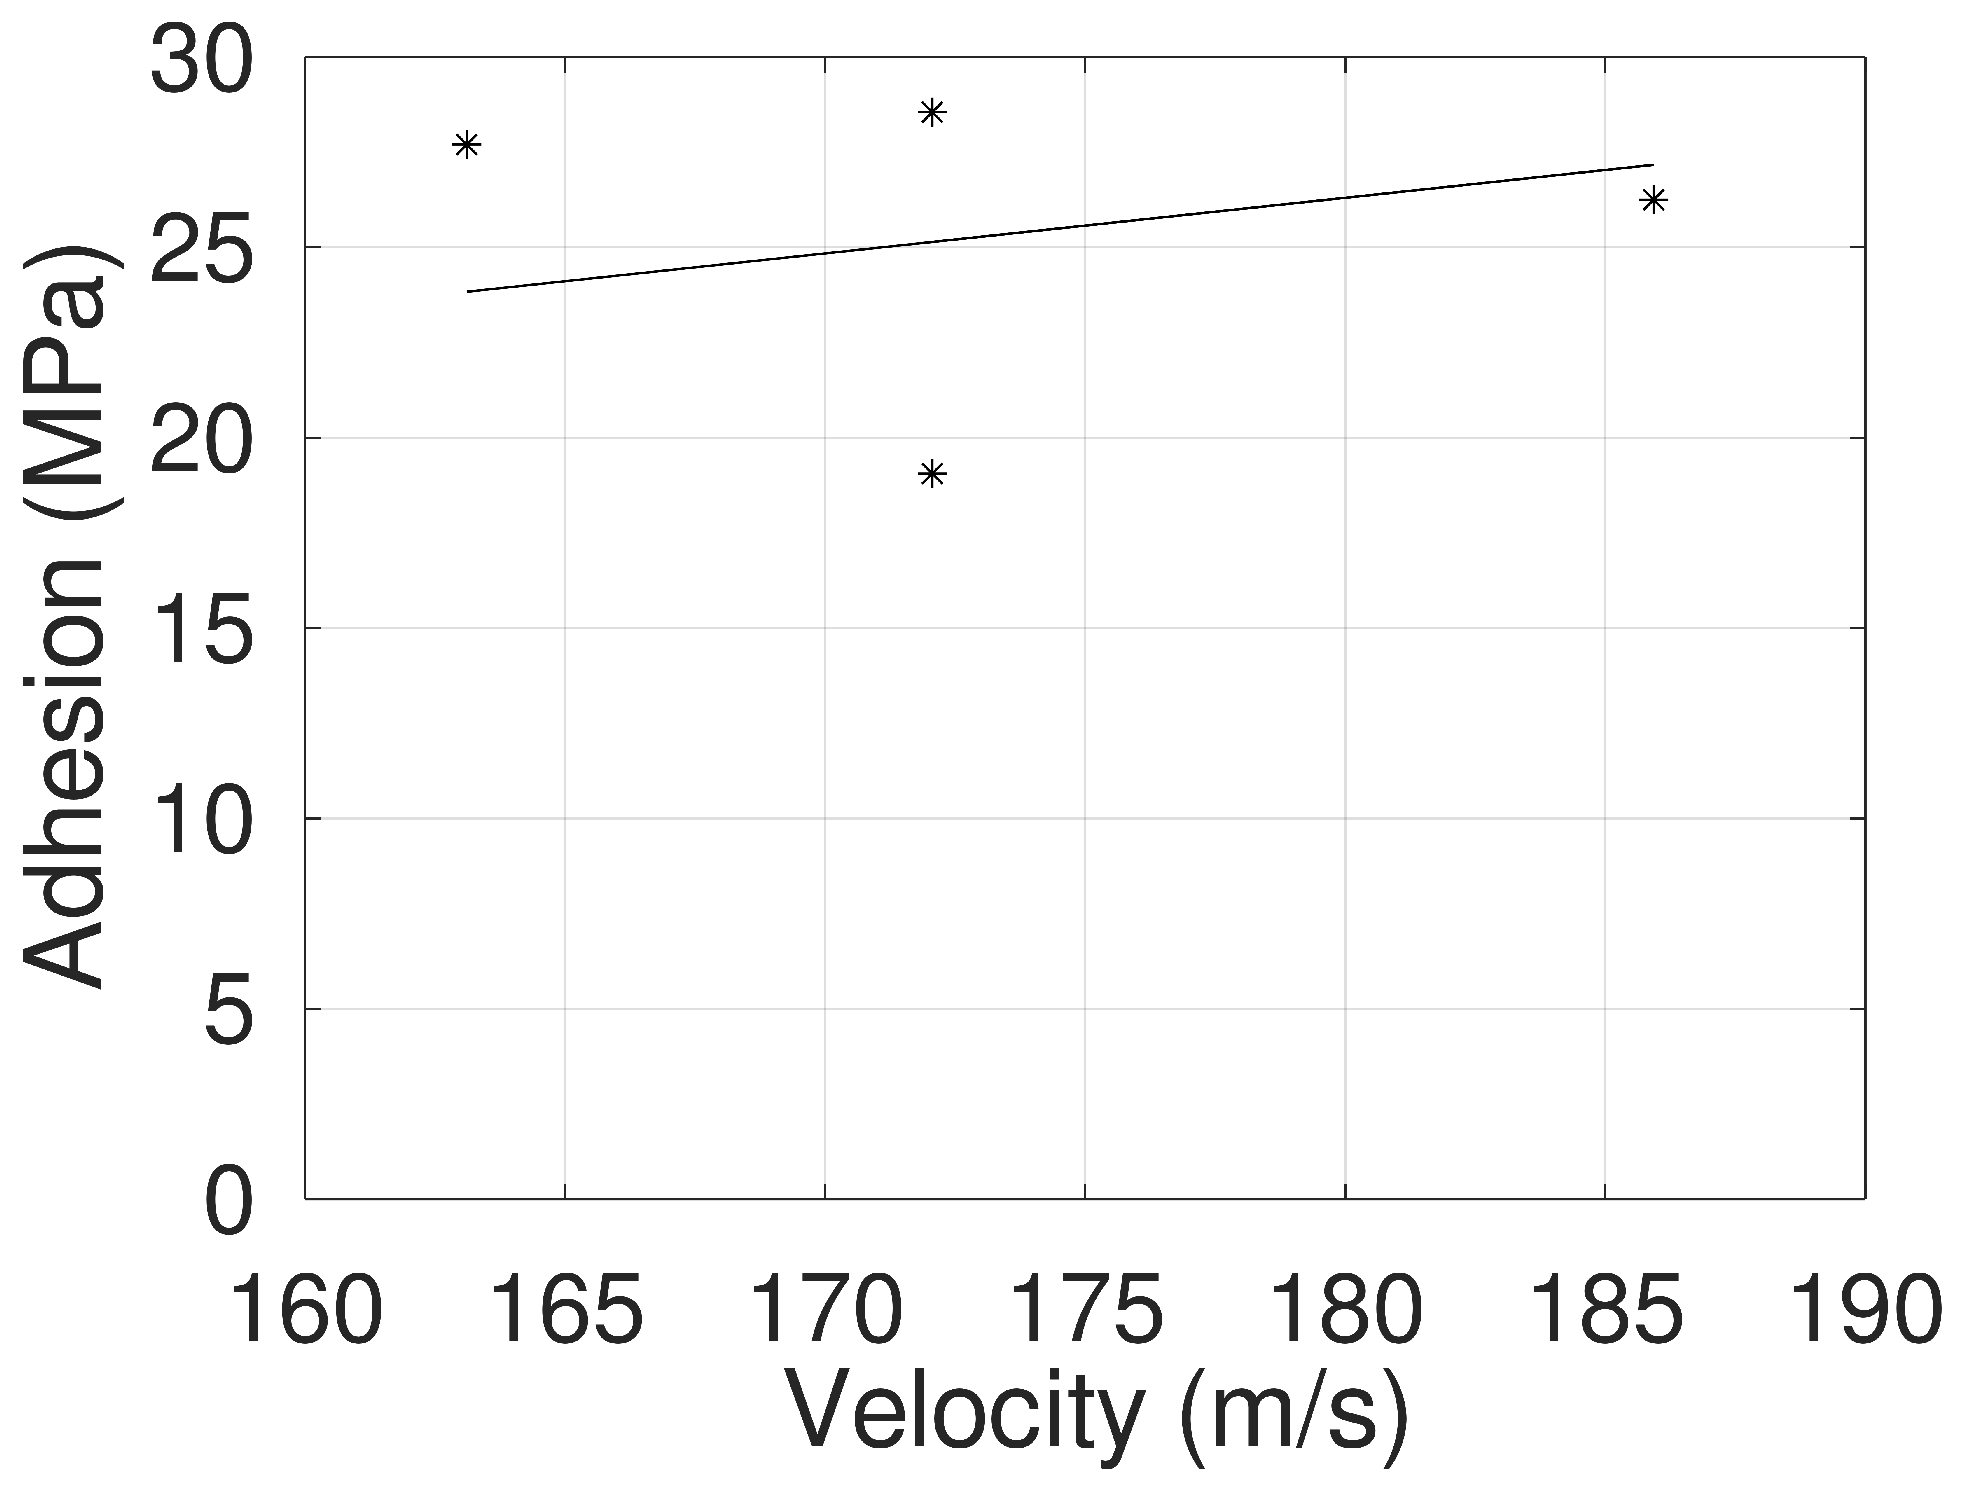
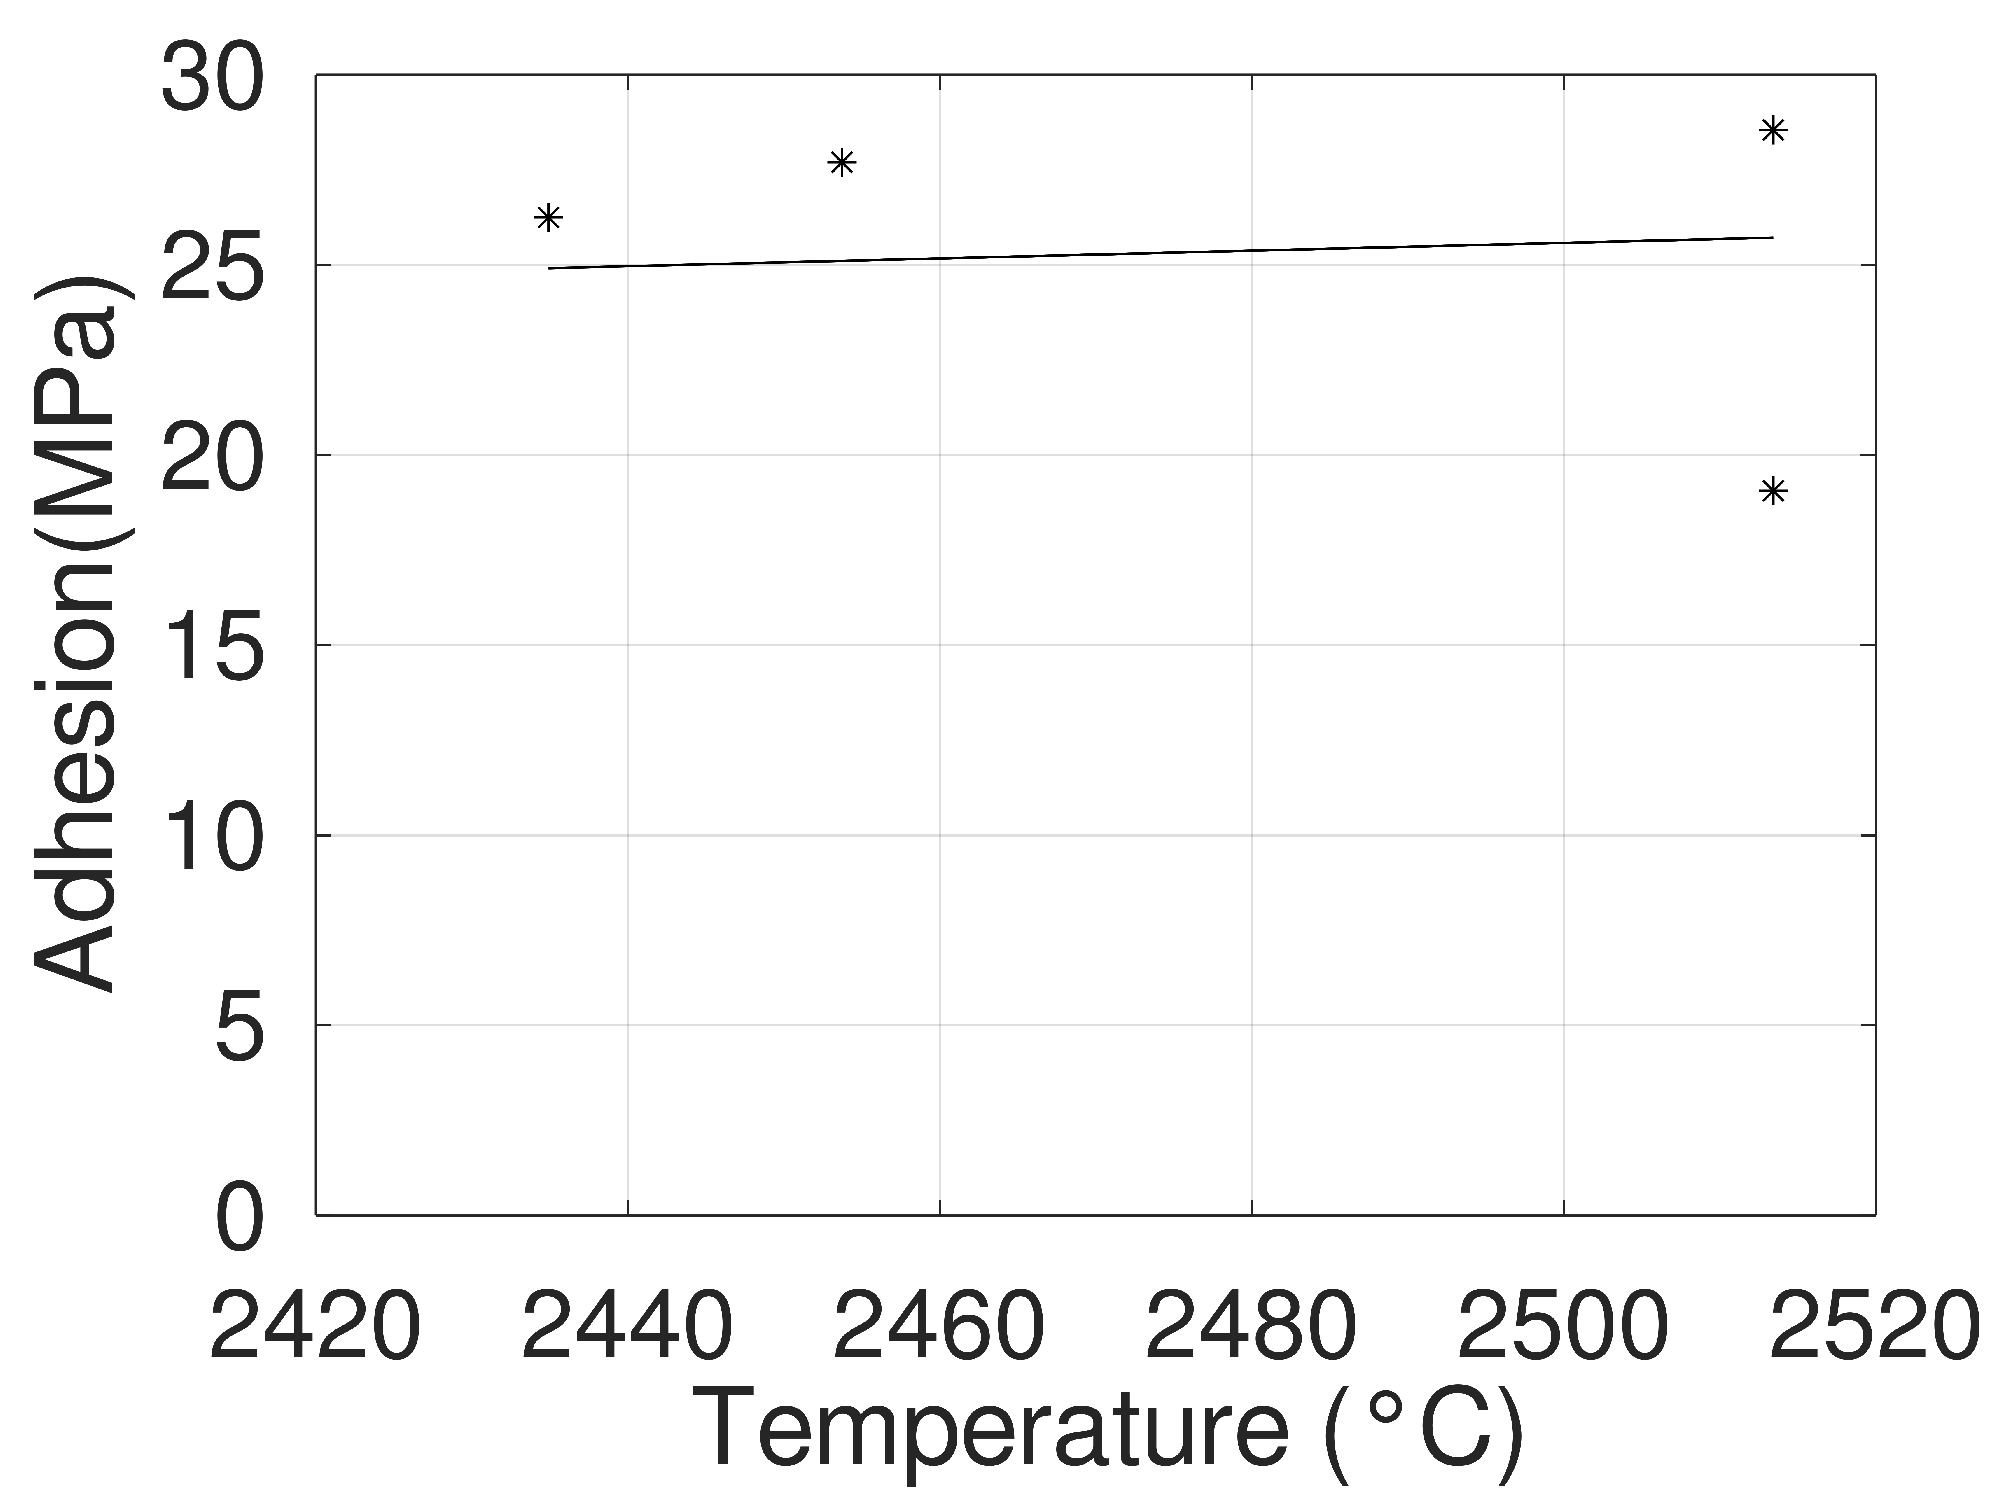
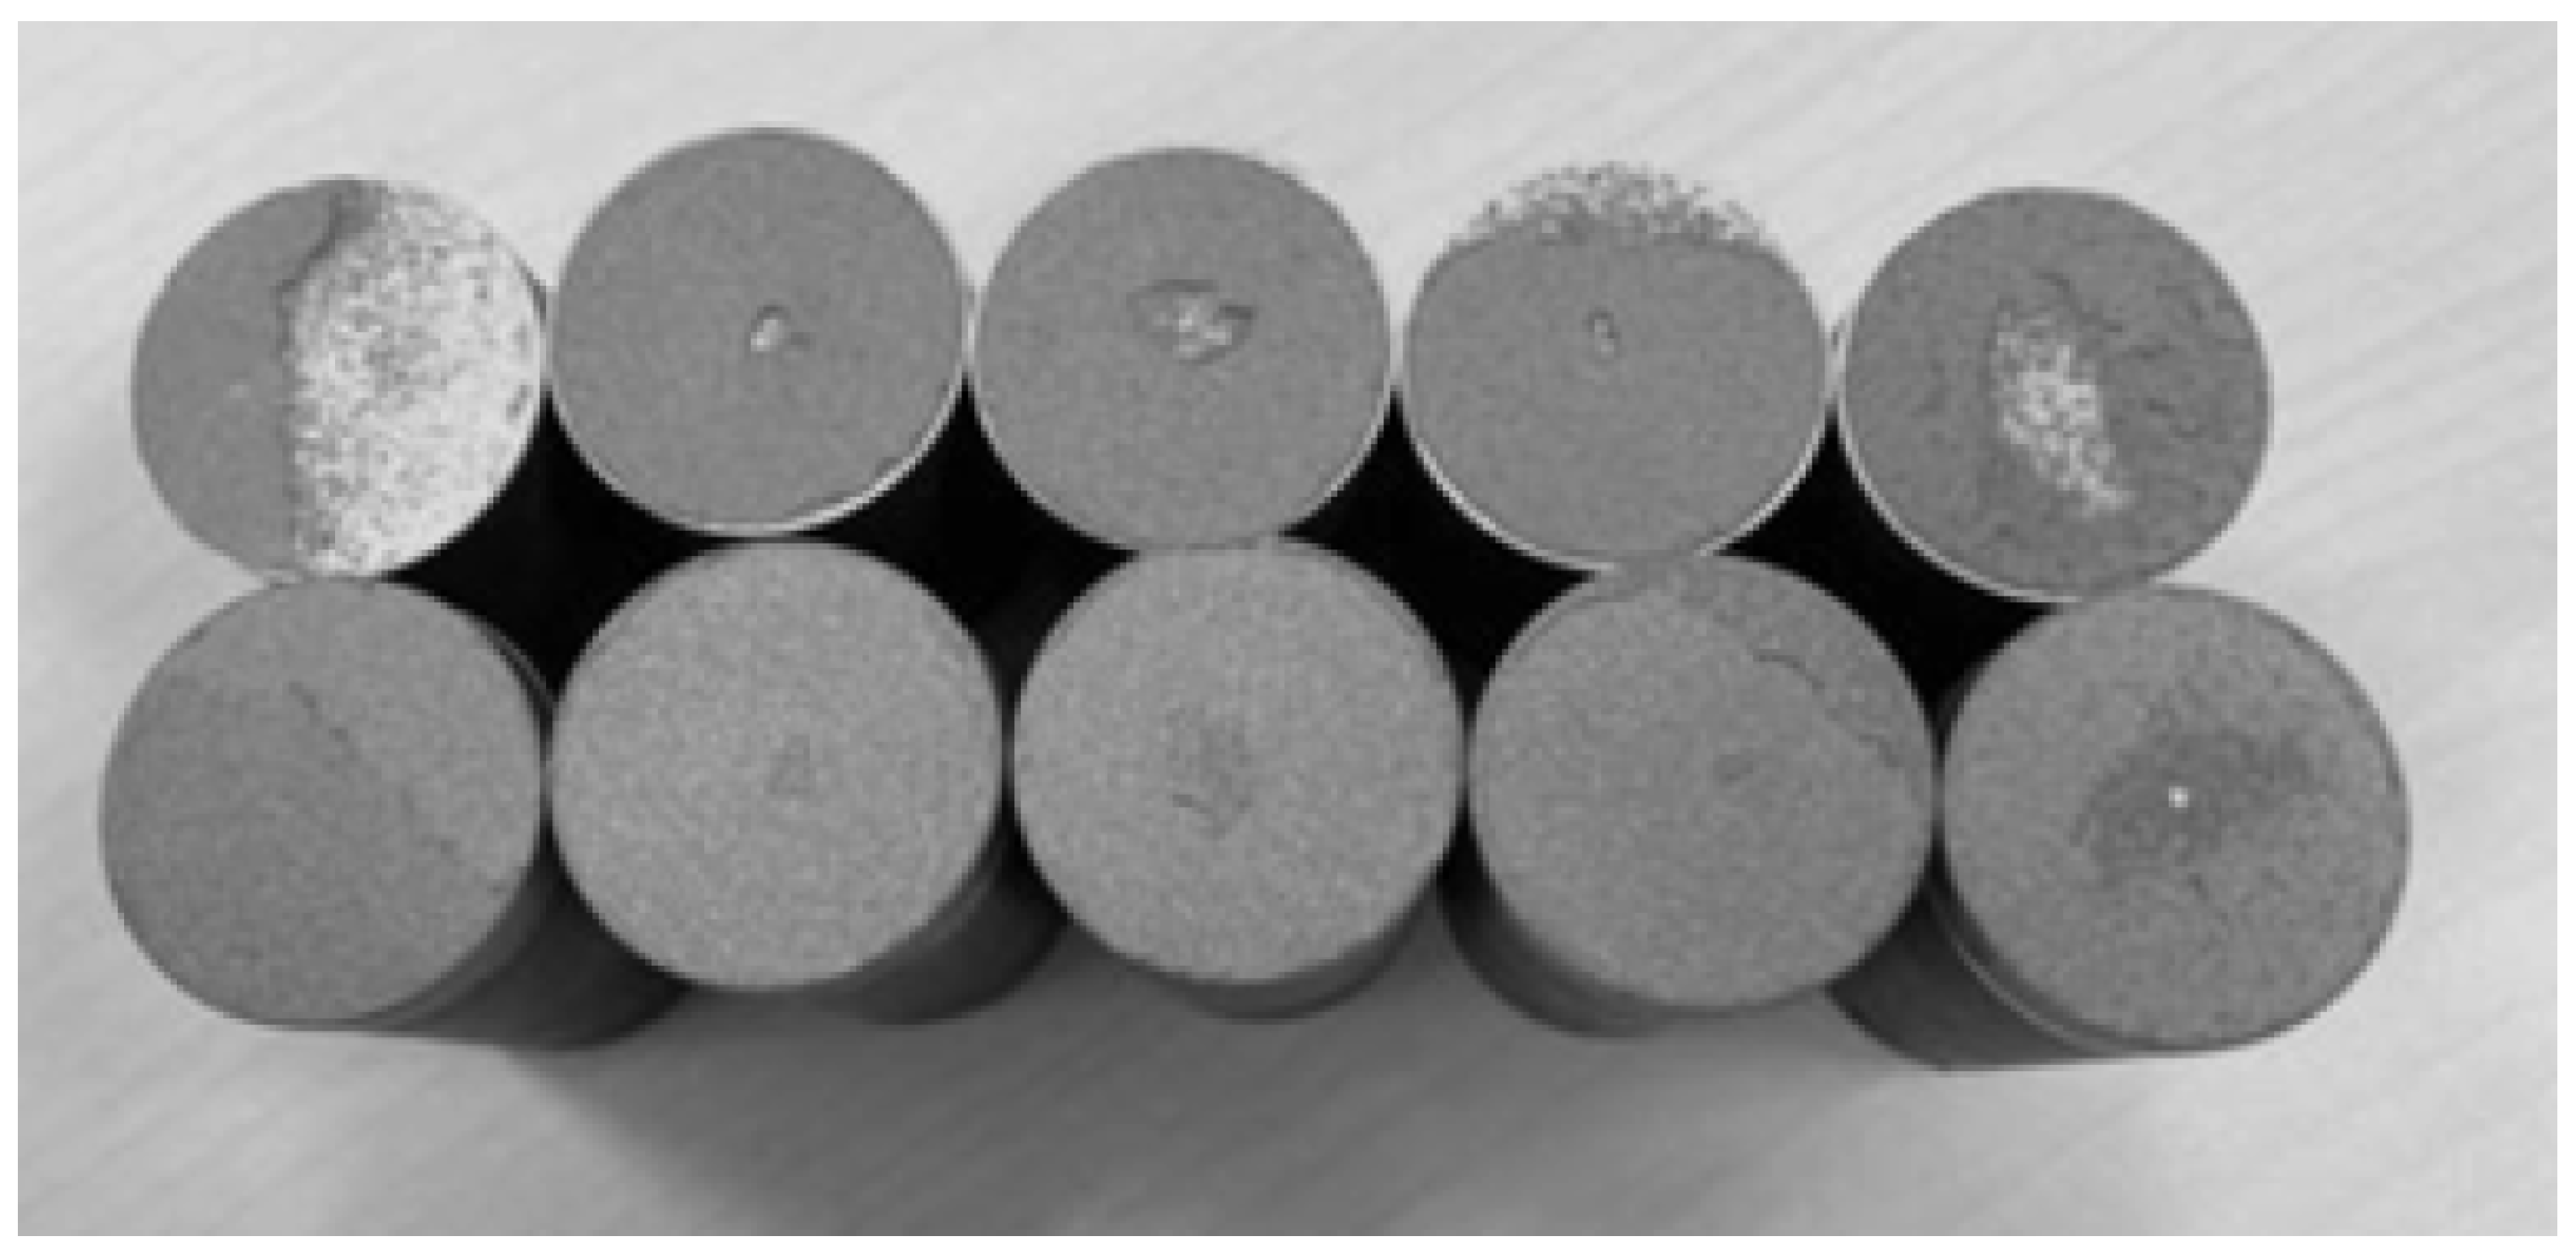
The distribution of the adhesion values for the particle velocities and temperatures obtained with the selected spray parameters are shown in Figure 15 and Figure 16. Figure 17 shows how the specimens broke. The coatings broke cohesively. The curing process was particularly sensitive, and, as shown in the figure, specimen 1 failed to complete the curing adequately. Therefore, the adhesion value for that specimen has not been taken into account.
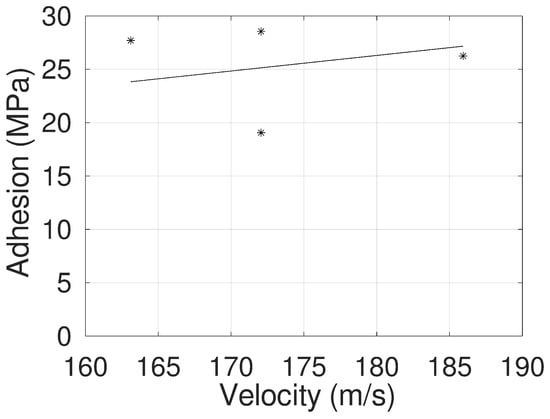
Figure 15.
Relationship between coating adhesion and particle velocity: adhesion value (*).
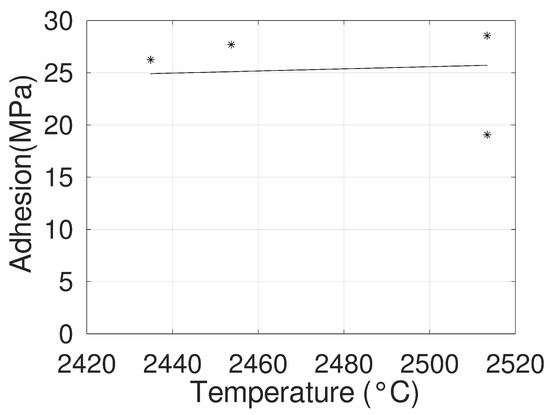
Figure 16.
Relationship between coating adhesion and particle temperature: adhesion value (*).

Figure 17.
Specimen rupture surfaces.
The regression line in Figure 13 shows an increase in hardness with the speed of the particle in flight. The regression line in Figure 14 also shows an increase in hardness with the temperature of the particle in flight. It should be noted that the maximum velocity does not coincide with the maximum temperature, so it was decided to study those parameters separately.
The same trends found in Figure 13 and Figure 14 were also seen in Figure 15 and Figure 16. These results can be justified by indicating that the higher speed and temperature enable a more efficient spatter-flattening process.
The coating’s cross-sectional microstructures for different spray parameters are shown in Figure 18. The porosity of the coating was lower than .
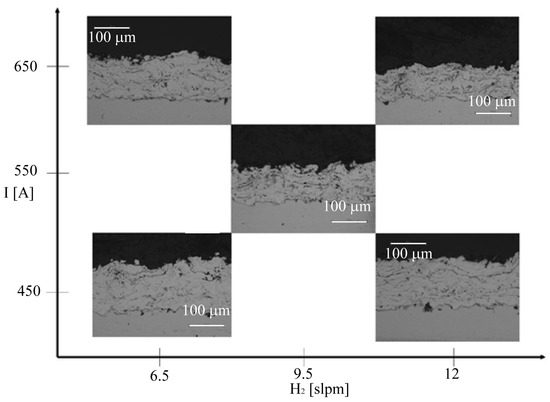
Figure 18.
Cross-sectional microstructure of the coatings for different spray parameters.
4. Conclusions
The particle velocity and temperature were measured for different spray parameters: electric current intensity, volume ratio of in Ar, and powder mass flow rate. The Accuraspray chamber, a sophisticated system requiring prior preparation to ensure the correct application of this tool, was used. For the analysis of the relationships between the spray parameters and the measured variables, the in-flight particle properties, a factorial analysis was carried out and implemented into 27 tests.
The experimental results confirmed the direct relationship between intensity and particle temperature, consistent with the relationship between intensity and energy generated in the arc in the spray device. The velocities followed a similar relationship.
Increasing the proportion of in the feed gas led to a higher heat transfer to the particles, consistent with the information found in the literature. A similar effect was detected for the velocity.
It must be kept in mind that some of the powders had enough velocity during the supply process to enter the centre of the flame, whilst others did not. As for the mass flow rate, one of the spray parameters, it has a direct relationship with the particle temperature when the particles have insufficient velocity entering the jet to reach its interior. The relationship is inverse above this limiting mass flow rate since the particles cool down upon entering the jet. The velocity still maintained its inverse relationship with the mass flow rate.
The adhesion and hardness increase with the speed and temperature of the particle in flight, which is related to a more efficient spatter-flattening process.
Finally, it can be stated that the information needed to deduce the behaviour of the particles as a function of the thermal spray parameters has been generated. This knowledge not only involves the identification of a series of trends that can be deduced from simple physical models but also enables the generation of concrete values for the velocity and temperature of these particles. All the identified trends have been justified by reasoning involving the simplified physical models. This is an endorsement of the experimental technique chosen to address the problem to be solved. With regard to the translation of the particle conditions during impact and the characteristics of the coating, relationships have been derived to connect the properties of the particles in flight with the characteristics of the coating. These relationships enable the operating values of the spraying process to be derived from the desired coating properties.
Author Contributions
A.F.R. carried out the calibration and installation of the Accuraspray and programmed the robot and coating equipment. J.A.M. analysed the results. G.J.C. selected the tests to be performed and captured the measurements. J.S. performed the literature review and coordinated the whole process. All authors have read and agreed to the published version of the manuscript.
Funding
This work was supported by the European Union (FEDER funds) and the Institute for the Business Competitiveness of Castilla y Leon (ICE)—Junta de Castilla y León under project number CCTT3/20/BU/0001.
Institutional Review Board Statement
Not applicable.
Informed Consent Statement
Not applicable.
Data Availability Statement
Not applicable.
Conflicts of Interest
The authors declare that they have no known competing financial interest or personal relationship that could have appeared to influence the work reported in this paper.
Abbreviations
The following abbreviations are used in this manuscript:
| APS | Atmospheric Plasma Spray |
| DoE | Design of experiments |
| ANN | Artificial Neural Network Modelling |
| Ni5Al | Nickel-Aluminium |
References
- Chandra, S.; Fauchais, P. Formation of solid splats during thermal spray deposition. J. Therm. Spray Technol. 2009, 18, 148–180. [Google Scholar] [CrossRef]
- Dhiman, R.; McDonald, A.G.; Chandra, S. Predicting splat morphology in a thermal spray process. Surf. Coatings Technol. 2007, 201, 7789–7801. [Google Scholar] [CrossRef]
- Fauchais, P.; Vardelle, M.; Goutier, S. Atmospheric plasma spraying evolution since the sixties through modeling, measurements and sensors. Plasma Chem. Plasma Process. 2017, 37, 601–626. [Google Scholar] [CrossRef]
- Tanaka, Y.; Fukumoto, M. Investigation of dominating factors on flattening behavior of plasma sprayed ceramic particles. Surf. Coatings Technol. 1999, 120, 124–130. [Google Scholar] [CrossRef]
- Tanaka, Y.; Fukumoto, M. Influence of solidification and wetting on flattening behavior of plasma sprayed ceramic particles. In Proceedings of the ISAEM 2000: 2nd International Symposium on Designing, Processing and Properties of Advanced Engineering Materials, Guilin, China, 2000; pp. 518–523. [Google Scholar]
- Fukumoto, M.; Huang, Y. Flattening mechanism in thermal sprayed nickel particle impinging on flat substrate surface. J. Therm. Spray Technol. 1999, 8, 427–432. [Google Scholar] [CrossRef]
- Jiang, X.; Wan, Y.; Herman, H.; Sampath, S. Role of condensates and adsorbates on substrate surface on fragmentation of impinging molten droplets during thermal spray. Thin Solid Film. 2001, 385, 132–141. [Google Scholar] [CrossRef]
- Pershin, V.; Lufitha, M.; Chandra, S.; Mostaghimi, J. Effect of substrate temperature on adhesion strength of plasma-sprayed nickel coatings. J. Therm. Spray Technol. 2003, 12, 370. [Google Scholar] [CrossRef]
- Okumus, S.C. Microstructural and mechanical characterization of plasma sprayed Al2O3–TiO2 composite ceramic coating on Mo/cast iron substrates. Mater. Lett. 2005, 59, 3214–3220. [Google Scholar] [CrossRef]
- Syed, A.; Denoirjean, A.; Hannoyer, B.; Fauchais, P.; Denoirjean, P.; Khan, A.; Labbe, J. Influence of substrate surface conditions on the plasma sprayed ceramic and metallic particles flattening. Surf. Coatings Technol. 2005, 200, 2317–2331. [Google Scholar] [CrossRef]
- Fukumoto, M.; Yamaguchi, T.; Yamada, M.; Yasui, T. Splash splat to disk splat transition behavior in plasma-sprayed metallic materials. J. Therm. Spray Technol. 2007, 16, 905–912. [Google Scholar] [CrossRef]
- McDonald, A.; Moreau, C.; Chandra, S. Thermal contact resistance between plasma-sprayed particles and flat surfaces. Int. J. Heat Mass Transf. 2007, 50, 1737–1749. [Google Scholar] [CrossRef]
- Tekmen, C.; Tsunekawa, Y.; Okumiya, M. Effect of plasma spray parameters on in-flight particle characteristics and in situ alumina formation. Surf. Coatings Technol. 2008, 203, 223–228. [Google Scholar] [CrossRef]
- Yin, Z.; Tao, S.; Zhou, X.; Ding, C. Particle in-flight behavior and its influence on the microstructure and mechanical properties of plasma-sprayed Al2O3 coatings. J. Eur. Ceram. Soc. 2008, 28, 1143–1148. [Google Scholar] [CrossRef]
- Zhang, C.; Li, C.J.; Liao, H.; Planche, M.P.; Li, C.X.; Coddet, C. Effect of in-flight particle velocity on the performance of plasma-sprayed YSZ electrolyte coating for solid oxide fuel cells. Surf. Coatings Technol. 2008, 202, 2654–2660. [Google Scholar] [CrossRef]
- Zhang, C.; Kanta, A.F.; Li, C.X.; Li, C.J.; Planche, M.P.; Liao, H.; Coddet, C. Effect of in-flight particle characteristics on the coating properties of atmospheric plasma-sprayed 8 mol% Y2O3–ZrO2 electrolyte coating studying by artificial neural networks. Surf. Coatings Technol. 2009, 204, 463–469. [Google Scholar] [CrossRef]
- Mantry, S.; Jha, B.; Mandal, A.; Mishra, D.; Mishra, B.; Chakraborty, M. Influence of in-flight particle state diagnostics on properties of plasma sprayed YSZ-CeO2 nanocomposite coatings. Int. J. Smart Nano Mater. 2014, 5, 207–216. [Google Scholar] [CrossRef]
- Xiao, Y.; Ren, E.; Hu, M.; Liu, K. Effect of particle in-flight behavior on the microstructure and fracture toughness of YSZ TBCs prepared by plasma spraying. Coatings 2018, 8, 309. [Google Scholar] [CrossRef]
- Pierlot, C.; Pawlowski, L.; Bigan, M.; Chagnon, P. Design of experiments in thermal spraying: A review. Surf. Coatings Technol. 2008, 202, 4483–4490. [Google Scholar] [CrossRef]
- Heimann, R.B. Better quality control: Stochastic approaches to optimize properties and performance of plasma-sprayed coatings. J. Therm. Spray Technol. 2010, 19, 765–778. [Google Scholar] [CrossRef]
- Guessasma, S.; Montavon, G.; Coddet, C. Neural computation to predict in-flight particle characteristic dependences from processing parameters in the APS process. J. Therm. Spray Technol. 2004, 13, 570–585. [Google Scholar] [CrossRef]
- Forghani, S.; Ghazali, M.; Muchtar, A.; Daud, A. Mechanical properties of plasma sprayed nanostructured TiO2 coatings on mild steel. Ceram. Int. 2014, 40, 7049–7056. [Google Scholar] [CrossRef]
- Karthikeyan, S.; Balasubramanian, V.; Rajendran, R. Developing empirical relationships to estimate porosity and microhardness of plasma-sprayed YSZ coatings. Ceram. Int. 2014, 40, 3171–3183. [Google Scholar] [CrossRef]
- Batra, R.C.; Taetragool, U. Numerical techniques to find optimal input parameters for achieving mean particles’ temperature and axial velocity in atmospheric plasma spray process. Sci. Rep. 2020, 10, 21483. [Google Scholar] [CrossRef] [PubMed]
- Chadha, S.; Jefferson-Loveday, R.; Hussain, T. Modelling Knudsen number effects in suspension high velocity oxy fuel thermal spray. Int. J. Heat Mass Transf. 2020, 152, 119454. [Google Scholar] [CrossRef]
- Oerlikon Metco. SF-0001.5-Real-Time Sensor Technology; Oerlikon Metco: Pfaeffikon, Switzerland, 2022. [Google Scholar]
- Tecnar. User Manual Accuraspray; Tecnar: Saint-Bruno-de-Montarville, QC, Canada, 2021. [Google Scholar]
- Mauer, G.; Vaßen, R.; Stöver, D. Plasma and particle temperature measurements in thermal spray: Approaches and applications. J. Therm. Spray Technol. 2011, 20, 391–406. [Google Scholar] [CrossRef]
- Akbarnozari, A.; Amiri, S.; Moreau, C.; Bamber, O.; Gernon, J.; Choquet, M.; Pouliot, L. Improvement of Online Diagnostic System to Monitor In-Flight Particles in Thermal Spray Processes. In Proceedings of the ITSC2019, ASM International, Yokohama, Japan, 25–26 May 2019; pp. 957–964. [Google Scholar]
- Gougeon, P. A new sensor for on-line diagnostics of particles under thermal spraying conditions. Adv. Process. Tech. Part. Mater. 1994, 6, 199. [Google Scholar]
- Wei, P.; Wei, Z.; Zhao, G.; Bai, Y.; Tan, C. Effect of processing parameters on plasma jet and in-flight particles characters in supersonic plasma spraying. High Temp. Mater. Process. 2016, 35, 775–786. [Google Scholar] [CrossRef]


Disclaimer/Publisher’s Note: The statements, opinions and data contained in all publications are solely those of the individual author(s) and contributor(s) and not of MDPI and/or the editor(s). MDPI and/or the editor(s) disclaim responsibility for any injury to people or property resulting from any ideas, methods, instructions or products referred to in the content. |
© 2023 by the authors. Licensee MDPI, Basel, Switzerland. This article is an open access article distributed under the terms and conditions of the Creative Commons Attribution (CC BY) license (https://creativecommons.org/licenses/by/4.0/).