Article

A Comparison of Cellulose Nanocrystals and Nanofibers as Reinforcements to Amylose-Based Composite Bioplastics

by
Marwa Faisal
1,†,
Marija Žmirić
1,†,
Ngoc Quynh Nhu Kim
1,
Sander Bruun
1,
Loredana Mariniello
2,
Michela Famiglietti
2,
Heloisa N. Bordallo
3,
Jacob Judas Kain Kirkensgaard
3,4,
Bodil Jørgensen
1,
Peter Ulvskov
1,
Kim Henrik Hebelstrup
5 and
Andreas Blennow
1,*
1
Department of Plant and Environmental Sciences, Faculty of Science, University of Copenhagen, 1871 København, Denmark
2
Department of Chemical Sciences, Monte Sant’Angelo Campus, University of Naples “Federico II”, Via Cinthia 4, 80126 Naples, Italy
3
Niels Bohr Institute, Faculty of Science, University of Copenhagen, 2100 København, Denmark
4
Department of Food Science, University of Copenhagen, DK-1958 Frederiksberg C, 1871 København, Denmark
5
Department of Agroecology, Aarhus University, 4200 Slagelse, Denmark
*
Author to whom correspondence should be addressed.
These authors contributed equally to this work.
Coatings 2023, 13(9), 1573; https://doi.org/10.3390/coatings13091573
Submission received: 30 June 2023 / Revised: 31 August 2023 / Accepted: 5 September 2023 / Published: 9 September 2023

Abstract

:
Starch-based bioplastics offer a promising alternative to conventional plastics. However, they exhibit certain limitations, notably in terms of mechanical strength and barrier properties. These challenges could potentially be addressed through the incorporation of nanocellulose as a reinforcing agent. In this study, we fabricated bioplastic films using a casting and blending approach, employing highly linear pure amylose (AM) in combination with cellulose nanofibers (CNF) or cellulose nanocrystals (CNC) at various ratios. This allowed for a direct comparison of CNF and CNC functionality within the AM matrix. We systematically assessed mechanical properties and water barrier characteristics, encompassing parameters such as water permeability, moisture content, swelling, solubility, crystallinity, thermal stability, transmittance, and opacity. Additionally, we investigated water vapor and oxygen permeability. Furthermore, we delved into distinctions between CNC and CNF biocomposites. Incorporation of either type of nanocellulose yielded enhancements in film properties, with CNF exerting a more pronounced positive influence compared to CNC. Particularly noteworthy were the mechanical properties, wherein CNF composite films demonstrated markedly higher tensile strength and Young’s modulus compared to their CNC counterparts. For instance, the inclusion of 1% CNF led to a substantial increase in AM tensile strength from 66.1 MPa to 144.8 MPa. Conversely, water vapor permeability exhibited a converse behavior, as the addition of 1% CNF resulted in a significant reduction of water barrier properties from 8.7 to 1.32 g mm m−2 24 h−1kPa−1. Intriguingly, CNC films displayed greater elongation at the point of rupture in comparison to CNF films. This can be attributed to the larger surface area of the CNC and the favorable interfacial interaction between AM and CNC. Notably, the introduction of nanocellulose led to reduced film opacity and improved thermal stability. In summary, nanocellulose interacted synergistically with the AM matrix, establishing a robust hydrogen-bonded network that greatly enhanced the performance of the biocomposite films.

1. Introduction

Bio-composites exhibit significant potential as environmentally friendly alternatives in the realms of both food and medicine, presenting renewable and sustainable options [1]. Their versatile applications have spurred extensive research and integration across various industries. Recently, the advancement of nanocomposite technology has addressed challenges associated with biopolymer packaging materials. Nanocomposites surpass plain polymers and traditional composites, demonstrating enhanced barrier properties, increased strength, and heightened heat resistance. The concept of biocomposites is undergoing evolution to encompass nanostructured hybrid materials. Key biopolymer constituents, such as starch, cellulose, chitin/chitosan, and silk, are derived from polysaccharides linked by glycosidic bonds [2,3]
Starch represents an abundant raw material with the potential to yield robust and biodegradable bioplastics characterized by both high-value and versatile bulk properties [4]. It consists of two primary polysaccharide types: amylopectin (AP) and amylose (AM). Amylopectin is composed of short α (1–4) bonded chain segments, comprising 10–16 glucose units forming parallel double helices that are α (1–6) linked to longer linear backbone chains [5]. In contrast, AM is chiefly a linear α (1 → 4) linked polymer capable of forming both single and double helices, which align in ordered structures, offering a strong structural foundation for biocomposites. The proportions of AM and AP in starch generally fall between 28% and 75%, with only one documented instance of producing a high-yield AM-only starch type [6,7].
Starch-based films possess crucial attributes for food packaging materials, including transparency, odor neutrality, lack of taste interference, and non-toxicity. However, they still contend with limitations such as brittleness, hydrophilicity, suboptimal barrier properties, and inadequate cohesiveness [6]. Augmenting the cohesiveness of starch films can be achieved through either blending them with appropriate polymers to create an interconnected matrix with starch or by crosslinking starch with a flexible polymer. The inclusion of plasticizers such as glycerol or water addresses brittleness and augments film flexibility by diminishing intra- and intermolecular hydrogen bonding. This, in turn, enhances the mobility of starch chains.
Cellulose, a linear homo-polysaccharide comprised of numerous β-(1 → 4)-D-glucopyranose residues, stands out as a superb option for reinforcement [7]. Of particular interest is nanocellulose, lauded for its advantageous physical and chemical properties. Characterized by chemical inertness, remarkable stiffness, high strength, low density, dimensional stability, and a minimal coefficient of thermal expansion, nanocellulose draws attention. Its surface chemistry is amenable to alteration. Cellulose nanocrystals (CNCs), in particular, exhibit versatile surface chemistry due to the heightened reactivity of their available hydroxyl groups. This facilitates diverse modifications, including the introduction of charged or hydrophobic components, modulation of water interactions, and the promotion of integration within polymer matrices. Surface modifications can occur during isolation/purification or via other treatments, encompassing covalent bonds or physical absorption.
The most prevalent approach for CNC production involves acidic hydrolysis, which eliminates amorphous segments in cellulose microfibrils while preserving crystalline regions. Acid-catalyzed hydrolysis with sulfuric acid yields sulfate esters with varying degrees of sulfonation, resulting in a negatively charged surface that stabilizes nanocrystal suspensions for a multitude of applications. Alternatively, hydrochloric acid usage leads to hydroxylated surfaces with lower charge density and reduced water dispersibility. Less conventional methods involving phosphoric and hydrobromic acids have also been explored [8].
Acid hydrolysis finds widespread use in the top-down production of cellulose nanocrystals (CNCs) [9]. These CNCs are generated by ending hydrolysis at the leveling off degree of polymerization (LODP) stage where hydrolysis comes to a near halt, leaving behind only highly resilient crystalline segments. These individual cellulose crystals are subsequently gathered and refined through processes involving centrifugation and dialysis, and loss is minimal [10].
Employing HCl vapor leads to swift hydrolysis of cellulose fibers derived from cotton. These fibers are consistently coated by a thin layer of water in ambient conditions (5). In these experiments, the equilibrium between HCl vapor and aqueous HCl solutions is utilized. The study shows that HCl vapor proves highly effective in breaking down cellulose within a cotton-based filter paper at room temperature. This process rapidly reduces the degree of polymerization (DP) to the level of LODP, approximately 170. The resultant nanocrystals have dimensions akin to those obtained from conventional liquid/solid acid hydrolysis of cotton, measuring around 7–8 nm in width and 100–300 nm in length with high yield [11,12].
Using TEMPO (2,2,6,6-tetramethylpiperidine-1-yl)oxyl radical as an oxidation catalyst enables the creation of stable suspensions of cellulosic particles with a high surface charge density [13,14]. These particles, derived from microgranular cellulose, exhibit characteristics across three length scales simultaneously: nanocrystals, micron-sized longitudinal particles, and larger particles up to tens of microns.
Presently, cellulose nanofibers (CNF) and cellulose nanocrystals (CNC) have garnered significant attention as reinforcement agents. The influence of CNF and CNC on starch properties diverges due to differences in size and preparation methods. Various studies suggest that CNF extracted from renewable sources, such as agro-wastes, bolster the crystallinity, barrier characteristics, mechanical strength, and thermal stability of starch while preserving its biodegradability.
CNF features an intricate structure comprising elongated, interwoven cellulose fibers with a notable aspect ratio. This network of fibers resembles a larger-scale fibrous matrix compared to the rod-like crystalline nanoparticles constituting CNC. Conversely, CNC exhibits a higher degree of crystallinity and comprises crystalline nanoparticles with a distinct rod-like shape. It boasts a larger surface area and an elevated density of surface hydroxyl groups, rendering it more reactive and conducive to diverse chemical modifications and functionalizations.
Manufacturing CNF/CNC films can be achieved through bottom-up assembly methods such as solvent casting, vacuum filtration, or layer-by-layer assembly. However, these approaches present certain limitations, including time-consuming processes and challenges associated with scaling up to bulk materials.
To address these limitations, a recent study [15] introduced a novel top-down recombination method for producing large-scale cellulosic structural materials. This method capitalizes on the inherent alignment of nanocellulose structures. Through the induction of hydrogen bonding with water molecules, the study developed a straightforward and versatile technique for generating robust and resilient structural materials. The investigation employed Finite Element Analysis (FEA) to examine the influence of water-induced hydrogen bonding on cellulose nanofibers. Dynamic mechanical properties were assessed using FEA, revealing that increased moisture levels led to improvements in tensile strength and toughness. Water molecules played a pivotal role by plasticizing cellulose nanofibrils and facilitating the establishment of hydrogen bonds, culminating in the creation of sturdy materials [15].
Another noteworthy study [16] introduced an efficient method for extracting micro and nano holocellulose fibers (HCNFs) from the natural stem of the manau rattan. This process encompassed three steps: pulping, bleaching, and TEMPO oxidation. Through this method, a high-haze yet transparent HCNF film was successfully fabricated using vacuum filtration, solvent exchange, and ambient drying techniques. The resulting HCNF film exhibited an impressive tensile strength of 84.8 MPa, attributed to the compact microstructure formed via self-association through hydrogen bonding among cellulose nanofibrils. Furthermore, the HCNF film showed exceptional optical properties, boasting high light transmittance (93.7%) at a wavelength of 550 nm. These remarkable traits stemmed from the dense, wrinkle-shaped microstructure that enabled visible light to penetrate and diffuse across the film surface. It was anticipated that this distinctive film, combining robustness with distinctive optical qualities, will find practical applications in industries such as optical devices and aerospace materials.
Numerous studies have consistently shown that incorporating CNF or CNC into the starch matrix enhances the mechanical, thermal, and barrier properties of resulting nanocomposites [17]. These enhancements are particularly significant for packaging applications. The specific properties required for these films vary depending on the intended application and the type of food being preserved [18]. Given that CNC and CNF exert distinct effects on starch films due to variations in size and preparation methods, the selection of nanocellulose can be customized to precisely match the specific demands of food packaging.
In our preceding investigation [19], we successfully produced nanocomposite films using AM sourced from transgenic barley, possessing a remarkable 99% AM content in the grain starch. We combined this with cellulose nanofibers (CNFs) obtained from sugar beet pulp. The AM matrix was reinforced with 25% and 50% CNF. Rigorous analyses were conducted to assess the mechanical, thermal, and water permeability properties of the AM/CNF composites, both in the presence and absence of glycerol.
The results from the composite films cast with AM-CNF showed increased crystallinity and improved mechanical properties. Additionally, these films exhibited decreased water contact angles, reduced water vapor permeability, and lower oxygen permeability, particularly evident at 50% CNF loading. A noteworthy observation was the emergence of an anti-plasticizing effect in the AM film at a glycerol content of 15%. However, the presence of 25% CNF reversed this effect. The inclusion of 50% CNF in the composite yielded surfaces with rougher textures, featuring fiber-like structures and heightened wettability.
This research introduces reinforced composite films comprising pure AM and two types of nanocellulose: CNC and CNF. Our study represents the first endeavor to blend pure AM with CNC and subsequently compare it to CNF while accounting for differences in size and preparation methods. The central aim of this study is to evaluate the influence exerted by CNF and CNC on the AM matrix. The outcomes of this investigation are expected to identify an alternative starch source for environmentally friendly packaging and establish a theoretical foundation for incorporating nanocellulose in starch-based films.
While CNCs and CNFs have been explored as reinforcement agents for starch-based films and have demonstrated property enhancement, a direct comparison between these two components in the context of pure AM remains absent. This paper directly compares and evaluates the performance and enhancement effects of CNCs and CNFs to discern their distinctions and identify the more suitable option for integration into 99% AM films.
We created casted films using various combinations of raw polysaccharides, plasticized with glycerol. This study aimed to comprehensively characterize the nanocomposite films in terms of their physical, mechanical, opacity, thermal, and barrier properties. The morphological features were examined using scanning electron microscopy (SEM) and X-ray diffraction (XRD). As a control, an AM-only film was utilized. Nanocomposites composed of AM, CNC, and CNF were fabricated in the range of 0.5%–17% of CNF or CNC. Our investigation revealed that the introduction of CNC or CNF led to a reduction in water barrier properties, accompanied by improvements in mechanical and thermal film characteristics. Notably, CNF exhibited superior results in several of these properties. We anticipate that our findings will streamline the search for an alternative starch source for biodegradable packaging and contribute to establishing a foundational framework for the utilization of nanocellulose in starch films.

2. Materials and Methods

2.1. Materials

AM, NCF, and CNC were the main components of the films. AM was produced from a genetically modified barley line that was previously generated [7]. CNCs were extracted from woody biomass provided by Nanografi Nano Technology Germany. The CNCs were 10–20 nm wide and 300–900 nm long. CNF was extracted from sugar beet pulp [20] provided by Nordic Sugar A/S Denmark. Glycerol and Milli-Q water were used as plasticizers for the films.

2.2. Extracting Amylose (AM) from Barley

Barley grains were ground into a fine powder using the Komo Fidibus 21 Grain Mill. Next, 500 mL of 0.075 M NaOH and 100 g of barley flour were mixed into a 1000 mL beaker and stirred for 3 h. The suspension was screened using a 100-micron mesh sieve, and the leftovers containing bran and pericarp were discarded. The filtrate was centrifuged at 4000× g for 10 min. The supernatant was discarded, and the AM granules were washed twice with distilled water and pH checked to secure neutral conditions. The AM was collected and washed with ethanol (96%), pelleted, and left to air dry overnight with occasional stirring to secure the complete dryness of the powder [21].

2.3. Extracting Nanocellulose Fibers from Sugar Beet Pulp

CNF was prepared following the procedures outlined in [12,14,20,22] with slight modifications. Briefly, 15 g (dry weight) of sugar beet pulp was washed with 5000 mL of dH2O using a 38 μm sieve, followed by suspension in 500 mL of 0.5 M NaOH. This mixture was stirred at 80 °C for 2 h and washed to neutrality with dH2O. The NaOH-treated pulp was then immersed in a 500 mL bleach solution (1% NaClO2, pH 5.0) and stirred at 70 °C for 2 h. After this, further washing with dH2O eliminated lignin and tannins. The remaining cellulose fiber suspension’s dry weight was measured post-drying and diluted to 1.00% (w/w) in dH2O. A 200 mL portion of the obtained fiber suspension was subjected to circulation in a high-shear homogenizer (microfluidizer materials processor M110-P, Newton, MA, USA) with 200 and 400 μm orifices under 500 bar pressure for 18 min, resulting in the production of nanocellulose fibers. The CNFs were stored at 4 °C in the refrigerator for subsequent use [20]. The CNF width ranged from 5 nm for the thinnest fibers to 16–55 nm for the thickest (Figure S1).

2.4. Creating the Biocomposite Films

Different nanocomposite formulations were prepared by blending AM with either CNC or CNF, along with glycerol as a plasticizer. For composite film creation, 1 g of AM was suspended in 100 mL of MilliQ water and mixed with 30% (w/w) glycerol. Various percentages of CNF or CNC (0.5%, 1%, 3%, 6%, 9%, and 17% wt% of AM) were subsequently added to the suspension. A control film comprising pure AM (1%) and 30% glycerol was also prepared. The components were introduced into a high-pressure glass reactor and heated in an oil bath at 140 °C with continuous stirring. Afterward, the reactor and solutions were cooled to 70 °C, followed by casting in Teflon-coated Petri dishes. Films were incubated at 50 °C for 8 h or until fully dry. To equalize moisture content and prevent film shrinkage, all films were stored in a sealed desiccator with potassium chloride at 90% relative humidity at room temperature before analysis [19].

2.5. Fourier Transform Infrared (FTIR) Spectroscopy

Infrared spectroscopy was conducted using a Bruker Alpha FTIR spectrometer (Bruker Optik GmbH, Ettlingen, Germany). The measurements employed an attenuated total reflectance (ATR) single reflectance cell equipped with a diamond crystal. The samples underwent 32 scans over the range of 4000–400 cm−1 at a resolution of 4 cm−1, with air as the background.

2.6. Thickness and Moisture Content

Film thickness was gauged at 8 randomly selected points per film using a micrometer device (148–121 Zhongtian Experimental Instrument Co., Ltd., Shanghai, China). The average of these 8 measurements was computed to establish the overall thickness for each film. Each film’s thickness was based on 8 replicates [23]. Moisture content was assessed by taking triplicate 2 × 2 cm squares from each film, which were then dried at 105 °C until a constant weight was achieved [24]. The moisture content was determined using the following equation, where Mi represents the initial weight and Mt denotes the final weight of the sample (Equation (1)):
M C ( % ) = ( M i M t ) M i × 100 %

2.7. Swelling Index (SI) and Water Solubility (WS)

The swelling index (SI) and water solubility (WS) were determined by weight using three different masses. Square-shaped 2 × 2 cm samples were prepared, and the tests were conducted in triplicate. The first mass (M1) was measured after the samples were equilibrated in an oven at 70 °C for 24 h to attain a constant weight. Subsequently, each sample was immersed in 20 mL of deionized water and stirred for 24 h at 30 °C to obtain M2 (wet weight). After drying the samples with filter paper, they were weighed to obtain M3, following another 24-h drying at 70 °C. Sample measurements were performed in triplicate simultaneously to ensure consistency. The swelling index (SI) and water solubility (WS%) were calculated using Equations (2) and (3) [25].
S I ( % ) = ( M 2 M 1 ) M 1 × 100 %
W S ( % ) = ( M 1 M 3 ) M 1 × 100 %

2.8. Mechanical Properties

Rectangular strips measuring 1 cm in width and 10 cm in length were cut from the films. Tensile properties were determined using an Instron machine model 5569 (MTS, Eden Prairie, MN, USA), equipped with a 5 kN tensile load cell, following ASTM D882 standard [26]. The distance between clamps was set at 60 mm, and the crosshead speed was maintained at 10 mm/min. For each film, 8 samples were tested and averaged. Film thickness was measured using a micrometer screw gauge. The results were derived from 6–8 replicates per film.

2.9. Scanning Electron Microscopy (SEM)

SEM images were captured using a Quanta 3D FEG (FEI Company, Eindhoven The Netherlands, The Netherlands), depicting both film surfaces and cross sections. Small film pieces were affixed to a metal plate and coated with a 2 nm colloidal gold layer prior to analysis. To examine the dispersion of CNF and CNC within the AM matrix, samples were cryogenically fractured in liquid nitrogen and subsequently gold-sputtered [19].

2.10. Light Transmittance and Opacity

Light transmittance was measured on small round pieces of the films. The film pieces were scanned on a Lambda 35 UV–vis spectrophotometer (PerkinElmer Inc., Waltham, MA, USA) from 200 to 800 nm, and the opacity was calculated [6]:
O p a c i t y = A x
where A is the absorbance of the film at 600 nm and x the film thickness (mm) [27].

2.11. Thermogravimetric Analysis (TGA)

TGA coupled with Fourier Transform Infrared Spectroscopy (FTIR) was utilized to characterize the thermal stability of the diverse films. All samples were analyzed using the TG 209 F1 Libra PERSEUS from NETZSCH coupled to an FTIR instrument from Bruker Optics. Experimental conditions were as follows: N2 atmosphere (20 mL/min), heating rate of 10 K/min. Measurements were conducted between 28 °C and 600 °C in a standard Al2O3 crucible, employing an automatic sample changer. An empty crucible was used for instrument correction. Data processing was conducted using NETZSCH-provided software. FTIR spectra of the evolved gases were recorded every 3 °C throughout the measurement. A selection of spectra at temperatures of interest, guided by TGA data, were further analyzed from the collected FTIR data.

2.12. Wide Angle X-ray Scattering(WAXS)

XRD analysis of the films was performed using a Nano-inXider instrument from Xenocs (Grenoble, France), employing a Cu Kα source with a wavelength of 1.54 Å and a 2D Pilatus detector (Dectris Ltd., Baden, Switzerland). Samples were loaded between mica windows, and background contributions were subtracted from the recorded spectra. The total relative crystallinity was calculated as the ratio of the crystalline peak area to the overall diffraction area, utilizing Peak Fit software (Version 4.0, Systat Software Inc., San Jose, CA, USA).

2.13. Permeability

The barrier properties of the films against water vapor (WV) and O2 were assessed using a MultiPerm instrument (ExtraSolution s.r.l, Pisa, Italy). Duplicate tests were conducted for each film at 50% RH and 25 °C, following ASTM F1249-13 (2013) and ASTM D3985-05 (2010) standards [28,29]. Prior to testing, film specimens were conditioned for 24 h at 50% RH and were enclosed in aluminum masks, reducing the film test area to 2 cm2.

2.14. Degradation Studies

For degradation studies, square pieces (3 cm × 3 cm) of pure films containing 1% AM, 1% CNF, 1% CNC, and composite films of AM with 17% CNF and 17% CNC were prepared. A 100 mL flask with a blue cap was filled with 25 g of soil, and each film was positioned on the soil surface and covered with another 25 g of soil. To achieve 80% of the water holding capacity (WHC), 500 µg of ionized water was added, maintaining constant water content (WC) during composting. The flasks were incubated at 25 °C ± 3 °C in a dark incubator with ensured air supply to prevent anaerobic conditions, sealed with rubber plugs, and equipped with syringes for sampling [30].
Gas concentrations (CO2, CH4, N2O) in collected samples were measured using a gas chromatograph (Bruker 450-GC 2011, Billerica, MA, USA) with appropriate detectors. Calibration was performed using standards encompassing all gases at the beginning and end of each sample run.
Fourier transform-infrared spectroscopy (FT-IR) was applied for analyzing samples before and after degradation, using an attenuated total reflectance (ATR) single reflectance cell with a diamond crystal. Scans were conducted 32 times over the 4000–400 cm−1 range at a 4 cm−1 resolution against an air background. A Bruker Alpha FTIR spectrometer (Bruker Optik GmbH, Ettlingen, Germany) was utilized for sample analysis.

2.15. Statistical Analysis

One-way analysis of variance (ANOVA) was utilized for data analysis, and means were compared using Tukey’s test at a significance level of 5% (p < 0.05). In the bar chart plot, different letters above the error bars denote significant differences between means. Thickness and mechanical properties were measured with 8 replicates, while moisture content, swelling, and water solubility were assessed in triplicates. Principal component analysis (PCA) was conducted to summarize and visually represent the data. Statistical analyses were carried out using IBM® SPSS® Statistics 27 software and Origin 2020.

3. Results and Discussions
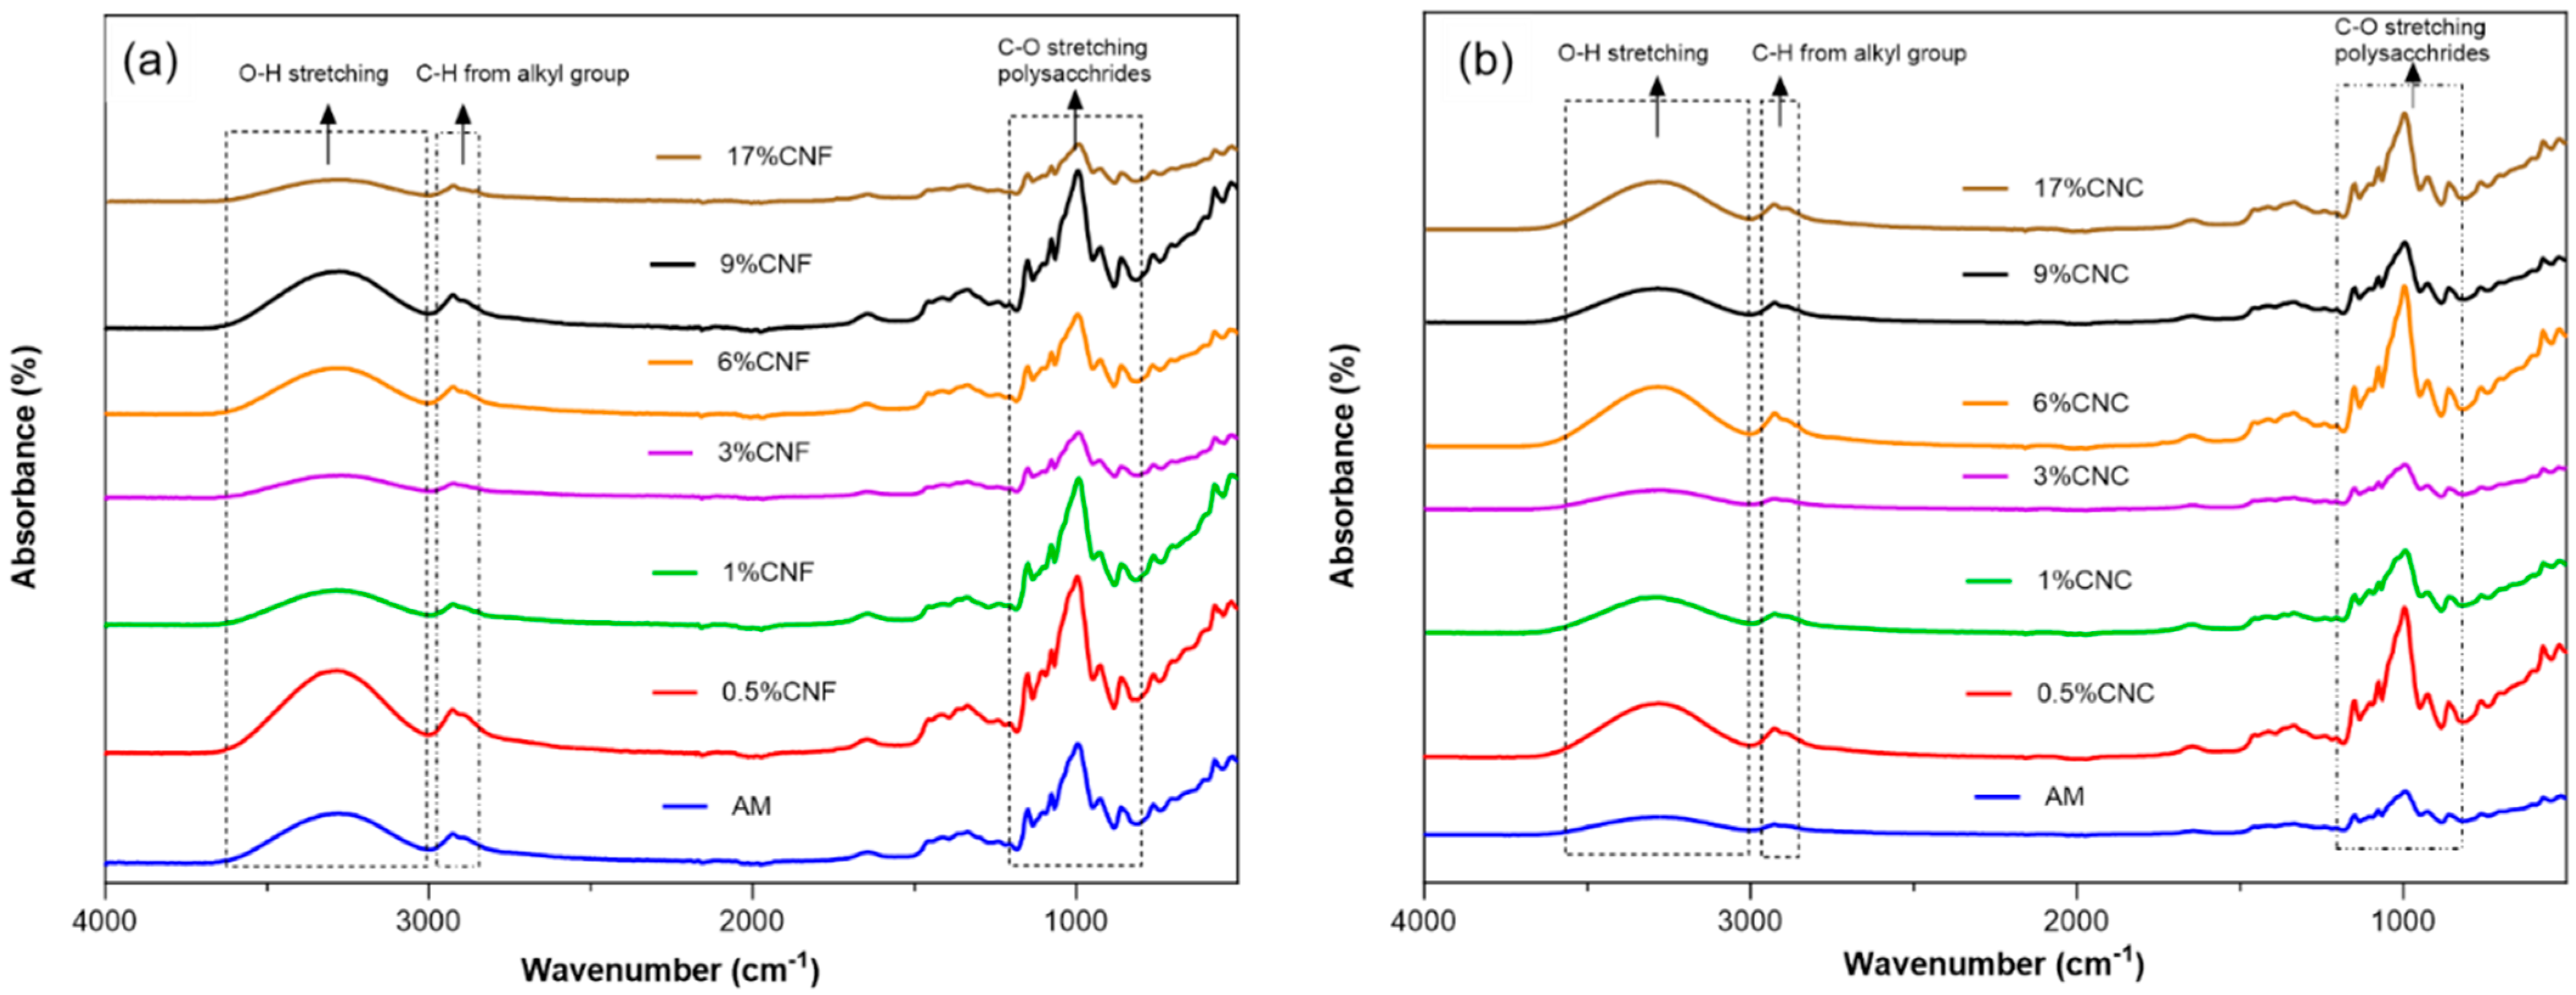
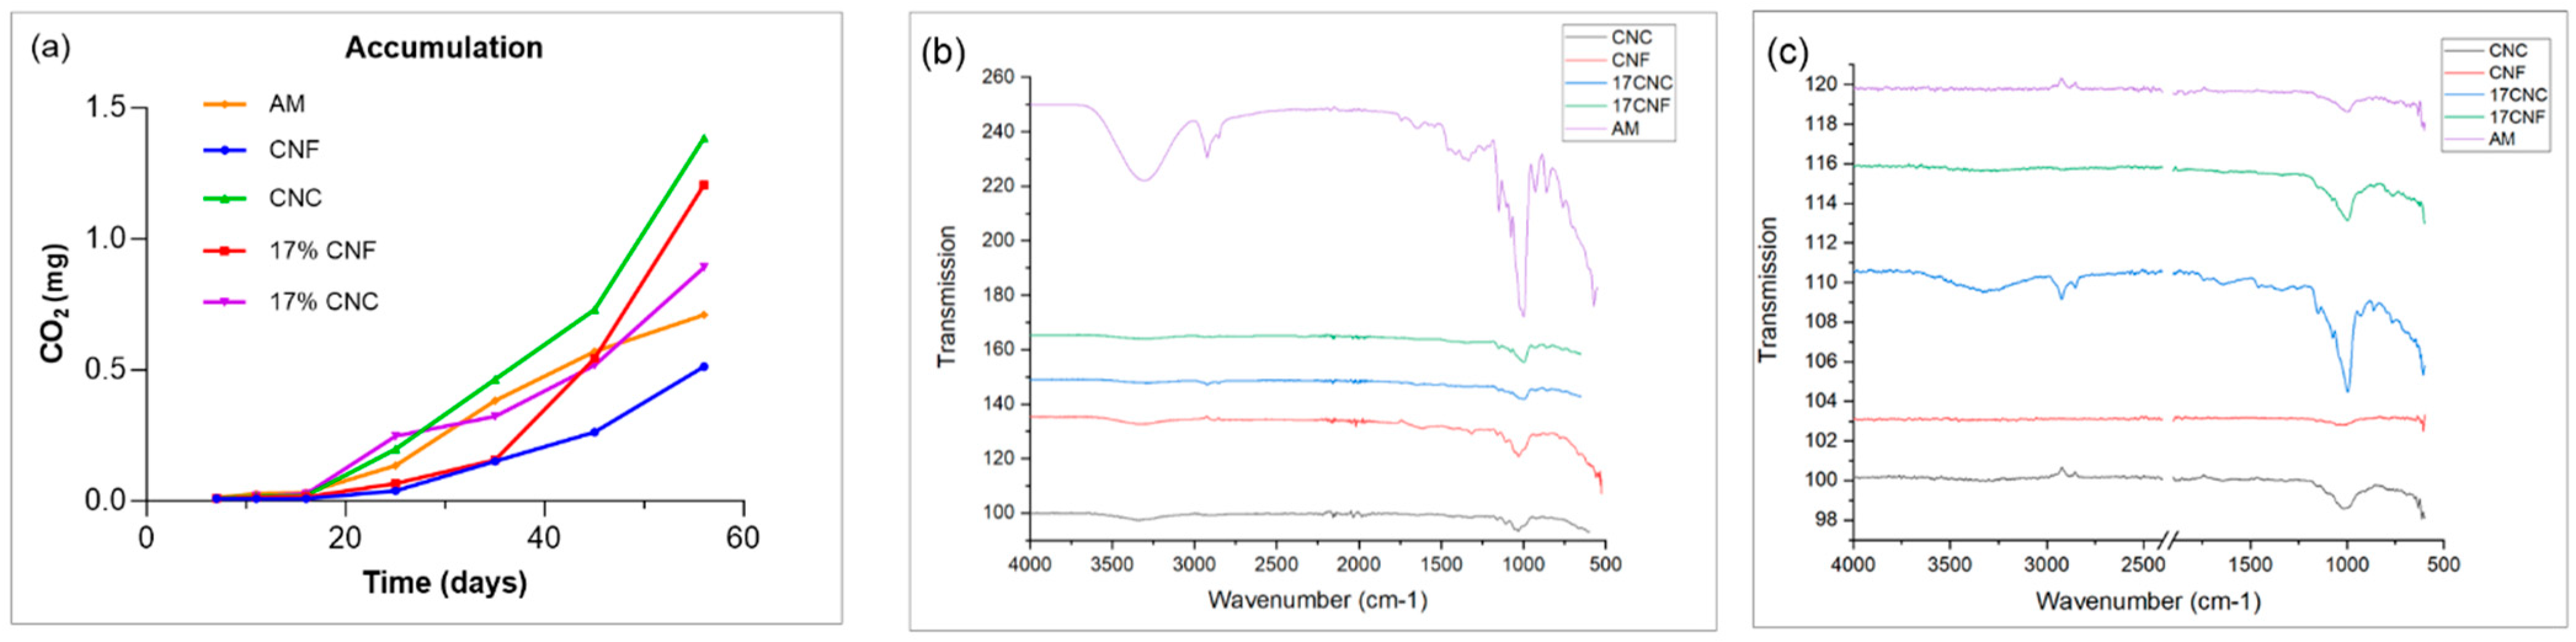
3.1. FTIR

The AM spectra revealed distinctive peaks: the band at 3280 cm−1 corresponded to the stretching vibration of -OH groups in AM. The band at 2921 cm−1 indicated C-H single bond stretching, while the peak at 1648 cm−1 was associated with water molecules in AM. Peaks at 1156 and 989 cm−1 were assigned to C-O-H and C-O-C stretching, respectively.
In the AM nanocomposite films, spectra of AM, CNF (Figure 1a), and CNC films (Figure 1b) exhibited a broad band at 3600–3000 cm−1 attributed to O-H stretching. This was due to extensive hydrogen bonding among cellulose, AM, and glycerol hydroxyl groups [19], with variation in peak intensities across samples. The strongest signals were in 6% CNF and 17% CNC films, indicating increased H-bonding and adhesion. Hygroscopic behavior of polysaccharides led to an adsorption band at 1648 cm−1, attributed to absorbed water, with reduced intensity in 3% CNF and 3% CNC films due to interactions among AM, CNF/CNC, and glycerol that decreased hydroxyl group-water binding.
In conclusion, CNC, CNF, and AM spectra were similar due to their similar chemical nature, complicating peak distinction [20]. Yet, absorbance’s at certain wavenumbers in CNC and CNF films exceeded those in the AM film, likely due to extensive bonding among AM, glycerol, and nanocellulose [31].

3.2. Thickness and Moisture

Film thickness is a crucial parameter affecting properties like gas permeability and opacity. The measured thickness for both AM and nanocomposites ranged around 0.06–0.08 mm. There was no significant difference observed before and after incorporating CNC or CNF into the AM matrix (p > 0.05) (Figure 2a). This consistency can be attributed to precise control over the dry mass content per unit area during the casting process [32].
Moisture content in the composite films was generally lower than in pure AM films, except for the lowest nanofiber concentrations (0.5% CNF and 1.0% CNC). This reduction can be attributed to the interaction between CNF/CNC and AM, leading to decreased water absorption (Figure 2b). No significant difference was observed between the CNC and CNF composite films (p > 0.05) (Figure 2b). In AM/CNF composite films, higher CNF concentrations led to slightly lower moisture content compared to CNC films, attributed to the entanglement and confinement behavior of CNF. This finding suggests that CNF exhibited stronger bonding compared to CNC due to its flexibility and length, which is reflected in the subsequent mechanical analysis results below.

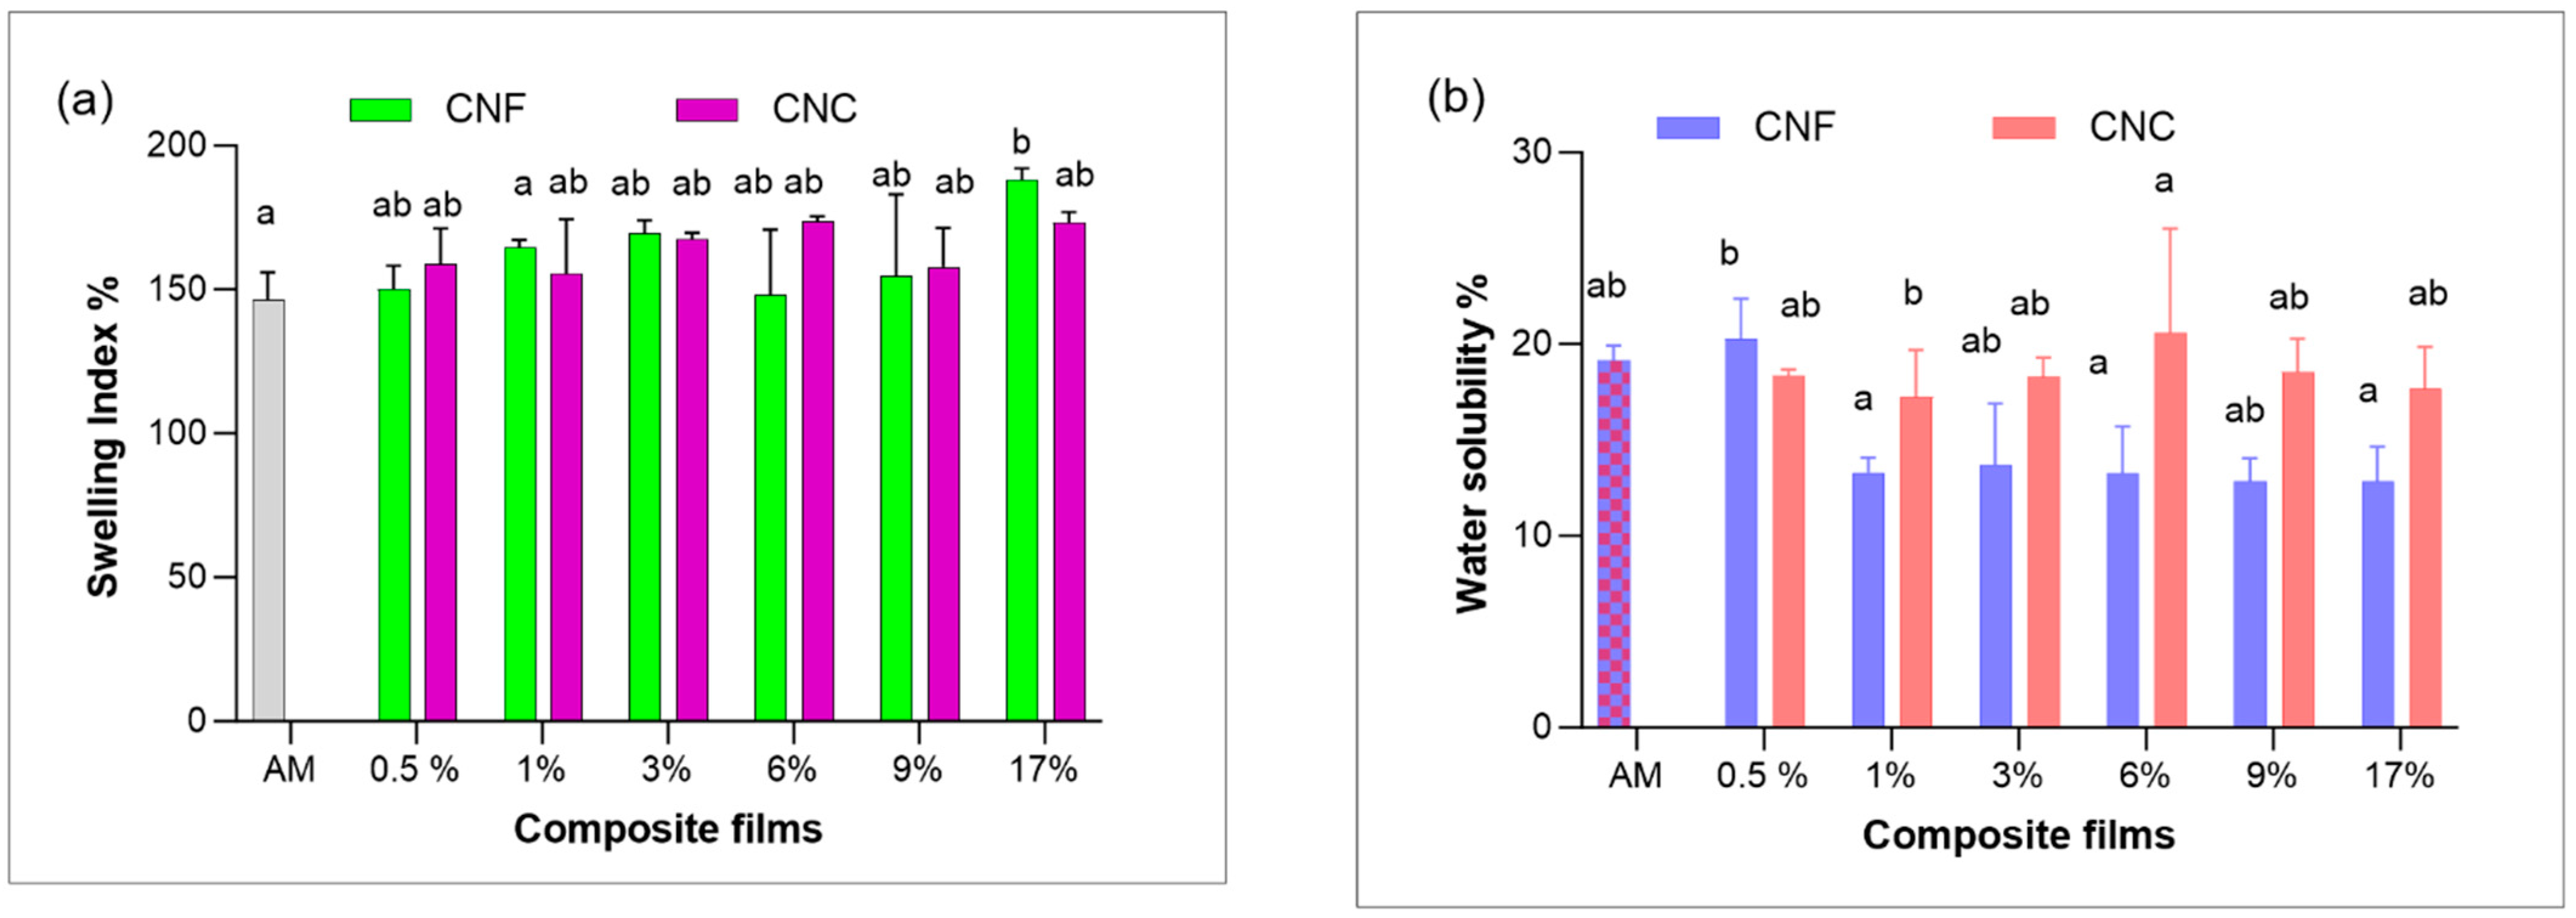
3.3. Swelling Index (SI) and Water Solubility(SW)

AM demonstrated a lower swelling index compared to both CNF and CNC composites, which may limit its application in the food industry. However, the incorporation of CNC and CNF led to an increase in the swelling index (Figure 3a). This behavior can be attributed to the interaction of nanocellulose with water, resulting in the observed swelling index increment. Remarkably, CNF films displayed a progressive rise in the swelling index with increasing CNF concentration, highlighting its unique ability compared to CNC in restricting the free volume within the AM matrix, consequently impeding water diffusion into the film.
As anticipated, owing to the lower water affinity of nanocellulose compared to AM, the water solubility of the films decreased upon the addition of CNC and CNF (Figure 3b). Remarkably, the CNF composite films displayed even lower values compared to CNC. This effect might be attributed to the agglomeration of CNC within the AM matrix.

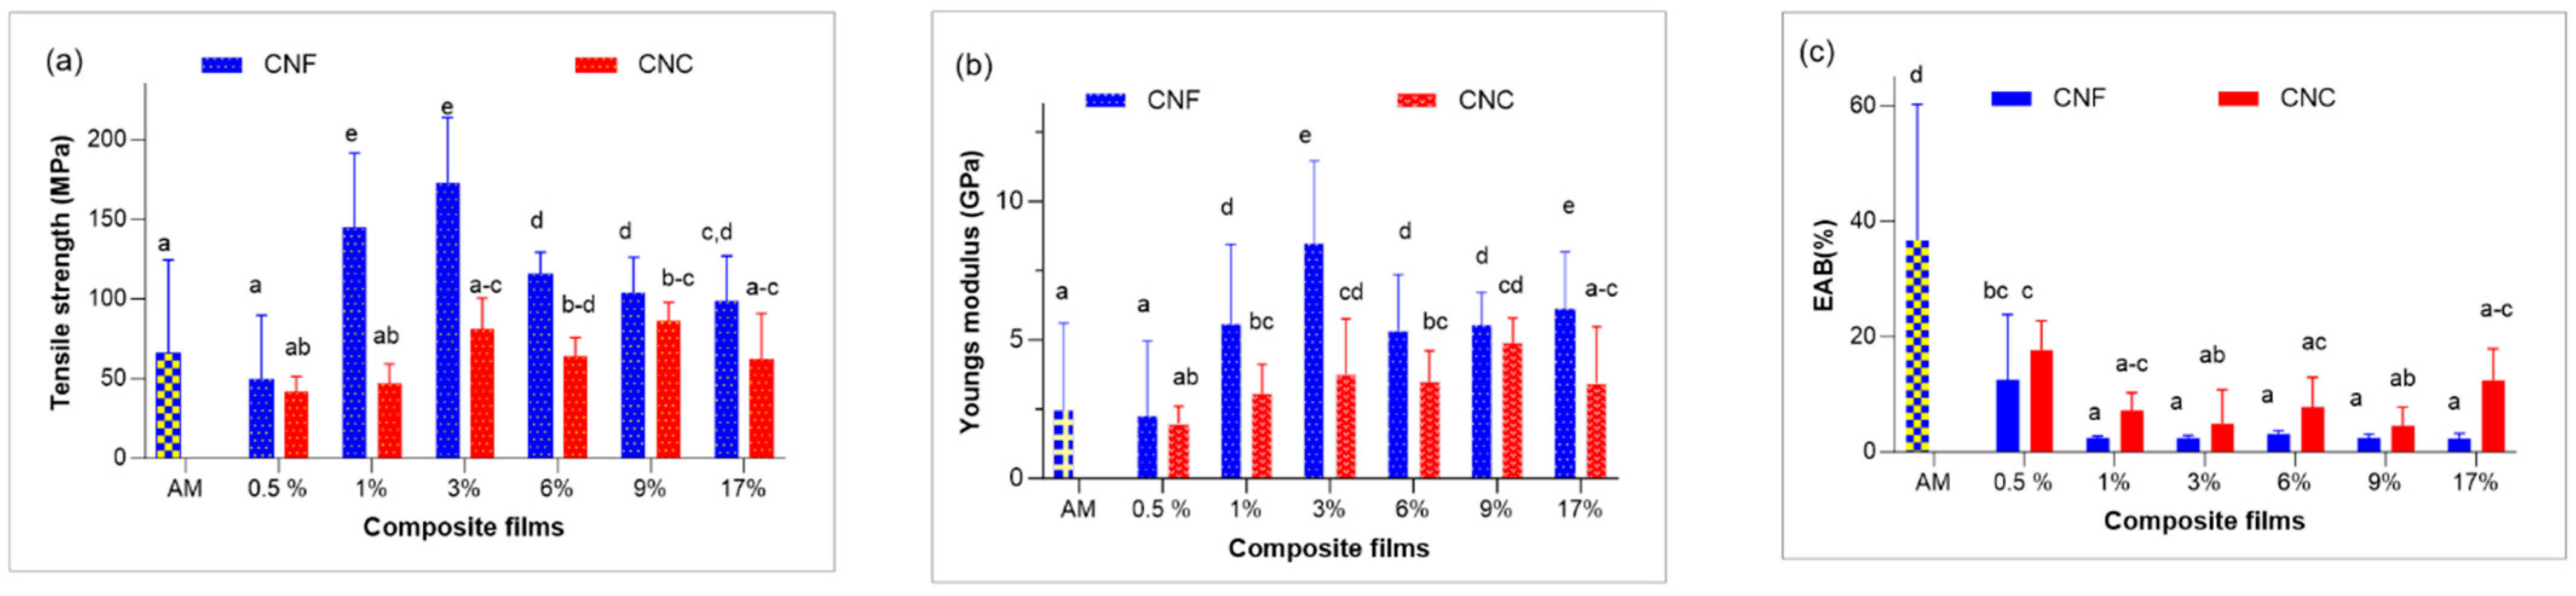
3.4. Mechanical Properties
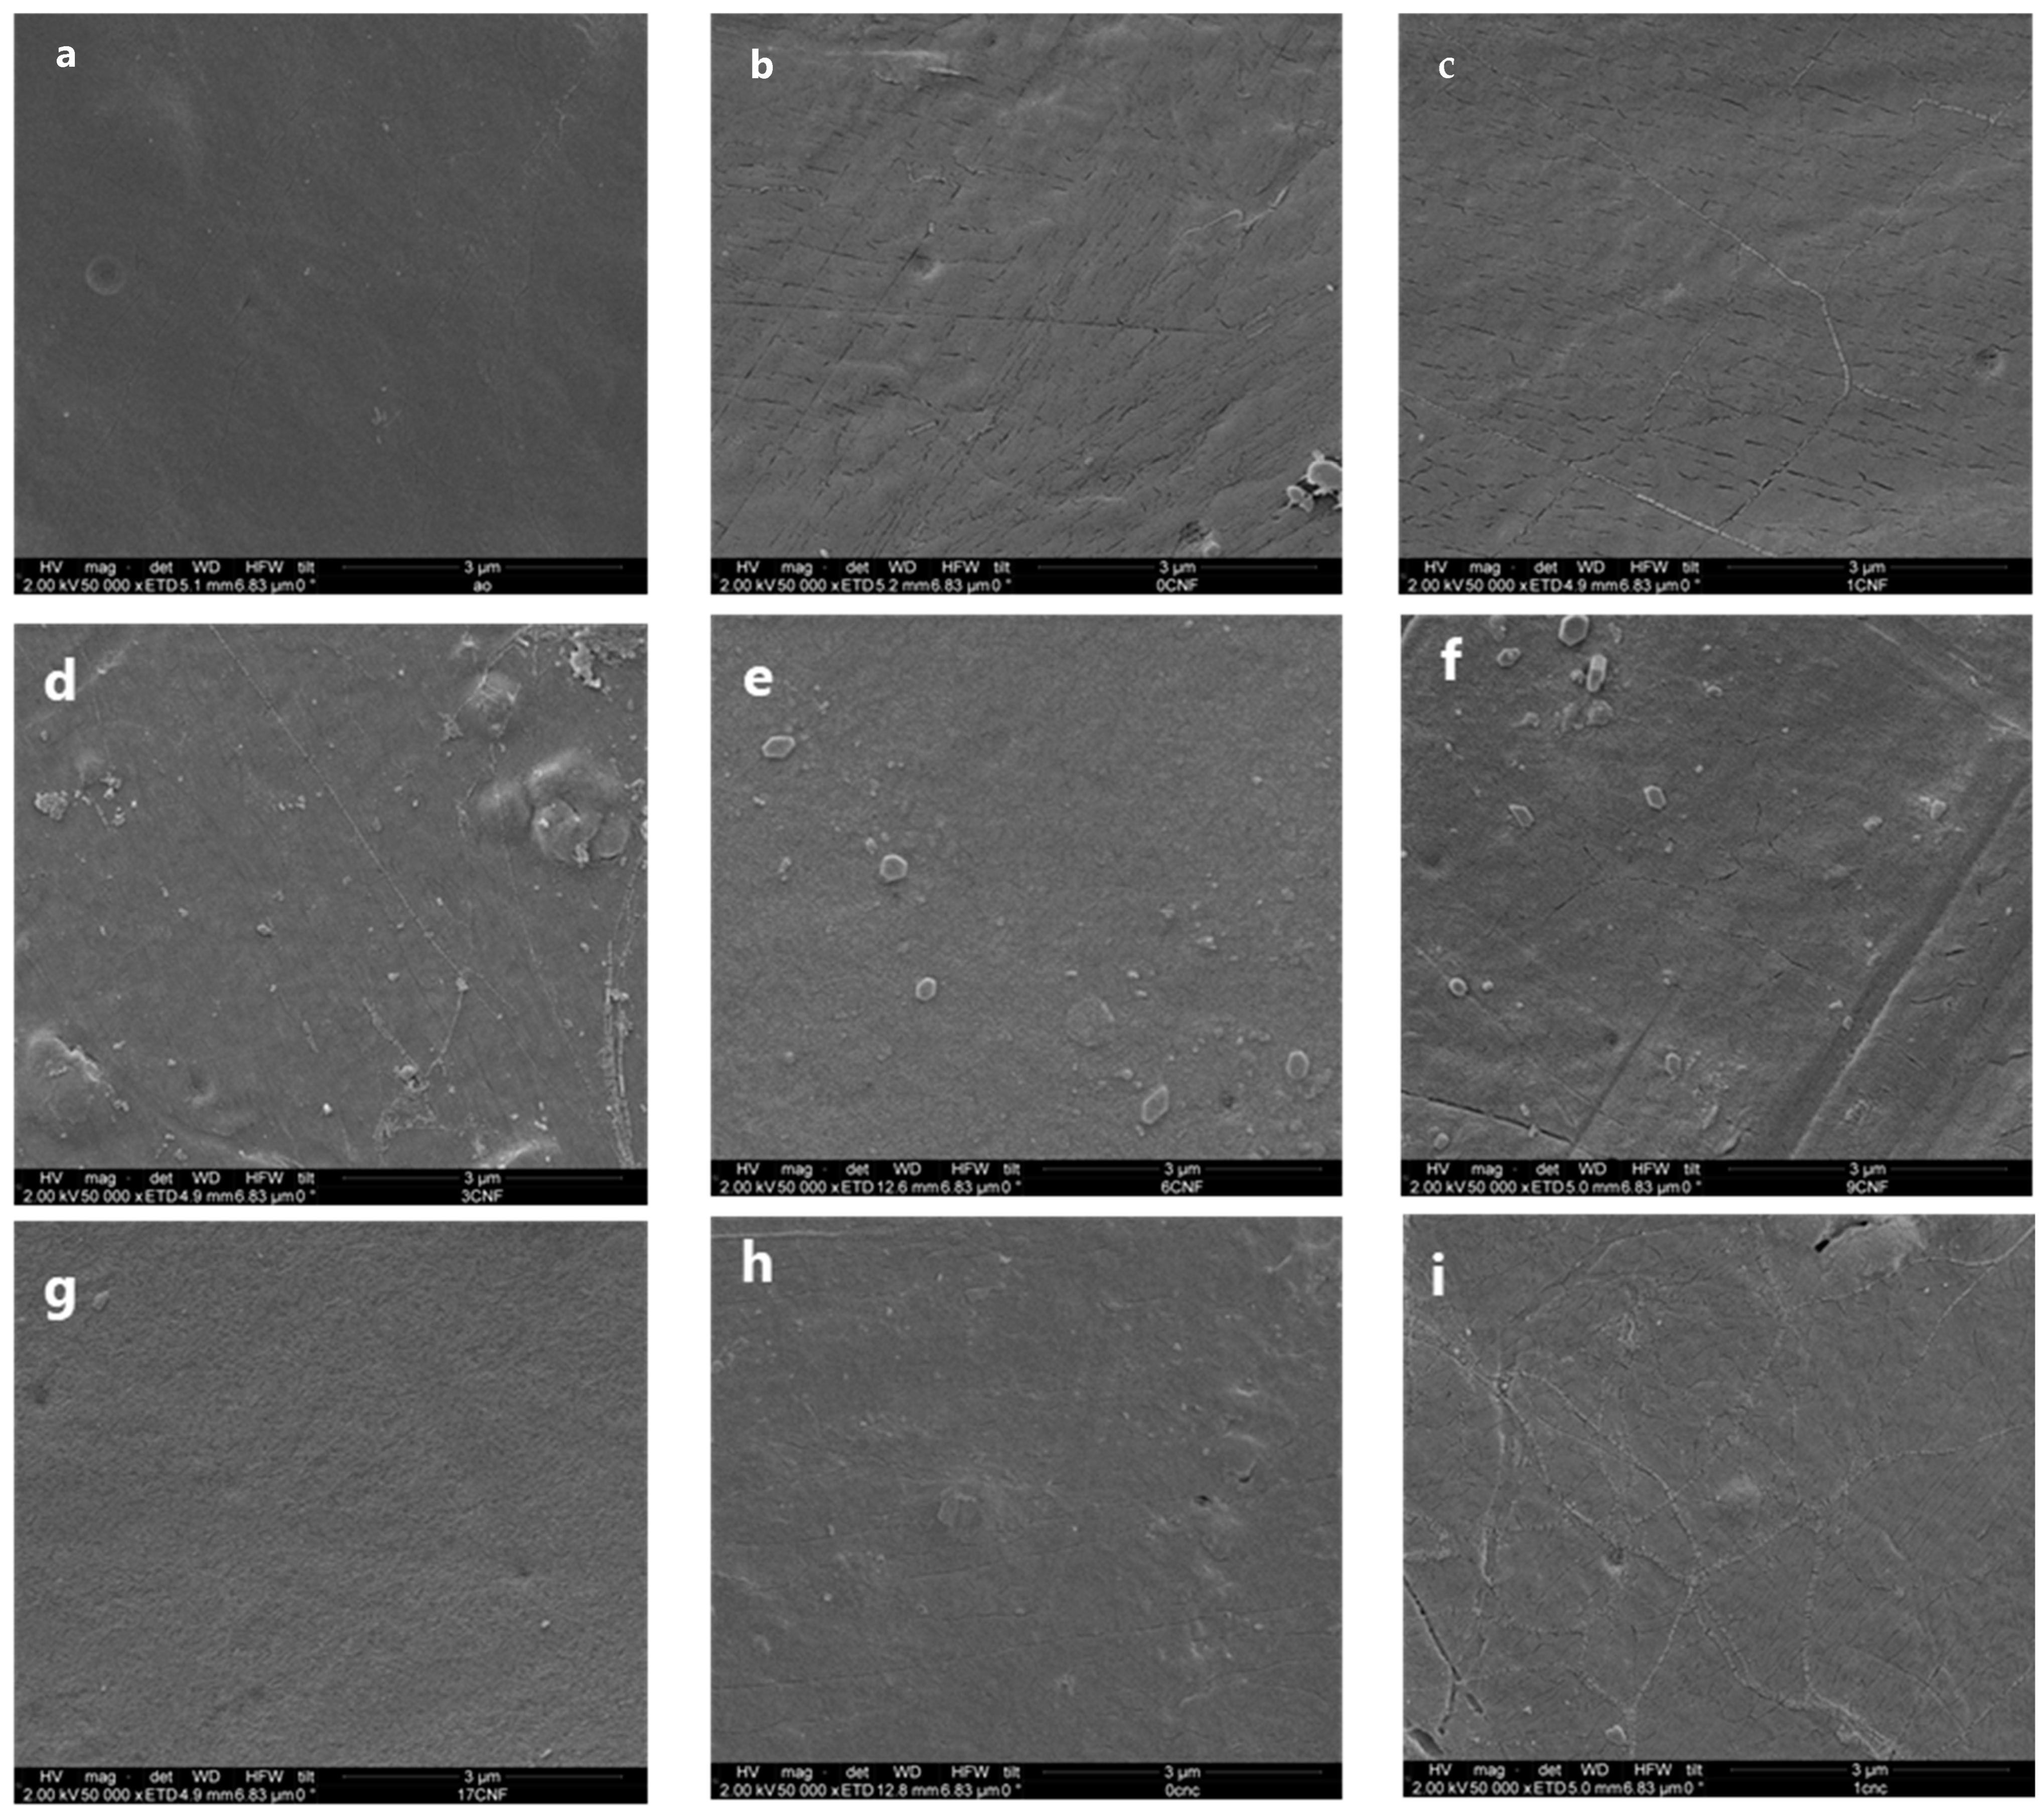
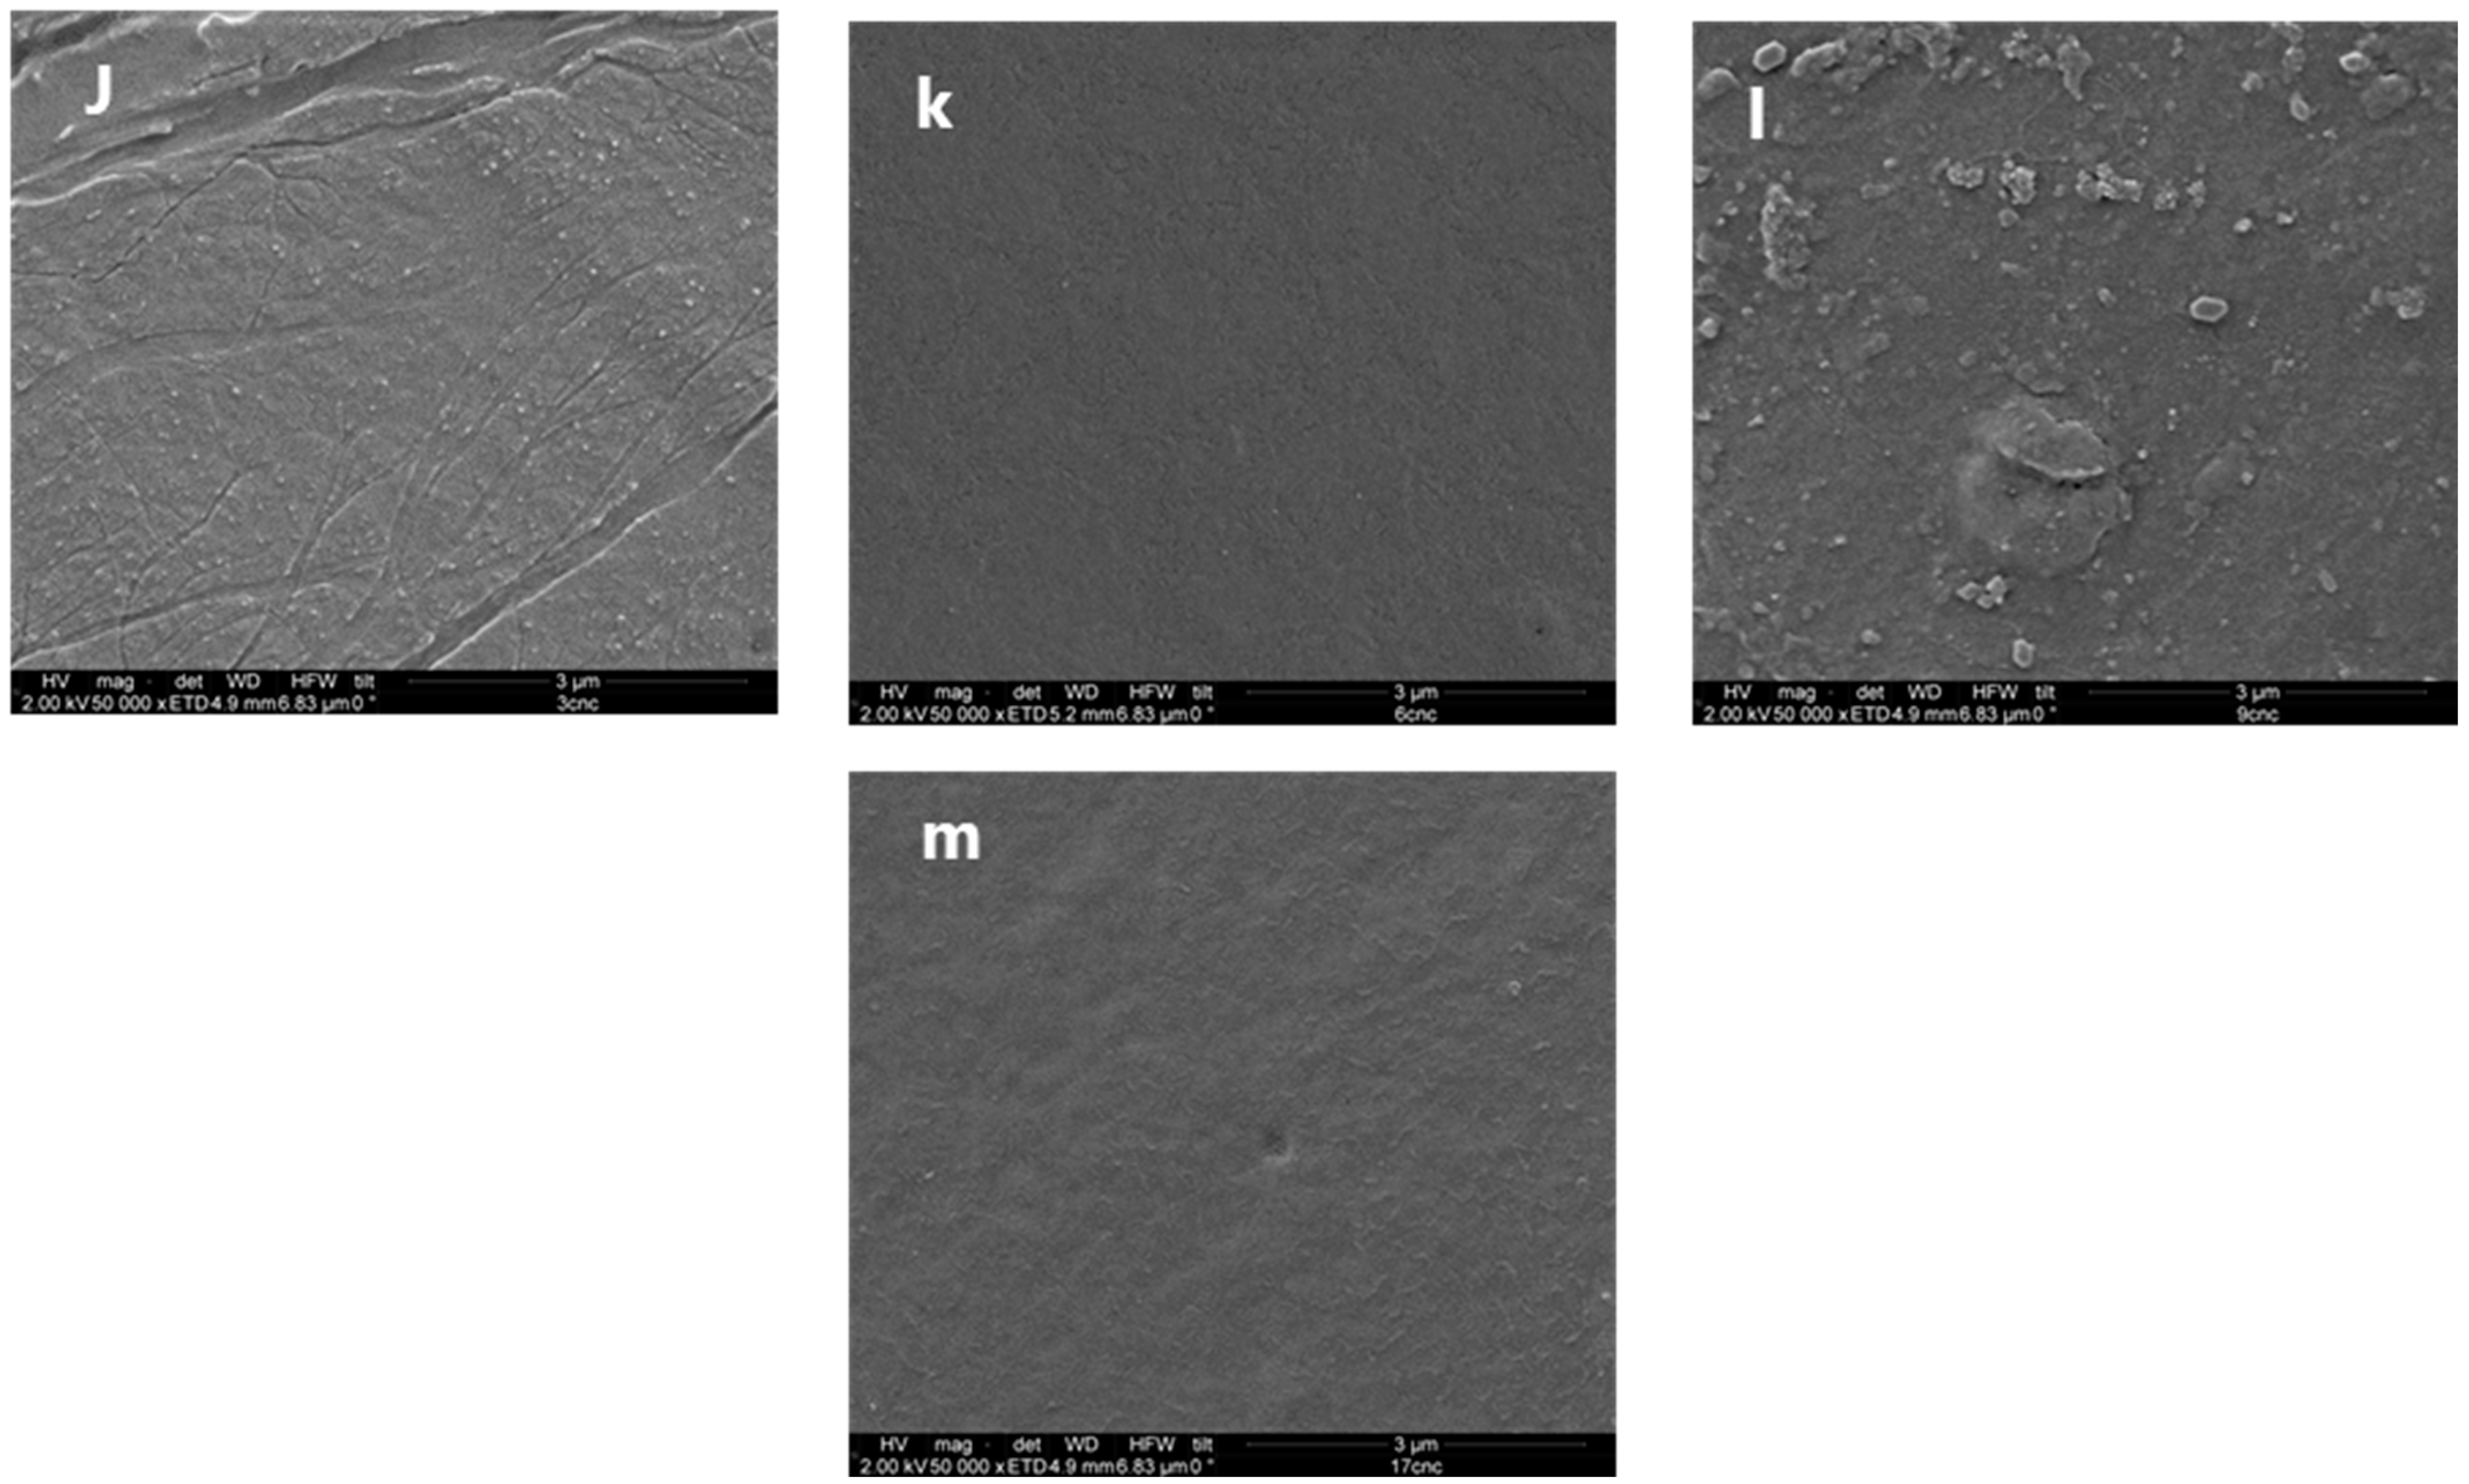
Mechanical assessments revealed that the incorporation of nanocellulose generally enhanced the strength and stiffness of the films (Figure 4a–c). Particularly, CNF had a pronounced influence on stress at break (TS) and Young’s modulus (YM), leading to significant enhancements (Figure 4b,c). Consequently, a noticeable disparity emerged between CNF- and CNC-containing films. The introduction of CNC moderately raised these properties. However, films containing 0.5% CNC or CNF, as well as 1% CNC, exhibited lower YM and TS values. The original TS of AM was 66 MPa, while in the presence of CNF, it increased to 128 MPa at a 3% CNF concentration and to 145 MPa with the addition of 1% CNF. The diminished YM and TS values at higher CNC concentrations are likely attributable to reduced crystal dispersion and agglomeration (Figure 4a) [33].
Including either CNC or CNF in the films reduced the elongation at break (EAB), especially for the CNF-containing films (Figure 4c). The significantly lower values observed for the elongation of the CNFs could be attributed to strong and stable bonds and interactions between the nanofibers and the AM matrix, as well as an effective stress transfer from the matrix to the fibers [25]. This effect is likely due to the inherent rigidity of nanofibers and the homogeneous dispersion of their crystalline and amorphous phases [34]. On the other hand, the lower values of TS and higher values of EAB in CNC films as compared to the CNF films suggest that CNCs form less dense structures, allowing for higher polymeric mobility under stress. In contrast, CNF films created highly compacted polymeric networks that resisted the applied stress.

3.5. SEM

SEM analysis of the film surfaces revealed distinctive effects of different concentrations of CNC and CNF on film topography and cross-sections (Figure 5). The AM film exhibited a uniformly smooth surface, free from cracks or voids. At very low concentrations of 0.5% CNC and 0.5% CNF, the surfaces appeared even smoother and continuous, indicating compatibility between CNF/CNC and AM (Figure 5b,c). This smoother topography can be attributed to the hydrogen bonding effect of plasticizing glycerol within the AM phase, which hinders aggregate formation. Similarly, CNC can promote the development of a homogeneous structure due to the chemical affinity between nanocellulose and AM, creating strong bonding between them [35]. However, some films exhibited topographic cracks. Films such as 1% CNC and 1% CNF displayed smaller and more frequent cracks on their surfaces, while 3% CNC showed larger fractures (Figure 5d,e). Despite occasional cracks and variations, all films presented relatively smooth surfaces devoid of pores, remaining robust, flexible, and maintaining commendable mechanical and barrier properties [36].
Among the films, AM exhibited the most rugged cross-section fracture, contrasting with the smoother fracture surfaces seen in the presence of CNC or CNF (Figure S2a–m). Irrespective of the percentage, the inclusion of CNC or CNF yielded smoother fracture surfaces. Notably, films containing 0.5% CNF and 1% CNF displayed the smoothest cross-section fractures (Figure S2b,c). However, higher concentrations, starting from 3% CNF, revealed less uniform fractures, suggesting reduced adhesion between nanocellulose structures and the AM matrix. Certain films, like 6% CNF and 3% CNC, showed coherent layers of crystals and fibers in their cross-section structures [19]. The cross-sections also exhibited micro cavities, potentially originating from the imprint of nanocrystal aggregates left after the detachment of the AM matrix and the nanocellulose particles [37]. Furthermore, the SEM data align with the lower solubility observed in the CNC compared to the CNF composites (Figure 4b), attributed to CNC agglomeration within the AM matrix. To mitigate cracks and ensure homogeneity in composite films, optimization of nanocellulose particle dispersion is crucial; this can be achieved by combining homogenization techniques with the stirring process before suspension heating.

3.6. Light Transmittance and Opacity

The transparency of a film holds significance in assessing its compatibility with polymer blends. For various food packaging applications, achieving high visibility in the visible spectrum is essential for presenting the food product appealingly to consumers [38]. Hence, the opacities of the films were evaluated based on their visible spectra. Within the film set, the AM film displayed the lowest transparency (Table 1). However, upon incorporating CNF or CNC, the composite films exhibited increased transparency, thus enhancing the visual representation of the enclosed product for consumers [37]. In comparison to the AM film, all films demonstrated improved light transmittance, with the 9% CNC film achieving the highest transparency while the 9% CNF film exhibited the lowest. This phenomenon could be attributed to the strong interactions between nanocellulose fillers and the AM matrix, effectively restraining retrogradation and recrystallization of gelatinized AM during the air-drying process [39].

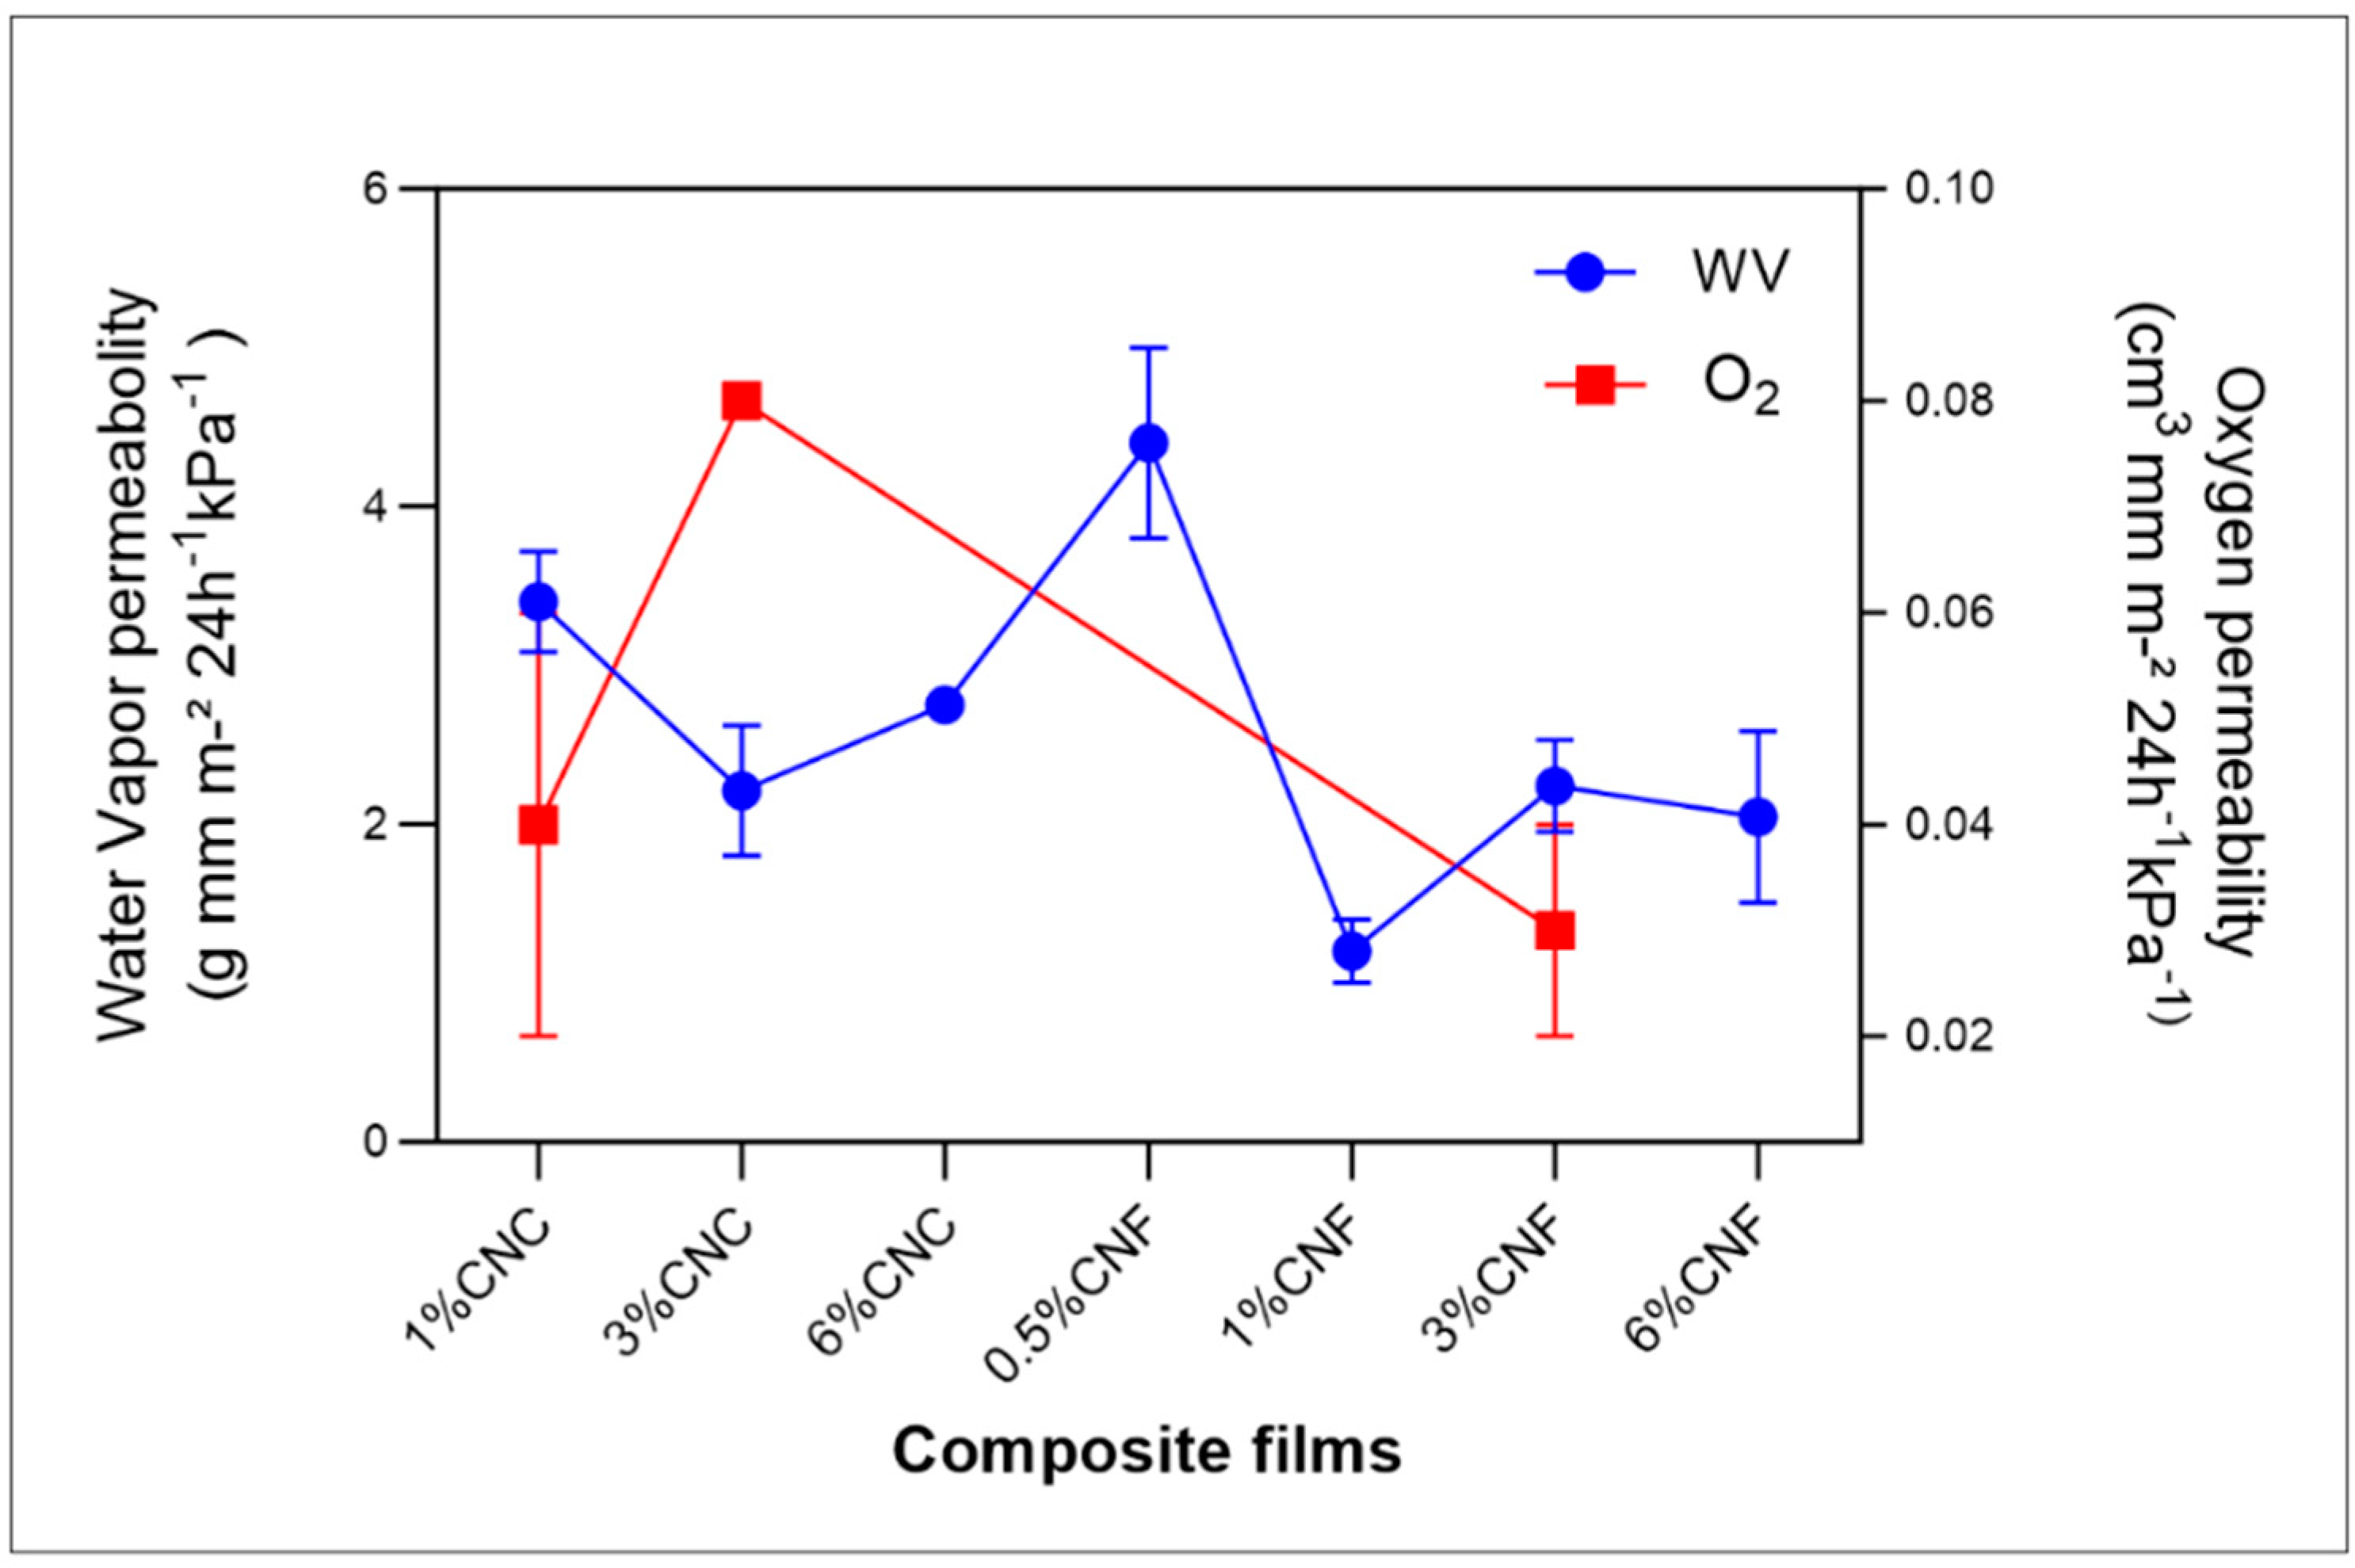
3.7. Water Vapor (WV) and Gas Permeability

WV and gas permeability constitute crucial attributes in packaging materials. The WV characteristics of thermoplastic films are contingent upon film matrix crystallinity, compactness, hydrophilic groups, and thickness. Elevation of both CNC and CNF concentrations led to diminished barrier performance against water vapor transmission (WV) (Figure 6). Notably, the WV permeability of AM films was quantified at 8.7 ± 0.4 g mm m−2 24 h−1kPa−1 [40].
The augmented diffusion of WV can be attributed to hindered permeation stemming from intricate pathways formed within the films. Specifically, the inclusion of 1% CNF in AM film exhibited a more pronounced hindrance to water diffusion (p < 0.05) than 1% CNC, likely attributed to CNC aggregation in the AM matrix [41]. However, a trend was discernible—albeit statistically non-significant (p > 0.05)—indicating a propensity to reduce WV permeability upon exceeding this concentration (Table S1).
Concerning oxygen permeability, subtle distinctions emerged between bioplastic films containing CNC or CNF. Specifically, the 3% CNC films demonstrated elevated oxygen permeability, while the 3% CNF films exhibited enhanced gas barrier properties. These phenomena align with the compact network structure achieved through CNF, as corroborated by SEM analysis [19].
Importantly, the WV and oxygen (O2) permeability values of all composite films outperformed the majority of petroleum-based materials [42]. Notably, the composite films’ water vapor permeability exceeded that of LDPE, measuring 0.07 ± 0.01 (cm3 mm m−2 24 h−1kPa−1). Additionally, the barrier efficacy of the composite films yielded higher oxygen permeability compared to LDPE, registering at 3.79 ± 0.80 (cm3 mm m−2 24 h−1 kPa−1) [43].

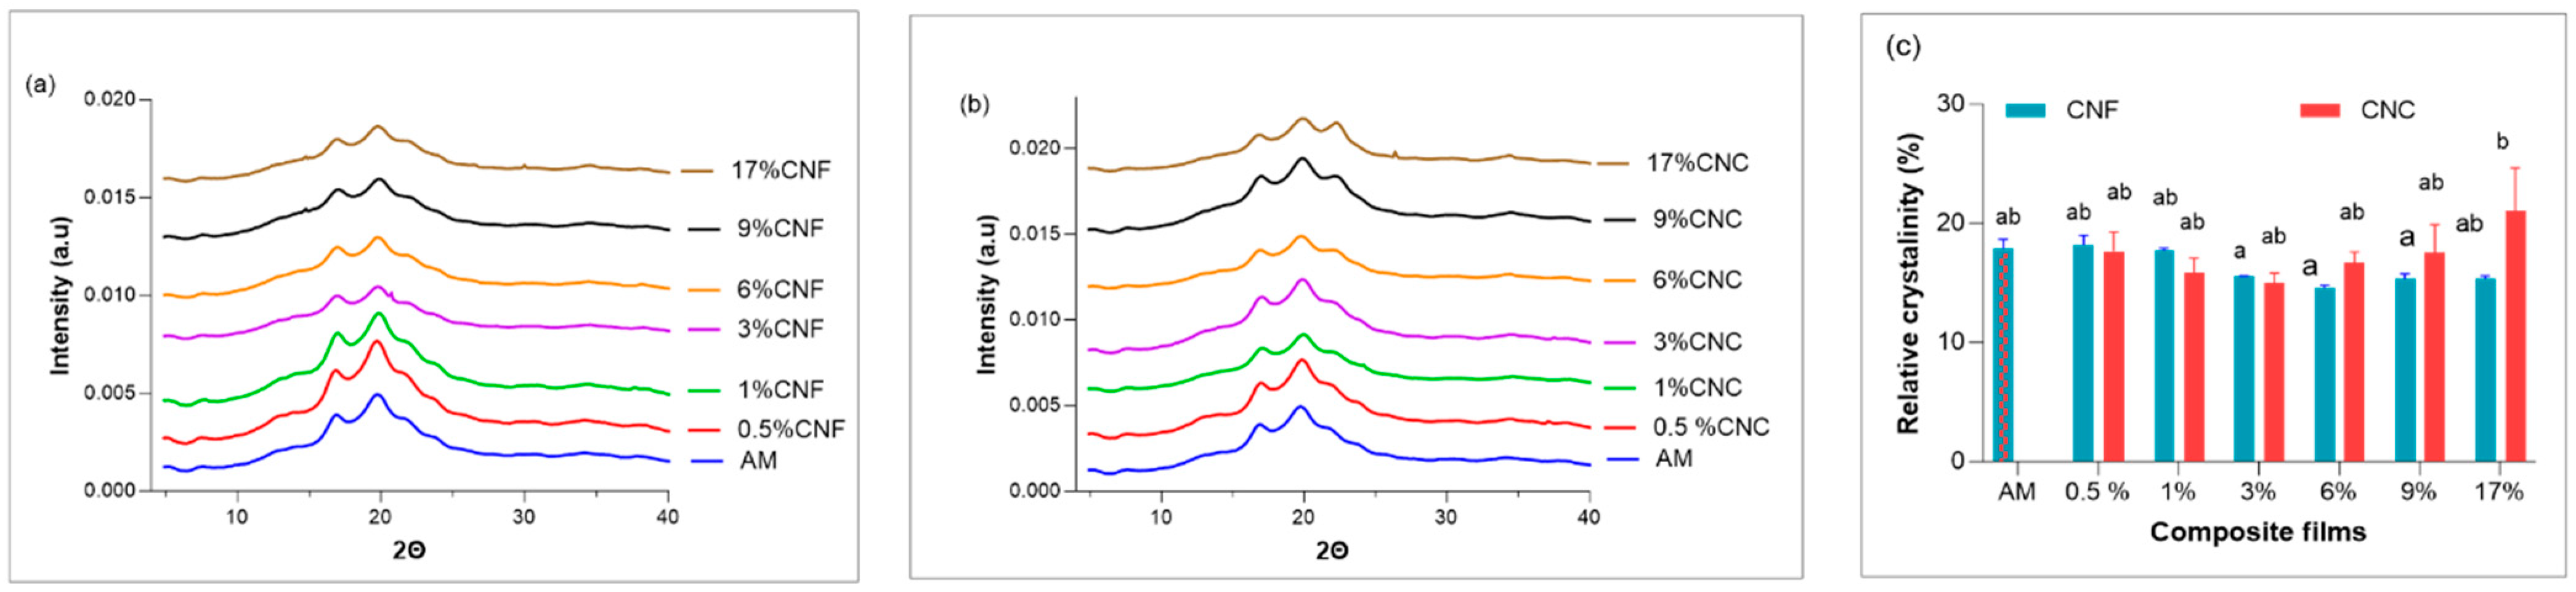
3.8. Wide Angle X-ray Scattering (WAXS)

X-ray diffraction analysis revealed well-defined crystalline structures within the biocomposite films. Differences in intensities were apparent between the CNF and CNC films, arising from the repeated β-(1 → 4)-D-glucopyranose units constituting parallel glucan chains [44].
The AM film featured a V-type polymorph, primarily characterized by single helices around 17°, 19.8°, 23°, and 25°—hallmarks of high AM starch (Figure 7a,b) [19]. CNF exhibited discernible diffraction peaks at 2θ values of 16.2° and 22.3°, indicative of a type-I cellulosic crystalline structure (Figure 7a) [19].
Of interest, the characteristic XRD peaks associated with CNC and CNF vanished in the nanocomposite films. This outcome signifies the successful integration of CNF and CNC into the AM matrix, except for the 17% CNC film, where the peak at 2θ = 22° grew in intensity due to its higher film content (Figure 7b). Notably, no new peaks or shifts in diffraction angles surfaced (Figure 7a,b). The relative crystallinity of the composite films remained largely unchanged (p > 0.05) upon filler addition, with the exception of the 17% CNC film (Figure 7c). Analogous behavior was documented in plasticized starch films reinforced with CNF, suggesting that favorable interfacial crystallization arises when the starch matrix is plasticized with glycerol and due to effective filler dispersion in the matrix [33].
Consequently, it is apparent that the diffractograms of the films encompassed a coexistence of the two film components (AM/CNF) and (AM/CNC). The addition of CNF or CNC did not precipitate any alteration in the crystal structure of AM.

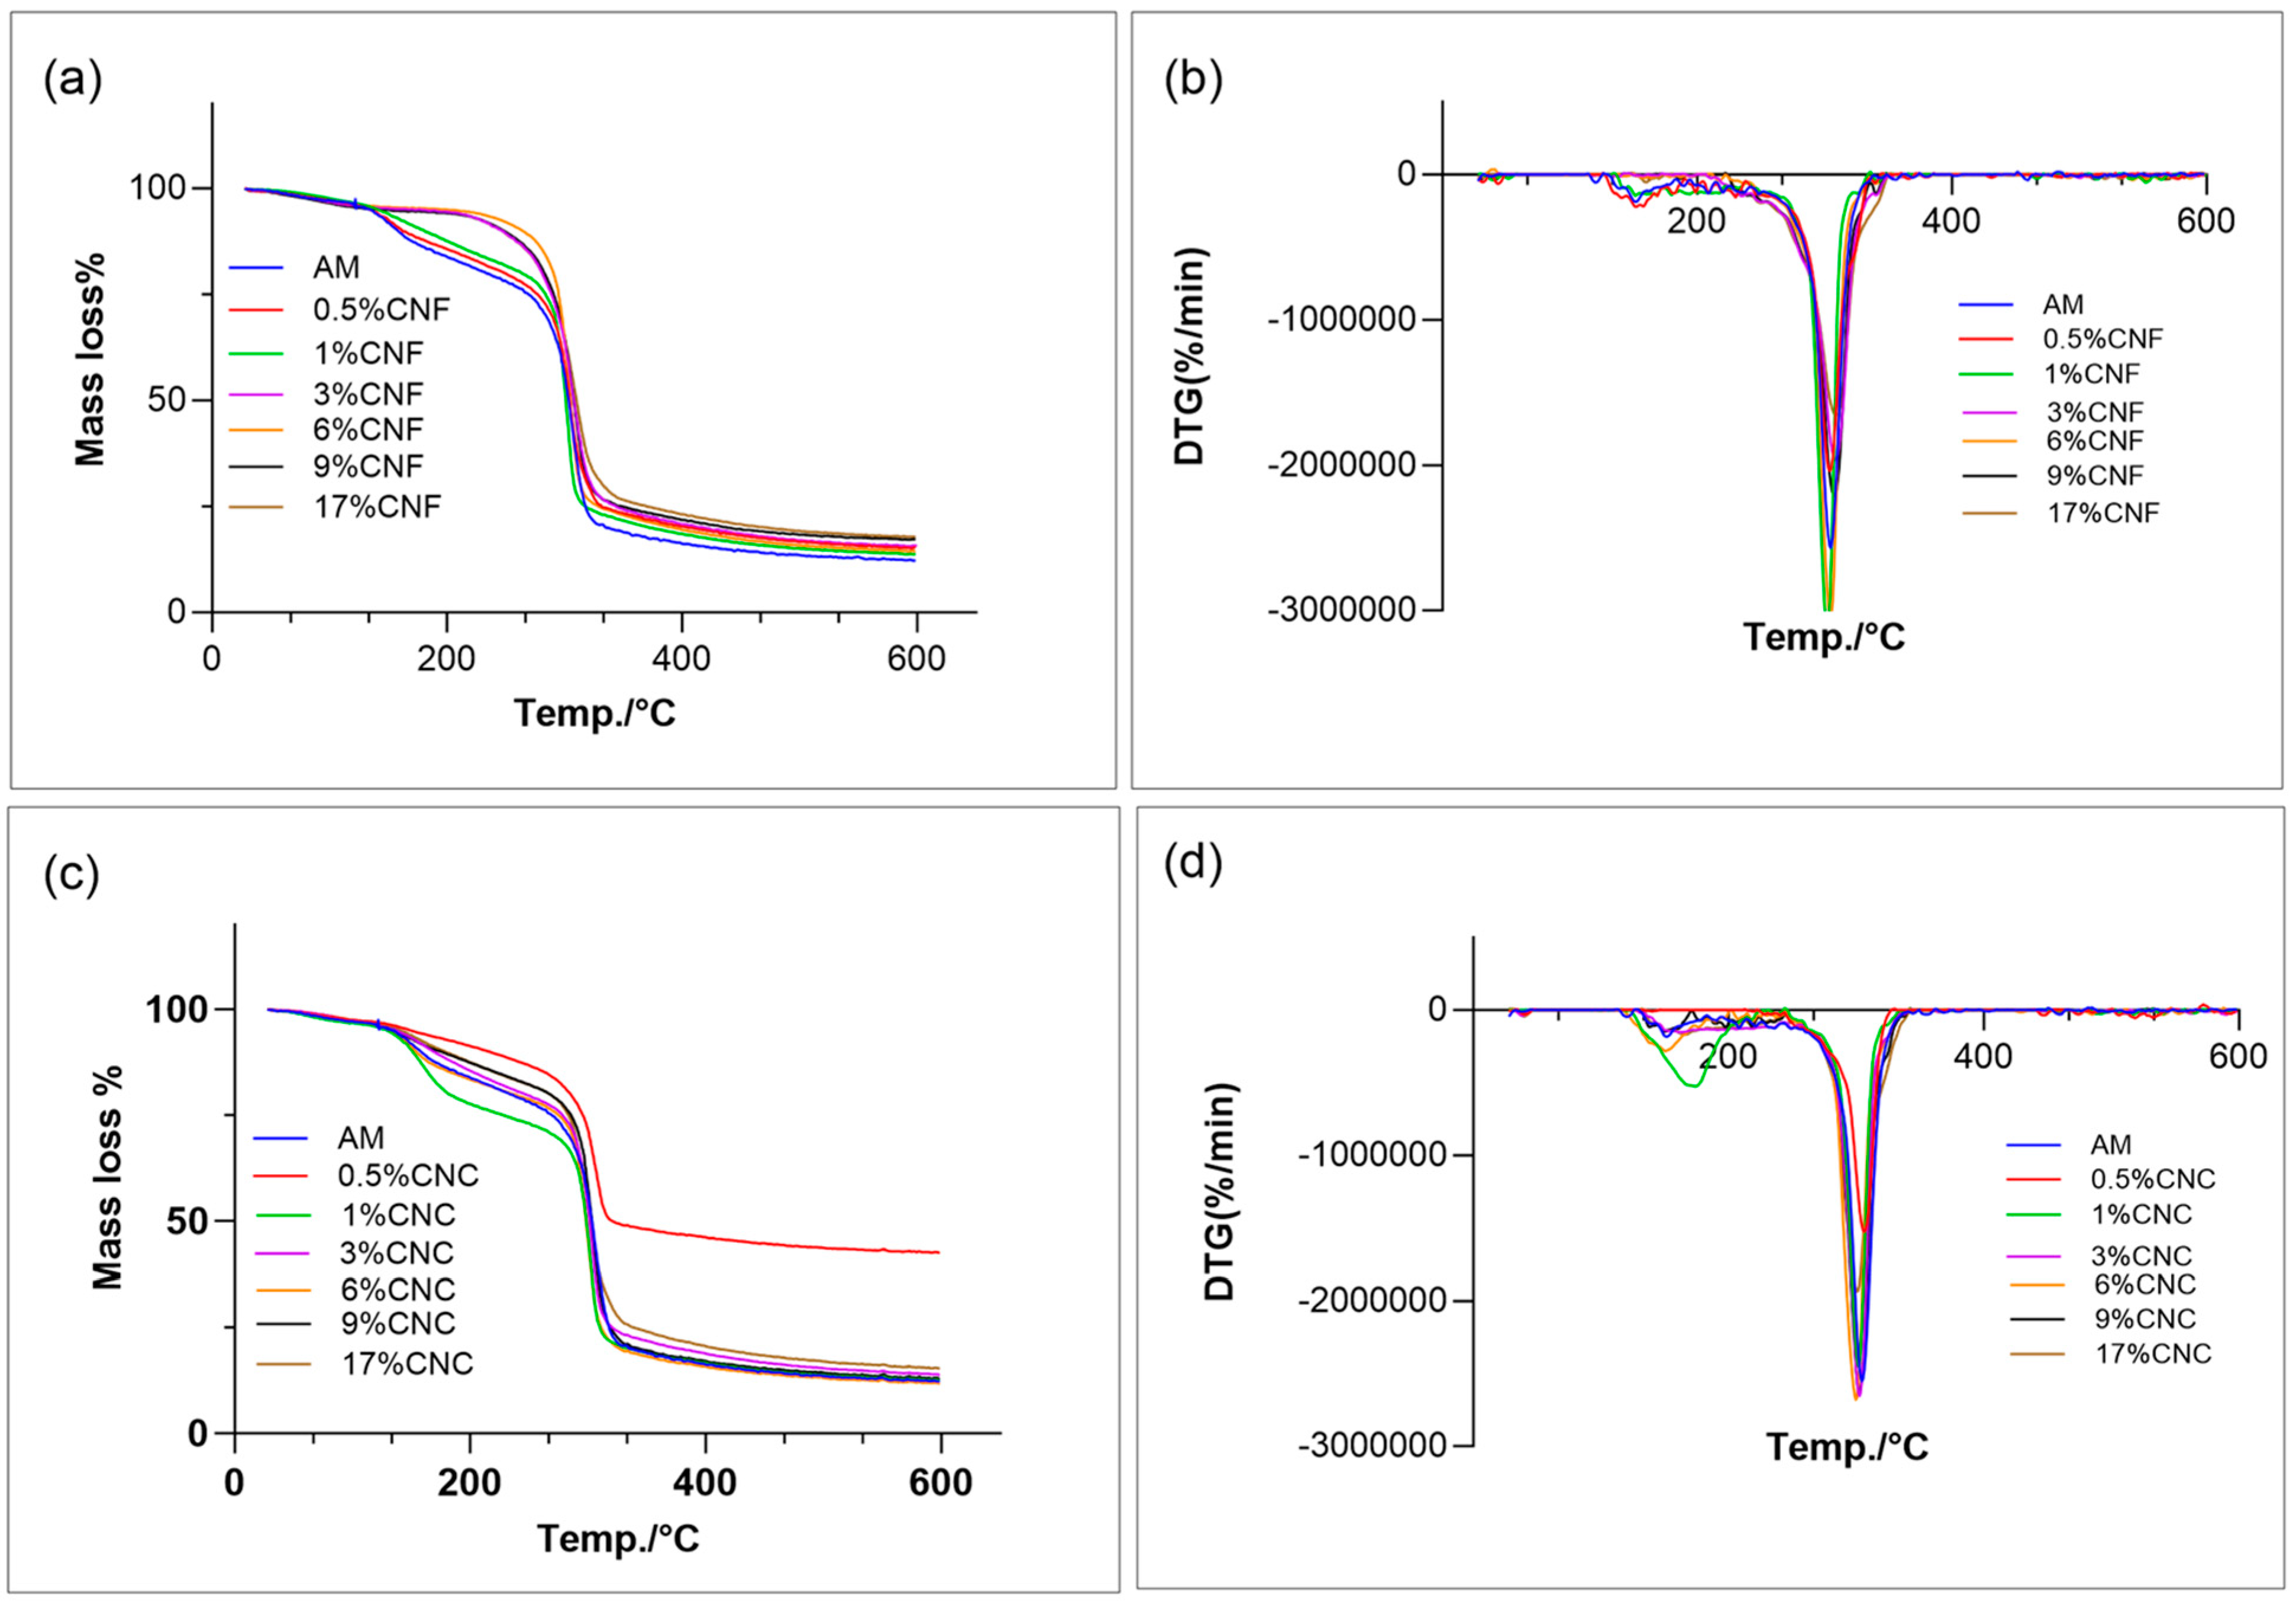
3.9. Thermogravimetric Analysis (TGA)

The thermal degradation of the films was assessed using TGA (Table 2). Figure 8a,b show TG and derivative thermogravimetric (DTG) curves for both AM and the composite films. The degradation profiles of AM, both with and without fillers, unveiled a three-stage degradation process. The first stage, within the 40–120 °C range, was attributed to water loss. The second stage, spanning 135–190 °C, marked the decomposition of the glycerol-rich phase. The third degradation stage, taking place between 290 and 350 °C, led to the formation of carbon black (Figure 8a,b).
For the CNF-filled nanocomposite films, degradation commenced at higher temperatures compared to the AM film, particularly at higher ratios of 9% and 17% CNF (Figure 8a). Conversely, the CNC-filled nanocomposite films exhibited reduced degradation as CNC content increased, likely due to agglomeration at higher concentrations (Figure 8b). These findings suggest that CNF possesses higher thermal stability than CNC. This insight is supported by XRD and SEM results, as CNF exhibited larger size and lower crystallinity. Therefore, the heightened thermal stability of AM/CNF can likely be attributed to CNF’s larger size and network structure.
Notably, similar observations were reported in previous studies involving pumpkin starch composite films reinforced with CNF, showing increased thermal stability compared to CNC-reinforced films [45].

3.10. Compost Biodegradation

In the soil burial test, three films of each sample underwent degradation over a 56-day period [46,47]. Notably, in the case of pure films, the AM-only film exhibited the most pronounced changes post-degradation, in contrast to CNF and CNC films (Figure S3). This suggests that biodegradation had initiated, with α-, β-, and γ-amylases hydrolyzing the α-(1 → 4)-glycosidic bonds of AM. At higher nanocellulose concentrations, fewer changes were observed, particularly in the 17% CNF film, suggesting that the 56-day degradation duration might not be sufficient for cellulases to degrade the cellulose structure.
Throughout flask incubation, the anticipated CO2 evolution occurred (Figure 9a). After 56 days, CNC exhibited the highest CO2 accumulation, reaching 1.4 mg. Initial CO2 production was minimal and nearly negligible [19]. Following a 16-day lag phase, CO2 evolution began increasing for all films, marking the commencement of assimilation and mineralization and entering the biodegradation phase. The steepest segments on the graphs indicated the most active phase of mineralization. All films displayed ongoing accumulation after 56 days of degradation, except for AM-only, which plateaued. The AM-only film reached the plateau, signifying the conclusion of assimilation and mineralization during biodegradation. The gases CH4 and N2O were only present in trace amounts, indicating the conducive, oxygen-rich conditions within the blue cap flasks remained optimal for degradation.
Samples were subjected to FTIR analysis before and after degradation to ascertain shifts in spectral intensities of the films’ functional groups (Figure 9b,c). Pre-degradation, all pure films (AM, CNF, and CNC), as well as AM composite films with 17% CNF and 17% CNC, exhibited prominent characteristic peaks at 3330 cm−1 (O–H stretching), 2902 cm−1 (C–H stretching), 1650 cm−1 (C–O stretching), and 1316 cm−1 (–CH2 bending). Additionally, absorption bands at 1159 cm−1 (anti-symmetric stretching of the C–O–C bridge) and 1028 cm−1 (skeletal vibrations involving C–O stretching) indicated a saccharide structure. Notably, no discernible differences were observed before and after the addition of CNF or CNC (Figure 9b).
Post-degradation, significant variations in absorption intensities were evident across all films. Notably, two characteristic bands within the 3650–3150 cm−1 range and at 2900 cm−1, corresponding to the O-H bond and C-H stretching in α-glucans and β-glucans, were absent in the degraded samples. An exception was the 17% CNC composite film, where they were reduced (Figure 9c) [19]. These findings suggest rapid degradation of CNF and CNC films within this timeframe, while the 17% CNC film exhibited slower degradation.

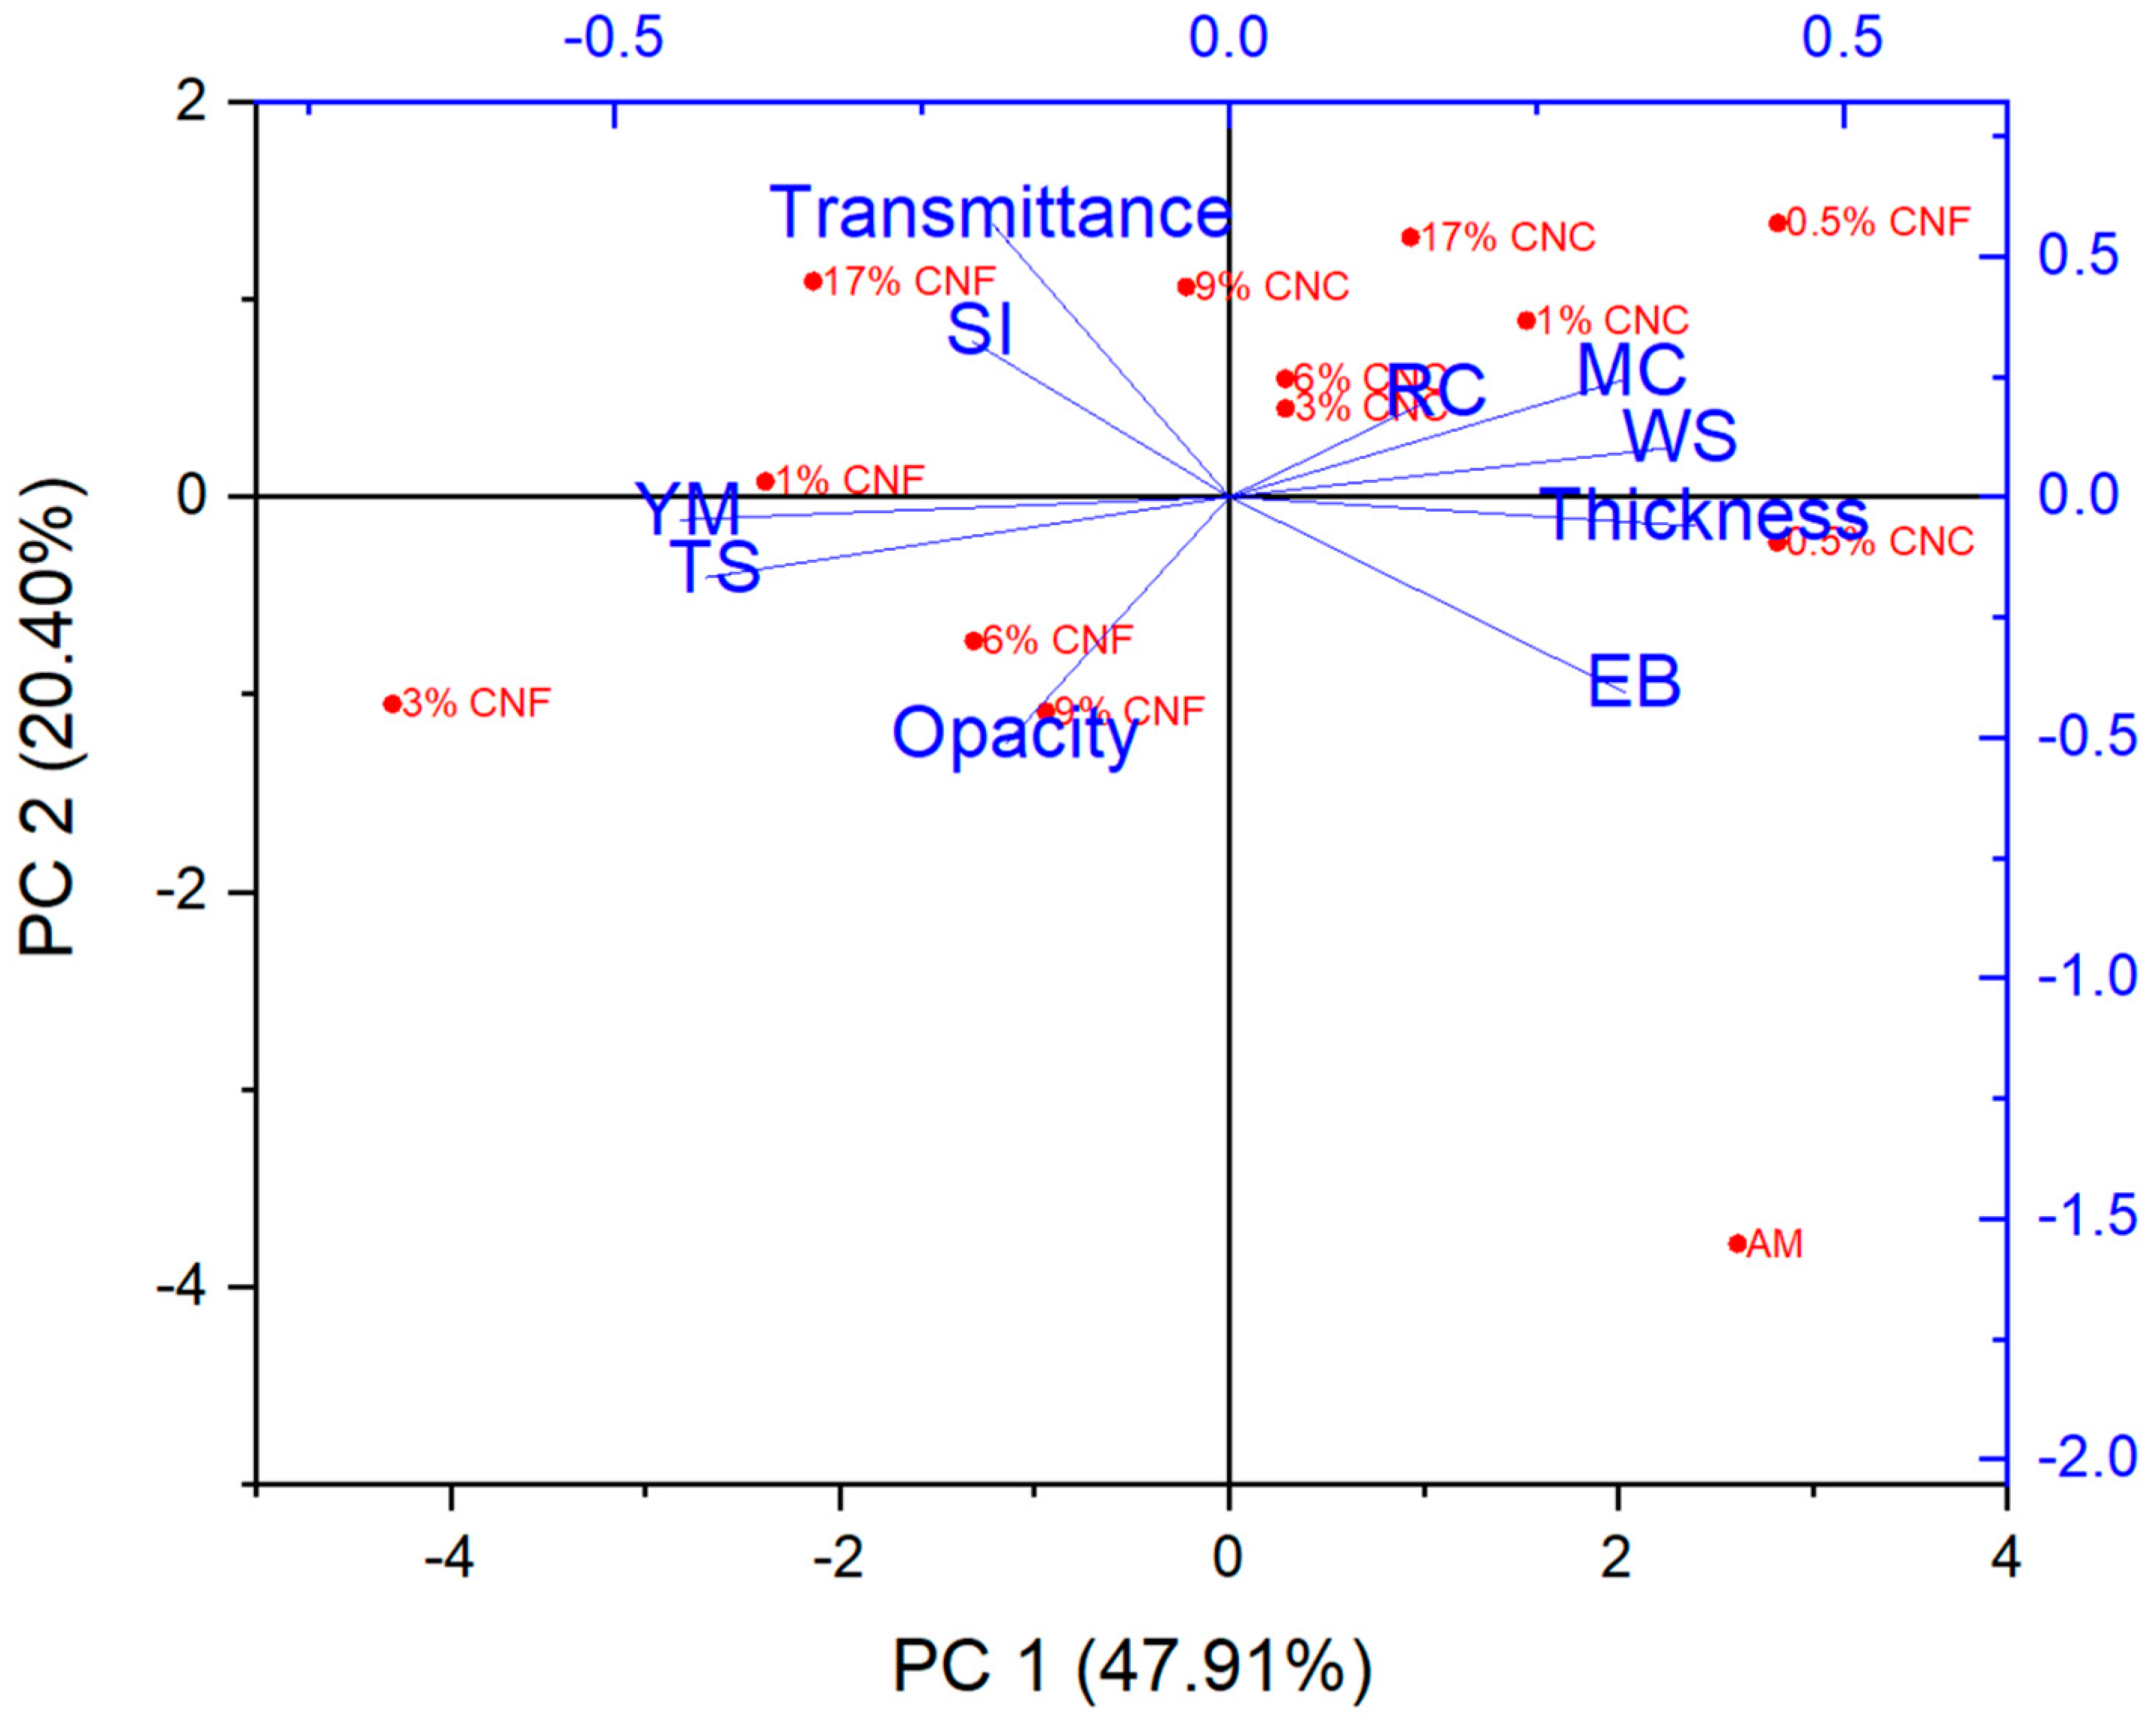
3.11. Principal Component Analysis

To illustrate the impact of CNF and CNC on the properties of the AM matrix, a Principal Component Analysis (PCA) was conducted (Figure 10). The primary component, PC1, accounted for 47.91% of the total variance and reflected the influence of CNF and CNC on the AM film. Notably, AM appeared as a distinct outlier among the samples due to its distinct characteristics, particularly high elasticity (EOB). PC1 effectively differentiated the data points corresponding to CNF and CNC. Young’s modulus (YM), tensile strength (TS), and opacity clustered closely with 1%, 3%, 6%, and 9% CNF samples. Transmittance and swelling index (SI) exhibited proximity with 17% CNF and 9% CNC. On the other hand, relative crystallinity, moisture content (MC), water solubility (WS), elongation at break (EB), and thickness were more characteristic of most CNC films and the 0.5% CNF film, specifically in terms of crystallinity and MC. This analysis serves to synthesize the previously elaborated findings, emphasizing the efficacy of CNF and CNC as reinforcing agents within the AM matrix.

4. Conclusions

The addition of NC fillers to the AM matrix in casted film systems had a substantial impact on all the measured properties, revealing discernible differences between CNC and CNF. AM-CNF composites notably exhibited significantly elevated tensile strength (TS) and Young’s modulus (YM), with the 3% CNF composite displaying the highest values, followed by 1% and 6% CNF. This underscores the remarkable potential of even a small NC proportion to greatly enhance a film’s tensile strength. Conversely, the CNC composites demonstrated relatively lower TS and higher elongation at break (EB), implying the formation of less dense structures that allow for greater polymer mobility under stress. Overall, CNF exerted a more pronounced influence compared to CNC. Consequently, these films possess the versatility for diverse food applications owing to their distinct advantages, offering sustainable alternatives to petroleum-based packaging. Their potential benefits encompass improved shelf life, augmented barrier properties, and reduced environmental impact. However, further research is imperative to optimize protocols for commercial utilization, with emphasis on mechanical properties, biodegradability, and the scalability of production methods.

Supplementary Materials

The following supporting information can be downloaded at: https://www.mdpi.com/article/10.3390/coatings13091573/s1. Figure S1: SEM images of cellulose nanofibers produced from sugar beet using chemical treatment (CNF). The arrows highlight one thin and one thick nanofiber in each sample. The magnification of nanofibers is 100,000× and the scale bar represents 1 μm; Figure S2: Micrographs of cross section of (a) AM, and and composite films of (b) 0.5% CNF, (c) 1% CNF, (d) 3% CNF, (e) 6% CNF, (f) 9% CNF, (g) 17% CNF, (h) 0.5% CNC, (i) 1% CNC, (j) 3% CNC, (k) 6% CNC, (l) 9% CNC, (m) 17% CNC; Table S1. Water vapor (WV) and O2 permeability; Figure S3: Biodegradation images of pure films of AM, CNF, CNC and composite films 17% CNF and 17% CNC before and after 5 days.

Author Contributions

Conceptualization, M.F. (Marwa Faisaland), M.Ž., P.U., B.J. and A.B; methodology, M.F. (Marwa Faisaland), L.M., S.B., M.F. (Marwa Faisaland), H.N.B., K.H.H. and J.J.K.K.; software, M.F. (Marwa Faisaland) and M.Ž.; validation, M.F. (Marwa Faisaland), M.Ž., P.U. and A.B.; formal analysis, M.F. (Marwa Faisaland), M.Ž., P.U. and A.B.; investigation, M.F. (Marwa Faisaland), M.Ž., N.Q.N.K., M.F. (Michela Famiglietti), and J.J.K.K.; resources, A.B. and P.U.; data curation, M.F. (Marwa Faisaland), A.B. and L.M.; writing—original draft preparation, M.F. (Marwa Faisaland), M.Ž. and L.M.; writing—review and editing, A.B., M.F. (Marwa Faisaland), M.Ž., L.M., H.N.B., B.J., P.U. and K.H.H.; visualization, M.F. (Marwa Faisaland), M.Ž., N.Q.N.K. and J.J.K.K.; supervision, A.B., L.M. and P.U.; project administration, A.B.; funding acquisition, A.B., P.U., H.N.B. and J.J.K.K. All authors have read and agreed to the published version of the manuscript.

Funding

This study was mainly supported by the Danish Council for Independent Research (grant number 8022-00095B) and the Innomission 4 Program of Innovation Fund Denmark. The thermoanalysis instrument was financed by Carlsberg Fondet (grants 2013_01_0589, CF14-0230, and CF20-0130). XRD data were generated via a research infrastructure at the University of Copenhagen, partly funded by FOODHAY (Food and Health Open Innovation Laboratory, Danish Roadmap for Research Infrastructure). Plant Carb ApS is acknowledged for providing amylose to the project.

Institutional Review Board Statement

Not applicable.

Informed Consent Statement

Not applicable.

Data Availability Statement

Not applicable.

Conflicts of Interest

The authors declare no conflict of interest. The funders had no role in the design of the study, in the collection, analyses, or interpretation of data, in the writing of the manuscript, or in the decision to publish the results.

References

  1. Mousa, M.H.; Dong, Y.; Davies, I.J. Recent advances in bionanocomposites Preparation, Properties, and Applications. Int. J. Polym. Mater. Polym. Biomater. 2016, 65, 225–254. [Google Scholar] [CrossRef]
  2. Karki, S.; Gohain, M.B.; Yadav, D.; Ingole, P.G. Nanocomposite and Bio-Nanocomposite Polymeric Materials/Membranes Development in Energy and Medical Sector: A Review. Int. J. Biol. Macromol. 2021, 193, 2121–2139. [Google Scholar] [CrossRef] [PubMed]
  3. Noreen, A.; Sultana, S.; Sultana, T.; Tabasum, S.; Zia, K.M.; Muzammil, Z.; Sultana, S. Chapter 3-Natural polymers as constituents of bionanocomposites. In Bionanocomposites; Elsevier: Amsterdam, The Netherlands, 2020; pp. 55–85. [Google Scholar]
  4. Sagnelli, D.; Hebelstrup, K.H.; Leroy, E.; Rolland-Sabaté, A.; Guilois, S.; Kirkensgaard, J.J.K.; Mortensen, K.; Lourdin, D.; Blennow, A. Plant-Crafted Starches for Bioplastics Production. Carbohydr. Polym. 2016, 152, 398–408. [Google Scholar] [CrossRef]
  5. Tetlow, I.J.; Bertoft, E. A Review of Starch Biosynthesis in Relation to the Building Block-Backbone Model. Int. J. Mol. Sci. 2020, 21, 7011. [Google Scholar] [CrossRef] [PubMed]
  6. Abe, M.M.; Martins, J.R.; Sanvezzo, P.B.; Macedo, J.V.; Branciforti, M.C.; Halley, P.; Botaro, V.R.; Brienzo, M. Advantages and Disadvantages of Bioplastics Production from Starch and Lignocellulosic Components. Polymers 2021, 13, 2484. [Google Scholar] [CrossRef]
  7. Carciofi, M.; Blennow, A.; Nielsen, M.M.; Holm, P.B.; Hebelstrup, K.H. Barley Callus: A Model System for Bioengineering of Starch in Cereals. Plant Methods 2012, 8, 36. [Google Scholar] [CrossRef]
  8. Frost, B.A.; Johan Foster, E. Isolation of Thermally Stable Cellulose Nanocrystals from Spent Coffee Grounds via Phosphoric Acid Hydrolysis. J. Renew. Mater. 2020, 8, 187–203. [Google Scholar] [CrossRef]
  9. Rinaldi, R.; Schüth, F. Acid Hydrolysis of Cellulose as the Entry Point into Biorefinery Schemes. ChemSusChem 2009, 2, 1096–1107. [Google Scholar] [CrossRef]
  10. Funahashi, R.; Ono, Y.; Tanaka, R.; Yokoi, M.; Daido, K.; Inamochi, T.; Saito, T.; Horikawa, Y.; Isogai, A. Changes in the Degree of Polymerization of Wood Celluloses during Dilute Acid Hydrolysis and TEMPO-Mediated Oxidation: Formation Mechanism of Disordered Regions along Each Cellulose Microfibril. Int. J. Biol. Macromol. 2018, 109, 914–920. [Google Scholar] [CrossRef]
  11. Kontturi, E.; Meriluoto, A.; Penttilä, P.A.; Baccile, N.; Malho, J.M.; Potthast, A.; Rosenau, T.; Ruokolainen, J.; Serimaa, R.; Laine, J.; et al. Degradation and Crystallization of Cellulose in Hydrogen Chloride Vapor for High-Yield Isolation of Cellulose Nanocrystals. Angew. Chemie-Int. Ed. 2016, 55, 14455–14458. [Google Scholar] [CrossRef]
  12. Spiliopoulos, P.; Spirk, S.; PPaakkonen, T.; Viljanen, M.; Svedstrom, K.; Pitkanen, L.; Awais, M.; Kontturi, E. Visualizing Degradation of Cellulose Nanofibers by Acid Hydrolysis. Biomacromolecules 2021, 22, 1399–1405. [Google Scholar] [CrossRef] [PubMed]
  13. Isogai, A.; Saito, T.; Fukuzumi, H. TEMPO-Oxidized Cellulose Nanofibers. Nanoscale 2011, 3, 71–85. [Google Scholar] [CrossRef]
  14. Peyre, J.; Pääkkönen, T.; Reza, M.; Kontturi, E. Simultaneous Preparation of Cellulose Nanocrystals and Micron-Sized Porous Colloidal Particles of Cellulose by TEMPO-Mediated Oxidation. Green Chem. 2015, 17, 808–811. [Google Scholar] [CrossRef]
  15. Han, X.; Wang, J.; Wang, X.; Tian, W.; Dong, Y.; Jiang, S. Finite Element Analysis of Strengthening Mechanism of Ultrastrong and Tough Cellulosic Materials. Polymers 2022, 14, 4490. [Google Scholar] [CrossRef]
  16. Han, X.; Wang, J.; Wang, J.; Ding, L.; Zhang, K.; Han, J.; Jiang, S. Micro- and Nano-Fibrils of Manau Rattan and Solvent-Exchange-Induced High-Haze Transparent Holocellulose Nanofibril Film. Carbohydr. Polym. 2022, 298, 120075. [Google Scholar] [CrossRef] [PubMed]
  17. Babaee, M.; Jonoobi, M.; Hamzeh, Y.; Ashori, A. Biodegradability and Mechanical Properties of Reinforced Starch Nanocomposites Using Cellulose Nanofibers. Carbohydr. Polym. 2015, 132, 1–8. [Google Scholar] [CrossRef] [PubMed]
  18. Otoni, C.G.; Avena-Bustillos, R.J.; Azeredo, H.M.C.; Lorevice, M.V.; Moura, M.R.; Mattoso, L.H.C.; McHugh, T.H. Recent Advances on Edible Films Based on Fruits and Vegetables—A Review. Compr. Rev. Food Sci. Food Saf. 2017, 16, 1151–1169. [Google Scholar] [CrossRef]
  19. Xu, J.; Sagnelli, D.; Faisal, M.; Perzon, A.; Taresco, V.; Mais, M.; Giosafatto, C.V.L.; Hebelstrup, K.H.; Ulvskov, P.; Jørgensen, B.; et al. Amylose/Cellulose Nanofiber Composites for All-Natural, Fully Biodegradable and Flexible Bioplastics. Carbohydr. Polym. 2021, 253, 117277. [Google Scholar] [CrossRef]
  20. Perzon, A.; Jørgensen, B.; Ulvskov, P. Sustainable Production of Cellulose Nanofiber Gels and Paper from Sugar Beet Waste Using Enzymatic Pre-Treatment. Carbohydr. Polym. 2020, 230, 115581. [Google Scholar] [CrossRef]
  21. Matsunaga, K.; Kawasaki, S.; Takeda, Y. Influence of Physicochemical Properties of Starch on Crispness of Tempura Fried Batter. Cereal Chem. 2003, 80, 339–345. [Google Scholar] [CrossRef]
  22. Holland, C.; Perzon, A.; Cassland, P.R.C.; Jensen, J.P.; Langebeck, B.; Sørensen, O.B.; Whale, E.; Hepworth, D.; Plaice-Inglis, R.; Moestrup, Ø.; et al. Nanofibers Produced from Agro-Industrial Plant Waste Using Entirely Enzymatic Pretreatments. Biomacromolecules 2019, 20, 443–453. [Google Scholar] [CrossRef] [PubMed]
  23. Teixeira, C.E.F.; de Almeida Rebechi, I.; Fontaneli, R.S. Digital Micrometer Used in Thickness Measurement of Plastic Film Compared to Standardized Instrument. Mater. Sci. Appl. 2017, 8, 577–583. [Google Scholar] [CrossRef]
  24. Faisal, M.; Bevilacqua, M.; Bro, R.; Bordallo, H.N.; Judas, J.; Kirkensgaard, K.; Hebelstrup, K.H.; Blennow, A. International Journal of Biological Macromolecules Colorimetric PH Indicators Based on Well-Defined Amylose and Amylopectin Matrices Enriched with Anthocyanins from Red Cabbage. Int. J. Biol. Macromol. 2023, 250, 126250. [Google Scholar] [CrossRef] [PubMed]
  25. Taherkhani, E.; Moradi, M.; Tajik, H.; Molaei, R.; Ezati, P. Preparation of On-Package Halochromic Freshness/Spoilage Nanocellulose Label for the Visual Shelf Life Estimation of Meat. Int. J. Biol. Macromol. 2020, 164, 2632–2640. [Google Scholar] [CrossRef] [PubMed]
  26. ASTM D 882-02; Standard Test Method for Tensile Properties of Thin Plastic Sheeting. ASTM International: West Conshohocken, PA, USA, 2002.
  27. Qin, Y.; Liu, Y.; Yong, H.; Liu, J.; Zhang, X.; Liu, J. Preparation and Characterization of Active and Intelligent Packaging Films Based on Cassava Starch and Anthocyanins from Lycium Ruthenicum Murr. Int. J. Biol. Macromol. 2019, 134, 80–90. [Google Scholar] [CrossRef]
  28. ASTM F1249-13; Standard Test Method for Water Vapor Transmission Rate Through Plastic Film and Sheeting Using a Modulated Infrared Sensor. ASTM International: West Conshohocken, PA, USA, 2013.
  29. ASTM D3985-05; Standard Test Method for Oxygen Gas Transmission Rate through Plastic Film and Sheeting Using a Colorimetric Sensor. ASTM International: West Conshohocken, PA, USA, 2010.
  30. Harrison, J.P.; Boardman, C.; O’Callaghan, K.; Delort, A.M.; Song, J. Biodegradability Standards for Carrier Bags and Plastic Films in Aquatic Environments: A Critical Review. R. Soc. Open Sci. 2018, 5, 171792. [Google Scholar] [CrossRef]
  31. Razzaq, W.; Javaid, A. Synthesis & Characterization of Cotton Fiber Reinforced Starch/PVA Biodegradable Composite Films. J. Fac. Eng. Technol. 2015, 22, 27–35. [Google Scholar]
  32. de Almeida, V.S.; Barretti, B.R.V.; Ito, V.C.; Malucelli, L.; da Silva Carvalho Filho, M.A.; Demiate, I.M.; Pinheiro, L.A.; Lacerda, L.G. Thermal, Morphological, and Mechanical Properties of Regular and Waxy Maize Starch Films Reinforced with Cellulose Nanofibers (CNF). Mater. Res. 2020, 23. [Google Scholar] [CrossRef]
  33. Nasri-Nasrabadi, B.; Behzad, T.; Bagheri, R. Preparation and Characterization of Cellulose Nanofiber Reinforced Thermoplastic Starch Composites. Fibers Polym. 2014, 15, 347–354. [Google Scholar] [CrossRef]
  34. Meneguin, A.B.; Ferreira Cury, B.S.; dos Santos, A.M.; Franco, D.F.; Barud, H.S.; da Silva Filho, E.C. Resistant Starch/Pectin Free-Standing Films Reinforced with Nanocellulose Intended for Colonic Methotrexate Release. Carbohydr. Polym. 2017, 157, 1013–1023. [Google Scholar] [CrossRef]
  35. Bangar, S.P.; Whiteside, W.S. Nano-Cellulose Reinforced Starch Bio Composite Films—A Review on Green Composites. Int. J. Biol. Macromol. 2021, 185, 849–860. [Google Scholar] [CrossRef] [PubMed]
  36. Fonseca, L.M.; Henkes, A.K.; Bruni, G.P.; Viana, L.A.N.; de Moura, C.M.; Flores, W.H.; Galio, A.F. Fabrication and Characterization of Native and Oxidized Potato Starch Biodegradable Films. Food Biophys. 2018, 13, 163–174. [Google Scholar] [CrossRef]
  37. Csiszár, E.; Kun, D.; Fekete, E. The Role of Structure and Interactions in Thermoplastic Starch–Nanocellulose Composites. Polymers 2021, 13, 3186. [Google Scholar] [CrossRef] [PubMed]
  38. Oleyaei, S.A.; Almasi, H.; Ghanbarzadeh, B.; Moayedi, A.A. Synergistic Reinforcing Effect of TiO2 and Montmorillonite on Potato Starch Nanocomposite Films: Thermal, Mechanical and Barrier Properties. Carbohydr. Polym. 2016, 152, 253–262. [Google Scholar] [CrossRef] [PubMed]
  39. Cheng, G.; Zhou, M.; Wei, Y.J.; Cheng, F.; Zhu, P.X. Comparison of Mechanical Reinforcement Effects of Cellulose Nanocrystal, Cellulose Nanofiber, and Microfibrillated Cellulose in Starch Composites. Polym. Compos. 2019, 40, E365–E372. [Google Scholar] [CrossRef]
  40. Famiglietti, M.; Zannini, D.; Turco, R.; Mariniello, L. Mechanical, Barrier and Thermal Properties of Amylose-Argan Proteins-Based Bioplastics in the Presence of Transglutaminase. Int. J. Mol. Sci. 2023, 24, 3405. [Google Scholar] [CrossRef]
  41. Arifin, H.R.; Djali, M.; Nurhadi, B.; Hasim, S.A.; Hilmi, A.; Puspitasari, A.V. Improved Properties of Corn Starch-Based Bio-Nanocomposite Film with Different Types of Plasticizers Reinforced by Nanocrystalline Cellulose. Int. J. Food Prop. 2022, 25, 509–521. [Google Scholar] [CrossRef]
  42. Ferrer, A.; Pal, L.; Hubbe, M. Nanocellulose in Packaging: Advances in Barrier Layer Technologies. Ind. Crops Prod. 2017, 95, 574–582. [Google Scholar] [CrossRef]
  43. Mirpoor, S.F.; Giosafatto, C.V.L.; Mariniello, L.; D’Agostino, A.; D’Agostino, M.; Cammarota, M.; Schiraldi, C.; Porta, R. Argan (Argania spinosa L.) Seed Oil Cake as a Potential Source of Protein-Based Film Matrix for Pharmaco-Cosmetic Applications. Int. J. Mol. Sci. 2022, 23, 8478. [Google Scholar] [CrossRef]
  44. Klemm, D.; Cranston, E.D.; Fischer, D.; Gama, M.; Kedzior, S.A.; Kralisch, D.; Kramer, F.; Kondo, T.; Lindström, T.; Nietzsche, S.; et al. Nanocellulose as a Natural Source for Groundbreaking Applications in Materials Science: Today’s State. Mater. Today 2018, 21, 720–748. [Google Scholar] [CrossRef]
  45. Zhang, L.; Zhao, J.; Zhang, Y.; Li, F.; Jiao, X.; Li, Q. The Effects of Cellulose Nanocrystal and Cellulose Nanofiber on the Properties of Pumpkin Starch-Based Composite Films. Int. J. Biol. Macromol. 2021, 192, 444–451. [Google Scholar] [CrossRef] [PubMed]
  46. Tan, Z.; Yi, Y.; Wang, H.; Zhou, W.; Yang, Y.; Wang, C. Physical and Degradable Properties of Mulching Films Prepared from Natural Fibers and Biodegradable Polymers. Appl. Sci. 2016, 6, 147. [Google Scholar] [CrossRef]
  47. Kijchavengkul, T.; Auras, R.; Rubino, M.; Ngouajio, M.; Fernandez, R.T. Assessment of Aliphatic-Aromatic Copolyester Biodegradable Mulch Films. Part I: Field Study. Chemosphere 2008, 71, 942–953. [Google Scholar] [CrossRef] [PubMed]
Figure 1. FT-IR of composite films, (a) AM/CNF composite films, (b) AM/CNC composite films.
Coatings 13 01573 g001
Figure 2. (a) Thickness and (b) moisture content of the AM, AM/CNF, and AM/CNC composite films. Different letters represent statistical differences (p ≤ 0.05) n = 3.
Coatings 13 01573 g002
Figure 3. (a) SI of CNF and CNC composite films; (b) WS of the composite films. Different letters represent statistical differences (p ≤ 0.05) n = 3.
Coatings 13 01573 g003
Figure 4. (a) TS; (b) YM of the films; and (c) EAB. Different letters represent statistical differences (p ≤ 0.05), n = 8.
Coatings 13 01573 g004
Figure 5. Micrographs of surface of (a) AM and composite films of (b) 0.5% CNF, (c) 1% CNF, (d) 3% CNF, (e) 6% CNF, (f) 9% CNF, (g) 17% CNF, (h) 0.5% CNC, (i) 1% CNC, (j) 3% CNC, (k) 6% CNC, (l) 9% CNC, (m) 17% CNC.
Coatings 13 01573 g005aCoatings 13 01573 g005b
Figure 6. WV and O2 permeability of composite films.
Coatings 13 01573 g006
Figure 7. (a) WAXS of AM/CNF composite films; (b) WAXS of AM/CNC composite films; (c) relative crystallinity of all the films. Different letters represent statistical differences (p ≤ 0.05), n = 2.
Coatings 13 01573 g007
Figure 8. TG and DTG curves of AM and AM nanocomposite films, (a,b) AM/CNF composite films, (c,d) AM/CNC composite films.
Coatings 13 01573 g008
Figure 9. (a) CO2 accumulation during the degradation process of the films; (b)FTIR spectra of the films before degradation; (c) FTIR spectra of the films after the degradation.
Coatings 13 01573 g009
Figure 10. (PCA) reveals the main variations within the composite systems by considering all the available data. The vectors indicate the direction and strength of loadings for the characterization variables.
Coatings 13 01573 g010
Table 1. The opacity and transmittance values of the films, n = 3.
CompositionOpacityTransmittance
AM6.4 ± 1.0 d41 ± 15 a
0.5% CNC2.7 ± 1 abc60 ± 19 ab
1% CNC2.3 ± 1 a69 ± 7 ab
3% CNC3 ± 0.0 abc67 ± 8 ab
6% CNC4 ± 0.0 c70 ± 2 ab
9% CNC3.1 ± 1.0 abc79± 1 b
17% CNC3 ± 0.0 abc71 ± 3 ab
0.5% CNF2.5 ± 1.0 ab74 ± 1 b
1% CNF3.8 ± 0.0 bc71 ± 4 ab
3% CNF3.8 nd76 ± 12 b
6% CNF3.4 ± 0.0 abc66 ± 1 ab
9% CNF3.2 ± 0.0 abc66 ± 5 ab
17% CNF3.7 ± 0.0 abc68 ± 14 ab
Different letters represent statistical differences (p ≤ 0.05).
Table 2. The initial temperature at which the degradation starts (Ti), derivative thermogravimetric at Tmax (DTG), and the % of mass residue at the DTG peak, n = 2.
CompositionTi (°C)DTG at Tmax(°C)Mass Residue (%)
AM38 ± 7 ab305 ± 2 abc43 ± 1 ab
0.5% CNC47 ± 6 b307 ± 0 bc60 nd
1% CNC28 ± 2 a301 ± 0 ab38 ± 4 a
3% CNC44 ± 2 b299 ± 0 abc46 ± 1 ab
6% CNC50 ± 2 b302 ± 1 a45 ± 3 ab
9% CNC47 ± 0 b299 ± 2 abc46 ± 1 ab
17% CNC47 ± 4 b301 ± 1 a52 ± 1 a
0.5% CNF35 ND307 ND53 ND
1% CNF47 ± 3 b301 ± 0 abc37 ± 11 a
3%CNF45 ± 3 b305 ± 3 abc57 ± 2 b
6%CNF49 ± 0 b303 ± 1 abc50 ± 1 ab
9% CNF37 ± 4 ab308 ± 0.1 c45 ± 6 ab
17% CNF48 ± 4 b308 ± 4 c51 ab
Different letters represent statistical differences (p ≤ 0.05). ND: not determined.
Disclaimer/Publisher’s Note: The statements, opinions and data contained in all publications are solely those of the individual author(s) and contributor(s) and not of MDPI and/or the editor(s). MDPI and/or the editor(s) disclaim responsibility for any injury to people or property resulting from any ideas, methods, instructions or products referred to in the content.

