Abstract
It is well known that coating spalling often occurs between the top ceramic coating (TC) and the metal bonding coating (BC) during the working process where the thermal mismatch stress between the layers plays a key role. Dynamic changes in the thermally grown oxide (TGO) between the facing and bonding layers during thermal cycling increase the thermal mismatch at the interface. The effect of oxide thickening on localized mismatch stresses under thermal cycling with different interfacial curvatures is quantitatively investigated using numerical methods in this paper. A dynamic growth model of the oxide was developed based on the consideration of the composition and morphology of the thermally grown oxide. The results show that TGO growth behavior, local stress evolution, crack initiation location, and crack propagation length are influenced by the interface curvature at the same aspect ratio. The interface between the oxide layer and the bonding layer gradually developed significant tensile to dangerous stresses during thermal cycling. These tensile stresses are predominantly distributed at the crest during the early stages of thermal exposure and gradually transferred to the near-peak (the region near the peak) and ramp regions (the region in between the peak and the valley) as the oxidation process progressed. The crack initiation and propagation phenomenon can be observed at various regions during thermal exposure. Increasing interface curvature leads to an earlier dangerous stress moment in the ramp area due to higher maximum tensile stress. Therefore, the small changes in the interface curvature severely affected the location and time of crack initiation and the crack length.
1. Introduction
Thermal Barrier Coating (TBC) can protect critical areas such as turbine blades and combustion chambers due to its excellent resistance to high temperatures [1,2,3]. A bonded coating (BC) and a ceramic top coat (TC) are usually applied to the surface of a high-temperature nickel-based alloy forming the TBC [4,5]. A dense thermally grown oxide (TGO) layer consisting mainly of Al2O3 is formed at the coating interface to protect the substrate, and its growth depends on the elemental composition of the bonding layer and the interface morphology [6,7,8]. The interfacial mismatch stress of the coating rises further due to the thickening of the oxide layer, eventually leading to spalling or delamination during engine operation [9,10]. The atmospheric plasma spraying (APS) process can lead to uneven coating interface morphology. This phenomenon can seriously affect the mismatch stress of coatings during thermal cycling and thus lead to failure [11,12].
In recent years, researchers have focused on investigating the influence of interfacial morphology on TGO growth behavior, residual stress, and coating failure. Che [13] et al. treated the thermal barrier coating at a constant temperature of 1050 °C and observed that the rough interface obtained under the APS process caused the growth rate of the peak region to be higher than that of the valley region in the oxide. Che [14] et al. further found that the faster diffusion of Al elements led to a thicker oxide layer in the peak region at interfaces with greater roughness. Meanwhile, Ranjbar-Far [15] et al. and Zhang [16] et al. showed that the variability of the fluctuation amplitude can affect the size of the maximum tensile stress by studying different interfacial roughness models and samples. This indicates that the increase in roughness is a significant reason for the sudden increase in interfacial mismatch stresses.
The authors believed that the interfacial morphology can further impact the oxide growth behavior and interfacial mismatch stresses. However, the bonding layer surface was treated with sandblasted particles of different particle sizes before spraying the top coat, which not only caused the roughness variations but also caused the change in the wavelength of the interface oscillation period. There were differences in the evolution of the composition and morphology of the oxides at different interfacial morphologies. These factors play an important role in the dynamic development of local stresses in coatings. It was necessary to investigate the localized growth behavior of the oxide layer and the local stresses in the coating based on different interfacial curvatures. Unfortunately, existing models have not fully accounted for the effects of different interfacial curvatures on the oxide growth process and the distribution and development of local stresses in coatings.
A novel stress analysis model with interface curvature as a reference was proposed in this investigation based on the consideration of the co-variation of roughness and wavelength. The oscillation period transverse to longitudinal ratio and the peak curvature were defined by counting multiple sets of electron microscope images. An FEM method was used to quantify the evolution of oxide growth and localized stresses under thermal cycling. The impact of interfacial curvature on oxide growth and mismatch stress was studied. This model not only improved the relationship between the topology of the interface, the localized growth behavior of the oxide layer, and the local stress distribution and development of the coating, but also inferred the occurrence location, time, and propagation length of cracks at different interface curvatures. This provided the foundation for the coating design of the hot end components such as guide vanes.
2. Test and Model Preparation
2.1. Coating Preparation and Testing
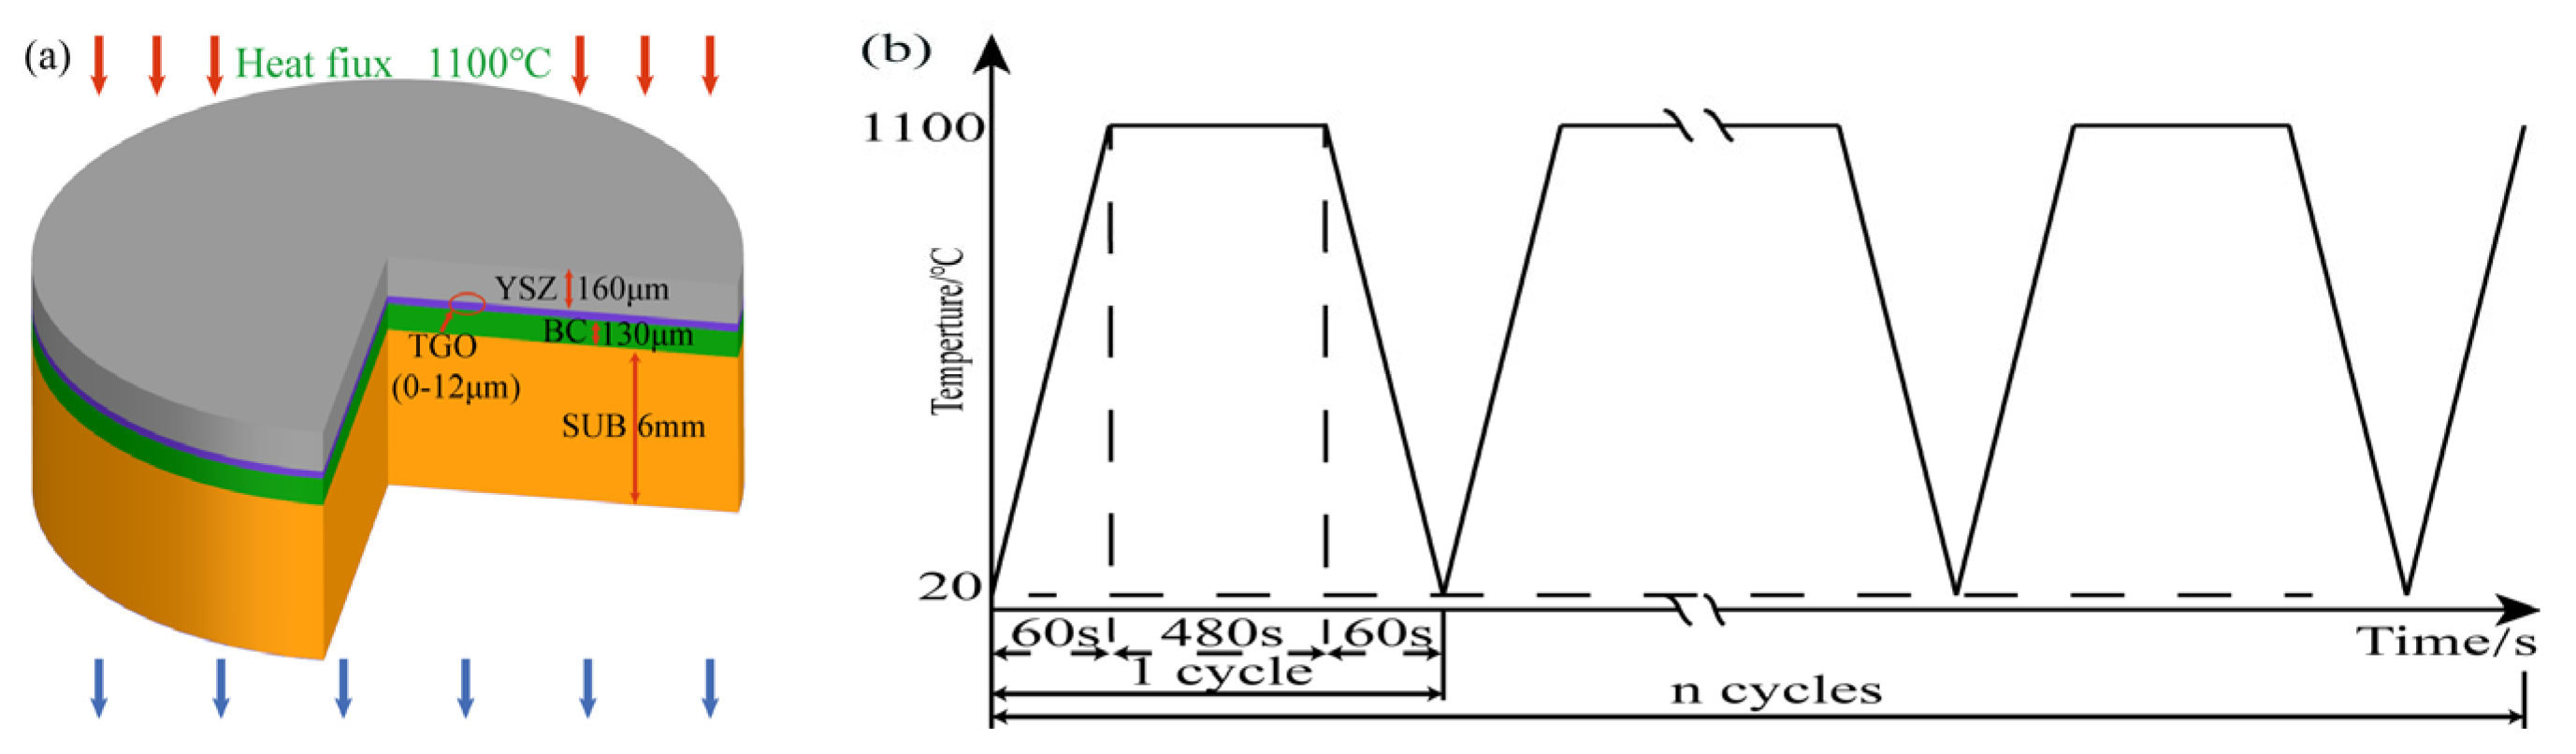
Hastelloy-X alloy of Φ25.4 mm × 6 mm was selected as the substrate. Before spraying, the samples were treated with 60 mesh white corundum sand to improve the bonding strength between the coating and the substrate. The bonding layer was obtained with a thickness of 130 μm using commercial Yttrium Nickel/Cobalt Chromium Aluminum (MCrAIY) powder prepared under the APS. The surface of BC was then blasted with low pressure and a small angle using 24 mesh, 36 mesh, 60 mesh, and 96 mesh of Al2O3, respectively. The burst pressure was 0.4 MPa. A working angle (the angle between the substrate surface and the nozzle axis) of 75° was considered ideal for sandblasting operations [17]. Finally, TC was prepared using 8 wt.% stabilized Zirconia with Yttrium Oxide (YSZ) to obtain a thickness of 160 μm (Figure 1a). The samples were designed to yield a variety of interfacial curvatures to allow for following investigations of oxide growth and internal stresses in the coatings. The equipment used for the preparation process was Praxair Model 3710 plasma arc spraying system and Model 2400 M six-axis manipulator. The four groups of the prepared samples were noted as No.1 (24 mesh sandblasting treatment), No.2 (36 mesh sandblasting treatment), No.3 (60 mesh sandblasting treatment), and No.4 (96 mesh sandblasting treatment). The spraying process parameters are shown in Table 1. The coating was subsequently tested using the heat treatment of Figure 1b.
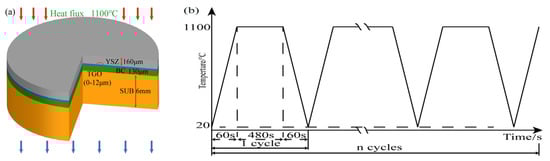
Figure 1.
Coating structure and thermal cycling process: (a) coating structure and (b) thermal cycle process.

Table 1.
Deposition parameters of thermal barrier coatings.
2.2. Morphological Analysis of Thermal Barrier Coatings
The typical areas of the samples after treatment of different sandblasted particles were selected. The cross-sectional morphology of the samples was investigated using a TESCAN MIRA LMS type scanning electron microscope (SEM). The 3D morphology and interfacial roughness of BC were examined by 3D laser microscopy.
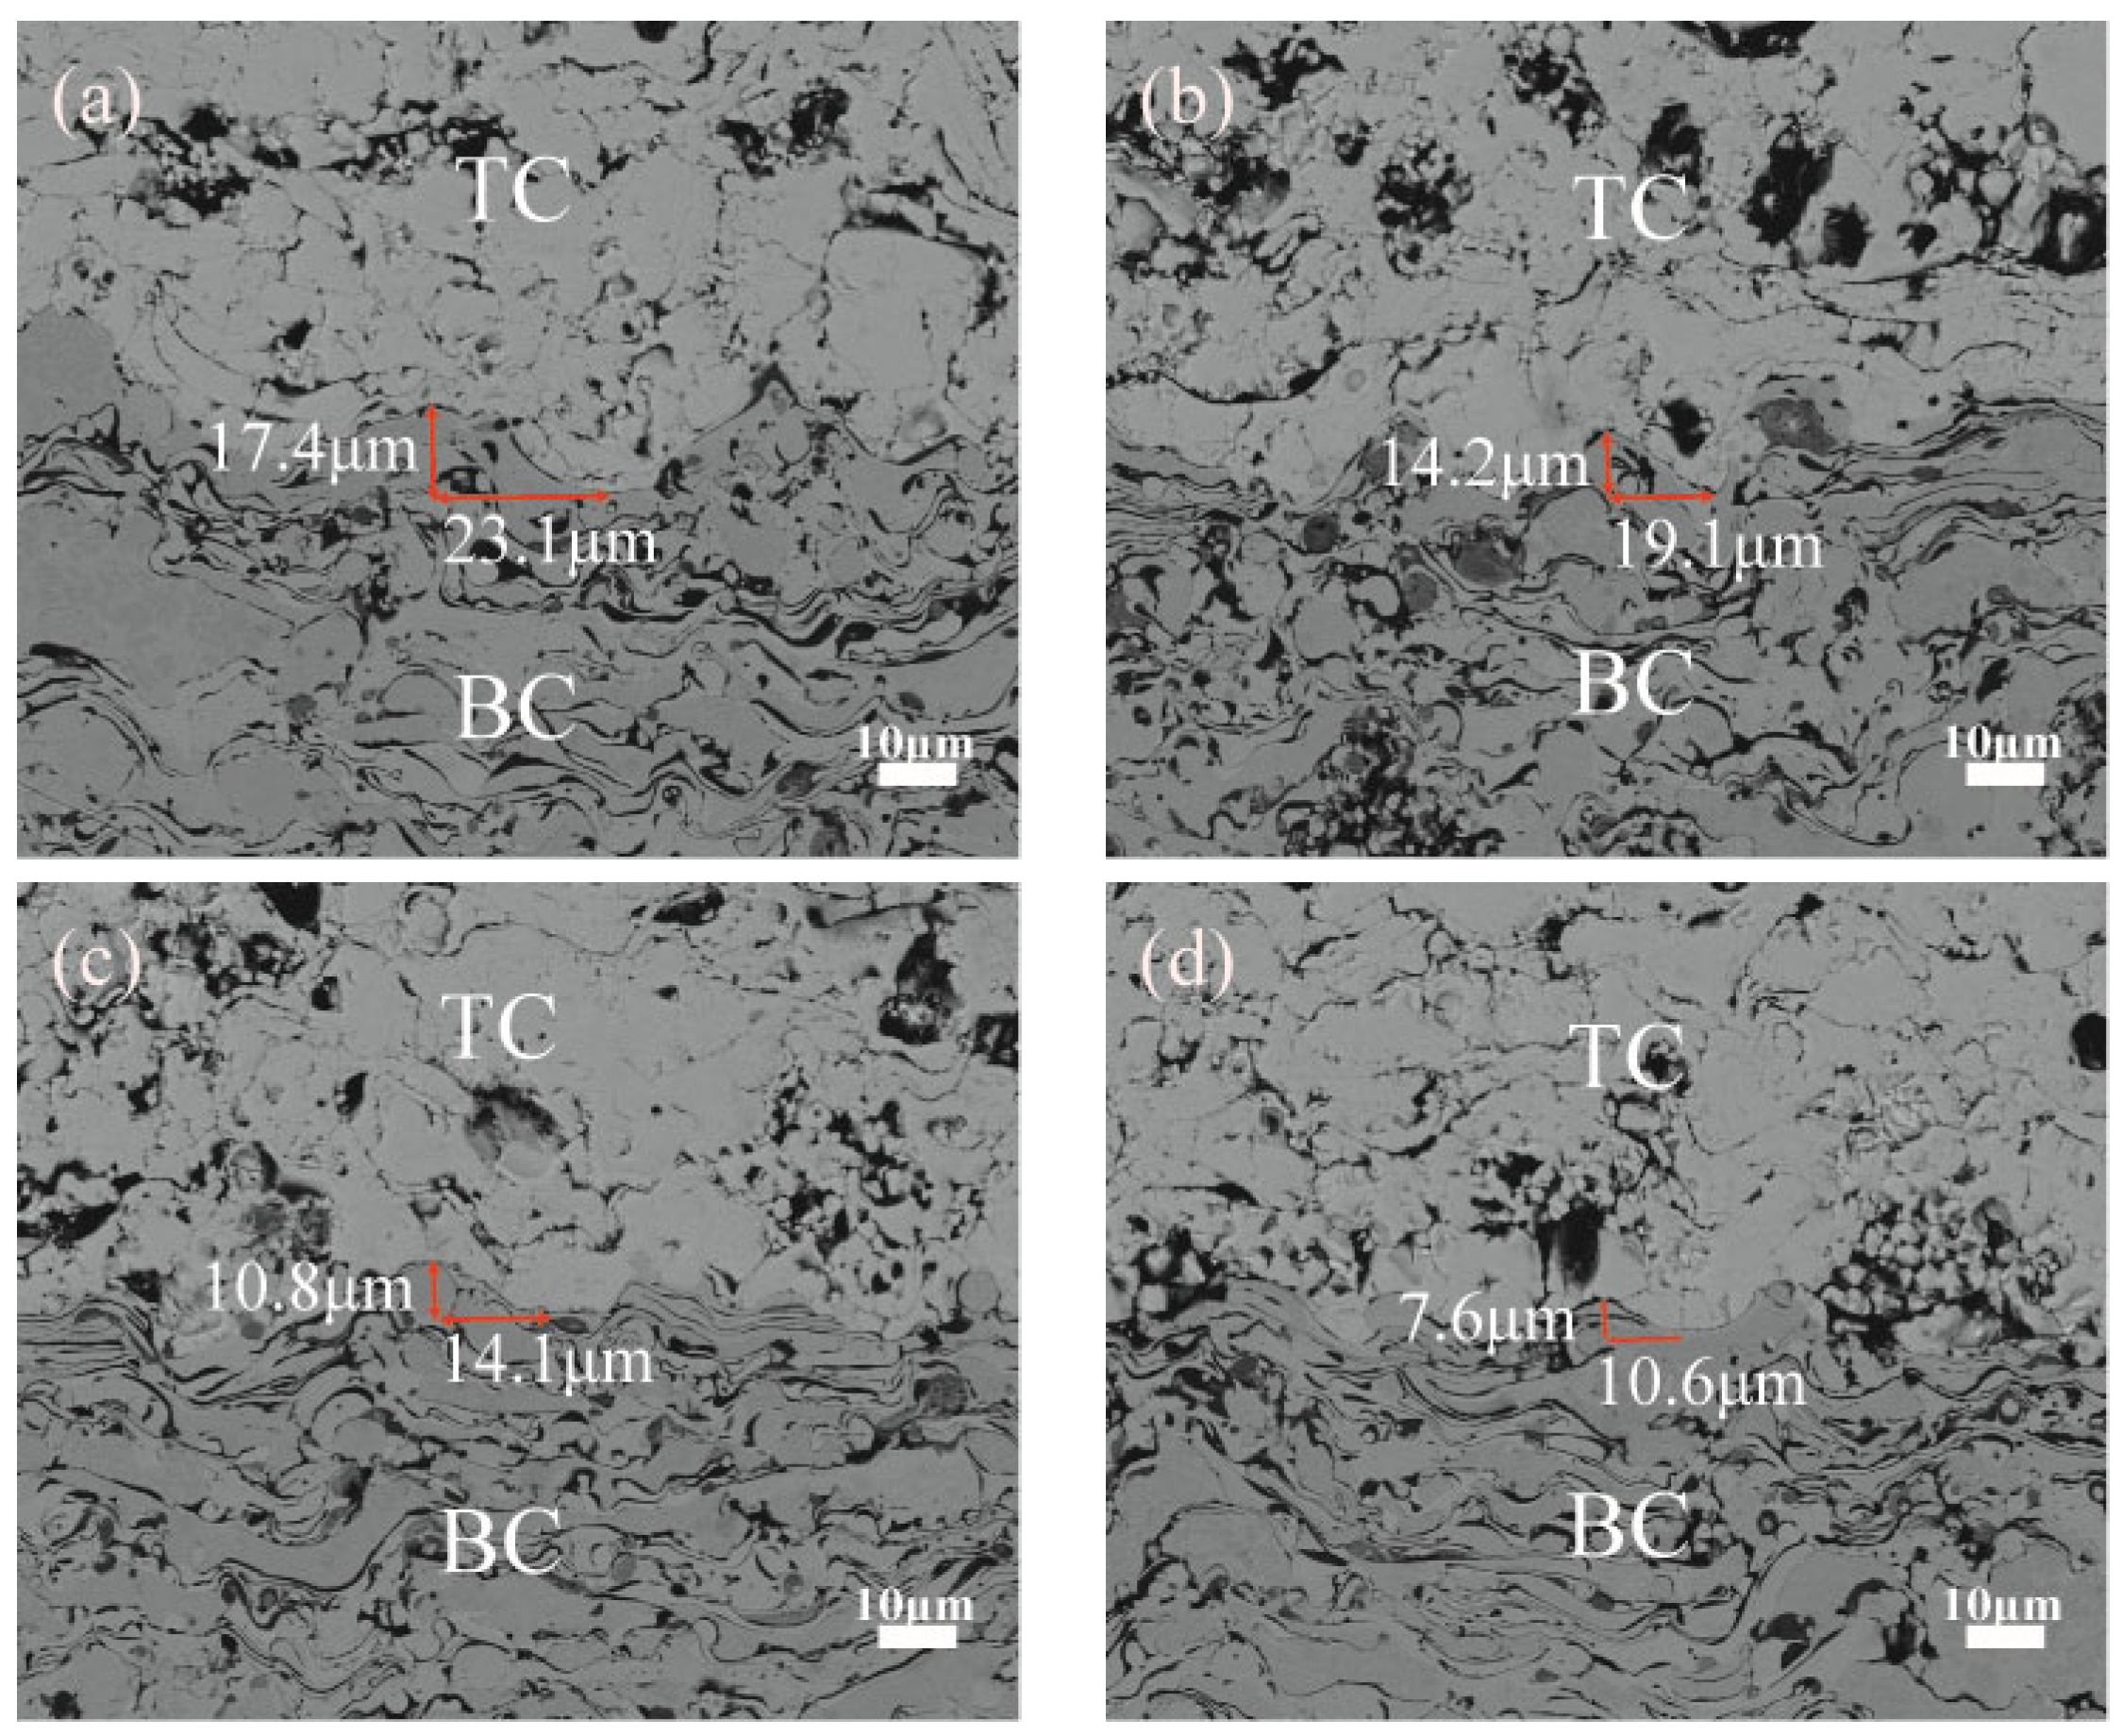
With the decrease of the sandblasting particle size on the surface of the treated bonding layer, there was a decrease of 1.8 μm–2.2 μm in the TC/BC interface amplitude compared with the previous set of samples, and a decrease of 3.5 μm–5.0 μm in the wavelengths of the oscillation cycles, which can be observed from Figure 2. It is tentatively indicated that the sandblasting treatment changed the interfacial morphology to a certain extent, which provides a reference for the subsequent study.
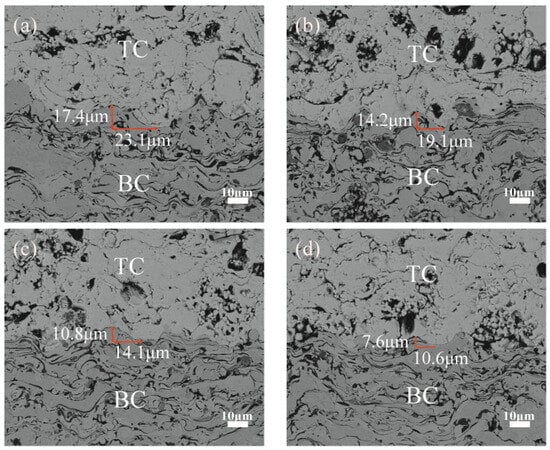
Figure 2.
Interface morphology after different sandblasting treatments: (a) No.1 (24 mesh) (b) No.2 (36 mesh) (c) No.3 (60 mesh) (d) No.4 (96 mesh).
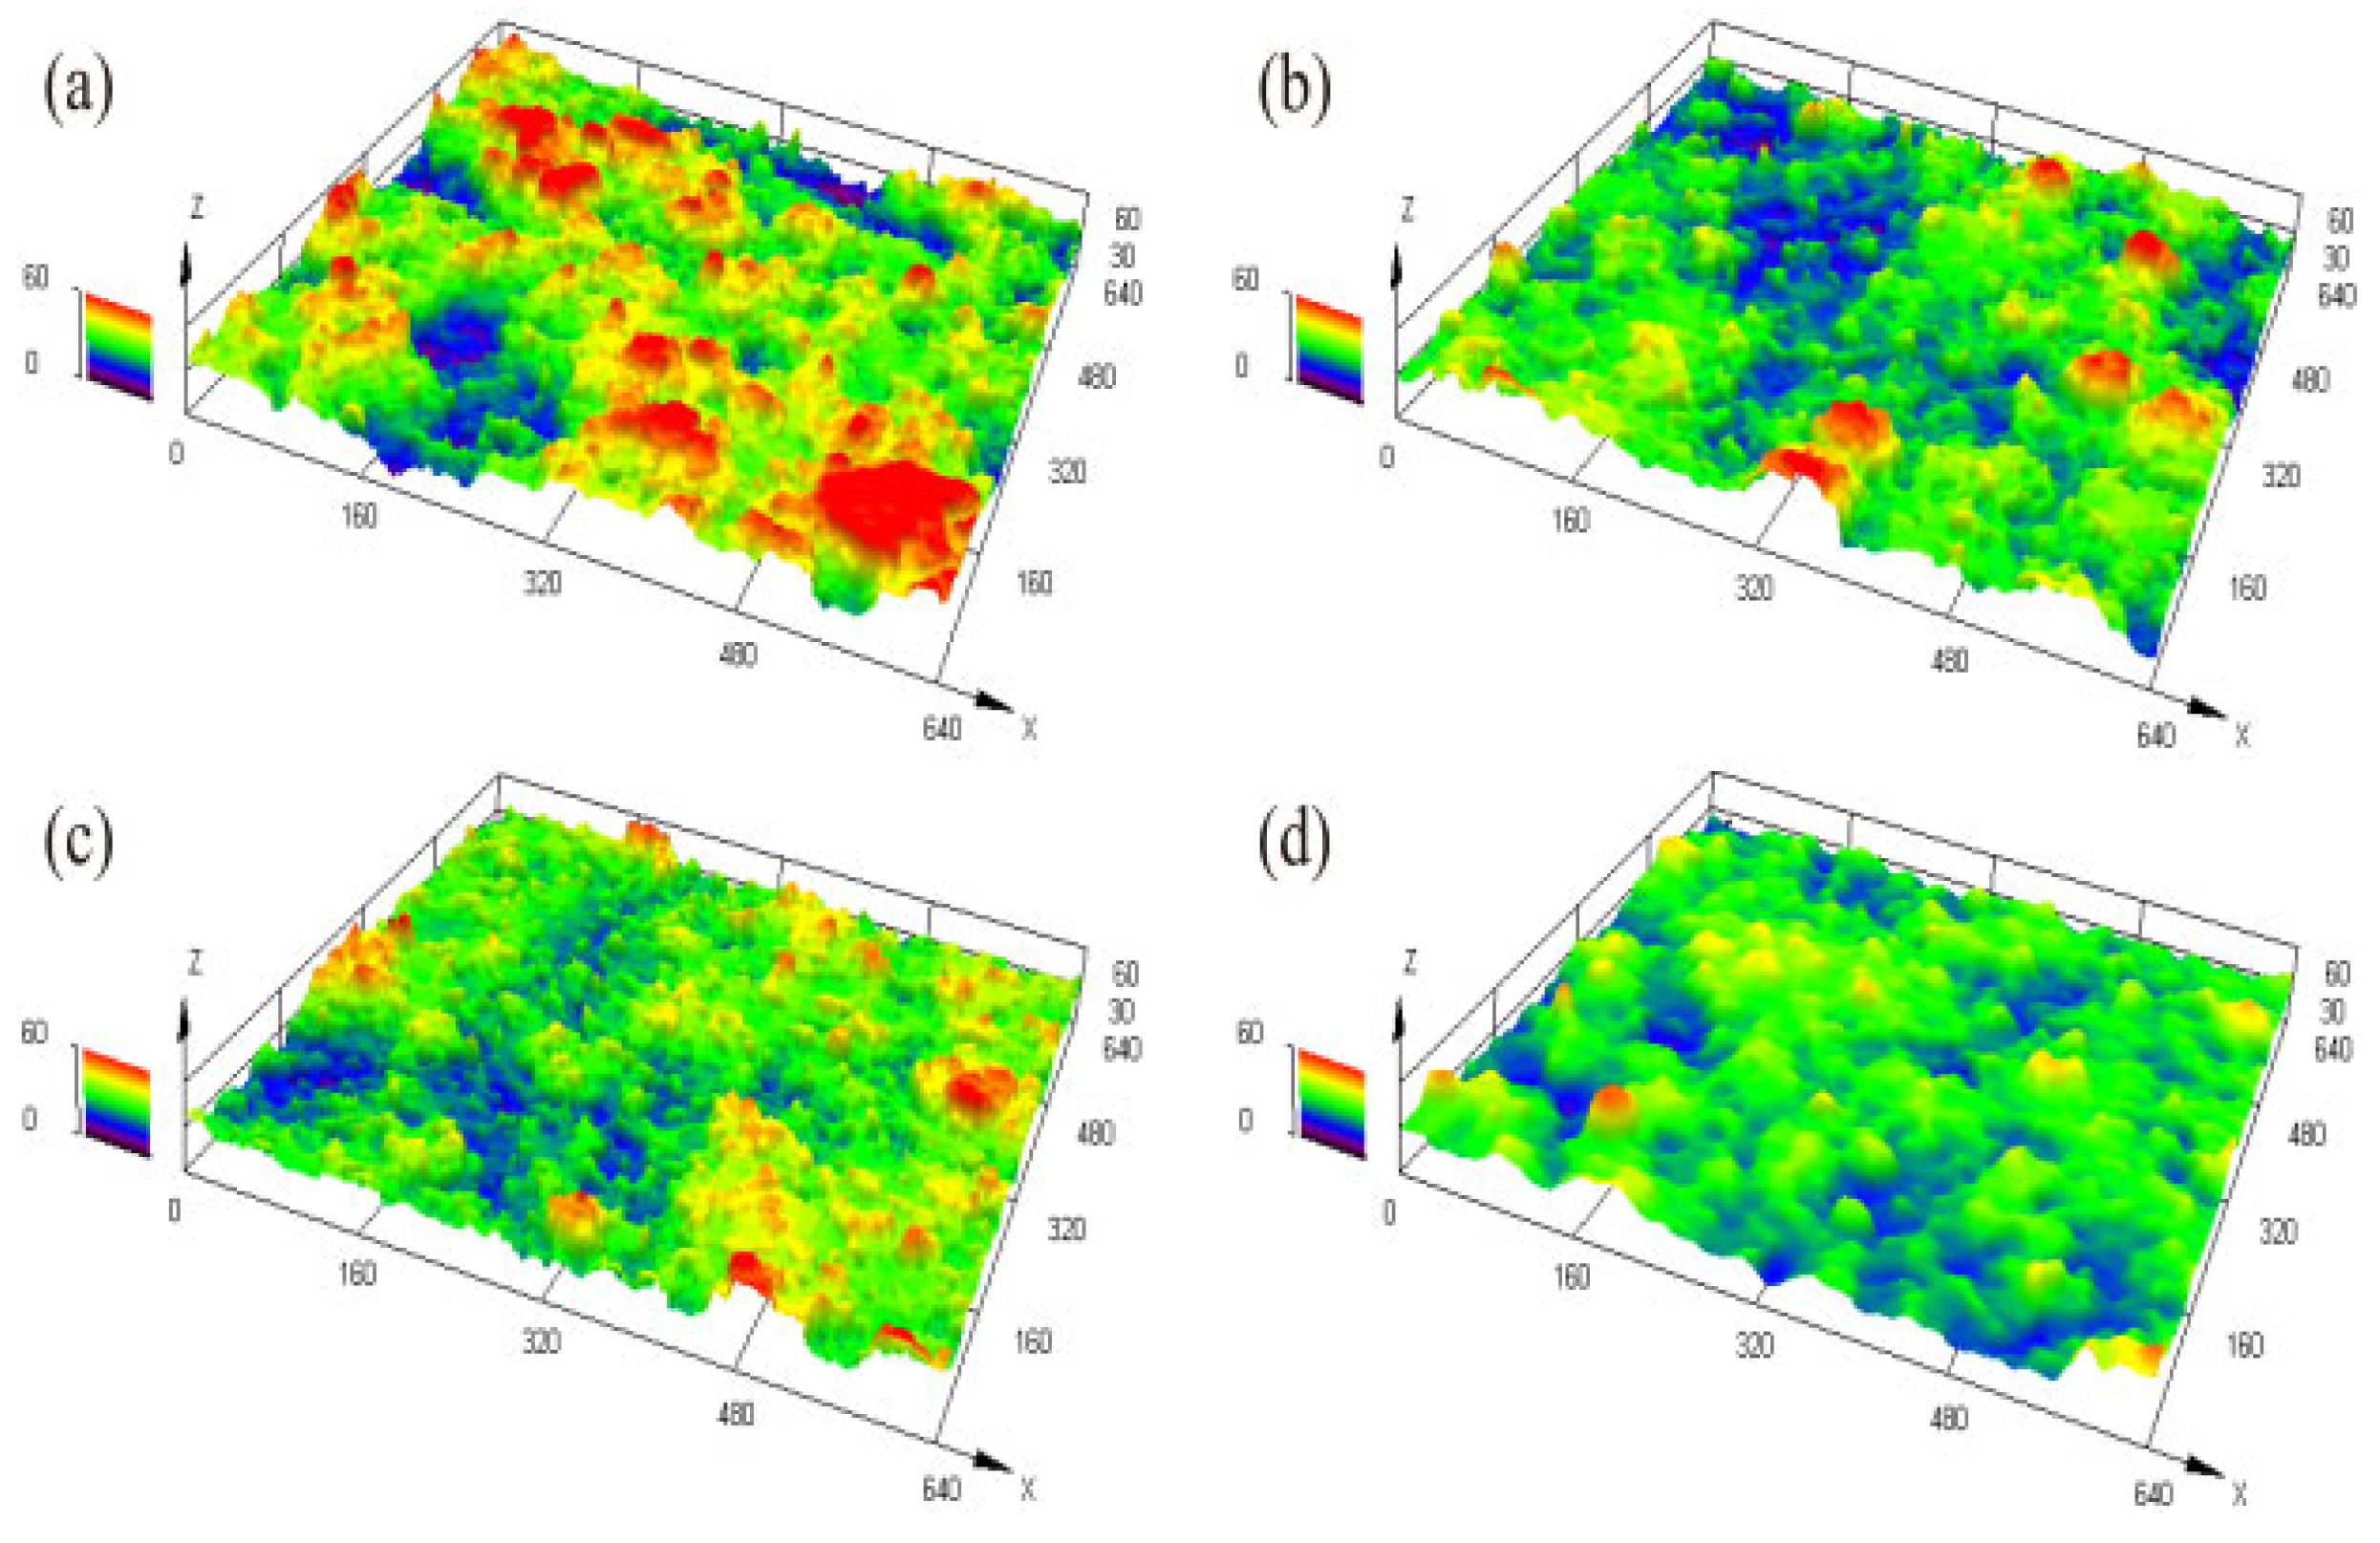
The 3D surface morphology of BC was measured by 3D laser microscopy, as shown in Figure 3. It can be seen that the surface fineness was improved with the decrease in particle size. The same indicates that the interfacial morphology was affected by different sandblast particle treatments to some extent.
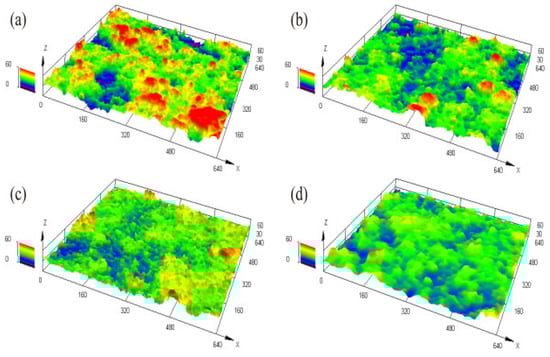
Figure 3.
3D morphology of the bonding coating surface: (a) No.1 (24 mesh) (b) No.2 (36 mesh) (c) No.3 (60 mesh) (d) No.4 (96 mesh).
Three areas of the coating were selected from four groups of samples after different sandblasting treatments. Each area was selected at three positions to measure its line roughness in the X-direction. Finally, the average value of the line roughness was obtained. The line roughness Ra was taken as the primary discriminator of roughness. The surface roughness of the coating was recorded to Table 2 after collation. As can be seen from the figure, there were different degrees of decrease in roughness with the decrease in the size of the sandblasted grains.
Table 2.
Average roughness (Ra), amplitude (A), wave length (λ), and peak curvature (Kp) at the interface.
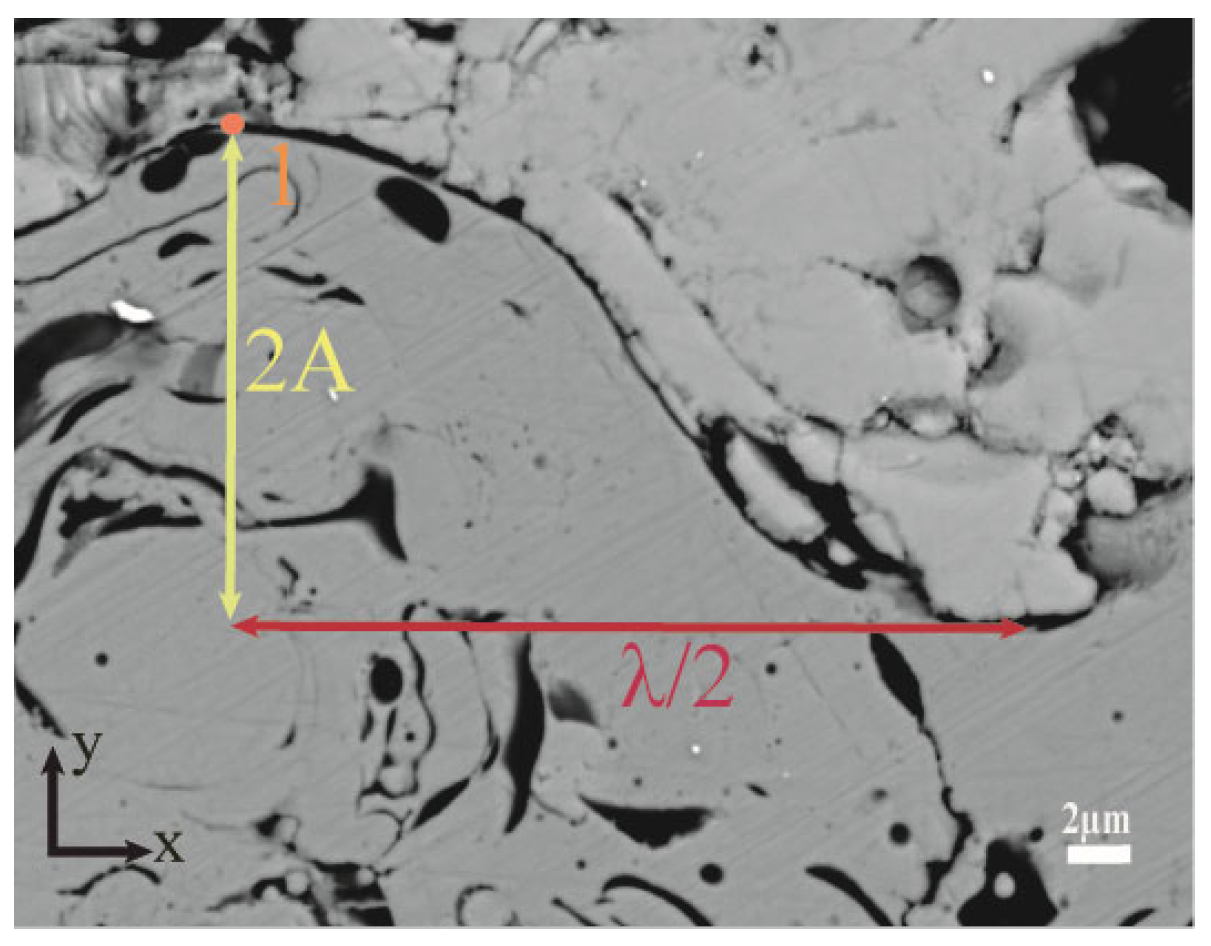
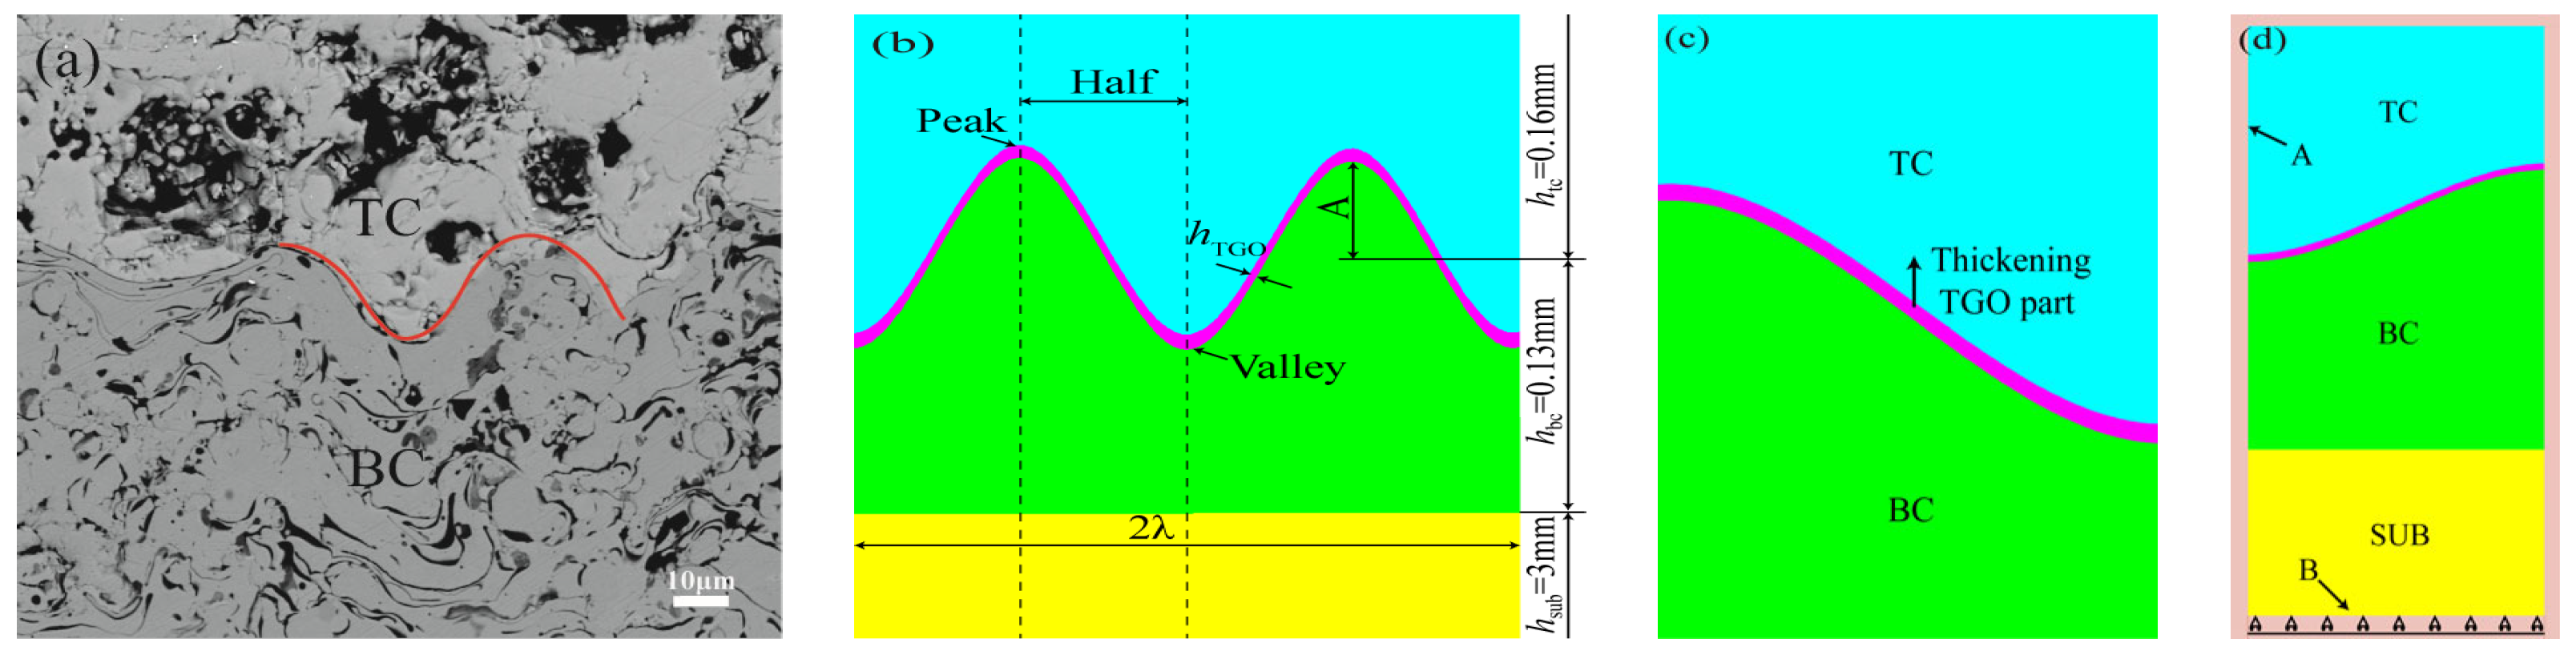
The TC/BC interface images were processed and analyzed using Image-Pro Plus 6.0 image analysis software. Three SEM cross-section images were selected from the samples treated with different sandblasting grain sizes, as shown in Figure 2, and Figure 4 shows the schematic diagram of the interface morphology. The laws of roughness (Ra), amplitude (A), wavelength (λ), and peak curvature (Kp) of the interface oscillation period after different treatments were summarized from each image (four sets of data were extracted to take the mean value), and finally the mean value of twelve sets of data were obtained, as shown in Table 2. It can be observed from the table that there was a proportional relationship between roughness, amplitude, and wavelength (A/Ra ≈ 1.33 and the aspect ratio of the oscillation period λ/A ≈ 5.18). Therefore, the introduction of the mean peak curvature Kp (the curvature at the maximum value in one cycle in a cosine-like function interface, as shown in point one) can be a good reflection of the overall level of interface curvature. It can be found that the interfacial curvature increased with decreasing sandblast grain size.
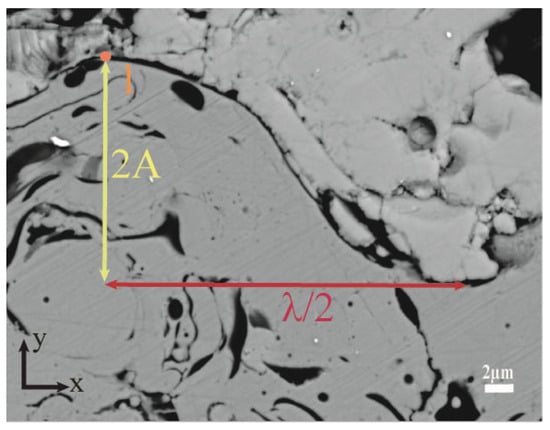
Figure 4.
Schematic diagram of interface morphology.
Typical areas were selected for four groups of samples experiencing different numbers of thermal cycles and the TGO thickness was measured [18].
where δTGO is the thickness of oxide layer thickness/μm; ∑S is oxide layer area/μm2; ∑L is the sum of interface lengths/μm.
δTGO = ∑S/∑L
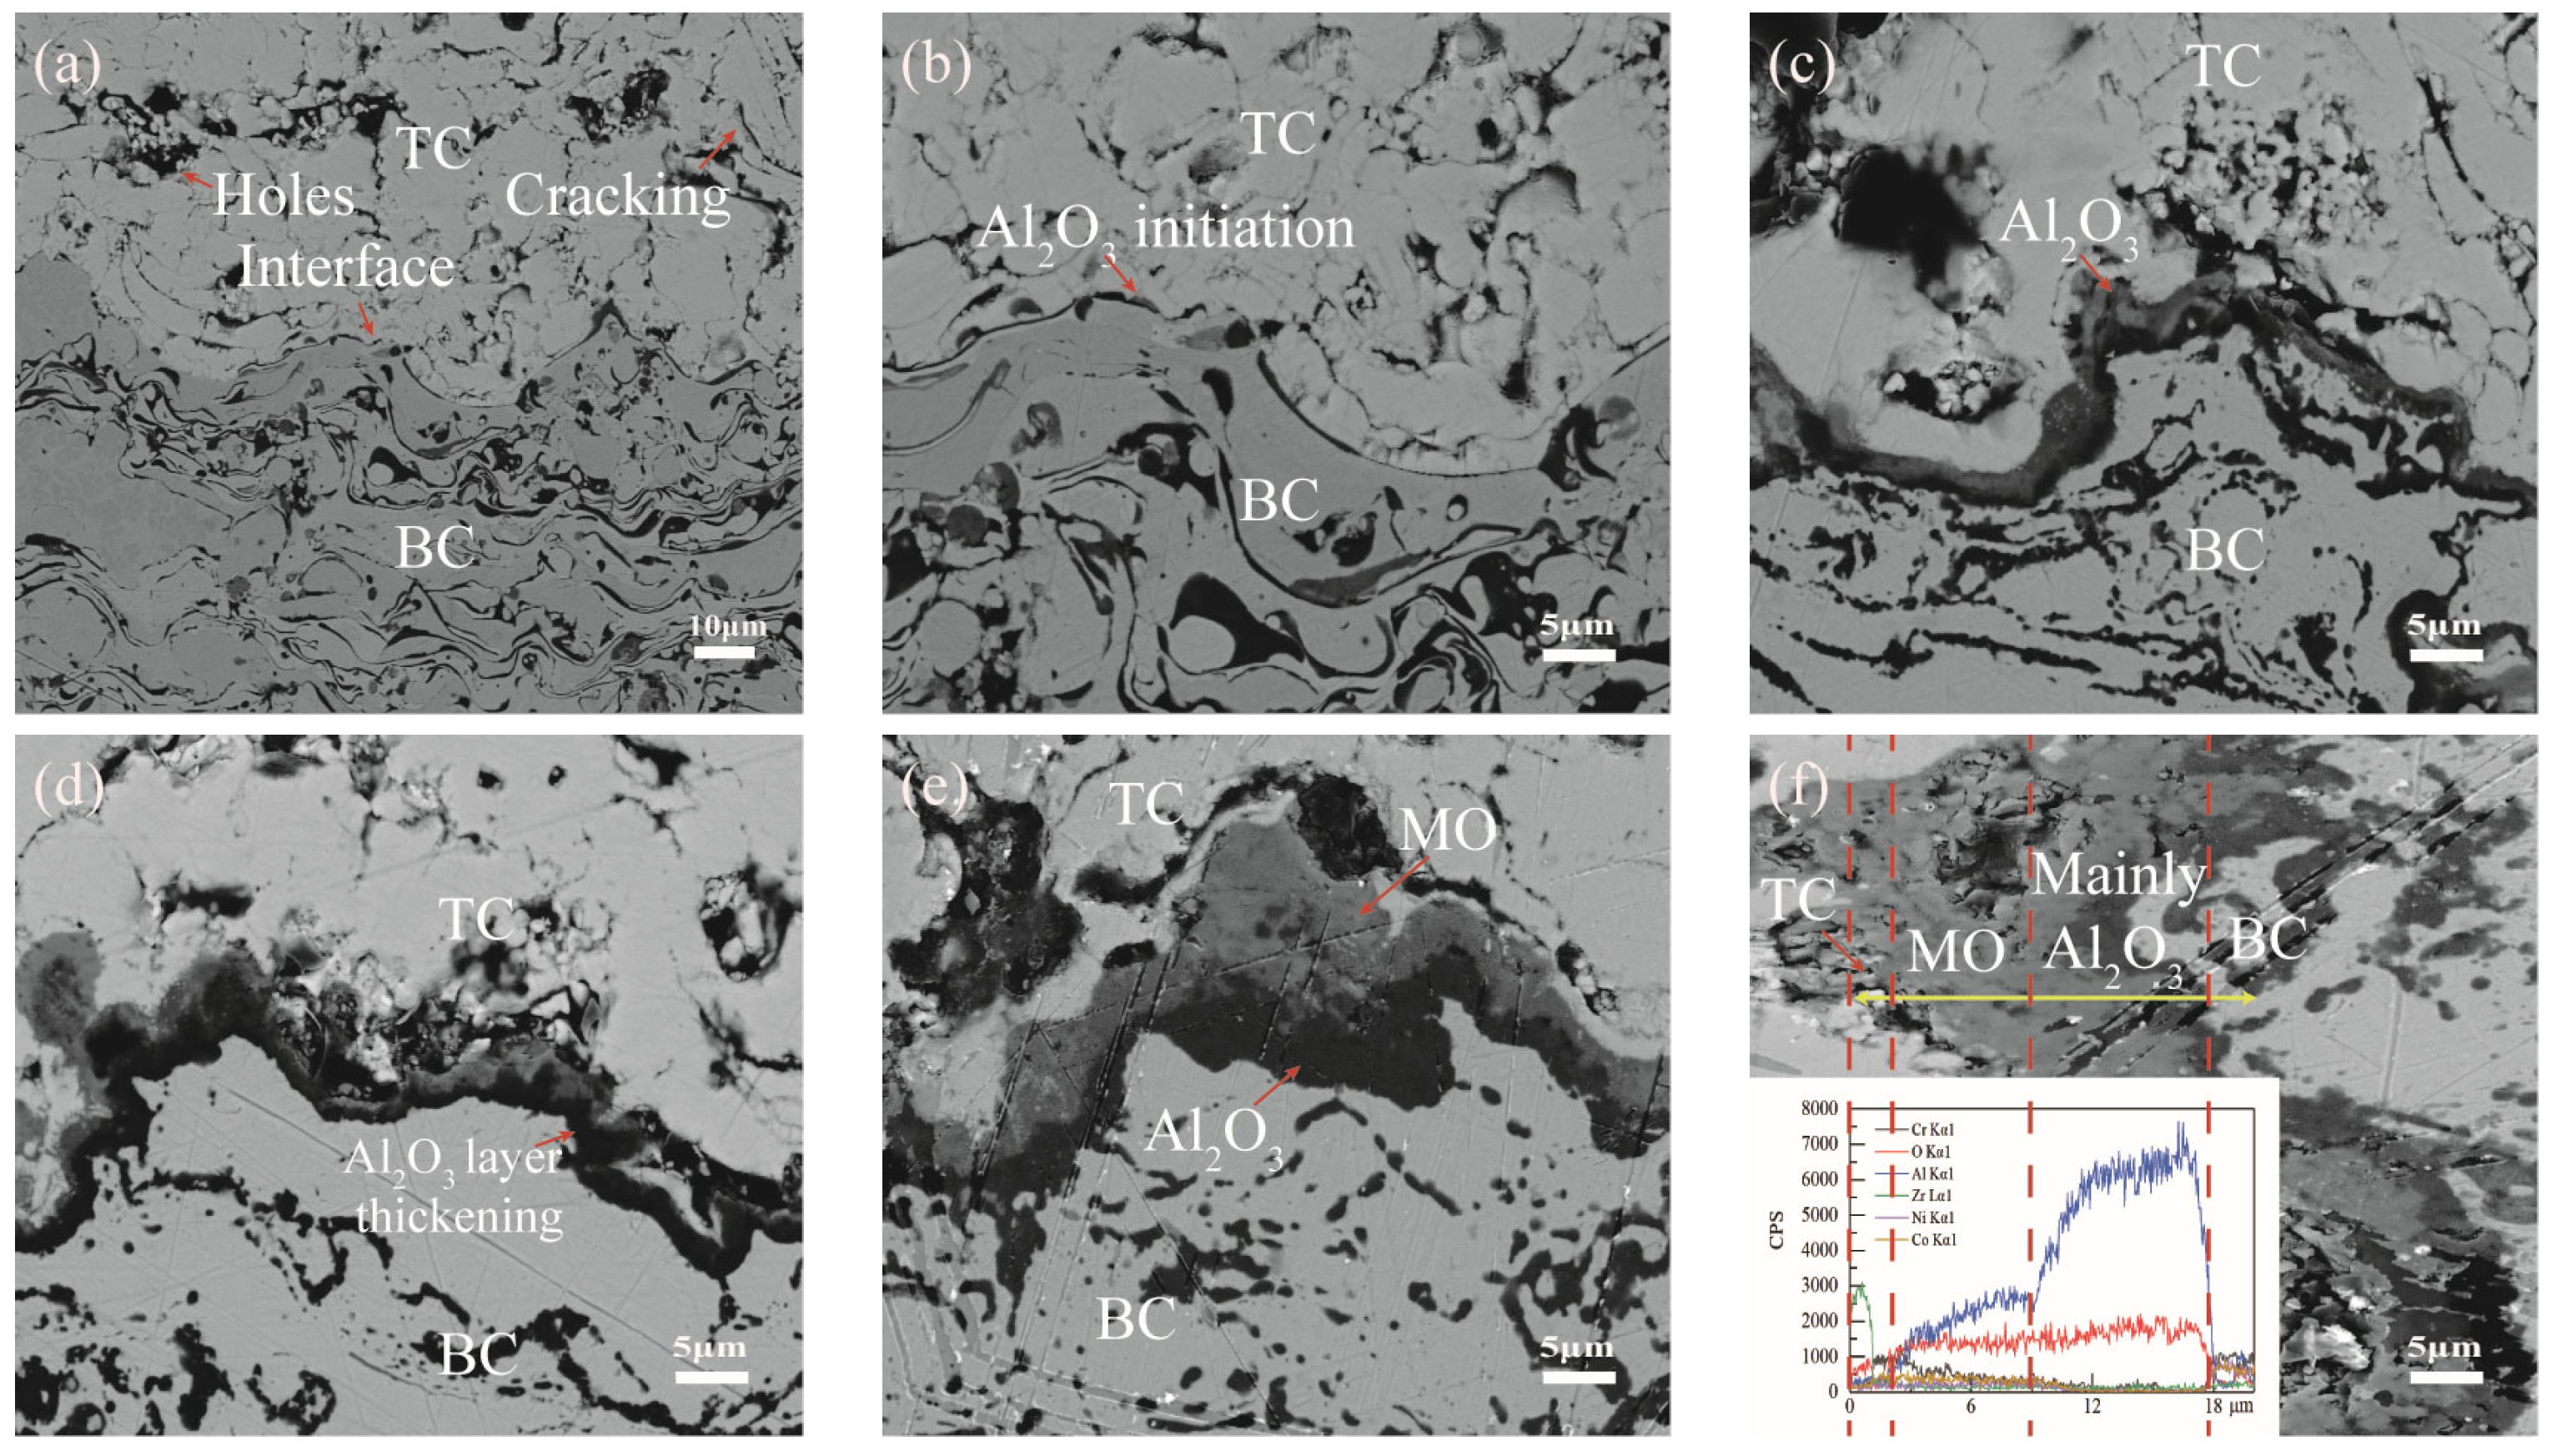
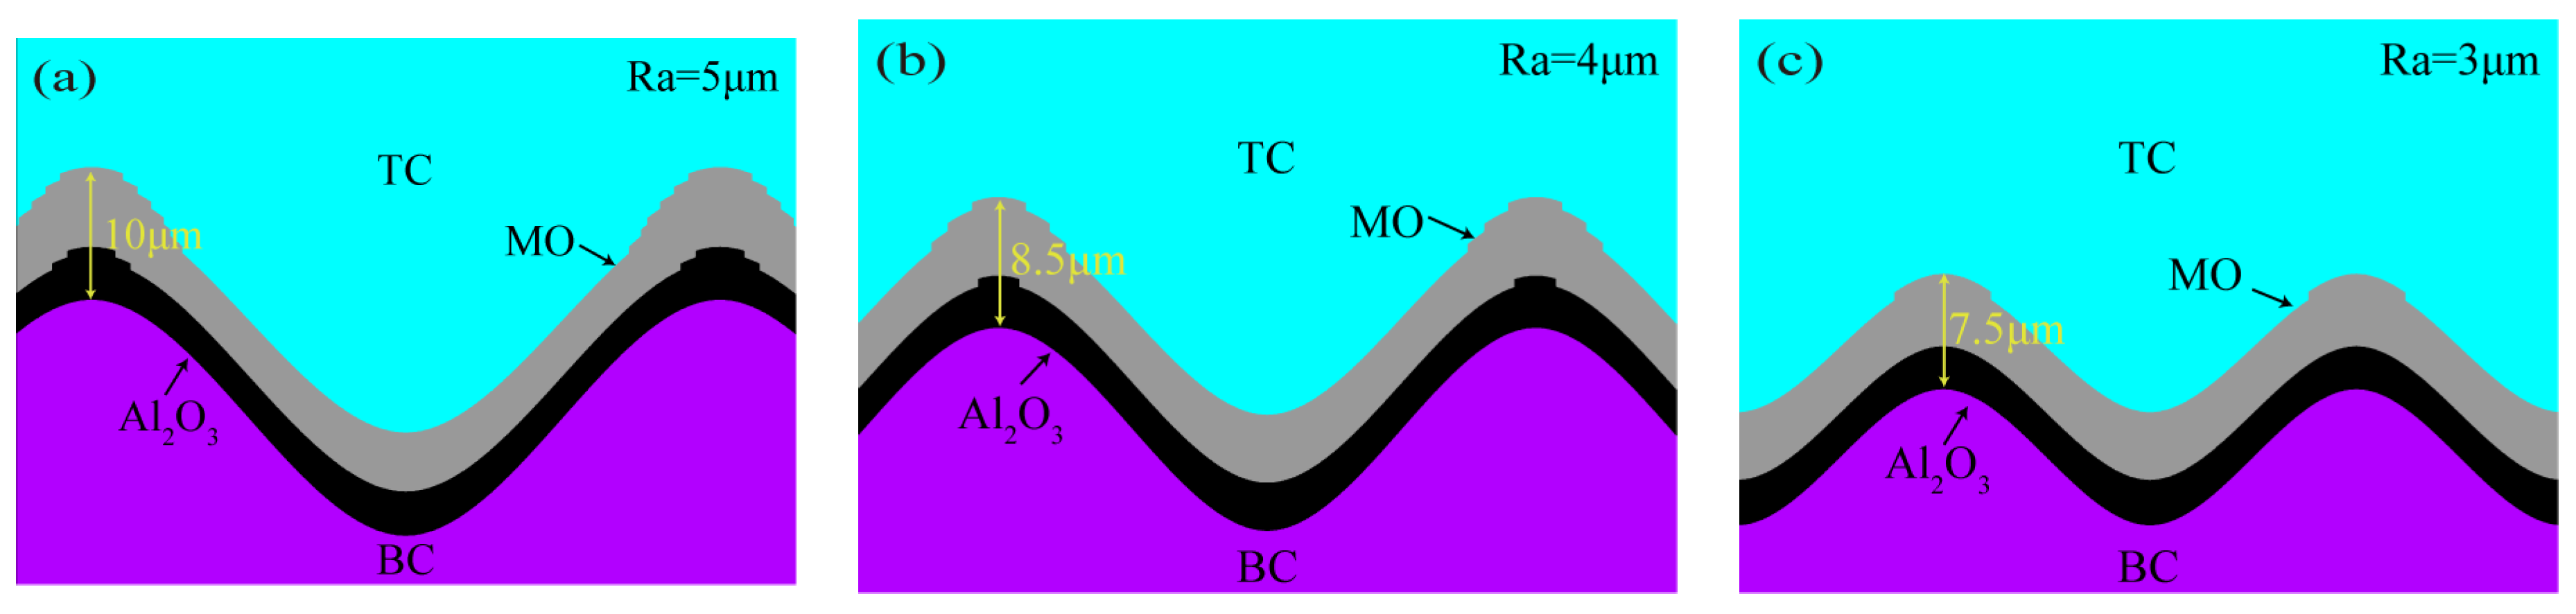
A randomly selected group (sample No.1 as an example) was analyzed for the growth of TGO layers with different numbers of thermal cycles, as shown in Figure 5. A large number of holes and microcracks were present in the ceramic layer in Figure 5a. The interface showed a cosine shape. It is obvious from Figure 5b that the α-Al2O3-dominated TGO is first formed preferentially in the peak and near-peak regions after 10 thermal cycles [19]. After 60 thermal cycles (Figure 5c), a dense oxide layer was generated at the interface. After 200 thermal cycles (Figure 5d), the Al2O3 thickened longitudinally, and an uneven local thickness appeared. After 340 thermal cycles (Figure 5e), a gray mixed oxide (MO) was produced in the sharp region. The rapid growth of MO (especially in the peak region) led to a further increase in interface fluctuations. After 390 thermal cycles (Figure 5f), the uneven growth led to a further increase in the thickness difference in each region, and the thickness of the peak region exceeded 10 μm. The transitional division between the mixed oxides and Al2O3 can be seen in the spectra.
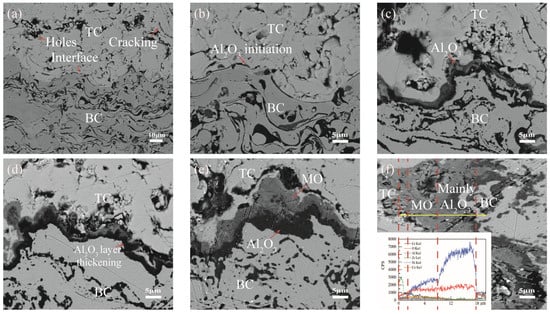
Figure 5.
Morphology and elements of coatings under thermal cycling: (a) 0 cycles (b) 10 cycles (c) 60 cycles (d) 200 cycles (e) 340 cycles and (f) 390 cycles.
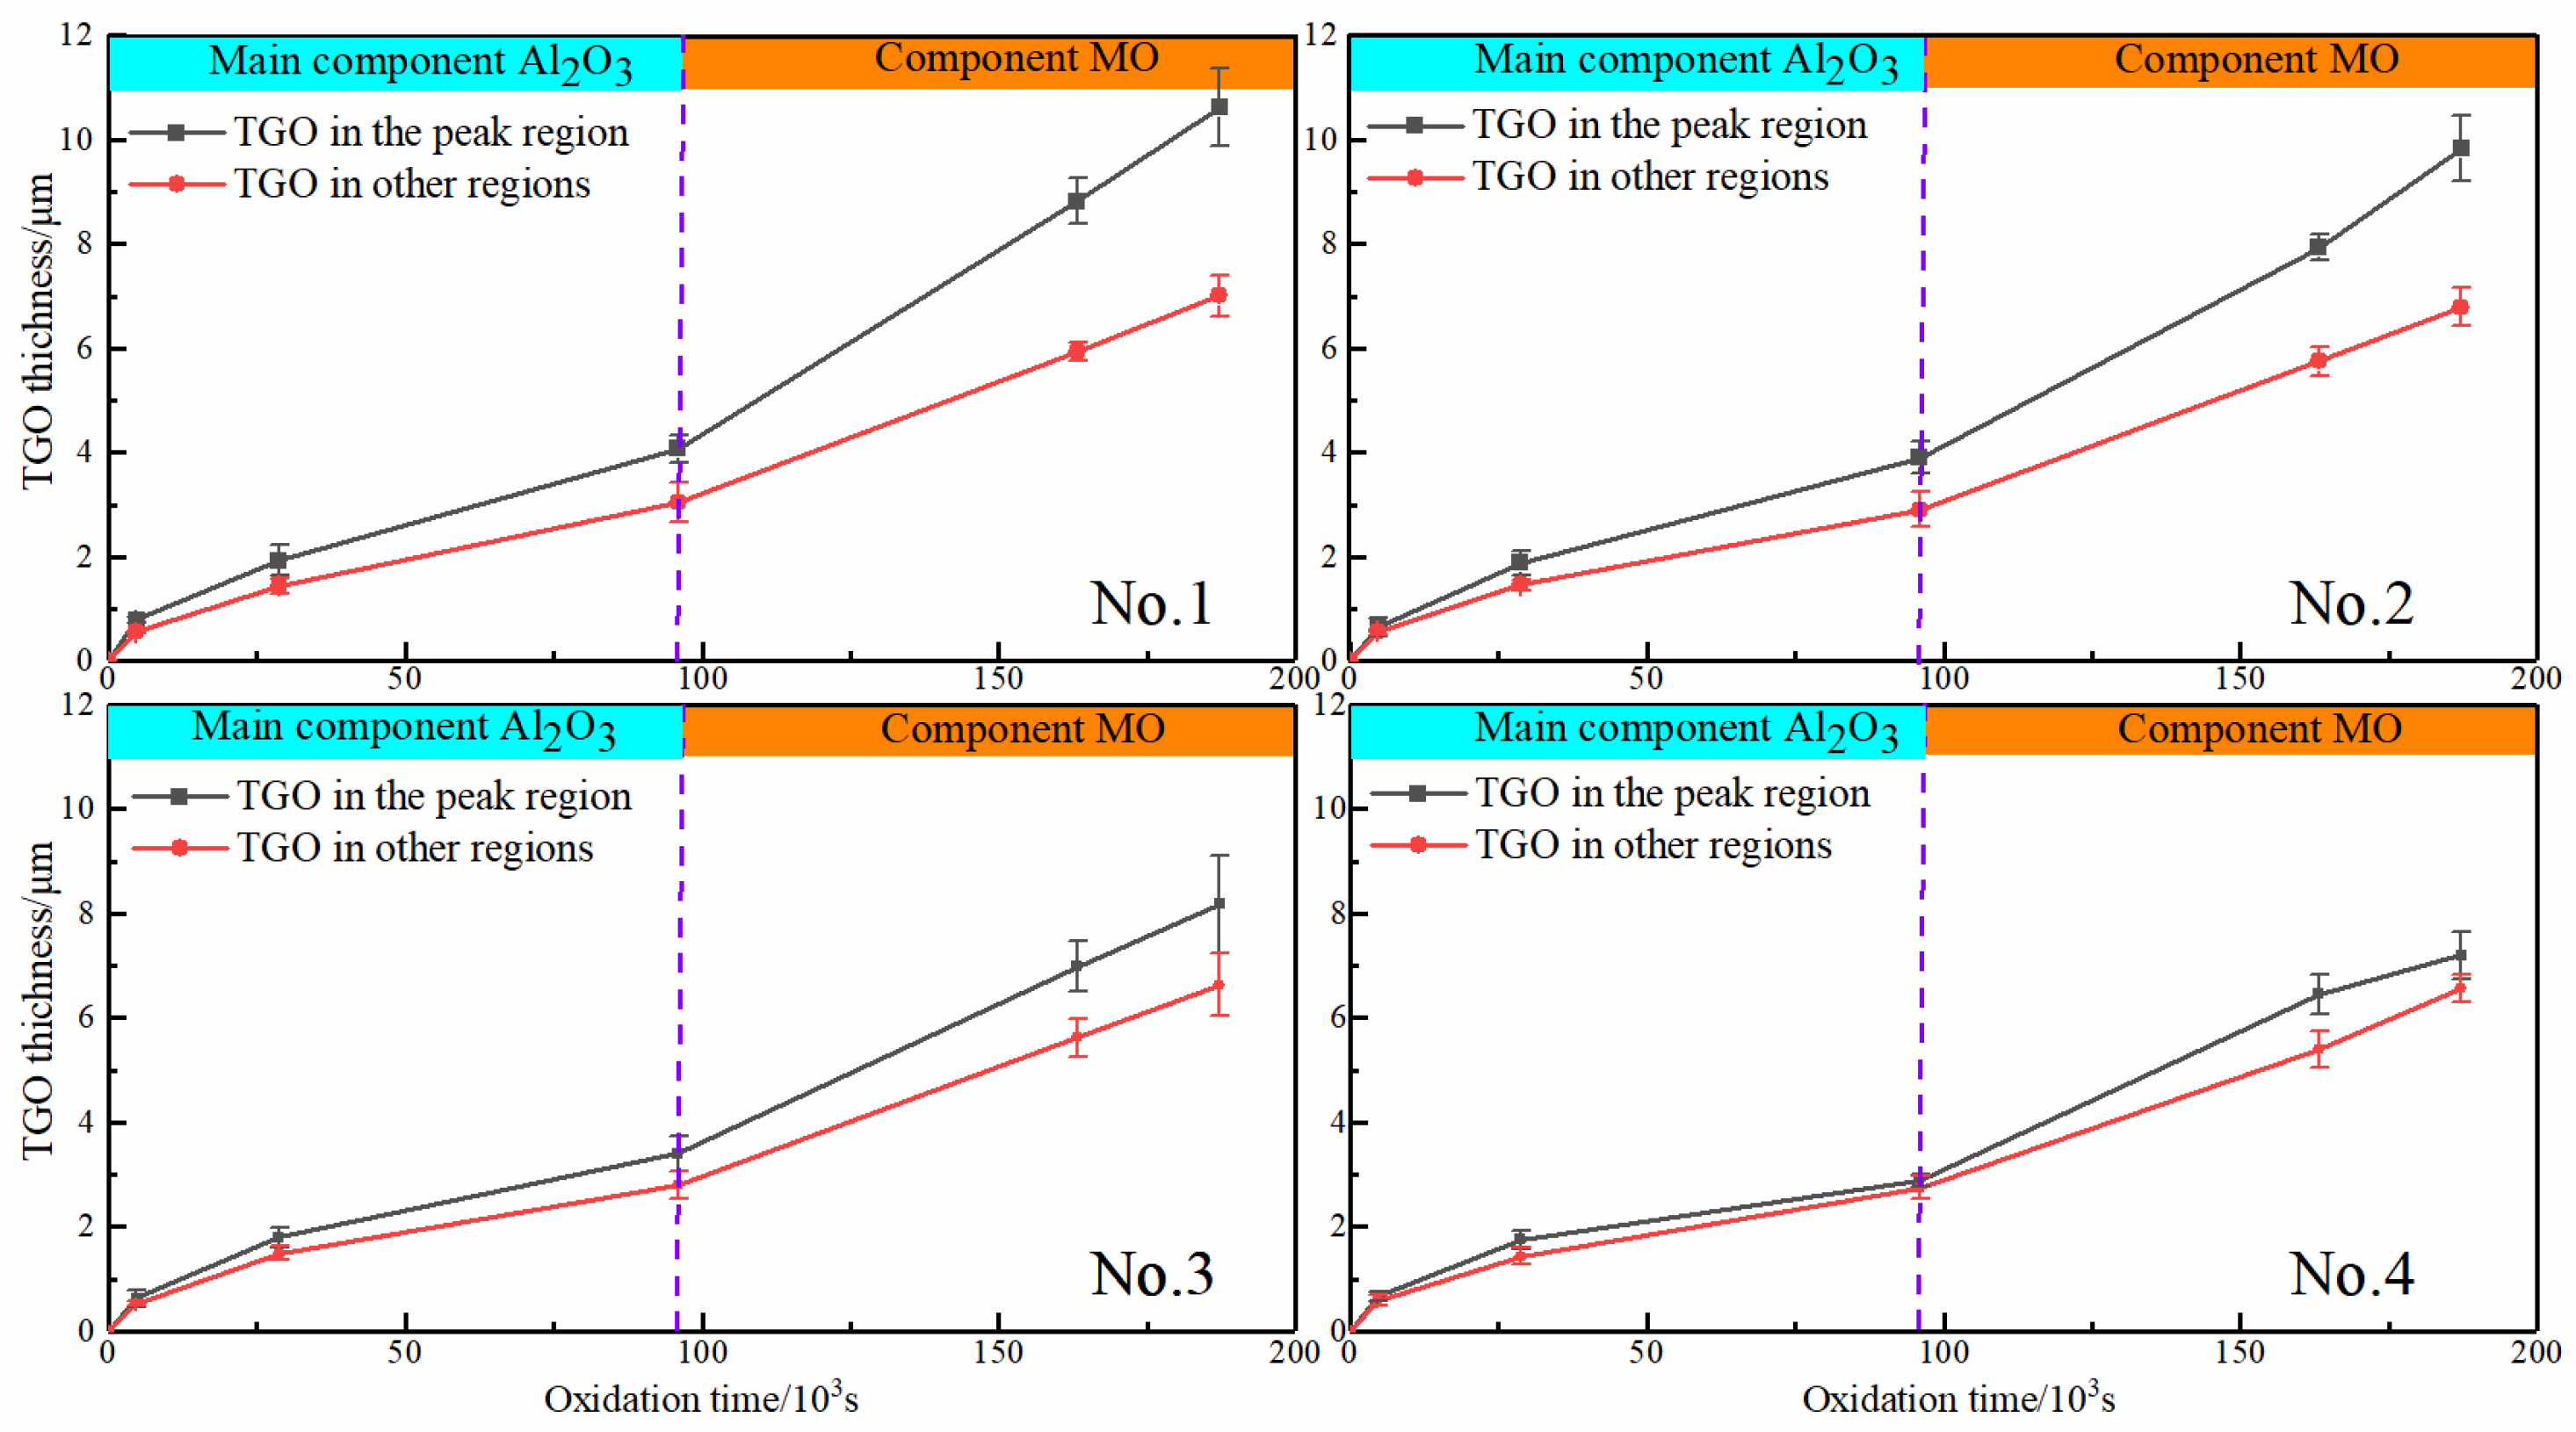
The maximum thickness of the oxide layer in the peak region for the samples with different interfacial curvatures was seen in Figure 6 (The thickness of the oxide layer is the average of all observations of the sample at that moment in time and is connected by a straight line). The growth rate of the oxide layer in the peak region progressively declined with the rise in the mean peak curvature. The TGO growth rate in the peak region was essentially the same as the other regions until Kp = 0.480 μm−1. It is noticed from the figure that the TGO started thickening rapidly at the late stage of thermal exposure, which was the fastest at Kp = 0.192 μm−1 and the peak area could reach 10.618 μm.
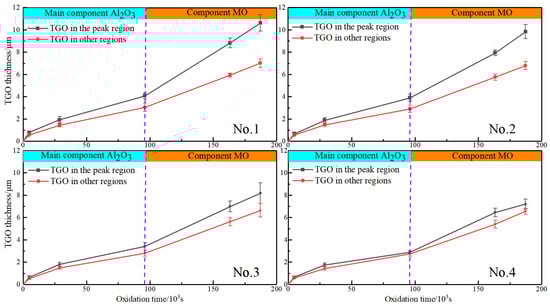
Figure 6.
Oxide thickness at different interface curvatures: No.1 (24 mesh); No.2 (36 mesh); No.3 (60 mesh); No.4 (96 mesh).
2.3. Calculation of Oxidation Kinetics
To provide a more accurate description of TGO growth under thermal cycling, the composition of TGO growth under different oxidation processes was refined. The regional growth rates of Al2O3 and MO were introduced to provide data support for the construction of the TGO dynamic growth model in this research.
Equation (3) can be derived from Wagner’s high-temperature oxidation theory [20]:
where h is the size of the oxide layer, Dv is the diffusion coefficient, C1 is related to the oxygen concentration, t is the time, σy is the y-direction stress, ∆Ω is the activation volume during the oxidation process, and k and T are the Boltzmann constant and the thermodynamic temperature, respectively. The enhancement of stress in the y-direction increases the diffusion of elements as shown by the equation. However, compressive stress restrains elemental diffusion [21,22]. Elemental diffusion ability dictates the growth of the oxide layer. In order to further research the impact of localized oxide morphology on coating stress, the model was split into two parts: the peak region and the others.
The oxide thickening was characterized on the basis of Equation (4) [23]:
where K is the growth coefficient and t is the holding time (This is due to the fact that it is generally believed that TGO grows more significantly at temperatures above 900–1000 °C. However, under the warming and cooling phases, this time was brief and ignored in this paper [19]). In order to accurately analyze the effect of TGO growth behavior on stresses at different interfacial curvatures, the TGO growth process in each region of Figure 7 was simplified into two stages (the TGO rate abruptly increased after 96 × 103 s, and this time was assumed to be the critical point). The first stage was the slow thickening of Al2O3, and the second stage was mixed oxide growth. The growth rates of TGO regions with different interfacial curvatures are shown in Table 3. A more accurate geometric dynamic model was constructed based on the growth rates in Table 3.
hTGO = K·t0.5
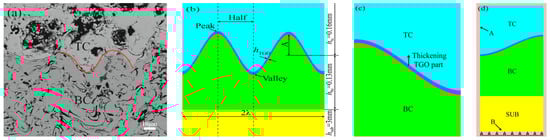
Figure 7.
Model of thermal barrier coating: (a) shape under SEM (b) physical model (c) local models and TGO growth directions (d) thermal loads and constraints.
Table 3.
Growth rates of TGO (Al2O3 and MO) regions at different roughness levels.
2.4. Model Size, Meshing, and Boundary Conditions
In order to analyze the effect of coating on stress under thermal cycling with different interfacial curvatures, the corresponding model was established. The model was calculated by ANSYS 21.0 software. The ideal TC/BC interface and model were built according to Figure 7a. The data in Table 2 were simplified to make it easier to construct the model. The amplitudes (A) are 10 μm, 8 μm, 6 μm, and 4 μm, and the corresponding wavelengths (λ) are 50 μm, 40 μm, 30 μm, and 20 μm, respectively. The initial model was presented in Figure 7b.
2.5. Material Parameters
The materials in the model were assumed to be homogeneous and isotropic. The material parameters were shown in Table 4 [24]. The creep factor of the coating is not ignored in high temperature environments, so then by the Norton power law creep:
where εcr is the strain rate/s−1, B is the pre-factor/s−1 MPa−n, σ is the stress/MPa, and n is the power-law creep exponent. The creep parameters are shown in Table 5 [25].
εcr = B/σn
Table 4.
Material parameters of 8YSZ coatings.
Table 5.
Creep effect parameters of 8YSZ coatings.
Based on the oxide growth at different interface curvatures (Table 3), the oxide growth program was prepared using APDL. The dynamic growth of the oxide (C is the number of cycles) and the coating stress evolution process were simulated.
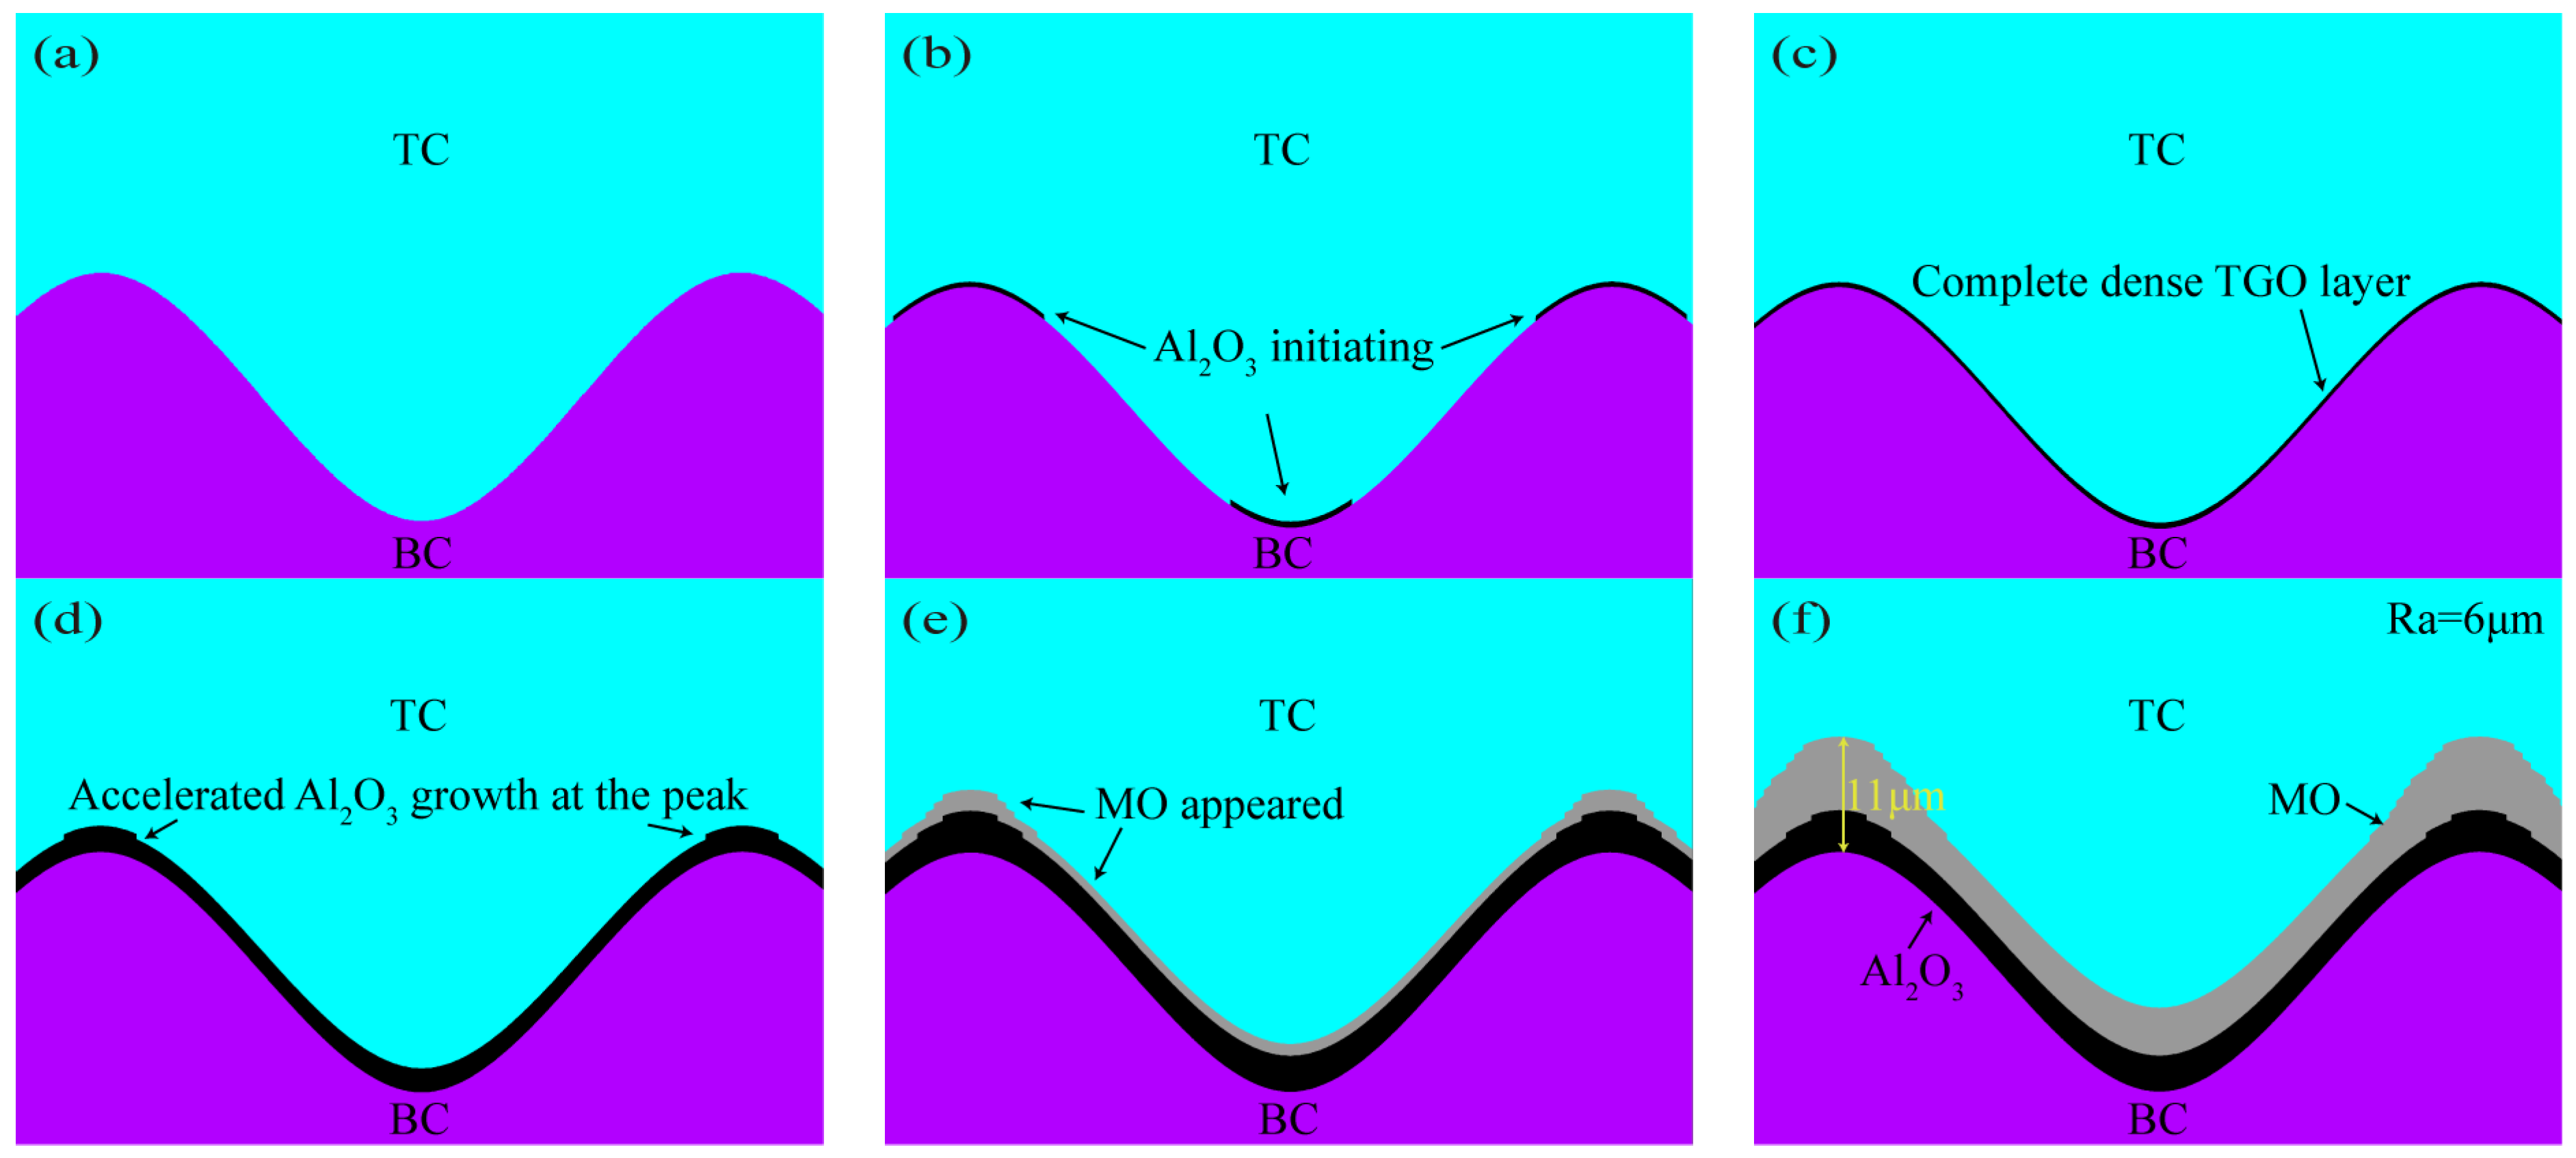
Taking No.1 as an example, Figure 8 shows the TGO dynamic growth process. The simulation process was simplified without loss of computational accuracy. The important nodes of coating TGO growth in 390 thermal cycles of the actual test process were refined into three main stages of the TGO dynamic growth model: (1) Al2O3 initial stage at the TC/BC interface (C = 1–3), as shown in Figure 8a,b. Al2O3 began to emerge from the crests and valleys when C = 2, as shown by the arrows in Figure 8b. (2) Al2O3 in the longitudinal slow growth phase at the interface (C = 4–9). At C = 4 (Figure 8c), an Al2O3 layer had formed at the interface. The uneven growth of oxides at the interface was clearly seen at C = 7 (Figure 8d). (3) Longitudinal rapid growth phase of MO (C = 10–13). MO exhibited explosive growth at C = 10 (Figure 8e). The MO in the peak region still remained fast growing at C = 13, and the maximum thickness of the oxide in the eventually peak region could reach 11 μm (Figure 8f). Figure 9 shows the final growth morphology of TGO at other interfacial curvatures.
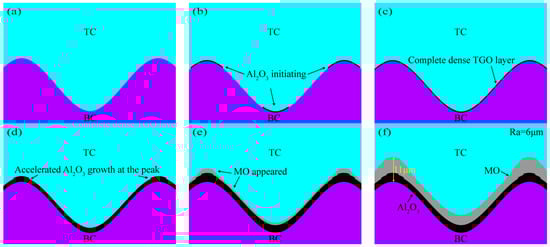
Figure 8.
Growth model of oxide layer: (a) C = 0, (b) C = 2, (c) C = 4, (d) C = 7, (e) C = 10, and (f) C = 13.
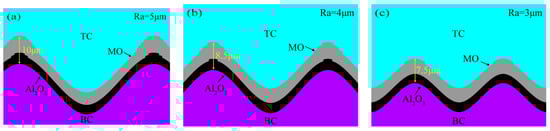
Figure 9.
TGO ultimate growth morphology at other interface curvatures: (a) No. 2, (b) No. 3, (c) No. 4.
3. Results and Analysis
3.1. Residual Stress
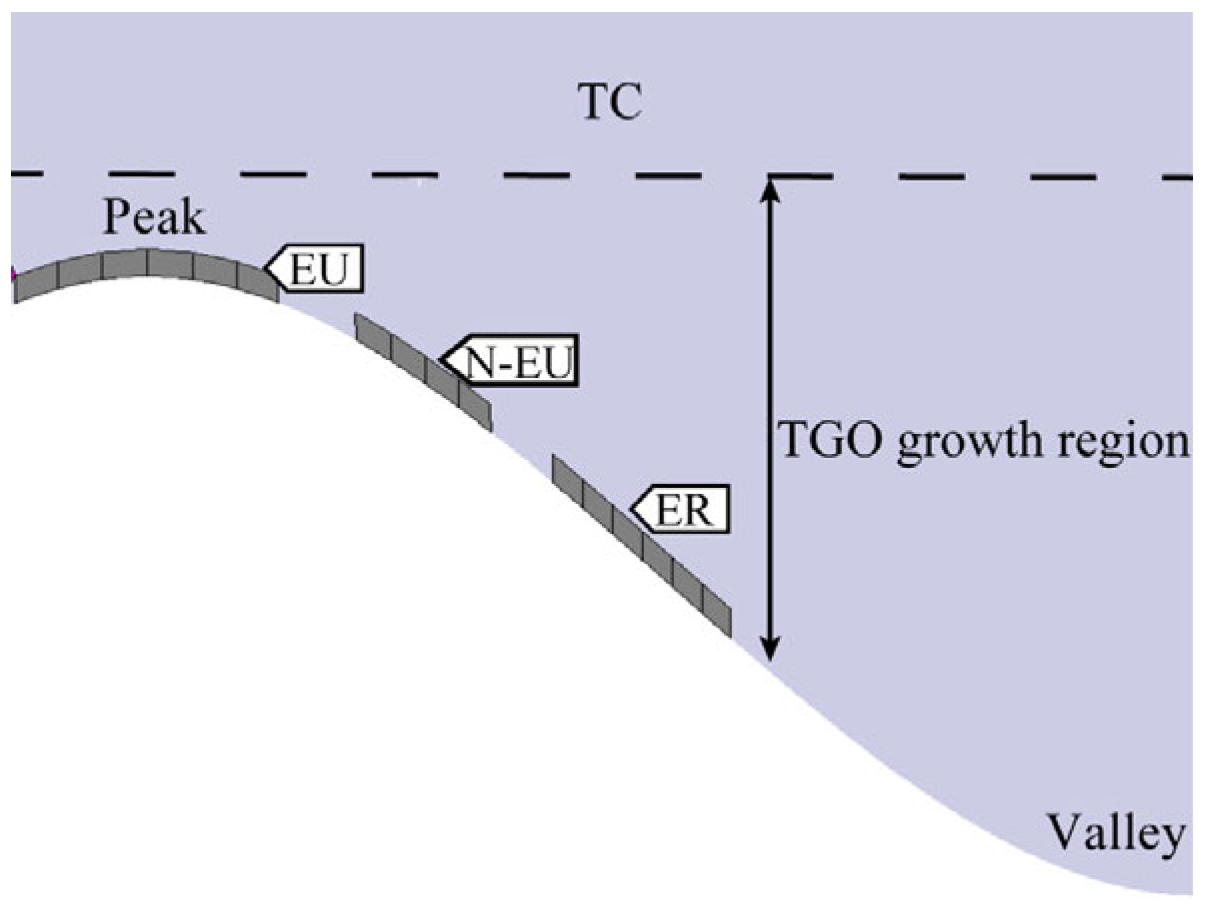
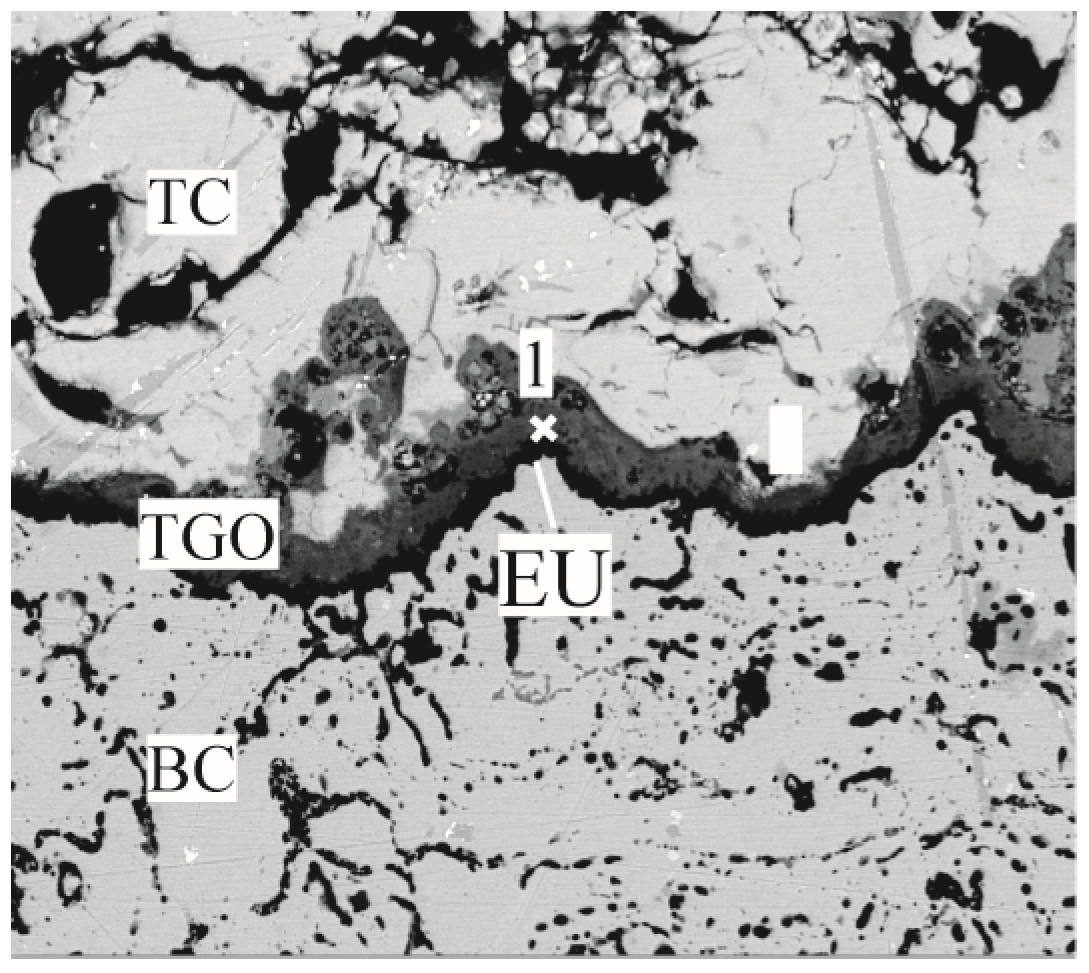
The oxidized layer was tested by using a Raman fluorescence spectrometer with a wavelength of 532 nm. To more accurately test the residual stresses in the TGO layer, the TGO stresses were characterized by tracking the frequency shift of R2 for Cr3+ in α-Al2O3 [26]. Since the appearance of cracks near the interface in the later stages of thermal exposure influenced the accuracy of the survey, locations with more pronounced features and no visible cracks were selected for testing. Three regions—the crest region (EU), the near crest region (N-EU), and the ramp region (ER)—were selected simultaneously (Figure 10). Figure 11 represents the Raman spectroscopy test locations and Figure 12 shows typical PLPS spectra of the TGO interior.
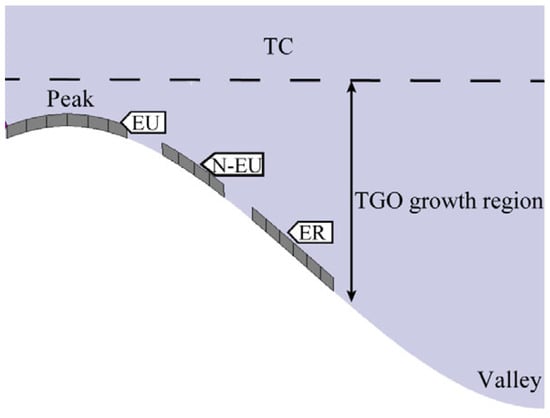
Figure 10.
Typical areas within the TGO.
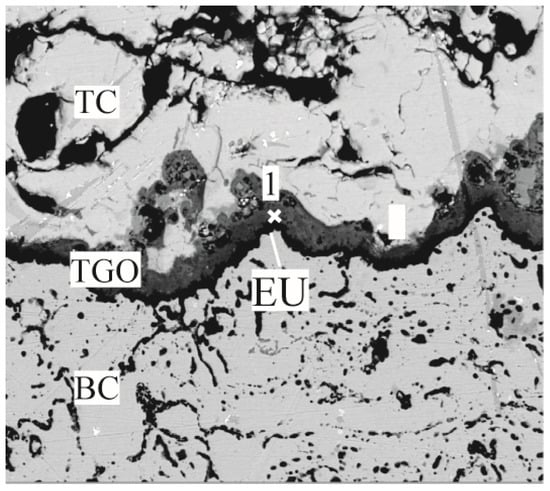
Figure 11.
Test area diagram using PLPS.
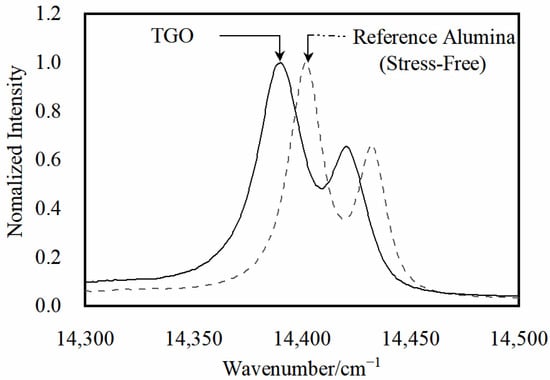
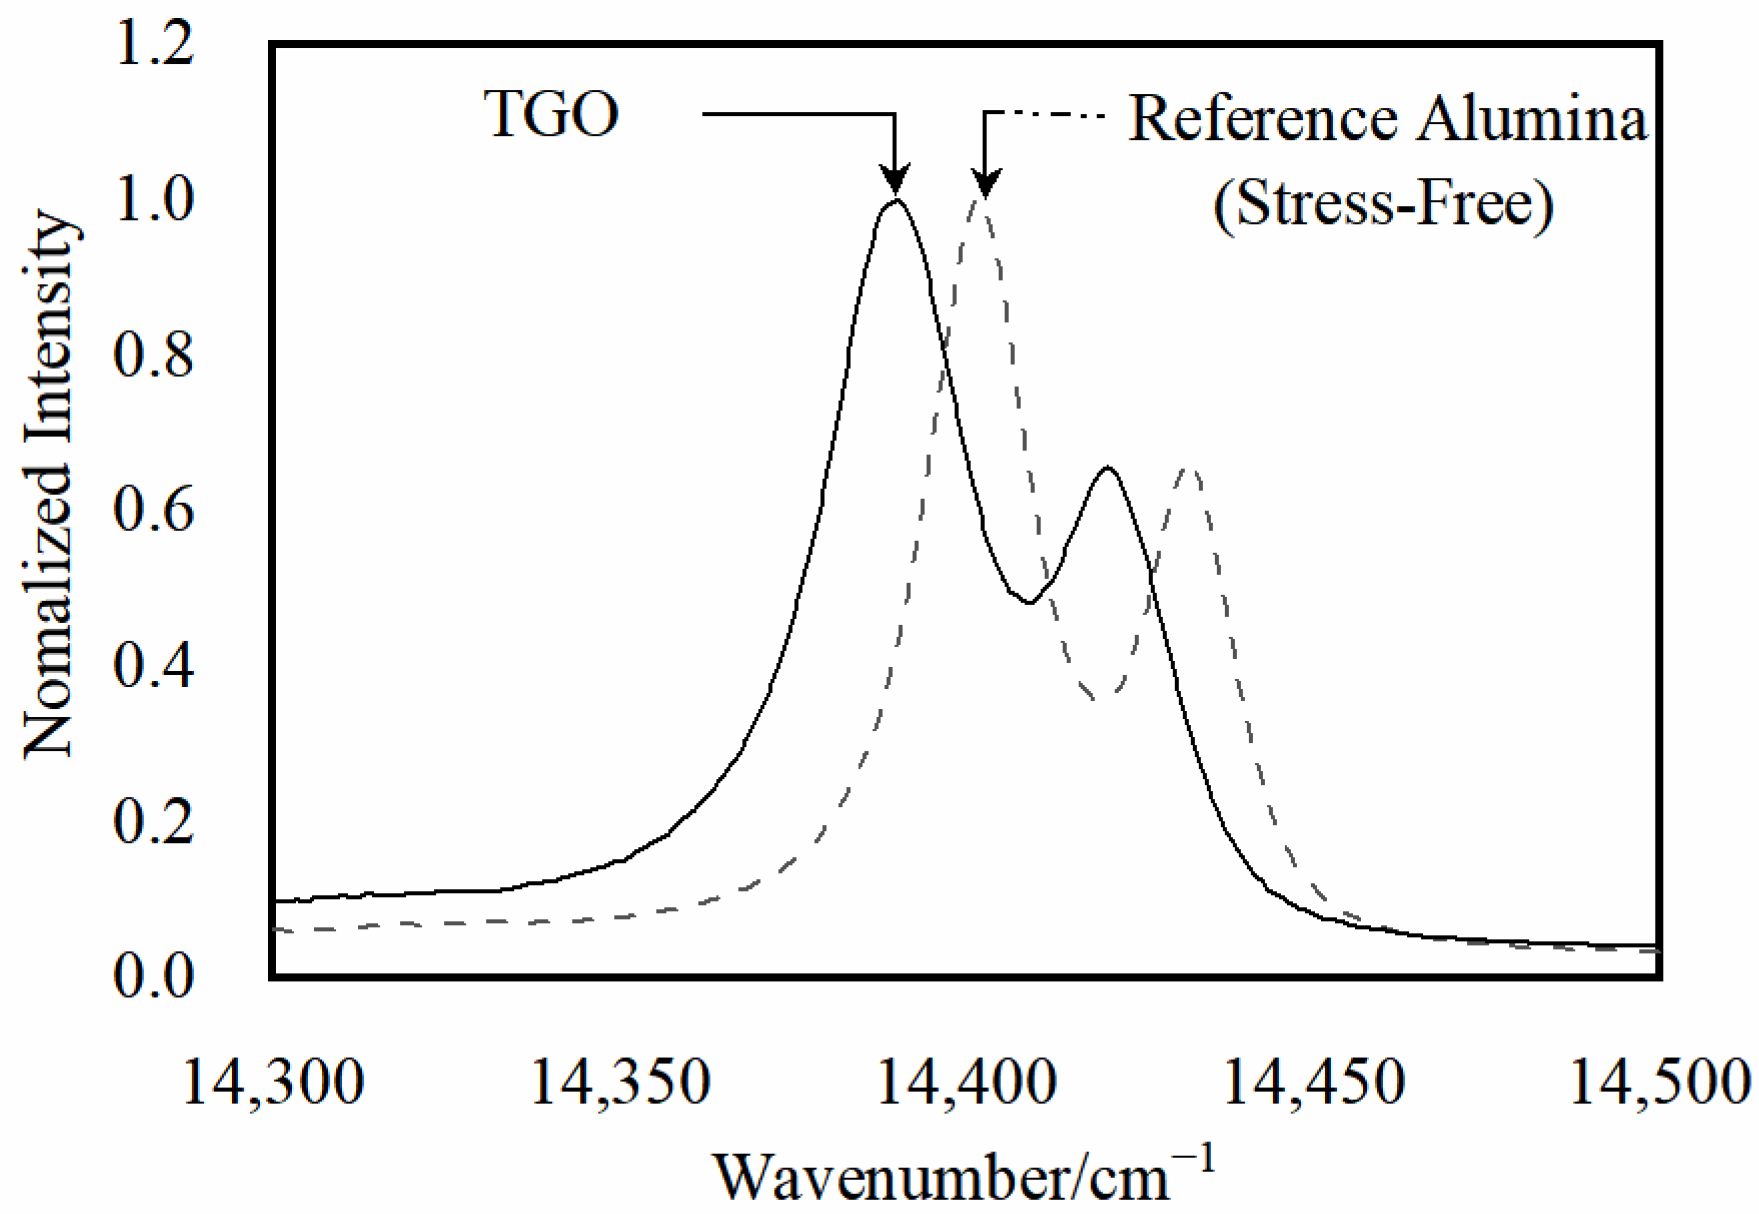
Figure 12.
Typical PLPS spectra inside the oxide layer.
The Gaussian Lorentz function was fitted to the spectral curves by Labspec 5.0 software with an accuracy of about 0.5 cm−1. The TGO can be considered under biaxial stress due to its flat structure. Lipkin and Clarke et al. [27] discussed the stress tensor of TGO in more detail. The residual stress σ is [28]:
where Δυ is the frequency shift of R2 fluorescence. All the Raman measurements were carried out at room temperature.
∆υ = 5.07σ
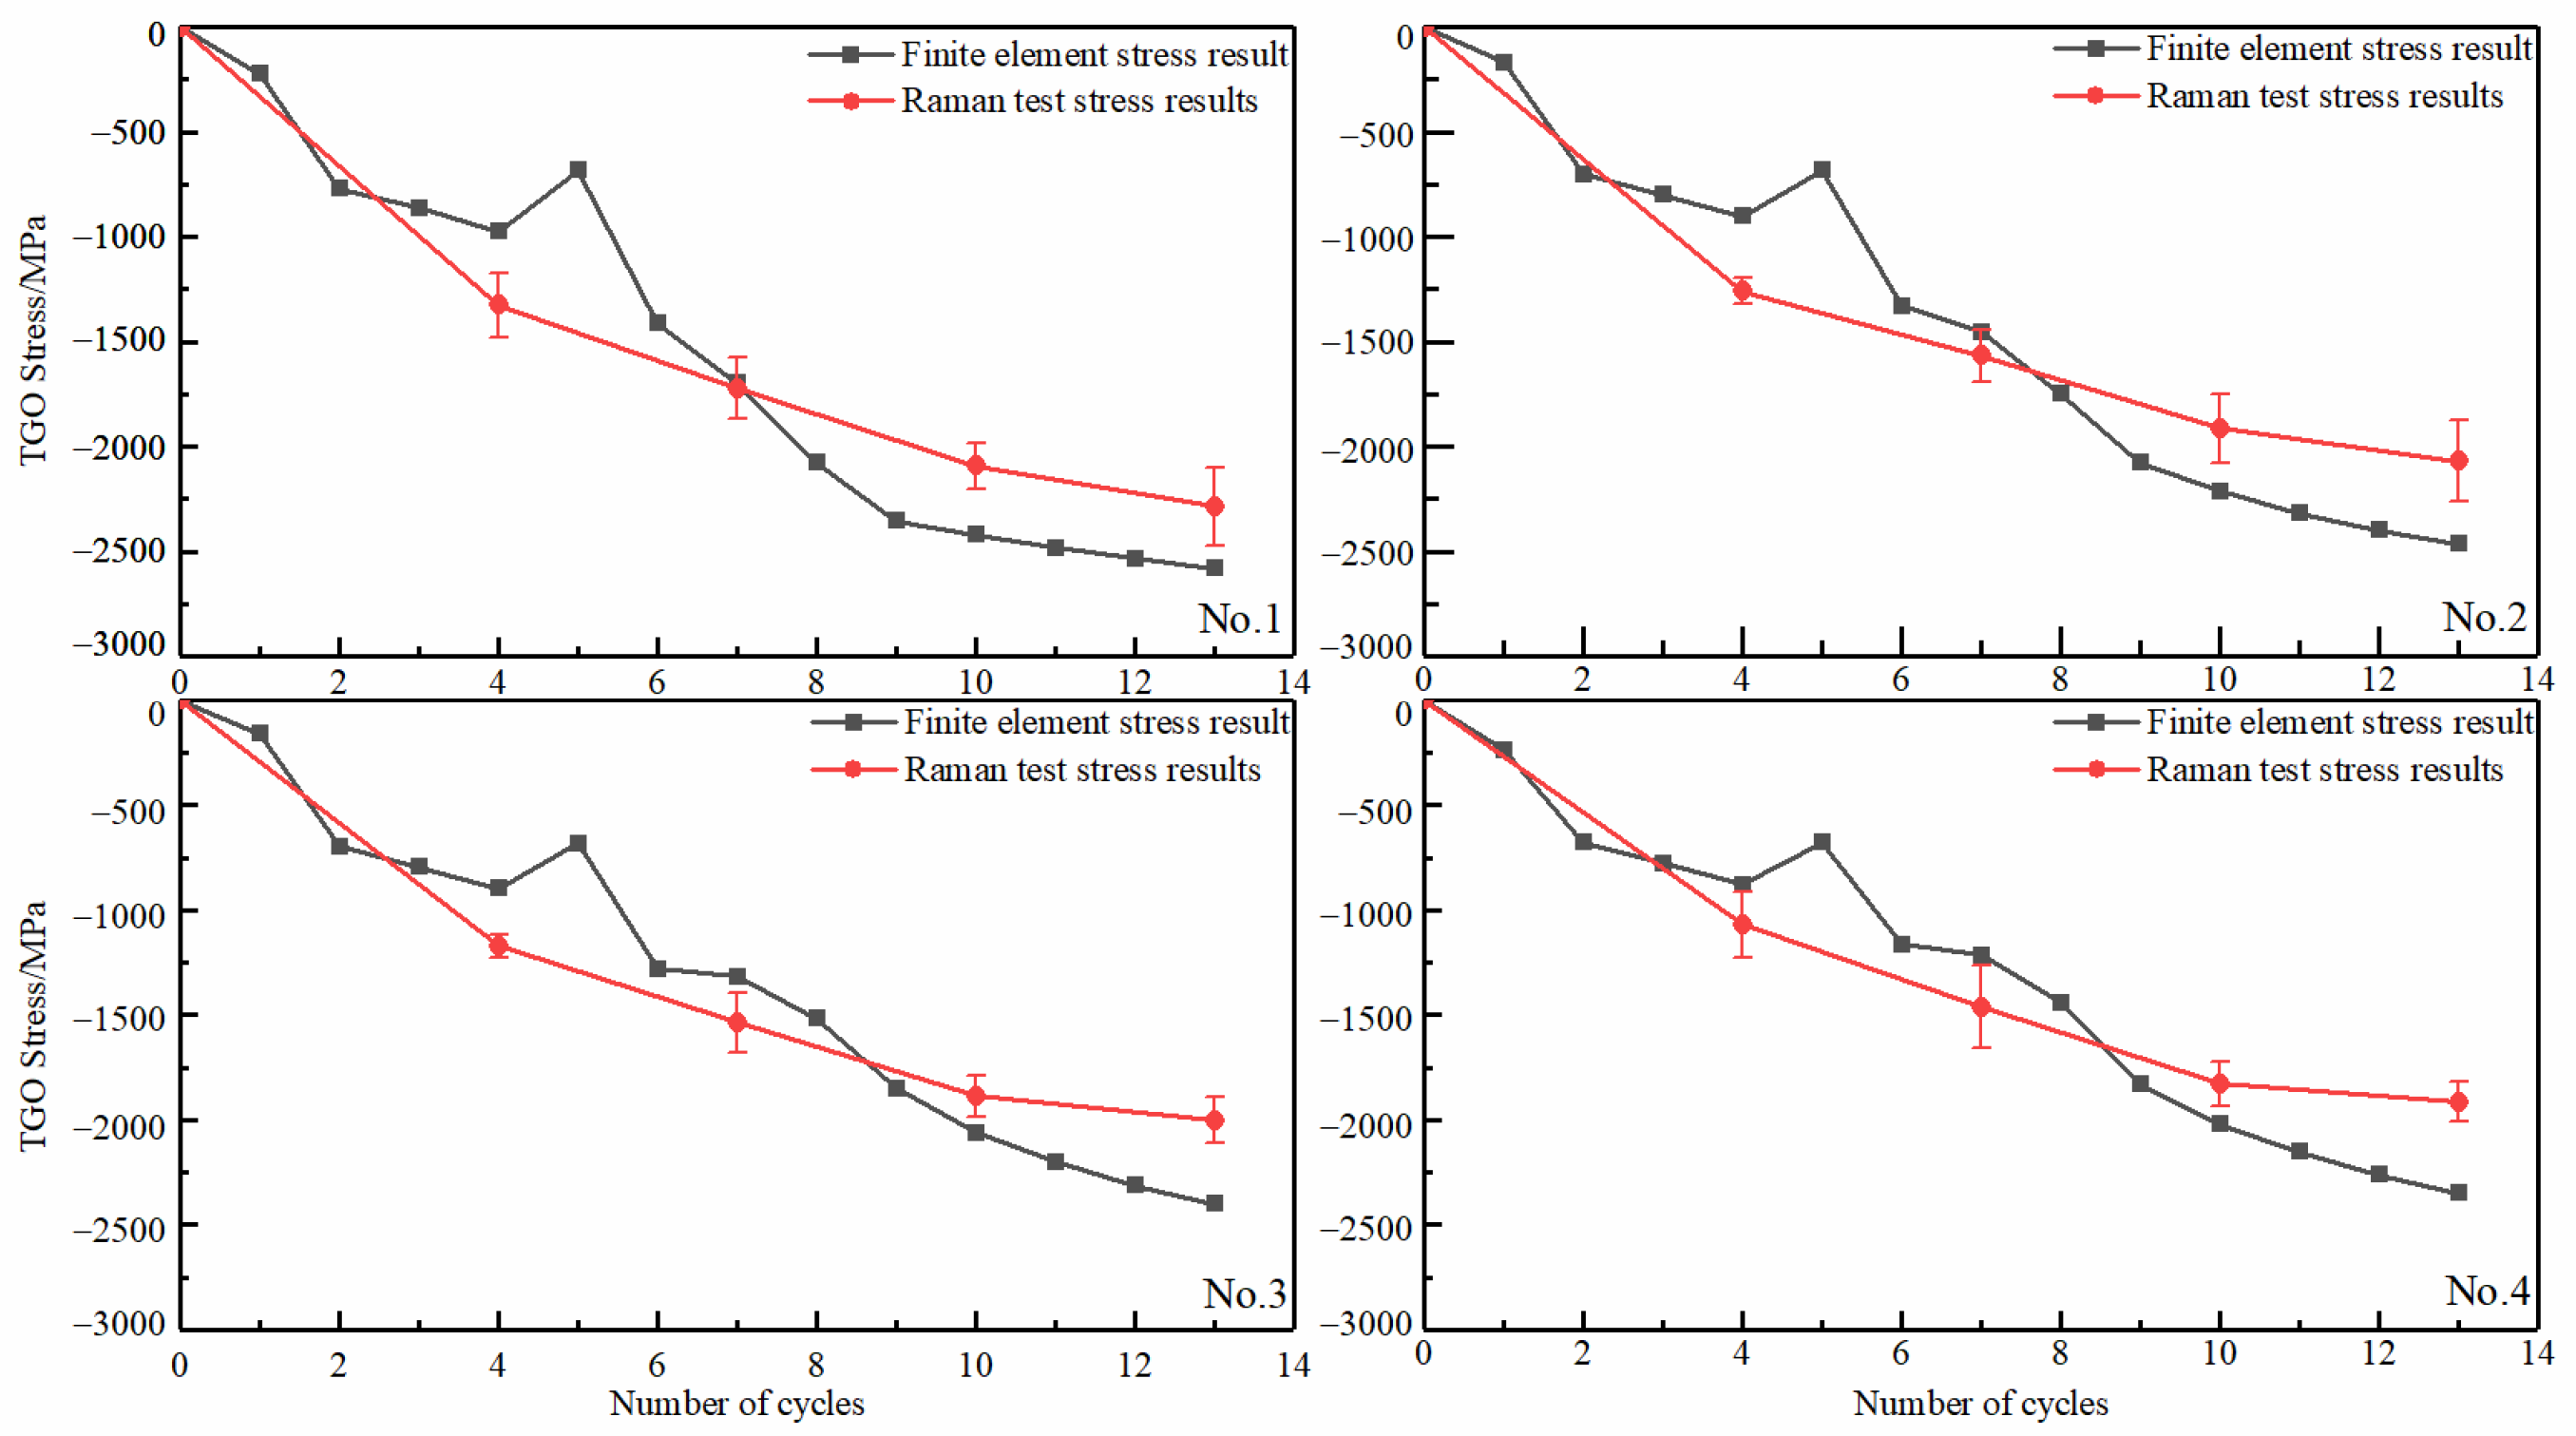
The evolution of residual stresses in the TGO peak region with different interfacial curvature was calculated and analyzed (Figure 13). As can be seen from the test results in the figure (shown as circular points in Figure 13), the increase in the number of thermal cycles increased the compressive stress in the TGO until the end. The rate of compressive stress rise was higher in the Al2O3-dominated growth phase. The presence of MO slowed the rising rate as the oxidation progressed. The TGO residual stress becomes smaller in the same number of cycles as the curvature of the interface increases. The compressive stress of No.1 can reach 2285.3 MPa after the end of the thermal cycle. However, the trend of the stresses was the same, whatever the curvature of the interface changed. The test results were consistent with the results of Xu [29] and with the biaxial stress results (The biaxial stress is the sum of the principal stress vectors in both directions) for each region at room temperature in the finite element model (shown as rectangular points in Figure 13). This result can further confirm the accuracy of the model constructed based on oxidation kinetics at different interfacial curvatures.
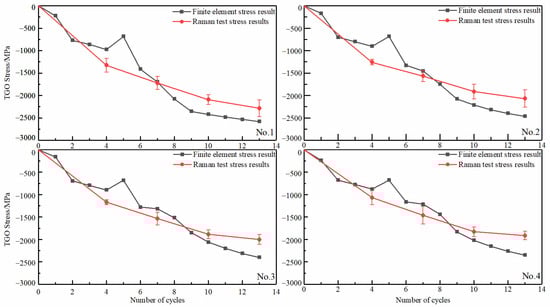
Figure 13.
TGO Residual Stress Evolution in Thermal Cycles under Cooling Phase.
3.2. Stress Level and Distribution in the Oxide Layer under Thermal Cycling
The basic characteristics of stress distribution and evolution under thermal cycling are the prerequisites for understanding the behavior of crack initiation and propagation. The appearance of interfacial cracks is the fundamental reason for the coating’s localized spalling [30,31]. The normal stress σyy is the main cause of crack initiation. Therefore, the stress analysis in this research was focused on the normal stress σyy.
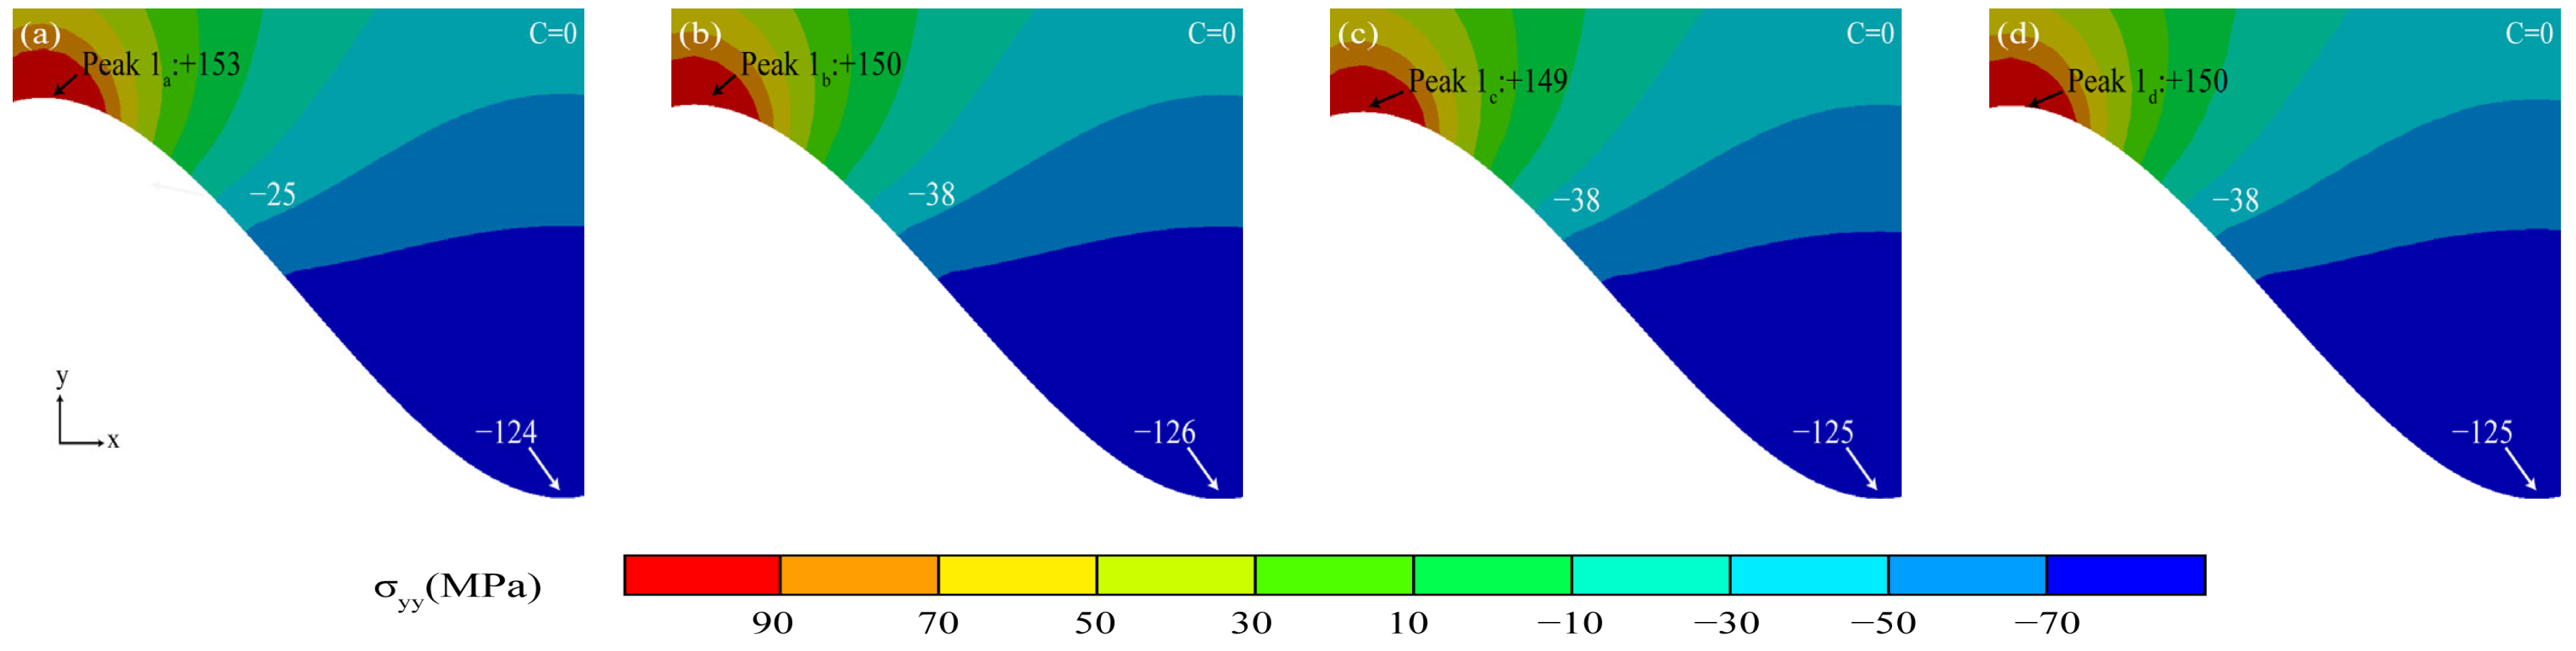
Figure 14 shows the coating stress diagram in the initial state. The maximum tensile stresses were present in the peak region (Peak 1) near the TC/BC interface at different interface curvatures in the initial state, and the values were highly similar. The stress direction was reversed along the direction of the interface.

Figure 14.
(a–d) Stress diagram of the coating in the initial state.
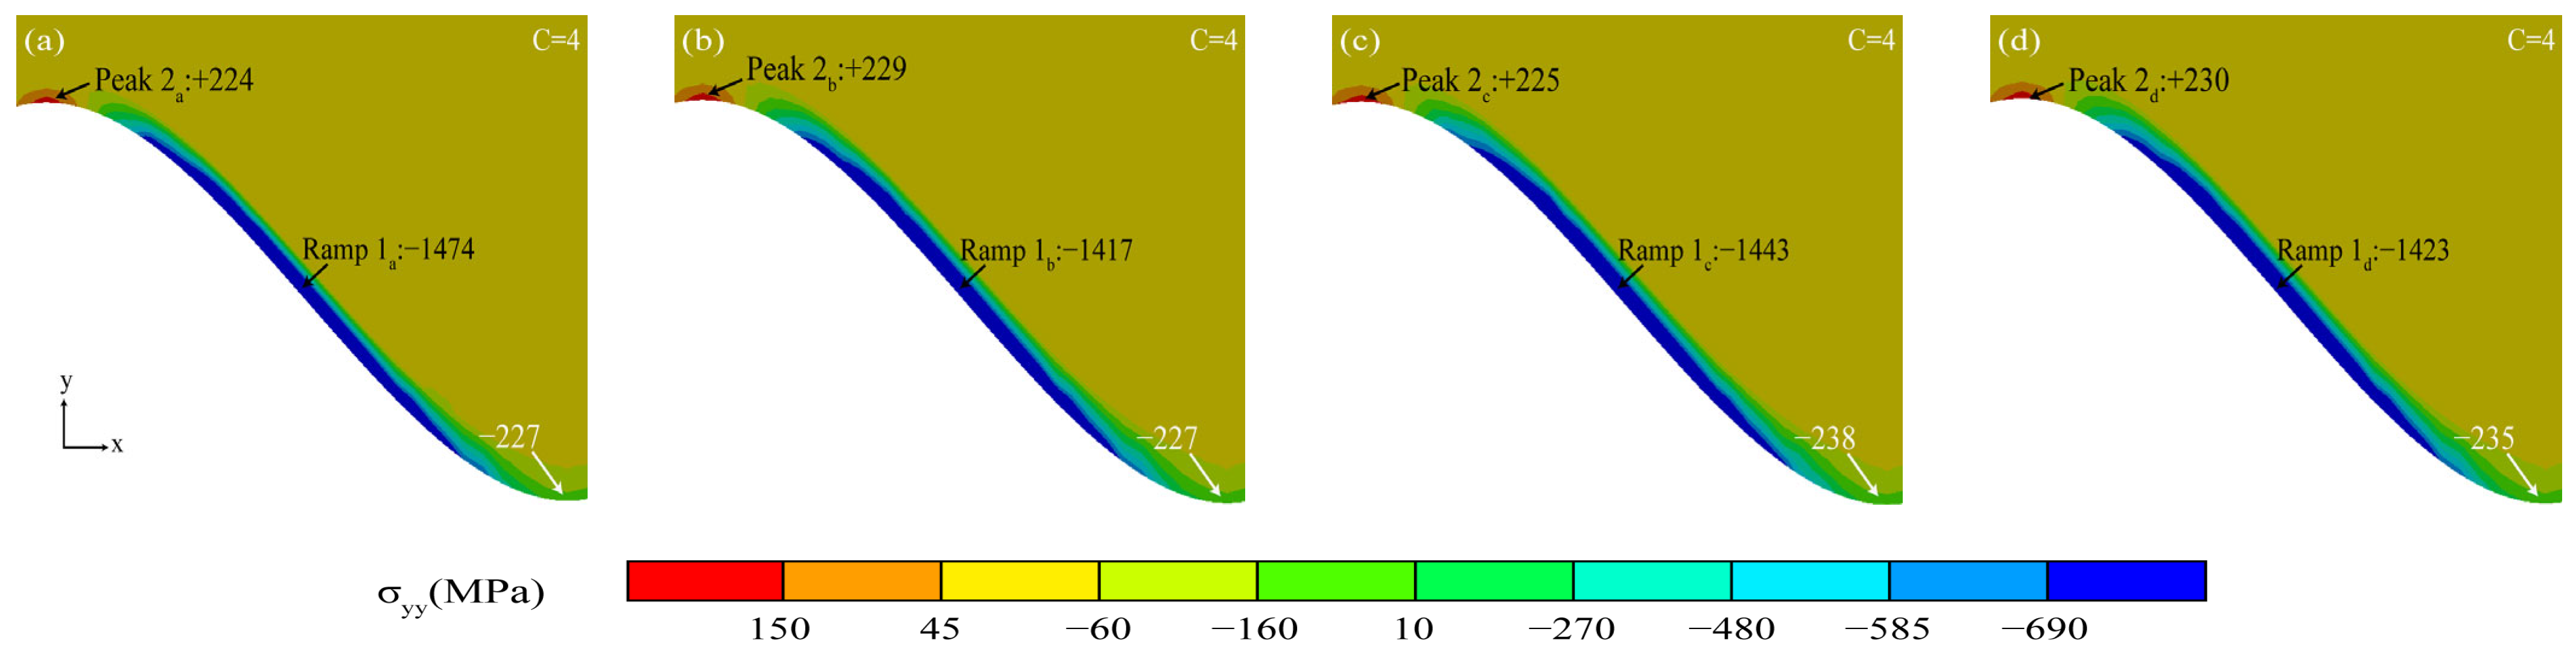
Figure 15 shows the stress diagram of the coating with a dense Al2O3 layer. A dense oxide layer gradually formed with the Al2O3 initiating and thickening. The maximum tensile stress was maintained in the peak region at the TGO/BC interface (Peak 2). However, the stress size in the peak region started to change at different interface curvatures (The no. 1 peak region had the lowest stress, and No.4 had the highest stress). The relatively even compressive stress distribution in the ramp region (Ramp 1) can protect the thermal barrier coating more effectively [32].
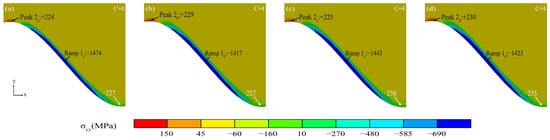
Figure 15.
(a–d) Stress diagram of TGO layer with a dense Al2O3 layer.
Figure 16 shows the stress diagram of the oxide layer under Al2O3 growth. The tensile stress in the peak region (Peak 3) at the TGO/BC interface increased steadily with the growth of Al2O3, and there was a significant gap (No.1 stress was the smallest at +441 MPa; No.4 stress was the largest at +480 MPa). A high stress concentration zone was present at the near-peak position (Near Peak 1) of the TGO/BC interface. The tensile stress was higher and gradually transferred to the ramp region along the interface as the interface curvature increased. The maximum tensile stress (+579 MPa) in the near-peak region clearly exceeded the peak region in No.4. The slow “laminar” thickening of the Al2O3 layer caused the compressive stress zone in the ramp region to move with the TC/TGO interface, and the compressive stress also decreased. As shown by the TGO layer stress comparison with different interface curvatures, the larger the interface curvature, the faster the compressive stress in the ramp region decreased, and the worse the protection effected.
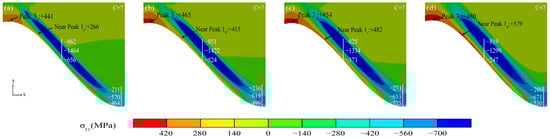
Figure 16.
(a–d) Stress diagram of oxide layer under Al2O3 growth.
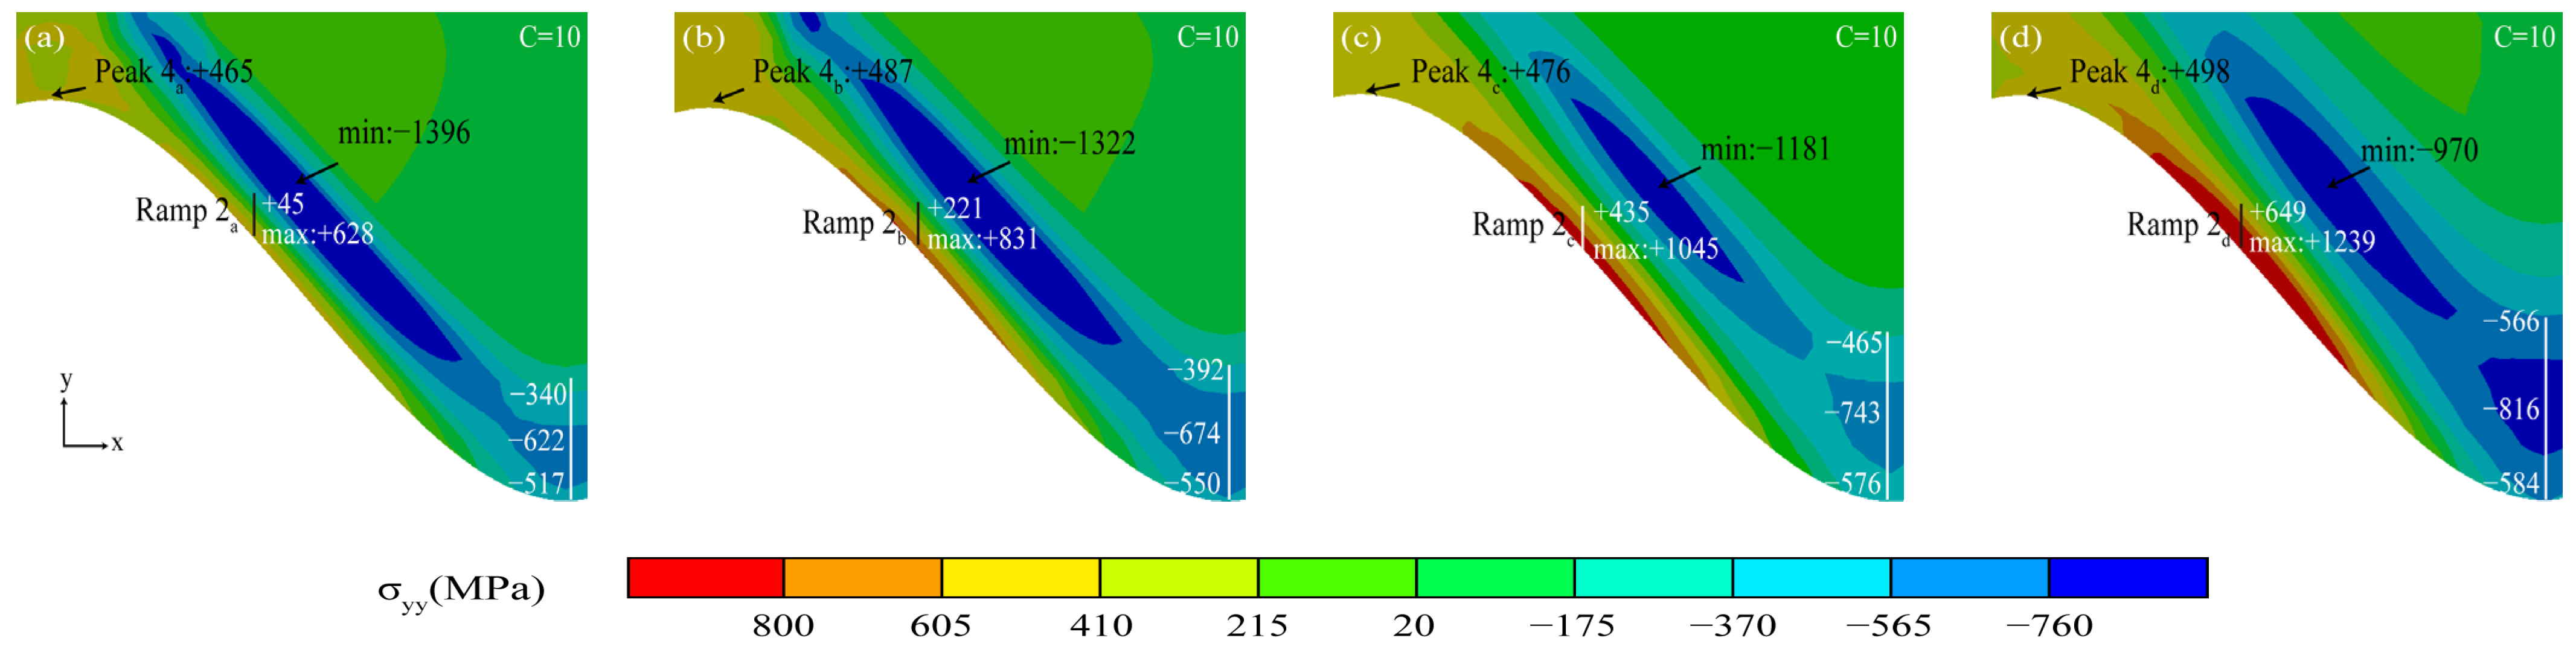
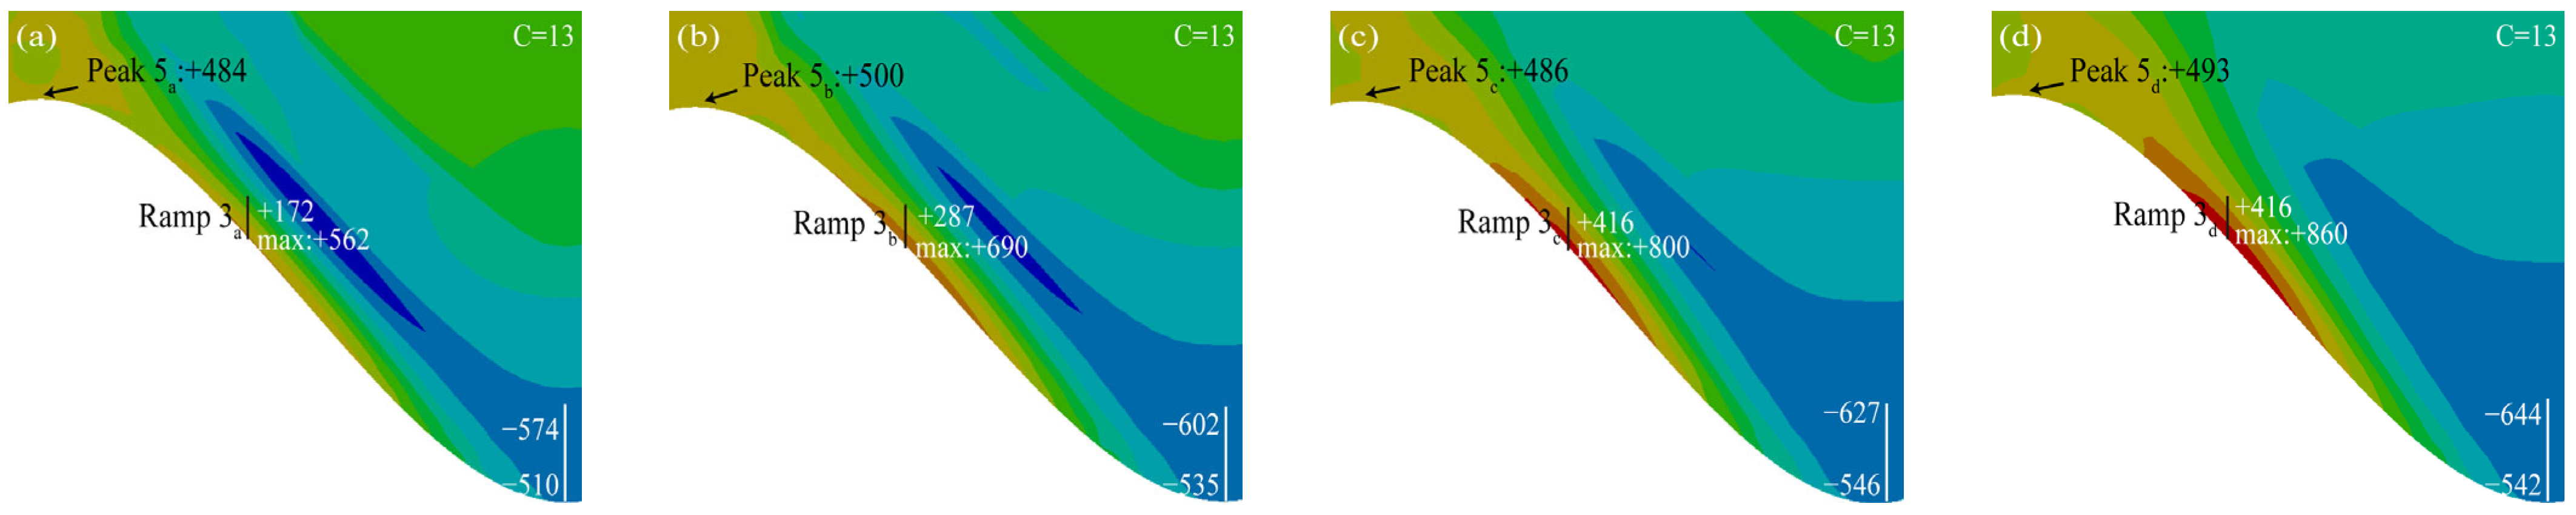
Figure 17 shows the stress diagram for the mixed oxide emergence phase. The tensile stress in the peak region consistently maintained a rising trend with a more significant stress difference (No. 1 had the lowest stress of +465 MPa, and No. 4 had the highest stress of +498 MPa). The maximum tensile stress in the near-peak region was gradually transferred to the ramp region (Ramp 2). That tensile stress was much larger than the tensile stress in the peak region with the MO initiating. As shown by the TGO stress comparison with different interface curvatures, the larger the interface curvature, the higher the maximum tensile stress in the ramp region.
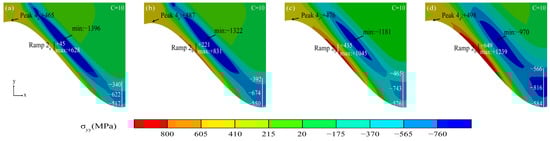
Figure 17.
(a–d) Stress diagram of TGO layer under MO initiating stage.
Figure 18 shows the stress diagram of the TGO layer under the MO rapid growth phase. It can be seen from the figure that the tensile stress in the peak region remained almost unchanged (No.1 tensile stress was the smallest and No.2 tensile stress was the largest at this time). The tensile stress in the ramp area decreases rapidly as the MO grows rapidly. The larger the interface curvature, the higher the decrease rate. The maximum tensile stress eventually at the TGO/BC interface was still concentrated in the ramp region.
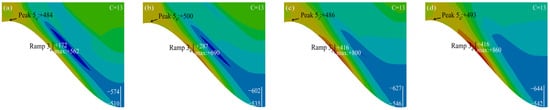

Figure 18.
(a–d) Stress diagram of rapid growth process of mixed oxides.
3.3. Transfer and Evolution Law of Stress in Typical Regions
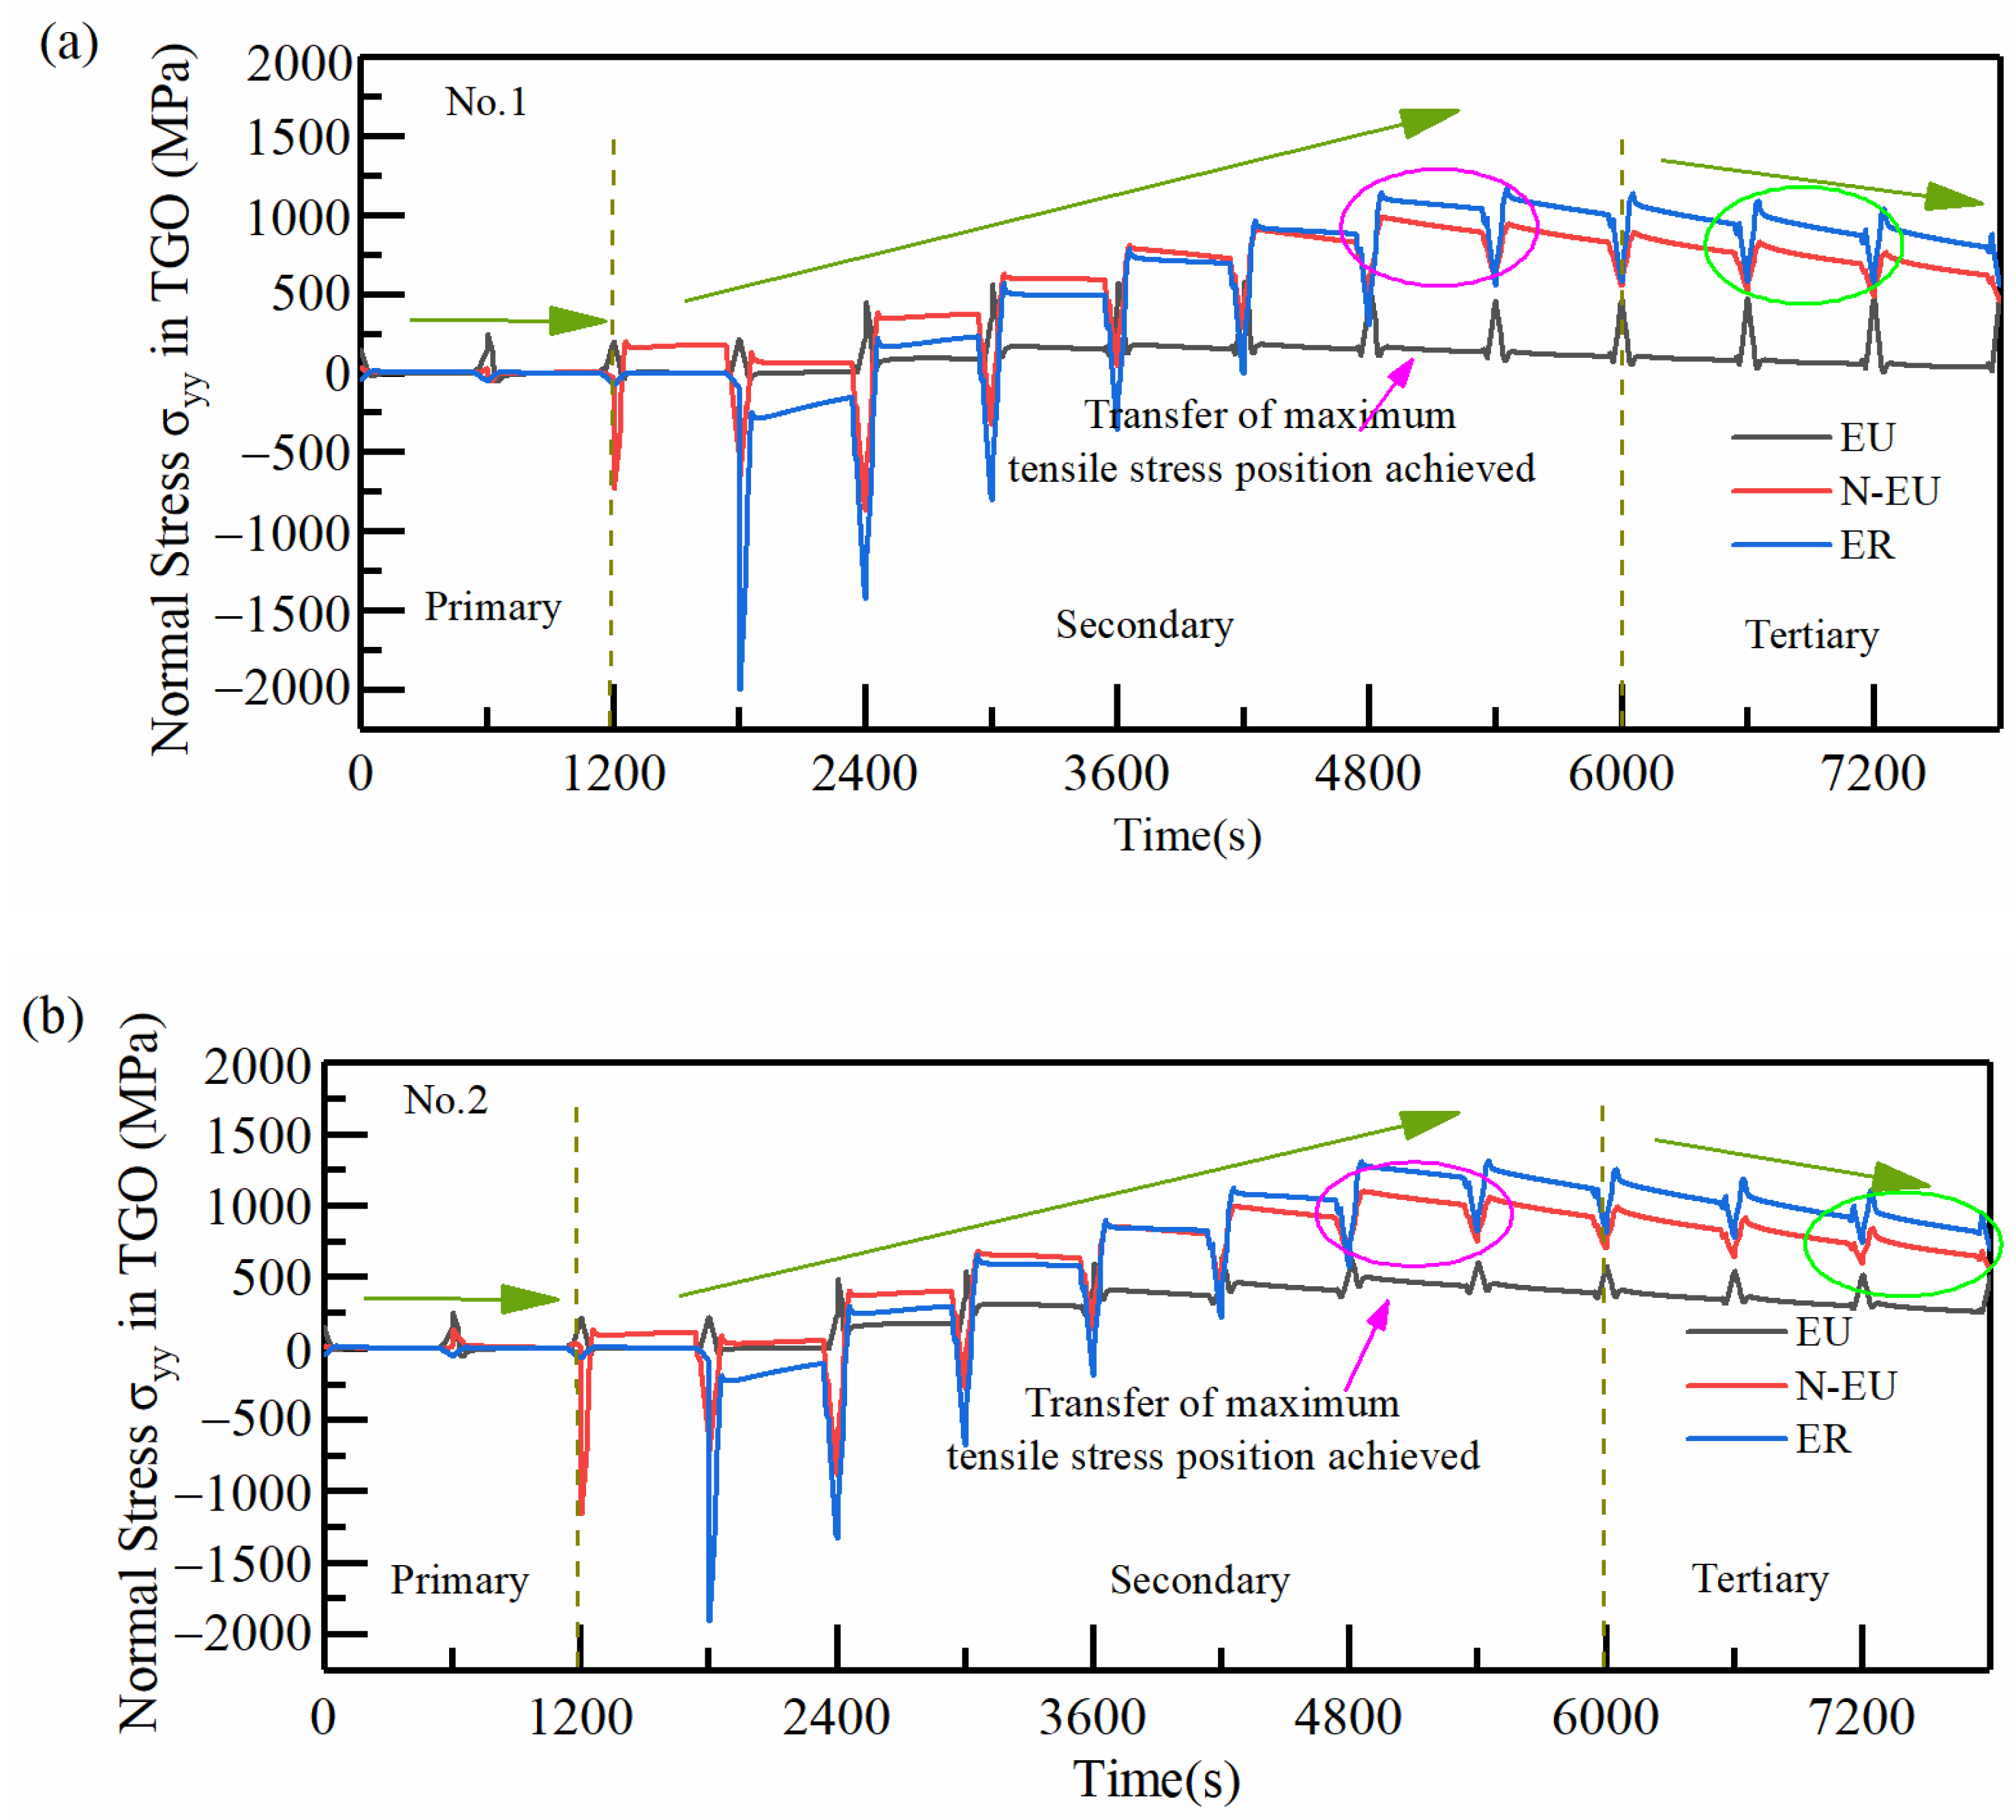
In order to clarify the effect of TGO growth behavior on the distribution and size of coating stresses at different interfacial curvatures, the stresses (σyy) in typical regions with a different number of thermal cycles were extracted and compared for four samples, as shown in Figure 19. Taking No.1 as an example, the hazardous loads at the TGO/BC interface were mainly concentrated in the EU (near the peak region and the ramp region where the tensile stress was close to 0) at the end moment of the first stage of cooling. Large tensile stress (MAX:+201 MPa) existed in the N-EU firstly in the holding state, and the area of dangerous stresses during the holding period began to be transferred in the second stage. The tensile stresses in the three typical regions continuously increased, especially in the ER (the maximum tensile stress existed during the 8th cycle of holding) with the oxidation process. The tensile stresses in N-EU and ER first exceed EU under the cooling phase, completing the region transfer of dangerous stresses under the whole process after entering the 9th thermal cycle (as shown in the pink circular box in Figure 19a). The tensile stress in the typical regions started to decrease with the rapid growth of MO. The dangerous stress transfer phenomenon in the process was over (the tensile stresses in N-EU and ER decreased rapidly below EU in the cooling stage) at the 13th cycle, and the dangerous loads were mainly concentrated in ER, as shown in the green circular box in Figure 19a.
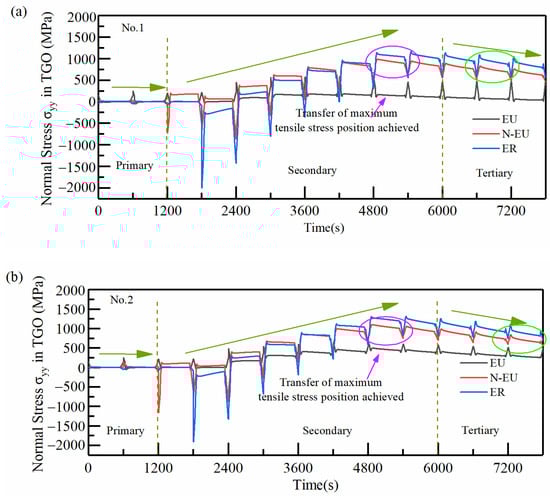
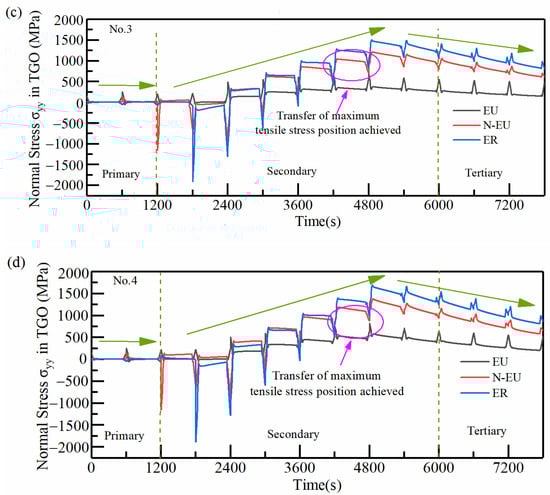
Figure 19.
Effect of thermal cycling cycles on the stress evolution in typical regions of the TGO layer: (a) No.1 (b) No.2 (c) No.3 (d) No.4.
It can be seen from the above regional stress evolution results that the regional transfer phenomenon of dangerous stress in the whole process appeared gradually earlier. Meanwhile, its end time was gradually delayed as the interface curvature increased. The dangerous stress loaded for a longer time in N-EU and ER. The time at which the maximum tensile stresses in N-EU and ER reached the highest point in the thermal cycle also gradually advanced with the increase in the interface curvature. It can be seen that small changes in interfacial curvature can seriously affect the interfacial mismatch stresses in TBCs, especially the timing and size of hazardous loads. The crack initiation and propagation were more easily caused by this phenomenon in coatings with higher interfacial curvature [33].
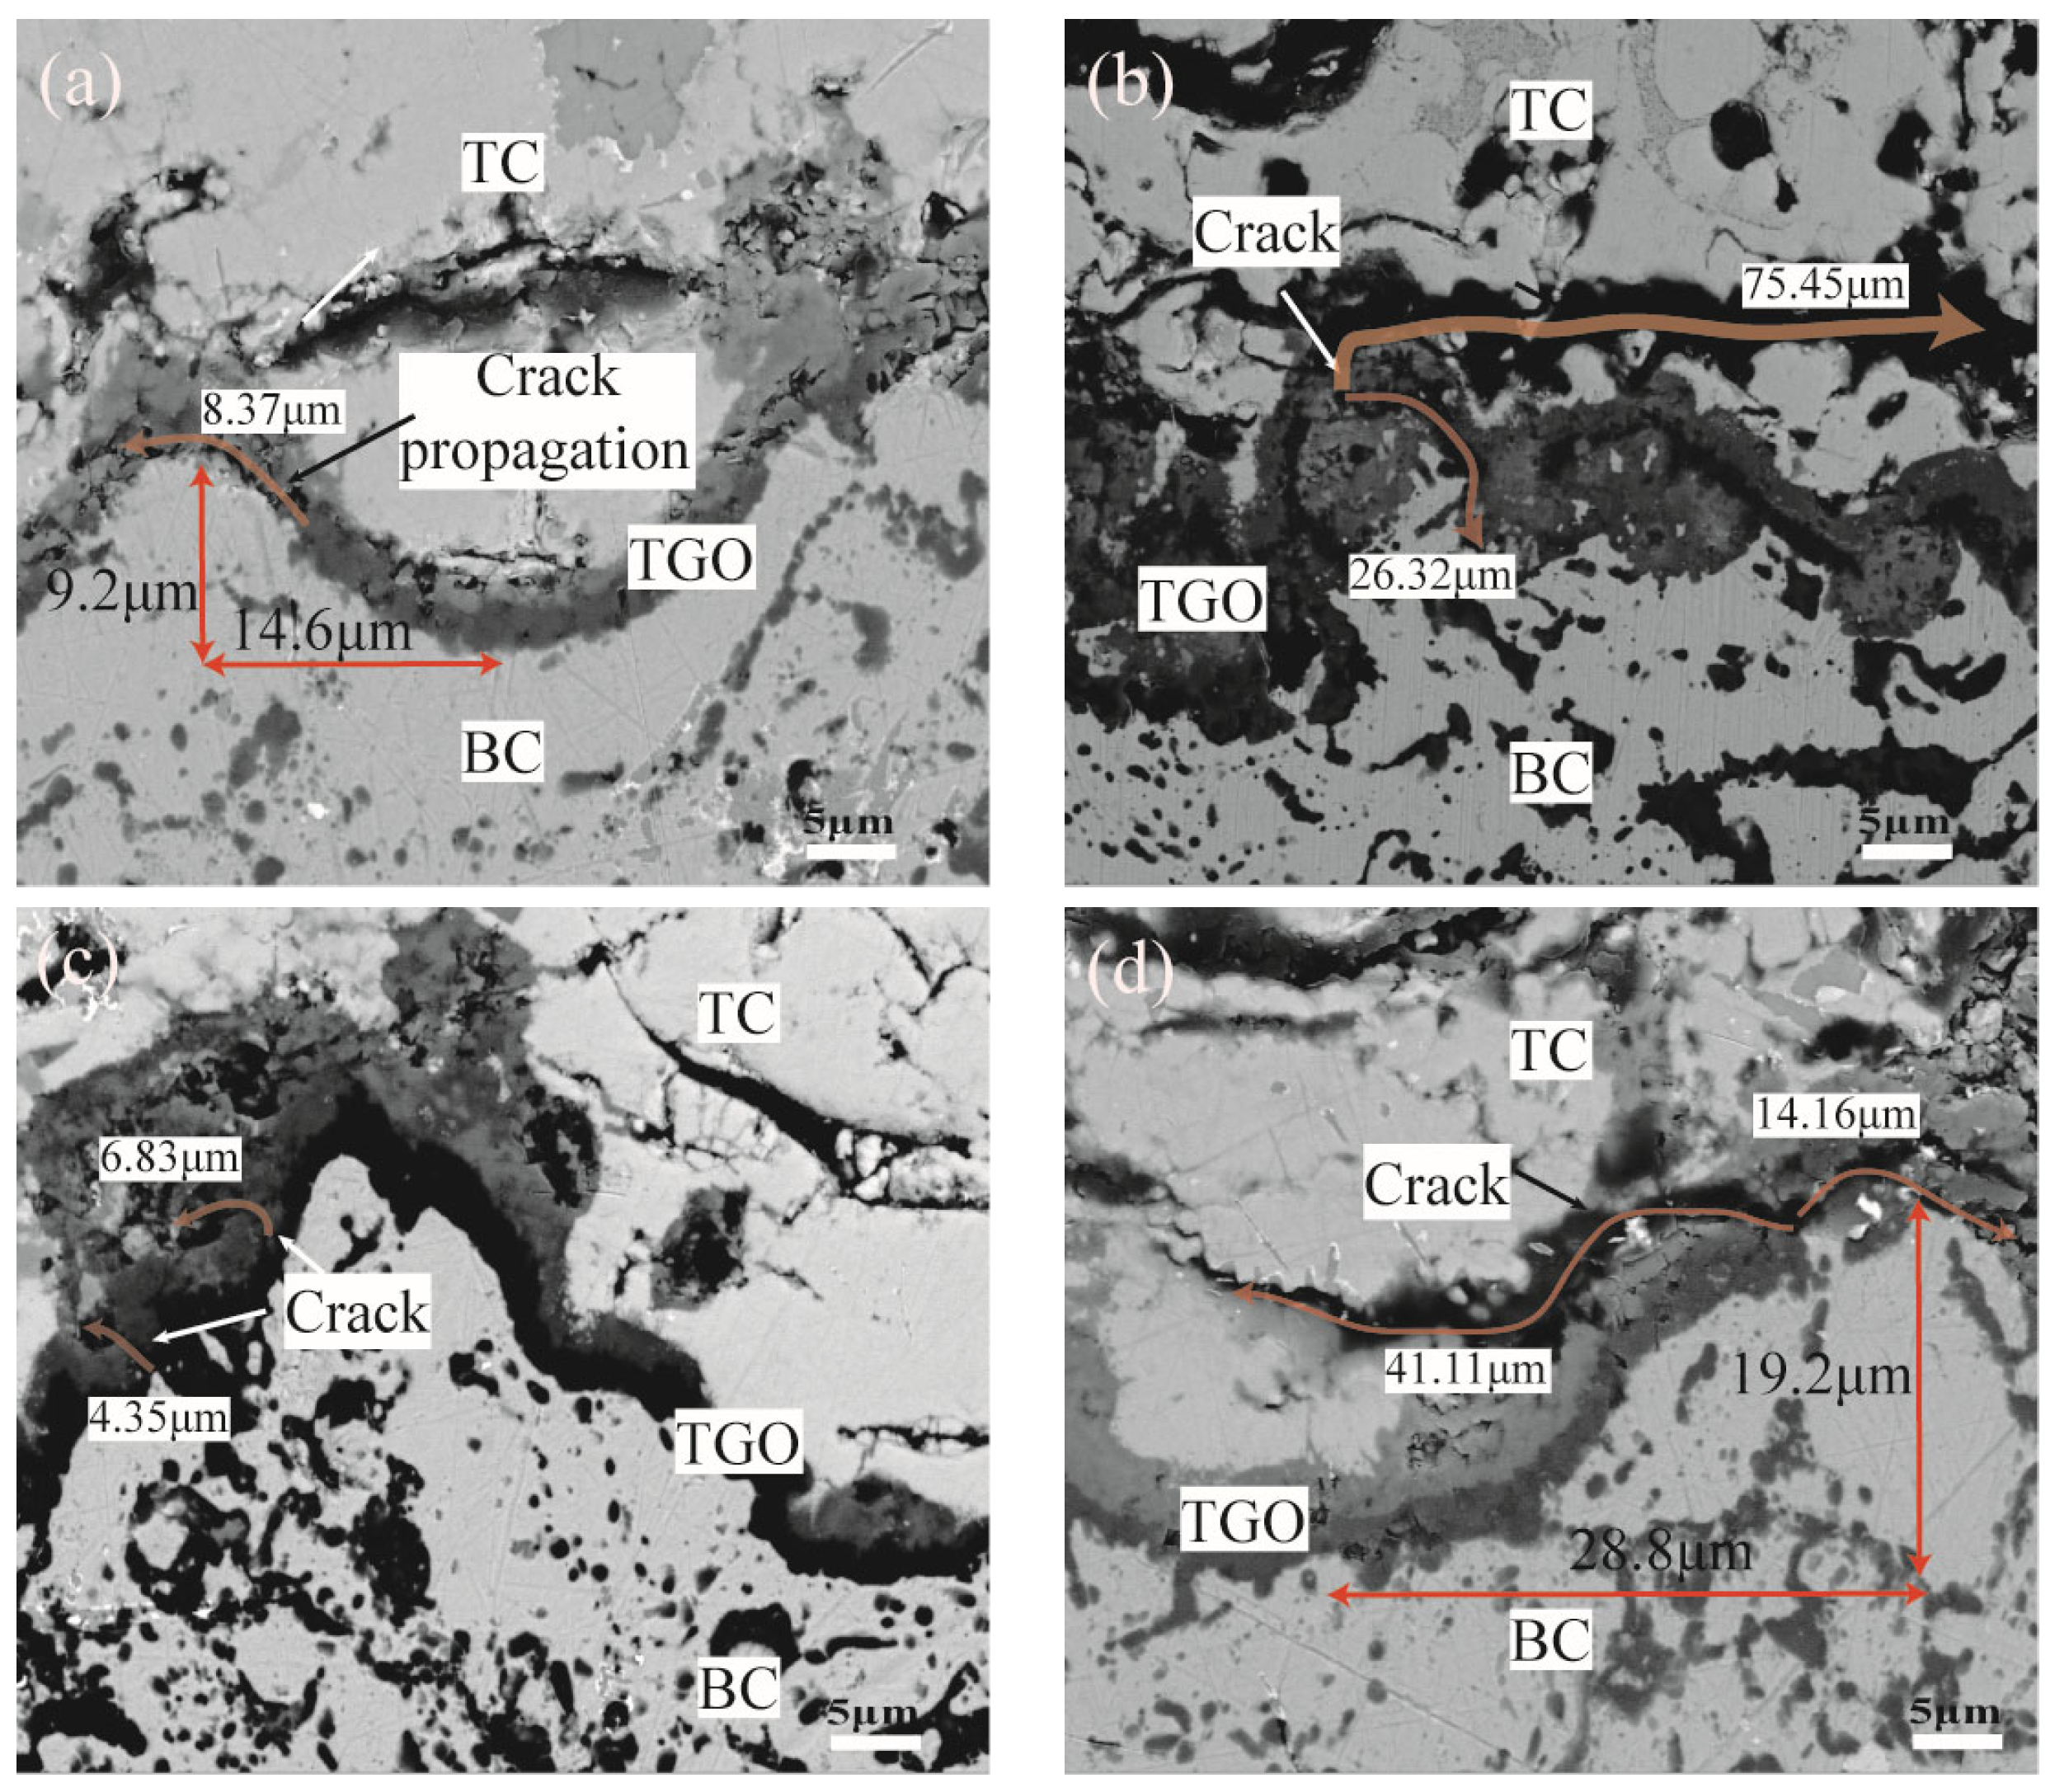
Figure 20 shows the crack initiation and propagation near the TGO/BC interface under thermal cycling. It can be seen that there was crack initiation in the ramp region with large interfacial curvature after 200 thermal cycles (the maximum length was 8.37 μm) when the TGO layer equivalent thickness was 3.25 μm, as shown in the orange curve in Figure 20a. A large-scale crack propagation phenomenon (the maximum length was 75.45 μm) has appeared. The internal oxidation behavior was severe after experiencing 300 thermal cycles, as shown in Figure 20b. The crack initiation (the maximum length was 6.83 μm) appeared in the peak, near-peak, and ramp regions of the small interface curvature sample after 300 thermal cycles when the TGO layer equivalent thickness was 5.36 μm, as shown in Figure 20c. The crack propagation phenomenon (the maximum length was 41.11 μm) was observed after 390 thermal cycles. However, there was no obvious crack penetration, as shown in Figure 20d. This phenomenon was consistent with the conclusions obtained by Karadge [34] and Hille et al. [35].
Figure 20.
TGO/BC Interface Cracking and Propagation (a) Crack initiation at small roughness (b) Crack propagation at small roughness (c) Crack initiation at large roughness (d) Crack propagation at large roughness.
The consecutive average crack lengths were summarized and calculated using five typical SEM images in each group of samples selected for the cracks located at the TGO/BC interface location, as shown in Equation (6).
According to the relationship between the number of thermal cycles, interfacial curvatures, stresses, and crack initiation and propagation lengths, the situation was summarized as shown in Table 6. The influence of interfacial curvature on the evolution of stress and cracking under thermal cycling was reflected by quantitative methods. The crack length expansion rate was slower when the tensile stress was small at different interfacial curvatures, as can be found from the table. The rate of interfacial crack extension increased significantly when dangerous stresses were present [36]. The expansion rate increased with the rise in the interface curvature. It indicated that there was a strong correlation between crack propagation time, rate, and interfacial curvature.
Table 6.
Relationship between the number of cycles, interfacial curvature, stress, and crack length under thermal cycling.
4. Conclusions
A hazardous stress analysis model based on the dynamic growth of oxides with different interfacial curvatures was established. The distribution of stresses and the evolution of cracks in thermal barrier coatings with different interfacial curvatures were revealed. The main conclusions drawn from this research are as follows.
- (1)
- The interfacial curvature has a strong correlation with the growth behavior of the oxide. TGO thickening was fastest in the peak region and was 1.1–1.6 times higher than in other regions. The growth rate of oxides for coatings with different sandblasting treatments rose with increasing interfacial curvature at the same oscillation period aspect ratio. The TGO thickness in the peak region of Kp = 0.198 μm−1 was more than 1.4 times that of Kp = 0.499 μm−1 at the end of the thermal cycle. This phenomenon provided data to support the development of accurate FEM.
- (2)
- High tension stress concentrations were eventually generated in the near TGO/BC ramp region during TGO growth. The magnitude of these stresses increased with increasing interfacial curvature. This was closely related to the geometrical parameter λ/A and the properties of the formed oxide. Taking No. 4 with Kp = 0.499 μm−1 as an example, the maximum tensile stress near the interface was 228 MPa at the beginning of the thermal exposure, which was in the peak region. The maximum tensile stress was gradually transferred to the ramp region as the oxidation progressed. The maximum tensile stress at this time was 1239 MPa, which was more than 5.4 times the early stage of thermal exposure. The stress evolution rules were similar for different interface curvatures. The high tensile stress concentration zones were maintained in the ramp region eventually. Therefore, different interfacial curvatures were the main factor producing the large differences in tensile stress concentration phenomena.
- (3)
- The generation of interfacial tensile stresses was mainly to maintain the continuity of the coating and to accommodate the differences in strain displacement. Therefore, high tensile stresses were highly likely to cause microcracks. With the increase in the interface curvature, the higher the maximum tensile stress at the interface, and the longer the dangerous stress load lasting in the ramp region. This phenomenon led to differences in the crack propagation behavior at different interface curvatures. Taking No. 4 with Kp = 0.499 μm−1 as an example, the crack propagation rate was slow at the early stage of thermal exposure with an average crack length of 1.71 μm, which was nearly consistent with the crack propagation rate of other interfacial curvature samples. The rate of crack extension increases significantly with the appearance of hazardous stresses. The average crack length reached 64.82 μm, which is nearly double the crack length of the Kp = 0.198 μm−1 sample at the end of the thermal cycle. It is indicated that the interface curvature seriously affected the time and speed of rapidly propagating cracks at the TGO/BC interface.
Author Contributions
Conceptualization, K.D.; methodology, L.W.; software, L.W.; validation, Z.W. and T.Z.; formal analysis, J.Y.; investigation, L.W.; writing—original draft preparation, T.Z.; writing—review and editing, K.D.; visualization, Z.W.; supervision, K.D.; project administration, K.D.; funding acquisition, L.W. All authors have read and agreed to the published version of the manuscript.
Funding
This research was funded by Central Universities Basic Research Business Fund Project of the Civil Aviation University of China (No. 3122019189).
Data Availability Statement
Not applicable.
Acknowledgments
The authors would like to thank Liya Sun from Shiyanjia Lab (www.shiyanjia.com) for the Raman analysis.
Conflicts of Interest
The authors declare no conflict of interest.
References
- Padture, N.P. Advanced structural ceramics in aerospace propulsion. Nat. Mater. 2016, 15, 804–809. [Google Scholar] [CrossRef]
- Kalush, A.; Texier, D.; Ecochard, M.; Sirvin, Q.; Choquet, K.; Gheno, T.; Bocher, P. Size effects on high temperature oxidation of MCrAlY coatings processed via APS and HVOF depositions. Surf. Coat. Technol. 2022, 440, 128483. [Google Scholar] [CrossRef]
- Liu, X.H.; Zhu, W.; Guo, J.W.; Song, Z.X.; Xiao, Y.Q. Numerical investigation of the effect of CMAS deposition on the temperature and stress distribution of thermal barrier coatings coated on a turbine blade. Aerosp. Sci. Technol. 2023, 140, 108456. [Google Scholar] [CrossRef]
- Wei, S.; Wang, F.C.; Fan, Q.B.; Zhuang, M. Lifetime prediction of plasma-sprayed thermal barrier coating systems. Surf. Coat. Technol. 2013, 217, 39–45. [Google Scholar] [CrossRef]
- Li, G.R.; Wang, L.S.; Yang, G.J. A novel composite-layered coating enabling self-enhancing thermal barrier performance. Scr. Mater. 2019, 163, 142–147. [Google Scholar] [CrossRef]
- Zeng, Y.Z.; Li, Q.X.; Bai, K.W. Prediction of interstitial diffusion activation energies of nitrogen, oxygen, boron and carbon in bcc, fcc, and hcp metals using machine learning. Comp. Mater. Sci. 2018, 144, 232–247. [Google Scholar] [CrossRef]
- Zhao, P.P.; Shen, M.L.; Gu, Y.; Zhu, S.L.; Wang, F.H. Oxidation behavior of NiCrAlY coatings prepared by arc ion plating using various substrate biases: Effects of chemical composition and thickness of the coatings. Corros. Sci. 2017, 126, 317–323. [Google Scholar] [CrossRef]
- Fan, X.L.; Zhang, W.X.; Wang, T.J.; Sun, Q. The effect of thermally grown oxide on multiple surface cracking in air plasma sprayed thermal barrier coating system. Surf. Coat. Technol. 2012, 208, 7–13. [Google Scholar] [CrossRef]
- Deng, C.; Zheng, R.; Wang, L.; Zhang, S.; Lin, X.; Ding, K.Y. Construction of three-dimensional dynamic growth TGO (thermally grown oxide) model and stress simulation of 8YSZ thermal barrier coating. Ceram. Int. 2022, 48, 5327–5337. [Google Scholar] [CrossRef]
- Wei, Z.Y.; Cai, H.N.; Tahir, A.; Zhang, W.W.; Li, X.F.; Zhang, Y.; Huang, Y.P.; Liu, Y. Stress states in plasma-sprayed thermal barrier coatings upon temperature cycling: Combined effects of creep, plastic deformation, and TGO growth. Ceram. Int. 2019, 45, 19829–19844. [Google Scholar] [CrossRef]
- Hu, Z.C.; Wang, L.; Zhuang, M.X.; Zhang, H.Y.; Li, G.S.; Liu, Y.; Wang, Y.; Yang, Y. Influence of internal oxidation of the bond-coat on the residual stress around the TGO and failure modes of the APS-TBCs: A finite element simulation study. Ceram. Int. 2021, 47, 5364–5373. [Google Scholar] [CrossRef]
- Chen, L.; Meng, G.H.; Li, C.J.; Yang, G.J. Critical scale grain size for optimal lifetime of TBCs. J. Mater. Sci. Technol. 2022, 115, 241–250. [Google Scholar] [CrossRef]
- Che, C.; Wu, G.Q.; Qi, H.Y.; Huang, Z.; Yang, X.G. Uneven growth of thermally grown oxide and stress distribution in plasma-sprayed thermal barrier coatings. Surf. Coat. Technol. 2009, 203, 3088–3091. [Google Scholar] [CrossRef]
- Che, C.; Wu, G.Q.; Qi, H.Y.; Huang, Z.; Yang, X.G. Effect of bond coat surface roughness on oxidation behaviour of air plasma sprayed thermal barrier coatings. Surf. Coat. Technol. 2008, 24, 276–279. [Google Scholar] [CrossRef]
- Ranjbar-Far, M.; Absi, J.; Mariaux, G.; Dubois, F. Simulation of the effect of material properties and interface roughness on the stress distribution in thermal barrier coatings using finite element method. Mater. Des. 2010, 31, 772–781. [Google Scholar] [CrossRef]
- Zhang, D.; Gong, S.; Xu, H.; Wu, Z. Effect of bond coat surface roughness on the thermal cyclic behavior of thermal barrier coatings. Surf. Coat. Technol. 2006, 201, 649–653. [Google Scholar] [CrossRef]
- Amada, S.; Hirose, T. Influence of grit blasting pre-treatment on the adhesion strength of plasma sprayed coatings: Fractal analysis of roughness. Surf. Coat. Technol. 1998, 102, 132–137. [Google Scholar] [CrossRef]
- Chen, W.R.; Archer, R.; Huang, X.; Marple, B.R. TGO growth and crack propagation in a thermal barrier coating. J. Therm. Spray Technol. 2008, 17, 858–864. [Google Scholar] [CrossRef]
- Nath, S.; Manna, I.; Majumdar, J.D. Kinetics and mechanism of isothermal oxidation of compositionally graded yttria stabilized zirconia (YSZ) based thermal barrier coating. Corros. Sci. 2014, 88, 10–22. [Google Scholar] [CrossRef]
- Martena, M.; Botto, D.; Fino, P.; Sabbadini, S.; Gola, M.M.; Badini, C. Modelling of TBC system failure: Stress distribution as a function of TGO thickness and thermal expansion mismatch. Eng. Fail. Anal. 2006, 13, 409–426. [Google Scholar] [CrossRef]
- Seo, D.; Ogawa, K.; Nakao, Y.; Miura, H.; Shoji, T. Influence of high-temperature creep stress on growth of thermally grown oxide in thermal barrier coatings. Surf. Coat. Technol. 2009, 203, 1979–1983. [Google Scholar] [CrossRef]
- Kao, D.B.; Mcvittie, J.P.; Nix, W.D.; Saraswat, K.C. Two-dimensional thermal oxidation of silicon. II. Modeling stress effects in wet oxides. IEEE Trans. Electron. Dev. 1988, 35, 25–37. [Google Scholar] [CrossRef]
- Wang, Z.; Wang, Z.; Zhang, T.; Guo, W.; Dai, H.; Ding, K.Y. Reliability evaluation of thermal barrier coatings for engine combustion chambers based on Monte-Carlo simulation. Surf. Coat. Technol. 2022, 448, 128923. [Google Scholar] [CrossRef]
- Xu, R.; Fan, X.L.; Zhang, W.X.; Wang, T.J. Interfacial fracture mechanism associated with mixed oxides growth in thermal barrier coating system. Surf. Coat. Technol. 2014, 253, 139–147. [Google Scholar] [CrossRef]
- Liu, P.F.; Jiang, P.; Sun, Y.L.; Xu, R.; Wang, T.J.; Zhang, W.X. Numerical Analysis of stress evolution in thermal barrier coating system during two-stage growth of heterogeneous oxide. Ceram. Int. 2021, 47, 14311–14319. [Google Scholar] [CrossRef]
- Grabner, L. Spectroscopic technique for the measurement of residual stress in sintered Al2O3. J. Appl. Phys. 1978, 49, 580–583. [Google Scholar] [CrossRef]
- Lipkin, D.M.; Clarke, D.R. Measurement of the stress in oxide scales formed by oxidation of alumina-forming alloys. Oxid. Met. 1996, 45, 267–280. [Google Scholar] [CrossRef]
- He, J.; Clarke, D.R. Coefficients for chromium-doped sapphire. J. Am. Ceram. Soc. 1995, 78, 1347–1353. [Google Scholar] [CrossRef]
- Xu, B.Q.; Luo, L.R.; Lu, J.; Zhao, X.F.; Xiao, P. Effect of residual stress on the spallation of the thermally-grown oxide formed on NiCoCrAlY coating. Surf. Coat. Technol. 2020, 381, 125112. [Google Scholar] [CrossRef]
- Ahmadian, S.; Jordan, E.H. Explanation of the effect of rapid cycling on oxidation, rumpling, microcracking and lifetime of air plasma sprayed thermal barrier coatings. Surf. Coat. Technol. 2014, 244, 109–116. [Google Scholar] [CrossRef]
- Xiao, Y.Q.; Yang, L.; Zhu, W.; Zhou, Y.C.; Pi, Z.P.; Wei, Y.G. Delamination mechanism of thermal barrier coatings induced by thermal cycling and growth stresses. Eng. Fail. Anal. 2021, 121, 105202. [Google Scholar] [CrossRef]
- Ding, K.Y.; Zhang, T.; Wang, Z.; Jun, Y.; Guo, W.S.; Yang, Y.F. Effect of Thermal Growth Oxide Composition and Morphology on Local Stresses in Thermal Barrier Coatings. Materials 2022, 15, 8442. [Google Scholar] [CrossRef] [PubMed]
- Wei, Z.Y.; Cai, H.N.; Zhao, S.D. Comprehensive understanding of horizontal and vertical crack effects on failure mechanism of lamellar structured thermal barrier coatings. Ceram. Int. 2022, 48, 8143–8154. [Google Scholar] [CrossRef]
- Karadge, M.; Zhao, X.; Preuss, M.; Xiao, P. Microtexture of the thermally grown alumina in commercial thermal barrier coatings. Scr. Mater. 2006, 54, 639–644. [Google Scholar] [CrossRef]
- Hille, T.S.; Turteltaub, S.; Suiker, A.S.J. Oxide growth and damage evolution in thermal barrier coatings. Eng. Fract. Mech. 2011, 78, 2139–2152. [Google Scholar] [CrossRef]
- Yu, Q.M.; Cen, L.; Wang, Y. Numerical study of residual stress and crack nucleation in thermal barrier coating system with plane model. Ceram. Int. 2018, 44, 5116–5123. [Google Scholar] [CrossRef]


Disclaimer/Publisher’s Note: The statements, opinions and data contained in all publications are solely those of the individual author(s) and contributor(s) and not of MDPI and/or the editor(s). MDPI and/or the editor(s) disclaim responsibility for any injury to people or property resulting from any ideas, methods, instructions or products referred to in the content. |
© 2023 by the authors. Licensee MDPI, Basel, Switzerland. This article is an open access article distributed under the terms and conditions of the Creative Commons Attribution (CC BY) license (https://creativecommons.org/licenses/by/4.0/).