Article

Study on Cavitation Corrosion Properties of Titanium Alloy Radiation Rod with Different Roughnesses for Ultrasonic Casting

1
School of Mechanical Engineering, Henan University of Engineering, No. 1, Xianghe Road, Zhengzhou 451191, China
2
School of Electrical and Information Engineering, Henan University of Engineering, No. 1, Xianghe Road, Zhengzhou 451191, China
*
Author to whom correspondence should be addressed.
Coatings 2023, 13(9), 1632; https://doi.org/10.3390/coatings13091632
Submission received: 29 July 2023 / Revised: 13 September 2023 / Accepted: 15 September 2023 / Published: 18 September 2023
(This article belongs to the Special Issue Enhanced Mechanical Properties of Metals by Surface Treatments)

Abstract

:
To determine the mechanism of corrosion damage caused by cavitation, the properties of titanium alloy radiation rods with different roughnesses in 2A14 aluminum melt for ultrasonic casting were studied. The corrosion morphology, weight loss/cavitated area, reaction layer and microhardness of surface section were observed, and the collapse of a single cavitation bubble was simulated. The weight loss/cavitated area caused by the physical impact of cavitation accounted for 6.4% to 8.6% of the total weight loss/cavitated area. The corrosion product was TiAl3. The reactant appeared at the Al/Ti solid–liquid interface in 4 min and the reaction layer appeared in 10 min under different roughnesses. The thickness of the work hardening layer on the surface of the material could reach 160 μm. The results show that the greater the roughness of titanium alloy in aluminum melt, the greater the rate of weight loss/cavitated area and the greater the maximum pressure in the process of cavitation bubble collapse. The evolution of the hardened layer depended on the stripping rate of the surface material caused by cavitation corrosion and the work hardening rate of the surface layer. This study provides insights to develop a new homemade Ti alloy radiation rod with better resistance to corrosion in the ultrasonic casting.

1. Introduction

With the development of modern industry, aluminum alloy has great application prospects in industrial applications [1,2,3,4]. However, with the continuous upgrading of industrial applications, higher requirements are put forward for the performance of aluminum alloys, and aluminum alloys produced by traditional casting methods can no longer meet this requirement [5,6]. By incorporating ultrasound into the traditional aluminum alloy casting process, the special acoustic cavitation effect of ultrasound [7,8,9,10] can refine the grain of aluminum melt and remove impurities and gases in the melt, and so aluminum alloys with stronger properties are obtained.
In the past few decades, many researchers have conducted research on the forming of aluminum alloys [11,12,13,14,15]. Ultrasonic melt treatment technology (UST) has significant advantages compared to other forming technologies, so this article mainly introduces ultrasonic processing technology [16,17,18,19,20]. Eskin [21] first proposed the application of ultrasound to lightweight alloy melts in 1997. The science and practicability of ultrasonic treatment of light alloy melt and the development of acoustic cavitation in liquid metal were discussed. The results showed that ultrasonic melt treatment could improve the degassing rate and fine filtration rate of light alloy melt, and had a great influence on the microstructure of the ingot. Li [22] prepared a new extrusion cast Al-5Cu-XLI-0.5Mn-0.3mg-0.15Ti (x = 0.3, 0.6, 0.9, 1.2 wt%) alloy (referred to as Al-5Cu-xLi alloy) using ultrasonic treatment. The addition of ultrasound could refine grain size and had a significant degassing effect. Guang [23] prepared high-strength magnesium aluminum bimetallic materials using a new type of lost foam composite casting (LFCC) method enhanced by ultrasonic vibration. Under the action of ultrasound, the Mg2Si and Al12Mg17 phases and Al12Mg17+δ-Mg at the interface were obviously refined, and the microhardness of the entire interface became more uniform. The shear strength of the Mg/Al bimetal was significantly increased by 86.5%, reaching 69 MPa. Moussa [24] used ultrasonic melt technology to prepare high-performance nickel–aluminum bronze (NAB) alloy with finer α(Cu) and β’ phases, and the finer intermetallic κII phase particles were evenly distributed along the casting structure. The above research proved the effectiveness of ultrasound on the melt and also ignored the effect of corrosion of the ultrasonic rod. The radiation rod used for ultrasound was damaged due to the influence of ultrasonic cavitation performance during actual work [25,26]. The main reason for the damage of radiation rod was cavitation corrosion. On the one hand, cavitation corrosion reduced the service life of the radiation rod; on the other hand, the corrosion products generated were harmful to the performance of the alloy. These are important reasons limiting the popularity of the ultrasonic casting industry. Titanium alloy has excellent physical and chemical properties compared to other materials [27]. Therefore, it was necessary to study the cavitation corrosion mechanisms of the titanium alloy radiation rod. The study of cavitation corrosion mechanisms has guiding significance for future corrosion protection [28,29].
The application of ultrasonic technology was accompanied by the emergence of the cavitation phenomenon. Many scholars have conducted comprehensive and systematic research on the factors affecting the process of cavitation corrosion. These factors include the material and surface condition of the radiation rod, the characteristics of the liquid medium, and the external environment [25,30]. In the process of ultrasonic casting, the ultrasonic performance is given priority, followed by the study of reducing the cavitation corrosion of the radiation rod. Once the casting of a certain metal is determined, its physical properties cannot be changed. Therefore, the study of cavitation corrosion of radiation rod is mainly affected by the properties of the radiation rod and the working environment. These include the pressure gradient on the surface of the radiation rod, material properties [31,32], surface morphology [33,34], and others.
In this paper, the factors affecting the cavitation corrosion of a titanium alloy radiation rod in aluminum melt were further studied. However, there are few reports on the mechanism of the influence of the surface roughness of the radiation rod on the degree of cavitation corrosion. The corrosion morphology, weight loss/cavitated area, surface roughness, reaction layer of profile, and microhardness of the surface section of the radiation rod were observed before and after the experiment, and the collapse of a single cavitation bubble was simulated. Therefore, this paper deeply studies the cavitation corrosion mechanism of a radiation rod with different surface roughnesses in high-temperature aluminum melt. This provides certain technical references for the study of cavitation corrosion mechanisms of radiation rods in the process of ultrasonic casting.

2. Experimental Details

2.1. Materials

2A14 aluminum alloy is an aluminum alloy with a nominal composition of Al-0.90Si-4.20Cu-0.45Mg-0.11Zn-0.67Mn-0.10Ti-0.10Ni-0.050Fe (wt%) [35]. The titanium alloy (Ti-6Al-4V) used for ultrasonic casting is grade TC4 [36], which belongs to the (α + β) titanium alloy family. It has several advantages, such as good corrosion resistance, a small density (4.5 g/cm3), high specific strength, high toughness, and welding performance. It has good resistance to high-temperature/pressure environments, good amplitude conductivity, and good adaptability to other external environmental factors in ultrasonic casting. Table 1 shows its composition [37].

2.2. Sample Preparation

UST was exerted through a sonotrode [36] that was driven by a high-power ultrasonic generator (DEEPSEA, Shanghai, China, input frequency, 20 kHz; input power 2.5 kW). The output power and current were 400 W and 6 A, respectively. The sonotrode was immersed at a position of 30 mm below the melt surface. The experimental setup is shown in Figure 1, which mainly includes a resistance furnace, a graphite silicon carbide crucible, an inert gas protection device, and an ultrasonic vibration system.
The entire process of cavitation corrosion includes the incubation period of cavitation and acceleration period of cavitation. The duration of the cavitation incubation period increases linearly with the increase of the roughness of the material surface morphology, and the original traces generated by machining on the material surface have a significant impact on it [38]. The incubation period of cavitation corrosion is a typical period that reflects the whole process of cavitation corrosion. Therefore, the corrosion experiment of the ultrasonic radiation rod in this paper was divided into two parts. One part was a corrosion experiment on titanium alloy blocks. The corrosion morphology, weight loss/cavitated area, changes of roughness, and reaction layer of the sample were observed and counted. The other part was the corrosion experiment on the ultrasonic radiation rod. In contrast to the first part of the corrosion experiment, there was no block sample at the lower end of the radiation rod, and only cavitation corrosion experiments were conducted on titanium alloy radiation rods. In this part, the growth of the reaction layer and the microhardness change of the surface section were studied. The TC4 titanium alloy, which was the same as the radiation rod used in ultrasonic casting, was machined into a sample size of 25 mm × 25 mm × 10 mm with four different roughnesses. The samples with roughnesses from small to large were represented as A, B, C, and D. Sample A was precision-machined on a lathe, while samples B, C, and D were all rough-machined, with roughnesses of 0.4, 7.2, 9.5, and 9.8 Ra (μm), respectively. Aluminum alloy 2A14 with a weight of about 5 kG was used for each crucible experiment. The aluminum melt temperature was about 700 °C, and the experiment durations were 12, 24, 36, and 48 min, respectively. After the experiment was completed, the samples were soaked with HCl and NaOH to remove the residual aluminum on the surface, and then cleaned and dried with alcohol and acetone to calculate weight loss/cavitated area. The weight loss rate/cavitated area is given by:
v t = ( m m t ) / t s
where vt, m, mt, s, and t are defined as the weight loss rate at this moment, weight, weight at this moment, cavitated area, and experimental time, respectively.

2.3. Microstructural Characterization

A super-depth-of-field microscope (VHX5000) was used to examine the sample’s surface. The original surface roughness value of the sample was tested with an optical surface profiler (Wyko, Beijing, China, Wyko NT9100). High-resolution scanning electron microscopy (TESCAN, Brno, Czech Republic, SEM: MIRA3 TESCAN) revealed the morphology of the corroded sample surface and section reaction layer. Energy-dispersive X-ray spectroscopy (Carl Zeiss, Berlin, Germany, EDS: OxfordX-Max20) and X-ray diffraction (XRD) in a Rigaku 600 X-ray diffractometer were used to perform qualitative analysis and identify the reaction layer components. The XRD was operated at a scanning speed of 0.02°/s at 40 kV using CuKα radiation (wavelength λKα = 1.54056 Å). A microhardness tester (Changzhou Sanfeng Instrument Technology Co., Ltd, Changzhou, China, HV-1000A) with a diamond indenter was used to measure the original surface microhardness of the sample. The sample size was 10 mm × 10 mm × 2 mm. Standard loads of 1.5 N were added. The operation time was 2 s. The microhardness values were obtained based on five different positions whenever possible.

3. Results and Discussion

3.1. Weight Loss Rate/Cavitated Area

Table 2 summarizes the data of initial weight, weight after ultrasonic treatment, and total weight loss of samples with different roughnesses. After 48 min of experiment, samples A: 0.4 Ra, B: 7.2 Ra, C: 9.5 Ra, and D: 9.8 Ra lost 8.1 mg, 12.7 mg, 17.3 mg, and 15.4 mg in weight, respectively. Sample A lost the least weight, while sample C lost the most weight. The rougher the surface, the greater the number of pits. A greater number of pits results in greater contact area between the pit and the aluminum melt. The aluminum melt rapidly spreads on the surface of the titanium alloy, leading to a higher rate of diffusion, chemical reaction, and recombination of Ti atoms in the aluminum melts. The change of weight loss rate/cavitated area over time of the sample under the ultrasonic condition of aluminum melt at 700 °C is shown in Table 3. Furthermore, the curve of weight loss rate/cavitated area of the block sample is drawn as shown in Figure 2.
The roughness was proportional to the weight loss rate/cavitated area, and the weight loss rate/cavitated area of the four groups of samples was relatively stable. The average weight loss rate/cavitated area of samples A: 0.4 Ra, B: 7.2 Ra, C: 9.5 Ra, and D: 9.8 Ra were 0.17 mg·min/cm2, 0.28 mg·min/cm2, 0.40 mg·min/cm2, and 0.32 mg·min/cm2. According to the weight loss rate/cavitated area, the weight loss/cavitated area of titanium alloy caused by physical impact due to the cavitation effect accounted for 6.4%~8.6% of the total weight loss/cavitated area.

3.2. Corrosion Morphology and Corrosion Products

3.2.1. Corrosion Morphology

Figure 3 shows the corrosion morphology of samples with different roughnesses subjected to ultrasonic vibration for 48 min. Obvious plastic deformation appeared on the surface of the samples. The etch pits formed as shown in Figure 3a were small in size, ranging from 1 to 5 μm in diameter. Each etch pit was scattered on the surface of the material in a separate form. However, the continuous expansion of some of the previously formed tiny etch pits gradually brought the original separated etch pits closer and closer, so that the walls of the etch pits were staggered together to form a continuous band of larger pits. Figure 3b shows that a continuous etch pit wall had been completely formed. The mechanical effect of the cavitation effect was concentrated at the etch pit, resulting in plastic deformation at the bottom of the slope between the bumps. The material was repeatedly pushed to the edge of the bump, resulting in a long waveform fold, and the entire surface presented a honeycomb. The average radius of the etch pit was 7–8 μm. The radius of the etch pit in Figure 3c,d continued to expand to more than 10 μm. The depth continued to deepen. Smaller etch pits merged to form larger and deeper etch pits. There were signs of reactants falling off at the grain boundary, exhibiting serious plastic deformation with astatic. The plastic deformation caused the honeycomb corrosion products to escape more easily from the radiation rod. The surface became rough and the morphology was still honeycomb. From Figure 3d, it was found that cracks began to form at the junction of the etch pits, with a trend of accelerating weight loss/cavitated area. This was caused by the impact wave formed by the cavitation effect and the continuous impact of the microjet. The continuous etch pits were affected by the cavitation effect and the continuous impact of the microjet, and fell off from the radiation rod, causing damage to the radiation rod. The evolution process of surface morphology was also different due to the influence of ultrasonic cavitation and different original surface roughness. The change process of etch pits on surfaces with small roughness lagged behind that on surfaces with large roughness.

3.2.2. Corrosion Product

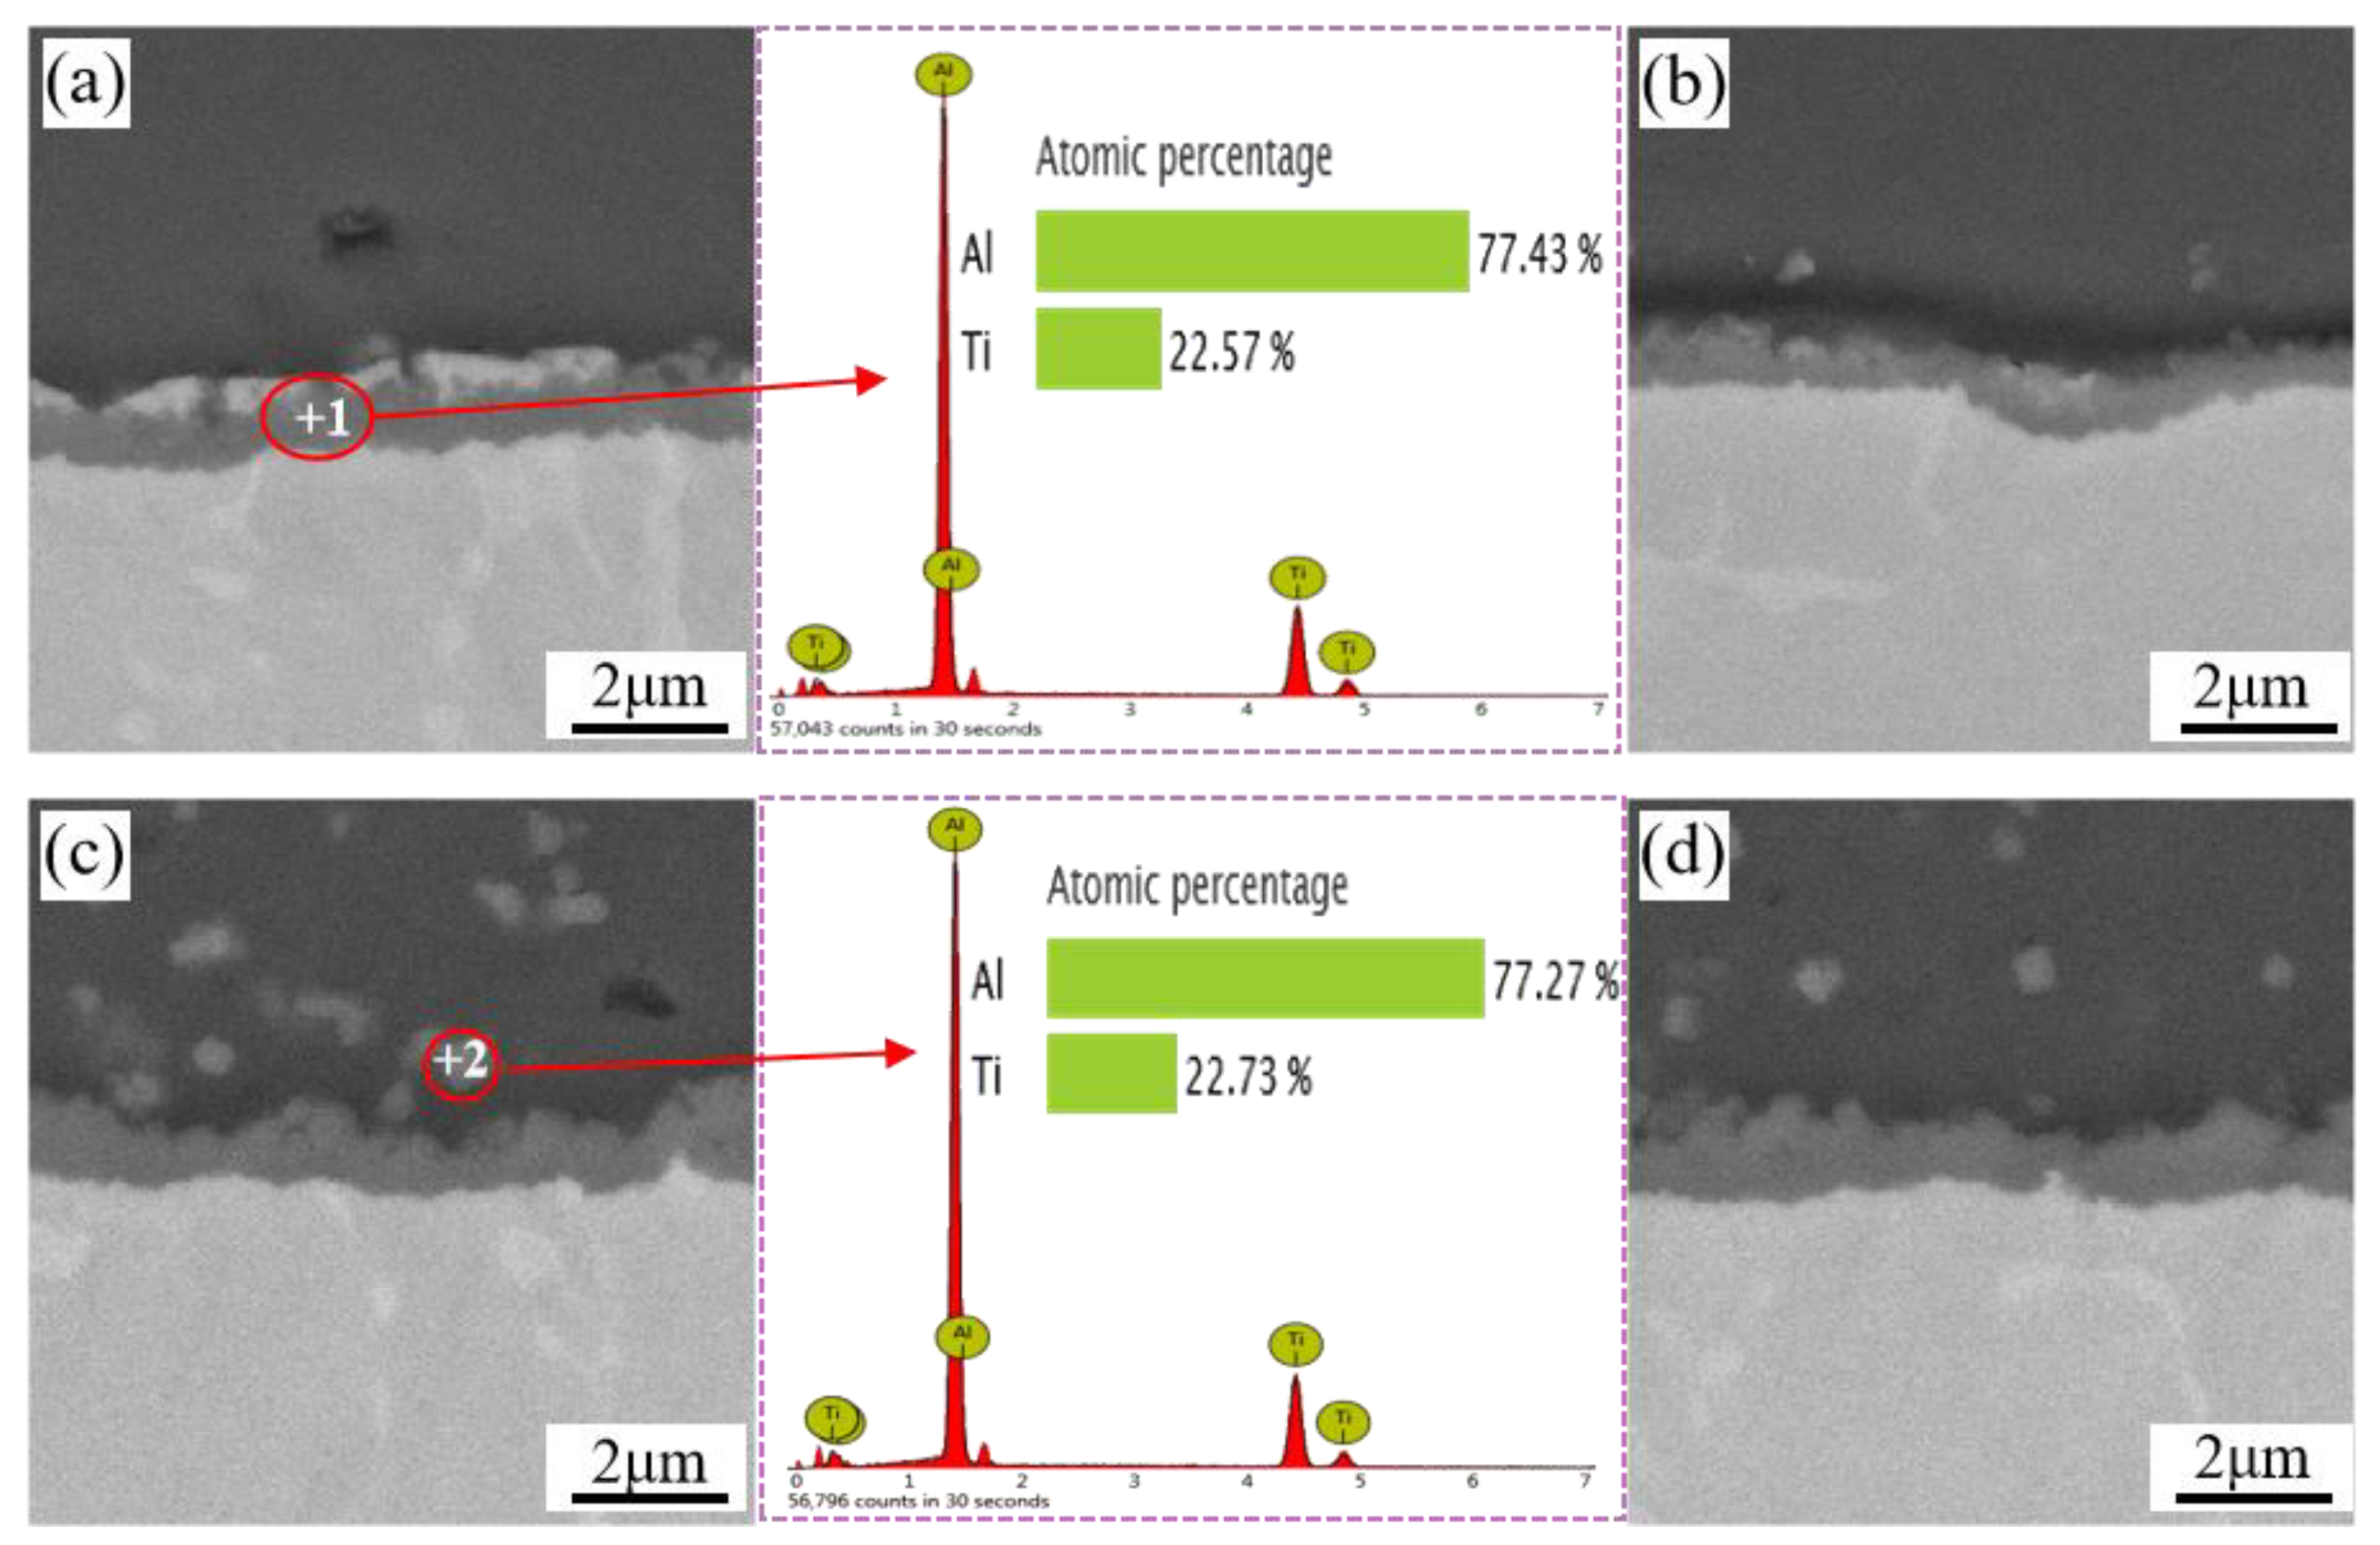
Figure 4a shows the profile microstructure of reaction layer of sample A: 0.4 Ra after ultrasonic application for 48 min in aluminum melt at 700 °C. It can be seen from the figure that a reaction layer is formed at the Al/Ti interface. XRD and EDS were used to analyze the reaction layer of the sample profile. Figure 4b,c show the energy spectrum of point 1 and the XRD analysis of the interface, respectively. The results of EDS elemental content showed that the atomic ratios of Al and Ti at the spectral points were about 3:1, indicating that this substance was TiAl3. This fund can provide an insight to develop a new homemade Ti alloy radiation rod with better resistance to corrosion in the ultrasonic melt processing.

3.3. Reaction Layer Morphology

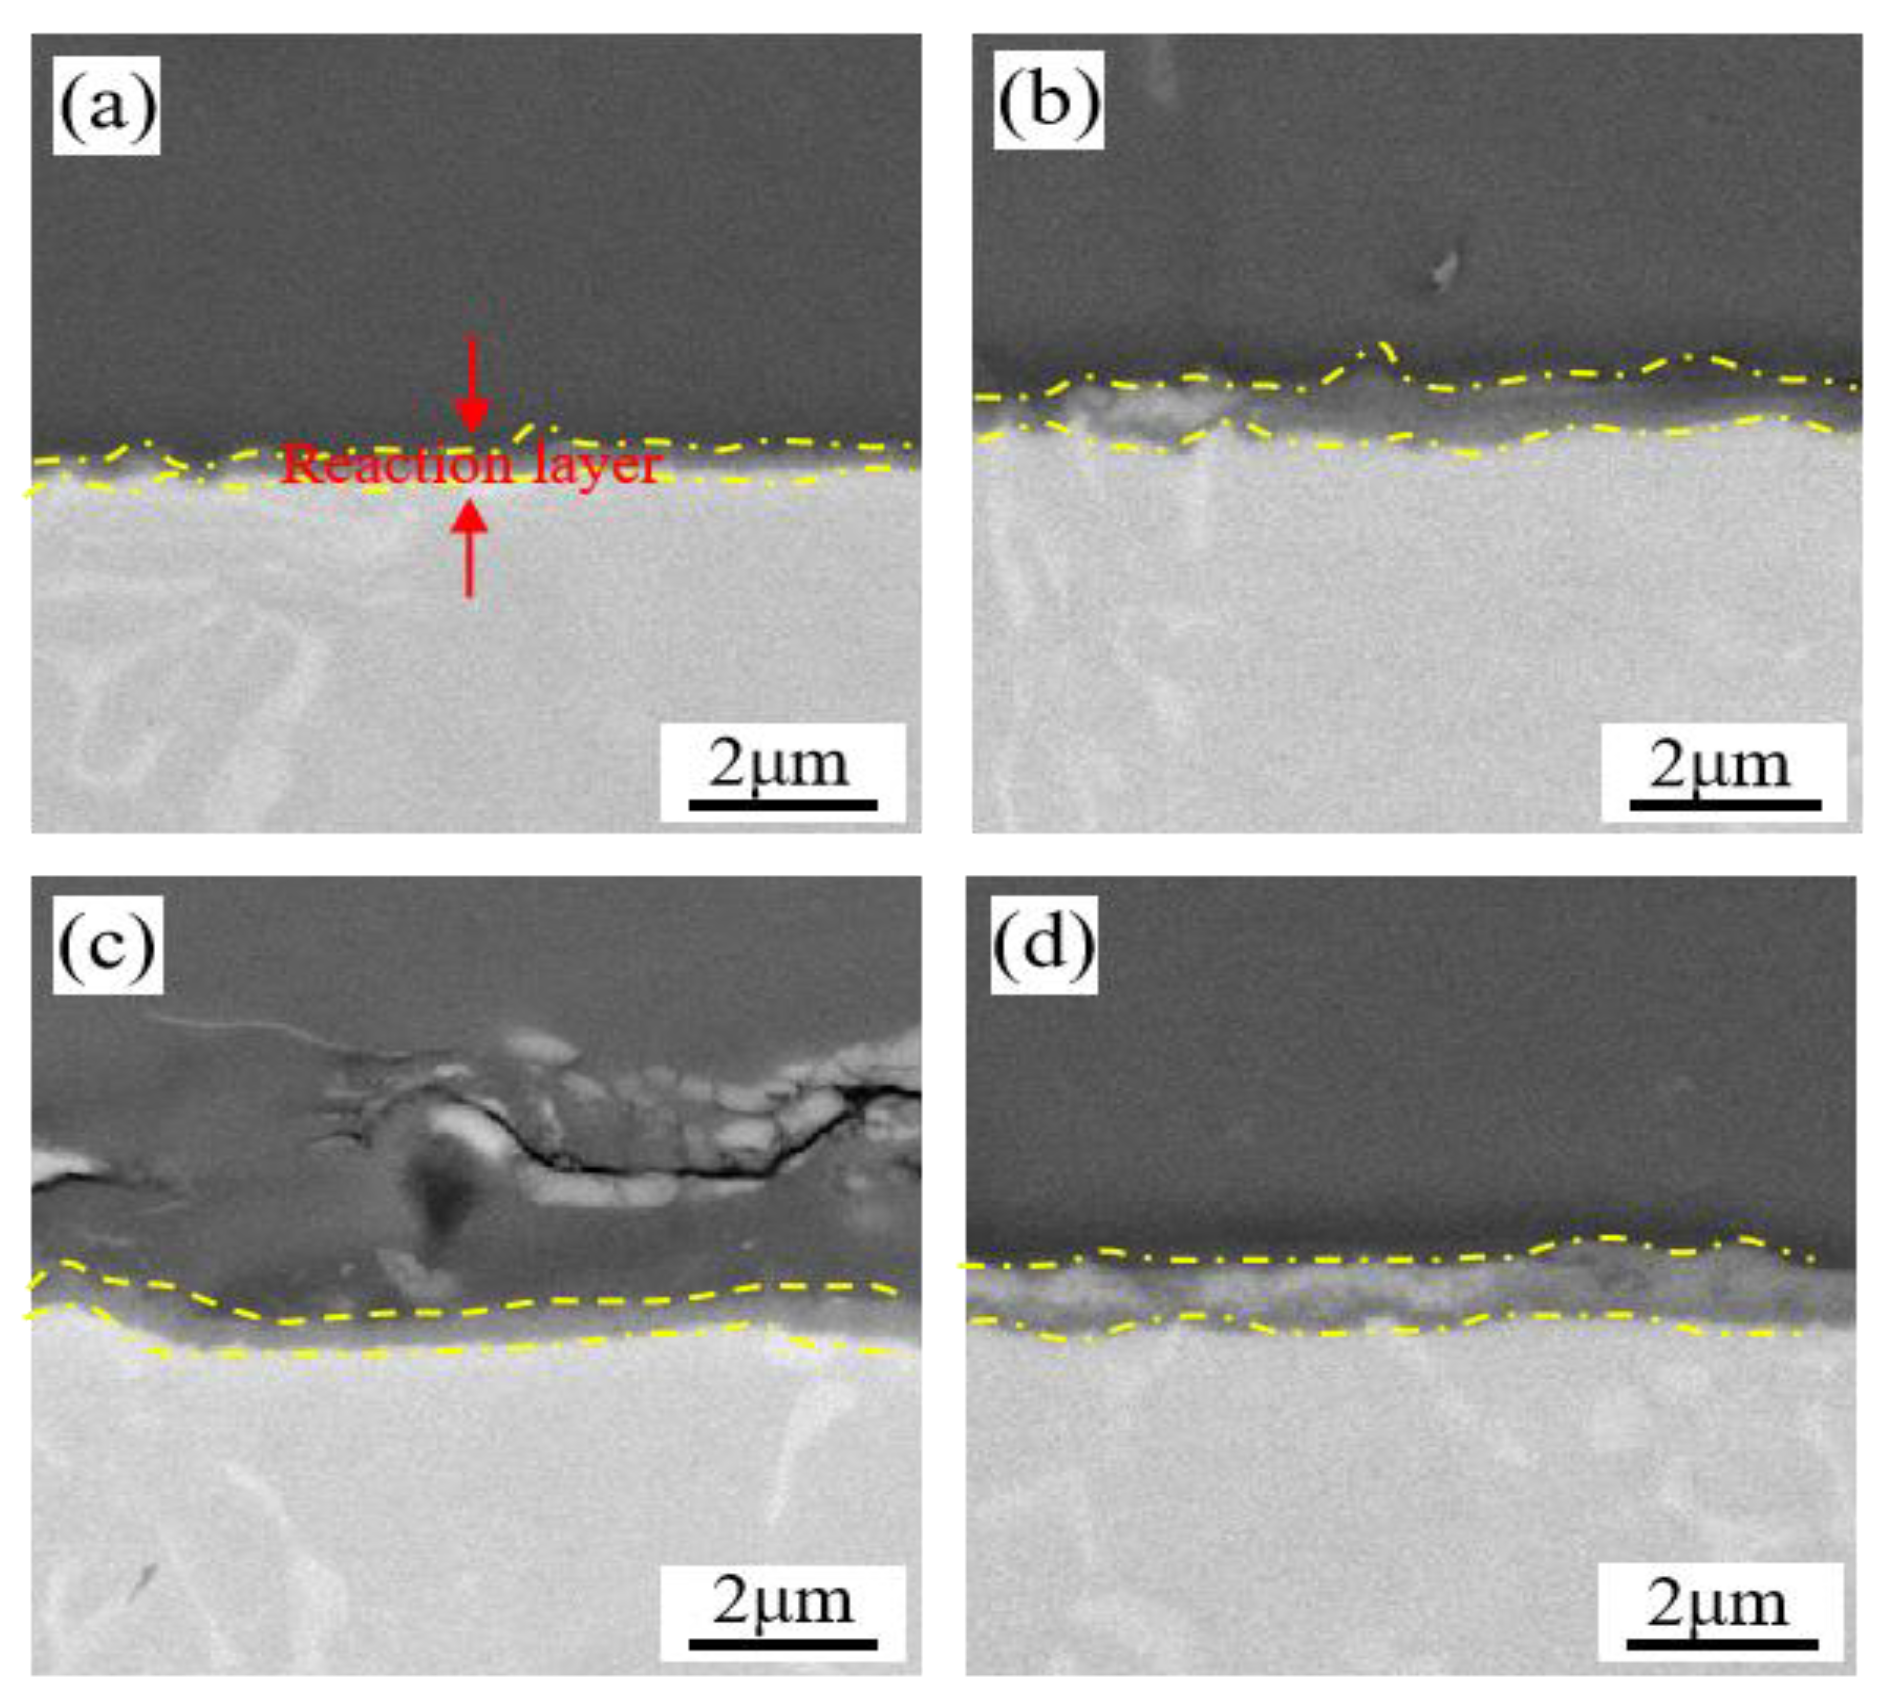
Figure 5 shows the microscopic image of the Al/Ti interface of each group of samples after ultrasonic vibration for 4 min. From the beginning of 4 min, reactants began to appear at the Al/Ti interface of samples with different roughness surfaces. Very small reactants had begun to form at all surfaces, which distributed in a flocculent manner on the surface of the material. Sample A: 0.4 Ra with low roughness exhibited fewer reactants, as shown in Figure 5a. Sample D: 9.8 Ra with high roughness exhibited more reactants, as shown in Figure 5d.
Figure 6 shows the SEM images of the interface of each sample after ultrasonic vibration for 10 min. A continuous reaction layer had been formed at the Al/Ti interface. Some granular reactants on the surface reaction layer of C: 9.5 Ra and D: 9.8 Ra titanium alloy materials with high roughness had been separated from the interface and ionized into the aluminum melt. This indicated that the cavitation effect generated by ultrasonication at this time had formed an impact on the surface and caused some weight loss/cavitated area in the interface reaction layer. EDS elemental analysis of the substance in Figure 6a,c revealed that it is composed of aluminum and titanium, with an atomic ratio of 3:1. It was determined that this substance was TiAl3. The thickness of the reaction layer in Figure 6a is relatively thin, and the thickness of the reaction layer in Figure 6d is the last.
Figure 7 shows the SEM images of the interface of each sample after ultrasonic vibration for 48 min. The reaction layers of all samples thickened and exhibited an irregular arrangement. Regardless of the roughness of the sample, a large amount of free reactants appeared at the Al/Ti interface. The thickness of the TiAl3 reaction layer increased to about 5 μm. There were many cracks in the reaction layers, and the cracks continued to deepen to the interior. Reactants began to form near the surface of the titanium alloy matrix. The growth of reactants might cause the adjacent matrix material to peel off as a whole, increasing the mass loss of the later material. The interface between Ti alloy matrix and reaction layer was no longer smooth, and the roughness increased obviously. This was because under the action of high-power ultrasonic, a large number of cavitation bubbles were generated in the melt. The fracture of cavitation bubble near the wall would produce vertical microjet impact on the solid surface, resulting in plastic deformation of the titanium alloy surface and increasing surface roughness. The microjets would also cause fatigue damage to the formed TiAl3 reaction layer. Under the influence of mechanical impact, cracks of various sizes appeared in the reaction layer. These cracks peeled the TiAl3 particles outside the reaction layers, which also verified the phenomenon that the radiation rod had a high weight loss rate/cavitated area under ultrasonic conditions.
Although the surface roughness of the four groups of samples was different, the formation of Al/Ti interface reactants and the growth of the reaction layer were similar. A continuous reaction layer appeared at the Ti/Al solid–liquid interface at 10 min, and the chemical composition of the layer was determined to be TiAl3. The cavitation effect occurred when the ultrasonic wave propagated in aluminum melt. The cavitation effect near the wall caused instantaneous high temperature and high pressure at the liquid–solid interface of Al/Ti. The high temperature and high pressure caused by cavitation bubble collapse increased the interdiffusion rate of Al and Ti atoms. They also increased the plastic deformation of the interface, which increased the solid–liquid contact area. This was helpful for the full diffusion of atoms. To a certain extent, the reaction rate of Al/Ti atoms was accelerated.

3.4. Profile Microhardness

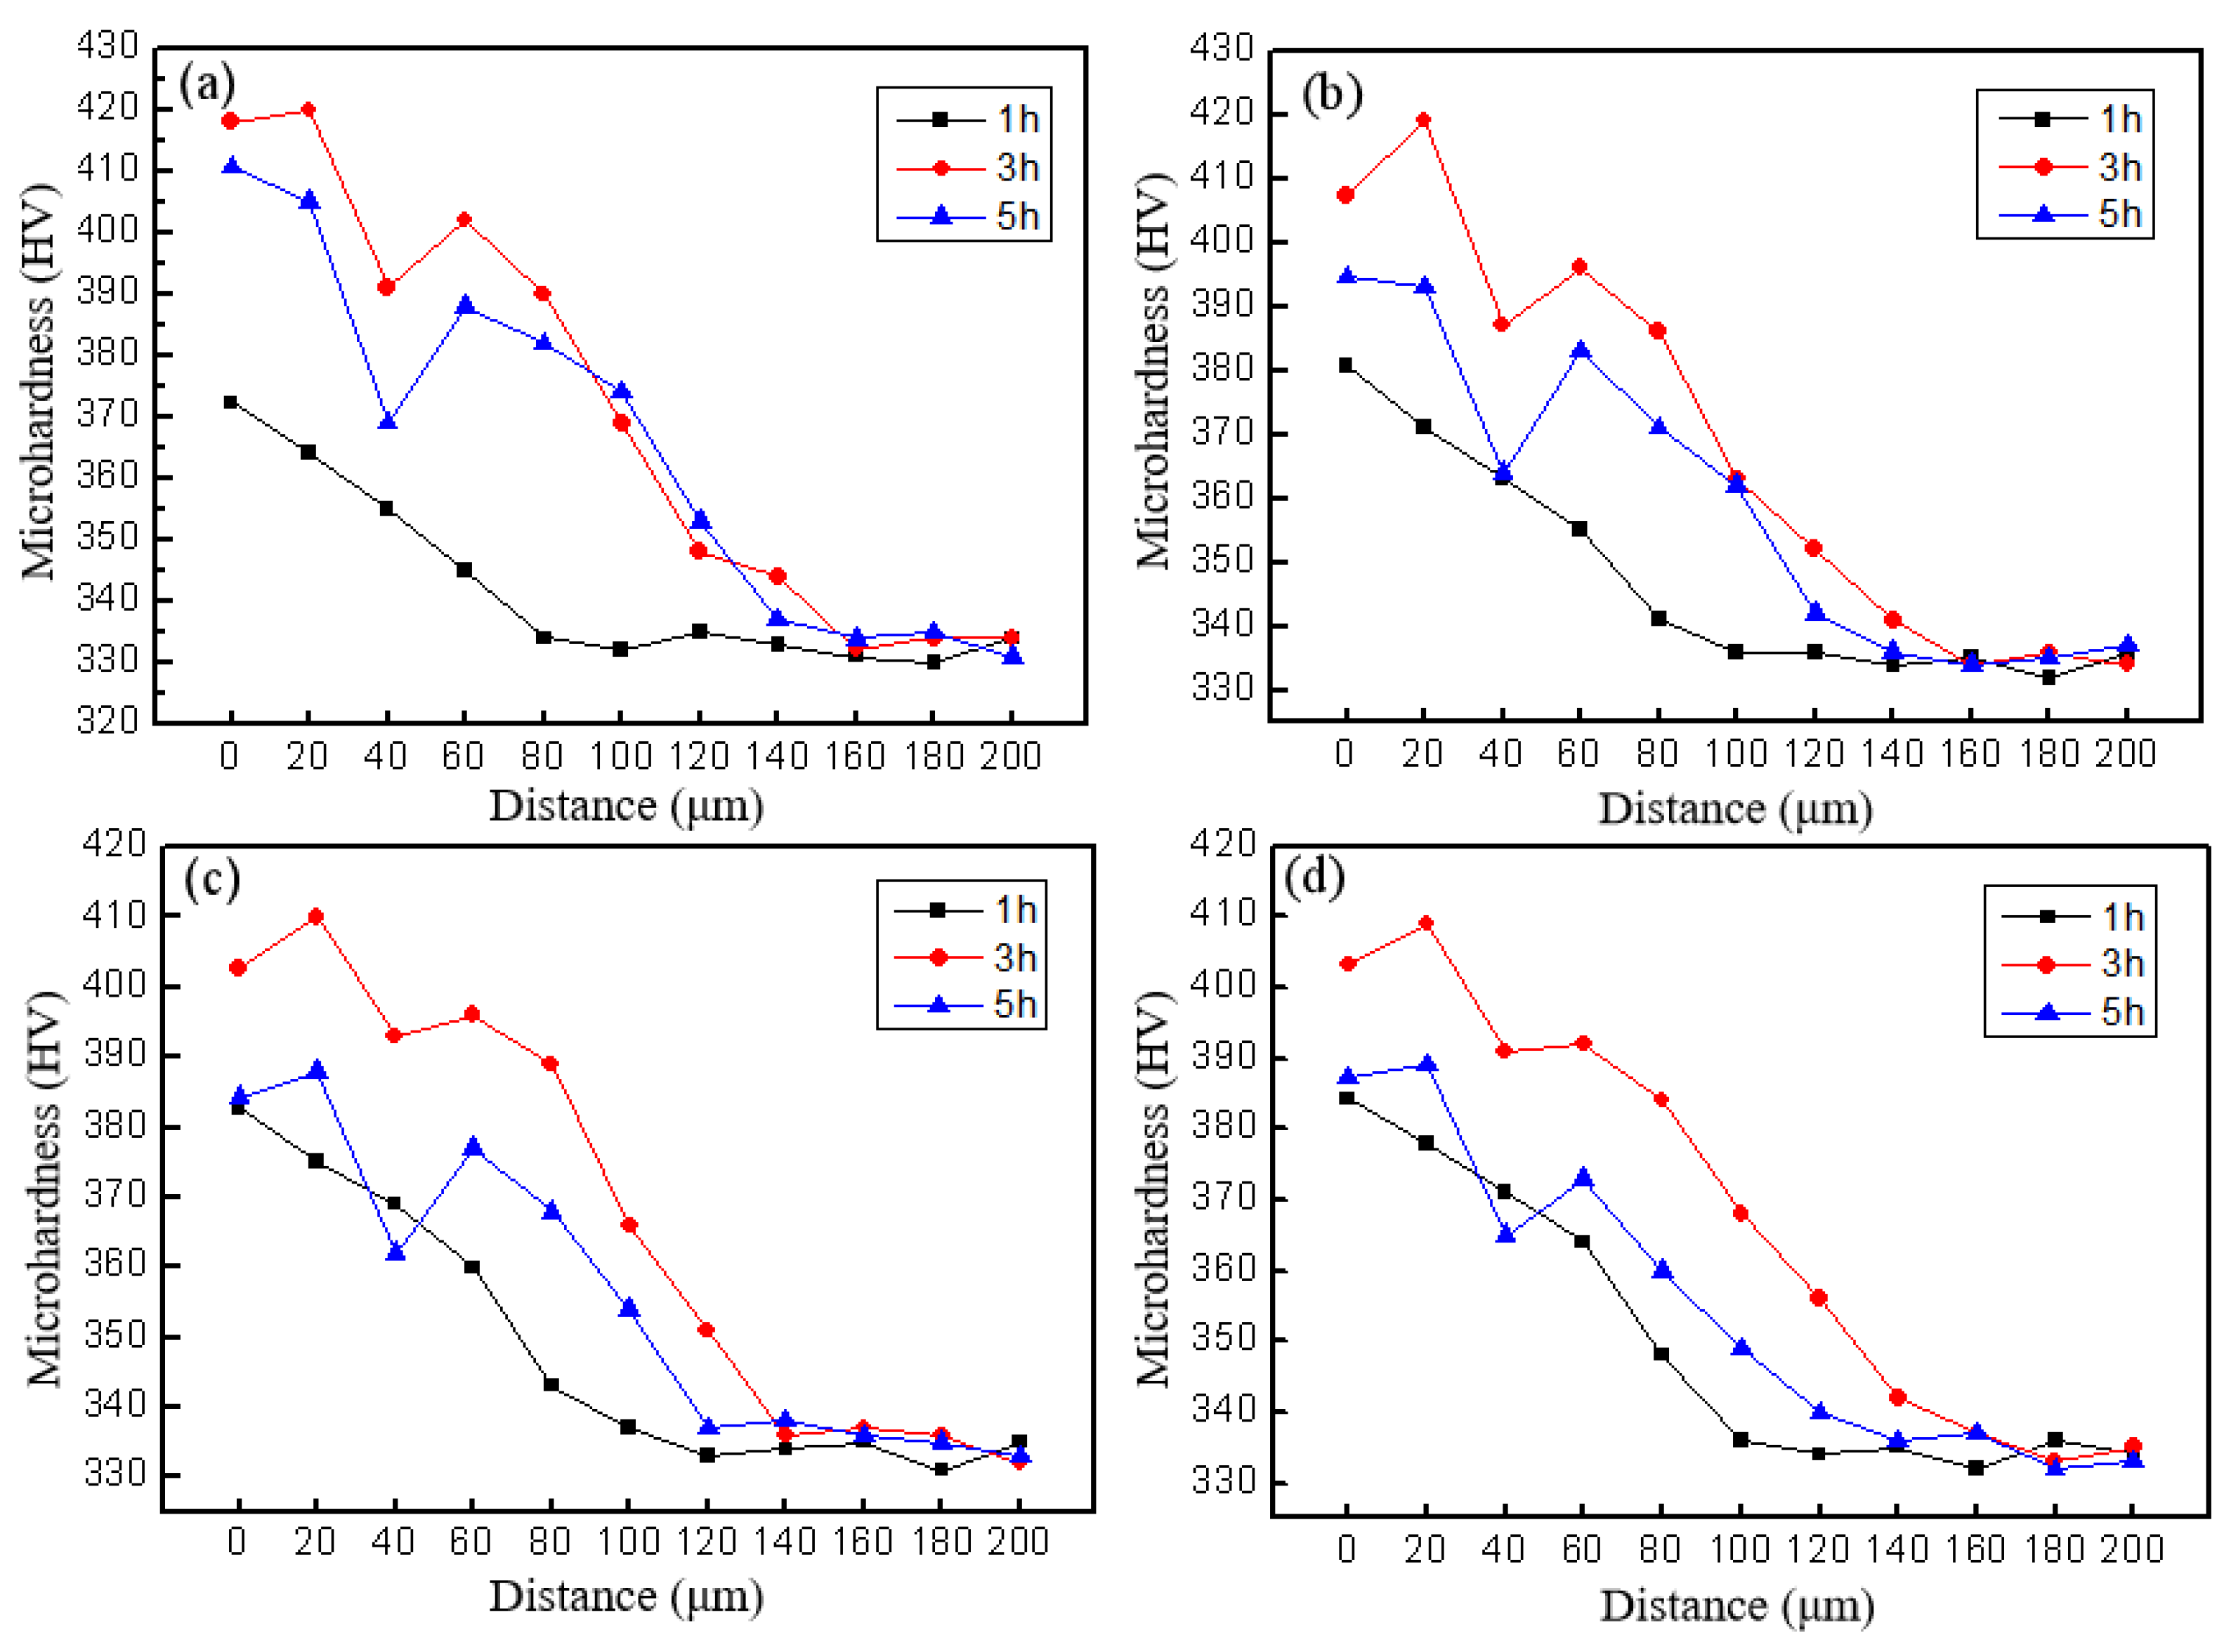
Figure 8 shows the microhardness of four different surface roughness profiles of the radiation rod materials subjected to cavitation corrosion. In this experiment, four titanium alloy samples with different roughnesses in 700 °C aluminum melt were subjected to cavitation corrosion for 1 h, 3 h, and 5 h, respectively. Then, the microhardness test was carried out from the surface layer of the matrix every 20 μm vertically to the inside, and the test length was 200 μm.
As an important measure of surface mechanical properties, the surface microhardness of a material can reflect the ability of the material to resist external impact. Therefore, surface microhardness is also one of the important parameters of cavitation resistance in the study of the cavitation corrosion behavior of materials. In the process of cavitation corrosion, the ability of titanium alloy material to absorb cavitation damage depends on the degree of deformation of the material surface, the depth of corrosion and the mode of destruction. The microhardness change of the material before and after cavitation corrosion is an index to measure the material’s ability to absorb cavitation damage.
When the radiation rod material was damaged by cavitation corrosion for 1 h, work hardening layers of different depths were formed near the surface of each sample substrate. As cavitation corrosion progressed, the thickness of the work hardening layer increased. The microhardness variation of samples with different roughness was similar. During the incubation period of cavitation corrosion, the surface of the material began to show work hardening due to the effect of microjet shock wave. Until the end of the incubation period of cavitation corrosion, the microhardness of the near surface layer continued to rise and reached the maximum value. At this time, the cavitation energy absorbed by the plastic deformation of the material reached saturation. Then, the microhardness gradually decreased, which caused the surface material to detach from the matrix and undergo processing softening. At the same time, as the newly exposed surface was subjected to cavitation impact, the larger hardened layer of the material moved towards the interior of the matrix. The rate of surface material detachment was lower than the rate of high hardened layer hardening towards the interior. This was the reason why the work hardening layer grew over time and there was a certain thickness of work softening zone near the surface.
Table 4 shows the thickness of the work hardening layer of titanium alloy samples with different roughnesses after different cavitation times. A hardened layer of 80 μm was formed on the surface of A: 0.4 Ra at 1 h after the experiment, and the thickness increased to 160 μm at 3 h. The thickness of the hardened layer decreased to 140 μm after 5 h. However, the thicknesses of the hardened layers of the other samples with higher roughness at 1 h were all higher. This was because at the beginning of the experiment, the surface of the samples with higher roughness had higher strength of cavitation corrosion and greater plastic deformation generated by absorbing energy of cavitation corrosion. This resulted in the higher work hardening degree of the surface layer. The thickness of the hardened layer of the C: 9.5 Ra at 3 h was lower than other samples with lower roughness, indicating that the cavitation corrosion acceleration period began at this time. The surface material of the substrate gradually fell off and dispersed in the aluminum melt. Therefore, the actual thickness of the work hardening layer was lower than that of the samples with lower roughness. The thickness of the hardened layer of the four samples at 5 h was reduced by about 20 μm. This indicated that the difference between the stripping rate of the surface material caused by cavitation corrosion and the work hardening rate of the surface layer caused by cavitation corrosion was roughly equal.
The formation of cavitation pits was the result of microjets and shock waves generated after the collapse of cavitation bubbles on the surface of materials. The microscopic and submicroscopic cracks on the surface of materials were the places where gas nuclei existed [39]. The gas nuclei at the crack gradually grew to collapse under the negative pressure environment formed by ultrasonic vibration, and the high-speed jet generated impacts the surface of the material. Figure 9 shows the formation, growth and collapse of cavitation bubbles in cylindrical grooves on the surface of the material. cR and cL represent the radial velocity of the impact point and the wave velocity of the shock wave, respectively. When cR > cL, the wave front kept in contact with the material surface, and the high-pressure region continued to exert high pressure on the solid surface. When cR = cL, the wave front gradually diverged from the surface of the material. The aluminum melt generated a radial flow along the surface of the material, with velocities pointing toward the center of the unloading wave. When the surface roughness was small, the lateral flow of aluminum melt was less hindered and the high-pressure zone between the solid and liquid interface could be completely unloaded. However, for the surface with larger roughness, the jet might directly act in the groove of a certain depth, and the lateral flow would be hindered by the two side walls. Therefore, the unloading process was difficult to complete.
Ignoring the compression of aluminum melt in region A, Equation (4) can be obtained by using Equation (2) [40] and Equation (3) [41], which is the geometric relationship between vj and cL when the high-pressure region is completely unloaded.
r e f f = r j v j c L
t r = 3 r j 2 v j c L 2
v j = 0.1673 0.2100 c L
where reff, tr, rj, vj, and cL are defined as the radius of the high-pressure area, the time from the start of unloading to the exact completion of the high-pressure area, radius, impact velocity, and velocity of shock wave in aluminum melt, respectively. It is assumed that the diameter and height of the cylindrical groove contour on the solid surface are equal to the diameter of the head of microjet. The bottom of the groove is an ideal plane.
If the value of cL is 1500 m/s, then vj is equal to 251–315 m/s. According to Equations (2) and (3), it can be seen that the high-pressure unloading completion time tr after impact of a microjet with a jet diameter of 10 μm is 0.63–0.99 ms. The lateral flow of the microjet compresses the melt between the solid surface and the edge wall, thus prolongating the unloading time. According to the above analysis, the surface profile with reduced roughness has little obstruction and so the lateral flow of melt is not affected. The duration of high pressure is short, and the degree of damage to the substrate surface is correspondingly small. The surface with high roughness is hindered by the lateral flow of microjets, and unloading in the high-pressure area is difficult. At the same time, the surface with high roughness contains more micro-cracks, and surface tearing and convex shear will occur under the impact of high lateral flow.

3.5. Simulation of the Collapse Impact of Cavitation Bubbles near the Wall

3.5.1. Boundary

The object of study in this paper was the process of the impact of cavitation bubbles on rigid surfaces with different roughness. This model was based on the existence of spherical cavitation bubbles near solid walls [42]. The two-phase flow module in the VOF method was used to solve the problem by using Fluent software. The first phase was a 2A14 aluminum melt at 700 °C, and the second phase was a gaseous cavitation bubble. Only half of the cavitation bubble and fluid motion process needed to be modeled due to the axisymmetric characteristics of cavitation collapse. Figure 10 shows the calculation region with an area of 1 mm × 1 mm. In this region, there was a semi-circular cavity on the Y-axis. Its radius was R. The solid wall was on the X-axis, and the minimum equilibrium position between the cavity wall and the solid wall was H. The effect of pressure pulse caused by cavitation collapse on the solid was different depending on the position of the cavity from the solid wall. In order to facilitate the following expression, the radius of cavitation bubbles R was set to 50 μm, and the ratio coefficient γ was set to:
γ = H R
The actual morphologies of solid surfaces with different roughnesses were modeled for simulation calculation. The maximum height difference of the 0.4 Ra, 7.2 Ra, and 9.7 Ra surface profiles was about 2 μm, 25 μm, and 40 μm, respectively. Combined with the calculation method of Ra, the absolute average value of the distance between the contour points and the equilibrium position was taken on the sampling length l:
Ra = 1 l 0 l | y ( x ) | d x
The approximate calculation is:
Ra = 1 n y = 1 n | y i |
where n and l are defined as the number of phases and sampling length, respectively. For the convenience of calculation, the solid surface was fitted to different scales of serrated morphology, and the roughness values used in actual experiments were taken as 0.4, 7, and 10, respectively. The grid of the established plane model was divided, and the minimum mesh size was 2.079 × 10⁻⁴ mm. The model required assumptions [43]: 1. ignoring the role of inertial force; 2. ignoring the surface tension of the cavity wall; and 3. assuming that the amount of gas in the cavity remained constant. The inertial force and surface tension have little influence on the whole calculation result, and the calculation amount is large, so they are ignored. In order to ensure the accuracy of simulation results, the amount of gas in the cavity must be kept constant. The left boundary of the model was set to conform to the symmetric boundary, and the following equation was established:
u x = 0 , u y n = 0
where ux and uy are defined as the partial velocity in the x and y directions, respectively. The lower boundary was set as the rigid wall surface, and the upper and right boundaries were set as the infinity boundary, which satisfies
u y n = 0 , v y n = 0
where n is the normal direction. The gas pressure in the cavity is 2340 Pa and the fluid pressure is 5 MPa.

3.5.2. Parameter

The gas–liquid phase in the fluid satisfies the equation:
ρ t + ( ρ u ) = 0
The N-S equation is:
u t + ( u ) u = 1 ρ p + γ 2 u
The VOF method was used to track the gas–liquid interface. In order to represent the proportion of liquid in the grid, the volume fraction function Fi was introduced. This function satisfied:
t ( F i ρ i ) + ( F i ρ i u i ) = 0
i = 2 F i = 1
where u, μ, ρ, and i are the velocity tensor of the fluid, the kinematic viscosity of the fluid, the density of the fluid, and the different phases in the fluid, respectively.
The density, surface tension, dynamic viscosity, and saturated vapor pressure of aluminum melt were 2450 kg/cm3, 0.86 N/m, 1.38 × 10⁻³ m2/s, and 2.45 kPa. The transient solution was performed by Fluent. Time and space were used in implicit format and upwind format, respectively, and pressure was calculated using the PISO algorithm. The time step was 10−8, and the variable step was solved.

3.5.3. Simulation Result

Figure 11, Figure 12 and Figure 13 show the pressure distribution diagram and the maximum pressure value of the solid interface when the ratio coefficients are equal to 0.5, 1, and 1.5, and the roughness values of the solid interface are 0.4 Ra, 7 Ra, and 10 Ra, respectively.
When the ratio coefficient was the same, the greater the roughness of the solid interface, the greater the maximum pressure value at that point. When the roughness was constant, the smaller the ratio coefficient was, and the closer the cavity was to the solid interface, the higher the maximum pressure. The number of small profile peaks on solid surface affected by the high-pressure region was slightly different. There were five small profile peaks affecting 0.4 Ra, and about 7 Ra small profile peaks affecting 7 Ra and 10 Ra. Although these pressure values were far less than the yield strength of titanium alloys, a large and repeated impact would certainly cause damage to the solid surface. Therefore, the greater the surface roughness, the greater the maximum pressure value on the surface, and the wider the influence range of the high-pressure region. The surface with higher roughness had sharper contour peak, which was easier to form stress concentration and greater corrosion degree.

4. Conclusions

The ultrasonic corrosion behavior of titanium alloy radiation rod with different roughness was studied in aluminum melt at 700 °C. Macro- and micro morphology observation, weight loss/cavitated area detection, phase analysis, microhardness measurement, cavitation dynamics equation derivation, and single cavitation bubble collapse simulation were carried out on the experimental samples at each stage under ultrasonic vibration at different time. Our main conclusions are as follows:
(1)
The corrosion rule of titanium alloy in aluminum melt was that the greater the roughness, the greater the weight loss rate/cavitated area. The weight loss/cavitated area of titanium alloy caused by cavitation effect accounted for 6.4%~8.6% of the total weight loss/cavitated area. The corrosion product was the intermetallic compound TiAl3. These reactants appeared at the Al/Ti solid–liquid interface of samples with different roughness in about 4 min, and the reaction layer was formed in 10 min.
(2)
With the increase of cavitation erosion time, the thickness of the work hardening layer on the surface of the material increased first and then decreased. The maximum thickness could reach 160 μm. The evolution of the hardened layer depended on the stripping rate of the surface material caused by cavitation corrosion and the work hardening rate of the surface layer.
(3)
The greater the roughness of the solid interface, the greater the maximum pressure at that point. When the roughness was constant, the smaller the ratio coefficient was and the closer the cavity was to the solid interface, the maximum pressure increased. The greater the surface roughness, the wider the influence range of the high pressure zone, and the greater the degree of corrosion.
Additionally, research has thus far concentrated on the properties of titanium alloy radiation rod with different roughness in 2A14 aluminum melt for ultrasonic casting. The influence of different roughness is only one factor in the ultrasonic casting process. We can also study the effect of different power levels of ultrasound on the corrosion performance of radiation rods. This will help us understand the corrosion mechanism of titanium alloy radiation rods throughout the entire ultrasonic casting process and also provide a deeper insight to develop a new homemade Ti alloy radiation rod with better resistance to corrosion in the ultrasonic casting.

Author Contributions

Conceptualization, Y.Y.; Data curation, Y.Z.; Writing—Original draft, Y.Y.; Writing—review and editing, X.L.; Funding acquisition, H.Z. All authors have read and agreed to the published version of the manuscript.

Funding

This research was funded by the Key Scientific Research and Technological Projects in Henan Province (NO.232102230010), Key Scientific Research and Technological Projects in Henan Province (NO.222102230097), Doctoral Foundation for Henan University of Engineering (NO. D2021008), and Key Research Project Plan for Higher Education Institutions in Henan Province (NO.22B430010).

Institutional Review Board Statement

Not applicable.

Informed Consent Statement

Not applicable.

Data Availability Statement

The data presented in this study are available on request from the corresponding author.

Acknowledgments

The authors are grateful to T. Zhang and W.W. Xu of the Analysis and Testing Center of HAUE for their kind help with XRD and SEM.

Conflicts of Interest

The authors declare no conflict of interest.

References

  1. Lin, R.; Liu, B.; Zhang, J.J.; Zhang, S.G. Microstructure evolution and properties of 7075 aluminum alloy recycled from scrap aircraft aluminum alloys. J. Mater. Res. Technol. 2022, 19, 354–367. [Google Scholar] [CrossRef]
  2. Wan, Z.D.; Wang, Q.; Zhao, Y.; Zhao, T.Y.; Shan, J.G.; Meng, D.Y.; Song, J.L.; Wu, A.P.; Wang, G.Q. Improvement in tensile properties of 2219-T8 aluminum alloy TIG welding joint by PMZ local properties and stress distribution. Mater. Sci. Eng. A 2022, 839, 142863. [Google Scholar] [CrossRef]
  3. Zhang, J.F.; Zhou, D.S.; Pang, X.Y.; Zhang, B.W.; Li, Y.; Sun, B.H.; Valiev, R.S.; Zhang, D.L. Deformation-induced concurrent formation of 9R phase and twins in a nanograined aluminum alloy. Acta. Mater. 2023, 244, 118540. [Google Scholar] [CrossRef]
  4. Safyri, M.; Moshtaghi, M.; Hojo, T.; Akiyama, E. Mechanisms of hydrogen embrittlement in high-strength aluminum alloys containing coherent or incoherent dispersoids. Corros. Sci. 2022, 194, 109895. [Google Scholar] [CrossRef]
  5. Miao, J.S.; Sutton, S.; Luo, A.A. Deformation microstructure and thermomechanical processing maps of homogenized AA2070 aluminum alloy. Mater. Sci. Eng. A 2022, 834, 142619. [Google Scholar] [CrossRef]
  6. Guo, X.P.; Li, H.J.; Xue, P. Microstructure and mechanical properties of 600 MPa grade ultra-high strength aluminum alloy fabricated by wire-arc additive manufacturing. J. Mater. Sci. Technol. 2023, 149, 56–66. [Google Scholar] [CrossRef]
  7. Balasubramani, N.; Venezuela, J.; Yang, N.; Wang, G.; Stjohn, D.; Dargusch, M. An overview and critical assessment of the mechanisms of microstructural refinement during ultrasonic solidification of metals. Ultrason. Sonochem. 2022, 89, 106151. [Google Scholar] [CrossRef]
  8. Eskin, D.G.; Tzanakis, I.; Wang, F.; Lebon, G.S.B.; Subroto, T.; Pericleous, K.; Mi, J. Fundamental studies of ultrasonic melt processing. Ultrason. Sonochem. 2019, 52, 455–467. [Google Scholar] [CrossRef]
  9. Priyadarshi, A.; Khavari, M.; Shahrani, B.; Subroto, T.; Yusuf, L.A.; Conte, M.; Pretice, P.; Pericleous, K.; Eskin, D.; Tzanakis, L. In-situ observations and acoustic measurements upon fragmentation of free-floating intermetallics under ultrasonic cavitation in water. Ultrason. Sonochem. 2021, 80, 105820. [Google Scholar] [CrossRef]
  10. Xu, N.X.; Yu, Y.; Zhai, W.; Wang, J.Y.; Wei, B.B. A high-temperature acoustic field measurement and analysis system for determining cavitation intensity in ultrasonically solidified metallic alloys. Ultrason. Sonochem. 2023, 94, 106343. [Google Scholar] [CrossRef]
  11. Lu, D.H.; Jiang, Y.H.; Guan, G.S.; Zhou, R.F.; Li, Z.H.; Zhou, R. Refinement of primary Si in hypereutectic Al-Si alloy by electromagnetic stirring. J. Mater. Process. Tech. 2007, 189, 13–18. [Google Scholar] [CrossRef]
  12. Cho, W.G.; Kang, C.G. Mechanical properties and their microstructure evaluation in the thixoforming process of semi-solid aluminum alloys. J. Mater. Process. Tech. 2000, 105, 269–277. [Google Scholar] [CrossRef]
  13. Wang, T.; Huang, Y.F.; Ma, Y.Z.; Wu, L.; Yan, H.Y.; Liu, C.; Liu, Y.; Liu, B.; Liu, W.S. Microstructure and mechanical properties of powder metallurgy 2024 aluminum alloy during cold rolling. J. Mater. Res. Technol. 2021, 15, 3337–3348. [Google Scholar] [CrossRef]
  14. Liu, T.; Wang, Q.D.; Sui, Y.D.; Wang, Q.G.; Ding, W.J. An investigation into aluminum-aluminum bimetal fabrication by squeeze casting. Mater. Design 2015, 68, 8–17. [Google Scholar] [CrossRef]
  15. Martin, J.H.; Yahata, B.; Hundly, J.M.; Mayer, J.A.; Schaedler, T.A.; Pollock, T.M. 3D printing of high-strength aluminium alloys. Nature 2017, 549, 365–369. [Google Scholar] [CrossRef]
  16. Yuan, D.; Shao, S.; Guo, C.; Jiang, F.C.; Wang, J.D. Grain refining of Ti-6Al-4V alloy fabricated by laser and wire additive manufacturing assisted with ultrasonic vibration. Ultrason. Sonochem. 2021, 73, 105472. [Google Scholar] [CrossRef]
  17. Jiang, R.P.; Zhao, W.H.; Zhang, L.; Li, X.Q.; Guan, S.K. Microstructure and corrosion resistance of commercial purity aluminum sheet manufactured by continuous casting direct rolling after ultrasonic melt pre-treatment. J. Mater. Res. Technol. 2023, 22, 1522–1532. [Google Scholar] [CrossRef]
  18. Jang, H.S.; Lee, G.H.; Jeon, J.B.; Choi, Y.S.; Shin, S.M. Effect of ultrasonic melt treatment conditions on melt quality of Al–Mg alloy. J. Mater. Res. Technol. 2022, 19, 2645–2656. [Google Scholar] [CrossRef]
  19. Xiong, Z.F.; Jiang, Y.; Yang, M.; Zhang, Y.; Lei, L. Achieving superior strength and ductility in 7075 aluminum alloy through the design of multi-gradient nanostructure by ultrasonic surface rolling and aging. J. Alloys Compd. 2022, 918, 165669. [Google Scholar] [CrossRef]
  20. Sui, D.S.; Han, Q.Y. Ultrasound-assisted cast-on method: Obtaining high-quality metallurgical bonds between a bare steel insert and A354 aluminum alloy within a composite casting. J. Mater. Process. Tech. 2023, 311, 117783. [Google Scholar] [CrossRef]
  21. Eskin, G.I. Principles of Ultrasonic Treatment: Application for Light Alloys Melts. Adv. Perform. Mater. 1997, 4, 223–232. [Google Scholar] [CrossRef]
  22. Li, J.Y.; Pan, Y.; Yan, Z.X.; Lu, S.L.; Zhao, D.J.; Guo, W.; Wu, S. Effects of Li content on microstructure evolution and mechanical properties of squeeze-cast Al-5Cu-xLi alloy assisted with ultrasonic treatment. J. Alloys Compd. 2023, 961, 171083. [Google Scholar] [CrossRef]
  23. Guang, F.; Jiang, W.M.; Wang, J.L.; Li, G.Y.; Zhang, Z.; Fan, Z.T. Development of high strength Mg/Al bimetal by a novel ultrasonic vibration aided compound casting process. J. Mater. Process. Tech. 2022, 300, 117441. [Google Scholar] [CrossRef]
  24. Moussa, M.E.; Waly, M.A.; Amin, M. Effect of high intensity ultrasonic treatment on microstructural modification and hardness of a nickel-aluminum bronze alloy. J. Alloys Compd. 2018, 741, 804–813. [Google Scholar] [CrossRef]
  25. Dong, F.; Li, X.Q.; Zhang, L.H. Cavitation erosion mechanism of titanium alloy radiation rods in aluminum melt. Ultrason. Sonochem. 2016, 31, 150–156. [Google Scholar] [CrossRef]
  26. Jiao, L.; Zhao, Y.T.; Li, H.; Shang, H.; Zhang, Z.Z.; Xia, T.F. A High-Temperature Aluminum Liquid Corrosion Resistant Ultrasonic Amplitude Transformer and a Preparation Method Thereof. China Patent CN201210467584.4, 19 November 2012. [Google Scholar]
  27. Maula, M.I.; Winarni, T.I.; Tauviqirrahman, M.; Maula, M.I.; Winarni, T.I.; Tauviqirrahman, M.; Akbar, I.; Basri, H.; Heide, E.V.D.; Jamari, J. Tresca Stress Simulation of Metal-on-Metal Total Hip Arthroplasty during Normal Walking Activity. Materials 2021, 14, 7554. [Google Scholar]
  28. Thakur, A.; Kaya, S.; Kumar, A. Recent Trends in the Characterization and Application Progress of Nano-Modified Coatings in Corrosion Mitigation of Metals and Alloys. Appl. Sci. 2023, 13, 730. [Google Scholar] [CrossRef]
  29. Thakur, A.; Sharma, S.; Ganjoo, R.; Assad, H.; Kumar, A. Anti-Corrosive Potential of the Sustainable Corrosion Inhibitors Based on Biomass Waste: A Review on Preceding and Perspective Research. J. Phys. Conf. Ser. 2022, 2267, 012079. [Google Scholar] [CrossRef]
  30. Tian, Y.; Liu, Z.L.; Li, X.Q.; Zhang, L.H.; Li, R.Q.; Jiang, R.P.; Dong, F. The cavitation erosion of ultrasonic sonotrode during large-scale metallic casting: Experiment and simulation. Ultrason. Sonochem. 2018, 43, 29–37. [Google Scholar] [CrossRef]
  31. Hong, S.; Wu, Y.P.; Zhang, J.F.; Zheng, Y.G.; Zheng, Y.; Lin, J.R. Synergistic effect of ultrasonic cavitation erosion and corrosion of WC–CoCr and FeCrSiBMn coatings prepared by HVOF spraying. Ultrason. Sonochem. 2016, 31, 563–569. [Google Scholar] [CrossRef]
  32. Man, H.C.; Cui, Z.D.; Yue, T.M.; Cheng, F.T. Cavitation erosion behavior of laser gas nitrided Ti and Ti6Al4V alloy. Mater. Sci. Eng. A 2003, 355, 167–173. [Google Scholar] [CrossRef]
  33. Li, D.; Kang, Y.; Wang, X.C.; Ding, X.L.; Fang, Z.L. Effects of nozzle inner surface roughness on the cavitation erosion characteristics of high speed submerged jets. Exp. Therm. Fluid Sci. 2016, 74, 444–452. [Google Scholar] [CrossRef]
  34. Pitt, F.; Ramulu, M. Influence of grain size and microstructure on oxidation rates in titanium alloy Ti-6Al-4V under superplastic forming conditions. J. Mater. Eng. Perform. 2004, 13, 727–734. [Google Scholar] [CrossRef]
  35. Shi, C.; Wu, Y.J.; Mao, D.H.; Fan, G.F. Effect of Ultrasonic Bending Vibration Introduced by the L-shaped Ultrasonic Rod on Solidification Structure and Segregation of Large 2A14 Ingots. Materials 2020, 13, 807. [Google Scholar] [CrossRef]
  36. Li, R.Q.; Liu, Z.L.; Dong, F.; Li, X.Q.; Chen, P.H. Grain refinement of a large-scale Al alloy casting by introducing the multiple ultrasonic generators during solidification. Metall. Mater. Trans. A 2016, 47, 3790–3796. [Google Scholar] [CrossRef]
  37. Li, R.Q.; Liu, Z.L.; Chen, P.H.; Zhong, Z.T.; Li, X.Q. Investigation on the Manufacture of a Large-Scale Aluminum Alloy Ingot: Microstructure and Macrosegregation. Adv. Eng. Mater. 2017, 19, 1600375. [Google Scholar] [CrossRef]
  38. Zhou, Y.K.; Hammitt, F.G. Vibratory cavitation erosion in aqueous solutions. Wear 1983, 87, 163–171. [Google Scholar] [CrossRef]
  39. Chahine, G.L.; Kapahi, A.; Choi, J.K. Modeling of surface cleaning by cavitation bubble dynamics and collapse. Ultrason. Sonochem. 2016, 29, 528–549. [Google Scholar] [CrossRef]
  40. Kattner, U.R.; Lin, J.C.; Chang, Y.A. Thermodynamic Assessment and Calculation of the Ti-Al System. Metall. Mater. Trans. A 1992, 23, 2081–2090. [Google Scholar] [CrossRef]
  41. Kennedy, C.F.; Field, J.E. Damage threshold velocities for liquid impact. J. Mater. Sci. 2000, 35, 5331–5339. [Google Scholar] [CrossRef]
  42. Zhang, S.G.; Duncan, J.H.; Chahine, G.L. The final stage of the collapse of a cavitation bubble near a rigid wall. J. Fluid. Mech. 1993, 257, 147–181. [Google Scholar] [CrossRef]
  43. Tomia, Y.; Robinson, P.B.; Tong, R.P.; Blake, J.R. Growth and collapse of cavitation bubbles near a curved rigid boundary. J. Fluid. Mech. 2002, 466, 259–283. [Google Scholar] [CrossRef]
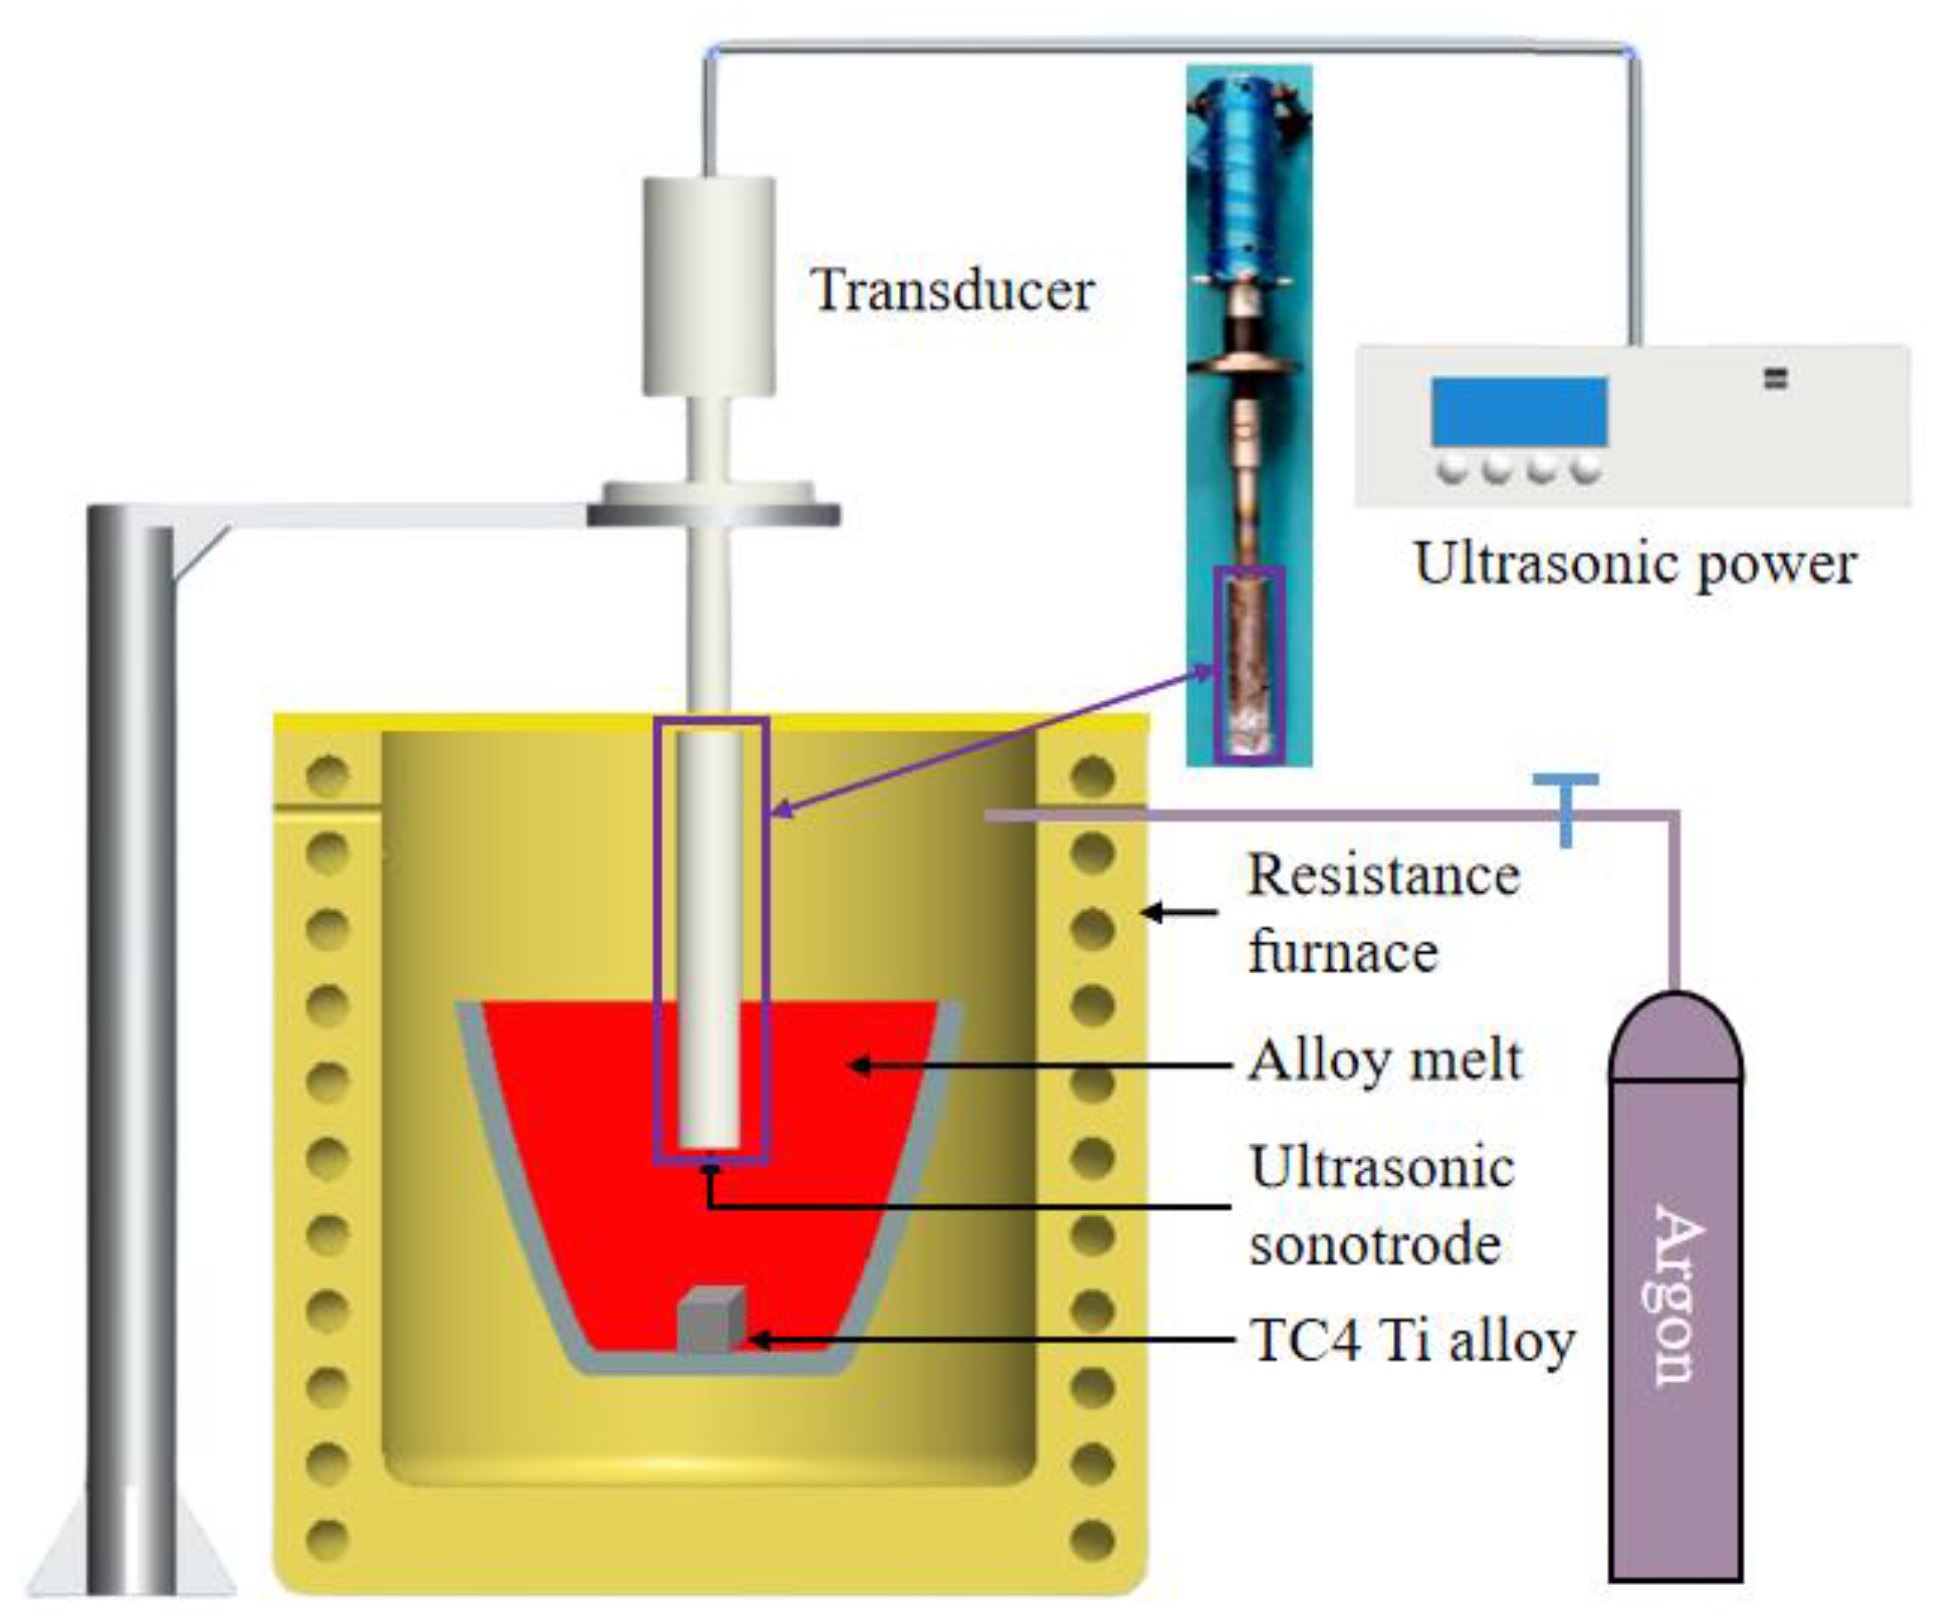
Figure 1. Schematic diagram of the experimental system.
Coatings 13 01632 g001
Figure 2. Curves of (a) weight loss/cavitated area; (b) weight loss rate/cavitated area.
Coatings 13 01632 g002
Figure 3. Surface morphologies of samples with vibration for 48 min: (a) A: 0.4 Ra, (b) B: 7.2 Ra, (c) C: 9.5 Ra, (d) D: 9.8 Ra.
Coatings 13 01632 g003
Figure 4. Sample A: 0.4 Ra: (a) Microstructure of the reaction layer in the profile; (b) energy spectrum, (c) XRD analysis.
Coatings 13 01632 g004
Figure 5. SEM images of the interface of samples with vibration for 4 min: (a) A: 0.4 Ra, (b) B: 7.2 Ra, (c) C: 9.5 Ra, (d) D: 9.8 Ra.
Coatings 13 01632 g005
Figure 6. SEM images of the interface of samples with vibration for 10 min: (a) A: 0.4 Ra, (b) B: 7.2 Ra, (c) C: 9.5 Ra, (d) D: 9.8 Ra.
Coatings 13 01632 g006
Figure 7. SEM images of the interface of samples with vibration for 48 min: (a) A: 0.4 Ra, (b) B: 7.2 Ra, (c) C: 9.5 Ra, (d) D: 9.8 Ra.
Coatings 13 01632 g007
Figure 8. Profile microhardness curve of samples and application time of ultrasonic: (a) A: 0.4 Ra, (b) B: 7.2 Ra, (c) C: 9.5 Ra, (d) D: 9.8 Ra.
Coatings 13 01632 g008
Figure 9. Schematic diagram of microjet impact grooves.
Coatings 13 01632 g009
Figure 10. Simulation area.
Coatings 13 01632 g010
Figure 11. Cloud picture of pressure distribution at γ = 0.5: (a) 0.4 Ra, (b) 7 Ra, (c) 10 Ra.
Coatings 13 01632 g011
Figure 12. Cloud picture of pressure distribution at γ = 1: (a) 0.4 Ra, (b) 7 Ra, (c) 10 Ra.
Coatings 13 01632 g012
Figure 13. Cloud picture of pressure distribution at γ = 1.5: (a) 0.4 Ra, (b) 7 Ra, (c) 10 Ra.
Coatings 13 01632 g013
Table 1. Contents of major solute elements in the TC4 (wt%).
ElementsFeCNHOAlVTi
Content≤0.30≤0.10≤0.05≤0.02≤0.205.5~6.83.5~4.5Bal.
Table 2. Weight loss/cavitated area of each sample (mg/cm2).
SampleRa (µm)Initial Weight m(g)Weight after 48 min m1(g)Lost Weight/Cavitated Area (mg/cm2)
A0.427.001726.99368.1
B7.227.051927.039212.7
C9.527.214027.196817.3
D9.826.941826.926415.4
Table 3. Weight loss rate/cavitated area of each sample (mg·min−1/cm2).
Number
Rate (vt)
12 min v1
(mg·min−1/cm2)
24 min v2
(mg·min−1/cm2)
36 min v3
(mg·min−1/cm2)
48 min v4
(mg·min−1/cm2)
A0.1680.1520.1850.169
B0.3040.2600.2730.265
C0.4600.3490.4210.359
D0.3340.2660.3470.320
Table 4. Thickness of work hardening layer (μm).
Roughness Time (t/h)135
0.4 Ra80160140
7.2 Ra90150130
9.5 Ra100140120
9.8 Ra100150130
Disclaimer/Publisher’s Note: The statements, opinions and data contained in all publications are solely those of the individual author(s) and contributor(s) and not of MDPI and/or the editor(s). MDPI and/or the editor(s) disclaim responsibility for any injury to people or property resulting from any ideas, methods, instructions or products referred to in the content.