Article

Investigation of Oxygen Behavior under Different Melt Flow, Diffusion Boundary Layer, and Crystal-Melt Interface in a 300 mm Silicon Crystal Growth with Cusp Magnetic Field

1
State Key Laboratory of Reliability and Intelligence of Electrical Equipment, Hebei University of Technology, Tianjin 300132, China
2
School of Materials Science and Engineering, Hebei University of Technology, Tianjin 300132, China
3
Zhonghuan Advanced Semiconductor Materials Co., Ltd., Yixing 214200, China
4
Hebei Engineering Laboratory of Photoelectronic Functional Crystals, Hebei University of Technology, Tianjin 300130, China
*
Authors to whom correspondence should be addressed.
Coatings 2023, 13(9), 1634; https://doi.org/10.3390/coatings13091634
Submission received: 28 July 2023 / Revised: 7 September 2023 / Accepted: 14 September 2023 / Published: 18 September 2023

Abstract

:
The silicon single crystals for semiconductor application are usually grown by the Czochralski (CZ) method. In this paper, we studied a 300 mm Czochralski silicon crystal grown with a cusp magnetic field to be used for an insulated gate bipolar transistor (IGBT). Different positions of the zero-Gauss plane (ZGP) under a cusp magnetic field were simulated and compared to numerical analysis. We investigated three factors that affected the oxygen concentration in the crystal, including (1) melt convection, (2) melt flow velocity near the quartz crucible wall, and (3) the diffusion boundary layer. We also studied the shape of the solid/liquid interface at the same time. The simulation results show that a change in the ZGP of the cusp magnetic field (CMF) strongly affects the convection in the melt, which leads to a difference in the thickness of the boundary layer near the wall of the quartz crucible. We investigated the relationship of the ZGP, convection in the melt, and the thickness of the boundary layer. In this way, we determined how to reduce oxygen diffusing into the melt and finally into the crystal. After simulation results were obtained, we pulled single crystals under the three configurations. The results show that the experimental data of the oxygen content and shape of the solid/liquid interfaces are consistent with the simulation results.

1. Introduction

In recent decades, with the rapid development of electronic components, massive business opportunities have emerged in the industrial power control, automotive, photovoltaic, and wind-electrical fields. It is well known that the float-zone (FZ) method is used to make silicon wafer substrate for insulated gate bipolar transistors (IGBTs). To reduce costs and raise productivity, a more cost-effective 300 mm diameter wafer substrate can be used for IGBTs. Therefore, silicon material grown by the CZ process with magnetic field equipment can be used as an IGBT substrate. IGBTs have been widely applied and are mainly used in high-voltage, high-current, and high-power scenarios. Compared with chip performance, users pay more attention to the stability and reliability of the products, which require a relatively low level of impurities in the crystal. The oxygen- and carbon-relative compounds formed after heat treatment by oxygen and carbon atoms in the crystal may impact the device’s performance [1].
Further studies show that the oxygen concentration of IGBT devices is required to be as low as possible. Since the excessive oxygen will be precipitated into SiOx during the heat treatment process of the device manufacturing process, the compounds would deteriorate the recombination lifetime of IGBTs [2]. In addition to that, when silicon wafers containing excessive oxygen are subjected to the low temperature of about 450 °C during crystal cooling or process cooling, oxygen thermal donors will form, resulting in changes in the electrical properties of the substrate, which is one of the important quality characteristics, requiring uniformity and stability. In particular, it is required that the resistivity distribution in the crystal is uniform, and the resistivity does not change after heat treatment in the device manufacturing process. The oxygen concentration and its uniformity in the CZ crystal mainly depend on the flow state in the molten liquid and some process parameters of crystal pulling. With the increase in the diameter of a silicon single crystal, the number of silicon crystal growth systems in the molten liquid increases, and the heat convection in the crucible becomes more intense [3]. To ensure the quality of crystallization, the heat convection in the molten liquid must be suppressed. Applying a magnetic field effectively controls the liquid flow during silicon growth [4].
The magnetic fields Czochralski (MCZ) technique is capable of growing low oxygen, low micro defects, and high resistivity CZ silicon. Beginning in 1980, various types of magnetic fields were developed, including magnetic field orientation (vertical magnetic fields CZ (VMCZ) for longitudinal magnetic fields, horizontal magnetic fields CZ (HMCZ) for transverse magnetic fields and cusp-shaped magnetic fields) [5], and crystal growth studies were conducted. Kakomoto [6] studied the VMCZ magnet and found that the VMCZ magnet field could suppress the radial heat convection, and oxygen concentration decreased with an increase in the longitudinal magnetic field intensity. Liu’s model showed that near the crucible wall, HMCZ inhibited the longitudinal molten flow caused by heat convection, delaying and blocking the oxygen transfer [7]. However, the radial magnetic field destroyed the symmetry of the growth system relative to the growth axis, so the effect of the magnetic field was also non-axisymmetric, resulting in the appearance of growth fringes at the crystal surface intervals. During the growth of VMCZ, the oxygen concentration in the crystal is affected by many variables and cannot be easily controlled. Therefore, in this research, the cusp magnetic field is considered as a more suitable method for crystal growth to better control the oxygen concentration of silicon single crystals than HMCZ and VMCZ. In past studies, the oxygen concentration of crystals can be improved by the application of the magnetic field and by changing the crucible rotation, but simply changing the crucible rotation parameter is not sufficient to maintain the oxygen level in the ideal range. In Borisov [8], a steady-state turbulence model was proposed for the extended hypothesis of Reynolds number stress tensor, which takes into account the different mechanisms of Reynolds number stress anisotropy and can be used for fast two-dimensional engineering calculations. Nguyen [9] numerically investigated the effects of a balanced/unbalanced cusp magnetic field (CMF) and crystal crucible inversion/iso-rotation on the heat, flow, and oxygen distribution during the growth of 8-inch silicon crystals. In Gunjal [10], a global model was established to study the effect of crystal and crucible rotation on melt flow in the absence and presence of electromagnetic fields.
The silicon melt is conductive, and under the action of a magnetic field, the flow of the melt will inevitably cause an induced current and thus generate Lorentz force. Under the action of Lorentz force, the heat convection in the silicon melt is inhibited, and the oxygen, point defects, and other impurities in the silicon crystal are suppressed. The oxygen vacancies are the most common point defects in technologically important complex oxide materials and influence their physical properties [11]. Proper distribution of the magnetic field can improve the uniformity of a single crystal and reduce initial oxygen concentration, boron, aluminum, and other impurities from the quartz crucible into the melt, thus improving the quality of silicon. The experimental and theoretical studies show that using a cusp magnetic field to pull crystals can control molten liquid’s convection, impurities transport, and defects formation [12]. The cusp magnetic field is asymmetrically distributed relative to the pulling shaft, and the magnetic fields cancel each other at the center point, resulting in zero magnetic field strength in the vertical direction. A vertical magnetic field is formed away from the center of the magnetic field, and a horizontal magnetic field is formed along the radius. In this way, by applying a cusp magnetic field to the molten silicon liquid, the convection of the molten silicon liquid along the direction orthogonal to the magnetic field line can be controlled. As a result, it can not only reduce the amount of oxygen from the quartz crucible but also promote oxygen evaporation in the silicon molten liquid to stably grow a single crystal with lower oxygen concentration.

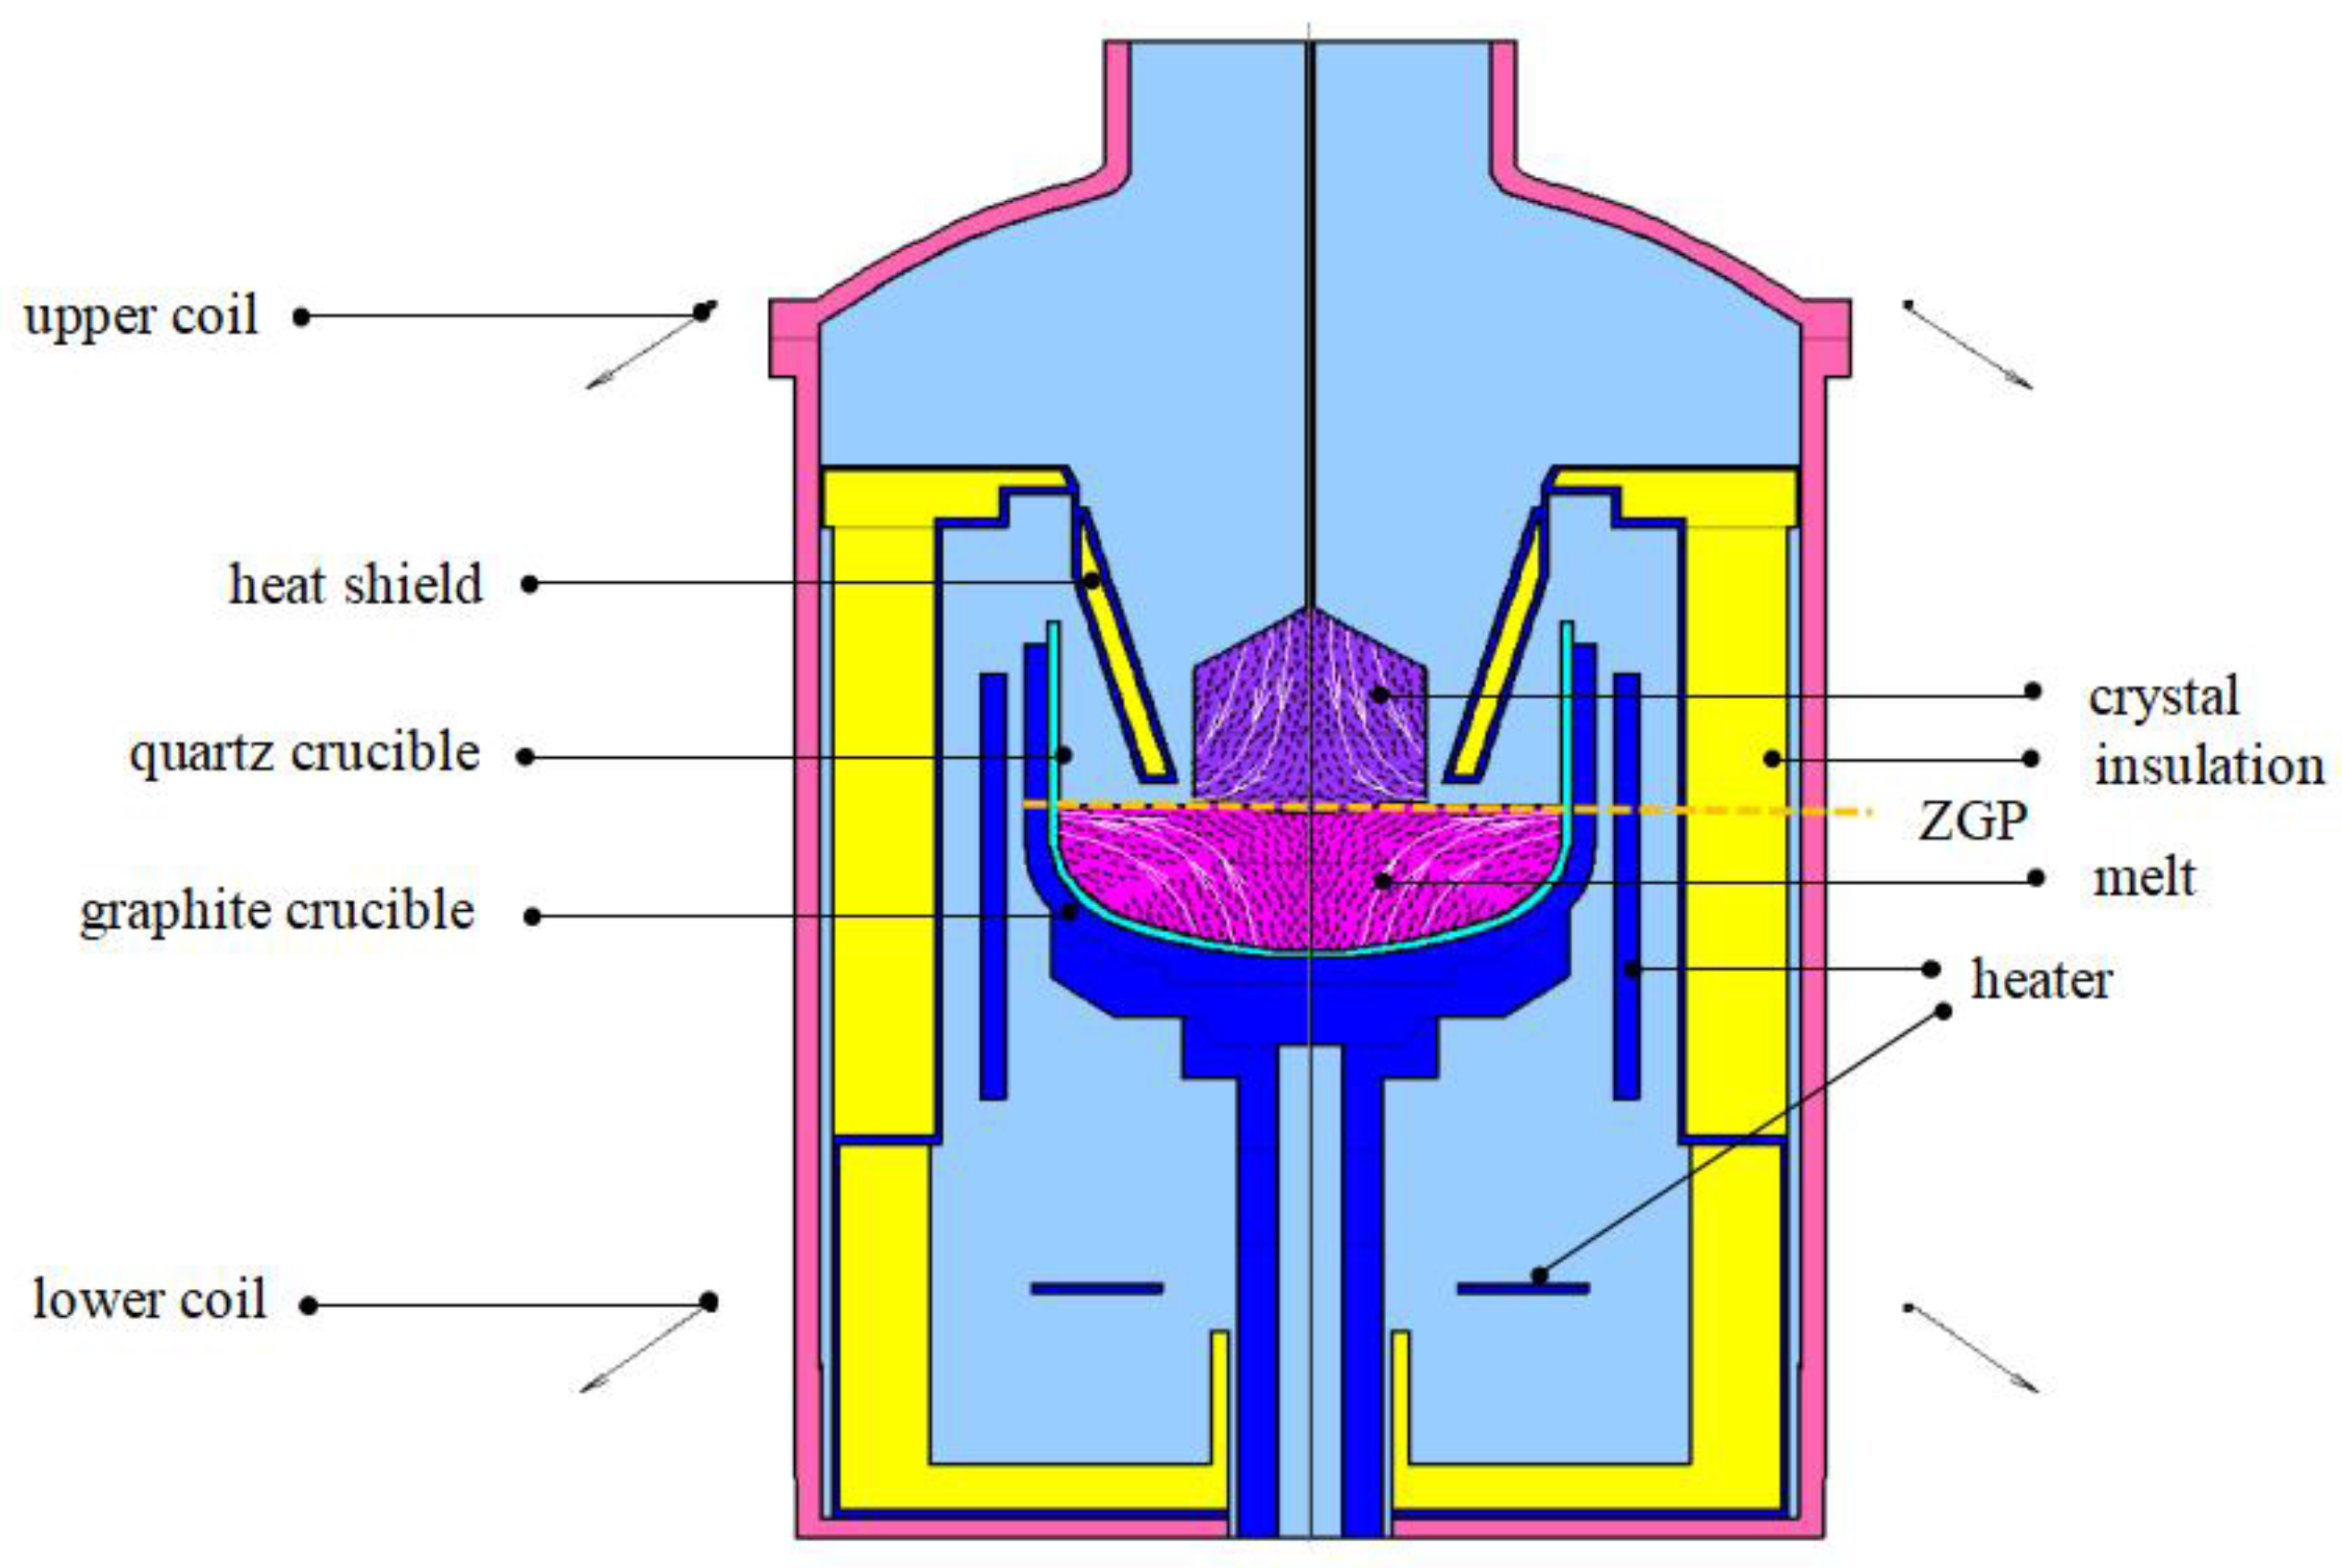
2. Experimental Setup and Modeling Approach

An installation schematic of the industrial CZ system with the cusp magnet is shown in Figure 1. The system mainly consists of a single crystal furnace, heater, graphite crucible, quartz crucible, crystal pulling, and rotation equipment. The system is applied to grow a 300 mm diameter silicon single crystal; the initial weight of the silicon melt is 260 kg, and the single crystal growth parameters are shown in Table 1. Notably, the crystal and crucible rotations are opposite. Argon flow rates and furnace pressure are fixed during crystal growth. The CMF is added to the outside of the single crystal furnace, which is specially produced at Zhonghuan Advanced Semiconductor Materials Co., Ltd., Yixing, China. The coil of the CMF is coaxial with the crystal growth furnace; there are two coils in the cusp-magnetic configuration, upper and lower coils, which are used to induce a CMF, and the current of the upper and lower coils is opposite. The zero-Gauss plane (ZGP) is determined by the Gauss meter and is at the mid-position between the upper and lower coils in the CMF configuration, as shown by the blue line. The reference intensity of the magnetic field is 0.09 T, which is set at the intersection of the ZGP position and the quartz crucible. The intensity remains constant during the growth process.

3. Description of Cusp Magnetic Field

We conducted numerical simulations on the control of the oxygen concentration using a CGSim (crystal growth simulator). The CMF is shown in Figure 2. During crystal growth, the crystal solid-liquid interface is fixed in the symmetric region of two coils. The effective magnetic field is composed of a longitudinal magnetic field perpendicular to the bottom of the crucible and a radial magnetic field perpendicular to the wall of the crucible, while there is no orthogonal magnetic field composition on the surface of the molten liquid. The position of the ZGP is determined by changing the position of the fixed coil while maintaining a constant magnetic ratio (MR) of the upper and lower coils, which means the upper and lower coils have the same distribution.
In this paper, the initial oxygen concentration behavior in the silicon crystal was studied in three zero-Gauss plane models: ZGP located (a) 20 mm above the melt-gas (m-g) interface, (b) on the m-g interface, and (c) 20 mm below the m-g interface. Previous studies [13] have detailed numerical simulation methods for temperature, melt flow, and oxygen diffusion boundary conditions at the quartz crucible walls. The influence of the magnetic field position on oxygen concentration is based on the diffusion boundary conditions of melt flow velocity at the crucible wall and solid-liquid interface, respectively. All numerical calculations were performed using CGSim (version 23.1) software.

4. Results and Discussion

4.1. CMF Effects on the Silicon Melt Convection

Figure 3 compares the influence of magnetic field intensity and distribution on the flow structure under different CMF conditions. It can be seen from Figure 3 that the structure of the melt under different CMF conditions consists of two parts, one of which forms a Taylor–Proudman unit (1) under the ingot, and the other part forms a buoyancy unit (2) along the crucible wall [14]. Among them, cell (1) is mainly caused by the rotation of the crystal and crucible, and cell (2) is mainly formed by convection driven by buoyancy. Apparently, under the three ZGP models, the distribution area and strength of the two kinds of circulation have obvious changes.It can be noticed from Figure 3 that the Taylor–Proudman vortex (1) is a clockwise flow cycle. As the position of the zero magnetic surface moves down, the horizontal magnetic field near the growth interface gradually increases and dominates because this direction is contrary to the Taylor–Proudman vortex (1), and inhibits the clockwise cell (1) in the crystallization zone. On the contrary, as the zero magnetic surface moves upward, the horizontal magnetic force weakens, and the flow area of the Taylor–Proudman vortex (1) gradually increases and affect the distribution of the flow (2) in the oxygen-enriched parts with melt, thus affecting the oxygen to deliver to the crystallization surface. To more clearly judge the difference in convection strength in the three cases, we intercept the intersection of cells (1) and (2) in Figure 3a–c (shown by the red triangle star in the figure) and compare the flow velocity. The following data are obtained: when the ZGP is +20 mm, the Vx-Vy value is 6.4348 × 10⁻³ m/s; when the ZGP is 0 mm, the Vx-Vy value is 7.3943 × 10⁻³ m/s; when the ZGP is −20 mm, the Vx-Vy value is 8.0582 × 10⁻³ m/s. Therefore, when the zero magnetic plane position is moved down, the flow rate at the intersection increases, so oxygen will have a greater chance of getting into the single crystal.
When the ZGP is at 20 mm above the m-g interface, the CMF suppresses the buoyancy convection near the crucible wall, which is a region of high magnetic field intensity. The cell (1) extends from the central part to the outer region of the melt, and the flow area is the largest, thus preventing the diffusion of oxygen from the bottom of the crucible wall into the solid-liquid interface, as shown in Figure 3a.
In addition, moving the center of the ZGP above the m-g interface increases the vertical component of the CMF in the direction opposite to the buoyancy cell (2). In particular, the ZGP is located 20 mm above the m-g interface, which leads to weak cells (2). Moreover, it can be seen from the magnetic induction intensity distribution in Figure 3c that the bottom of the crucible wall is the weakest in this case. Therefore, the buoyancy cell (2) is enhanced, while the Taylor–Proudman cell (1) is weakened, resulting in a higher oxygen melt at the bottom, entering the crystal. At the same time, the distribution of the two kinds of flow circulations leads to the M-shaped growth interface geometry shown in Figure 3c, which is known as a source generated from dislocation [15] and is not conducive to the single crystal growth process.

4.2. CMF Effects on the Oxygen Transport

The oxygen concentration in the silicon melt is equal to the difference between the dissolution rate of the quartz crucible and the evaporation rate of SiO. It is assumed that oxygen diffusion at all surfaces is of dissolution and evaporation rate determinants, and in the case of steady growth, can establish a simple relationship:
[O]s = [O]m − [O]a
where, [O]S, [O]m, and [O]a are the number of oxygen atoms from unit time entering the crystal, melting from the quartz crucible, and evaporating from the free surface of the melt [16,17,18,19], respectively.
[ O ] s = A R v k e C m = A c D ( C c C m ) / δ c A m D ( C a C m ) / δ m
where AR is the cross-sectional area of the crystal rod, Ac is the contact area between the quartz crucible and silicon melt, Am is the contact area between silicon melt and external atmosphere, v is the pulling speed, ke is the effective segregation coefficient of oxygen, and Cm is the concentration of oxygen in the melt. Cc is the concentration of oxygen on the surface of the quartz crucible, Ca is the concentration of oxygen in the peripheral atmosphere, δ c is the thickness of the diffusion boundary layer between the quartz crucible and silicon melt, δ m is the thickness of the diffusion boundary layer between silicon melt and the peripheral atmosphere, and D is the diffusion coefficient.
The factors that determine the dissolution rate of the quartz crucible are the crucible wall temperature and the contact area between the quartz crucible and the silicon melt. The dissolution rate of the quartz crucible, like most chemical reactions, increases exponentially with an increase in temperature. Therefore, the temperature of the quartz crucible wall will increase the Cc value in Equation (2). Because the center of the melt surface must remain at the freezing point, an increase in the temperature of the quartz crucible wall corresponds to an increase in the temperature gradient inside the silicon melt. In the three models studied in this paper, the weight of the silicon melt is the same as the size of the quartz crucible, so the contact area between the quartz crucible and the silicon melt is fixed, and the area ratio (Ac/Am) of the silicon melt to the free surface is the same. The dissolution rate of the quartz crucible is mainly affected by temperature, and the temperature distribution under the three models is shown in Figure 4a–c. It can be seen from the figure that the temperature difference between the quartz crucible wall and the temperature difference at the free interface is very small, and the difference is less than 1 k, so there is barely a difference between oxygen dissolution rate and evaporation.
Based on the above discussion, under certain crystal growth parameters, the oxygen concentration in the crystal depends on the thickness of the two diffusion boundary layers. However, convection in the melt will affect the thickness of the diffusion boundary layer, change the transport of oxygen content, and thus affect the distribution of oxygen content, so it is significant to study the convection in the melt. The theoretical calculation of the thickness of the boundary layer is easily derived. In the previous research, the boundary layer at the crucible wall was discussed [20], and there is a substantial theory and calculation method. The habitual force expression of the unit is ρ v u / x , and u / x is proportional to U/l (U is the velocity at the outer edge of the boundary layer); therefore ρ u 2 / l , and the expression of friction force of the monolith volume is τ / y . Suppose that under the condition of stratified flow, its expression is μ 2 u / x 2 ; since the magnitude of the velocity ladder perpendicular to the wall is equal to the magnitude of the accumulated friction force of the mono site, the lower relation formula can be obtained as follows,
μ U / δ 2 ~ ρ U 2 / l
The correlation formula of boundary layer thickness is obtained, below:
δ ~ μ l / ρ U = v l / U
The scale factor is 5, taking the length of 1 as the reference length, so it can be calculated as follows,
δ = 5 / Re
The common formula of the deduced boundary layer is as follows,
δ ( x ) vx / U
It can be concluded from Formula (6) that the boundary layer is inversely proportional to the axial flow velocity, where the thickness of the boundary layer, Re, is the Reynolds number, and U = V(x,y) is the longitudinal velocity.
Consequently, to clearly explain the effect on oxygen concentration under the three magnetic field models, we will focus on the convection at the crucible wall, crucible bottom, and free interface. As can be seen from the convection distribution on the right of Figure 3, under the action of buoyancy unit (2), the convection at the crucible wall is dominated by the longitudinal direction, while the convection at the bottom of the crucible and the free interface is radial and opposite. As can be seen from the description of the first section, the convection under different magnetic field conditions is different. To clearly explain the oxygen concentration under the three magnetic field models, we show a typical example of the distributions of radial velocity components in the melt, as shown in Figure 5a–c.
It is generally known that the oxygen in the melt comes from oxygen dissolution, which occurs at the interface between the silicon melt and the crucible. The oxygen is mainly dissolved at the bottom of the crucible and then transferred to the vicinity of a solid-liquid interface through thermal convection. According to previous studies and Formula (6), the thickness of the boundary layer is inversely proportional to the velocity at this position. As can be seen in Figure 5a–c, the horizontal velocity at the bottom of the crucible and Angle R gradually increases as the position of the ZGP moves down, and the horizontal convective flow rate of the melt near the bottom of the crucible is the largest at the −20 mm position. Therefore, the diffusion boundary layer between the quartz crucible and the silicon melt at this position is thin, the washing of the crucible wall is more intense, resulting in more oxygen impurities entering the melt, and finally, a part of the oxygen in the melt is integrated into the crystal. The oxygen concentration distribution in the three cases is displayed in Figure 6a–c. Through the comparison of the results of oxygen concentration, the oxygen concentration near the bottom of the crucible gradually increases as the position of the ZGP moves down, and it is again verified that the decomposition of the crucible wall is inversely proportional related to the strength of the convection flow (that is the thickness of the boundary layer).
The influence of different CMF configurations on the flow pattern has been studied above, and the initial oxygen concentration distribution in the three cases is displayed in Figure 6a–c. In the CMF, most of the oxygen is carried to the free surface and evaporates. Only a small amount is transported to the crystallization zone. A small gradient of oxygen concentration is found in the core region of the melt due to the Taylor–Proudman flow.
When the ZGP is located 20 mm above the m-g interface, according to the above discussion and VX-Vy overall analysis, the flow rate near the crucible wall is slow due to the inhibition of the melt convection near the crucible wall, which results in a decrease in the dissolved oxygen concentration in the crucible wall and the slow corrosion rate of the crucible. Moreover, with the melt convection of cell (2), oxygen in the area near the crucible wall is transported to the free interface and volatilized. Less oxygen is delivered to the core region of the melt, and less and less oxygen diffuses into a crystal, so the low-oxygen zone below the solid-liquid interface is larger, as shown in Figure 6a.
When the ZGP is located on the m-g interface at a given magnetic field strength, the zero magnetic surface enhances the flow of dissolved oxygen from the crucible into the melt, then brings it into the crystal. However, a decrease in the axial magnetic intensity in the crystallization zone causes the radial distribution of oxygen on the growth interface to become uniform.
When the ZGP is located 20 mm below the m-g interface cases, with the change in the position of the zero magnetic surface, the strength and weakness of the convection flow near the crucible wall changed with it. Under the action of strong convection, the melt convection brushing near the wall of the quartz crucible is stronger. This can also be proved by the melt convection intensity distribution oxygen concentration at the growth interface, which increases, greater than at 20 mm above the m-g interface.
In the above-mentioned, single-crystal growth parameters (experiments are carried out with fixed rotation rates for the crucible and crystal), we carried out the actual industrial single-crystal pulling process. The whole single crystal is segmented, and a slug is taken at the segmented position and tested by Fourier transform infrared spectroscopy (FT-IR) to obtain the central oxygen concentration of the head and tail of each crystal segment. The results are shown in Figure 7. The figure displays the difference in oxygen concentration in the center of the interface at the crystal segment with the crystal length. When the ZGP is located 20 mm above the m-g interface, the overall oxygen concentration shows the lowest level. At the former part of crystal lengths, the axial oxygen concentration decreases slowly as the crystal length increases until it reaches a minimum; the lowest value in the three groups was 1.02 ppma. Then it increases continuously as the crystal length increases further. Therefore, the largest oxygen concentration appears in the initial and final stages of the whole crystal growth process. The experimental results and simulation results show the same trend, which further confirms the discussion under numerical simulation in this paper.

4.3. CMF Effects on Growth Interface

We compared the shape of the growth interface under different CMFs; the simulation results are shown in Figure 8. When the ZGP is located 20 mm above the m-g interface, the interface is convex to the crystal. While the ZGP is located on the m-g interface, the interface near the crystal axis is slightly concave to the crystal and convex at the right side near the edge of the crystal. When the ZGP is located 20 mm below the m-g interface, the growth interface becomes more convex towards the liquid direction, and a W-shaped growth interface is obtained. The interface shape is affected by the convection of the Taylor–Proudman unit (1) near the growth interface, as shown in Figure 3. In addition, it can be seen that the lower the position of the ZGP, the smaller the temperature gradient below the crystal, so the more convex near the crystal axis.
To confirm the morphology of the growth interface in the actual crystal growth and verify the guiding significance of the numerical simulation, we tested the growth interface of the single crystal in the actual industrial single-crystal pulling process. The results are shown in Figure 9. The red line is the location of the single crystal length discussed in the simulation. The experiment uses the LPCon-LP SCAN (Lateral Photovoltage Scanning) tool to select single crystal profile samples with a range of 50 mm length above and below the simulated single crystal position for longitudinal scanning. The sample is coated with gallium indium alloy to make them conductive, and the image of solid-liquid interface streaks of the profile is shown by infrared ray scanning through the sample. The results show that the growth interface on the surface under the three ZGP positions is consistent with the simulation trend, which further confirms that the actual production has a positive match with the numerical simulation.

5. Conclusions

This paper investigated the effects of CMF distribution at different positions of the zero-Gauss plane (ZGP) on melt convection, oxygen concentration transfer, and the crystal-melt interface of a 300 mm MCZ silicon crystal by conducting numerical simulations. The results show that when the ZGP moves downward gradually from the melt-gas interface, the melt flow velocity near the quartz crucible wall gradually increases, resulting in a decrease in the thickness of the diffusion boundary layer. Along with the changes in the convection area and intensity, more oxygen is generated and transported to the bottom of the solid-liquid interface, and eventually diffuses into the crystal, leading to a significant increase in oxygen concentration. In the oxygen concentration distribution of the crystal discussed in this paper, the ZGP located at +20 mm case is the lowest value in the calculation. In addition, the melt convection and temperature gradient at the solid-liquid interface lead to different shapes of the growth interface. When the ZGP is at +20 mm, the shape of the interface is convex towards the crystal, while at −20 mm, the interface near the crystal axis is slightly concave to the crystal. Additionally, the actual industrial crystal growth can be accomplished by simulation results, and the crystal data were evaluated. The trend of crystal oxygen concentration is consistent with the simulation analyses, and the scanning results of a solid-liquid interface are in line with the simulation results as well, indicating that the simulation and discussion in this paper provide valuable guidance for practical production.

Author Contributions

Formal analysis, H.C., H.L. and G.C.; Data curation, H.C.; Writing—original draft, C.S., X.A., H.Z. and G.C.; Writing—review & editing, H.Z., H.L. and G.C. All authors have read and agreed to the published version of the manuscript.

Funding

This work was supported by the project for the Science and Technology Correspondent of Tianjin City (Grant No. 20YDTPJC01710) and the Research Foundation of Education Bureau of Hebei (Grant No. QN2021044). Also Special thanks to Miao Wang and Mingchao Hou for their contributions in the experiments and Fab resource allocation.

Institutional Review Board Statement

Not applicable.

Informed Consent Statement

Not applicable.

Data Availability Statement

Not applicable.

Conflicts of Interest

The authors declare no conflict of interest.

References

  1. Schulze, H.-J.; Ofner, H.; Niedernostheide, F.-J.; Lukermann, F.; Schulz, A. Fabrication of IGBTs using 300 mm magnetic Czochralski substrates. IET Power Electron. 2019, 12, 3870–3873. [Google Scholar] [CrossRef]
  2. Kalaev, V.; Sattler, A.; Kadinski, L. Crystal twisting in Cz Si growth. J. Cryst. Growth 2015, 413, 12–16. [Google Scholar] [CrossRef]
  3. Bok-Cheol, S.; In-Kyoo, L.; Kwang-Hun, K.; Hong-Woo, L. Oxygen concentration in the Czochralski-grown crystals with CUSP-magnetic field. J. Cryst. Growth 2005, 275, 455–459. [Google Scholar]
  4. Liu, X.; Liu, L.; Li, Z.; Wang, Y. Effects of CUSP-shaped magnetic field on melt convection and oxygen transport in an industrial CZ-Si crystal growth. J. Cryst. Growth 2012, 354, 101–108. [Google Scholar] [CrossRef]
  5. Kakimoto, K.; Liu, X.; Nakano, S. Analysis of the Effect of CUSP-Shaped Magnetic Fields on Heat, Mass, and Oxygen Transfer Using a Coupled 2D/3D Global Model. Cryst. Res. Technol. 2022, 57, 2100092. [Google Scholar] [CrossRef]
  6. Koichi, K.; Kyung-Woo, Y.; Minoru, E. Oxygen transfer during single silicon crystal growth in Czochralski system with vertical magnetic fields. J. Cryst. Growth 1996, 163, 238–242. [Google Scholar]
  7. Liu, X.; Liu, L.; Li, Z.; Wang, Y. Effects of static magnetic fields on thermal fluctuations in the melt of industrial CZ-Si crystal growth. J. Cryst. Growth 2012, 360, 38–42. [Google Scholar] [CrossRef]
  8. Borisov, D.; Artemyev, V.; Kalaev, V.; Smirnov, A.; Kuliev, A.; Zobel, F.; Kunert, R.; Turan, R.; Aydin, O.; Kabacelik, I. Advanced approach for oxygen transport and crystallization front calculation in Cz silicon crystal growth. J. Crystal Growth 2022, 583, 126493. [Google Scholar] [CrossRef]
  9. Nguyen, T.-H.; Chen, J.-C.; Hu, C.; Chen, C.-H. Effects of crystal-crucible iso-rotation and a balanced/unbalanced cusp magnetic field on the heat, flow, and oxygen transport in a Czochralski silicon melt. J. Cryst. Growth 2020, 531, 125373. [Google Scholar] [CrossRef]
  10. Gunjal, P.R.; Ramachandran, P.A. Tailoring the oxygen distribution in 300 mm Czochralski crystal of pure silicon using cusp magnetic field. Prog. Comput. Fluid Dyn. Int. J. 2010, 10, 307–318. [Google Scholar] [CrossRef]
  11. Eglitis, R.I.; Purans, J.; Popov, A.I.; Jia, R. Tendencies in ABO3 perovskite and SrF2, BaF2 and CaF2 bulk and surface F-center Ab initio computations at high symmetry cubic structure. Symmetry 2021, 13, 1920. [Google Scholar] [CrossRef]
  12. Ding, J.; Li, Y.; Liu, L. Effect of CUSP magnetic field on the turbulent melt flow and crystal melt interface during large-size Czochralski silicon crystal growth. Int. J. Therm. Sci. 2021, 170, 107137. [Google Scholar] [CrossRef]
  13. Chen, J.C.; Guo, P.C.; Chang, C.H.; Teng, Y.Y.; Hsu, C.; Wang, H.M.; Liu, C.C. Numerical simulation of oxygen transport during the Czochralski silicon crystal growth with a CUSP magnetic field. J. Cryst. Growth 2014, 401, 888–894. [Google Scholar] [CrossRef]
  14. Raufeisen, A.; Breuer, M.; Botsch, T.; Delgado, A. Prediction of the three-phase boundary movement in Czochralski crystal growth. J. Cryst. Growth 2010, 312, 2297–2299. [Google Scholar] [CrossRef]
  15. Smirnova, O.V.; Durnev, N.V.; Shandrakova, K.E.; Mizitov, E.L.; Soklakov, V.D. Optimization of furnace design and growth parameters for Si Cz growth, using numerical simulation. J. Cryst. Growth 2008, 310, 2185–2191. [Google Scholar] [CrossRef]
  16. Murgai, A. Mechanisms of oxygen incorporation in Czochralski-grown silicon. In Semiconductor Silicon 1981 (Proceedings of the 4th International Symposium on Silicon Materials Science and Technology, Electrochemical Society PV 81-5); Huff, Y.T.H., Kriegler, R., Eds.; The Electrochemical Society: Pennington, NJ, USA, 1981; p. 11. [Google Scholar]
  17. Hoshikawa, K.; Hirata, H.; Nakanishi, H.; Ikuta, K. Control of oxygen concentration in Cz silicon growth. In Semiconductor Silicon 1981 (Proceedings of the 4th International Symposium on Silicon Materials Science and Technology, Electrochemical Society PV 81-5); Huff, Y.T.H., Kriegler, R., Eds.; The Electrochemical Society: Pennington, NJ, USA, 1981; p. 101. [Google Scholar]
  18. Carlberf, T.; King, T.B.; Witt, A.F. Dynamic Oxygen Equilibrium in Silicon Melts during Crystal Growth by the Czochralski Technique. J. Electrochem. Soc. 1982, 129, 189. [Google Scholar] [CrossRef]
  19. Moody, J.W. Oxygen precipitation in Czochralski silicon. In Semiconductor Silicon 1981 (Proceedings of the 4th International Symposium on Silicon Materials Science and Technology, Electrochemical Society PV 81-5); Huff, Y.T.H., Kriegler, R., Eds.; The Electrochemical Society: Pennington, NJ, USA, 1981; p. 100. [Google Scholar]
  20. Brice, J.C.; Laudise, R.A. The Growth of Crystals from Liquids; North-Holland Publishing Company: Amsterdam, The Netherlands, 1973; Chapter 4. [Google Scholar]
Figure 1. Schematic diagram of the major components of the industrial CZ furnace.
Coatings 13 01634 g001
Figure 2. Distribution of Bxy with CMF (a) 20 mm above the m-g interface, (b) on the m-g interface, (c) 20 mm below the m-g interface.
Coatings 13 01634 g002aCoatings 13 01634 g002b
Figure 3. Distribution of magnetic induction in the melt (left) and flow structure (right) with CMF (a) 20 mm above the m-g interface, (b) on the m-g interface, (c) 20 mm below the m-g interface.
Coatings 13 01634 g003aCoatings 13 01634 g003b
Figure 4. Distribution of temperature in the melt at (a) 20 mm above the m-g interface, (b) on the m-g interface, (c) 20 mm below the m-g interface.
Coatings 13 01634 g004
Figure 5. Distribution of radial velocity component (Vx) in the melt at (a) 20 mm above the m-g interface, (b) on the m-g interface, (c) 20 mm below the m-g interface.
Coatings 13 01634 g005aCoatings 13 01634 g005b
Figure 6. Distribution of oxygen concentration in the melt (left) and flow pattern (right) with CMF (a) 20 mm above the m-g interface, (b) on the m-g interface, (c) 20 mm below the m-g interface.
Coatings 13 01634 g006aCoatings 13 01634 g006b
Figure 7. Experimental data of oxygen concentration with CMF (a) 20 mm above the m-g interface, (b) on the m-g interface, (c) 20 mm below the m-g interface.
Coatings 13 01634 g007
Figure 8. Comparison between growth interface shapes under different CMFs in simulation (a) 20 mm above the m-g interface, (b) on the m-g interface, (c) 20 mm below the m-g interface.
Coatings 13 01634 g008
Figure 9. Comparison between growth interface shapes under different CMFs in experiments (a) 20 mm above the m-g interface, (b) on the m-g interface, (c) 20 mm below the m-g interface.
Coatings 13 01634 g009
Table 1. Single crystal growth parameter.
ParameterValue
Furnace pressure, Pa2000
Argon gas flow rate, slpm (standard liter per minute)95
Crystal pulling rate, mm/h24.5
The ratio of crystal to crucible rotation rate6:−1
Magnetic field strength, T0.09
Disclaimer/Publisher’s Note: The statements, opinions and data contained in all publications are solely those of the individual author(s) and contributor(s) and not of MDPI and/or the editor(s). MDPI and/or the editor(s) disclaim responsibility for any injury to people or property resulting from any ideas, methods, instructions or products referred to in the content.

