
Counter-Ion Effect on the Surface Potential of Foam Films and Foams Stabilized by 0.5 mmol/L Sodium Dodecyl Sulfate

 ,
, 
Abstract
:1. Introduction
2. Materials and Methods
2.1. Materials
2.2. Methods
2.2.1. Interferometric Study of Foam Films
2.2.2. Surface Tension and Capillary Pressure
2.2.3. Foam
2.2.4. Methodical Processing of the Results
3. Results
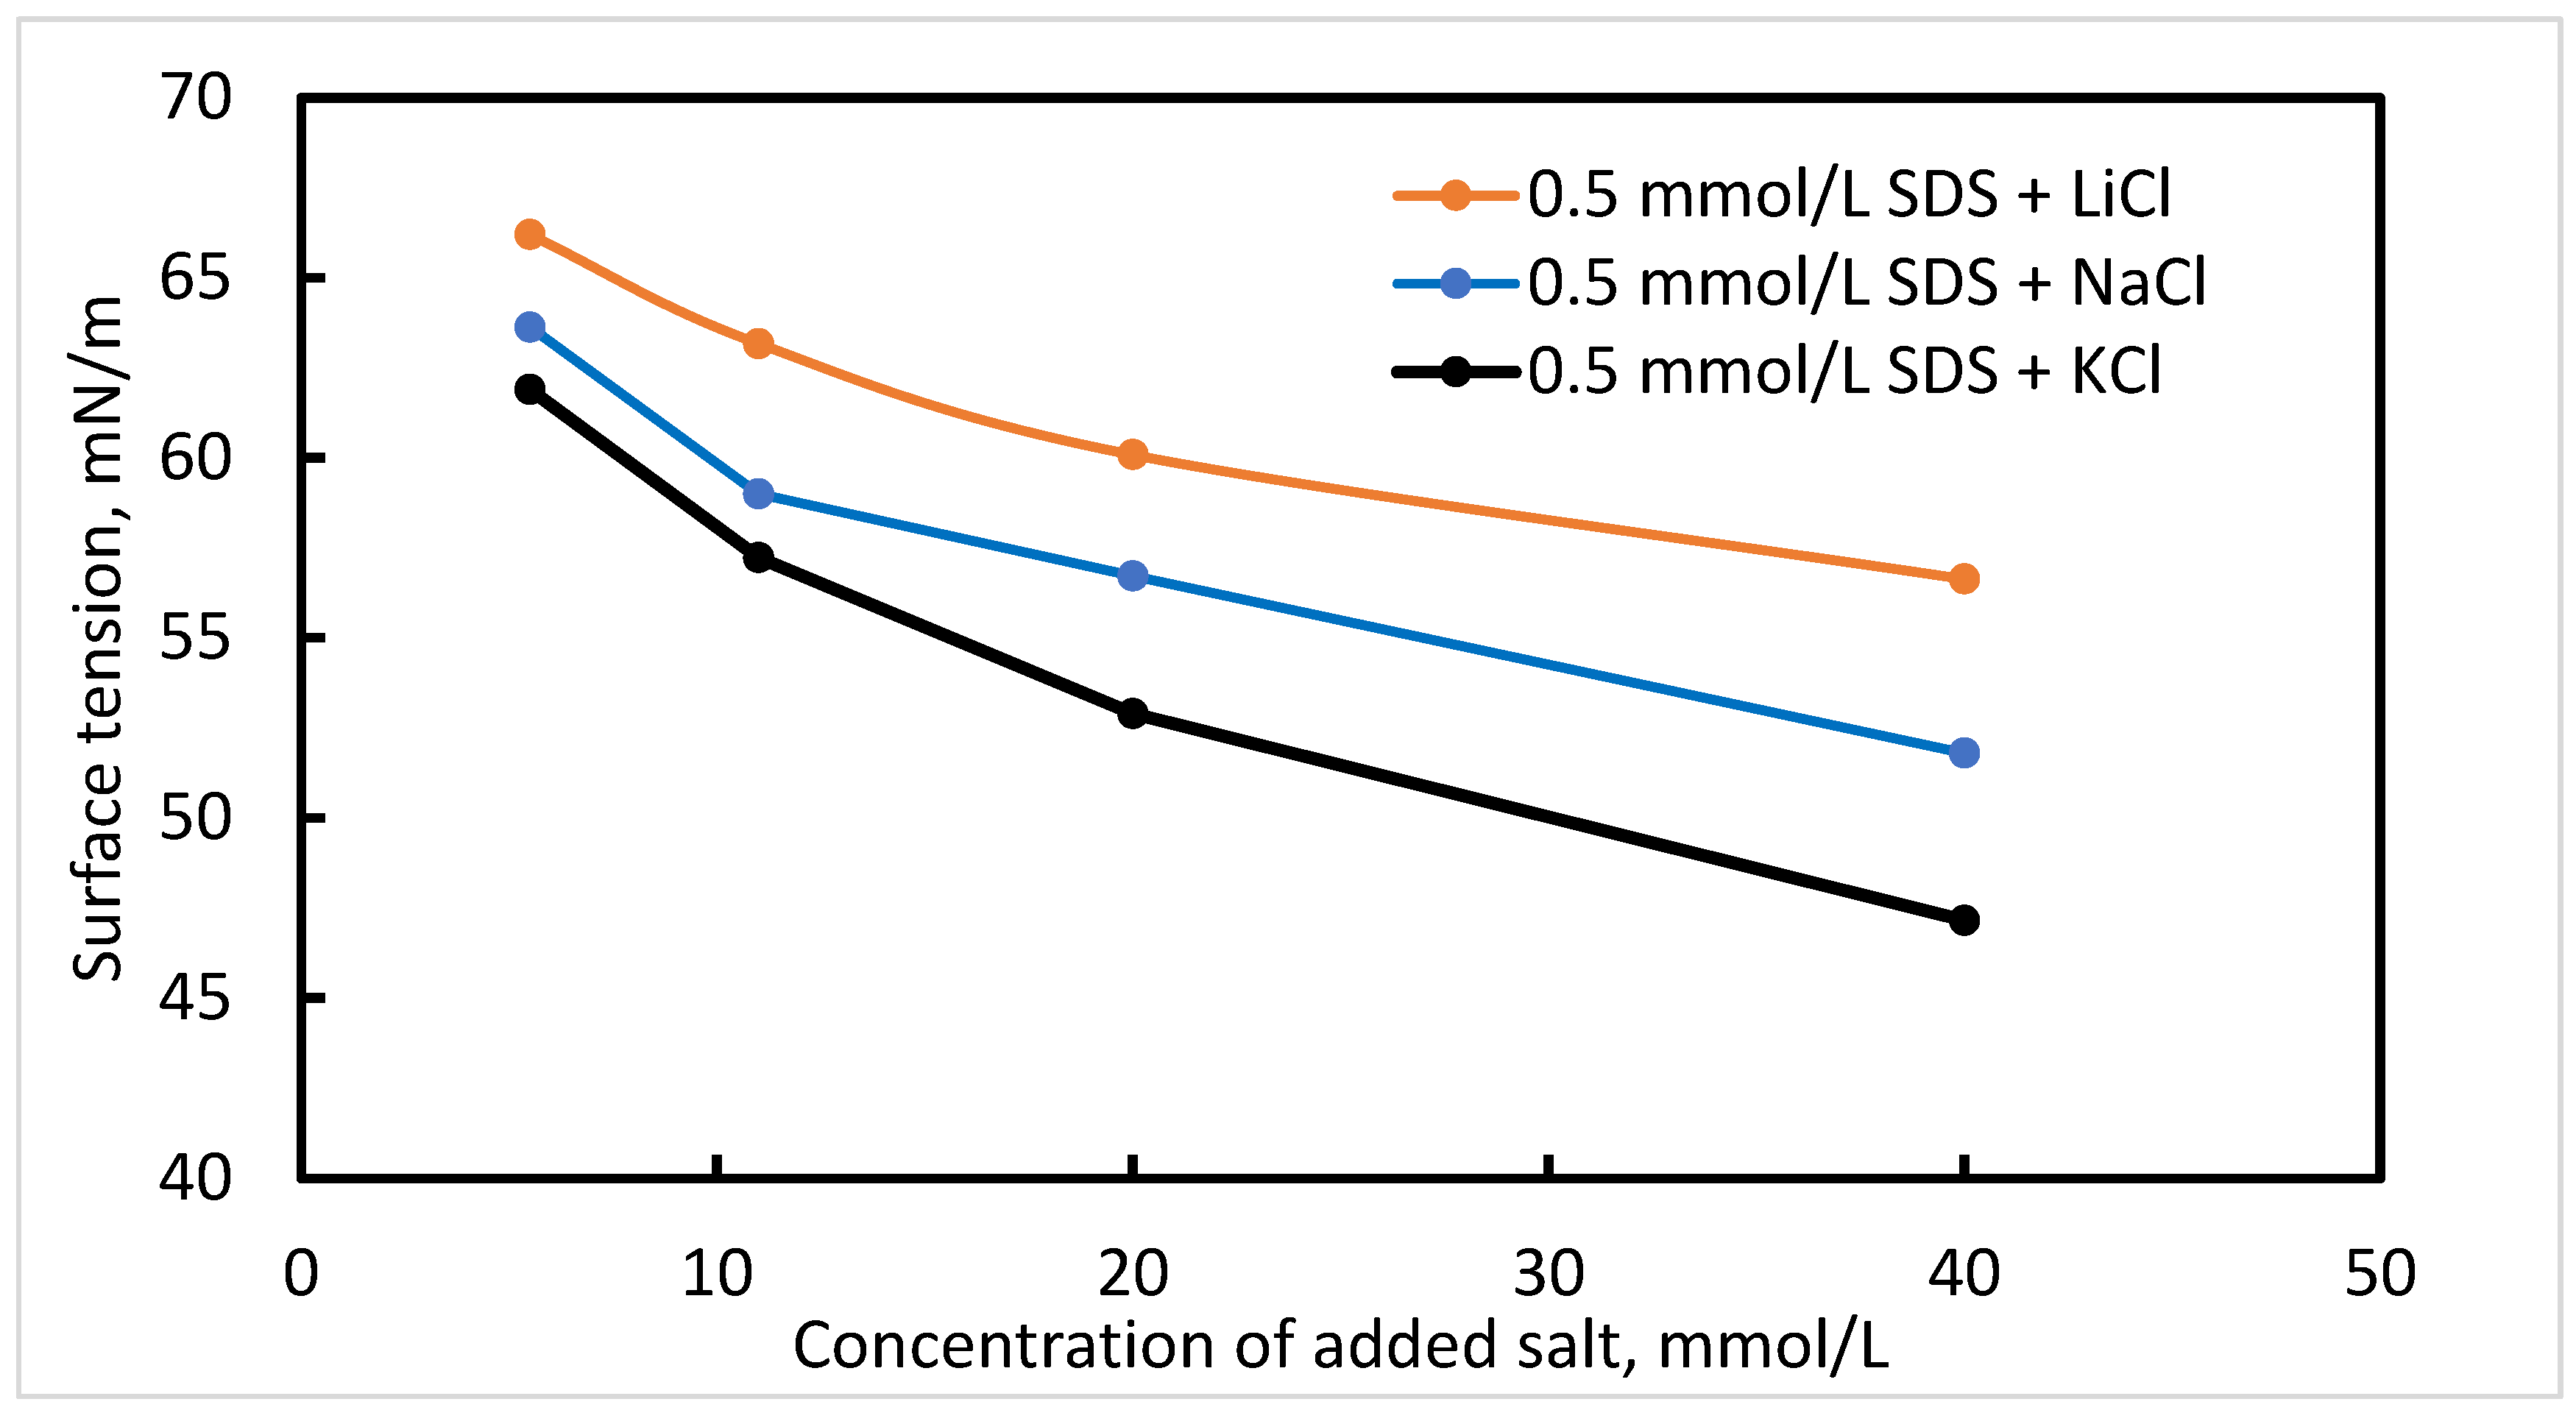
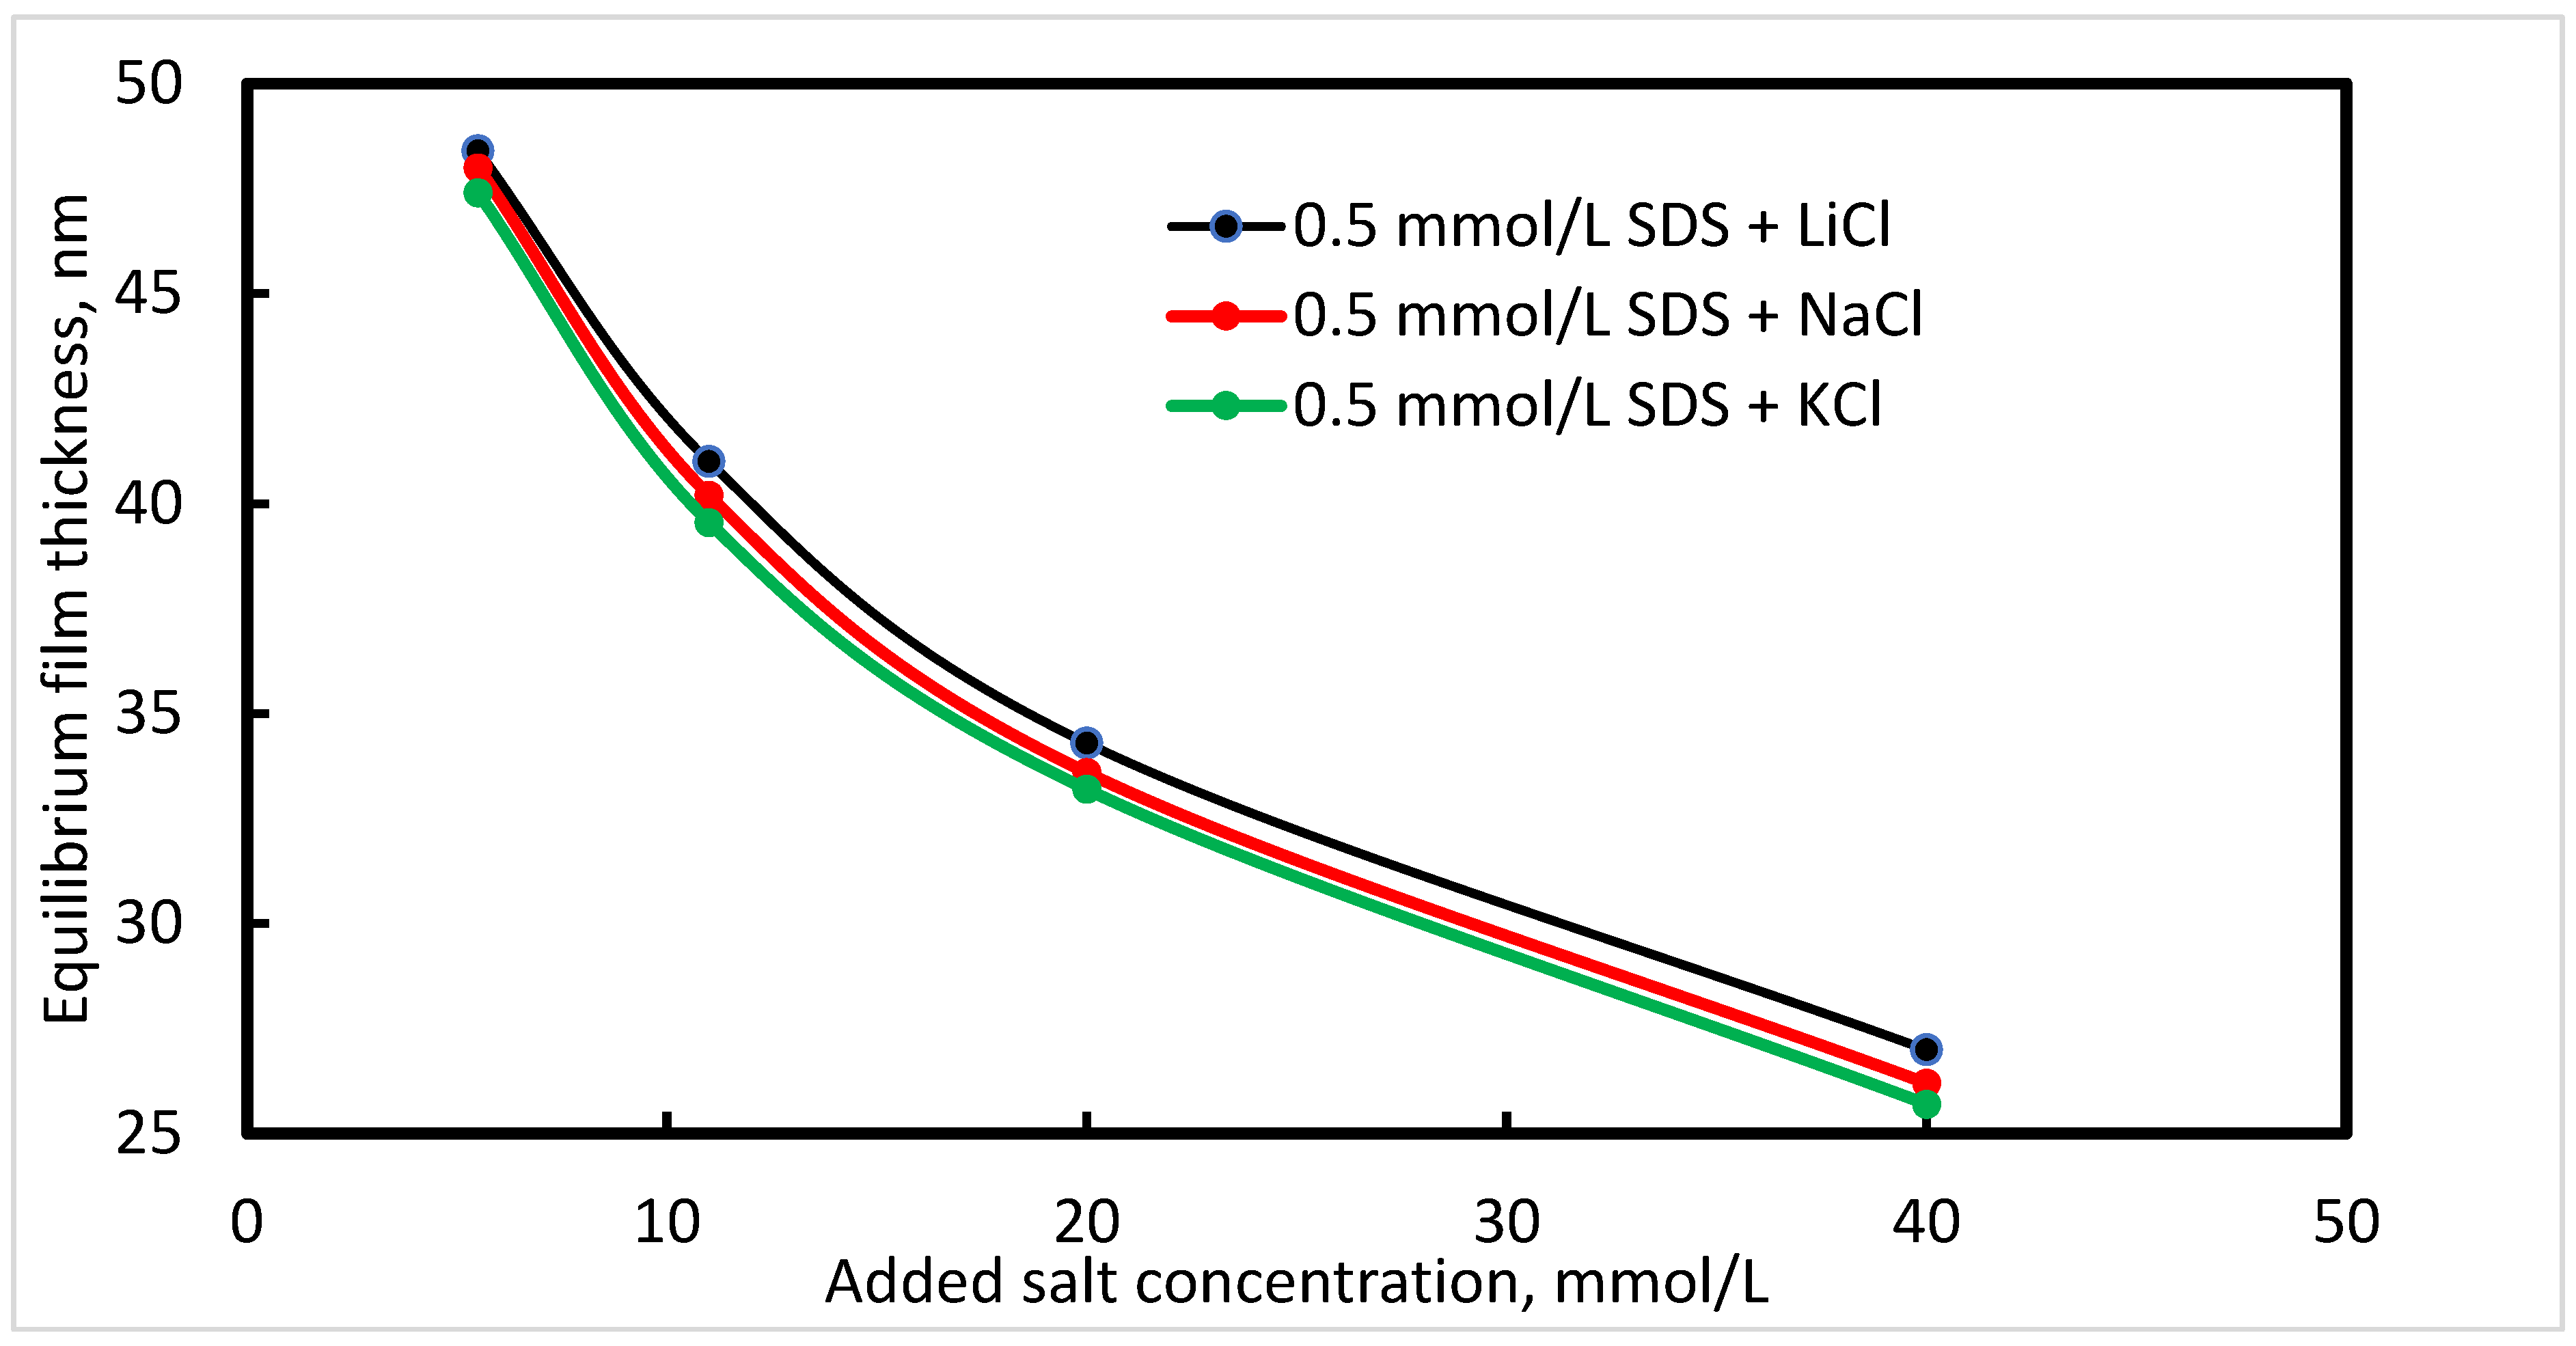
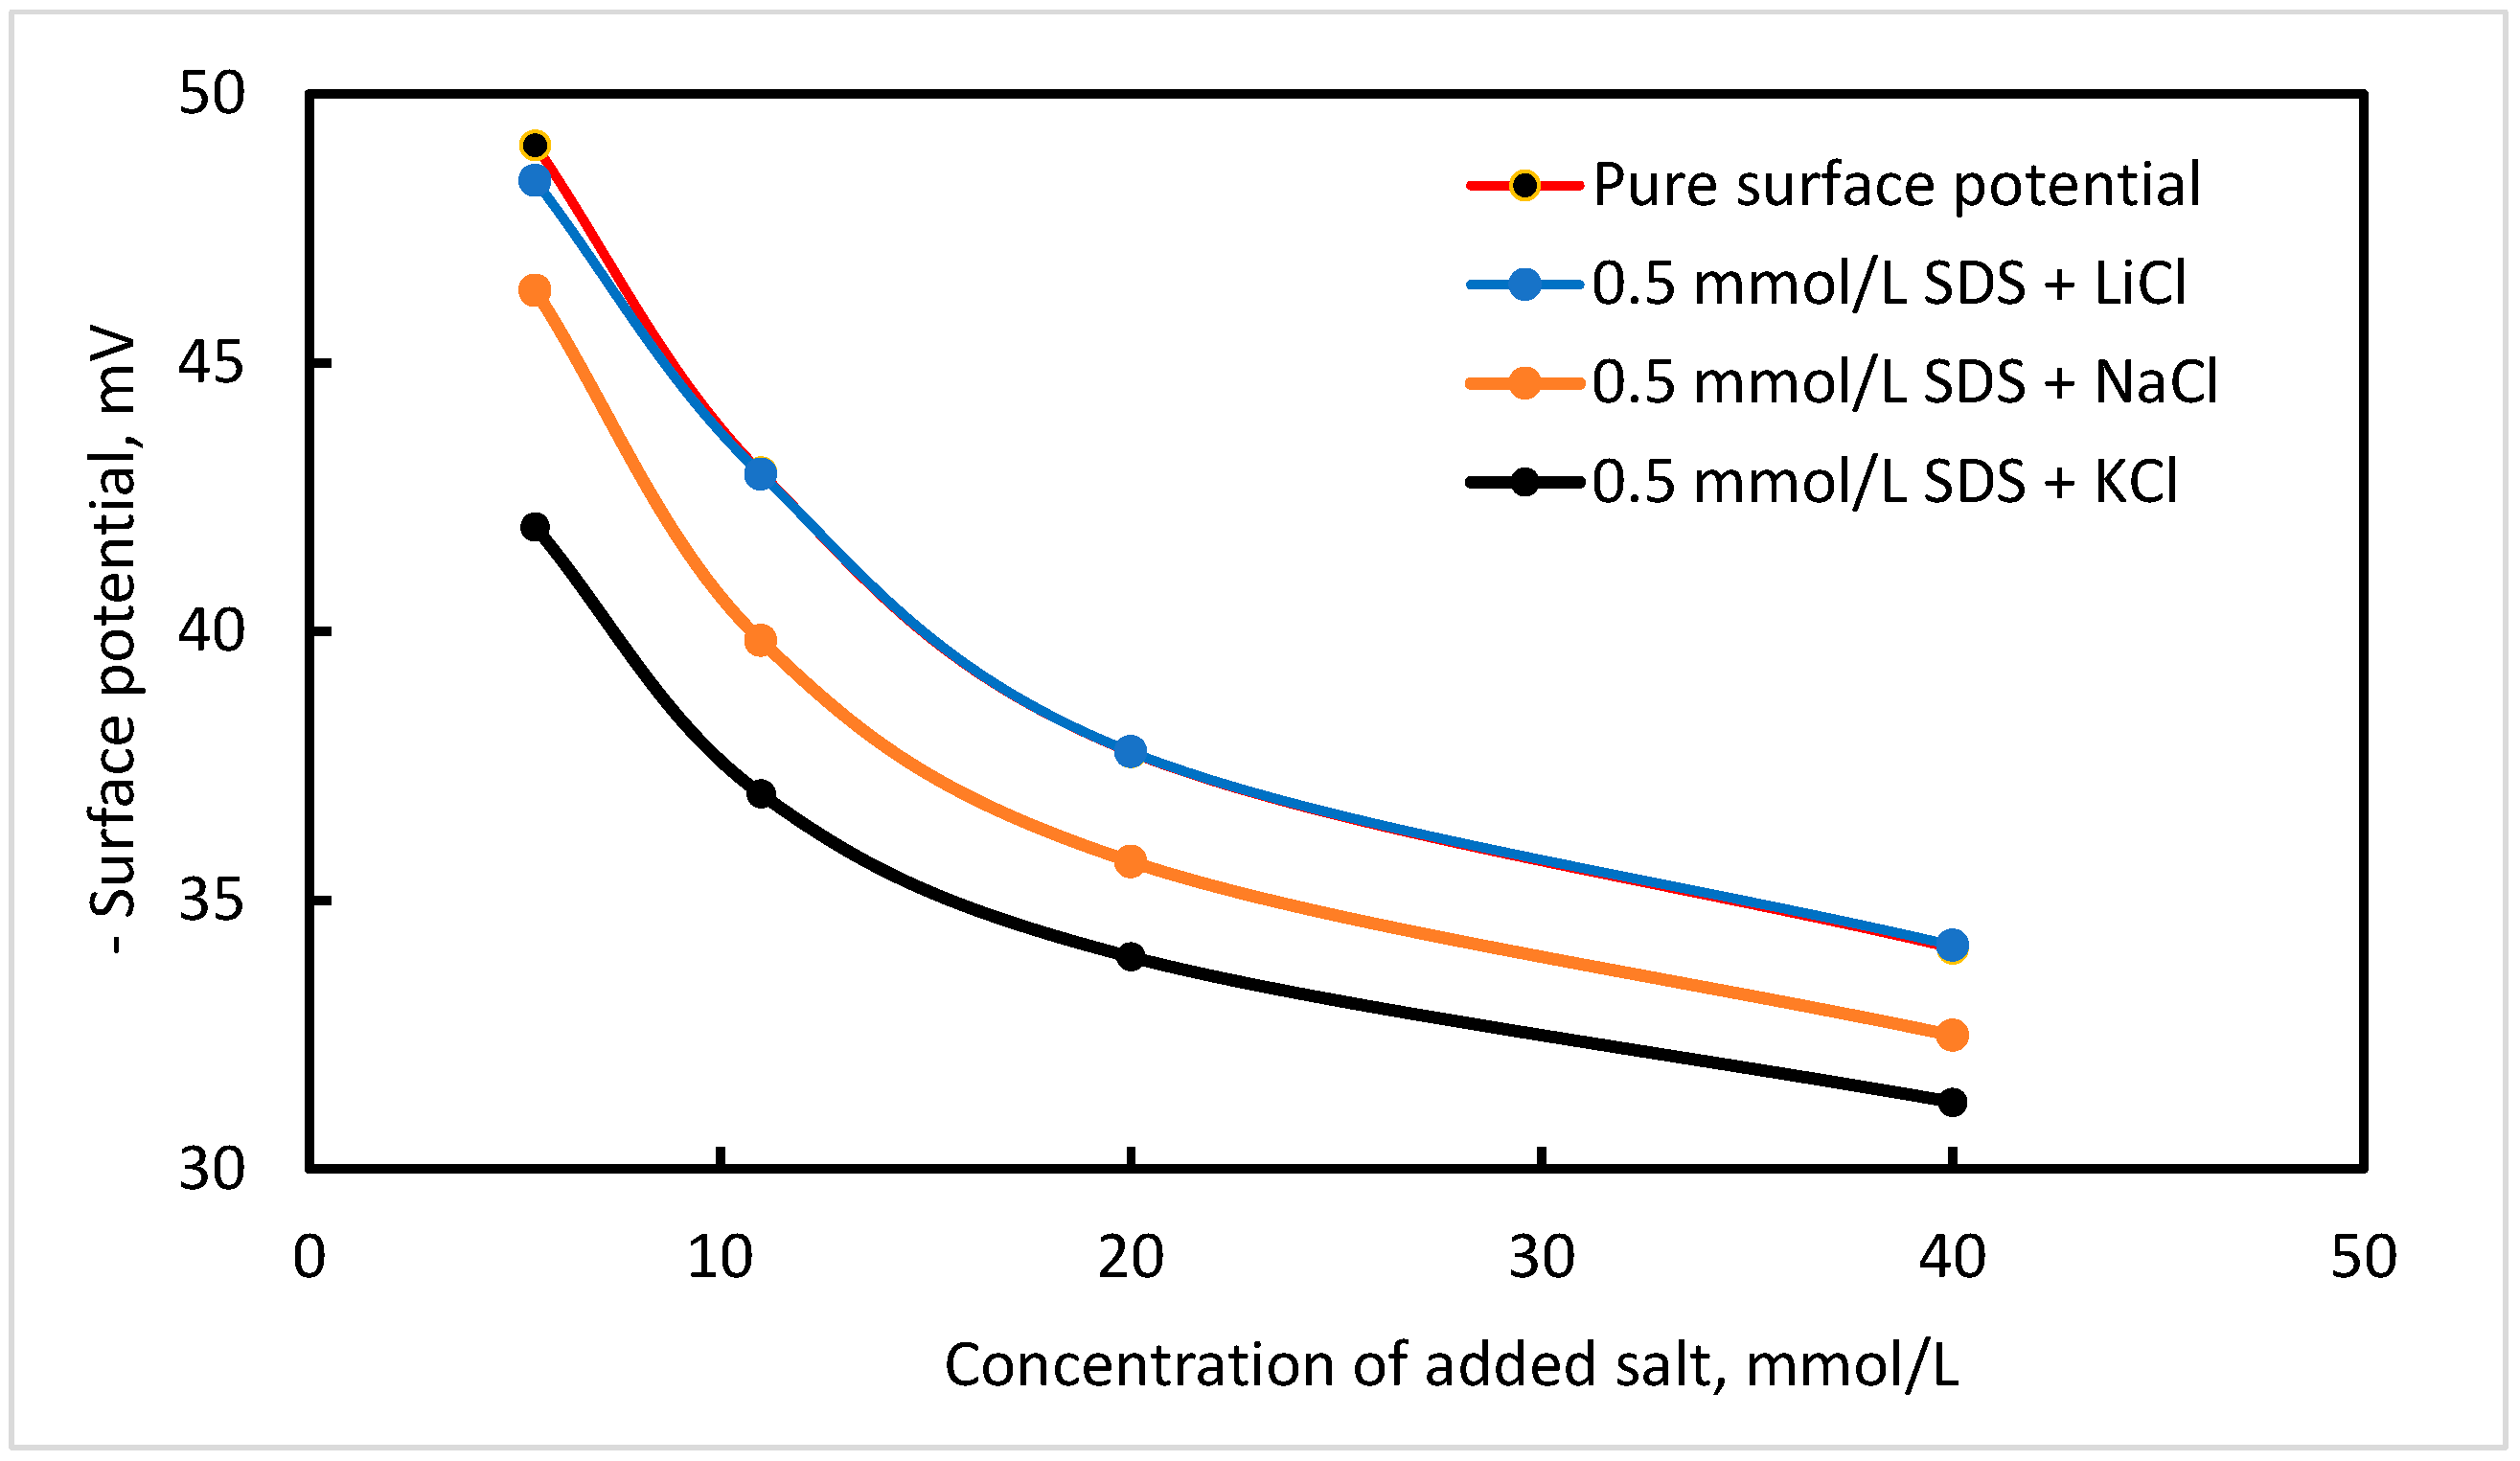
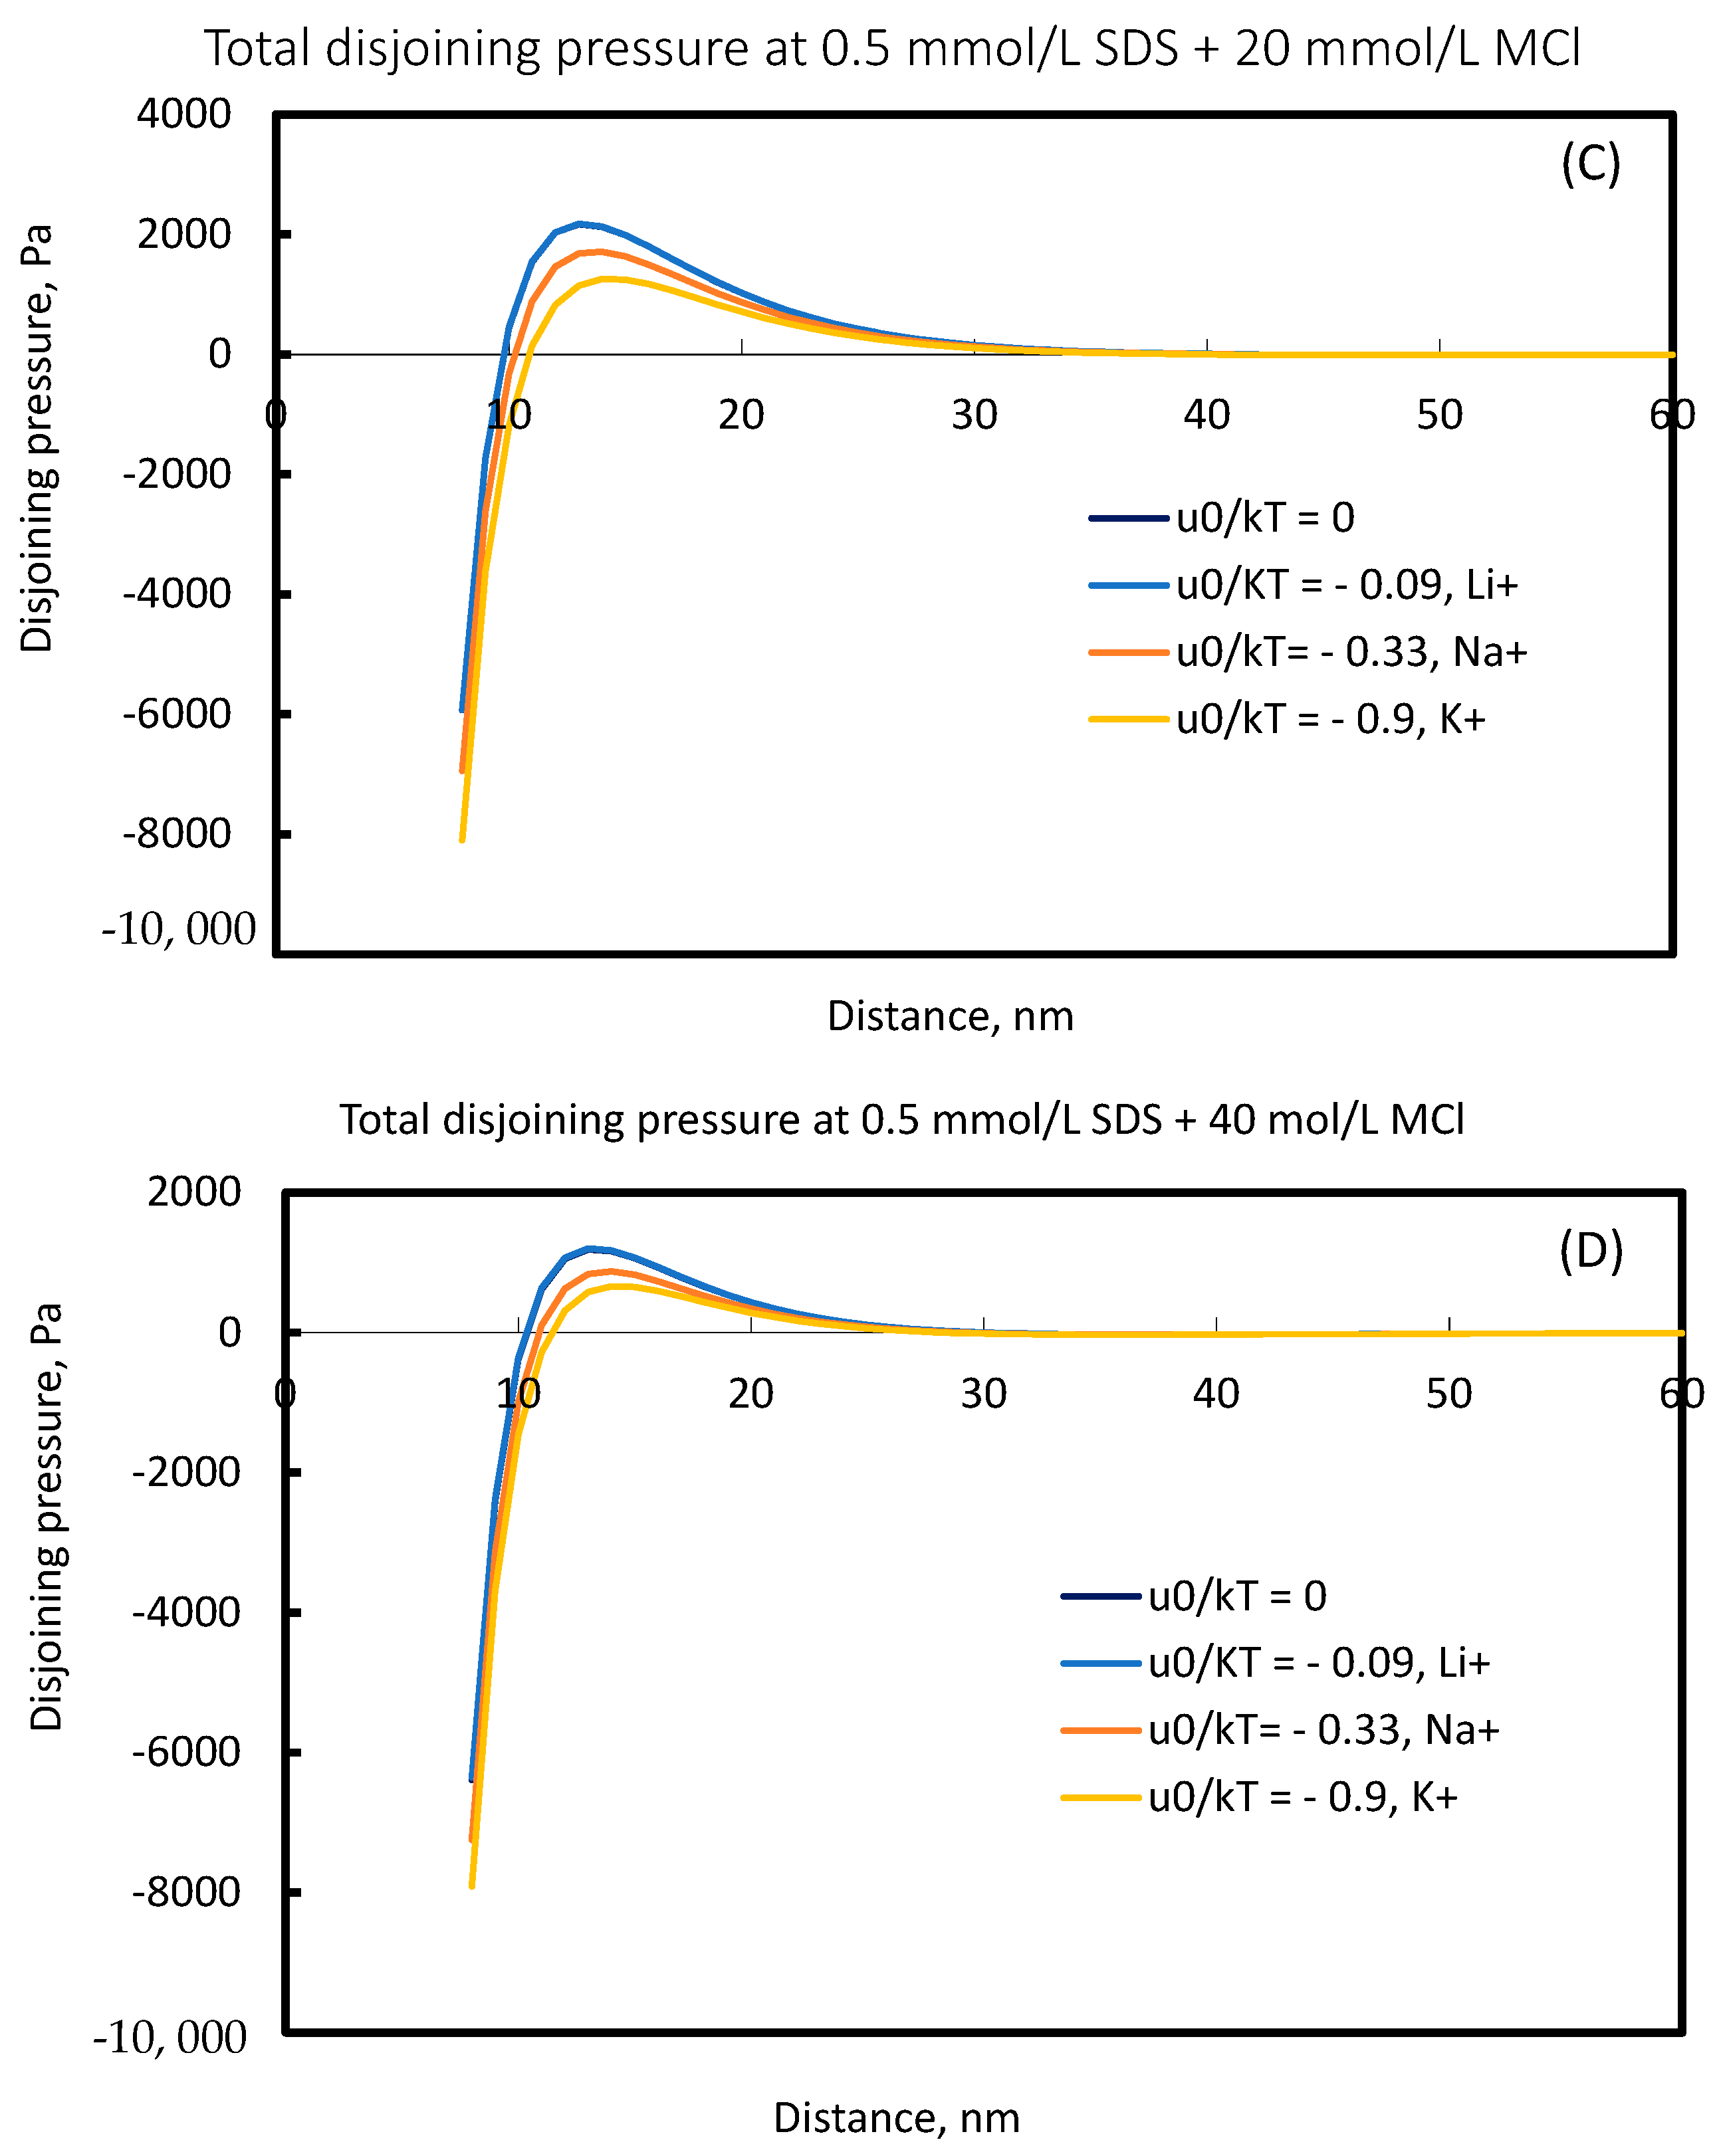
3.1. Counter-Ion Specific Effects on Thin Foam Films Stabilized by 0.5 mmol/L SDS
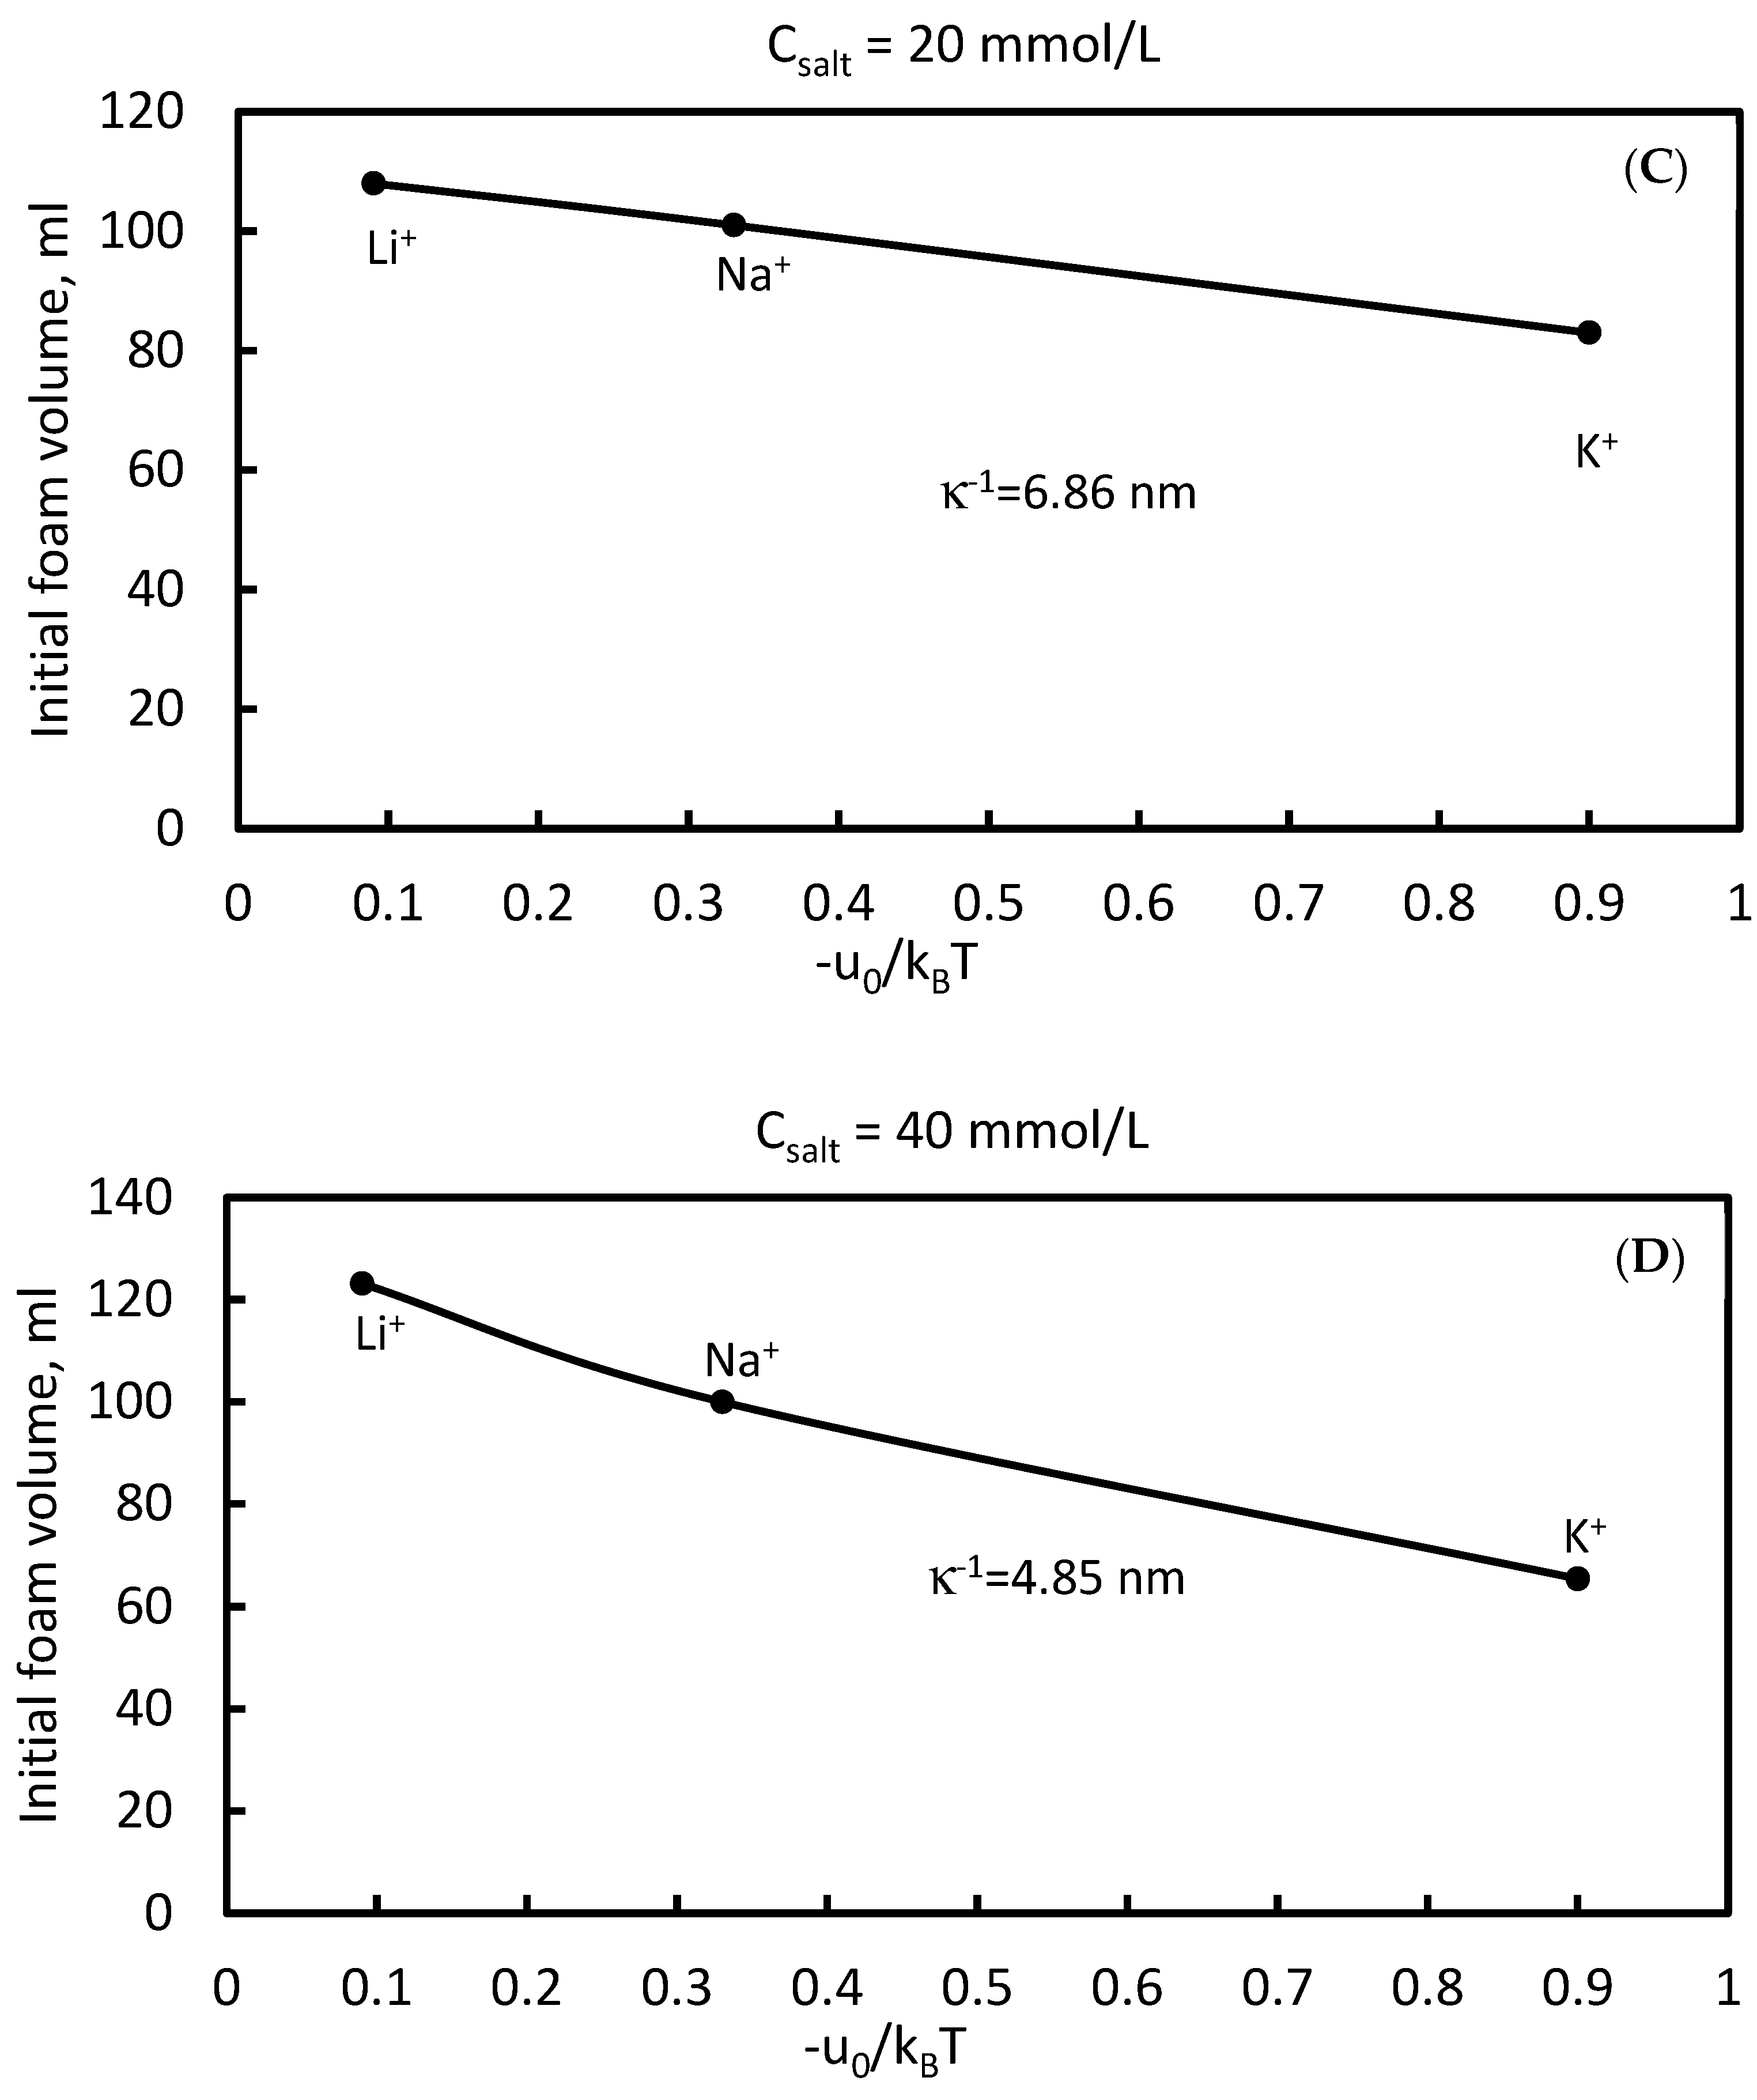
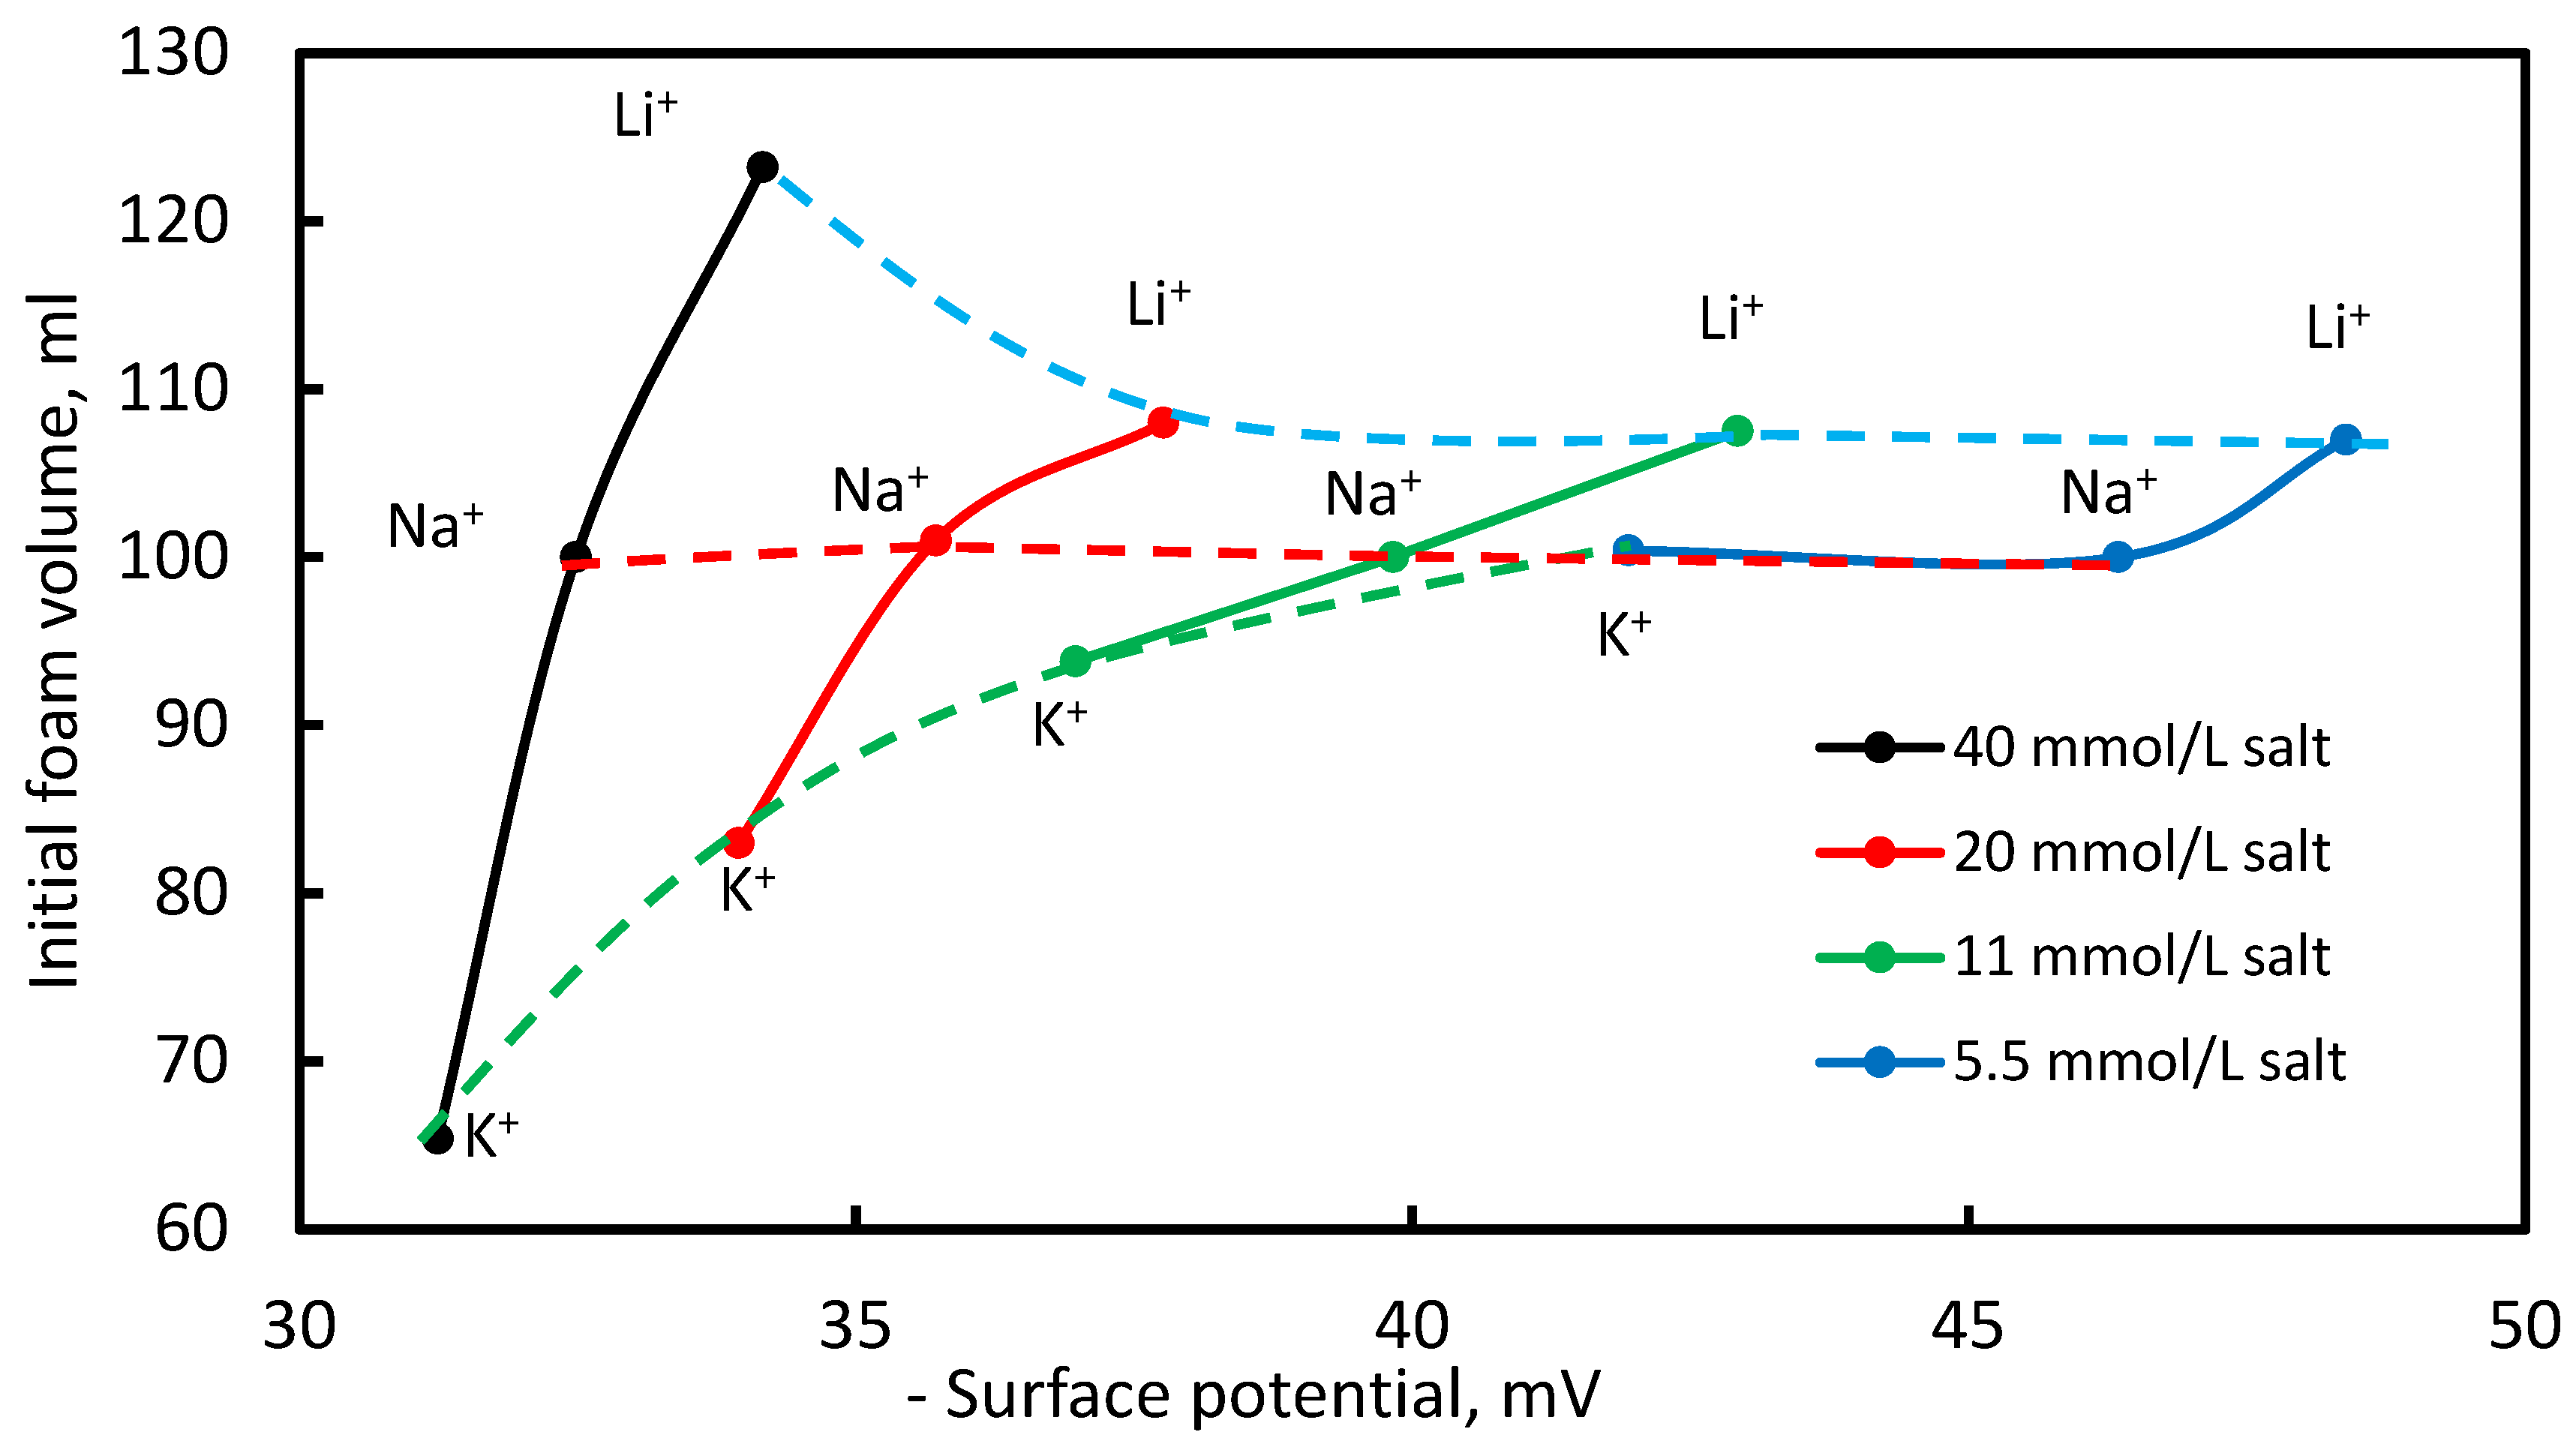
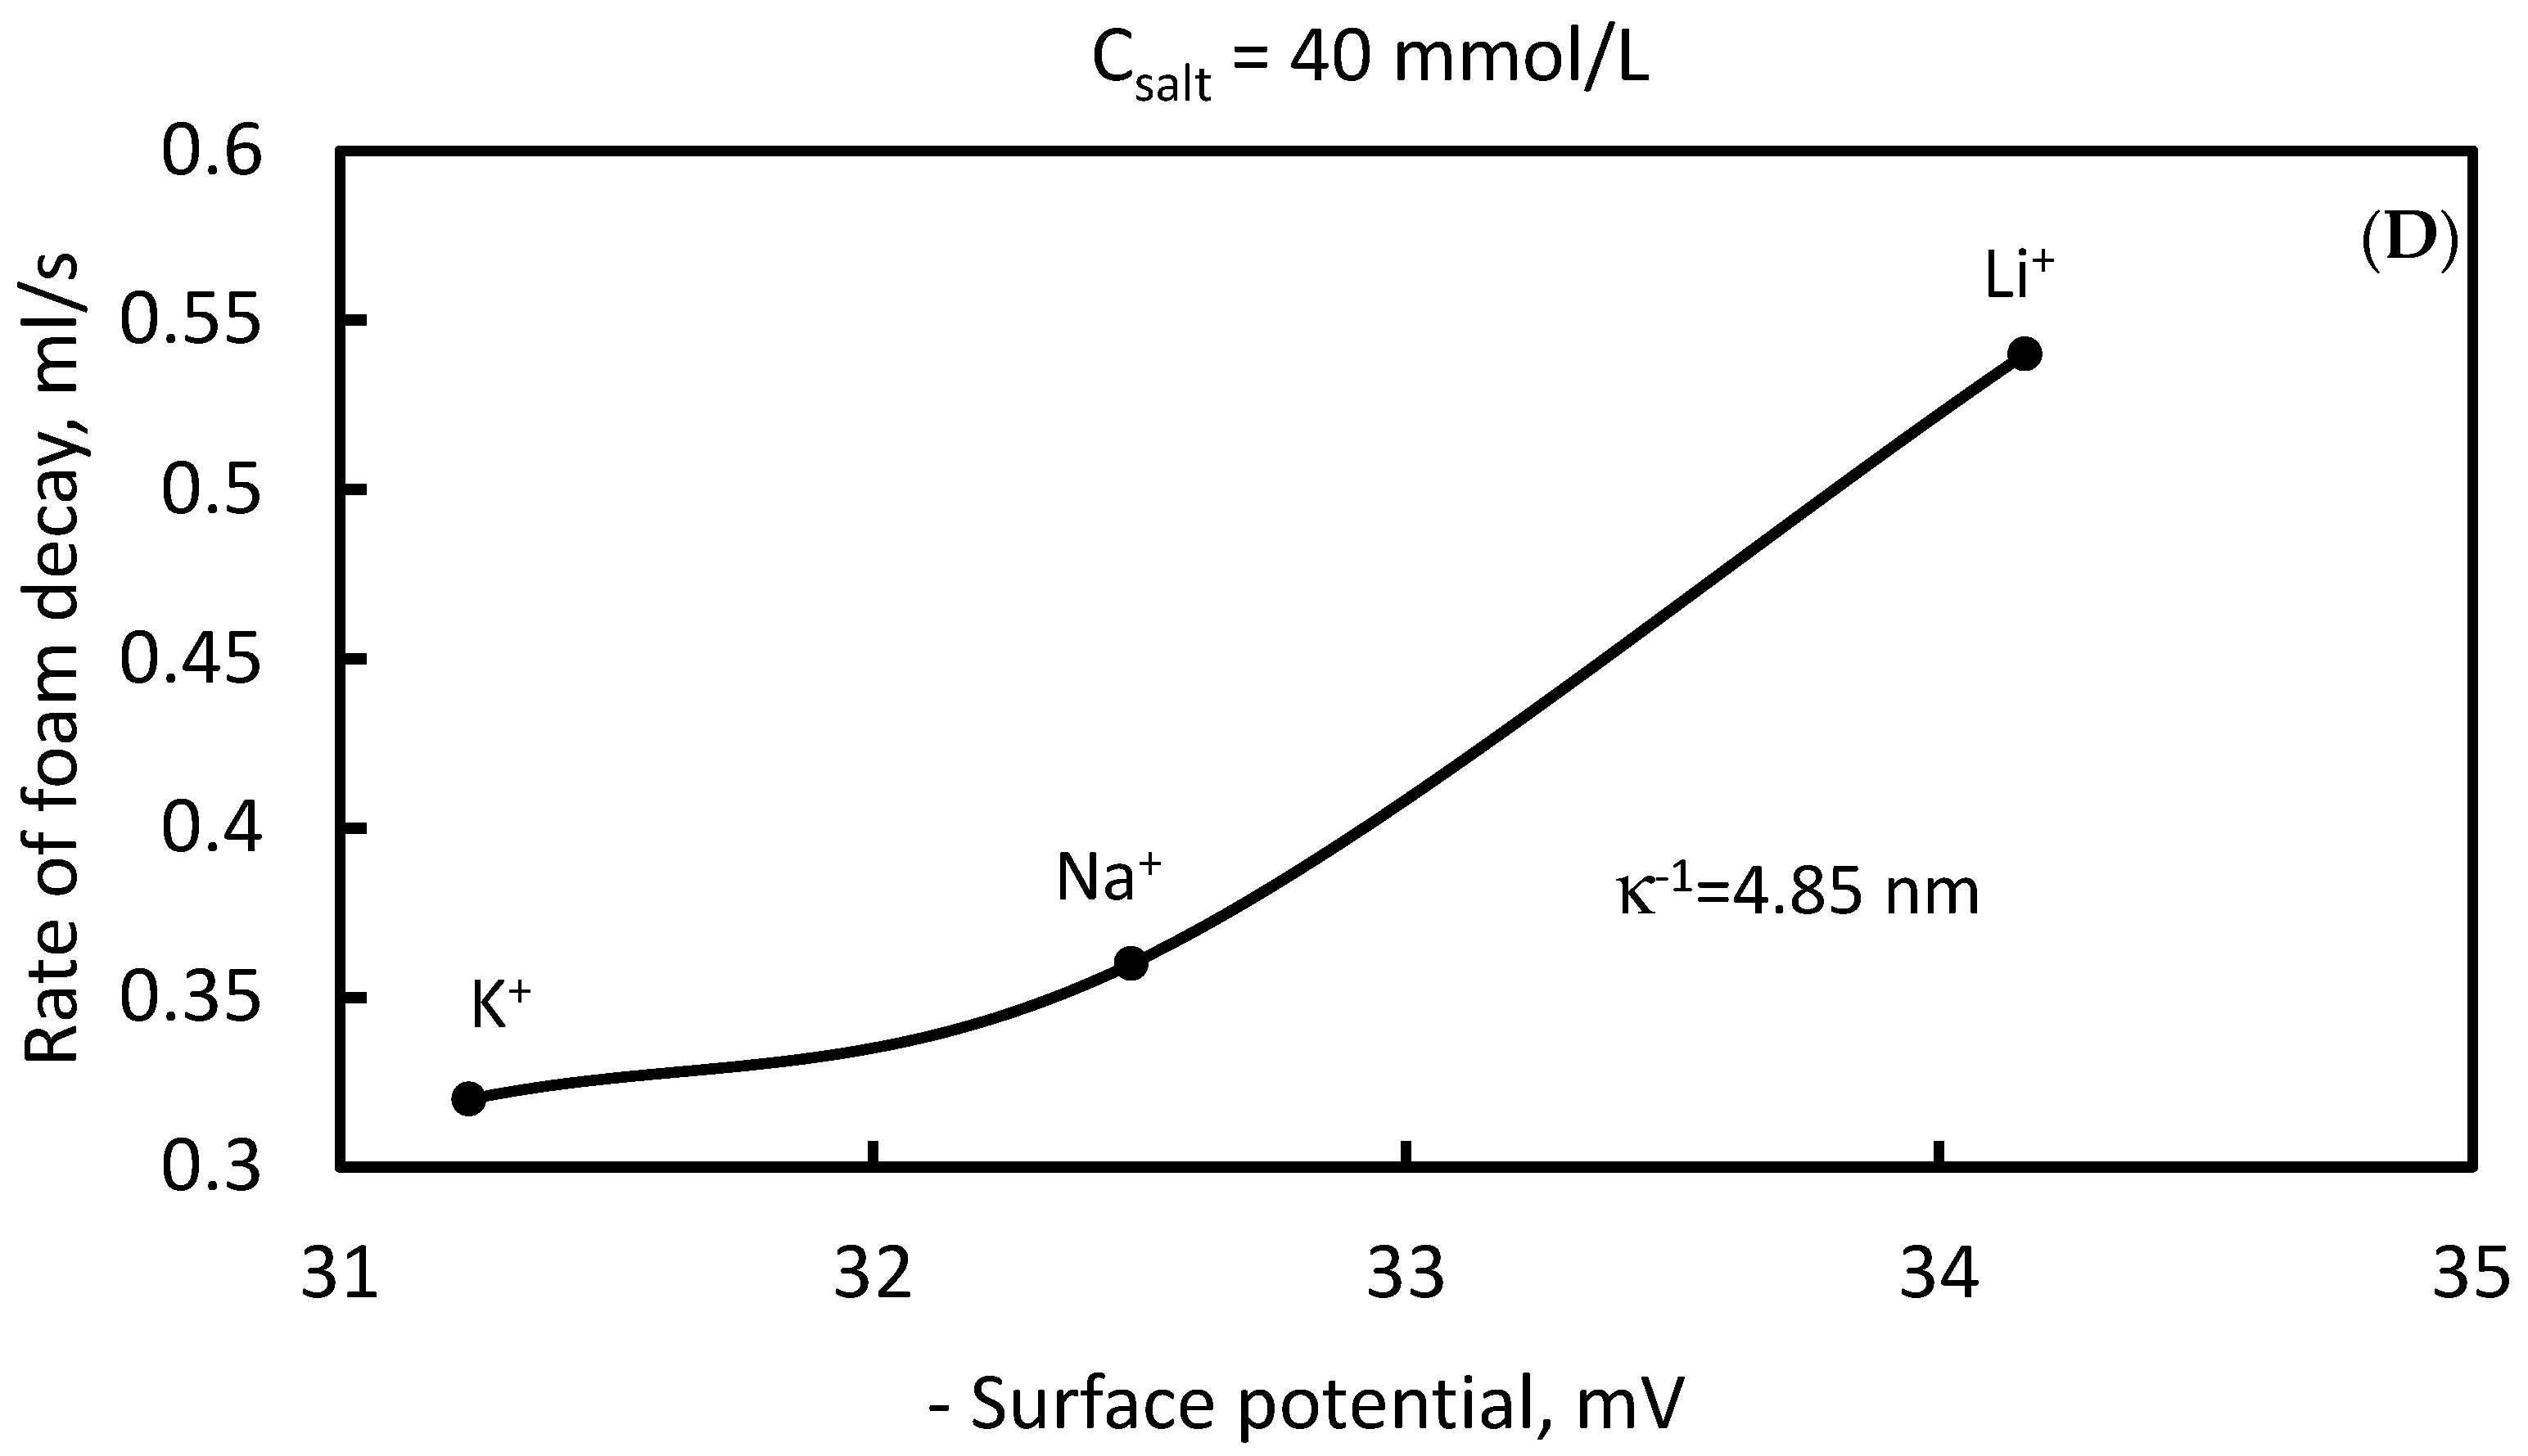
3.2. Counter-Ion Specific Effects on Foam, Stabilized by 0.5 mmol/L SDS
4. Discussion
5. Conclusions
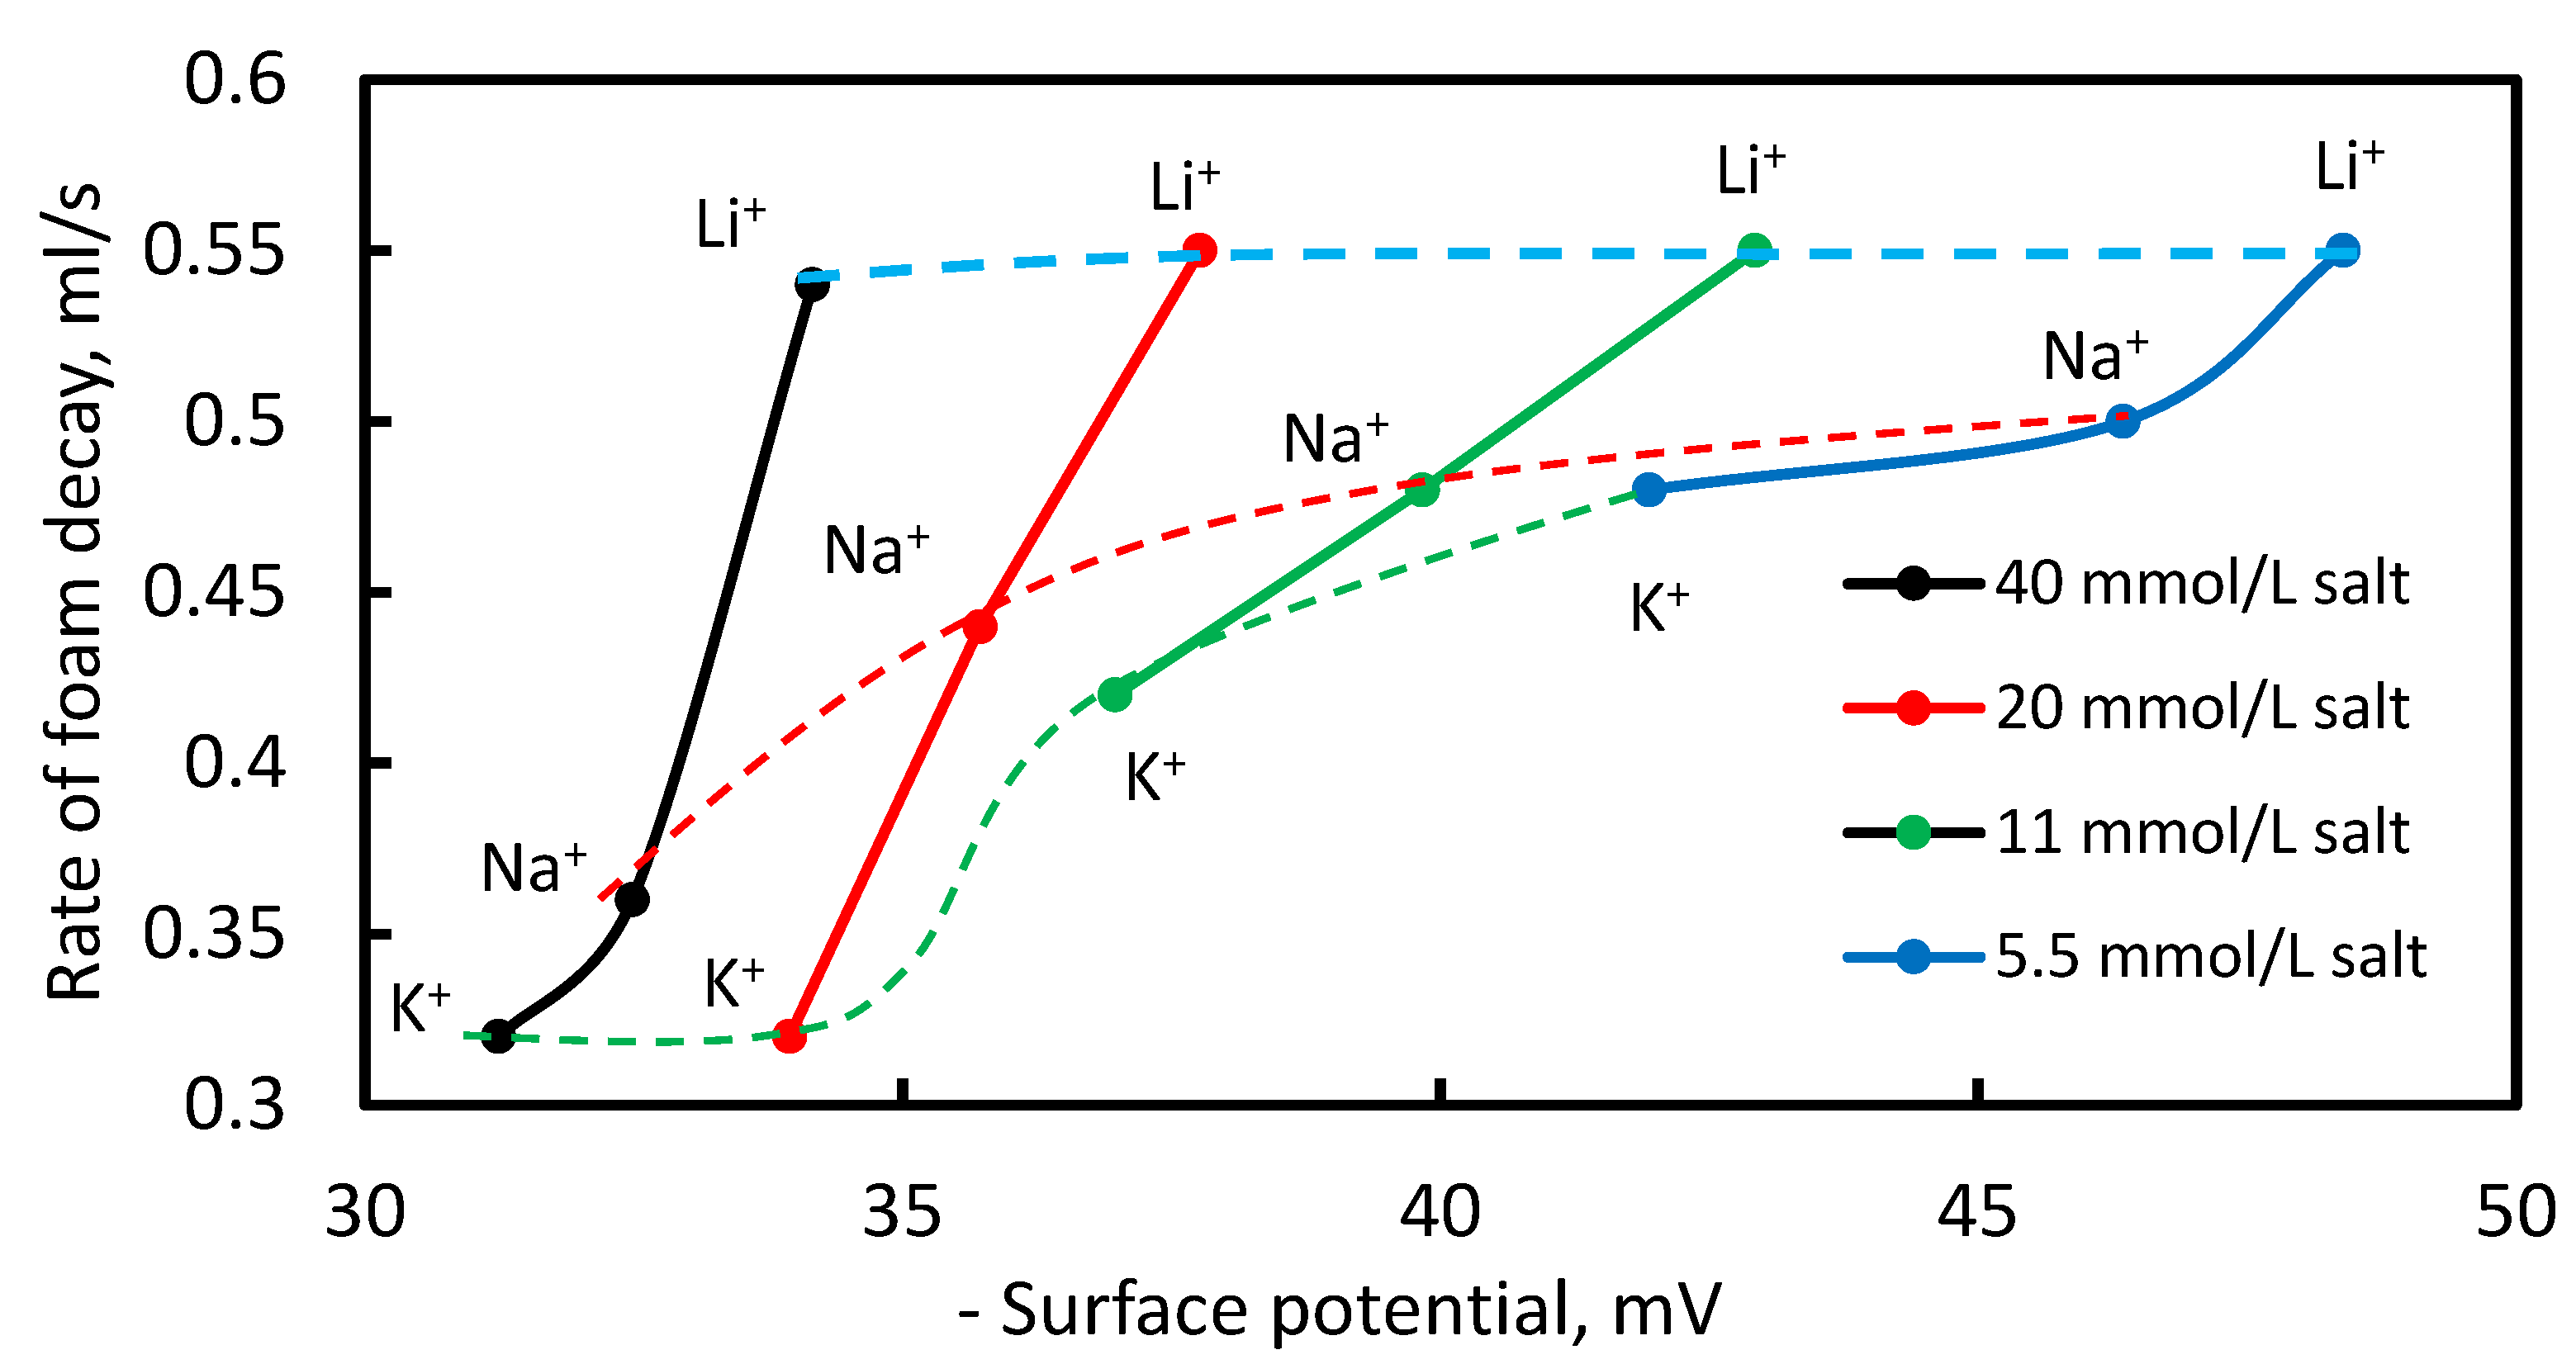
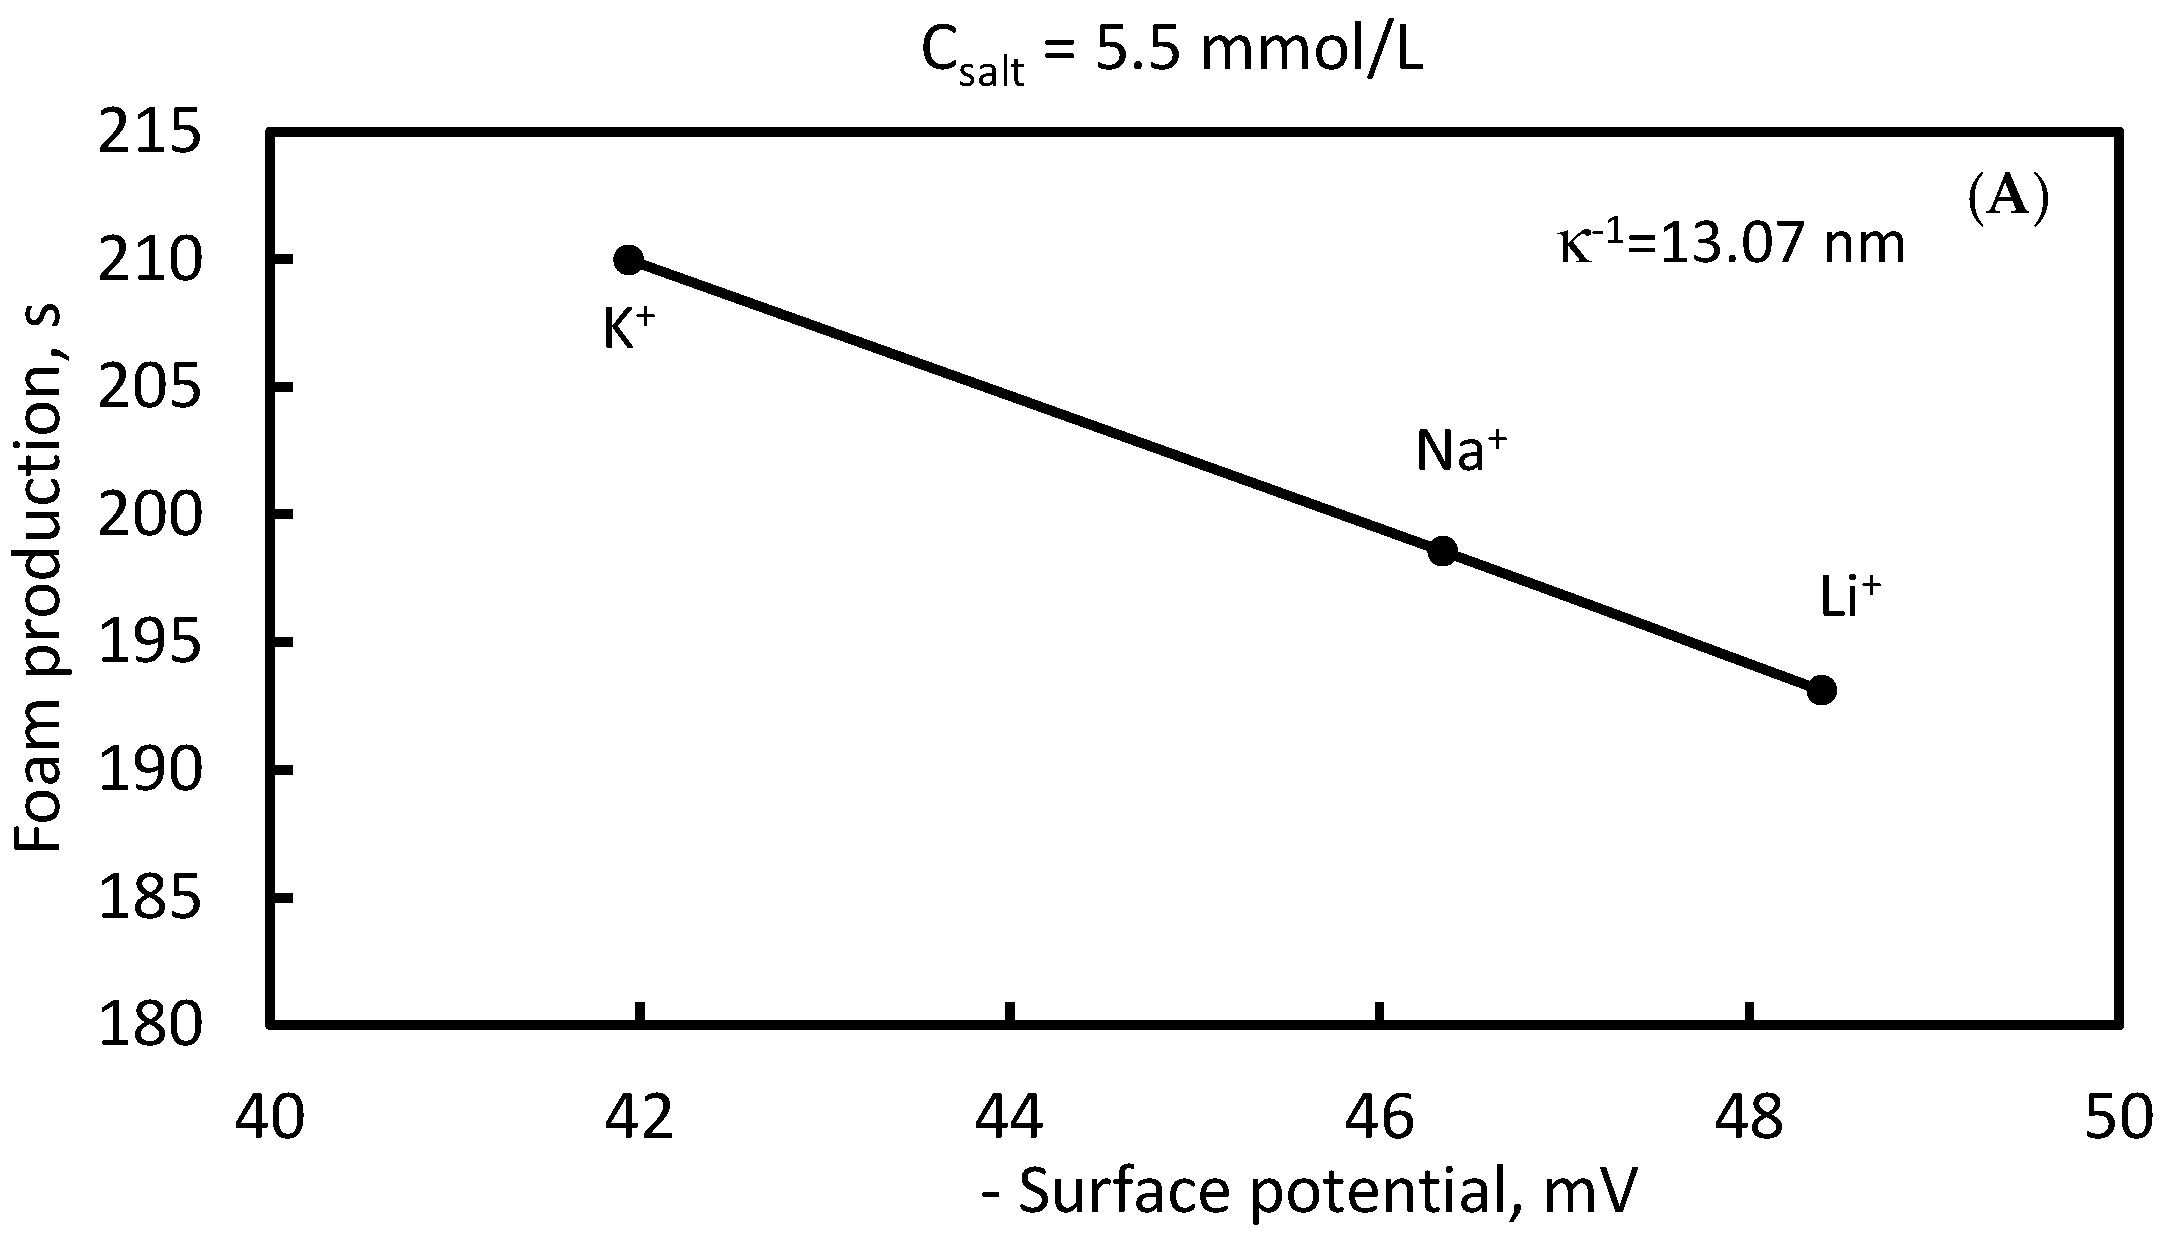
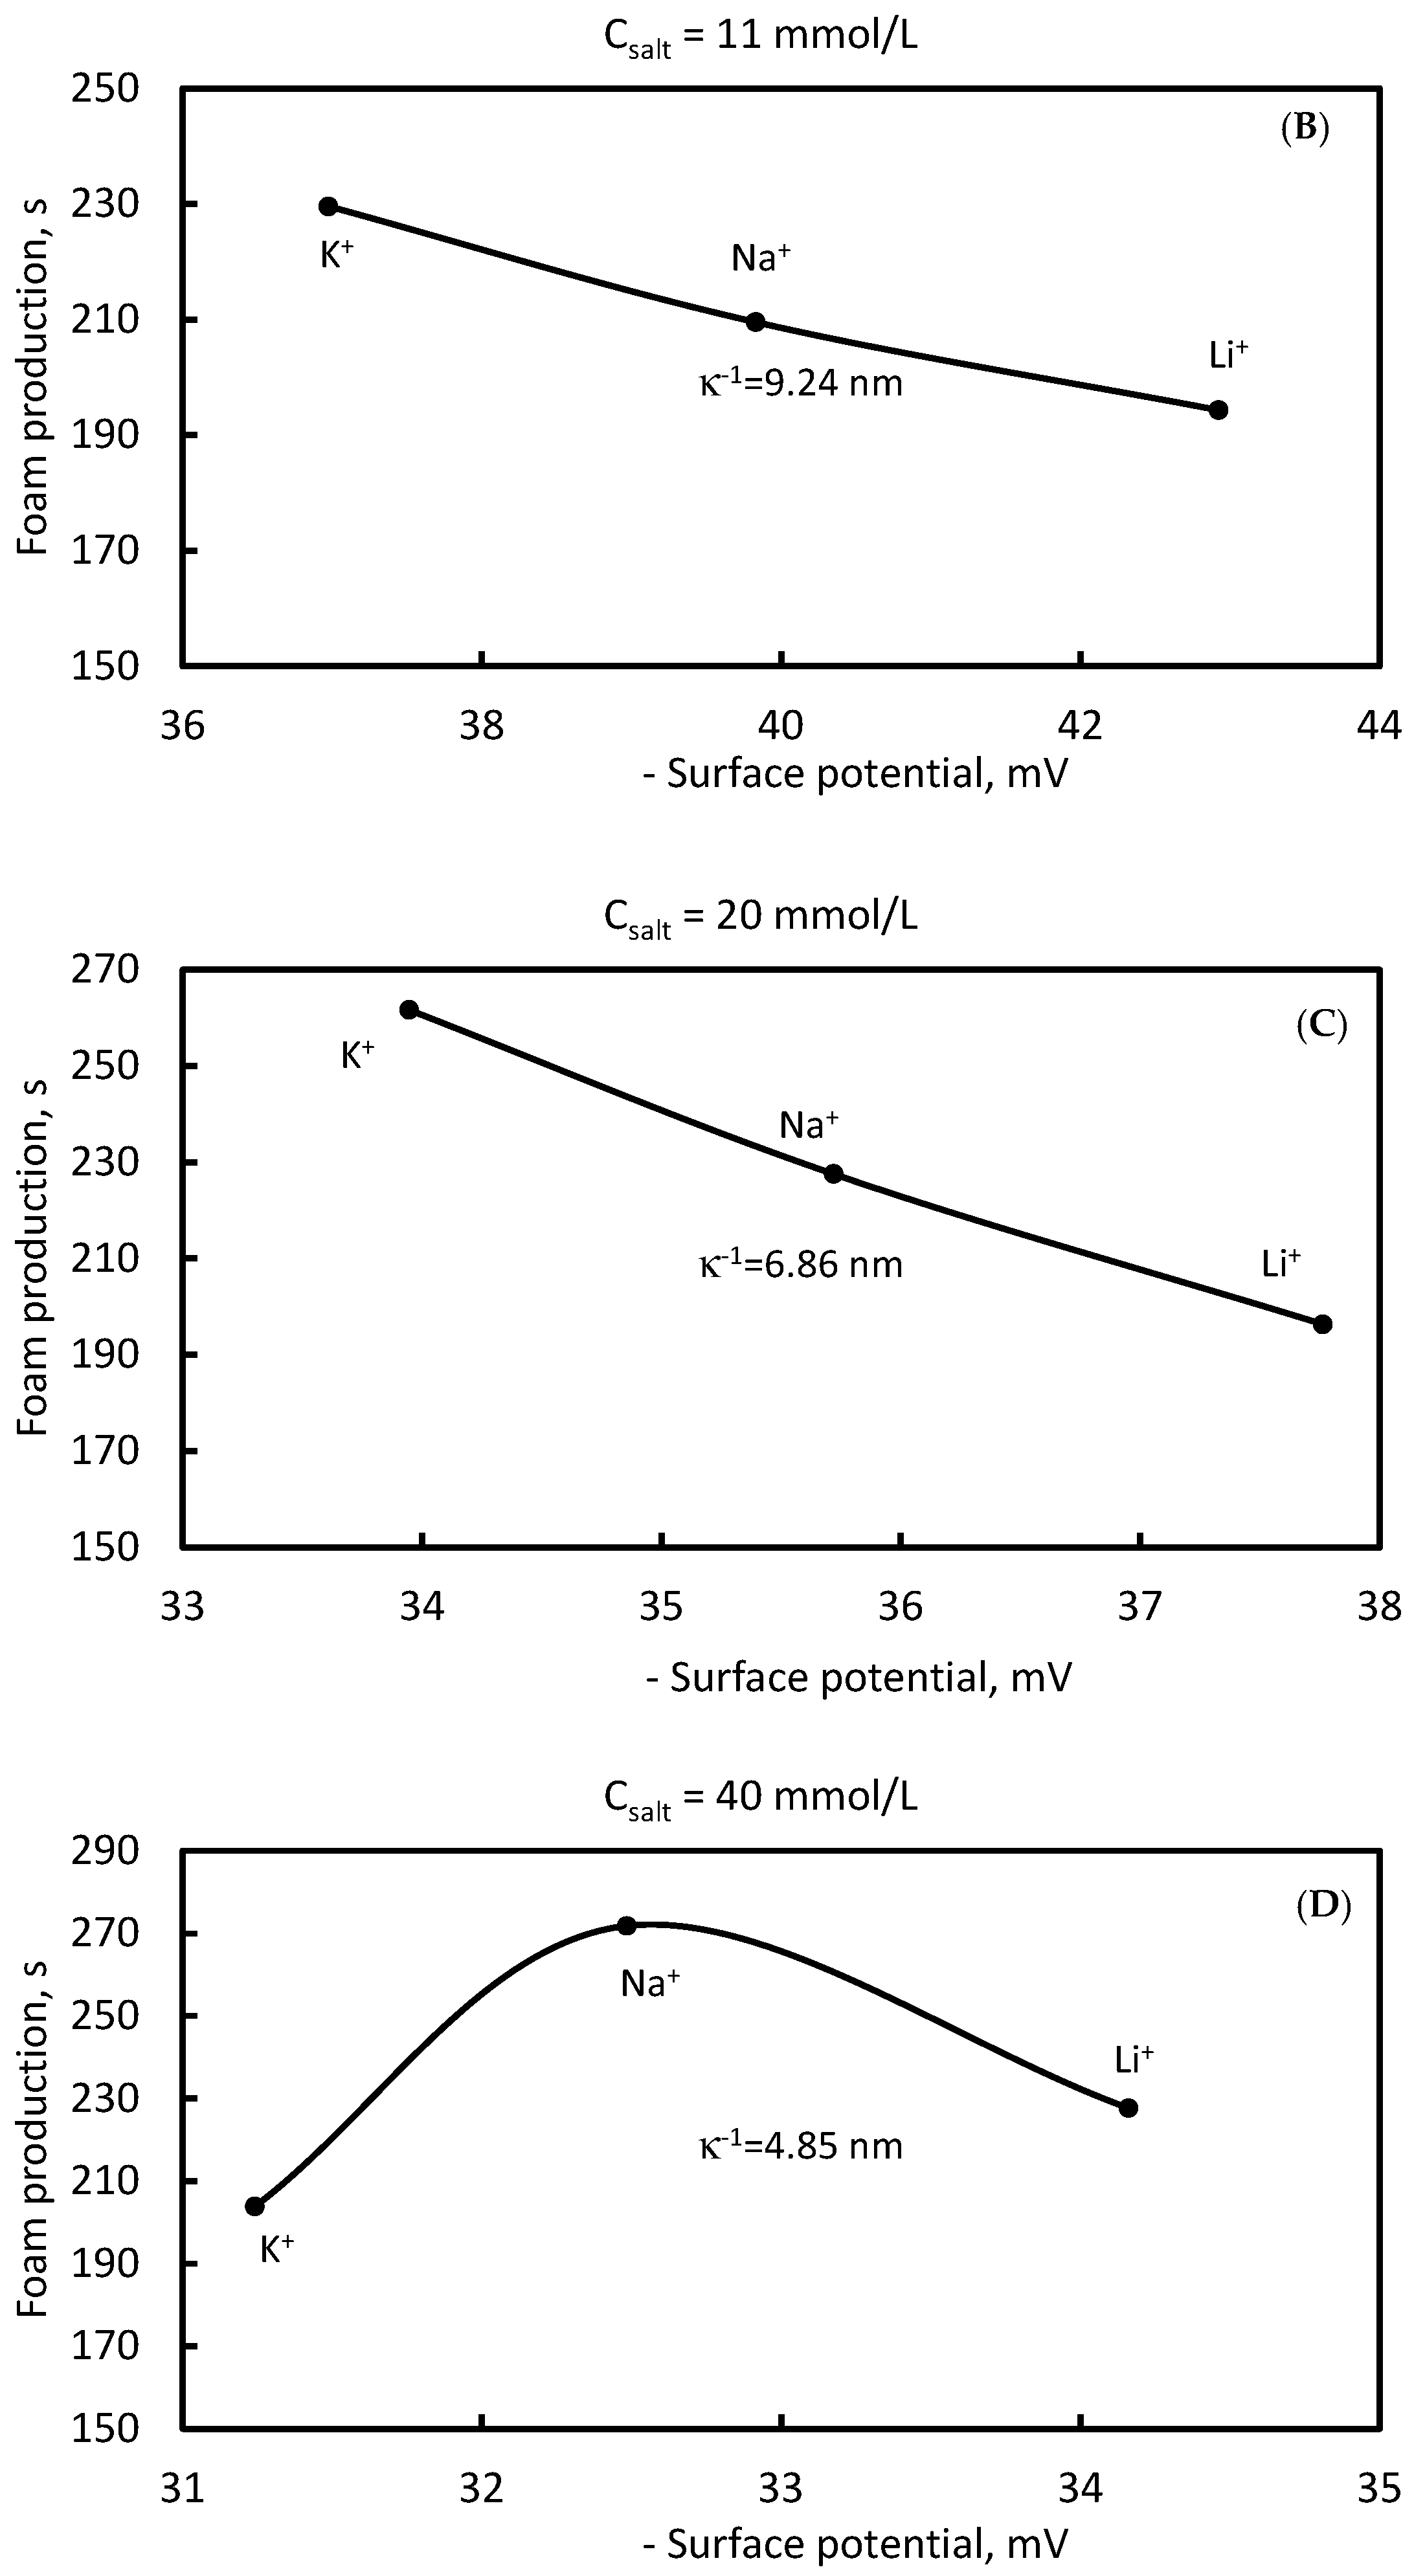
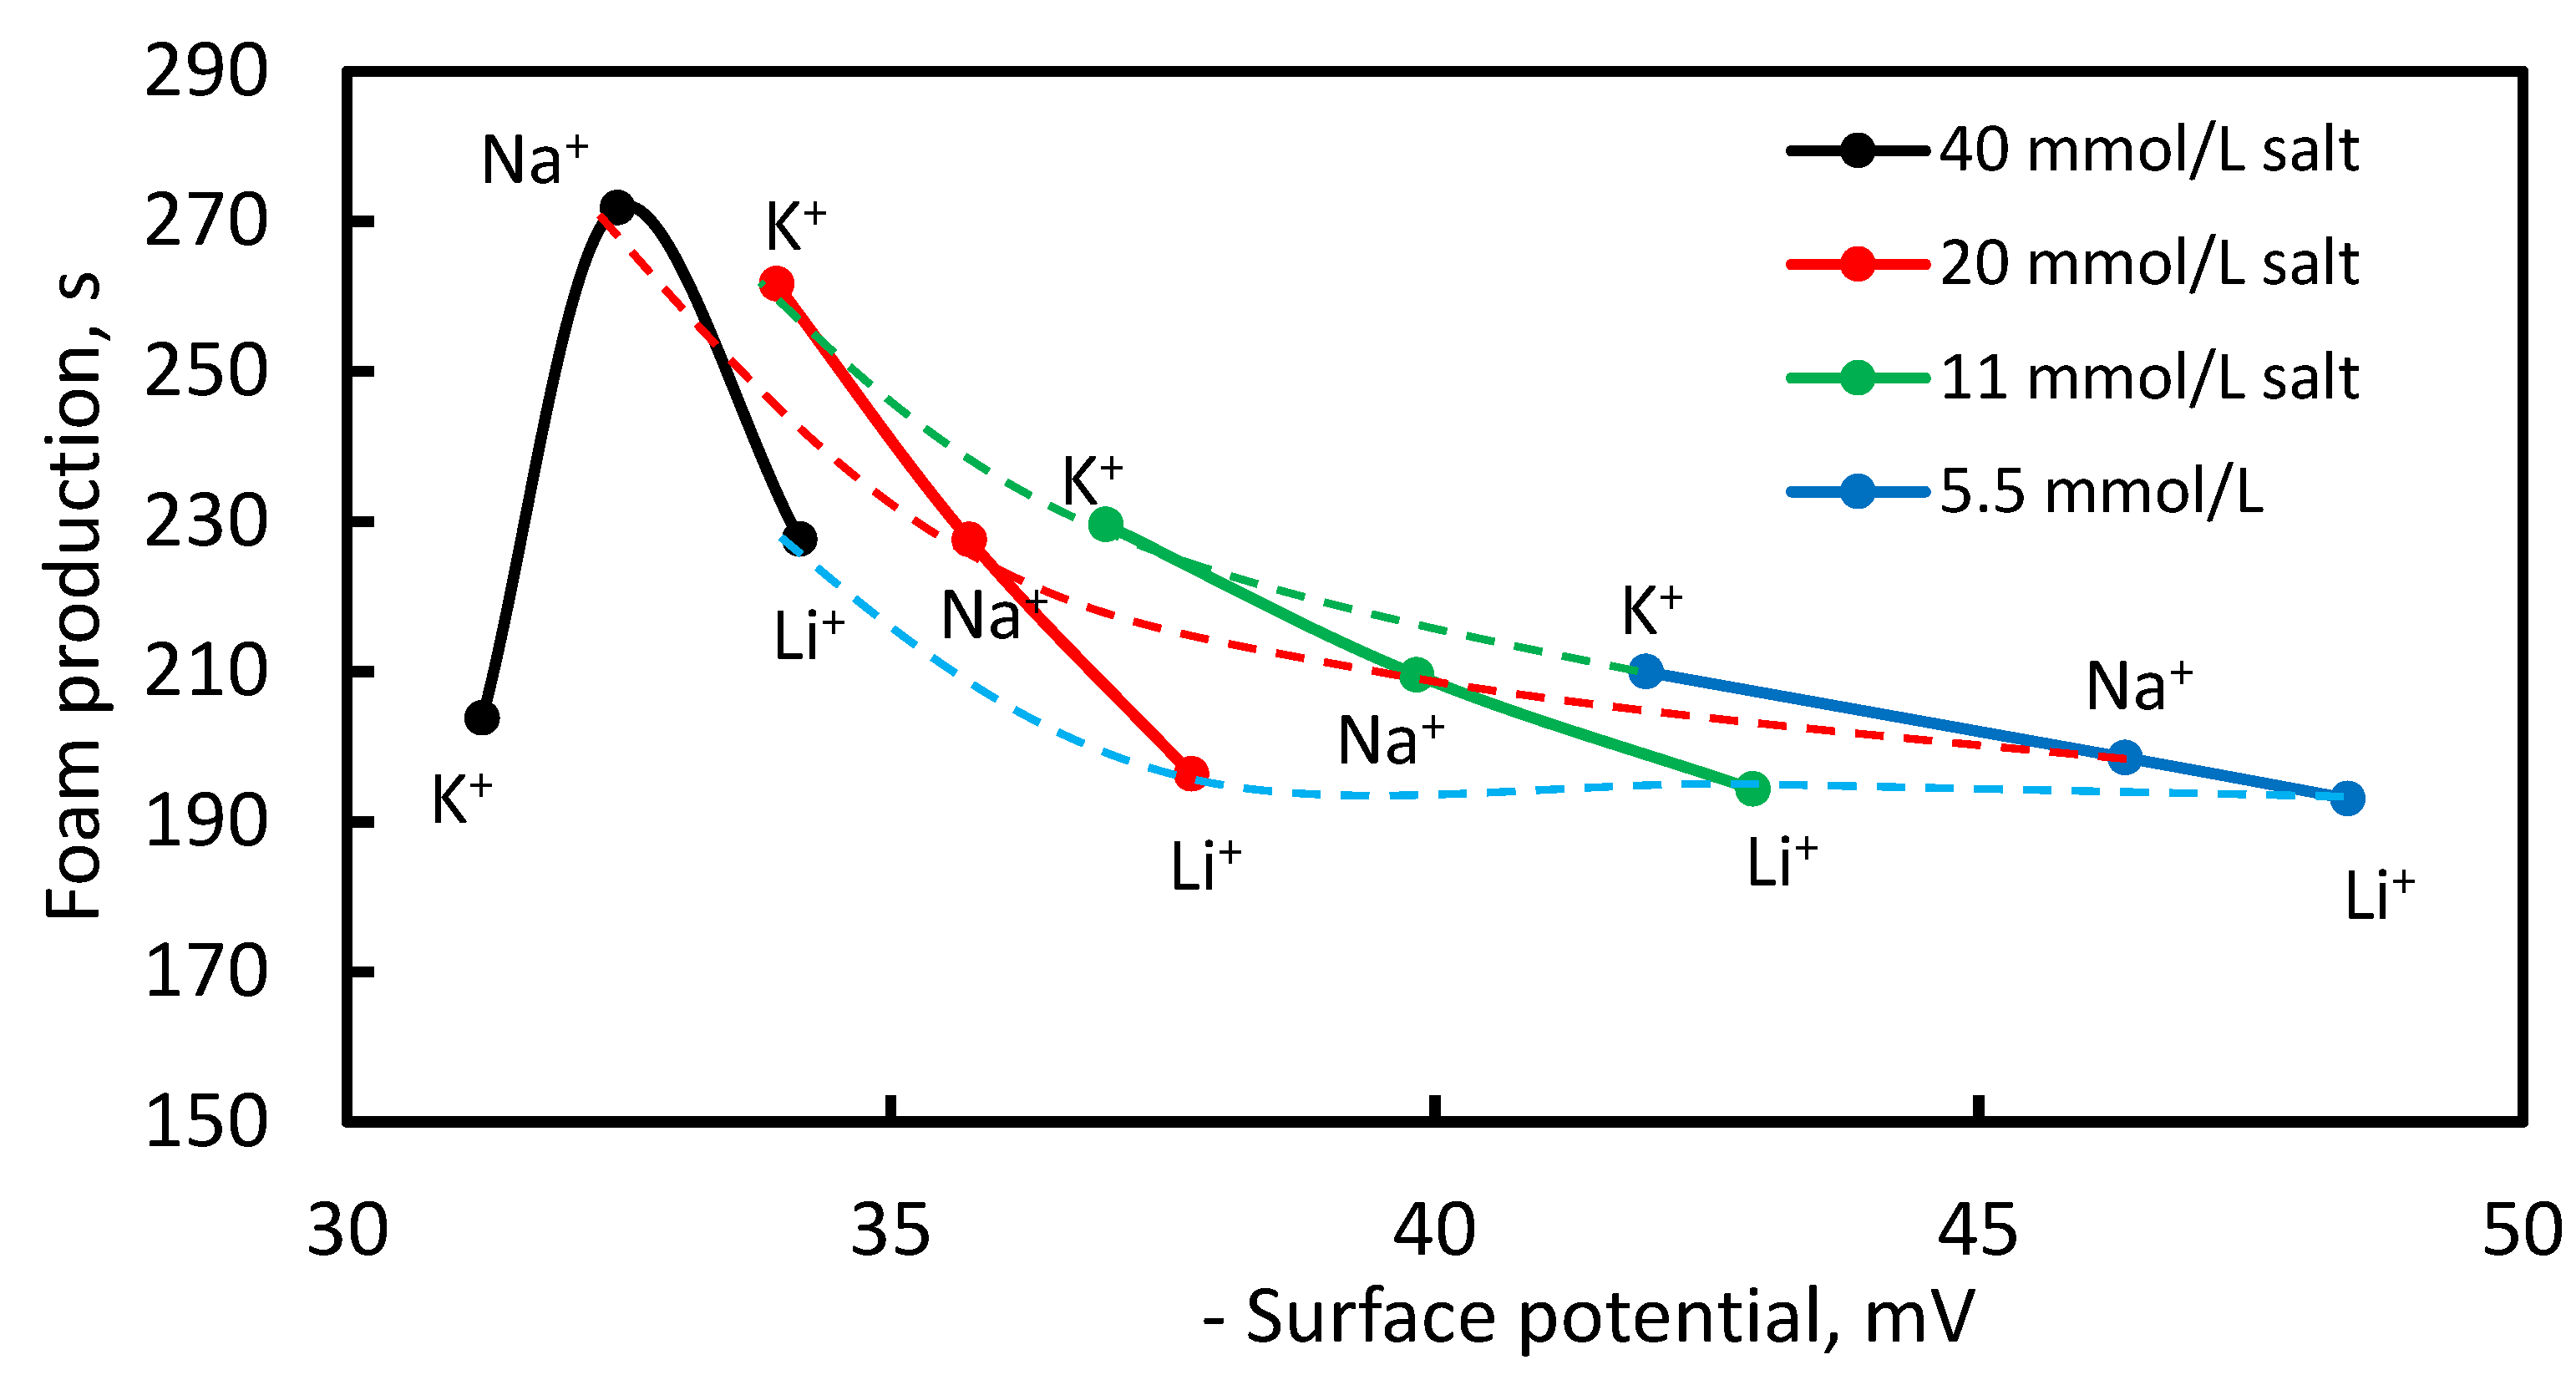
- A correlation between the foamability, the initial rate of foam decay, the foam production and the specific energy of adsorption of the counter-ions and the related absolute values of the surface potential of the equilibrium foam films is developed for the first time in the literature. One can see that most of the correlations are either linear or close to linearity.
- It was reported for the first time that the Li+ ions practically do not adsorb on the air/water interface. Thus, the effect of these counter-ions is only electrostatic screening. In reality, the addition of electrolytes always screens the electrostatic interaction between the bubbles, by means of an effective decrease in the surface potential and the shrinking of the diffusive layer of counter-ions [38,46] due to the overall decrease in the energy of the electrostatic field because of its interaction with the counter-ions.
- The counter-ion effect on the foamability and the rate of decay of foam, produced by means of the Bartsch method, was studied separately for the first time. The counter-ions, in a sequence of increasing foaming effect, can be ordered as follows: Li+ > Na+ > K+. The generation of foam occurs under the regime of electrostatic stabilization of the bubbles. These bubbles are produced during the foam generation and their electrostatic repulsion hinders their coalescence, thus boosting foamability. On the contrary, the counter-ions in the sequence of increasing the foam stabilization effect can be ordered as followed: Li+ < Na+ < K+. The decay of the foam occurs under the regime of electrostatically controlled surfactant adsorption. Immediately after the generation of the foam, the vigorous adsorption of surface-active co-ions on the bubbles begins. The bubbles in the presence of counter-ions with the largest absolute value of the specific adsorption energy of counter-ions will have the smallest electrostatic barrier preventing the surfactant adsorption and the bubbles will undergo the fastest surfactant adsorption, causing the slowest foam decay. The opposite happens with the bubbles in the presence of counter-ions with the smallest absolute value of the specific energy of adsorption of the counter-ions.
Author Contributions
Funding
Data Availability Statement
Acknowledgments
Conflicts of Interest
References
- Lewith, S. The behaviour of the proteins in the blood serum in the presence of salts. Arch. Exp. Pathol. Pharmakol. 1887, 24, 1–16. [Google Scholar] [CrossRef]
- Hofmeister, F. To the theory of the effect of the salts (Second message). Arch. Exp. Pathol. Pharmakol. 1888, 24, 247–260. [Google Scholar] [CrossRef]
- Hofmeister, F. To the theory of the effect of the salts (First message). Arch. Exp. Pathol. Pharmakol. 1888, 25, 1–30. [Google Scholar] [CrossRef]
- Limbeck, R.V. To the theory of the effect of the salts (On the Diuretic Effect of Salts). Arch. Exp. Pathaology Pharmacol. 1888, 25, 69–86. [Google Scholar] [CrossRef]
- Hofmeister, F. To the theory of the effect of the salts (Free and disabled swelling). Arch. Exp. Pathol. Pharmakol. 1890, 27, 395–413. [Google Scholar] [CrossRef]
- Muenzer, E. To the theory of the effect of the salts (The general effect of salts). Arch. Exp. Pathol. Pharmakol. 1898, 47, 74–96. [Google Scholar]
- Heydweiller, A. Concerning the physical characteristics of solutions in correlation. II. Surface tension and elcetronic conductivity of watery salt solutions. Ann. Der Phys. 1910, 33, 145–185. [Google Scholar] [CrossRef]
- Weissenborn, P.K.; Pugh, R.J. Surface Tension and Bubble Coalescence Phenomena of Aqueous Solutions of Electrolytes. Langmuir 1995, 11, 1422–1426. [Google Scholar] [CrossRef]
- Weissenborn, P.K.; Pugh, R.J. Surface tension of aqueous solutions of electrolytes: Relationship with ion hydration, oxygen solubility, and bubble coalescence. J. Colloid Interface Sci. 1996, 184, 550–563. [Google Scholar] [CrossRef]
- Marcus, Y. Specific ion effects on the surface tension and surface potential of aqueous electrolytes. Curr. Opin. Colloid Interface Sci. 2016, 23, 94–99. [Google Scholar] [CrossRef]
- Ninham, B.W. On progress in forces since the DLVO theory. Adv. Colloid Interface Sci. 1999, 83, 1–17. [Google Scholar] [CrossRef]
- Ninham, B.W.; Yaminsky, V. Ion Binding and Ion Specificity: The Hofmeister Effect and Onsager and Lifshitz Theories. Langmuir 1997, 13, 2097–2108. [Google Scholar] [CrossRef]
- Bostrom, M.; Williams, D.R.M.; Ninham, B.W. Specific Ion Effects: Why DLVO Theory Fails for Biology and Colloid Systems. Phys. Rev. Lett. 2001, 87, 168103. [Google Scholar] [CrossRef]
- Bostroem, M.; Williams, D.R.M.; Ninham, B.W. Surface tension of electrolytes: Specific ion effects explained by dispersion forces. Langmuir 2001, 17, 4475–4478. [Google Scholar] [CrossRef]
- Bostroem, M.; Kunz, W.; Ninham, B.W. Hofmeister Effects in Surface Tension of Aqueous Electrolyte Solution. Langmuir 2005, 21, 2619–2623. [Google Scholar] [CrossRef]
- Moreira, L.A.; Bostrom, M.; Ninham, B.W.; Biscaia, E.C.; Tavares, F.W. Hofmeister effects: Why protein charge, pH titration and protein precipitation depend on the choice of background salt solution. Coll. Surf. A 2006, 282, 457–463. [Google Scholar] [CrossRef]
- Bostroem, M.; Ninham, B.W. Dispersion Self-Free Energies and Interaction Free Energies of Finite-Sized Ions in Salt Solutions. Langmuir 2004, 20, 7569–7574. [Google Scholar] [CrossRef]
- Jungwirth, P.; Tobias, D.J. Ions at the air/water interface. J. Phys. Chem. B 2002, 106, 6361–6373. [Google Scholar] [CrossRef]
- Vrbka, L.; Mucha, M.; Minofar, B.; Jungwirth, P.; Brown, E.C.; Tobias, D.J. Propensity of soft ions for the air/water interface. Curr. Opin. Colloid Interface Sci. 2004, 9, 67–73. [Google Scholar] [CrossRef]
- Warszynski, P.; Lunkenheimer, K.; Czichocki, G. Effect of counterions on the adsorption of ionic surfactants at fluid-fluid interfaces. Langmuir 2002, 18, 2506–2514. [Google Scholar] [CrossRef]
- Para, G.; Jarek, E.; Warszynski, P. The surface tension of aqueous solutions of cetyltrimethylammonium cationic surfactants in presence of bromide and chloride counterions. Coll. Surf. A 2005, 261, 65–73. [Google Scholar] [CrossRef]
- Para, G.; Jarek, E.; Warszynski, P. The Hofmeister series effect in adsorption of cationic surfactants—Theoretical description and experimental results. Adv. Colloid Inreface Sci. 2006, 122, 39–55. [Google Scholar] [CrossRef] [PubMed]
- Moelbert, S.; Normand, B.; De Los Rios, P. Kosmotropes and chaotropes: Modelling preferential exclusion, binding and aggregate stability. Biophys. Chem. 2004, 112, 45–57. [Google Scholar] [CrossRef] [PubMed]
- Vlachy, N.; Jagoda-Cwiklik, B.; Vácha, R.; Touraud, D.; Jungwirth, P.; Kunz, W. Hofmeister series and specific interactions of charged headgroups with aqueous ions. Adv. Colloid Interface Sci. 2009, 146, 42–47. [Google Scholar] [CrossRef] [PubMed]
- Bastos-González, D.; Pérez-Fuentes, L.; Drummond, C.; Faraudo, J. Ions at interfaces: The central role of hydration and hydrophobicity. Curr. Opin. Colloid Interface Sci. 2016, 23, 19–28. [Google Scholar] [CrossRef]
- Mehringer, J.; Hofmann, E.; Touraud, D.; Koltzenburg, S.; Kellermeier, M.; Kunz, W. Salting-in and salting-out effects of short amphiphilic molecules: A balance between specific ion effects and hydrophobicity. Phys. Chem. Chem. Phys. 2021, 23, 1381–1391. [Google Scholar] [CrossRef]
- Ivanov, I.B.; Marinova, K.G.; Danov, K.D.; Dimitrova, D.; Ananthapadmanabhan, K.P.; Lips, A. Role of the counterions on the adsorption of ionic surfactants. Adv. Colloid Interface Sci. 2007, 134–135, 105–124. [Google Scholar] [CrossRef]
- Ivanov, I.B.; Slavchov, R.I.; Basheva, E.S.; Sidzhakova, D.; Karakashev, S.I. Hofmeister Effect on Micellization, Thin Films and Emulsion Stability. Adv. Colloid Interface Sci. 2011, 168, 93–104. [Google Scholar] [CrossRef]
- Sett, S.; Karakashev, S.I.; Smoukov, S.K.; Yarin, A.L. Ion-specific effects in foams. Adv. Colloid Interface Sci. 2015, 225, 98–113. [Google Scholar] [CrossRef]
- Schelero, N.; von Klitzing, R. Ion specific effects in foam films. Curr. Opin. Colloid Interface Sci. 2015, 20, 124–129. [Google Scholar] [CrossRef]
- Schelero, N.; Hedicke, G.; Linse, P.; Klitzing, R.V. ivanov. J. Phys. Chem. B 2010, 114, 15523–15529. [Google Scholar] [CrossRef]
- Pandey, S.; Bagwe, R.P.; Shah, D.O. Effect of counterions on surface and foaming properties of dodecyl sulfate. J Colloid Interface Sci. 2003, 267, 160–166. [Google Scholar] [CrossRef]
- Powale, R.S.; Bhagwat, S.S. Influence of Electrolytes on Foaming of Sodium Lauryl Sulfate. J. Dispers. Sci. Technol. 2006, 27, 1181–1186. [Google Scholar] [CrossRef]
- Jiang, N.; Yu, X.; Sheng, Y.; Zong, R.; Li, C.; Lu, S. Role of salts in performance of foam stabilized with sodium dodecyl sulfate. Chem. Eng. Sci. 2020, 216, 115474. [Google Scholar] [CrossRef]
- Varade, S.R.; Ghosh, P. Foaming in aqueous solutions of zwitterionic surfactant in presence of monovalent salts: The specific ion effect. Chem. Eng. Comm. 2020, 207, 1216–1233. [Google Scholar] [CrossRef]
- Derjaguin, B.; Landau, L. Theory of the stability of strongly charged lyophobic sols an of the adhesion of strongly charged particles in solutions of electrolytes. Acta Phys. Chim. 1941, 14, 633–662. [Google Scholar] [CrossRef]
- Verwey, E.J.W.; Overbeek, J.T.G. Theory of the Stability of Lyophobic Colloids; Elsevier: Amsterdam, The Netherlands, 1948; p. 218. [Google Scholar]
- Nguyen, A.V.; Schulze, H.J. Colloidal Science of Flotation; Marcel Dekker: New York, NY, USA, 2004; p. 840. [Google Scholar]
- Kruglyakov, P.M.; Ekserova, D.R. Foam and Foam Films; Elsevier: Amsterdam, The Netherlands, 1990; p. 425. [Google Scholar]
- Amani, P.; Karakashev, S.I.; Grozev, N.A.; Simeonova, S.S.; Miller, R.; Rudolph, V.; Firouzi, M. Effect of selected monovalent salts on surfactant stabilized foams. Adv. Colloid Interface Sci. 2021, 295, 102490. [Google Scholar] [CrossRef]
- Pitzer, K.S. Thermodynamics of electrolytes. I. Theoretical basis and general equations. J. Phys. Chem. 1973, 77, 268–277. [Google Scholar] [CrossRef]
- Pitzer, K.S.; Mayorga, G. Thermodynamics of electrolytes. II. Activity and osmotic coefficients for strong electrolytes with one or both ions univalent. J. Phys. Chem. 1973, 77, 2300–2308. [Google Scholar] [CrossRef]
- Nguyen, A.V.; Evans, G.M.; Jameson, G.J. Approximate calculations of electrical double-layer interaction between spheres. In Encyclopedia of Surface and Colloid Science; Hubbard, A.T., Ed.; Marcel Dekker: New York, NY, USA, 2002; Volume 5. [Google Scholar]
- Ivanov, I.B.; Ananthapadmanabhan, K.P.; Lips, A. Adsorption and structure of the adsorbed layer of ionic surfactants. Adv. Colloid Interface Sci. 2006, 123–126, 189–212. [Google Scholar] [CrossRef] [PubMed]
- Slavchov, R.I.; Karakashev, S.I.; Ivanov, I.B. Ionic Surfactants and Ion-Specific Effects: Adsorption, Micellization, Thin Liquid Films. In Surfactant Science and Technology: Retrospects and Prospects; Romsted, L.S., Ed.; Taylor & Francis Group: Abingdon, UK, 2013; pp. 53–121. [Google Scholar]
- Exerowa, D.; Kruglyakov, P.M. Foam and Foam Films: Theory, Experiment, Application; Marcel Dekker: New York, NY, USA, 1997; p. 796. [Google Scholar]


| Csalt, mmol/L | −φs (No Spec. Effect), mV | −φs (LiCl), mV | −φs (NaCl), mV | −φs (KCl), mV |
|---|---|---|---|---|
| 5.5 | 49.04 | 48.39 | 46.34 | 41.94 |
| 11 | 42.95 | 42.92 | 39.83 | 36.97 |
| 20 | 37.75 | 37.76 | 35.72 | 33.95 |
| 40 | 34.10 | 34.16 | 32.48 | 31.24 |
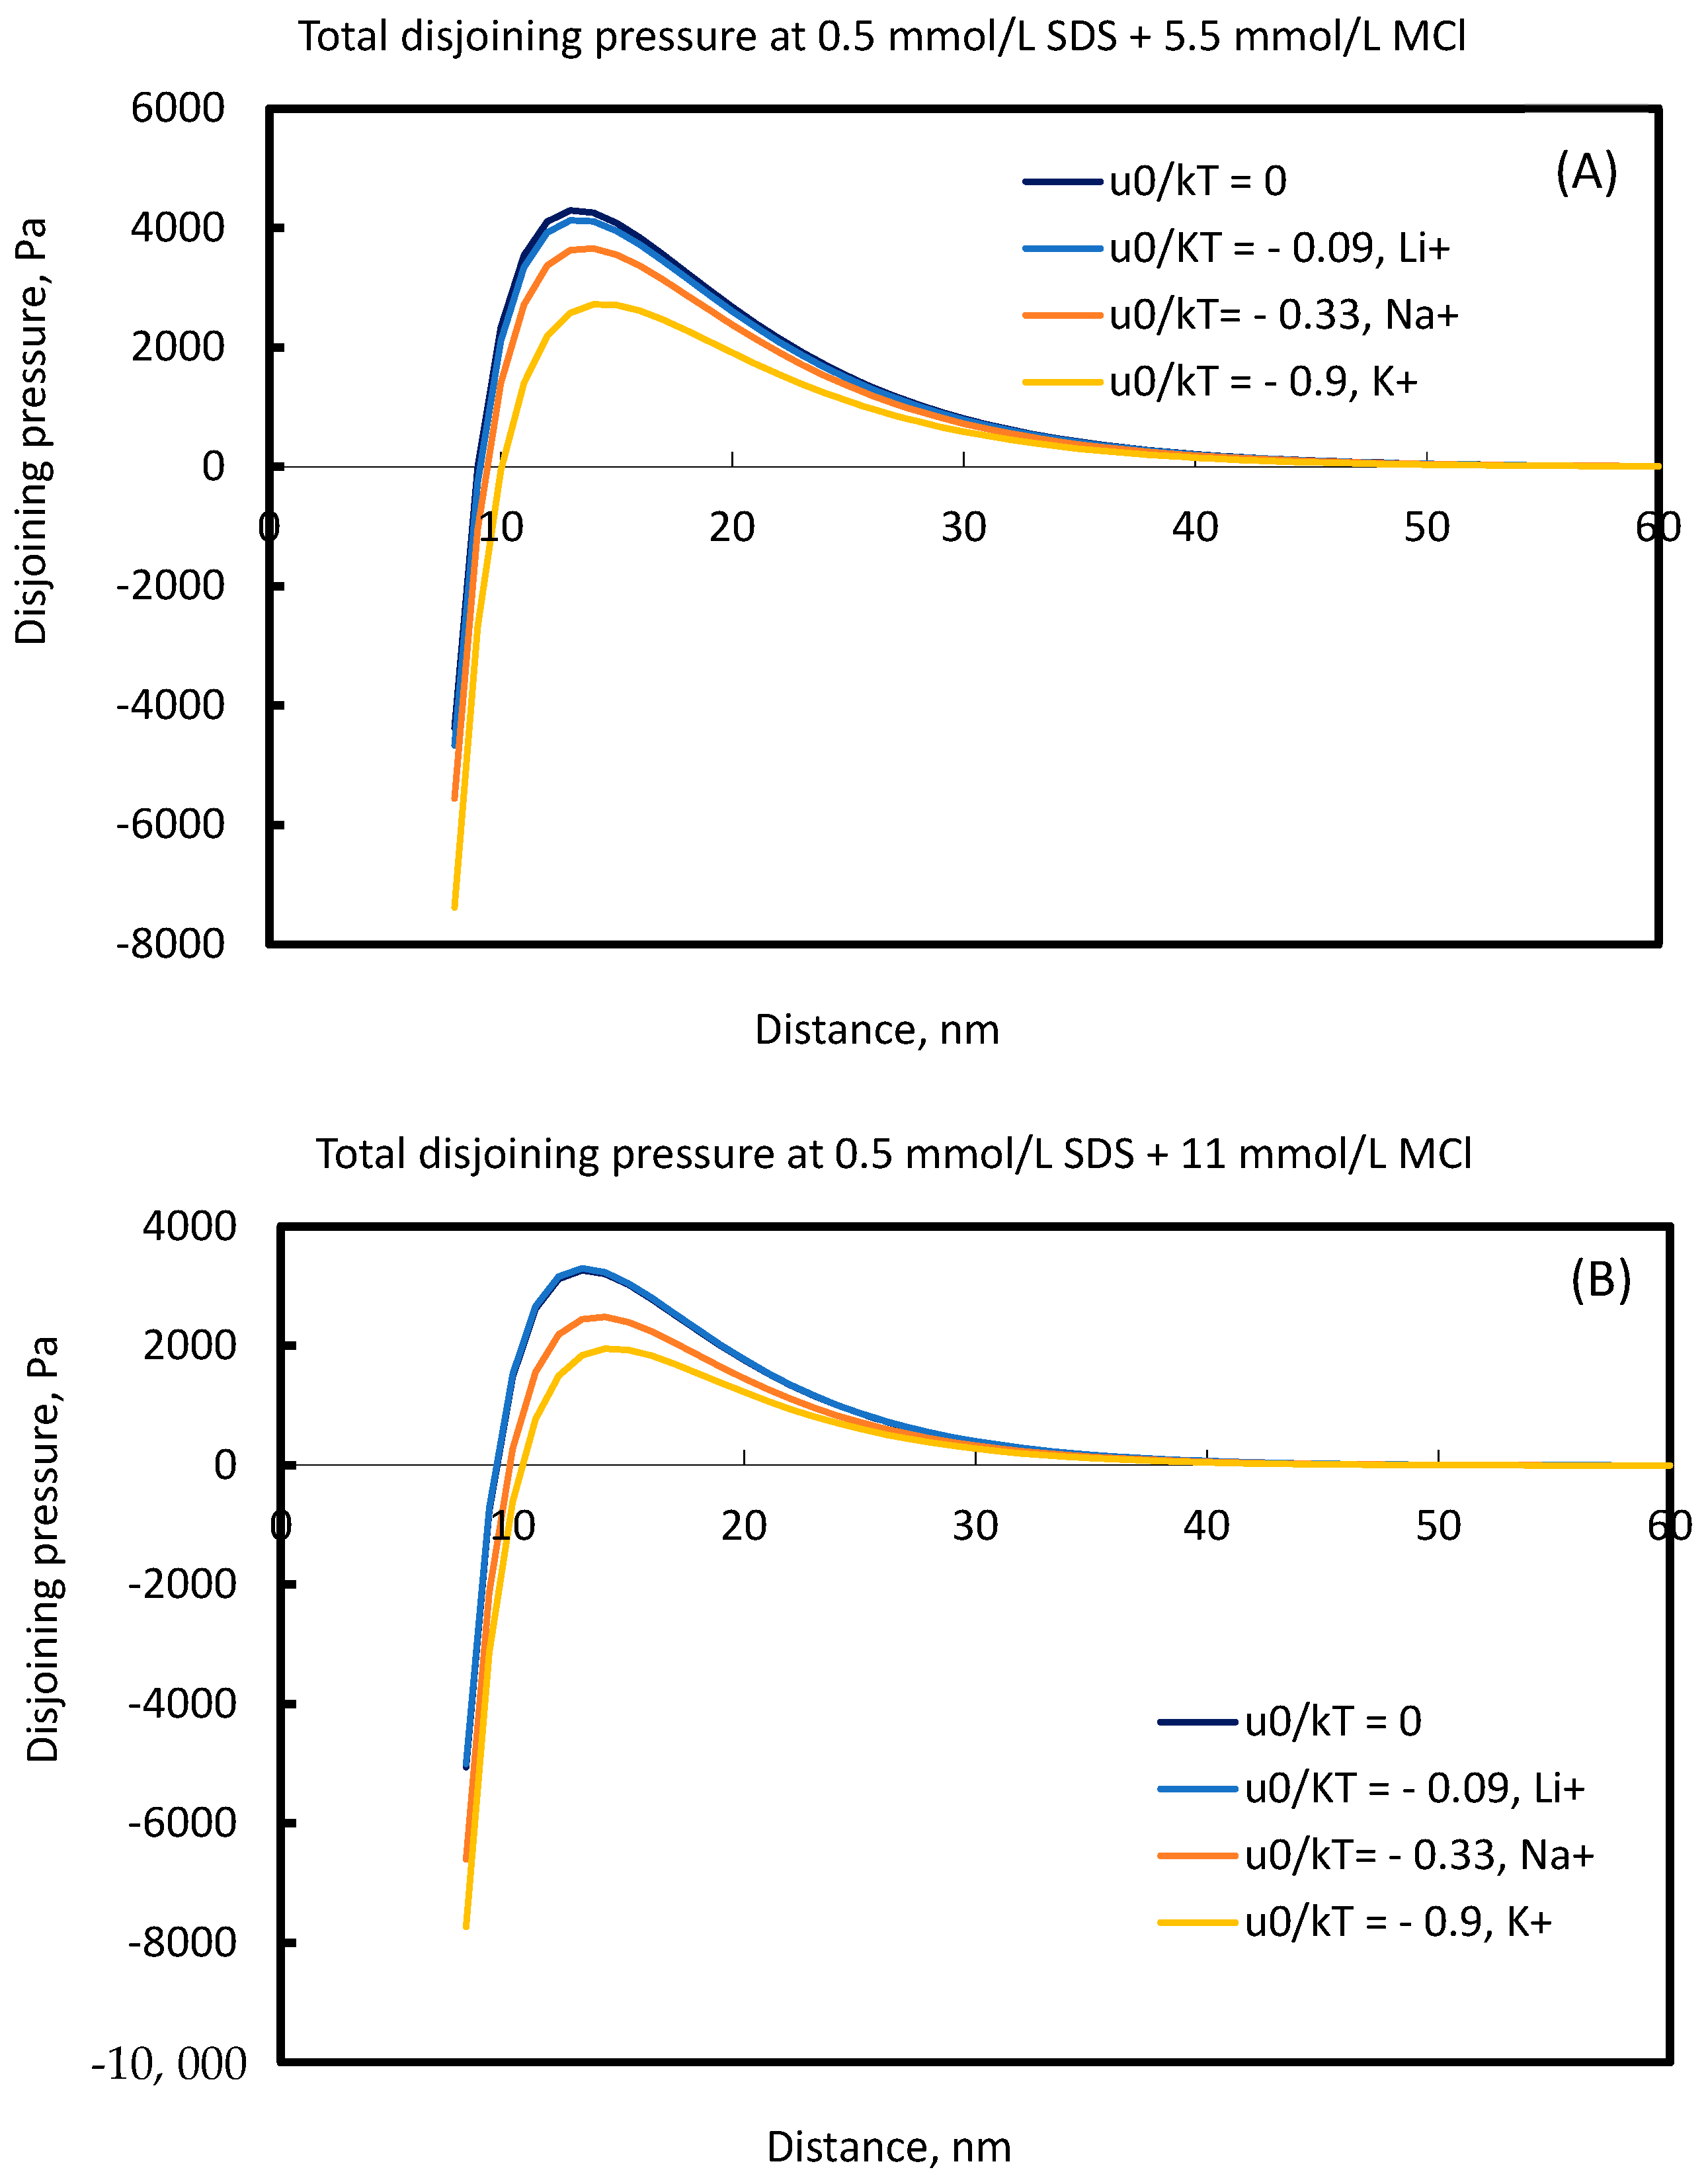
| Type of counter-ion | N/A | Li+ | Na+ | K+ |
| −u0/kBT | 0.00 | 0.09 | 0.33 | 0.90 |
Disclaimer/Publisher’s Note: The statements, opinions and data contained in all publications are solely those of the individual author(s) and contributor(s) and not of MDPI and/or the editor(s). MDPI and/or the editor(s) disclaim responsibility for any injury to people or property resulting from any ideas, methods, instructions or products referred to in the content. |
© 2023 by the authors. Licensee MDPI, Basel, Switzerland. This article is an open access article distributed under the terms and conditions of the Creative Commons Attribution (CC BY) license (https://creativecommons.org/licenses/by/4.0/).
Share and Cite
Petkova, N.; Ivanova-Stancheva, D.; Grozev, N.A.; Mircheva, K.; Karakashev, S.I. Counter-Ion Effect on the Surface Potential of Foam Films and Foams Stabilized by 0.5 mmol/L Sodium Dodecyl Sulfate. Coatings 2024, 14, 51. https://doi.org/10.3390/coatings14010051
Petkova N, Ivanova-Stancheva D, Grozev NA, Mircheva K, Karakashev SI. Counter-Ion Effect on the Surface Potential of Foam Films and Foams Stabilized by 0.5 mmol/L Sodium Dodecyl Sulfate. Coatings. 2024; 14(1):51. https://doi.org/10.3390/coatings14010051
Chicago/Turabian StylePetkova, Nidelina, Dilyana Ivanova-Stancheva, Nikolay A. Grozev, Kristina Mircheva, and Stoyan I. Karakashev. 2024. "Counter-Ion Effect on the Surface Potential of Foam Films and Foams Stabilized by 0.5 mmol/L Sodium Dodecyl Sulfate" Coatings 14, no. 1: 51. https://doi.org/10.3390/coatings14010051
APA StylePetkova, N., Ivanova-Stancheva, D., Grozev, N. A., Mircheva, K., & Karakashev, S. I. (2024). Counter-Ion Effect on the Surface Potential of Foam Films and Foams Stabilized by 0.5 mmol/L Sodium Dodecyl Sulfate. Coatings, 14(1), 51. https://doi.org/10.3390/coatings14010051