Article

The Preparation and Characterization of an Alginate–Chitosan-Active Bilayer Film Incorporated with Asparagus (Asparagus officinalis L.) Residue Extract

by
Leslie V. Acuña-Pacheco
1,2,
Ana L. Moreno-Robles
1,2,
Maribel Plascencia-Jatomea
2,
Carmen L. Del Toro-Sánchez
2,
Jesús F. Ayala-Zavala
3,
José A. Tapia-Hernández
2,
María J. Moreno-Vásquez
1 and
Abril Z. Graciano-Verdugo
1,*
1
Departamento de Ciencias Químico-Biológicas, Universidad de Sonora, Blvd. Luis Encinas y Rosales S/N, Col. Centro, Hermosillo 83000, Mexico
2
Departamento de Investigación y Posgrado en Alimentos, Universidad de Sonora, Blvd. Luis Encinas y Rosales S/N, Col. Centro, Hermosillo 83000, Mexico
3
Centro de Investigación en Alimentación y Desarrollo, Carretera Gustavo Enrique Astiazarán Rosas, No. 46, Col. La Victoria, Hermosillo 83304, Mexico
*
Author to whom correspondence should be addressed.
Coatings 2024, 14(10), 1232; https://doi.org/10.3390/coatings14101232
Submission received: 6 August 2024 / Revised: 12 September 2024 / Accepted: 19 September 2024 / Published: 24 September 2024
(This article belongs to the Special Issue Edible Films and Coatings: Fundamentals and Applications, 2nd Edition)

Abstract

:
The agricultural production of asparagus generates a significant number of residues rich in bioactive compounds, most of which are wasted. In this study, active edible films with antioxidant and antibacterial properties for food packaging were developed using ethanolic extracts obtained from asparagus residues. These ethanolic extracts of asparagus residue (AspE) were incorporated (1 y 4 wt%) into sodium alginate (SA) solutions for the preparation of alginate–chitosan (SA/CS) bilayer films using the casting method, and they were characterized by optical, structural, mechanical, and thermal properties. In addition, the total phenolic and flavonoid content, antioxidant activity, and antibacterial activity were determined. The results showed that the SA/CS film with 1% AspE had better optical, structural, mechanical, and thermal properties due to its color, flexibility, and homogeneity. Both films incorporated with AspE exhibited antioxidant and antibacterial activity, with higher activity in the film with 4% AspE. However, this film showed shrinkage and surface irregularities that make its application in food packaging difficult, so the formulation with 1% AspE was considered better for this type of application. This study shows that asparagus residues can be a valuable source of bioactive compounds for the food industry, indicating the potential for the valorization of this agri-food waste.

1. Introduction

In recent years, asparagus production worldwide has become an activity undergoing a growing boom, especially in exports, because it is a product in high demand in the international market due to its great benefits, including its high number of nutrients [1]. However, unfortunately, only about 50% of asparagus is considered edible, so the other half is discarded during processing [2]. During asparagus processing, waste is generated by cutting the stalks before packaging and by discarding asparagus that does not meet quality standards. Asparagus has a high content of compounds with biological activity, such as phenolic compounds, saponins, fructooligosaccharides, inulin, and lignans, among which rutin, quercetin, and ferulic acid stand out, which have health benefits [3]. In particular, the high antioxidant activity of asparagus, due to its phenolic and flavonoid composition, has been demonstrated, prompting efforts to extract them from asparagus residues [4]. In addition, these compounds show antibacterial activity against pathogenic bacteria such as Salmonella and S. aureus and spoilage bacteria such as Pseudomonas and lactic acid bacteria [5]. Therefore, the use of these compounds as additives in foods may be beneficial for extending their shelf life and as an alternative for recovering asparagus waste.
The antioxidant properties of phenolic compounds are attributed to their ability to scavenge free radicals and chelate metal ions. Meanwhile, antibacterial activity can occur by different mechanisms, such as damage to the bacterial cell membrane, the inhibition of the ribosome, the inhibition of cell wall synthesis, and damage to plasmids, among others [5]. The interactions of the functional groups of phenolic compounds with the bacterial cell membrane form proton exchangers that reduce the gradient across the bacterial membrane, thus causing cell damage [6]. These bioactive compounds can be used in different food applications as a food ingredient or as a preservative additive. Bioactive compounds can be incorporated directly into the food or through packaging; this technique is one of the modalities of active food packaging, which is increasingly used in the food industry due to its advantages [7,8]. In recent years, significant developments have been made in this type of packaging system, where the component with biological activity is incorporated into edible films for active food packaging to extend its shelf life [9]. Several studies have implemented the use of bioactive compounds in biopolymeric materials to exploit the biological activity of these compounds, highlighting their antioxidant activity. Dou et al. [10] reported the incorporation of tea polyphenols into edible gelatin–alginate films, highlighting as a result a great antioxidant activity by increasing the polyphenols in the edible films. Alshehri et al. [11] reported on biocomposite films of polyvinyl alcohol/carboxymethyl cellulose incorporated with broccoli extract, which resulted in antioxidant activity using the DPPH and ABTS methods. Guo et al. [7] developed acrolein/resveratrol bilayer films grafted with sodium chitosan–alginate–chitosan and reported that the covalent bonding of resveratrol–acrolein–chitosan significantly and remarkably improved the antioxidant activity of the bilayer films.
Edible films are one of the emerging technologies in the food industry because they interact effectively with the product and the environment to maintain and improve quality, safety, and sensory properties compared to synthetic plastics [12]. The main components commonly used in their formulation are polysaccharides, such as alginate and chitosan [13]. The alginate-based polymeric matrix, extracted from brown algae, has demonstrated its potential as a coating material. In addition, it has a film-forming capacity and can, therefore, be used as a vehicle for bioactive compounds to indirectly incorporate them into packaged foods for preservation [14]. Chitosan, on the other hand, is obtained from the deacetylation of chitin and is a polymer composed of monomers of 2-amino-2-deoxy-D-glucosamine and N-acetyl-2-amino-2-deoxy-D-glucosamine linked by β–(1–4) glycosidic linkages. Chitosan is characterized by its solubility, crystallinity, and biodegradability, as well as its biological properties, which may include antimicrobial, antioxidant, antitumor, and anti-inflammatory properties [15].
The assembly technique known as the layer-by-layer method involves sequentially adsorbing oppositely charged materials onto a substrate to obtain thin films [16] through the interactions between multivalent molecules and macromolecules [17]. Several unconventional and quasi-LBL technologies have recently been developed based on LBL assembly, and although the assembly is distinct from conventional approaches, similar techniques and materials are used. It represents an alternative to repeated sequential assembly, yielding thicker films than those obtained by LBL and promoting the application of a variety of different polyelectrolyte systems [18]. Additionally, the development of bilayer films using unconventional LBL, such as layer-by-layer casting, allows for the complementarity of the material properties of the polyelectrolytes used [18,19] and the incorporation of bioactive compounds that act directly on food, such as alginate (polyanionic), in one of the layers, for example, in the inner layer. An outer layer of polymers with antibacterial properties, such as chitosan (polycationic), is used to protect the product from external factors such as light, oxygen, and pathogenic and spoilage microorganisms [19].
Numerous studies have been conducted on alginate and chitosan as edible coating material, and, to the best of our knowledge, no study has been reported that uses both biopolymers with asparagus residue extract. Therefore, in the present study, an edible coating was developed with the bioactive compounds of this extract for food applications. For this purpose, an ethanolic extract of asparagus residues was obtained and characterized by total phenols and flavonoids. Subsequently, the asparagus extract was used in the development of a bilayer film made with layer-by-layer casting with alginate and chitosan, and its optical, structural, mechanical, thermal, antioxidant, and antibacterial properties were characterized.

2. Materials and Methods

2.1. Materials

Sodium alginate was used in salt form (molecular weight of 12–14 kDa). Chitosan from crab shells (average MW 121 kDa, 80% deacetylation) and glycerol as plasticizing agent (purity of 99.5%); 2,2-diphenyl-1-picrylhydrazylradical (DPPH); 2,2′-azino-bis (3-ethyl-benzothiazoline-6-sulfonicacid) (ABTS); 2,4,6-Tris (2-pyridyl)-s-triazine (TPTZ); 6-hydroxy-2,5,7,8-tetramethylchroman-2-carboxylic acid (Trolox); Folin–Ciocalteu reagent; and sodium carbonate were purchased from Sigma-Aldrich (Sigma Chemical Co., St. Louis, MO, USA).
The discarded fresh asparagus (Asparagus officinalis L.) was obtained from the agricultural region of Caborca, Sonora, México (30.846400 N, 112.748570 O). After harvesting, the discarded asparagus was packed in plastic bags and transported in boxes to the Food Research Laboratory of the Universidad de Sonora, Unidad Regional Centro, in the city of Hermosillo, Sonora, and kept refrigerated (4 °C) until use.

2.2. Sample Preparation

Asparagus was washed and disinfected with a 1% chlorine solution; then, it was rinsed with plenty of water; after that, the excess water was dried with paper. Subsequently, the asparagus was cut into pieces approximately 1 cm in size. It was taken to a drying oven in a convection oven for 24 h at 45 °C. The dehydrated asparagus was ground in a food mill (Thomas Scientific, Swedesboro, NJ, USA), and flour was sieved in sieving equipment (CHOPIN Technologies, Villeneuve-la-Garenne, Nanterre, France) to obtain particle sizes of 200 microns; the asparagus powder obtained was stored at −40 °C in plastic bags protected from light.

2.3. Preparation of Asparagus Residue Extract

The asparagus residue extract (AspE) was obtained following the methodology described by Fan et al. [19], with modifications. The asparagus powder (1 g) was mixed with 20 mL of solvent (ethanol–water 50:50). The extraction procedure was carried out by extraction assisted by ultrasonic pulses using a Branson Digital Sonifier SFX 550 (Branson Ultrasonics Corporation, Brookfield, CT, USA) ultrasonic device at a frequency of 20 kHz and amplitude of 30%, with a pulsed on-time and off-time of two and two seconds during 40 min. The flask with the sample was placed in an ice bath, to prevent the extract from increasing in temperature during the ultrasound treatment. Then, the extract obtained was centrifuged at 4 °C for 30 min at 6000 rpm, and the ethanolic fraction was filtered under vacuum. The extracts were placed in a rotary evaporator (45 °C, 100 rpm) to remove the solvent and subsequently subjected to lyophilization. Finally, the lyophilized extracts were stored in the dark at −40 °C until use.

2.4. Quantification of Total Phenols and Total Flavonoids

2.4.1. Quantification of Total Phenols

Total phenols were determined according to the Folin–Ciocalteu method, with modifications [20]. Briefly, 10 µL of asparagus residue extract in solution (0.012 g/mL) was taken, and 25 µL of Folin 1 N reagent was added and incubated for 5 min in the dark. Then, 25 µL of 20% sodium carbonate and 140 µL of MiliQ water were added. The mixture was incubated for 30 min in the dark, and subsequently, the absorbance was read at 760 nm on a microplate reader (Veloskan™ LUX multimode, Thermo Scientific, Chicago, IL, USA). The results are expressed as µmol of gallic acid equivalent/g dry weight (µmol GAE/g DW).

2.4.2. Total Flavonoid Quantification

The determination of total flavonoids was performed according to the method described by Chen et al. [21], with modifications. Briefly, 25 µL of asparagus residue extract in solution, and 100 µL of MiliQ water were taken. The mixture was incubated in the dark for five minutes, and 15 µL of 10% AlCl3 was added. It was left in the dark for 6 min, and then 50 µL of 1M NaOH and 50 µL of MiliQ water were added. Absorbance was read at 510 nm on a microplate reader (multi-mode Veloskan ™ LUX, Thermo Scientific, Waltham, MA, USA), and the results are expressed as µmol quercetin equivalent/g dry weight (µmol QE/g DW).

2.5. Preparation of Bilayer Film

The films were prepared according to the method described by Concha-Meyer et al. [22], with some modifications. Solutions of 1% sodium alginate (SA) in MiliQ water and 1% chitosan (CS) in 0.1 M acetic acid were prepared by magnetic stirring at 70 °C for 40 min for SA and at 40 °C for CS. Freeze-dried AspE (1 and 4 wt%) was added to the SA solutions. For better incorporation, the freeze-dried AspE was dissolved in 5 mL of water before incorporation into SA solutions. After 15 min of magnetic stirring to improve homogeneity, 1 mL of glycerol was added to each solution (SA and CS). The films were prepared by casting (pouring on a plate). Briefly, 10 mL of the SA + AspE film-forming solution was taken and added to a Petri dish (diameter of 35 mm). It was placed in a convection oven at 35 °C for 4 h to dry until a solid but sticky surface was obtained to promote the interaction between the polymers. Subsequently, 10 mL of the CS film-forming solution was added. They were then placed in the oven for another 8 h. Once dry, the films were stored in the dark and placed in a desiccator at 50% relative humidity prior to analysis. These films were coded as F1% and F4%. Under the same conditions, a bilayer film was prepared with no addition of AspE, which was used as a control (F0%). Monolayer films of SA and CS were prepared for analysis by FTIR and TGA to study their contribution to the obtained results. Additionally, the thermal stability of AspE was evaluated.

2.6. Bilayer Film Characterization

2.6.1. Thickness

The thickness of the film was measured using a thickness gauge (C112XBS, Mitutoyo Corp., Kawasaki, Japan) at ten random positions.

2.6.2. Appearance and Color

The film’s color was evaluated according to the CIE L*a*b* system using a HunterLab MiniScan XE Plus colorimeter (Hunter Associates Laboratory, Reston, VA, USA). The color values L (lightness), a (red–green), and b (yellow–blue) of the films were determined. The °Hue and chroma (C*) were calculated using the following equations [23]:
° Hue = tan 1 b a
C = ( a ) 2 + ( b ) 2

2.6.3. Light Transmission and Opacity

Light transmittance values of the films were obtained by measuring the transmittance (%) in the wavelength range of 200 to 800 nm using a UV-VIS spectrophotometer, model Cary 100 (Varian Inc., Palo Alto, CA, USA). The films were cut into 40 × 10 mm rectangles and placed in the quartz cell of the spectrophotometer, using the cell free of any substance as a calibration blank. Opacity was determined by measuring the absorbance at 600 nm and calculated using the following equation [24]:
O = Abs 600/(thickness) × 100
where O is the % opacity, and Abs 600 is the absorbance at 600 nm divided by the film thickness (mm).

2.6.4. Mechanical Properties of Films

The percentage of elongation, tensile strength (MPa), and Young’s modulus (MPa) were determined according to the methodology of ASTM D1708-96 [25]. The films were cut into rectangular strips of 3 cm × 0.5 cm (n = 5). The test was performed with a 6 N load cell and a speed of 0.1 mm/s in an Electroforce 5110 mechanical testing machine (TA Instrument, Austin, MN, USA).

2.6.5. Morphology of Film

The films’ morphological characteristics were determined by analyzing their cross-section using scanning electron microscopy (SEM) with a JSM-5410 LV microscope (Scanning Microscope, Tokyo, Japan).

2.6.6. Fourier Transform Infrared Spectroscopy (FTIR) of Films

The possible interactions between the extracts and SA-CS were evaluated by FTIR, using a PerkinElmer Spectrum 2000 spectrophotometer (PerkinElmer Co., Norwalk, CT, USA). The samples were scanned 16 times in the spectral range of 4000 to 400 cm−1, with a resolution of 4 cm−1.

2.6.7. Thermogravimetric Analysis (TGA)

TGA was performed to determine the thermal stability of the samples. A PerkinElmer STA 6000 was used, heating from 30 to 600 °C at a heating rate of 10 °C/min under a nitrogen atmosphere.

2.6.8. Determination of Total Phenols of Films

The total phenolics of films were determined according to the Folin–Ciocalteu method [26], with modifications. Briefly, 48 mg of each film was placed in 10 mL of 98% methanol and allowed to stand for 30 min [27]. After this period, 10 µL of the methanol solution was removed, and 25 µL of Folin 1 N reagent was added and incubated for 5 min in the dark. Then, 25 µL of 20% sodium carbonate and 140 µL of MiliQ water were added, and the absorbance was read at 760 nm in a microplate reader (Veloskan ™ LUX multimode, Thermo Scientific, Chicago, IL, USA). The results are expressed as µmol gallic acid equivalent (GAE)/g film.

2.6.9. Determination of Total Flavonoids of Films

The determination of total flavonoids was performed according to the method described by Marinova et al. [28], with modifications. Briefly, 48 mg of each film was placed in 10 mL of 98% methanol and allowed to stand for 30 min. After this period, 25 µL of the film in solution and 100 µL of MiliQ water were taken. The mixture was incubated in the dark for five minutes, and 15 µL of 10% AlCl3 was added. After 6 min in the dark, 50 µL of 1 M NaOH and 50 µL of MiliQ water were added. Absorbance was read at 510 nm on a microplate reader (multi-mode Veloskan™ LUX, Thermo Scientific, Chicago, IL, USA), and the results are expressed as µmol quercetin equivalent (QE)/g film.

2.7. Determination of the Antioxidant Activity of Films

2.7.1. ABTS (2,2′-azino-bis (3-ethylbenzothiazoline-6-sulfonic acid) Assay

The ABST assay was performed according to Arrua et al. [27]. To generate the radical, 19.2 mg of ABTS was dissolved in 5 mL of distilled water. A solution of 4.95 mM potassium persulfate in water was then added and allowed to stand for 12 h at 25 °C in the dark. The absorbance of the ABTS solution was then adjusted to 1.0 ± 0.01 at a wavelength of 734 nm. To determine the antioxidant capacity of the films, 48 mg of the film was placed in a 10 mL volume of ABTS solution and allowed to stand for 30 min. At the end of the time, 20 µL of the solution was removed, and the absorbance was read at 734 nm in a microplate reader (Veloskan LUX, Thermo Fisher Scientific, Waltham, MA, USA). Each treatment was performed in triplicate. The antiradical activity (% ARA) of the films was calculated according to the following equation [27]:
%ARA = 100 × (1 − Abs 734 nm/blank)
The results are expressed as %ARA/100 mg film.

2.7.2. DPPH Assay (2,2-diphenyl-1-picryl-hydrazyl)

The DPPH assay was performed according to the method by Arrua et al. [27]. A stock solution was prepared by dissolving 24 mg of DPPH in 100 mL of methanol. The working solution was obtained by mixing 10 mL of the stock solution with 45 mL of methanol to obtain an absorbance of 1.1 ± 0.002 units at 515 nm with the spectrophotometer. To determine the antioxidant capacity of the films, approximately 48 mg of the film was placed in a 10 mL volume of DPPH solution and allowed to stand for 30 min. At the end of the time, 20 µL of the solution was removed, and the absorbance was read at 515 nm in a microplate reader (Veloskan LUX, Thermo Fisher Scientific, Waltham, MA, USA). Each treatment was performed in triplicate. The values were calculated using the following equation [27]:
%ARA = 100 × (1 − Abs 515 nm/blank)
The results are expressed as a percentage of antiradical activity (%ARA)/100 mg film.

2.7.3. Ferric-Reducing Power Assay (FRAP)

The ferric-reducing power assay (FRAP) was performed according to the method of Benzie and Strain [29], with some modifications. The method is based on the increase in absorbance due to the formation of the 2,4,6-tripyridyl-s-triazine (TPTZ)-Fe (II) complex in the presence of reducing agents. The FRAP reagent was prepared from acetate buffer (pH 3.6), 10 mM TPTZ (2,4,6-tri(2-pyridyl)-s-triazine) solution in 40 mM HCl and 20 mM ferric chloride solution in 10:1:1 (v/v/v) ratios. For sample analysis, 48 mg of film was collected and placed in 10 mL of FRAP reagent and allowed to stand for 30 min. After this time, 20 µL of the solution was collected, and the absorbance was read at 638 nm in a microplate reader (Veloskan LUX, Thermo Fisher Scientific, Waltham, MA, USA). Each treatment was performed in triplicate. The results are expressed as mg Trolox equivalent (TE)/g film.

2.8. Determination of Antibacterial Activity of Films

2.8.1. Microbial Strains and Inoculum Preparation

The Gram-positive bacterium Pediococcus acidilactici (ATCC 8040) and the Gram-positive pathogenic bacterium Staphylococcus aureus (ATCC 25923) associated with food poisoning were used for antibacterial evaluation. The bacteria were cultured on nutrient agar and incubated at 37 ± 1 °C for 24 h in an incubator (Thermo Scientific™ Heratherm™, Waltham, MA, USA). Bacterial cultures were diluted with MHB broth to adjust to a 0.5–1.0 (1 × 10⁸ bacteria CFU/mL) McFarland scale or an OD of ~0.1 (570 nm).

2.8.2. Resazurin Cell Viability Assay

The cell growth of bacteria treated with the films incorporated with different concentrations of asparagus residue extracts was evaluated. The quantitative colorimetric method used to determine the cell proliferation capacity was resazurin (Alamar Blue (7-hydroxy-10-oxydophenoxazin-10-io-3-one) (non-fluorescent blue). In this method, resazurin was reduced to resorufin (pink, highly fluorescent) by oxidoreductases found mainly in the mitochondria of viable cells, allowing for differentiation between viable (pink) and non-viable (purple) cells. For this purpose, 1 cm2 pieces of film were cut and placed in a 12-well plate, and 50 μL inoculum of the standardized microorganism (1–3 × 10⁸ bacteria/mL) was added to each well. The plate was incubated for 24 h at 37 °C. At the end of the incubation period, the foil pieces were carefully removed and placed in 1 mL of saline solution, which was gently shaken back and forth 25 times. Then, 250 μL of this solution was taken and added to a 96-well plate containing 20 μL of resazurin and incubated for 4 h in an incubator (Thermo Scientific™ Heratherm™, Waltham, MA, USA), after which the absorbance was read in a microplate reader at a wavelength of 570 nm [30]. The cell’s bacterial growth was reported as CFU/cm2 film.

2.8.3. Microscopic Analysis

The effect of the films on bacterial cell morphology was evaluated using the methodology of Martínez-Camacho et al. [31]. Sterile film pieces (1 cm2) were cut and placed on a nutrient agar plate. Each piece of film was inoculated with 50 μL of standardized microorganism inoculum (1 × 10⁸ bacteria/mL). The plate was incubated for 24 h at 37 °C. At the end of the incubation period, the pieces of film were carefully removed, and a sample was taken for staining with trypan blue to identify any damage that may have occurred in the cell membrane. Only cells with intact membranes can effectively exclude the dye, so only cells with damaged membranes are stained. For observation, image analysis was performed using Image-Pro Plus version 6.3 software (2008 Media Cybernetics Inc., Rockville, MD, USA) and a light microscope (Olympus CX31, Tokyo, Japan) connected to an In The cell morphology was reported as area in µm2.
In addition, propidium iodide staining was performed to analyze the cell damage by fluorescence microscopy. This is a chromosomal or nuclear red fluorescent stain that does not penetrate living cells, so it is assumed that dead cells or cells with a damaged membrane allow the passage of this dye, which shows a red fluorescent color.

2.9. Experimental Design and Statistical Analysis

Statistical analyses were performed using a complete randomized design on the Infostat statistical program (Version 2020), with the only factor being the extract concentration (0, 1, and 4%). The differences between means were evaluated by Tukey’s test at a significance level of 5%.

3. Results and Discussion

3.1. Content of Total Phenols and Total Flavonoids from Asparagus Extract Residues

The total phenolic content of AspE was 44,635.3 ± 1064 µmol GAE/g DW, and the total flavonoid content was 24,346.6 ± 377 µmol QE/g DW. Fan et al. [19] reported lower values for total phenolic content (12,030 µmol AGE/g DW) for asparagus residue extracts extracted by the solid–liquid technique with 50% ethanol as solvent. As for the total flavonoid content, Redondo-Cuenca et al. [32] reported a value of 8870 µmoles QE/g DW for green asparagus residue extracts extracted using the solid–liquid technique with ethanol (80%) as solvent. These values are due to the extraction method used. Conventional extraction techniques are less efficient than non-conventional techniques, such as ultrasound-assisted extraction. Asparagus residues contain a large number of polyphenolic compounds. The phenolic acids that may be present in asparagus are hydroxybenzoic acids, such as gallic acid, or hydroxycinnamic acids, such as ferulic acid or coumaric acid; other non-flavonoid compounds are stilbenes, saponins, and lignans. Other polyphenolic compounds of the flavonoid type are found, such as quercetin, kaempferol, and rutin. These are known for their antioxidant and antibacterial activities [33]. The antioxidant activity of this type of extract has been correlated with its phenolic and flavonoid content. Sun et al. [33] reported a correlation between the total flavonoid content and antioxidant activity, suggesting that flavonoids are a key group of compounds in the antioxidant activity of plant extracts such as asparagus.

3.2. Bilayer Film Characterization

3.2.1. Thickness

The determination of edible film thickness is of great importance as it affects the functional and physicochemical properties of edible films, as well as their mechanical properties and and vapor permeability. Additionally, the thickness determines the distance the bioactive compound must travel to diffuse from one side of the film to the other [27]. The thickness values of the developed films can be seen in Table 1. The thickness of the edible films was between 0.14 mm and 0.25 mm. This is in compliance with the Japanese Industrial Standard JIS Z 1707 [34], which states that the maximum thickness of plastic film for food packaging is 0.25 mm. For the 0% extract formulation, a value of 0.14 ± 0.01 mm was obtained, which was the smallest value, followed by the 1% film (0.15 ± 0.01 mm), and finally, the 4% film with a value of 0.25 ± 0.61 mm, which was the highest value. We can observe that as the content of asparagus residue extract increased, the thickness of the film increased, presenting irregularities on the film’s surface. Similar results were reported in monolayer alginate films with carboxymethylcellulose obtaining a value of 0.12 mm [35]. Alfonso-Arce [36] reported values from 0.09 mm to 0.11 mm in monolayer alginate films with 1% thyme and rosemary extracts.

3.2.2. Appearance and Color of Films

The AspE obtained was used to prepare sodium alginate–chitosan (SA/CS)-active bilayer film. Two formulations were prepared by adding 1 and 4% of AspE, and additionally, a control formulation, free of asparagus extract, was prepared. The films obtained are shown in Figure 1. Regarding general appearance, the 0% film (F0%) was homogeneous, flexible to the touch, light yellow in color, shiny, and easy to peel off. The film of 1% AspE (F1%) was homogeneous, flexible, light green in color, shiny, and easy to peel off. Finally, the 4% AspE film (F4%) was not homogeneous and not very flexible; was difficult to peel off, dark green, and non-uniform in color; and had shrinkage and an irregular surface.
The incorporation of natural extracts obtained from plant sources in polymeric materials implies a change in their attributes, depending on the concentration that is added. In this case, the concentration of 4% of AspE increased the color of the films and irregularities on their surface. This can directly affect the thickness and optical properties of the films.
The color values of the developed films were obtained using the CIE L*a*b* method and are shown in Table 1. For the prepared films, luminosity values (L*) were found to range from 63.04 to 86.78, with the greatest values for the F0% film (p < 0.05), indicating that increasing the concentration of the extract decreased the luminosity of the film. As for the chromatic coordinates of a* and b*, they indicate tones from red (+a*) to green (−a*) and from yellow (+b*) to blue (−b*), so the film showed values indicating tones between green and yellow [37], which were greater as the concentration of asparagus in the film increased (p < 0.05). Similar results were reported by Alshehri et al. [11] on carboxymethyl cellulose–polyvinyl alcohol films with broccoli extract, reporting a decrease in brightness with an increase in the broccoli extract content.
Color parameters can be analyzed through °Hue and chroma, which indicate the angle tone (0°: red, 90° = yellow, 180° = green, and 270° = blue) and color saturation or intensity, respectively [23]. The °Hue decreased with an increase in the AspE content, ranging from 95.38° for the fil control to 81.24° for the F4% film, indicating the presence of reddish hues in the F4% formulation. In terms of chroma, the color intensified with an increase in the AspE concentration, ranging from 6.72 ± 2.2 for the F0% film to 54.29 ± 12.8 for the F4% film. The values of °Hue agree with those reported by Zamudio-Flores et al. [38] in oxidized banana starch films. They reported values of 90.59 and a value of 90.24 for oxidized oat starch films. In terms of chroma values, Lopez-Palestina et al. [39] reported similar values in gelatin films with different proportions of lycopene and β-carotene-rich oil, reporting that chroma values increased with an increase in oil concentration, with values ranging from 5.76 for gelatin-only films to 46.91 for films with 15% oil. It can be seen that all three films have a yellow hue, although the control and F1% films tend toward green. The AspE films have a higher color saturation than the control film.
The determination of optical properties in active packaging is of great importance for their application, especially in the food and beverage industry; this is because the films can provide barrier properties against photooxidative reactions in foods, thanks to the addition of plant or vegetable extracts that can impart color and opacity to the films. The optical properties of the packaging can affect the amount of light that reaches the packaged product. For light-sensitive products, such as foods rich in fats or lipids, or photosensitive components, it is crucial to control light permeability to avoid the degradation of these components or the oxidation of lipids. Controlling this degradation factor will ensure the stability of the product and its useful life. Knowing and understanding optical properties allows us to develop innovative solutions to problems such as those mentioned above. This includes the use of advanced materials that can take advantage of the optical properties of the films based on the specific needs of the product where it is used [39].

3.2.3. Light Transmission and Opacity

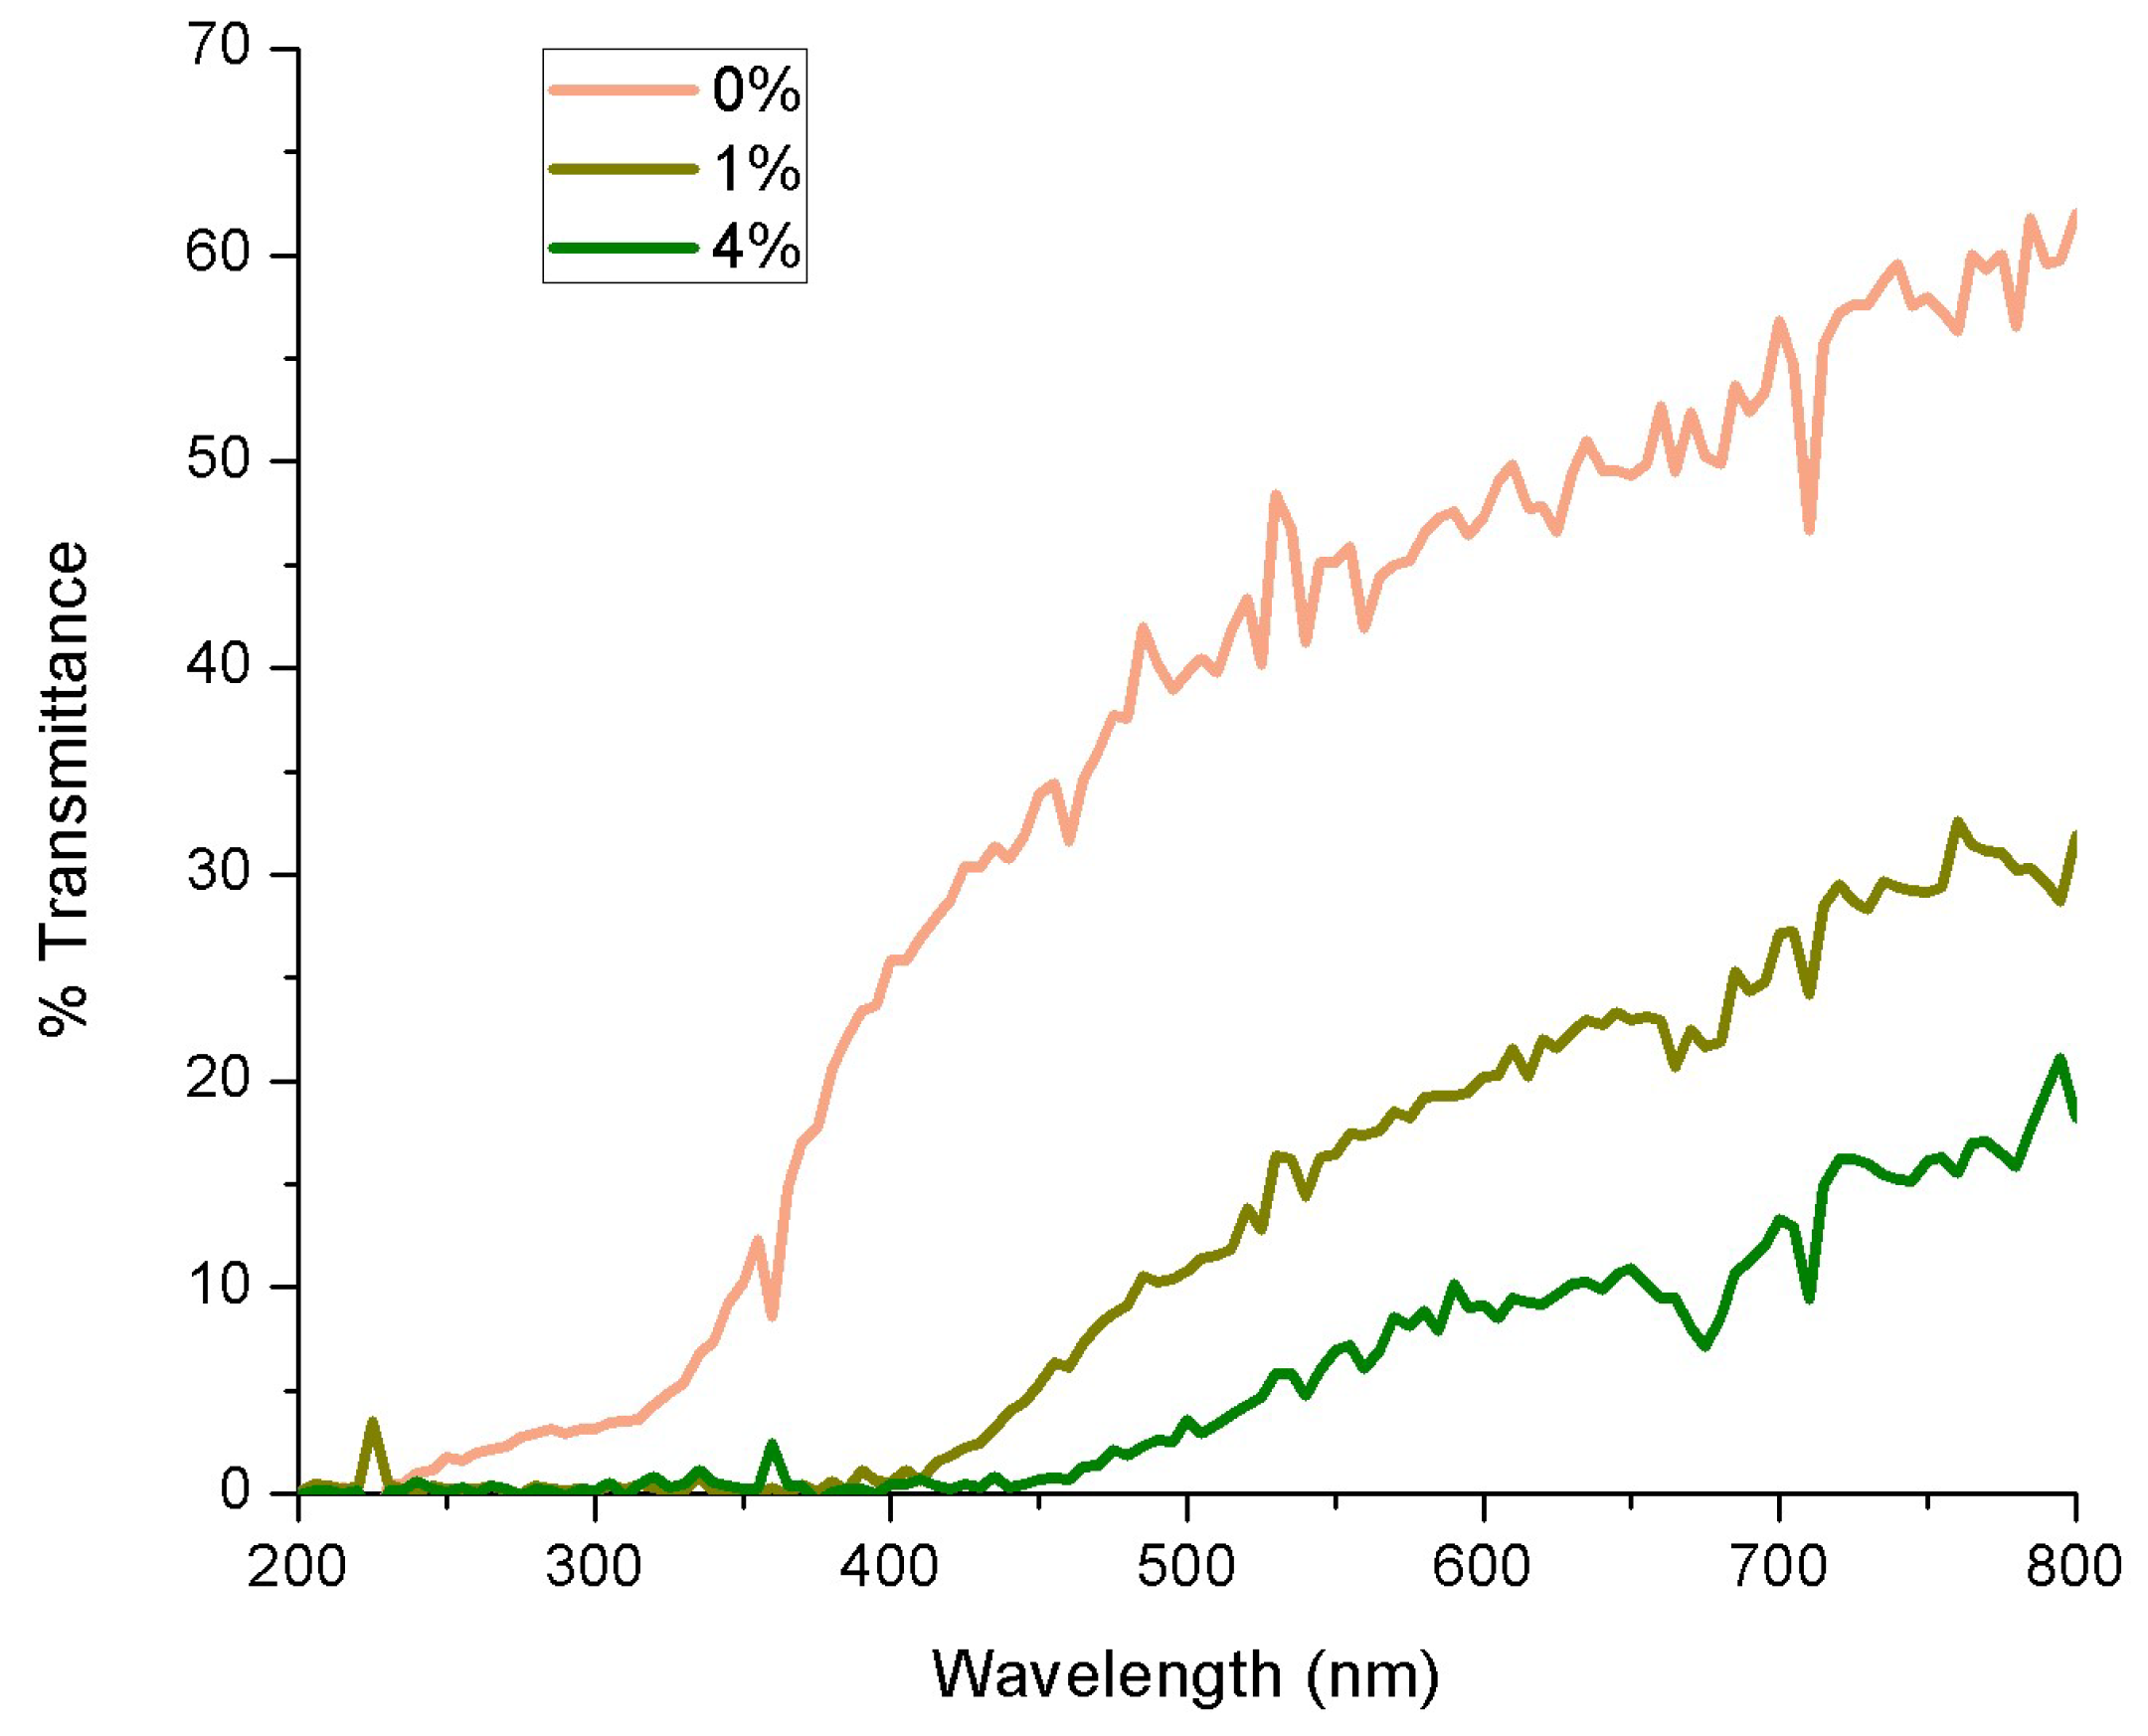
The transmittance percentage indicates how transparent or opaque a material is [40]. Figure 2 shows the percentage of transmittance of the films against the wavelength, where it is observed that increasing the content of asparagus extract in the film decreases the percentage of transmittance. Based on this percentage of transmittance, materials are classified as transparent if their transmittance is greater than 80%; they are translucent if they are between 10 and 80%; and if they are less than 10%, they are considered opaque [41]. According to this classification, the three formulations of films developed were classified as translucent materials. Some materials, such as polyethylene terephthalate, have a transmittance percentage >90%; for cellulosic materials, the transmittance value is around 85%, while for amber glass, it is 40% [42]. The addition of natural-derived additives in the films tends to absorb ultraviolet light and act as a barrier to these areas of the electromagnetic spectrum, due to UV-absorbing aromatic structures and functional groups such as phenolic units, catechol groups, unsaturated bonds, ketones, and other chromophores [43]. Knowing which areas our material absorbs allows us to direct the use of the developed materials to those applications in which they could provide better protective activity.
Table 1 shows the opacity of developed films. The opacity of the different films was found to be 0.96 mm−1 for the F0% film, 1.52 mm−1 for the F1% film, and 1.95 mm−1 for the F4% film. As can be seen, by increasing the concentration of the extract, the opacity increased (p < 0.05); this is because the extract has properties that prevent the passage of light through the material since it presents compounds that, in addition to imparting color, can absorb and disperse the light. Similar values have been reported in studies where alginate or chitosan films were made with different bioactive compounds. Hernández-Gómez et al. [44] reported an opacity of 1.73 mm−1 for monolayer alginate films incorporated with 0.2% melipona honey (Melipona beecheii); in this study, different concentrations of honey were carried out, resulting in a decrease in opacity with increasing the concentration of honey and maintaining the concentration of alginate (2%) in the formulation. Shan et al. [37] reported an increase in opacity in the production of multilayer composite films when adding tea extract for active packaging.

3.2.4. Mechanical Properties

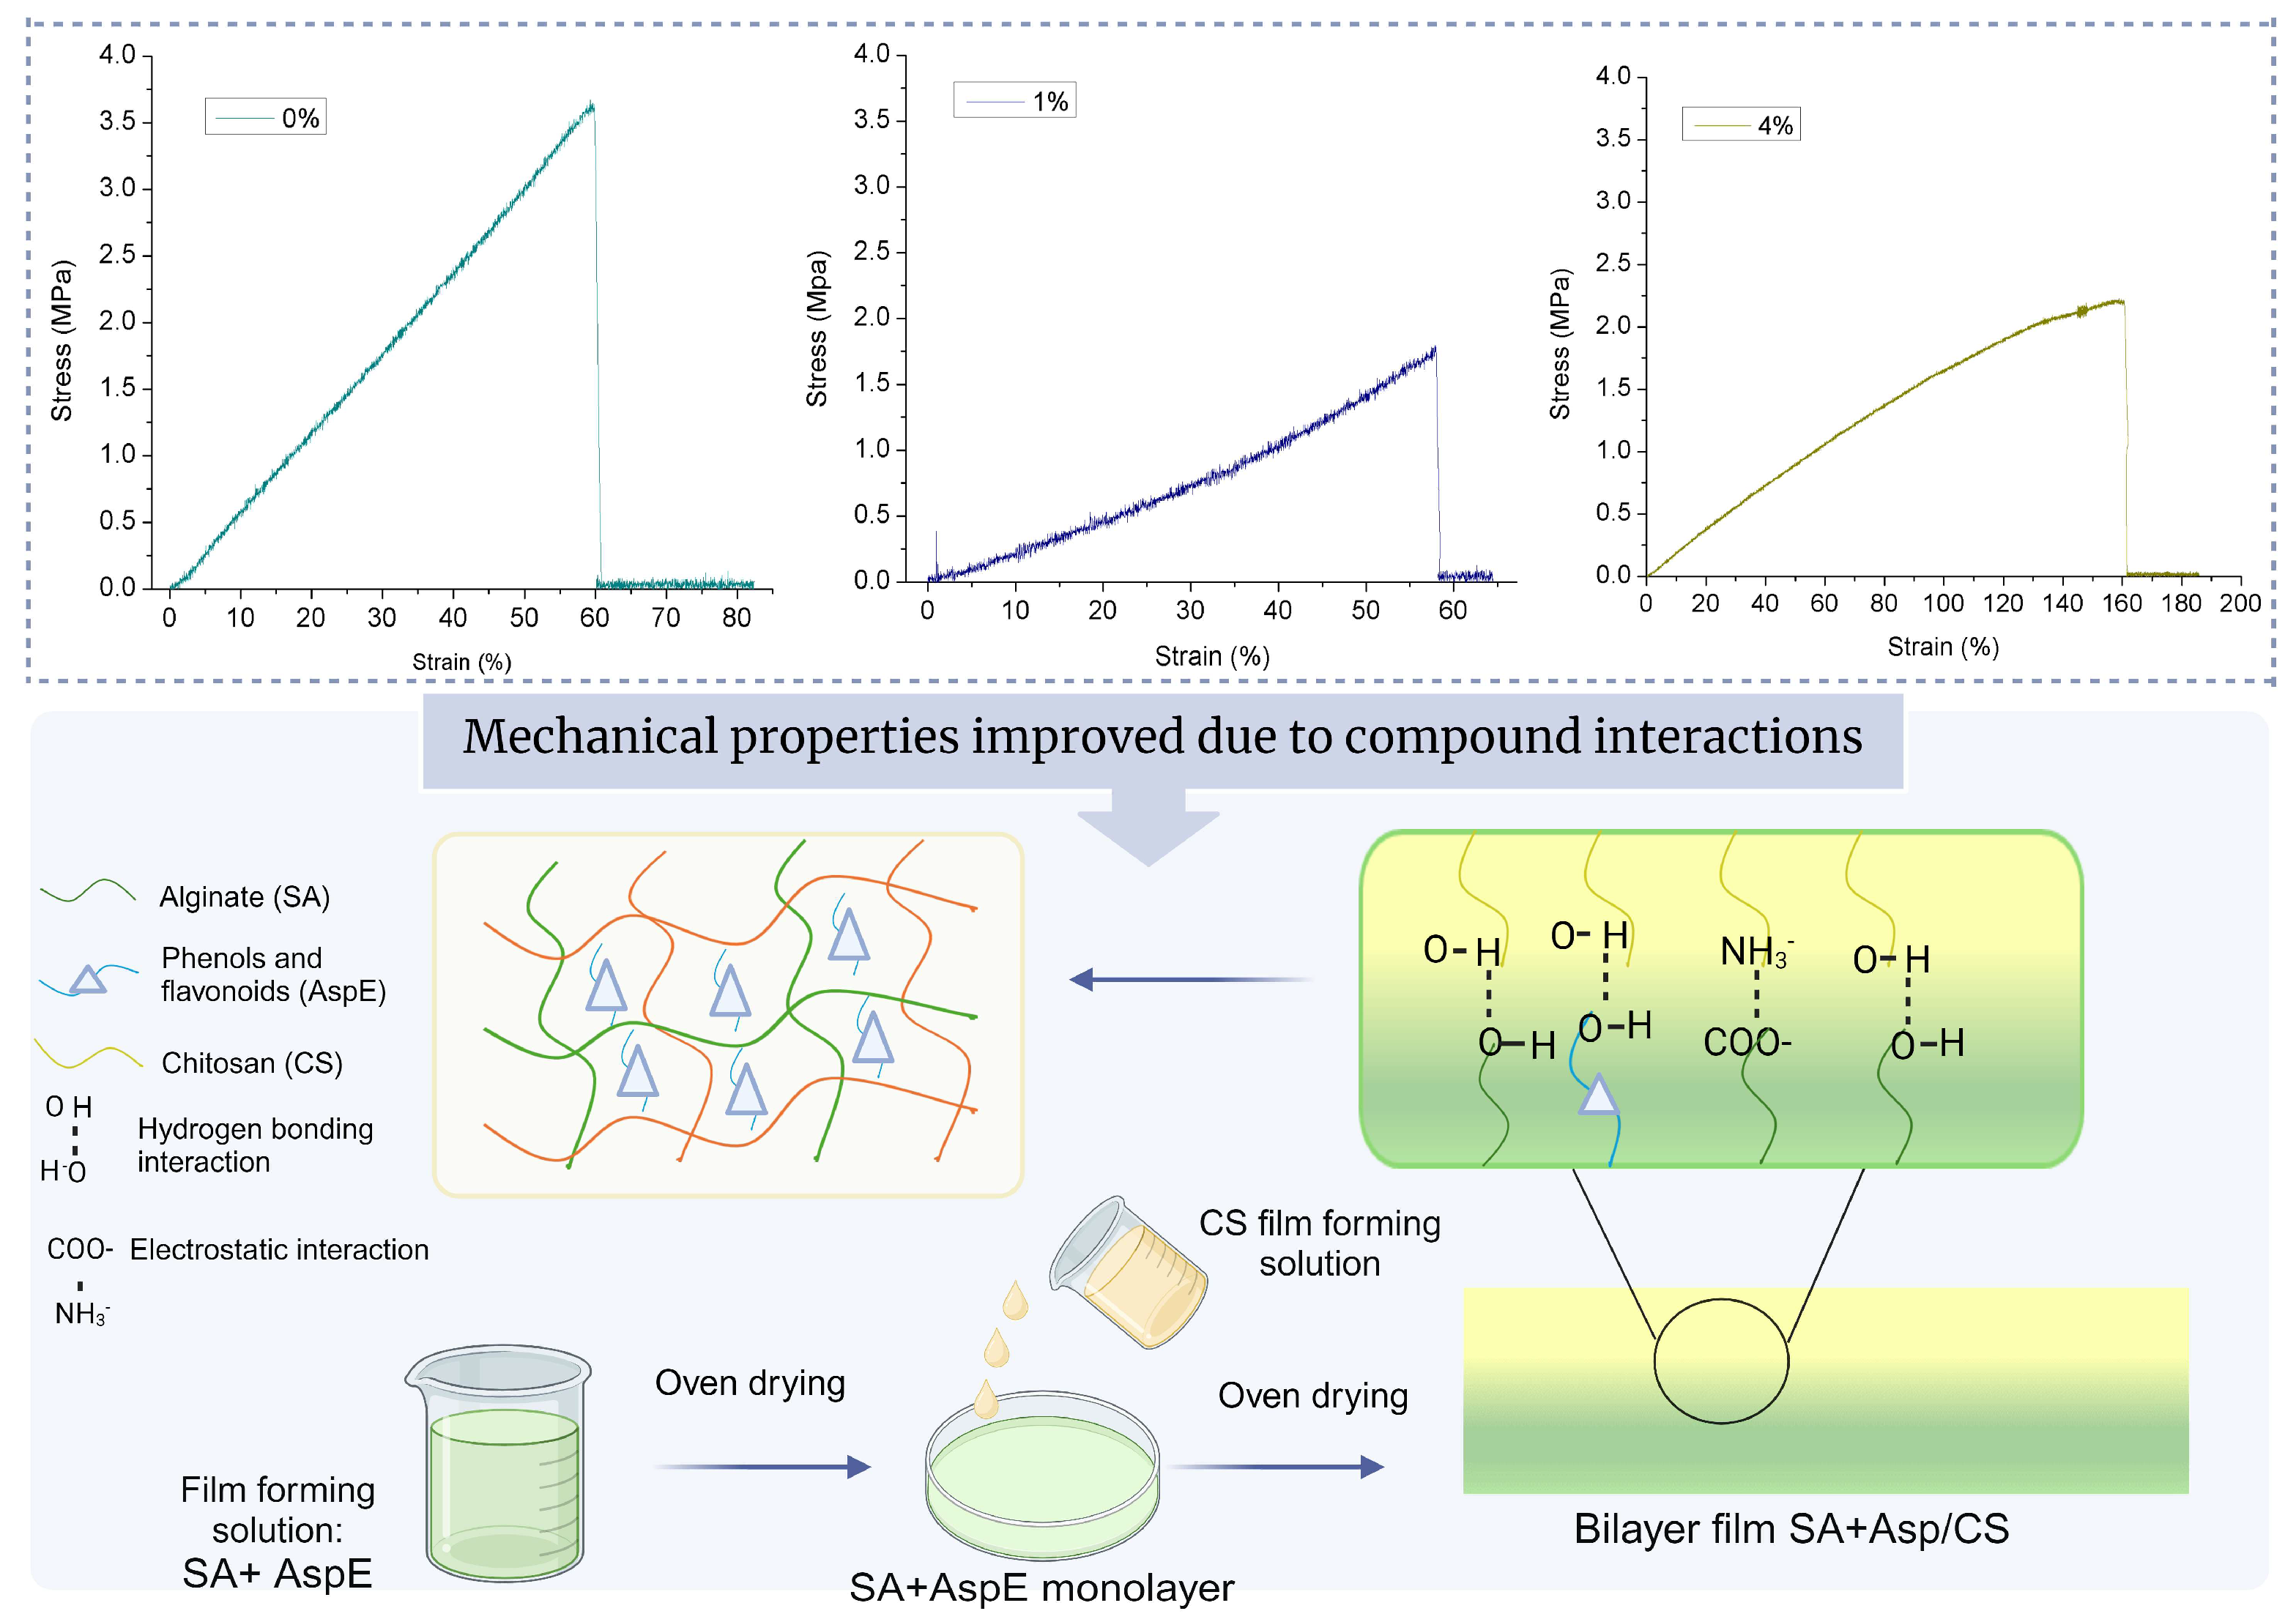
Table 2 shows the results of % elongation, tensile strength, and Young’s modulus of the film control and films made with different concentrations of AspE (1 and 4 wt%). The film control (F0%) showed an elongation value similar to the F1% film. The F4% film experienced greater elongation than other films, with an elongation of 92.9 ± 1%. It can also be observed that the addition of AspE increased the elongation only for the F4% film. SA and CS bind through electrostatic interactions between the alginate carboxyl groups and the chitosan amino groups. On the other hand, the addition of AspE can bind through hydrogen bridges between the hydroxyl groups present in the polymers and the phenolic compounds present in AspE, so that by modifying the interactions of the biopolymers, less effort is required to deform the film. Similar results have been presented by Zhang et al. [12] with an elongation at a break of 60.9 ± 6.3 in chitosan/zein (1:3) films. As a result, an increase in tensile strength and elongation at break in bilayer films is highlighted compared to monolayer films of single polymers.
The results of tensile strength are presented from highest to lowest in the following order: the F0% film, 1.83 ± 0.09; F4%, 1.12 ± 0.0; and finally, the F1% formulation, 0.76 ± 0.08. Tensile strength consists of the maximum force or tension to which a material can be subjected before breaking. There are several materials that, when combined with chitosan, generate favorable effects in films. Some of these adjuvants are proteins such as alginates, gelatin, and collagen [45]. Others are plasticizers such as sorbitol and glycerol [46]. Some plasticizers such as glycerol, sorbitol, and propylene glycol are added to chitosan films to increase flexibility. These components decrease the intermolecular attractions between adjacent polymer chains and increase the flexibility of the film. However, the incorporation of additives has a plasticizing effect, increasing deformation and improving tensile strength. Natural compounds, such as extracts from natural sources, can enhance these properties by interacting with the compounds present in the formulation. By adding 1% of the extract, a significant decrease in tensile strength can be observed. However, adding 4% increases this value.
The highest Young’s modulus value was observed in the F0% film. Young’s modulus is the fundamental measure of film stiffness [47], that is, the higher the value, the less elastic and flexible the film is. Parris and Coffin [48] stated that this value of the initial elastic modulus of the films was of critical importance in applications where the degree of stretch resistance is an important factor depending on the biopolymers. As can be seen, as the content of AspE increases, Young’s modulus decreases; this may be due to the previously mentioned plasticizing effect. Queirós et al. [49] mentioned that the formation of hydrogen bonds increases the cohesion between the polymer chain and the additive and prevents their separation. Therefore, the maximum force required to break the film increases. Escárcega-Galaz et al. [50] showed similar results for Young’s modulus when evaluating chitosan films with bee honey (2%) and glycerol, showing a value of 2.42 ± 0.14 MPa. However, the analyses carried out on films that only contained chitosan in their formulation revealed values between 2198.9 ± 44.0 and 3834.16 ± 288.63 MPa based on the concentration of chitosan. This is because pure chitosan films are usually rigid, inflexible, and brittle. Therefore, it is necessary to improve these properties using additives in the formulations since these components modify the mechanical properties of the films, increasing their flexibility.
Figure 3 shows the stress–strain curves of the film control and films made with different concentrations of AspE (1 and 4 wt%). The film control (F0%) showed a brittle behavior characterized by a high elastic region and a short plastic region. By adding AspE to the bilayer films (F1% and F4%), a decrease in the effort required for the film’s deformation, as well as deformation before their rupture, was observed, with a larger region of plastic behavior. The wider plastic region indicated higher film plasticity, which was more significant with increasing AspE concentration, resulting in a more flexible material. Figure 3 shows a scheme of the possible interaction mechanism of AspE with CS and SA and their influence on the mechanical properties. SA and CS bind to each other through electrostatic interactions between the cationic amino group of CS and the anionic carboxyl group of SA. The glycerin with a high number of hydroxyl (OH) groups in the edible film matrix also favors the interactions between SA and CS [51]. Asparagus residue extract has a high content of phenolic compounds such as ferulic acid, which can act as cross-linkers between polymers, binding via hydrogen bonding between CS and SA [52]. It has been shown that ferulic acid favors the interaction between components of different polymeric matrices [53]. Several studies report that phenolic compounds are distributed in the free spaces between the polymers, forming a network that increases the mechanical properties of the particles incorporated with the extract [54]. The stress–strain graph shows that the elongation percentage of the edible films is greater with increasing AspE concentration. Santoso et al. [55] reported that OH groups of gambir powder filtrate used in edible film are trapped in the polymeric matrix, causing a decrease in the film matrix’s cohesive strength and an increase in the elasticity of edible films. This decrease in cohesive strength could be related to what was observed in the morphology of the F4% film. Furthermore, increasing the concentration of AspE increases the free volume between chains and may cause the formation of aggregates that weaken the interaction interchain.

3.2.5. Morphology of Film

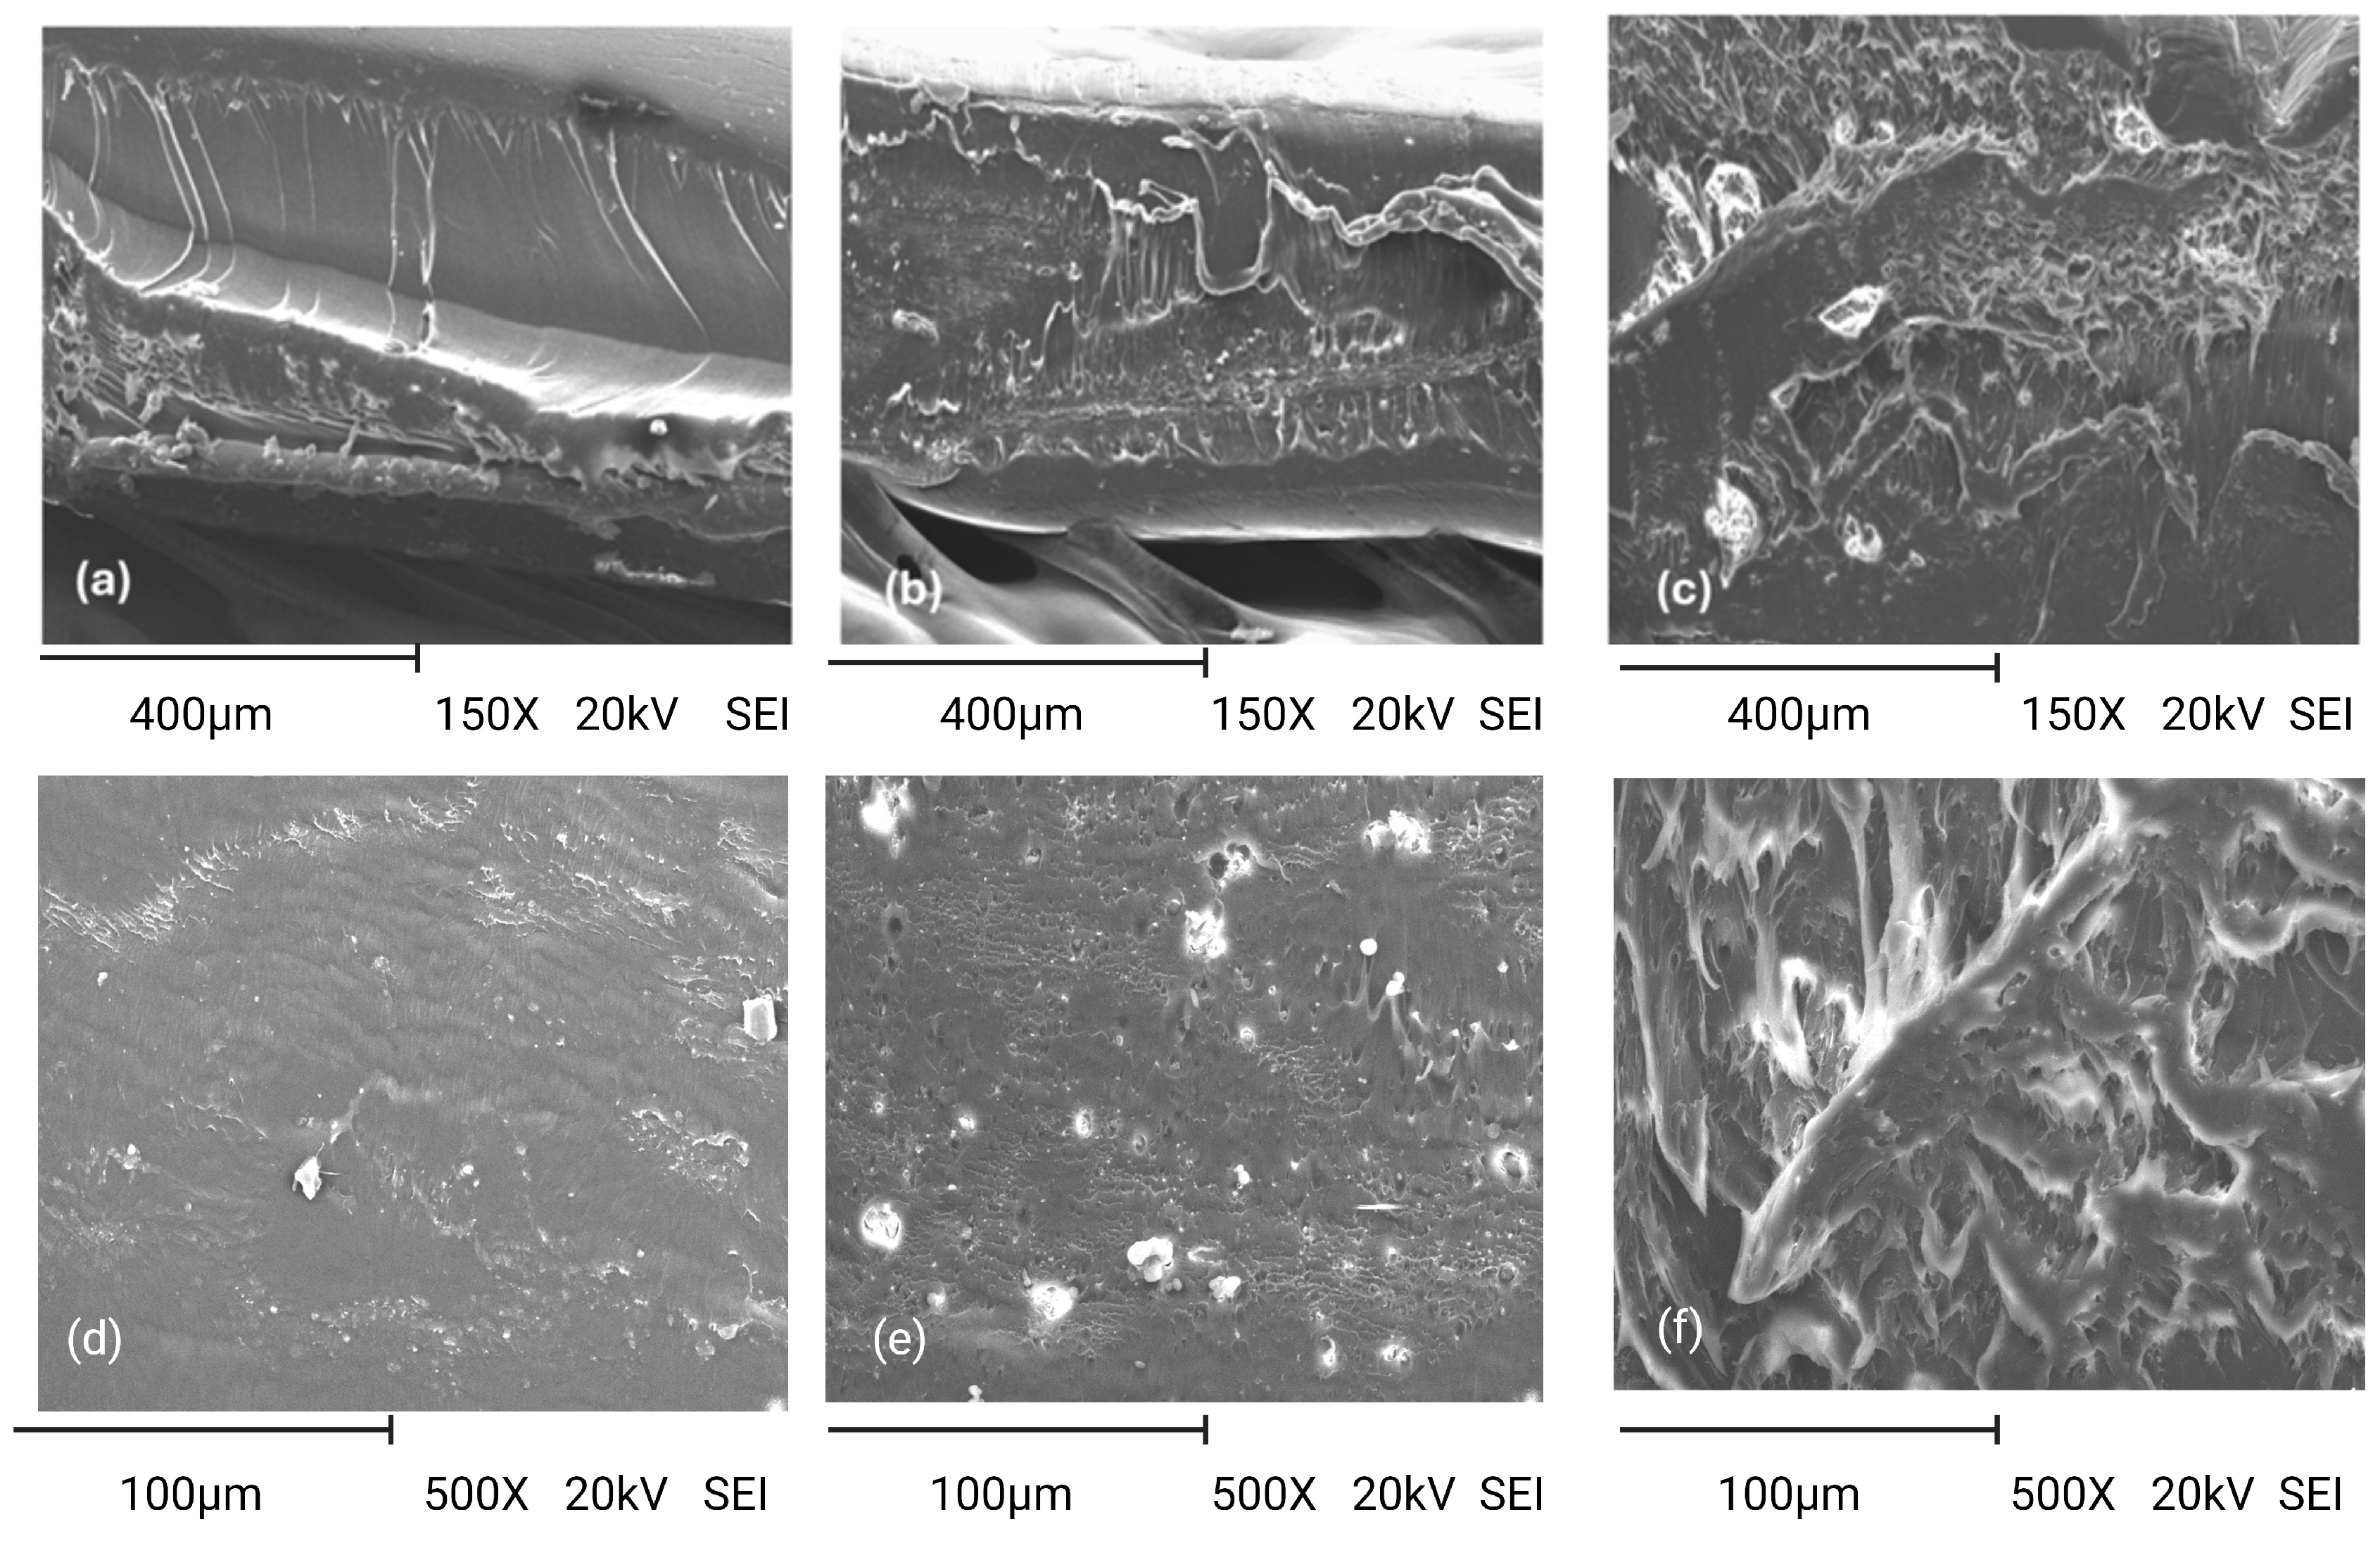
The morphology of the cross-sections of the films was analyzed using SEM microscopy. Figure 4 shows the cross-sections of the bilayer films obtained. The selected images had a magnification of 150× and 500×, which enabled the observation of the interfacial region between both polymers. For the 150× magnification, the F0% film shows brittle fracture patterns and different microstructures that can be related to a low interfacial interaction between the polymers. When AspE was added to the formulation, no transition region was observed between the layers of the F1% and F4% films; however, the F4% film showed some white aggregates, which may be caused by the aggregation of chitosan with AspE, coinciding with previous reports of chitosan film added with other polyphenol extracts [56]. At 500× magnification, we can see that the F0% film presented a more homogenous, compact, and less rough surface compared to the F1% and F4% formulations. Similar results were obtained by Zhang et al. [12], where chitosan–zein bilayer films were analyzed, and the cross-section of the chitosan films revealed a homogenous and smooth internal structure without any sign of fracture. Additionally, small white spots were observed on the surface of the F0% film. The F1% film also presented white spots embedded in the surface and pores. The presence of these spots and white pores has previously been reported in chitosan film, which depends on the nature of the chitosan used (degree of acetylation and molecular weight) [57]. On the other hand, F4% presented an irregular surface with a segmented structure, indicating low cohesiveness of the film matrix, which coincides with the results observed in mechanical properties and may be due to the significant changes in the film’s microstructure when mixed with a high concentration of AspE in the film matrix.
A study by Aziman et al. [58] investigated the morphology of poly(butylene succinate) (PBS) and tapioca starch (TPS) films incorporated with biomaster silver (BM), highlighting that the pure PBS film presented a smooth surface, revealing its tough and ductile structure. Meanwhile, the PBS film with 1.5% BM showed a rougher surface than the pure PBS film. Similar results were obtained in alginate–chitosan bilayer films, resulting in a decrease in the homogeneity of the films by incorporating TiO2 nanoparticles, leading to the formation of roughness and the appearance of conglomerates (white dots) [59]. Paulino et al. [60] reported on alginate–chitosan bilayer membranes with olive leaf extract, showing, as a result, a compact structure without layer separation, as well as good adhesion of the polymers with the extract.

3.2.6. FTIR Analysis of Films

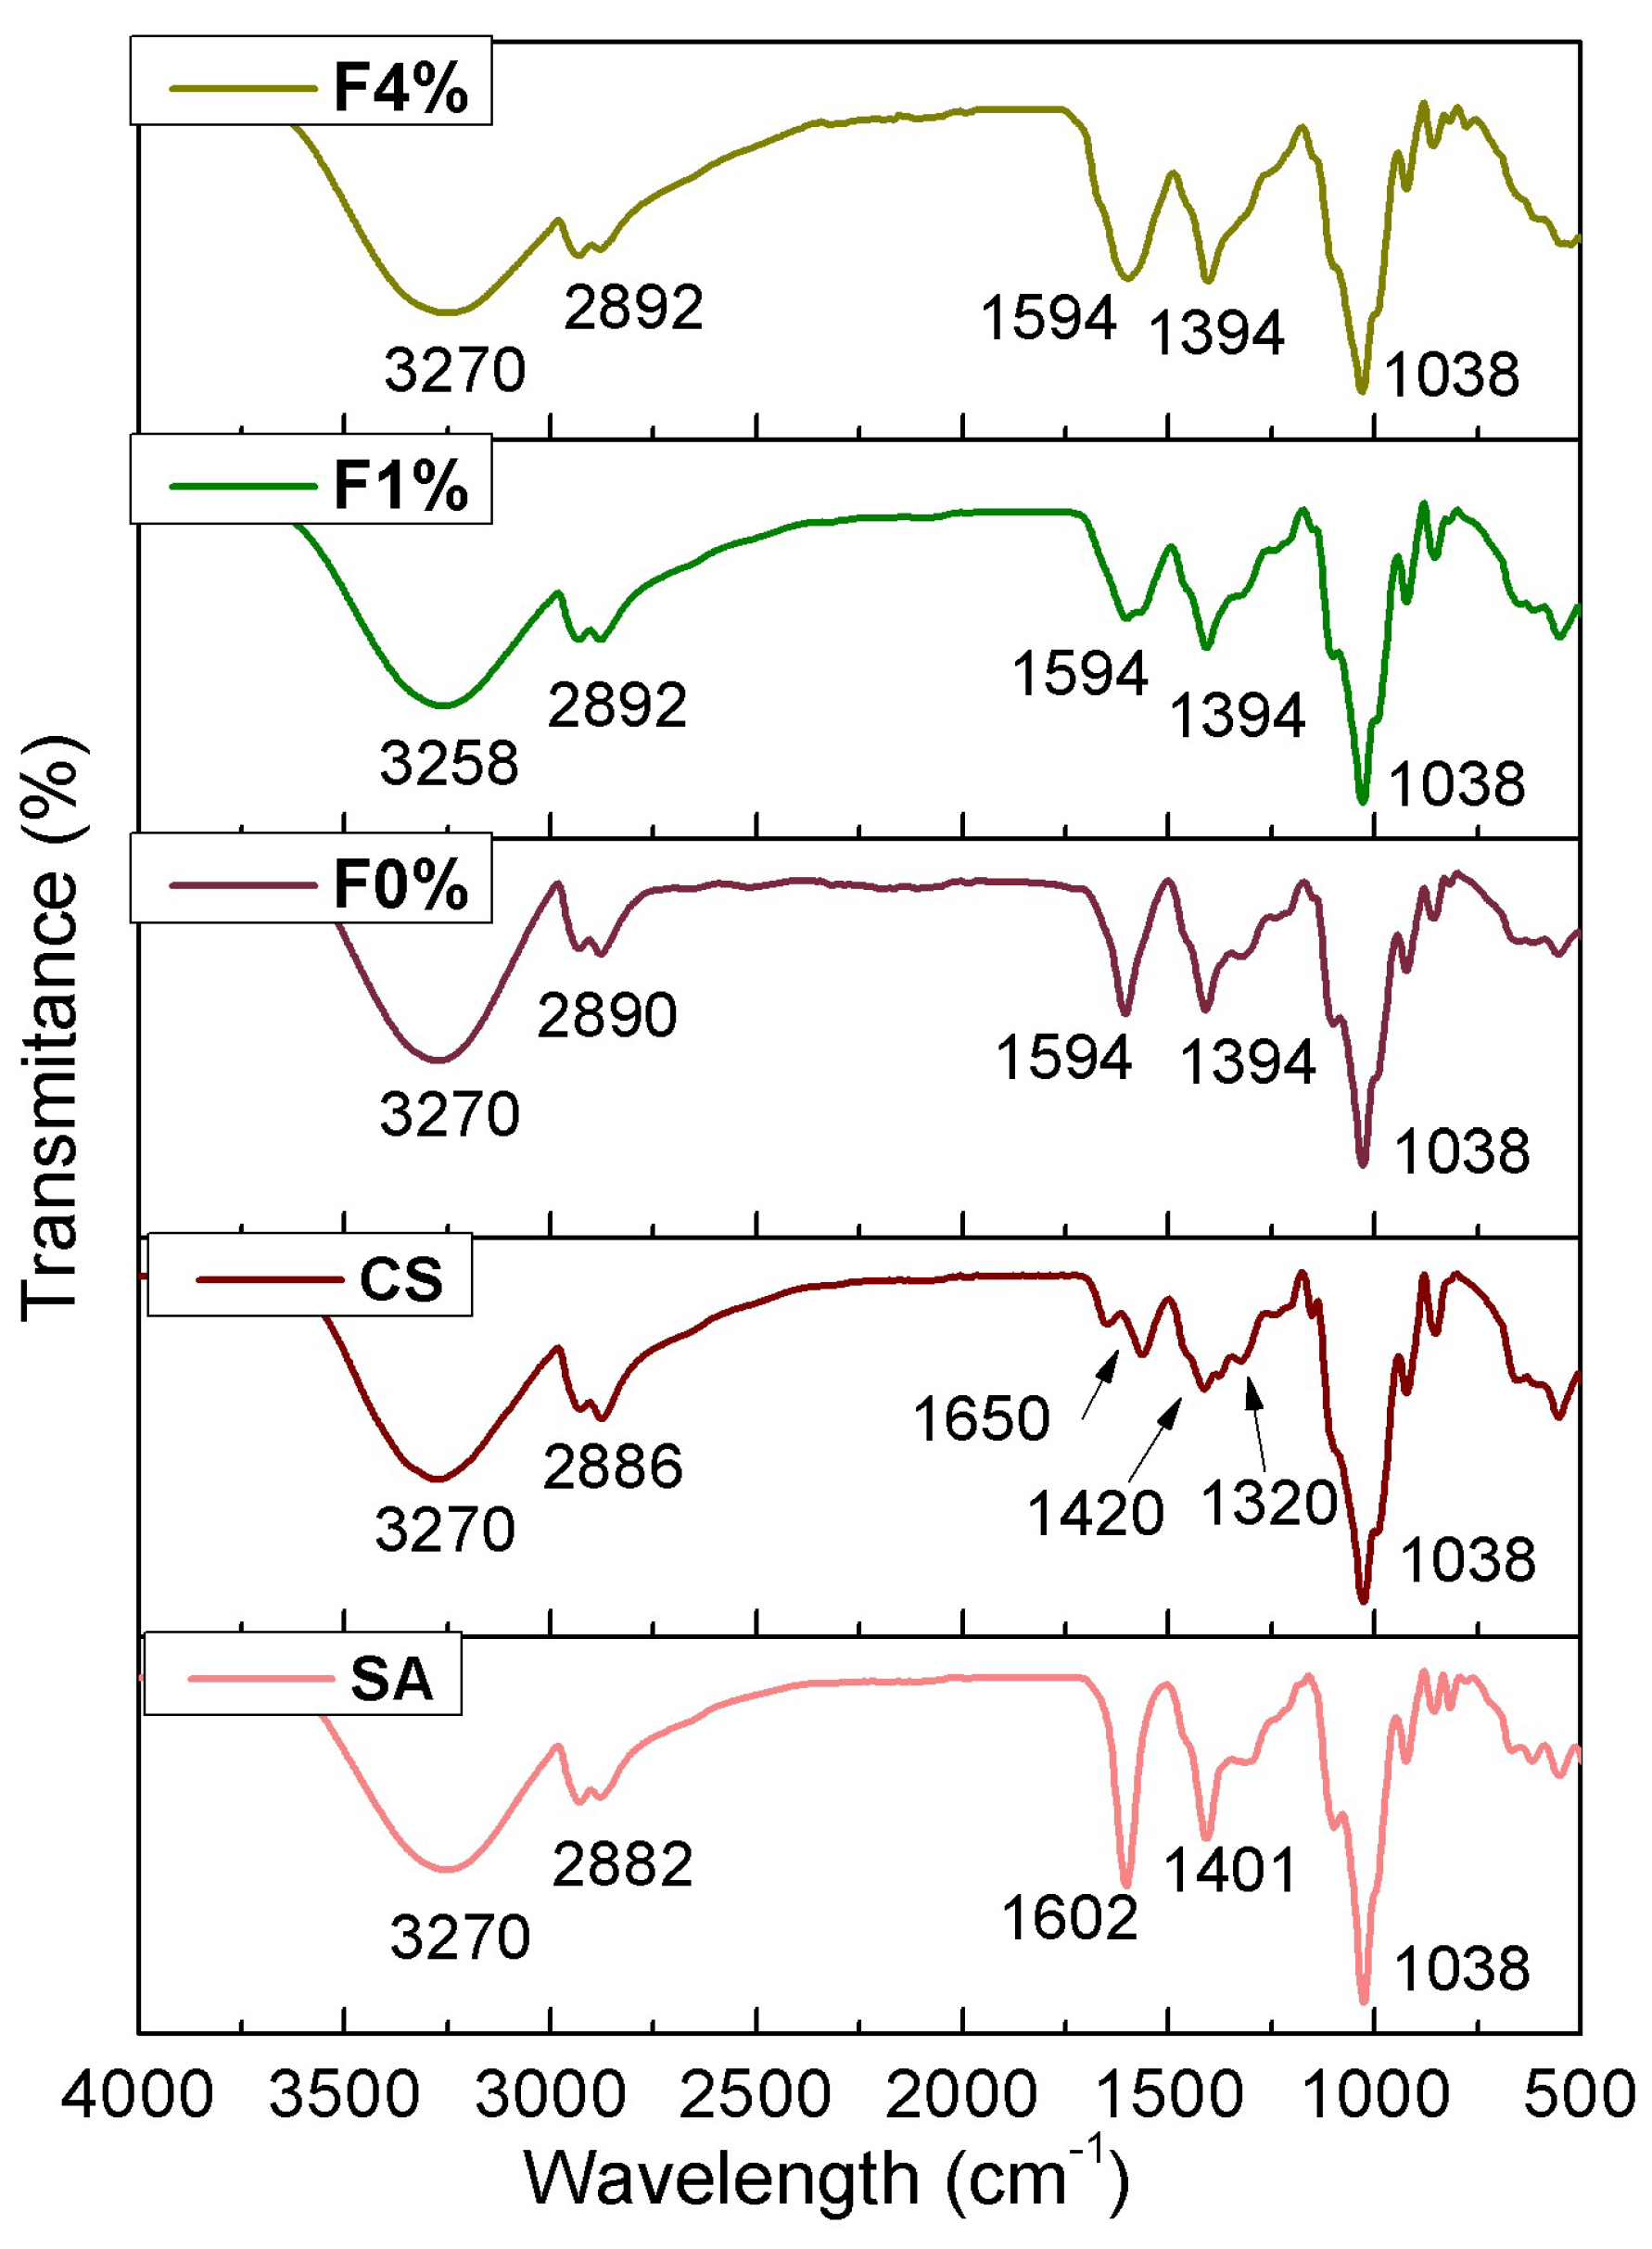
The FTIR analysis allowed for the identification of the characteristic functional groups of chitosan and alginate, and the components present in the extract. For this purpose, the F0%, F1%, and F4% films and monolayer alginate and chitosan films were analyzed to identify the characteristic bands and interactions promoted in the bilayer materials. Figure 5 shows a comparison of the spectra of the different formulations. The spectrum corresponding to the SA film showed that the band at 3270 cm−1 corresponds to the stretching vibration of the hydroxyl group. The band at 1602 cm−1 is typical of alginate and indicative of stretching vibrations of C=O. The band at 1401 cm−1 corresponds to the stretching of the carboxylate anion (COO-) of the carboxyl groups present in the alginate. An asymmetric stretching of the C-O-C bond at 1038 cm−1 corresponds to the glycosidic bond between the β-D-mannuronic and α-L-guluronic units [61]. Similar results have been reported by Kuczajowska-Zadrożnaa et al. [62] in the spectrum of alginate, which shows a band at 1602 cm−1, indicating the C-O vibration and an asymmetric adsorption band at 1402 cm−1 appearing in response to the vibration of the COO- groups, indicating the presence of the carboxyl groups of the alginate molecule.
Regarding the spectrum corresponding to the CS film, C=O stretching was presented at 1650 cm−1 corresponding to amide I, as well as stretching at 1420 cm−1 corresponding to the N-H bond of amide II and a stretch C-N at 1320 cm−1, which corresponds to amide III [63,64]. Li et al. [64] reported that the absorption bands at 1596 cm−1 and 1296 cm−1 usually correspond to the bending of N-H (amide II) and C-N (amide III), respectively. Their study also showed characteristic bands at 3270 cm−1, which correspond to the stretching of the single bond of hydrogen, -OH, and NH [65].
The spectrum of bilayer films showed bands characteristic of both polymers. The F0% film showed an increase in the extension of the band between 3200 and 3600 m−1 due to a greater number of hydroxyl groups corresponding to alginate, chitosan, and glycerol. Likewise, a bending of the hydroxyl groups was found at 1350–1200 cm−1 as in the previous formulations. The spectrum of the F1 and F4% films showed that the stretching of the C=C bond occurred at 1450–1600 cm−1, as well as a small vibration of the C=O bond around 1605–1725 cm−1. A vibration of the -OH and -CH groups was also observed in an aromatic ring at 1400 cm−1. It is considered that these signals correspond to polyphenolic compounds, such as quercetin, which is considered among the main phenolic compounds present in this plant extract. The band at 2877–2892 cm−1 in all formulations indicates the presence of asymmetric and symmetric -CH groups. The spectrum of the bilayer films shows a shift in the peak of CS from 1650 cm−1 to 1594 cm−1 and the band’s disappearance at 1420 cm−1 corresponding to the band of the amine group. This shows the interaction between alginate and chitosan, possibly through ionic interactions between the negatively charged carboxyl groups of alginates and the negatively charged amine groups of chitosan [66].

3.2.7. Thermogravimetric Analysis (TGA)

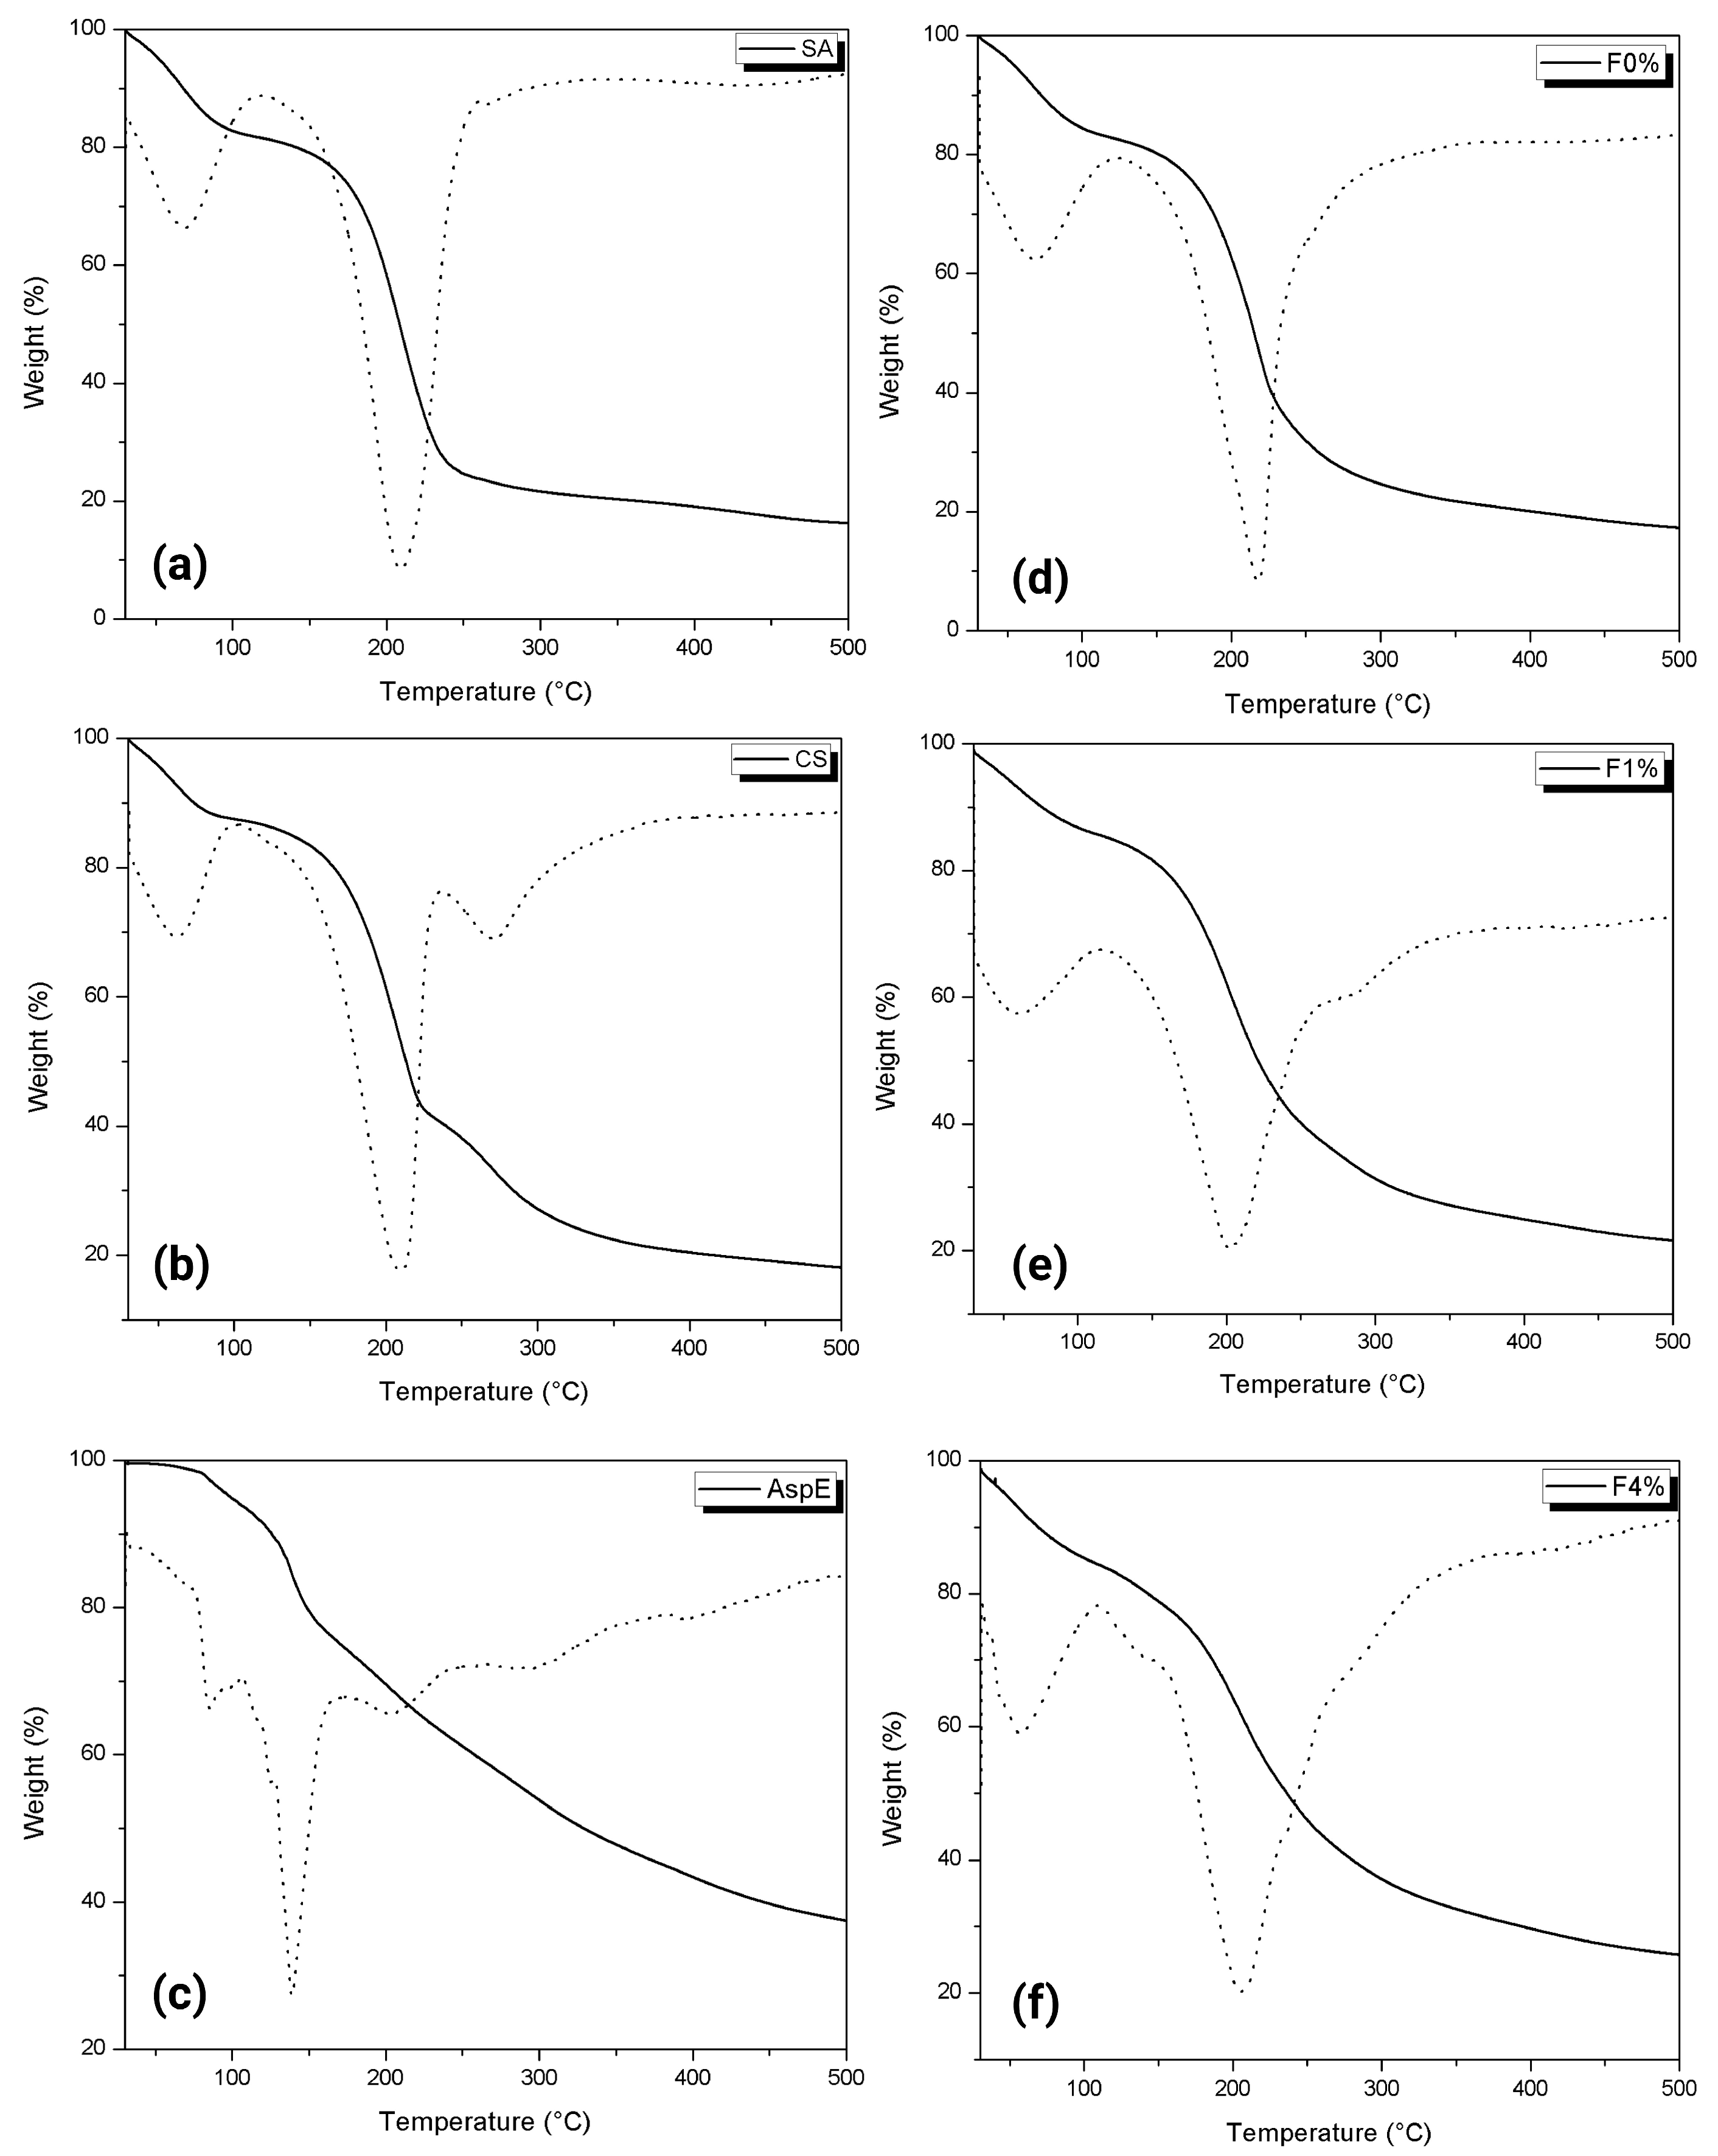
Thermal analysis is a physical measurement technique used to evaluate the strength and stability of the polymer as a function of temperature [67]. The TGA thermograms of the different formulations are shown in Figure 6. The films show characteristic signals of both biopolymers; an initial degradation was observed in all the samples except AspE at 70–100 °C, which was attributed to the evaporation of water and solvent [68]. In the SA film, a second drop occurs at 240–250 °C, which can be attributed to alginate degradation. The AspE thermogram shows a drop at 170 °C, which can be attributed to the degradation of the extract. This indicates that the compounds present in the extract have low thermal stability and degrade at lower temperatures than polymeric materials [69]. The CS, F0%, F1%, and F4% films show degradation at 180–238 °C, which can be attributed to the degradation of chitosan and glycerol. In all the treatments except AspE, a final peak was observed at 250–300 °C, which is related to the degradation and decomposition of the structure of both polymers [70]. Zhang et al. [12] reported a peak in chitosan–zein films between 250 and 330 °C, which they attributed to the decomposition of the polymer structure. This study highlights that the addition of a zein layer can increase the stability of the chitosan film. The thermogram of F4% shows decreases with less intensity, and we can also see how the drop is shifted toward 200 °C, which may indicate greater stability of the extract when incorporated in the edible films. Similar results have been presented by Zhang et al. [12], who reported a degradation of chitosan at 170–238 °C in chitosan-zein bilayer films.

3.2.8. Determination of Total Phenols and Total Flavonoids of Films

The results of the determination of total phenolics and flavonoids are shown in Table 3. For both determinations, a lower content was observed for the 1% formulation compared to the F4% film. Significant differences were found for total flavonoids in the 0% film compared to the F1% and F4% films and for total phenolics in the three formulations (p < 0.05). The F0% film (base material: alginate–chitosan) presented a value of 27.97 QE/g film for total flavonoids and 3.9 GAE/g film for total phenols; this may be due to the fact that alginate and chitosan contain functional groups such as amino and carboxyl that can react with the reagents used in these determinations.
A study by Nair et al. [14] reported a value of 35 mg QE/g for flavonoids in chitosan/alginate films with F1% pomegranate peel extract, which is similar to the value reported for films made with asparagus extract. For total phenolics, the results differ from those reported by Guo et al. [7], who presented a value of 10 mg GAE/g for the chitosan–alginate films incorporated with resveratrol 0.2%.

3.2.9. Determination of the Antioxidant Activity of Films

Table 4 shows the antioxidant activity values of the prepared bilayer films. According to the different antioxidant activity techniques used, the F4% film had higher antioxidant activity (p < 0.05), followed by the F1% film and control film. For ABTS, the F4% film presented a value of 48.96% of antiradical activity (ARA), while for the F1% film, it was 43.96%. The F0% films showed some antioxidant activity; however, previous studies have shown that SA and CS may have certain antioxidant activity due to the presence of hydroxyl groups in both compounds [71]. Kim and Thomas [71] reported the antioxidant activity of chitosan of different molecular weights, highlighting a strong antioxidant activity of approximately 85% in chitosan (1%) of 30 kDa using the DPPH method.
The antioxidant activity of chitosan can be explained by several mechanisms. One mechanism is free radical scavenging. Chitosan additionally presents the amino group that can react with free radicals to chelate them [71]. Park et al. [72] suggested that chitosan can eliminate free radicals due to the action of nitrogen in its C-2 position. It has also been reported that the mechanism of chitosan’s antioxidant activity is that free radicals can react with the hydrogen ion of ammonium ions to form a stable molecule [73]. Similar results were presented by Alshehri et al. [11], who reported an %ARA value of 43% in films of carboxymethyl cellulose, polyvinyl alcohol, and broccoli extract at 0.7%, obtained by ultrasound-assisted extraction. The film’s antioxidant activity was attributed to the broccoli extract present and the type of extraction used, which allows the bioactive compounds to be extracted more efficiently. According to Alshehri et al. [11], the plant extract’s bioactive compounds contain a high number of hydroxyl groups, which could act as hydrogen donors for ABTS and DPPH radicals.
The determination of the antioxidant activity by FRAP showed that bilayer films incorporated with AspE presented the highest values of antioxidant activity compared to the control film, demonstrating that the F4% and F1% films can reduce ferric ions, which can be attributed to the added AspE. This indicates that the bioactive compounds present in the asparagus residue extract have an antioxidant mechanism mainly by electron transfer, which is a HAT mechanism [33]. Mugnaini et al. [74] prepared alginate films added with 10% grape pomace extract and found a lower reducing capacity (59.1 mg TE/g film) compared to the films obtained in the present study. In addition to the differences due to the type of plant extract used, it may also be due to the fact that grape pomace was extracted by solid–liquid extraction, which is less efficient compared to non-conventional techniques such as ultrasound extraction.

3.2.10. Determination of Antibacterial Activity by Cell Viability Analysis

Resazurin Cell Viability Assay

The resazurin assay is a versatile colorimetric test that measures the metabolic activity of living cells [75]. It is based on the reduction of resazurin, a blue dye. When reduced to resorufin, it becomes pink. This reduction is caused by the metabolic activity of living cells. The amount of resorufin produced is directly proportional to the metabolic activity of the cells and can be quantified by measuring the absorbance of the solution [76]. Staphylococcus aureus (pathogenic) and Pediococcus acidilactici (probiotic) bacteria were used to evaluate the effect of pathogenic bacteria, which causes food poisoning, and probiotic bacteria, which generate benefits for humans. This is because when developing edible active films, it is important to evaluate the effect on beneficial bacteria for humans, which has been scarcely reported for this type of development.
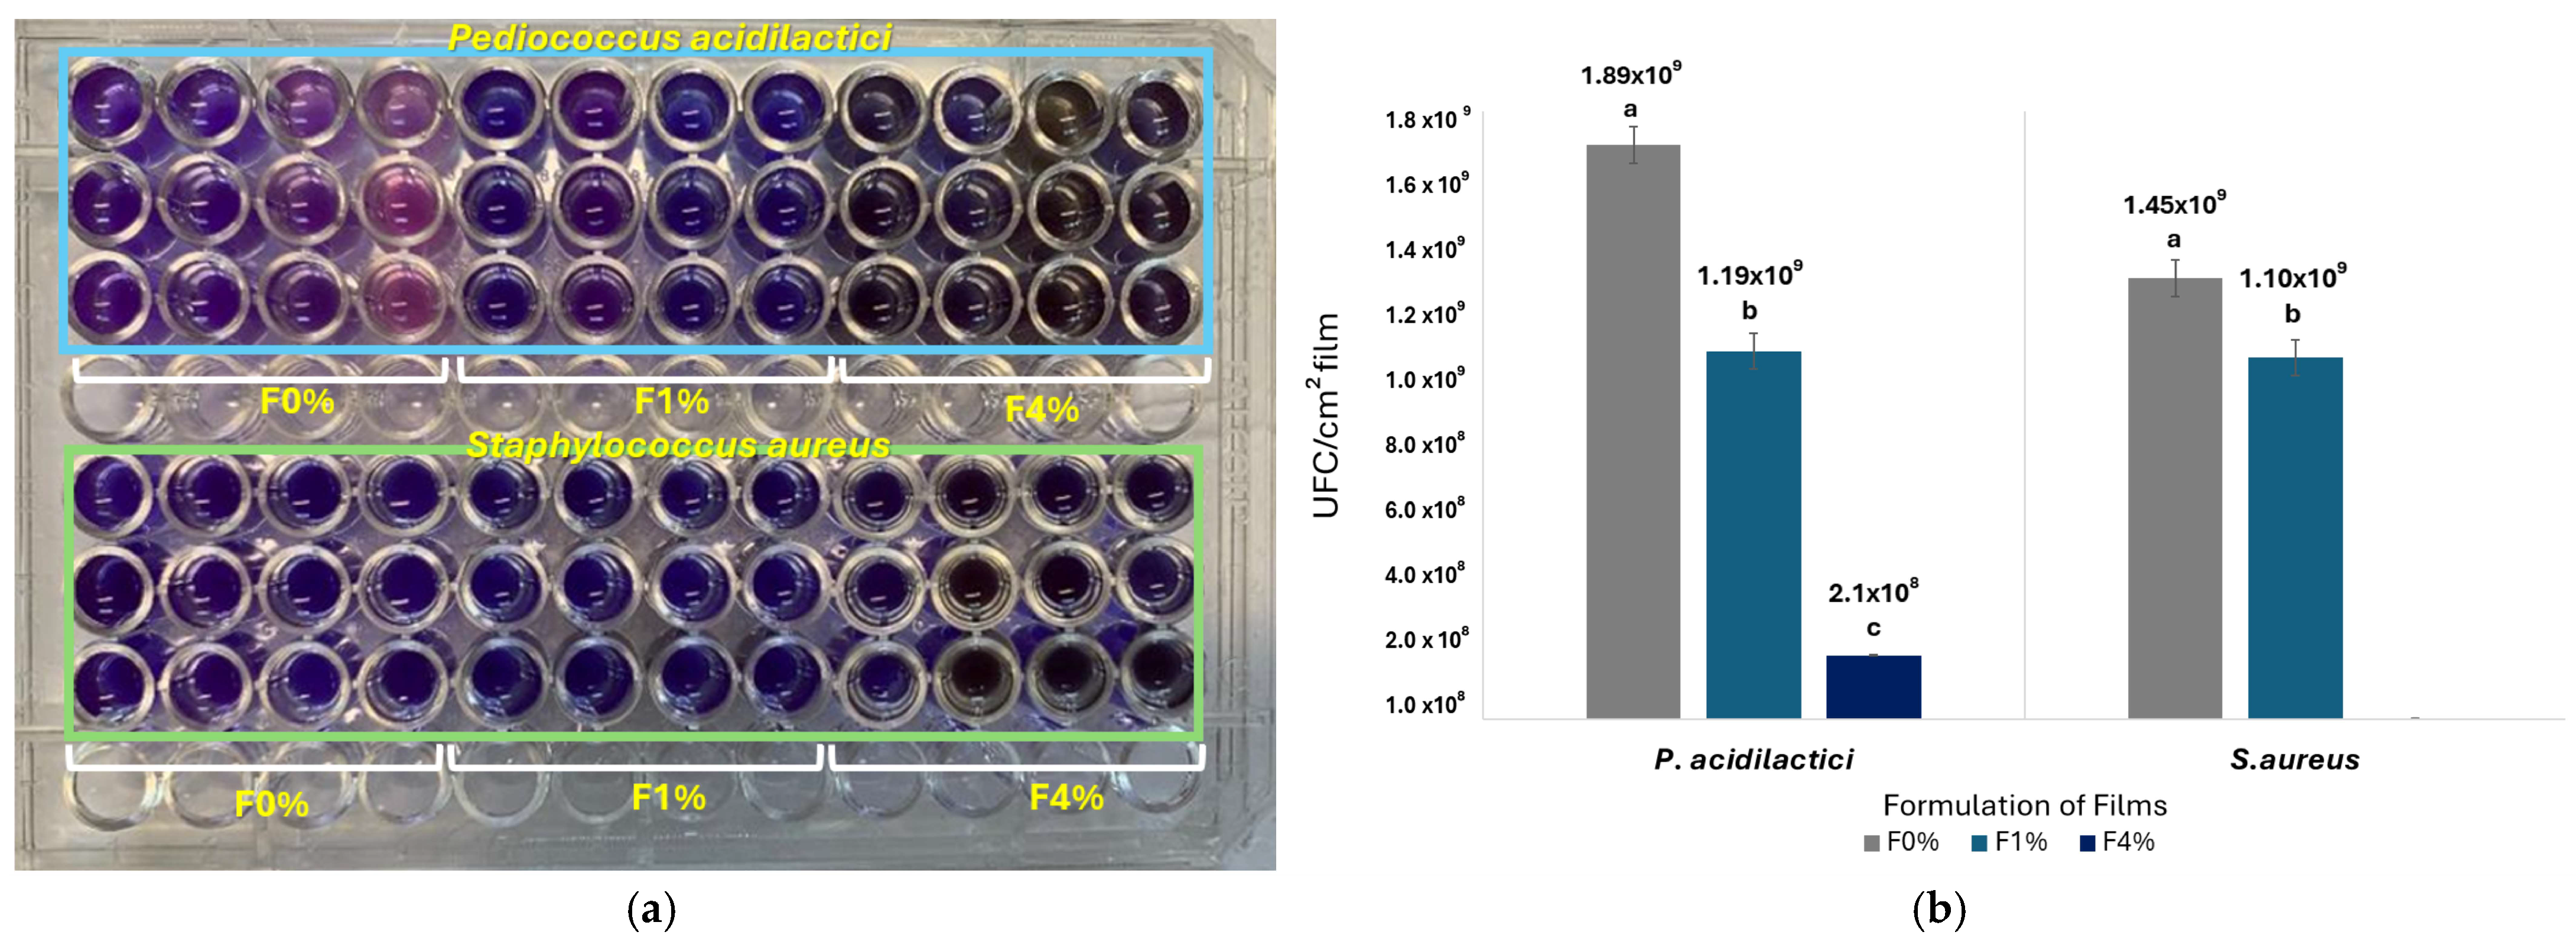
The results of the resazurin test (Figure 7a) showed a decrease in the metabolic activity of the bacteria with an increase in the concentration of the extract in the film. Additionally, a greater inhibition of metabolic activity was observed in S. aureus compared to P. acidilactici bacteria. This indicates that in addition to the antibacterial activity provided by the chitosan of the bilayer film, the bioactive compounds present in the extract allow this property to be increased in the films added with AspE, observing a greater antibacterial effect on pathogenic bacteria compared to probiotic bacteria. This behavior agrees with the bacterial count (CFU/cm2 film) obtained for both bacteria (Figure 7b) and control treatment (p < 0.05). For both bacteria, significantly (p < 0.05) higher CFU content was observed in the F0% film compared to the F1% and F4% films. For P. acidilactici, the CFU content in the F0% film was 1.89 × 10⁹ CFU/cm2 film, while that for the F1% film was 1.19 × 10⁹ CFU/cm2 film, and the smallest value of bacterial count (2.1 × 10⁸ CFU/cm2 film) was observed in bacteria treated with F4% (p < 0.05). For S. aureus, the bacteria treated with the F0% film presented a bacterial count value of 1.45 × 10⁹ CFU/cm2, while the bacterial count of bacteria treated with F1% and F4% films was significantly lower (p < 0.05), with values of 1.10 × 10⁹ for the F1% film and 0 CFU/cm2 film for the F4% film. These results indicate greater bacterial inhibition for S. aureus compared to P. acidilactici, which is consistent with the resazurin test.

Microscopic Analysis

  • Morphometric analysis
The measurements of the bacteria cells exposed to the different formulations of the material were analyzed using the Image-Pro Plus program. Table 5 shows how the bilayer films affect bacterial cell morphology. A decrease in the size of Staphylococcus aureus was observed when exposed to the F1% and F4% film, which could indicate morphological damage caused by the effect of the active edible film. However, for P. acidilactici, the size increased only in the higher concentration; this could be because the film incorporated with the active extract did not induce significant damage. The edible film could act as a substrate for P. acidilactici; however, in the resazurin viability test, we found that there was a decrease in bacterial metabolism. P. acidilactici is a non-pathogenic bacteria; therefore, in certain foods, it is useful for food preservation and is used as a probiotic [77].
  • Cell Membrane Integrity
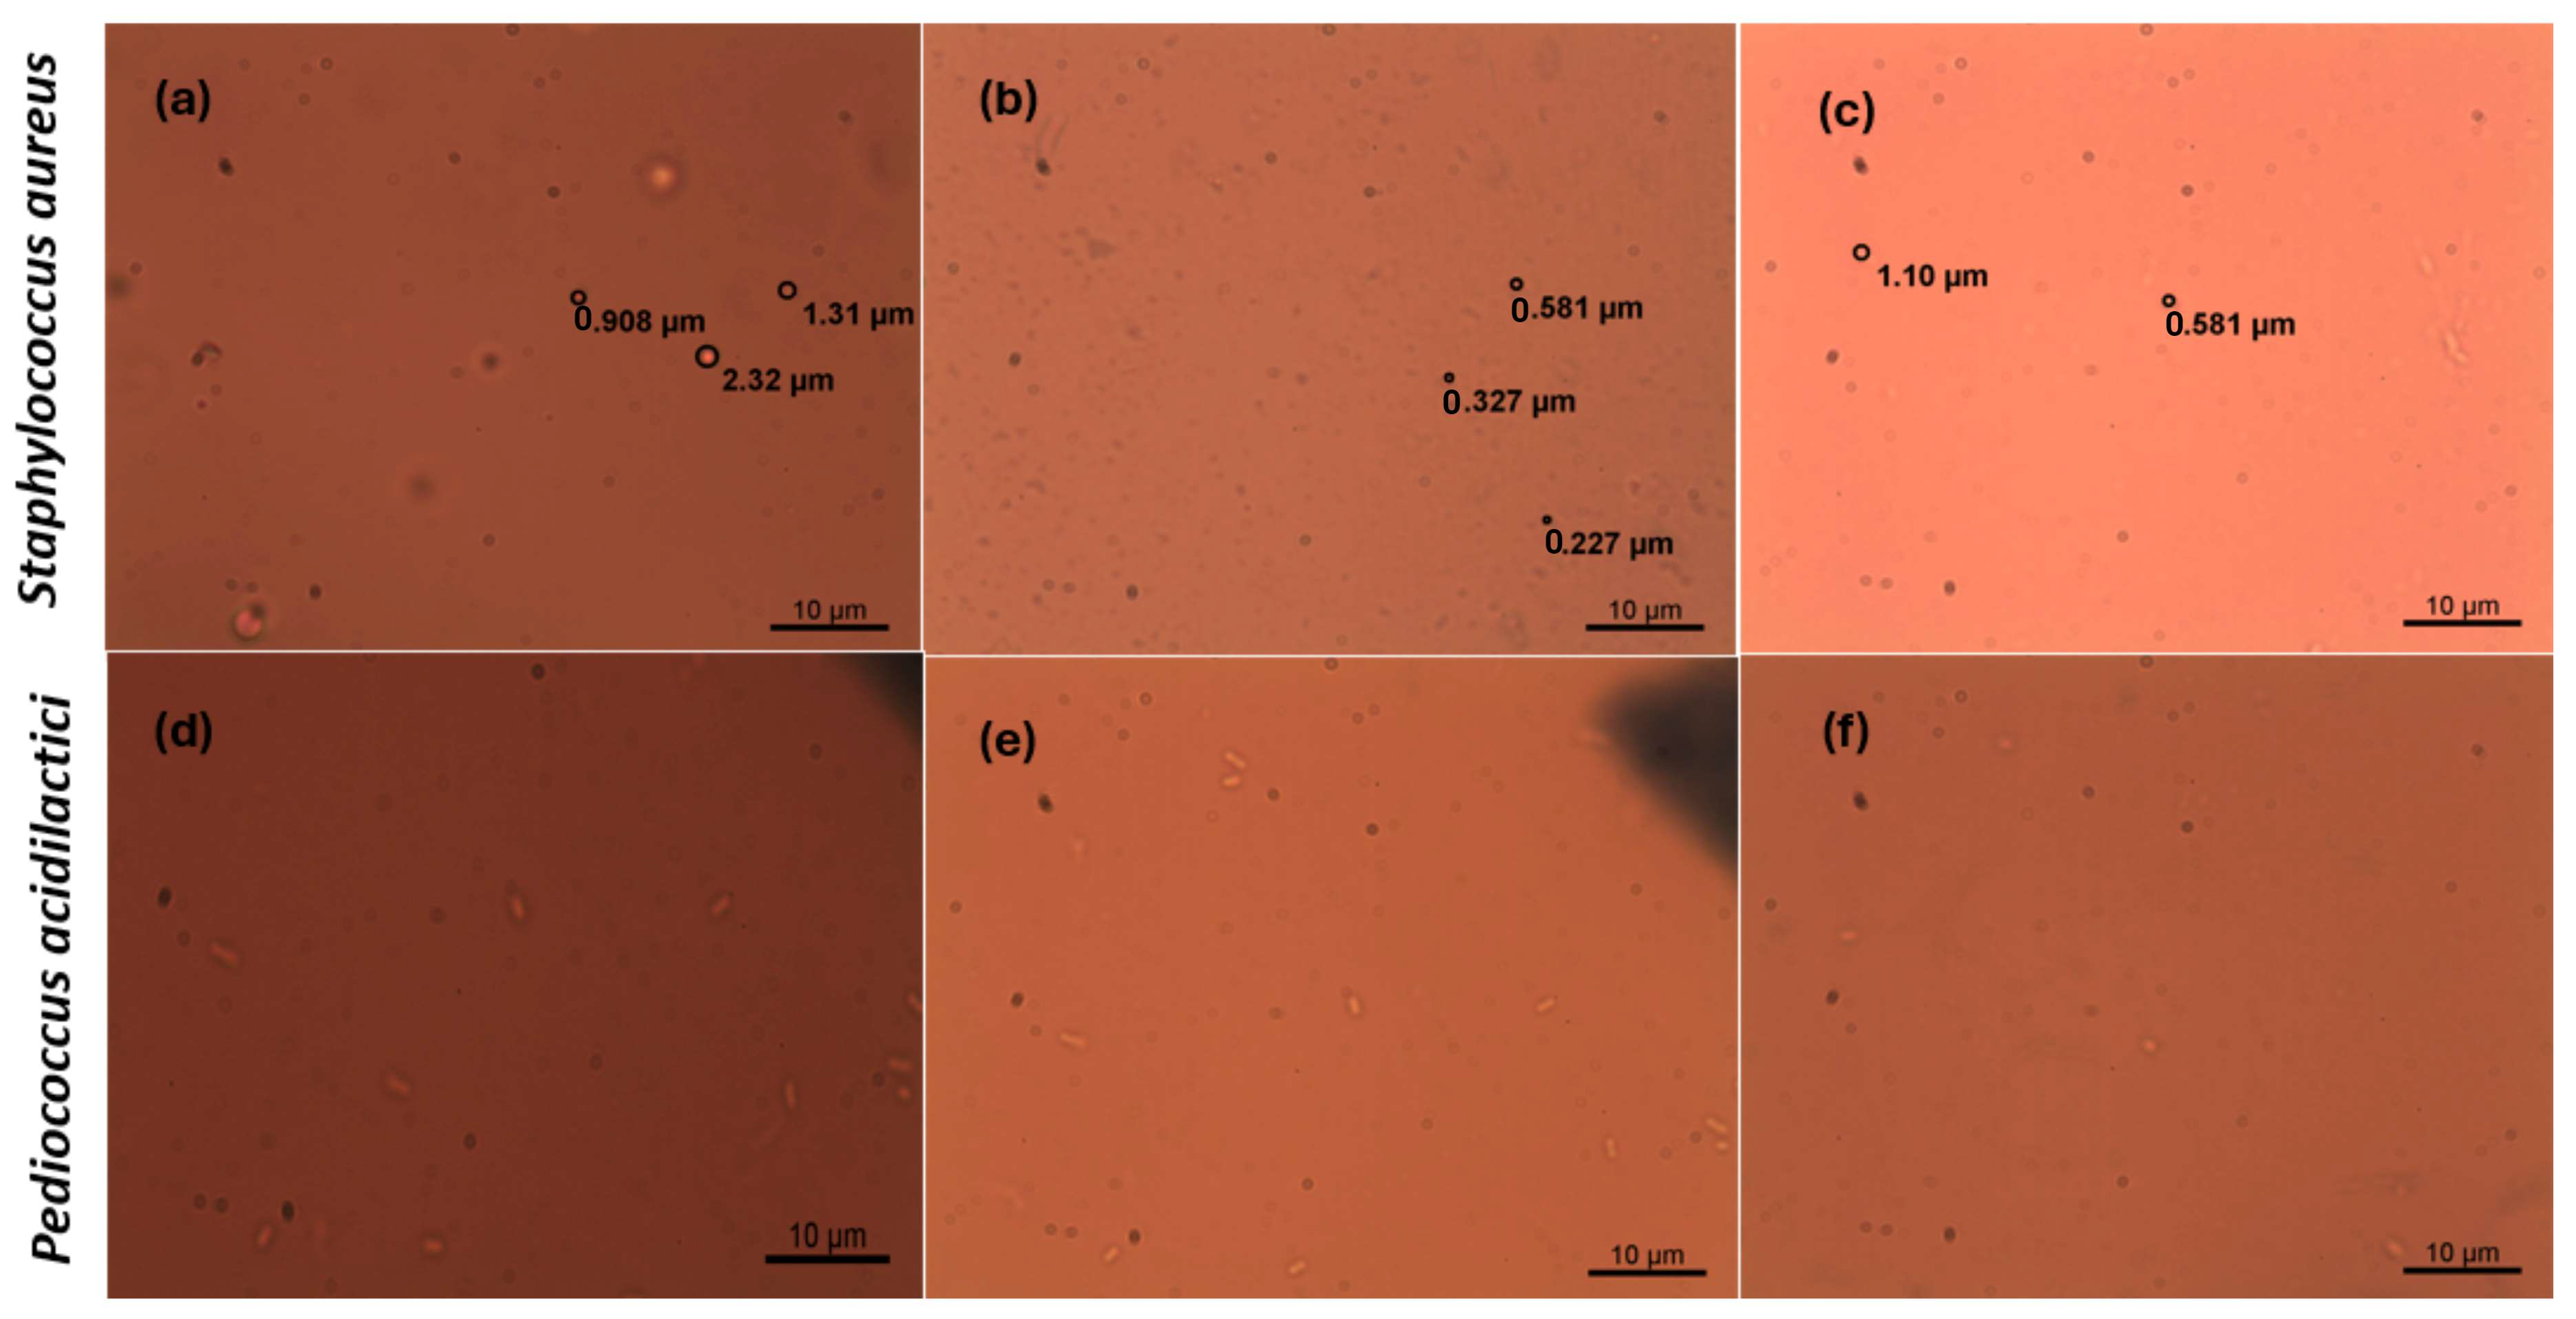
Trypan blue is an exclusion dye that can be used to distinguish viable cells from morphologically damaged cells. The dye has an affinity for DNA, so viable cells do not absorb the dye, while non-viable or morphologically damaged cells are stained blue [78]. Figure 8 shows the images taken after trypan blue staining. Cell damage was not evident with the trypan blue staining of both S. aureus and P. acidilactici, as no cells were stained with the dye. The results are similar to the viable cells reported by Fridman et al. [78], where it was observed that healthy cells did not stain blue. The trypan blue remained on the outside without penetrating the cells.
The staining assay with propidium iodide allows the possible cytotoxic effects of the extracts on microorganisms to be examined. It allows us to mark living and dead cells, through the permeability of cell membranes [79]. When the bioactive compounds present in the edible film exert an antibacterial activity or cytotoxic effect on bacterial cells, the integrity of the cell membranes is compromised; in this way, the dye enters the cell and binds with nucleic acids, resulting in a red fluorescent color associated with cell death [80].
Fluorescence microscopy analyses were performed on S. aureus and P. acidilactici, which showed high sensitivity to the films incorporated with the asparagus waste extracts. Figure 9 shows the effect of the AspE-incorporated film formulations on the cell membrane integrity of S. aureus and P. acidilactici. Cell membrane damage was evident in cells stained with propidium iodide and mainly in S. aureus cells. It can be observed that the bacterial cells treated with the F4% film showed a higher intensity of light emitted by propidium iodide compared to the other treatments, indicating that more bacterial cells lose their cellular integrity at higher concentrations. The luminescent intensity emitted by propidium iodide indicates that the damage to membrane cells is directly proportional to the increase in AspE in the films.
Fluorescence signals may reflect the generation of ROS [80]. ROS generation as a cytotoxic mechanism can alter the plasma membrane. Different studies have proposed a mechanism for inducing reactive oxygen species (ROS) associated with oxidative stress; this antimicrobial mechanism, attributed to the presence of bioactive compounds in AspE in combination with chitosan, can be very effective in this type of development.

4. Conclusions

An ethanolic extract of asparagus was obtained using the ultrasound method and was incorporated into bilayer films based on alginate and chitosan. The films with 1% and 4% of AspE did not present differences in their content of phenolic compounds and flavonoids; however, the F4% film presented a greater antioxidant activity when compared to the rest of the formulations. Likewise, the F4% film showed higher antibacterial activity against S. aureus and P. acidilactici, highlighting that it maintains the viability of P. acidilactici, a probiotic bacterium with benefits for health and the food industry. On the other hand, the F1% film showed better optical, mechanical, structural, and thermal properties, showing a less intense color, greater flexibility, and homogeneity. The results obtained suggest that it is possible to modify the amount of AspE added to the polymeric matrix to improve the interaction between the components and obtain films with better properties. This study shows that adding ethanolic extracts of asparagus rich in phenolic compounds to films has a high potential for application in the food industry, offering a sustainable alternative for using asparagus waste through the development of edible films with active properties.

Author Contributions

Conceptualization, A.Z.G.-V., M.P.-J. and L.V.A.-P.; methodology, A.Z.G.-V., M.P.-J., A.L.M.-R. and L.V.A.-P.; formal analysis, L.V.A.-P., A.L.M.-R. and J.A.T.-H.; investigation, L.V.A.-P., A.L.M.-R., M.J.M.-V., M.P.-J. and A.Z.G.-V.; writing—original draft preparation L.V.A.-P. and A.Z.G.-V.; writing—review and editing, L.V.A.-P., A.Z.G.-V., M.P.-J., C.L.D.T.-S. and J.F.A.-Z.; supervision, A.Z.G.-V., M.P.-J. and C.L.D.T.-S.; project administration, A.Z.G.-V.; funding acquisition, A.Z.G.-V. All authors have read and agreed to the published version of the manuscript.

Funding

This work was partially supported by Facultad Interdisciplinaria de Ciencias Biológicas y de Salud de la Universidad de Sonora [Project FICBS-USO313009104].

Institutional Review Board Statement

Not applicable.

Informed Consent Statement

Not applicable.

Data Availability Statement

Data are contained within the article.

Acknowledgments

The authors would like to acknowledge Silvia Elena Burruel Ibarra for her technical assistance in SEM analysis and Elba Castañeda Nevarez for providing the vegetable material. We thank César Benjamín Otero León for his technical support in the Departmento de Ciencias Químico-Biológicas’s Food Research Laboratory.

Conflicts of Interest

The authors declare no conflicts of interest.

References

  1. Zhang, H.; Birch, J.; Xie, C.; Yang, H.; Dias, G.; Kong, L.; Bekhit, A.D. Optimization of extraction parameters of antioxidant activity of extracts from New Zealand and Chinese Asparagus officinalis L. root cultivars. Ind. Crops Prod. 2018, 119, 191–200. [Google Scholar] [CrossRef]
  2. Santiago, B.; Feijoo, G.; Moreira, M.T.; González-García, S. Identifying the sustainability route of asparagus co-product extraction: From waste to bioactive compounds. Food Bioprod. Process. 2021, 129, 176–189. [Google Scholar] [CrossRef]
  3. Chitrakar, B.; Zhang, M.; Adhikari, B. Asparagus (Asparagus officinalis): Processing effect on nutritional and phyto-chemical composition of spear and hard-stem byproducts. Trends Food Sci. Technol. 2019, 93, 1–11. [Google Scholar] [CrossRef]
  4. Fuentes-Alventosa, J.M. Caracterización de Componentes Bioactivos del Espárrago Verde: Obtención de Ingredientes Funcionales a Partir de Los Subproductos Generados Durante su Transformación Industrial. Ph.D. Thesis, Universidad de Córdoba, Córdoba, Spain, 2009. [Google Scholar]
  5. García-Ruiz, A.; Moreno-Arribas, M.V.; Martín-Álvarez, P.J.; Bartolomé, B. Comparative study of the inhibitory effects of wine polyphenols on the growth of enological lactic acid bacteria. Int. J. Food Microbiol. 2011, 145, 426–431. [Google Scholar] [CrossRef]
  6. Barbosa-Pereira, L.; Bilbao, A.; Vilches, P.; Angulo, I.; Fité, J.L.B.; Paseiro-Losada, P.; Cruz, J.M. Brewery waste as a potential source of phenolic compounds: Optimisation of the extraction process and evaluation of antioxidant and antimicrobial activities. Food Chem. 2014, 145, 191–197. [Google Scholar] [CrossRef] [PubMed]
  7. Guo, H.; Jiang, K.; Ou, J.; Huang, C.; Liu, F.; Zheng, J.; Ou, S. Preparation of acrolein/resveratrol-grafted chitosan-sodium alginate bilayer films and their antibacterial and antioxidant activities. Food Hydrocoll. 2024, 149, 109601. [Google Scholar] [CrossRef]
  8. Oli, S.; Kumar Chauhan, H.; Kumar Bisht, A.; Agnihotri, S.; Dobhal, P. Bioactive compound, polyphenol content, and antioxidant activity of Asparagus racemosus Linn. root extract. Nat. Prod. Res. 2023, 1, 1–6. [Google Scholar] [CrossRef]
  9. Yan, J.; Li, M.; Wang, H.; Lian, X.; Fan, Y.; Xie, Z.; Niu, B.; Li, W. Preparation and property studies of chitosan-PVA biodegradable antibacterial multilayer films doped with Cu2O and nano-chitosan composites. Food Control 2021, 126, 108049. [Google Scholar] [CrossRef]
  10. Dou, L.; Li, B.; Zhang, K.; Chu, X.; Hou, H. Physical properties and antioxidant activity of gelatin-sodium alginate edible films with tea polyphenols. Int. J. Biol. Macromol. 2018, 118, 1377–1383. [Google Scholar] [CrossRef]
  11. Alshehri, A.A.; Hamed, Y.S.; Kamel, R.M.; Shawir, S.M.S.; Sakr, H.; Ali, M.; Ammar, A.; Saleh, M.N.; El Fadly, E.; Salama, M.A.; et al. Enhanced physical properties, antioxidant and antibacterial activity of bio-composite films composed from carboxymethyl cellulose and polyvinyl alcohol incorporated with broccoli sprout seed extract for butter packaging. Int. J. Biol. Macromol. 2024, 255, 128346. [Google Scholar] [CrossRef]
  12. Zhang, L.; Li, K.; Yu, D.; Regenstein, J.M.; Dong, J.; Chen, W.; Xia, W. Chitosan/zein bilayer films with one-way water barrier characteristic: Physical, structural and thermal properties. Int. J. Biol. Macromol. 2022, 200, 378–387. [Google Scholar] [CrossRef] [PubMed]
  13. Perera, K.Y.; Sharma, S.; Duffy, B.; Pathania, S.; Jaiswal, A.K.; Jaiswal, S. An active biodegradable layer-by-layer film based on chitosan-alginate-TiO2 for the enhanced shelf life of tomatoes. Food Packag. Shelf Life 2022, 34, 100971. [Google Scholar] [CrossRef]
  14. Nair, M.S.; Saxena, A.; Kaur, C. Effect of chitosan and alginate-based coatings enriched with pomegranate peel extract to extend the postharvest quality of guava (Psidium guajava L.). Food Chem. 2018, 240, 245–252. [Google Scholar] [CrossRef]
  15. Kim, S. Competitive Biological Activities of Chitosan and Its Derivatives: Antimicrobial, Antioxidant, Anticancer, and Anti-Inflammatory Activities. Int. J. Polym. Sci. 2018, 2018, 1708172. [Google Scholar] [CrossRef]
  16. Richardson, J.J.; Cui, J.; Björnmalm, M.; Braunger, J.A.; Ejima, H.; Caruso, F. Innovation in Layer-by-Layer Assembly. Chem. Rev. 2016, 116, 14828–14867. [Google Scholar] [CrossRef]
  17. Gates, S.J.; Shukla, A. Layer-by-layer assembly of readily detachable chitosan and poly(acrylic acid) polyelectrolyte multilayer films. J. Polym. Sci. B Polym. Phys. 2016, 55, 127–131. [Google Scholar] [CrossRef]
  18. Diop, C.I.K.; Beltran, S.; Sanz, M.T.; Garcia-Tojal, J.; Trigo-lopez, M. Designing bilayered composite films by direct agar/chitosan and citric acid-crosslinked PVA/agar layer-by-layer casting for packaging applications. Food Hydrocoll. 2023, 144, 108987. [Google Scholar] [CrossRef]
  19. Fan, R.; Yuan, F.; Wang, N.; Gao, Y.; Xiang, H.Y. Extraction and analysis of antioxidant compounds from the residues of Asparagus officinalis L. J. Food Sci. Technol. 2015, 52, 2690–2700. [Google Scholar] [CrossRef]
  20. Maksimović, Z.; Malencic, Ð.; Kovacevi, N. Polyphenol contents and antioxidant activity of Maydis stigma extracts. Bioresour. Technol. 2005, 96, 873–877. [Google Scholar] [CrossRef]
  21. Chen, C.; Mokhtar, R.A.M.; Sani, M.S.A.; Noor, N.Q.I.M. The Effect of Maturity and Extraction Solvents on Bioactive Compounds and Antioxidant Activity of Mulberry (Morus alba) Fruits and Leaves. Molecules 2022, 27, 2406. [Google Scholar] [CrossRef]
  22. Concha-Meyer, A.; Schimtz, R.; Brito, C.; Fuentes, R. Lactic acid bacteria in an alginate film inhibit Listeria monocytogenes growth on smoked salmon. Food Control 2011, 22, 485–489. [Google Scholar] [CrossRef]
  23. Mora-Sánchez, M.; Hernández-Carranza, P.; Ramírez-López, C.; Ruiz-López, I.I.; Ochoa-Velasco, C.E. Developing active chitosan-based edible film for extending the shelf life of guacamole. Front. Sustain. Food Syst. 2023, 7, 1254337. [Google Scholar] [CrossRef]
  24. Wessling, C.; Nielsen, T.; Leufvén, A. The influence of α-tocopherol concentration on the stability of linoleic acid and the properties of low-density polyethylene. Packag. Technol. Sci. 2000, 13, 19–28. [Google Scholar] [CrossRef]
  25. ASTM D1708-96; Standard Test Method for Tensile Properties of Plastic by Use of Microtensile Specimens. In Annual Book of ASTM Standards. American Society for Testing and Material: Philadelphia, PA, USA, 1992.
  26. Prior, R.L.; Wu, L.; Schaich, K. Standardized methods for the determination of antioxidant capacity and phenolics in foods and dietary supplements. J. Agric. Food Chem. 2005, 53, 4290–4302. [Google Scholar] [CrossRef]
  27. Arrua, D.; Strumia, M.C.; Nazareno, M.A. Immobilization of caffeic acid on a polypropylene film: Synthesis and antioxidant properties. J. Agric. Food Chem. 2010, 58, 9228–9234. [Google Scholar] [CrossRef]
  28. Marinova, D.; Ribarova, F.; Atanassova, M. Total phenolics and flavonoids in Bulgarian fruits and vegetables. J. Univ. Chem. Tech. Metal. 2005, 40, 255–260. [Google Scholar]
  29. Benzie, I.F.; Strain, J.J. Ferric reducing/antioxidant power assay: Direct measure of total antioxidant activity of biological fluids and modified version for simultaneous measurement of total antioxidant power and ascorbic acid concentration. Methods Enzymol. 1999, 299, S0076–S6879. [Google Scholar]
  30. O’Brien, J.; Wilson, I.; Orton, T.; Pognan, F. Investigation of the Alamar Blue (resazurin) fluorescent dye for the assessment of mammalian cell cytotoxicity. Eur. J. Biochem. 2000, 267, 5421–5426. [Google Scholar] [CrossRef]
  31. Martínez-Camacho, A.P.; Cortez-Rocha, M.O.; Ezquerra-Brauer, J.M.; Graciano-Verdugo, A.Z.; RodriguezFélix, F.; Castillo-Ortega, M.M. Chitosan composite films: Thermal, structural, mechanical and antifungal properties. Carbohydr. Polym. 2010, 82, 305–315. [Google Scholar] [CrossRef]
  32. Redondo-Cuenca, A.; García-Alonso, A.; Rodríguez-Arcos, R.; Castro, I.; Alba, C.; Rodríguez, J.M.; Goñi, I. Nutritional composition of green asparagus (Asparagus officinalis L.), edible part and by-products, and assessment of their effect on the growth of human gut-associated bacteria. Food Res. Int. 2023, 163, 112284. [Google Scholar] [CrossRef]
  33. Sun, T.; Powers, J.P.; Tang, J. Evaluation of the antioxidant activity of asparagus, broccoli and their juices. Food Chem. 2007, 105, 101–106. [Google Scholar] [CrossRef]
  34. JIS Z 1707; General Rules of Plastic Films for Food Packaging. Japanese Standards Association: Minato-ku, Tokyo, Japan, 2019.
  35. Ruan, C.; Zhang, Y.; Wang, J.; Sun, Y.; Gao, X.; Xiong, G.; Liang, J. Preparation and antioxidant activity of sodium alginate and carboxymethyl cellulose edible films with epigallocatechin gallate. Int. J. Biol. Macromol. 2019, 134, 961–967. [Google Scholar] [CrossRef]
  36. Alfonso-Arce, C. Caracterización de Películas Comestibles de Quitosano y la Afectación de las Propiedades por Aplicación de Aceites Esenciales. Master’s Thesis, Universidad Nacional de Colombia, Bogotá, Colombia, 2011. [Google Scholar]
  37. Shan, P.; Wang, K.; Yu, F.; Yi, L.; Sun, L.; Li, H. Gelatin/sodium alginate multilayer composite film cross-linked with green tea extract for active food packaging application. Colloids Surf. A Physicochem. Eng. Asp. 2023, 662, 131013. [Google Scholar] [CrossRef]
  38. Zamudio-Flores, P.B.; Ochoa-Reyes, E.; Ornelas-Paz, J.d.J.; Tirado-Gallegos, J.M.; Bello-Pérez, L.A.; Rubio-Ríos, A.; Cárdenas-Felix, R.G. Caracterización fisicoquímica, mecánica y estructural de películas de almidones oxidados de avena y plátano adicionadas con betalaínas. Agrociencia 2015, 49, 483–498. [Google Scholar]
  39. López-Palestina, C.U.; Aguirre-Mancilla, C.L.; Ramirez-Pimentel, J.G.; Raya-Pérez, J.C.; Jímenez-Alvarado, R.; Hernández-Fuentes, A.D. Evaluación del color y propiedades antioxidantes de películas comestibles de gelatina incorporadas con aceite rico en licopeno y β-caroteno. Investig. Y Desarro. En. Cienc. Y Tecnol. De. Aliment. 2018, 3, 411–416. [Google Scholar]
  40. Corsello, F.A. Preparación y Caracterización de Películas de Quitosano Modificadas con Nanocristales de Celulosa. Master’s Thesis, Universidad Nacional de la Plata, Buenos aires, Argentina, 2015. [Google Scholar]
  41. Guzman-Puyol, S.; Benítez, J.J.; Heredia-Guerrero, J.A. Transparency of polymeric food packaging materials. Food Res. Int. 2022, 161, 111792. [Google Scholar] [CrossRef]
  42. Yao, Y.; Tao, J.; Zou, J.; Zhang, B.; Li, T.; Dai, J.; Zhu, M.; Wang, S.; Fu, K.K.; Henderson, D.; et al. Light management in plastic-paper hybrid substrate towards high-performance optoelectronics. Energy Environ. Sci. 2016, 9, 2278–2285. [Google Scholar] [CrossRef]
  43. Roy, S.; Ramakrishnan, R.; Goksen, G.; Singh, S.; Łopusiewicz, Ł. Recent progress on UV-light barrier food packaging films—A systematic review. Innov. Food Sci. Emerg. Technol. 2024, 91, 103550. [Google Scholar] [CrossRef]
  44. Hernández-Gómez, E.; Madera-Santana, T.J.; Quintana-Owen, P.; Ortiz-Vázquez, E.; Ramón Sierra, J.M.; Vargas y Vargas, M.L. Propiedades fisicoquímicas y bioactivas de películas comestibles basadas en alginato y miel Melipona. Biotecnica 2024, 1, 16–24. [Google Scholar]
  45. Bierhalz, A.C.K.; Westin, C.B.; Moraes, A.M. Comparison of the properties of membranes produced with alginate and chitosan from mushroom and from shrimp. Int. J. Biol. Macromol. 2016, 91, 496–504. [Google Scholar] [CrossRef]
  46. McHugh, T.H.; Aujard, J.F.; Krochta, J.M. Plasticized Whey Protein Edible Films: Water Vapor Permeability Properties. J. Food Sci. 1994, 59, 416–419. [Google Scholar] [CrossRef]
  47. Agostini de Moraes, M.; Cocenza, D.S.; Cruz Vasconcellos, F.d.; Fraceto, L.F.; Beppu, M.M. Chitosan and alginate biopolymer membranes for remediation of contaminated water with herbicides. J. Environ. Manag. 2013, 131, 222–227. [Google Scholar] [CrossRef]
  48. Parris, T.; Coffin, D.R.; Joubran, R.F.; Pessen, H. Composition factors affecting the water vapor permeability and tensile properties of hydrophilic films. J. Agric. Food Chem. 1995, 43, 1432–1435. [Google Scholar] [CrossRef]
  49. Queirós, L.; Sousa, S.; Duarte, A.; Domingues, F.; Ramos, A. Development of carboxymethylxylan films with functional properties. J. Food Sci. Technol. 2017, 54, 9–17. [Google Scholar] [CrossRef]
  50. Escárcega-Galaz, A.; Sánchez-Machado, D.I.; López-Cervantes, J.; Sanches-Silva, A.; Madera-Santana, T.J.; Paseiro-Losada, P. Mechanical, structural and physical aspects of chitosan-based films as antimicrobial dressings. Int. J. Biol. Macromol. 2018, 116, 472–481. [Google Scholar] [CrossRef]
  51. Rodriguez, M.; Oses, J.; Ziani, K.; Mate, J.I. Combined effect of plasticizers and surfactants on the physical properties of starch based edible films. Food Res. Int. 2006, 39, 840–846. [Google Scholar] [CrossRef]
  52. Kanmani, P.; Aravind, J.; Kamaraj, M.; Sureshbabu, P.; Karthikeyan, S. Environmental applications of chitosan and cellulosic biopolymers: A comprehensive outlook. Bioresour. Technol. 2017, 242, 295–303. [Google Scholar] [CrossRef]
  53. Balasubramaniam, M.P.; Murugan, P.; Chenthamara, D.; Ramakrishnan, S.G.; Salim, A.; Lin, F.H.; Robert, B.; Subramaniam, S. Synthesis of chitosan-ferulic acid conjugated poly(vinyl alcohol) polymer film for an improved wound healing. Mater. Today Commun. 2020, 25, 101510. [Google Scholar] [CrossRef]
  54. Arifin, H.R.; Djali, M.; Nurhadi, B.; Azlin-Hasim, S.; Masruchin, N.; Vania, P.A.; Hilmi, A. Corn Starch-Based Bionanocomposite Film Reinforced With ZnO Nanoparticles and Different Types of Plasticizers. Front. Sustain. Food Syst. 2022, 6, 886219. [Google Scholar] [CrossRef]
  55. Santoso, B.; Hazirah, R.; Priyanto, G.; Hermanto, D.; Sugito, D. Utilization of Uncaria gambir Roxb filtrate in the formation of bioactive edible films based on corn starch. Food Sci. Technol. Int. 2019, 39, 837–842. [Google Scholar] [CrossRef]
  56. Zhang, W.; Li, X.; Jiang, W. Development of antioxidant chitosan film with banana peels extract and its application as coating in maintaining the storage quality of apple. Int. J. Biol. Macromol. 2020, 154, 1205–1214. [Google Scholar] [CrossRef]
  57. López-Mata, M.A.; Ruiz-Cruz, S.; Silva-Beltrán, N.P.; Ornelas-Paz, J.J.; Ocaño-Higuera, V.M.; Rodríguez-Félix, F.; Cira-Chávez, L.A.; Del-Toro-Sánchez, C.L.; Shirai, K. Physicochemical and Antioxidant Properties of Chitosan Films Incorporated with Cinnamon Oil. Int. J. Polym. Sci. 2015, 1, 8. [Google Scholar] [CrossRef]
  58. Aziman, N.; Kian, L.K.; Jawaid, M.; Sanny, M.; Alamery, S. Morphological, Structural, Thermal, Permeability, and Antimicrobial Activity of PBS and PBS/TPS Films Incorporated with Biomaster-Silver for Food Packaging Application. Polymers 2021, 13, 391. [Google Scholar] [CrossRef]
  59. Wang, J.; Wang, Z.; Wang, W.; Wang, Y.; Hu, X.; Liu, J.; Gong, X.; Miao, W.; Ding, L.; Li, X.; et al. Synthesis, Modification and Application of Titanium Dioxide nanoparticles: A Review. Nanoscale 2022, 18, 14. [Google Scholar] [CrossRef]
  60. Paulino, L.G.S.; Avila, L.B.; Moraes, C.C.; Khan, M.R.; Manoharadas, S.; Reis, G.S.D.; Dotto, G.L.; Da Rosa, G.S. Double-Layer Membranes of Chitosan and Sodium Alginate Added to Natural Olive Leaf Extract for Potential Use in Skin Lesions. Resources 2023, 12, 97. [Google Scholar] [CrossRef]
  61. Lakouraj, M.M.; Mojerlou, F.; Zare, E.N. Nanogel and superparamagnetic nanocomposite based on sodium alginate for sorption of heavy metal ions. Carbohydr. Polymers. 2014, 106, 34–41. [Google Scholar] [CrossRef]
  62. Kuczajowska-Zadrożnaa, M.; Filipkowskab, U.; Jóźwiak, T. Adsorption of Cu (II) and Cd (II) from aqueous solutions by chitosan immobilized in alginate beads. Environ. Chem. Eng. 2020, 8, 103878. [Google Scholar] [CrossRef]
  63. Elmotasem, H. Chitosan—Alginate blend films for the transdermal delivery of meloxicam. Asian J. Pharm. Sci. 2008, 3, 12–29. [Google Scholar]
  64. Li, K.; Zhu, J.; Guan, G.; Wu, H. Preparation of chitosan-sodium alginate films through layer-by-layer assembly and ferulic acid crosslinking: Film properties, characterization, and formation mechanism. Int. J. Biol. Macromol. 2019, 122, 485–492. [Google Scholar] [CrossRef]
  65. Kloster, G.A.; Marcovich, N.E.; Mosiewicki, M.A. Composite films based on chitosan and nanomagnetite. Eur. Polym. J. 2015, 66, 386–396. [Google Scholar] [CrossRef]
  66. Waldi, J. Production of Bioplastic Poly-ß-Hydroxyalkanoate (PHA) Produced by Rastonia eutropha Using Hydrolyzed Sago Starch Substrate with Isopropyl Palmitate as Plasticizer. Undergraduate Thesis, Bogor Agricultural University, Jawa Barat, Indonicia, 2007. [Google Scholar]
  67. Xu, Y.; Liu, X.; Jiang, Q.; Yu, D.; Xu, Y.; Wang, B.; Xia, W. Development and properties of bacterial cellulose, curcumin, and chitosan composite biodegradable films for active packaging materials. Carbohydr. Polym. 2021, 260, 117778. [Google Scholar] [CrossRef]
  68. Dias, M.R.; Leão, R.C.; De Souza Costa, h. obtenção e caracterização de microesferas de alginato/vidro bioativo. Rev. Eletrônica Perspect. Da Ciência E Tecnol. 2020, 12, 122–137. [Google Scholar] [CrossRef]
  69. Zhou, X.; Zong, X.; Wang, S.; Yin, C.; Gao, X.; Xiong, G.; Xu, X.; Qi, J.; Mei, L. Emulsified blend film based on konjac glucomannan/carrageenan/ camellia oil: Physical, structural, and water barrier properties. Carbohydr. Polym. 2021, 251, 117100. [Google Scholar] [CrossRef]
  70. Anaya-Esparza, L.M.; Pérez-Larios, A.; Ruvalcaba-Gómez, J.M.; Sánchez-Burgos, J.A.; Romero-Toledo, R.; Montalvo-González, E. Funcionalización de los recubrimientos a base de quitosano para la conservación postcosecha de frutas y hortalizas. TIP. Rev. Espec. En Cienc. Químico-Biológicas 2020, 23, 1–14. [Google Scholar] [CrossRef]
  71. Kim, K.W.; Thomas, R.L. Antioxidative activity of chitosans with varying molecular weights. Food Chem. 2007, 101, 308–313. [Google Scholar] [CrossRef]
  72. Park, P.J.; Je, J.Y.; Kim, S.W. Free radical scavenging activities of different deacetylated chitosans using an ESR spectrometer. Carbohydr. Polym. 2004, 55, 17–22. [Google Scholar] [CrossRef]
  73. Xie, W.; Xu, P.; Liu, Q. Antioxidant activity of water-soluble chitosan derivatives. Bioorganic Med. Chem. Lett. 2001, 11, 1699–1701. [Google Scholar] [CrossRef]
  74. Mugnaini, G.; Bonini, M.; Gentile, L.; Panza, O.; Del Nobile, M.A.; Conte, A.; Esposito, R.; D’Errico, G.; Moccia, F.; Panzella, L. Effect of design and molecular interactions on the food preserving properties of alginate/pullulan edible films loaded with grape pomace extract. J. Food Eng. 2024, 361, 111716. [Google Scholar] [CrossRef]
  75. Kanniah, P.; Chelliah, P.; Thangapandi, J.; Gnanadhas, G.; Mahendran, V.; Robert, M. Green synthesis of antibacterial and cytotoxic silver nanoparticles by Piper nigrum seed extract and development of antibacterial silver based chitosan nanocomposite. Int. J. Biol. Macromol. 2021, 189, 18–33. [Google Scholar] [CrossRef] [PubMed]
  76. Njoku, D.I.; Guo, Q.; Dai, W.; Chen, J.; Mao, G.; Sun, Q.; Sun, H.; Peng, Y.K. The multipurpose application of resazurin in micro-analytical techniques: Trends from the microbial, catalysis and single molecule detection assays. Trends Anal. Chem. 2023, 167, 117288. [Google Scholar] [CrossRef]
  77. Filipiak, Y.; Larocca, C. Utilización del azul tripán para diferenciar ovocitos bovinos vivos y muertos en fertilización in vitro. Arch. Zootec. 2012, 61, 309–312. [Google Scholar] [CrossRef]
  78. Fridman, G.; Shereshevsky, A.; Jost, M.M.; Brooks, A.D.; Fridman, A.; Gutson, A.; Vasilets, V.; Friedman, G. Floating Electrode Dielectric Barrier Discharge Plasma in Air Promoting Apoptotic Behavior in Melanoma Skin Cancer Cell Lines. Plasma Chem. Plasma Process. 2007, 27, 163–176. [Google Scholar] [CrossRef]
  79. Hernández-Abril, P.A.; López-Meneses, A.K.; Lizardi-Mendoza, J.; Plascencia-Jatomea, M.; Luque-Alcaraz, A.G. Cellular Internalization and Toxicity of Chitosan Nanoparticles Loaded with Nobiletin in Eukaryotic Cell Models (Saccharomyces cerevisiae and Candida albicans). Materials 2024, 17, 1525. [Google Scholar] [CrossRef]
  80. Lewis-Luján, L.M.; Rosas-Burgos, E.C.; Ezquerra-Brauer, J.M.; Burboa-Zazueta, M.G.; Assanga, S.B.I.; Del Castillo-Castro, T.; Penton, G.; Plascencia-Jatomea, M. Inhibition of Pathogenic Bacteria and Fungi by Natural Phenoxazinone from Octopus Ommochrome Pigments. J. Microbiol. Biotechnol. 2022, 32, 989–1002. [Google Scholar] [CrossRef]
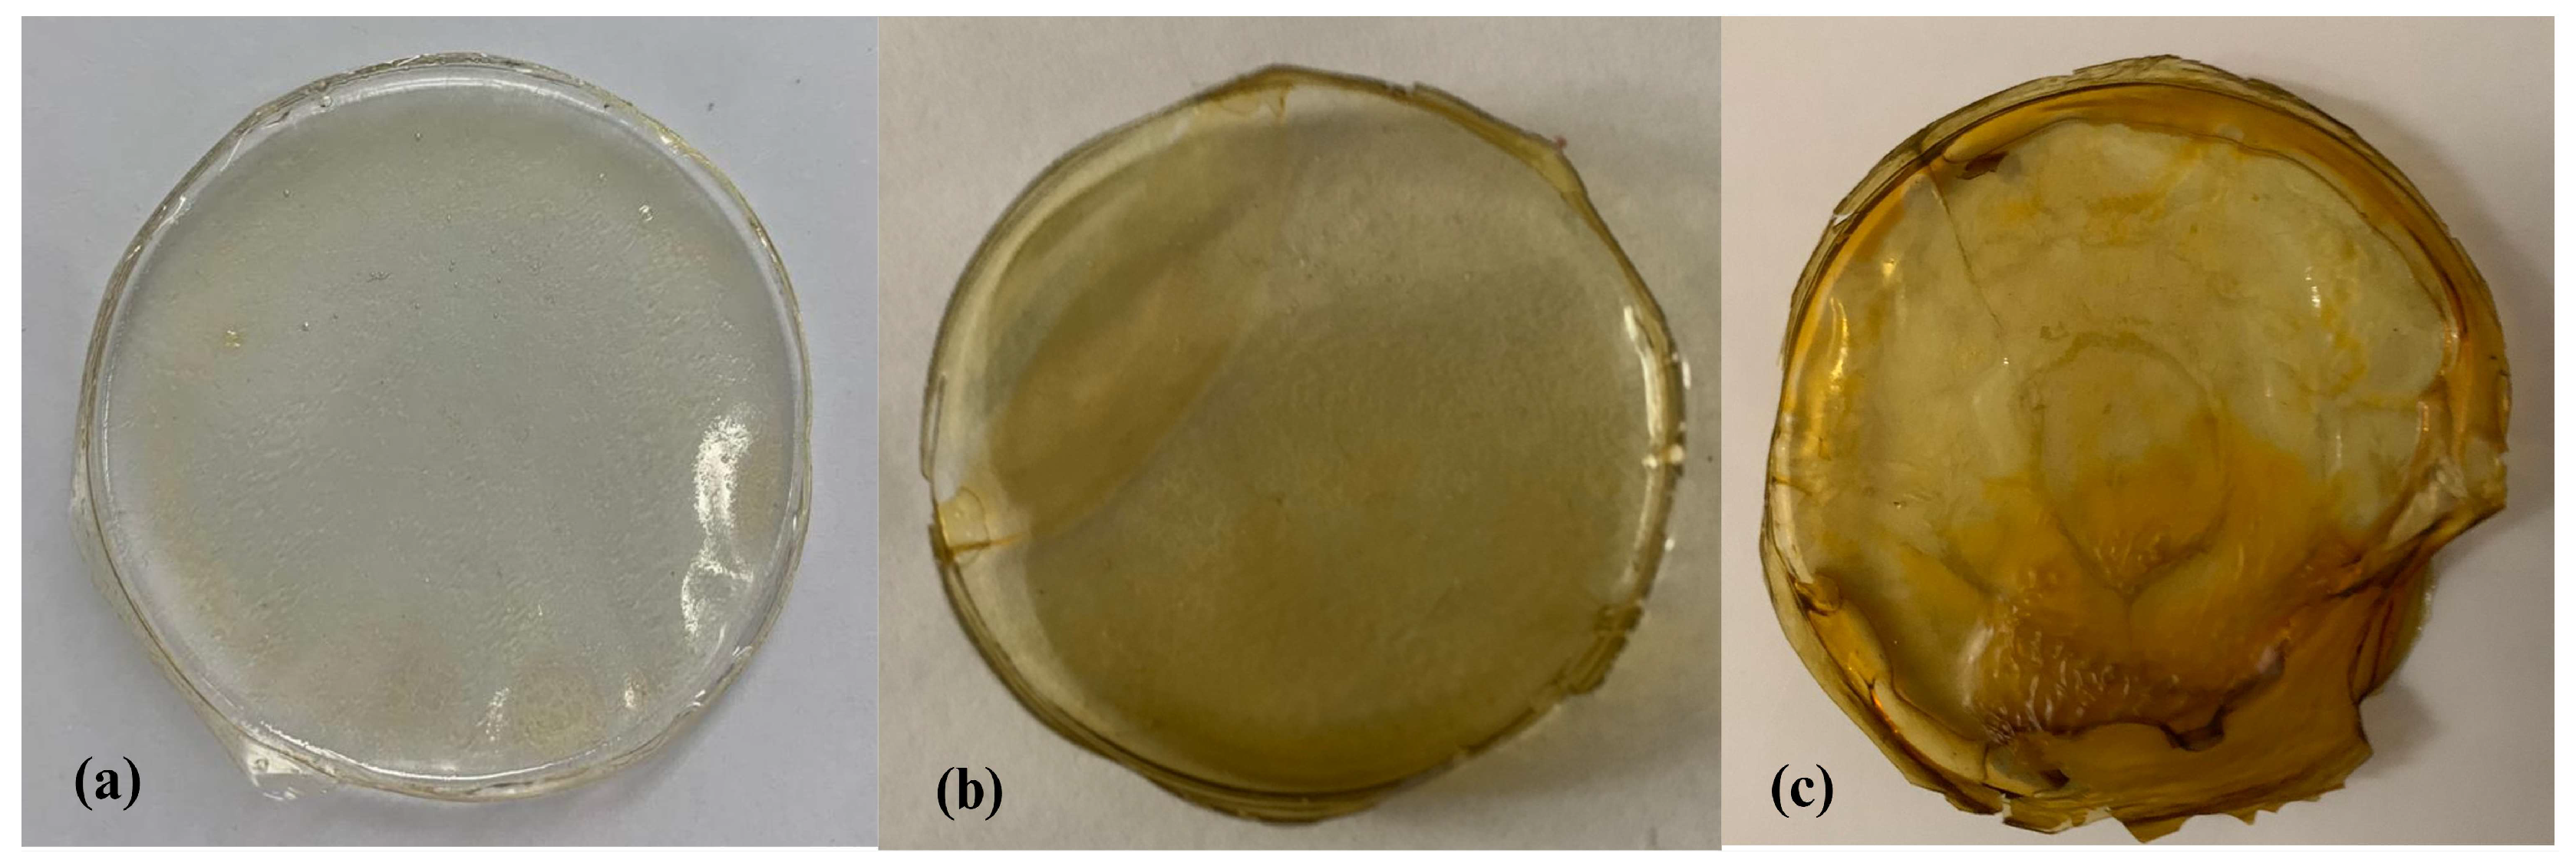
Figure 1. Appearance of the control bilayer film and bilayer films with the addition of asparagus extract residues: (a) F0% film; (b) F1% film; (c) F4% film.
Coatings 14 01232 g001
Figure 2. UV-VIS spectra of transmittance of the control bilayer film (F0%) and bilayer films with the addition of 1% (F1%) and 4% (F4%) of asparagus extract residues.
Coatings 14 01232 g002
Figure 3. Stress–strain graph of films of the control bilayer film (F0%) and bilayer films with the addition of 1% (F1%) and 4% (F4%) of asparagus extract residues and the scheme of the interaction mechanism of asparagus extract with chitosan (CS) and alginate (SA) and their influence on the mechanical properties. The figure was created using BioRender.com.
Coatings 14 01232 g003
Figure 4. Cross-section micrography of the control bilayer film and bilayer films with the addition of asparagus extract residues: F0% film (a,d); F1% film (b,e); F4% film (c,f). Magnification was 150× for (ac), and was 500× for (df).
Coatings 14 01232 g004
Figure 5. Infrared spectrum of the control bilayer film (F0%) and bilayer films with the addition of 1% (F1%) and 4% (F4%) of asparagus extract residue films incorporated with asparagus residue extract and the monolayer film of chitosan (CS) and sodium alginate (SA).
Coatings 14 01232 g005
Figure 6. TGA thermograms of the control film and bilayer films with the addition of asparagus extract residues: (a) Sodium alginate (SA) film; (b) chitosan (CS) film; (c) Asparagus extract (AspE); (d) F0% film; (e) F1% film; (f) F4% film.
Coatings 14 01232 g006
Figure 7. Results of resazurin cell viability assay of S. aureus and P. acidilactici treated with the control bilayer film (F0%) and bilayer films with the addition of asparagus extract residues (F1% and F4%): (a) Photograph of the resazurin test on S. aureus and P. acidilactici; (b) bacterial count (CFU/cm2 film) of P. acidilactici and S. aureus and; abc: means with different literals per bacteria indicate a significant difference (p < 0.05).
Coatings 14 01232 g007
Figure 8. Staining with trypan blue of S. aureus (ac) and P. acidilactici (df) treated with the control bilayer film and bilayer films with the addition of asparagus extract residues: (a,d) bacteria cells treated with F0% film; (b,e) bacteria cells treated with F1% film; (c,f) bacteria cells treated with F4% film; captured using Image-Pro Plus and a light microscope connected to an Infinity 1 camera (100×).
Coatings 14 01232 g008
Figure 9. Images from fluorescence microscopy (100×) of S. aureus (ac) and P. acidilactici (df) treated with the control bilayer film and bilayer films with the addition of asparagus extract residues: (a,d) bacteria cells treated with F0% film; (b,e) bacteria cells treated with F1% film; (c,f) bacteria cells treated with F4% film.
Coatings 14 01232 g009
Table 1. Thickness, color, and opacity of the control bilayer film (F0%) and bilayer films with the addition of 1% (F1%) and 4% (F4%) of asparagus residue extract.
Film
F0%F1%F4%
Thickness (mm)0.14 ± 0.009 a0.15 ± 0.006 b0.25 ± 0.606 c
L*86.78 ± 1.01 a76.04 ± 0.43 b63.04 ± 3.02 c
a*−0.65 ± 0.17 c−3.12 ± 0.53 b7.53 ± 1.8 a
b*6.69 ± 1.2 c41.47 ± 0.4 b53.68 ± 9.7 a
°Hue95.38 ± 1.2 a94.33 ± 0.8 a81.24 ± 4.2 b
C*6.72 ± 2.2 c41.59 ± 1.5 b54.29 ± 12.8 a
Opacity (mm−1)0.96 ± 0.01 a1.56 ± 0.006 b1.95 ± 0.17 c
Values correspond to means ± standard deviation (thickness n = 10; color and opacity n = 3); abc: means with different letters in the row indicate significant differences (p < 0.05).
Table 2. Mechanical properties of the control bilayer film (F0%) and bilayer films with the addition of 1% (F1%) and 4% (F4%) of asparagus extract residues.
FilmElongation
(%)
Tensile Strength
(MPa)
Young’s Modulus
(MPa)
F0%44.9 ± 0.31 b1.83 ± 0.09 a4.43 ± 0.07 a
F1%30.7 ± 2.09 b0.76 ± 0.08 b2.02 ± 0.01 b
F4%92.9 ± 1.00 a1.12 ± 0.00 ab1.43 ± 0.00 b
Means ± standard deviation (n = 3); ab: means with different literals per column indicate significant differences (p < 0.05).
Table 3. Results of total phenol and flavonoid contents of films incorporated with asparagus residue extract.
FilmDetermination
FlavonoidsPhenols
-(mg QE/g film)(mg GAE/g film)
F0%27.97 ± 1.00 c3.90 ± 1.00 c
F1%88.40 ± 5.01 b26.32 ± 4.00 b
F4%108.77 ± 10.00 a30.12 ± 2.00 a
The values correspond to the means ± standard deviation (n = 3); abc: means with different literals within each column indicate significant differences (p < 0.05). QE: quercetin equivalent. GAE: gallic acid equivalent.
Table 4. Antioxidant activity of the control bilayer film (F0%) and bilayer films with the addition of 1% (F1%) and 4% (F4%) of asparagus extract residues.
Film Antioxidant Activity
ABTSDPPHFRAP
-(% ARA)(mg TE/g film)
F0%7.84 c6.98 c0.12 c
F1%43.96 b51.05 b154.6 b
F4%48.76 a61.58 a207.4 a
The values correspond to the means ± standard deviation (n = 3); abc: means with different literals within each column indicate significant differences (p < 0.05). % ARA: percentage of antiradical activity. TE: Trolox equivalent.
Table 5. Antibacterial activity for bilayer films evaluated based on their effect on the area (µm2) of S. aureus and P. acidilactici.
-Film
BacteriaF0%F1%F4%
-(µm2)-
Staphylococcus aureus2.07 ± 0.41 a1.27 ± 0.043 b1.23 ± 0.37 c
Pediococcus acidilactici1.81 ± 0.48 a1.88 ± 0.54 a1.96 ± 0.44 b
F0%: control bilayer film; F1%: bilayer film with 1% of AspE; F4%: bilayer film with 4% AspE. Values correspond to means ± standard deviation (n = 60). abc: Means with different literals within each column indicate significant differences (p < 0.05).
Disclaimer/Publisher’s Note: The statements, opinions and data contained in all publications are solely those of the individual author(s) and contributor(s) and not of MDPI and/or the editor(s). MDPI and/or the editor(s) disclaim responsibility for any injury to people or property resulting from any ideas, methods, instructions or products referred to in the content.