Abstract
Fluorescent materials for sensing have gained attention for the visual detection of different substances as metals and pesticides for environmental monitoring. This work presents fluorescent nanocomposites in solution, film, and paper obtained without capping and stabilizing agents, coming from quantum dots of cadmium sulfide (CdS QDs) and anionic–cationic polymer matrices. Fluorescent films were formed by casting and fluorescent paper by impregnation from the solutions. The optical properties of CdS QDs in solution showed absorption between 418 and 430 nm and a maximum emission at 460 nm. TEM analysis evidenced particle size between 3 and 6 nm and diffraction patterns characteristic of CdS nanocrystals. Infrared spectra evidenced changes in the wavenumber in the fluorescent films. The band gap values (2.95–2.82 eV) suggested an application for visible transmitting film. Fluorescent solutions by UV-vis and fluorescence evidenced a chemical interaction with glyphosate standard between 1 and 100 µg/mL concentrations. The analysis of red, green, and blue color codes (RGB) evidenced a color response of the fluorescent paper at 10 and 100 µg/mL, but the fluorescent films did not show change. Nanocomposites of chitosan and pectin, in solution and on paper, exhibited a behavior “turn-on” sensor, while carboxymethylcellulose had a “turn-off” sensor. This methodology presents three fluorescent materials with potential applications in visual sensing.
1. Introduction
The synergy between organic and inorganic materials is an attractive tool for designing functional materials like nanocomposites with novelty physical, chemical, and ecological properties, such as optical, mechanical, thermal, electrical, magnetic, oxidation, biodegradability, and toxicity [1,2]. Nanocomposites are systems composed of heterogeneous materials with at least one nanoscale component such as nanoparticles, nanotubes, or quantum dots (QDs); so, these organic–inorganic hybrid nanomaterials can be formed by a polymer matrix and metal ions [3]. Fluorescent nanocomposites have been widely used in different sensing and diagnostic imaging applications, where the fluorescence response can be modulated through the synthesis method, the materials used, the shape and dimensionality, interactions at the surface, composition and electronic properties, and other factors [4].
Different materials have been explored to obtain fluorescent quantum dots due to their properties, such as chemical and photochemical stability, compared to fluorescent organic dyes. These materials present narrower emission bands and broader excitation wavelength ranges [5], and the inorganic materials for their synthesis are inexpensive [6]. The chemical synthesis of the QDs in aqueous media can lead to precipitation and aggregation processes, which implies lower reaction efficiencies; therefore, it is necessary to use stabilizing agents like surfactants, as well as expensive and toxic organic compounds such as mercaptosuccinic acid, 2-mercaptoacetic acid, 3-mercaptopropionic acid, and glutathione [7,8]. Most strategies to obtain QDs use mercaptan-type ligands, the precipitation method, and rigorous purification methodologies. However, the interaction with macromolecules like polysaccharides as capping and stabilizing agents has been little explored. The ligands influence the optical properties of the sensors because these can modify the surface of the QDs, as well as the stability and solubility in aqueous media. The chemical interaction between the stabilizers and the QDs has a protective effect, improving the dispersion stability of the particles [9,10].
These nanocrystals have been used in medicine, electronics, and optoelectronics areas, as well as in systems with on/off switches as sensors for environmental monitoring [11]. In Colombia, since 1995, glyphosate (Gly) has been used indiscriminately to eradicate illicit crops [12], which makes it a public health problem since some studies have shown that this molecule is an endocrine disruptor; carcinogenic; and an inhibitor of enzymes such as acetylcholinesterase, an enzyme important for the functioning of the central nervous system [13,14]. Therefore, monitoring this pesticide is important to guarantee environmental quality and food safety. However, the most used analysis methods such as gas chromatography (GC), high-performance liquid chromatography (HPLC), and mass spectrometry (MS) [15] are expensive, requiring rigorous processes, long processing times, and derivatization, which limits their use in remote areas, as well as the accessibility in real time to the local producers [6,16].
New rapid detection techniques based on luminescent quantum dots (QDs) present advantages such as simplicity, ease of operation, detection to low concentrations, and rapid response, making them a potential alternative for pesticide analysis [17,18,19,20]. Bera and Mohapatra (2020) integrated mercaptopropionic acid capped with CdTe and carbon quantum dots (CQD) to establish an interaction with glyphosate (Gly), reaching a detection limit of 2 pM. In similar studies presented by T. Li et al. (2012), the authors developed nanoparticles based on CdTe nanocrystals in sol-gel-derived composite silica spheres that were coated with calix[6]arene; the system obtained a detection limit of 0.0725 nmol/L. On the other hand, a fluorescent system based on carbon dots from wool and silver nanoparticles (AgNPs) obtained a detection limit of 12 ng·mL−1, evidencing that the Gly concentration was proportional to fluorescence intensity [21]. In addition, nanoconjugates synthesized via a single-step aqueous route at room temperature are being explored, such as chitosan-CdS QDs [5,18,19,22,23], CdS dendrimer nanocomposites [24], cadmium sulfide nanoparticles [25], and other that have not been studied as sensors in solution and paper-based sensors for the visual detection of glyphosate [26,27,28]. On the other hand, the studies have evidenced luminescence sensitivity in the QD surface when these present interactions occur between different analytes, metals, and organic molecules, allowing the development of “turn-off or turn-on” sensors [24,29,30].
In this study, CdS QDs were obtained without common stabilizing agents. Fluorescent nanocomposites were formed from CdS QDs and cationic/ionic polymer matrices. This simple methodology considered conditions for the synthesis without mercaptan ligands, room temperature, and short times of stirring; finding different ways to obtain fluorescent nanocomposites: solutions, films, and paper; and their physicochemical characterization, like an attractive strategy to develop sensors for visual detection of organic molecules—in this case, glyphosate, an organophosphorus pesticide.
2. Materials and Methods
2.1. Materials
Hydrated sodium sulfide (Na2S·XH2O) and glacial acetic acid were obtained from Panreac Química SA, Darmstadt, Germany. Hydrated cadmium chloride (CdCl2·2.5H2O) was provided by Carlo Erba Reagentil SpA (Rodano, Italy). Commercial carboxymethylcellulose (RnCH2-COOH) was used (CMC, Mv,ave = 14,740 kDa), and this polymer was characterized according to the previous methodology [31]. Commercial pectin, beta-D-galacto-hexopyranuronic (Pec, degree of esterification: %DE = 57%, Mv,ave = 5300 Da), was used; this polymer was characterized according to the previous methodology [32,33]. Chitosan (Ch), D-glucosamine, and N-acetyl-D-glucosamine, with medium molecular weight (degree of deacetylation: %DD = 80.2%, Mv,ave = 227 kDa), were used; these polymers were characterized according to a previous methodology [34]. Chitosan and glyphosate (C3H8NO5P, analytical standard) were obtained from Sigma Aldrich (St. Louis, MO, USA). Sodium acetate, sodium hydroxide, sodium chloride, and 37% hydrochloric acid were obtained from Merck KGaA (Darmstadt, Germany). Quantitative filter paper WhatmanTM, grade 540, diameter 24 mm, was obtained from Global Life Sciences Solutions USA LLC 1209 Orange Street Wilmington, DE, USA.
2.2. Synthesis and Characterization of Fluorescent Nanocomposite Solutions
Fluorescent nanocomposites were synthesized according to a previous study [22]. Cadmium sulfide quantum dots (CdS QDs) and three polymer matrices, namely, cationic: Ch, anionic: CMC, and Pec, were used. The concentrations of the hydrated cadmium chloride and the hydrated sodium sulfide are shown in Table 1.

Table 1.
Formulations: concentrations of CdCl2·2.5H2O and Na2S·XH2O.
A solution of each polymer was prepared (1%, w/v). Chitosan was dissolved in 1% acetic acid (v/v), and CMC and Pec polymers were prepared in water. The polymers were dissolved at room temperature with constant magnetic stirring for 24 h. The respective amount of CdCl2·2.5H2O was added to the polymer solution (5 mL of 5 or 10 mM). The solution was stirred for 17 h. Na2S·XH2O was added dropwise (1 mL/min) with a syringe with a 21Gx1 ½ needle (5 mL of 2.5 or 5 mM). The mixture was stirred for 15 min. A yellow color was observed in the solution.
The fluorescent nanocomposite solutions were characterized. The optical properties were characterized by fluorescence and UV-Vis spectroscopic analysis. The morphology was analyzed by transmission electron microscopy (TEM).
2.2.1. UV-Vis Absorption Spectra
The samples were analyzed in a Perkin Elmer Lambda 35 UV-Vis spectrophotometer with UV Winlab v7.1 software (Shelton, CT, USA) with a resolution of 1 nm at room temperature. Nanocomposite solutions (300 µL of fresh sample and 700 µL of deionized water) were analyzed in a quartz cell. UV-Vis spectra were obtained between 200 and 800 nm to determine the absorption peaks. The polymer solution was used like a blank.
2.2.2. Fluorescence Measurement
The fluorescence was acquired by scanning with a ThermoFisher Scientific Fluoroskan Ascent FL with Skanlt 5.0 software (Waltham, MA, USA). Nanocomposite solutions (200 µL) were analyzed in a microplate reader (96 well, F-Boden Ref. 655077) at the excitation/emission wavelengths 355/460, 485/538, and 544/590 nm. Only these wavelengths were evaluated for technical reasons of the equipment. However, some studies were previously reviewed to verify the ranges for measuring the photoluminescence of CdS QDs: 353/583 nm [35] and 360/489 nm [36]; excitation spectra with wavelengths at 478, 510, 532, and 539 nm were obtained by setting the emission wavelengths at 495 and 555 nm [37] and 450/531 nm [22].
2.2.3. Morphology
Fluorescent nanocomposite solutions were analyzed by transmission electron microscopy TEM, Tecnai G2 F20Super Twin TMP (Hillsboro, OR, USA). The sample for the TEM analysis was prepared by placing 20 µL of nanocomposite solutions on a copper grid (Lacey Formvar/200 mesh carbon) without staining with uranyl acetate [20]. The images were analyzed by the software Digital Micrograph-Gatan 3.0 and ImageJ 1.46r.
2.3. Preparation of Fluorescent Films Based on Nanocomposites of CdS QD–Polymer Matrices
The fluorescent nanocomposite films were formed by casting. The solutions previously obtained were added to 60 × 15 mm2 polystyrene plastic Petri dishes. Approximately 16.3 g of solution was added to these containers, and these were dried in a digital incubator Memmert BE-40 (W355 S9075 E. Godfrey Lane, Eagle, WI, USA) at a temperature between 35 and 37 °C for 48–72 h. The films were characterized by Fourier transform infrared spectroscopy (FTIR). The optical property was analyzed by UV-Vis spectroscopy.
2.3.1. FTIR Analysis
FTIR spectra were obtained in the range 4000–450 cm−1. The films were cut into 6 × 2 cm2 rectangles, and the transmittance was recorded over 12 scans in a Perkin Elmer spectrum one FTIR (instrument distributed by PerkinElmer, Shelton, CT, USA).
2.3.2. UV-Vis Absorption Spectra
The films were analyzed in a Perkin Elmer Lambda 35 UV-Vis spectrophotometer with UV Winlab v7.1 software. The films were cut into 6 × 2 cm2 rectangles; the UV-Vis spectra were run in the 200–800 nm range to determine the absorption peaks.
2.4. Sensing Application
Glyphosate was selected as a probe organic molecule due to the functional groups present in the chemical structure: phosphonic acid, carboxyl acid, and secondary amine, as well as the importance of being detected in different studies about environmental monitoring [38]. In this study, a standard of Gly was used, and real samples were not evaluated, so the selectivity or interferences were not analyzed.
2.4.1. Fluorescent Nanocomposite Solutions
Different concentrations of glyphosate were used (1, 10, 100 μg/mL) [15]. 50 µL of glyphosate was added to 150 µL of the fluorescent nanocomposite solutions; these were kept for 15 min before the measurement. The fluorescence was measured in a ThermoFisher Scientific Fluoroskan Ascent FL with Skanlt 5.0 software (Waltham, MA, USA, USA) using a microplate reader (96 well, F-Boden Ref. 655077), under the same conditions indicated previously. Also, the solutions were observed under the UV lamp at 365 nm as a quality test.
2.4.2. Fluorescent Films
The fluorescent nanocomposite films were cut into small 4 × 4 cm2 pieces. These were treated with glyphosate at 10 and 100 μg/mL concentrations, and the fluorescent behavior under a UV lamp was analyzed [21]. 50 µL of Gly solutions was added to each film, and these were incubated at room temperature for 15 min. After that, the films were exposed to a UV lamp (365 nm) [39]. Films of polymeric matrix without QDs were used as a blank sample. Pictures were taken with a Huawei smartphone camera, MAR-LX3A (ISO3200, f/1.8, 1/12 s).
2.4.3. Fluorescent Paper
The Whatman filter papers were immersed in each nanocomposite solution prepared (F1, F2, F3 to Ch, Pec, CMC, respectively) until the entire circle was covered. Polymer solution (1%) was used as a blank. These were dried at room temperature for 4 h. The glyphosate concentrations tested were 10 and 100 μg/mL [21]. So, 50 µL was added into the circular fluorescent paper center. The color responses of the papers were observed under the UV lamp at 365 nm after drying. Pictures were taken with a Huawei smartphone camera, MAR-LX3A (ISO3200, f/1.8, 1/12 s). The RGB values were simulated by Adobe Photoshop Elements 2023 v21.0 [28].
2.5. Statistics
All data are presented as mean ± standard deviation (±SD) from at least three measurements. Means were compared between groups by one-way analysis of variance (ANOVA) using the software Statgraphics Centurion XVI.I. A value of p < 0.05 was considered statistically significant. The variable considered was fluorescence, which was analyzed through the formulations, polymer matrix, and glyphosate concentration.
3. Results and Discussion
3.1. Synthesis and Characterization of Fluorescent Nanocomposite Solutions
UV-Vis and fluorescence spectroscopy evaluated the optical properties. Figure 1A shows the UV-Vis absorption spectra of the formulations. Chitosan showed absorption onset at 420 nm (~2.95 eV) to samples F1 and F2, and the F3 formulation increased to 426 nm (~2.91 eV). CMC evidenced absorption onset for the samples F1 and F3 at 422 nm (~2.94 eV), while F2 increased at 8 nm. Pectin showed absorbances at 428 nm (~2.90 eV). According to these results, the concentration of Cd2+ and S2− ions did not present an effect. However, the polymeric matrix influenced the absorbances obtained. Figure 1B shows the fluorescent colors of the different formulations under a UV lamp. Qualitatively, it was observed that all chitosan formulations presented a more homogeneous fluorescent color (blue) in comparison to the Pec and CMC samples (green, pink, blue), which could have been due to the difference in the organic functional groups, amine, amide, and carboxyl groups present in Ch, which can generate a different interaction like a chelating agent type. On the other hand, all F1 formulations showed a blue shift, meaning the particle size in these formulations was smaller [7,8,40]; this phenomenon occurs due to the quant confinement effect [35], which means a spectral shift towards lower wavelengths (higher energy) due to the decrease in the diameter of QDs. This is due to the radius of the QDs affecting the wavelength of the emitted light according to the Brus equation [41]. It is important to mention that all solutions showed yellow colors under visible light (Figure 1B).
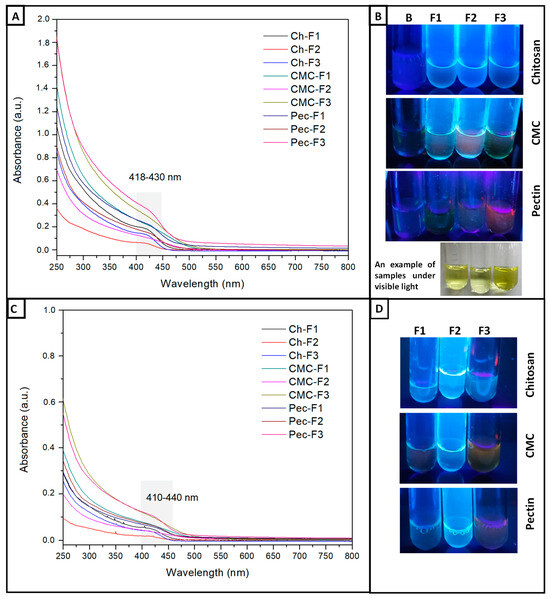
Figure 1.
(A) UV–vis spectra of CdS QD chitosan (Ch), carboxymethylcellulose (CMC), and pectin (Pec) nanocomposite solutions. (B) Photographs of the fluorescent nanocomposite solutions under visible light and a UV lamp, Blank-B, F1 (Cd:S 5:2.5 mM), F2 (Cd:S 5:5 mM), and F3 (Cd:S 10:5 mM). (C) UV–vis spectra of CdS QD chitosan (Ch), carboxymethylcellulose (CMC), and pectin (Pec) nanocomposite solutions treated with 100 µg/mL of Gly. (D) Photographs of the fluorescent nanocomposite solutions treated with 100 µg/mL of Gly (F1, F2, and F3).
Few studies have evaluated macromolecules as capping agents for CdS quantum dots. The amine, amide, and carboxyl groups are characteristics of the chitosan polysaccharide as chelating agents [22]; similar behavior has presented carboxylic and carboxylate groups in CMC and Pec [18,42]. We have explored the use of polysaccharides as a capping agent for QDs-CdS. These macromolecules present an amphiphilic environment due to the different organic groups such as carboxylate, hydroxyl, ether, ester, amide, and carbon chains; this characteristic allows the stability of the QDs, and this is an advantage due to the quantum efficiency being able to be preserved [43].
The fluorescence was measured at 355/460, 485/538, and 544/590 nm, Ex./Em. Table 2 presents the results for 355/460 and 485/538 nm; at 544/590 nm, no fluorescence was observed. The formulations evidenced a major emission at 460 nm (~2.70 eV). Statistical analysis showed a significant difference in CMC fluorescent nanocomposites concerning Pec and Ch, which were homogeneous groups. These results were close to studies where CdS QDs were capped with thioglycolic acid–melamine (TGA) (Ex./Em. 357/470) [29]. Hydrogels formed from CdS QDs with CMC/acrylates (Emis. 470 nm) [18]. Other studies have shown emissions at 500 nm for CdS QD chitosan and CMC nanocomposites [22,44,45]. CdS QDs capped with castor oil presented photoluminescence (PL) with emission maximums at 482, 485, and 502 nm, and ricinoleic acid at 490, 496, and 517 nm [8]. The fluorescence measured at 485/538 nm was lower, showing a significant difference between the three polymers. Statistically, the formulations did not present differences between them. So, the fluorescence values in the nanocomposite solutions depended on the polymer type, but cadmium and sulfide concentrations did not show an effect.
Table 2.
Fluorescence measurement of the nanocomposite solutions at 355/460 and 485/538 excitation/emission wavelengths.
Morphology
TEM images of the blanks (Figure 2A,E,I) did not show diffraction patterns in comparison to the micrographics of the nanocomposites (Figure 2F–H,J–L) at the scale of 20 and 50 nm, which evidences the presence of CdS QDs. The interplanar distance was calculated, obtaining a lattice spacing d value of 0.305 ± 0.003 nm, characteristic of the Miller index plane (111) [46,47]. Characteristic d values of the hexagonal phase were also found at 0.611 ± 0.006 nm and 0.411 ± 0.003 nm [48]. Chitosan formulations clearly did not show areas with quantum dots and diffraction patterns (Figure 2B–D). Similar studies showed nanocomposites with smaller particle sizes and a blue shift [19]. In this case, chitosan formulations showed a blue shift; possibly for that reason, the micrography did not present zones with QDs and diffraction patterns (Figure 2B–D) due to the blue shift that occurs with decreasing in the particle size. On the contrary, CMC and Pec formulations showed higher absorbances (Figure 1A) and diffraction patterns (Figure 2H,L), meaning a higher particle size. These results evidenced the presence of CdS nanocrystals in the nanocomposites, which was coherent with previous studies [7,43].
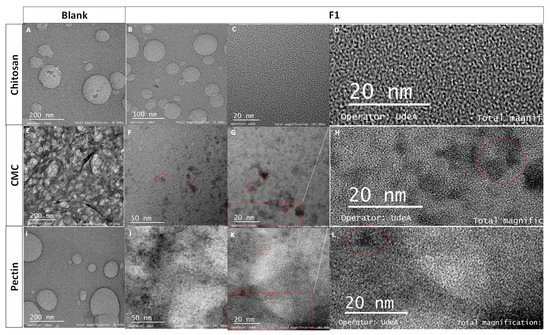
Figure 2.
TEM images of (A) chitosan, (B–D) F1-CdS/chitosan nanocomposite, (E) CMC, (F–H) F1-CdS/CMC nanocomposite, (I) pectin, (J–L) F1-CdS/Pec nanocomposite (F1: 5 mM CdCl2·2.5H2O, 2.5 mM Na2S·XH2O and 1% (w/v) polymeric matrix). (C,G,K) were enlarged by 50%: (D) 1367 × 647 pixels, (H) 1449 × 649 pixels, and (L) 1757 × 755 pixels.
Some aggregates were observed in the nanocomposites of CMC and pectin, and on average, the particle size was in the range of 3–6 nm (Figure 2F,J). The results of particle size are according to previous studies where CdS nanoparticles were obtained using hairy root culture of Linaria maroccana L., exhibiting a particle diameter of 5.2 nm [49], CdS capped with TGA [43], and (3-mercaptopropyl) trimethoxysilane, showing a particle diameter between 3–4 nm [7].
On the other hand, DLS analysis evidenced values close to 3000 nm and polydispersity higher than 400 nm for all samples, which corresponded to the polymer scattering in the solution; for this characterization only were the values reported [50].
3.2. Preparation of Fluorescent Films and Paper Based on Nanocomposites of CdS QD–Polymer Matrices
3.2.1. Fluorescent Films Based on Nanocomposites of CdS QD–Polymer Matrices
FTIR Analysis
To examine the interaction between cadmium sulfide quantum dots (CdS QDs) and polymers, the FTIR analysis was performed to detect changes in particular functional groups of the polymers. Figure 3A shows the infrared spectra of the chitosan fluorescent nanocomposite films. A characteristic absorption peak of the -OH stretching hydroxyl group was observed at 3342 cm−1, possibly overlapping with the N-H stretching. Stretching bands of the aliphatic group -CH were observed at 2934 and 2882 cm−1. The band at 1638 cm−1 was assigned to the C=O amide-I stretching of chitosan; however, at 1638 cm−1, there also was a characteristic bending of the -OH bond for the water, which can establish an interaction with the sulfur of the CdS particles [51]. The signal in 1561 cm−1 was assigned to -NH bending, primary amine, and amide II. The region between 1410 and 1334 cm−1 was correlated to the -CH bending. Also, the peaks between 1079 and 1030 cm−1 were attributed to stretching bands of the C-O-C bond [5].
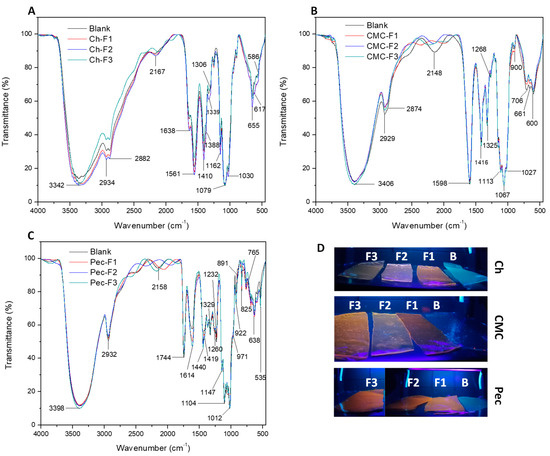
Figure 3.
FTIR spectra of (A) chitosan, (B) CMC, (C) and pectin nanocomposite films, and (D) photographs of the films under a UV lamp. Blank (polymer), F1 (Cd:S 5:2.5 mM), F2 (Cd:S 5:5 mM), and F3 (Cd:S 10:5 mM).
Figure 3B shows the characteristic bands of CMC nanocomposite films. The spectra showed at 3406 cm−1 the stretching signal of O-H. The peaks at 2929 and 2874 cm−1 were assigned to the C-H stretching. The signal at 1598 cm−1 was assigned to the asymmetric stretching of carboxylate groups -COO−, and the symmetric carboxylate stretches were detected at 1416 and 1325 cm−1. The peaks observed between 1109 and 1027 cm−1 were assigned to the -C-O stretching [52].
Figure 3C presents the infrared spectra of the pectin nanocomposite films. The peak 3398 cm−1 was assigned to O–H stretching. The signal at 2932 cm−1 was characteristic of C-H stretching. At 1744 cm−1, the carbonyl stretching of methyl-esterified uronic carboxyl groups was detected. The carboxylate group was also observed at 1614 cm−1 with the asymmetric stretch, and the symmetric carboxylate stretches were detected at 1419 and 1329 cm−1. The region observed between 1104 and 1012 cm−1 was assigned to the -C-O stretching, and at 971 cm−1 to C-O bending. The signal at 922 cm−1 was correlated with the rocking mode of –CH3 [53,54]. Some reports have established characteristic signals of QDs and nanoparticles of cadmium sulfide (CdS) close to 1110, 1040, 1400, and 1560 cm−1 depending on polymer film [55,56]; in this case, these could be overlapped with other peaks.
FTIR analysis evidenced the presence of functional groups such as amine (-NH2), amide-type I, ester (-COOCH3) and carboxylic acid (-COOH), carboxylate (-COO−), hydrophobic groups (-CH, -CH2, -CH3), hydrophilic groups (-OH, -NH2, -COO−), and ionic groups, which are important to the interaction with metal ions, as well as to establish intermolecular forces like hydrogen bonding, electrostatics, dipole-dipole interactions, and Van der Walls forces [57].
Polysaccharides such as chitosan have shown high interaction and affinity with the metal ions due to the amine and carbonyl groups, which have single electron pairs on nitrogen and oxygen atoms, obtaining a chelating effect; so, the groups form a coordinate bonding with the ions [58]. Pectin has groups that can be ionized, allowing the binding with metal ions [59,60]. Carboxymethyl cellulose has been used as a stabilizer to prepare inorganic nanoparticles due to the -OH and COOH groups [52,61,62,63].
Table S1 and Figures S1–S3 present the main peaks with significant shifts in the intensity and wavenumber. The increase in the concentration of Cd2+ evidenced changes in νs (C=O amide I), δ (-NH), and δS (C-O-C) in chitosan nanocomposites films. CMC nanocomposite films showed a band shift at longer wavenumber to νs (COO−) and νs (C-O), and at lower wavenumber δS (C-O-C). Pectin nanocomposite films evidenced a band shift at lower wavenumber to νas (COO−) and longer wavenumber to νs (COO−) and δS (C-O-C) [55,64]. On the other hand, a shoulder close to 2000–2300 cm−1 evidenced a significant change in the three formulations concerning the blank; this was possibly due to some interactions with sulfur. Some studies have shown that the sulfur compounds are adsorbed on -OH groups [56]. In this way, the polysaccharides with -OH, COOH, -COO−, -NH2, C-O-C, and -NHCOCH3 groups allowed the stabilization of the CdS QDs due to the different binding sites, obtaining a variety of fluorescent colors, as is shown by the photography of the fluorescent films in Figure 3D.
UV-Vis Absorption Analysis
Figure 4 shows the UV-Vis spectra of the films. The results showed absorption bands defined by the formulations F1 (430 nm, ~2.88 eV) and F3 (440 nm, ~2.82 eV) of the pectin nanocomposites, as well as of chitosan F3 (424 nm, ~2.92 eV). The absorbance values were higher compared to nanocomposite solutions. Possibly, the dried process favored the aggregation of the CdS QDs, increasing the particle size and the redshift [65]. This evidences coherency with the color of the films observed in the photographs (Figure 3D), where orange colors were mainly observed. It is important to mention that each film under visible light showed a yellow color; the photo is not shown.
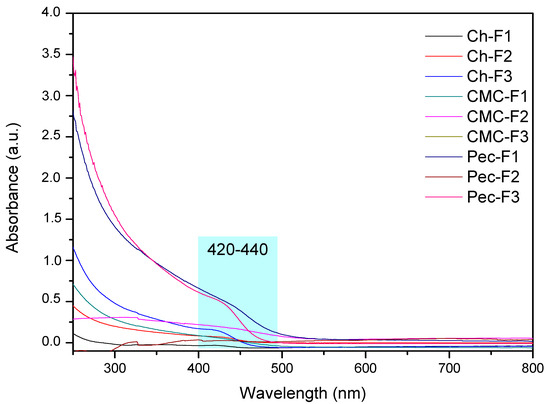
Figure 4.
UV–vis spectra of CdS QD chitosan (Ch), carboxymethylcellulose (CMC), and pectin (Pec) nanocomposite films.
Luminescent films have gained interest due to their different applications in chemo-/bio-sensing, as optical displays, and as switches [66,67,68]. The most studied material to obtain them has been carbon QDs, and a few studies about chitosan and CMC polymers have been reported [69,70]. For that reason, exploring new methodologies and precursors is a current topic of study [65,71,72,73]. Luminescent films based on chitosan, CMC, and pectin polymers were obtained in this work. According to the band gap values (2.95–2.82 eV), the films can used in applications for visible transmitting film [43].
3.2.2. Fluorescent Paper Based on Nanocomposites of CdS QD–Polymer Matrices
After this paper’s process of impregnation with the nanocomposite solutions and their drying, samples without Gly were analyzed under a UV lamp (Figure 5). The filter papers were impregnated uniformly; however, during the drying at room temperature, some showed dark zones. Possibly, this behavior was due to the viscosity of the solutions, as well as the difference in the hydrophilic–hydrophobic nature between polymer and paper, which can generate an incompatibility with the paper, obtaining a heterogeneous dried state [74,75].
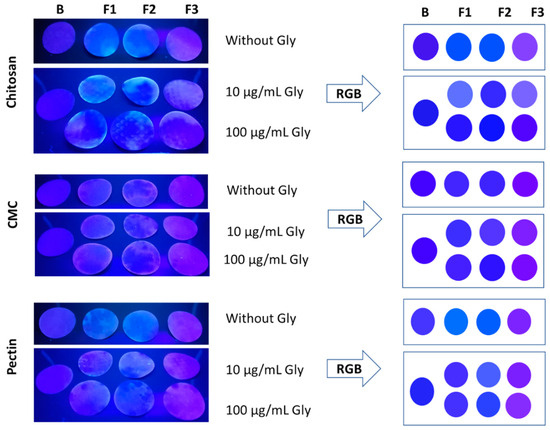
Figure 5.
Images of the paper impregnated with the fluorescent nanocomposite solutions. On the left, the photography of the paper without Gly and the paper treated with 10 and 100 µg/mL of Gly is presented. All the images were taken under a 365 nm UV lamp. On the right, RGB codes for each paper are shown. The data were analyzed with n = 2.
3.3. Sensing Application
The fluorescent nanocomposite solutions, the films obtained from the solutions, as well as the paper impregnated with the solutions, were evaluated in interaction with glyphosate (Gly). Fluorescent films did not show significant changes in the presence of Gly, and these showed a behavior of swelling; for that reason, these were not evaluated as visual detectors. So, the results for the fluorescent solutions and fluorescent paper were presented in the following sections.
3.3.1. Fluorescent Nanocomposite Solutions
The analysis was carried out with a standard Gly. The solutions showed higher fluorescence values at Exc/Emis 355/460 nm (Table 3); lower values (0.014–0.045) were observed at 485/538 nm, and fluorescence was not observed at 544/590 nm. The UV-Vis spectra exhibited changes in the absorbance and wavelengths (Figure 1C), and the colors of the solutions also showed changes when these interacted with Gly (Figure 1D). According to Table 3, the results of the ratio F/F0 suggest that at the Gly concentrations 1 and 10 µg/mL, the fluorescence intensity was proportional to the increase in Gly concentration for chitosan and pectin formulations; so, it means a “turn-on” sensor. However, when the Gly concentration increased to 100 µg/mL, the fluorescence intensity decreased; for example, in F1, the values were 1.38, 1.63, and 1.45 for the concentrations 1, 10, and 100 µg/mL, respectively. On the other hand, CMC formulations evidenced a slight decrease in the fluorescence intensity at the Gly concentrations between 1 and 10 µg/mL, meaning a possible “turn-off” sensor; at higher Gly concentrations, the fluorescence intensity slightly increased. A possible explanation for the different behavior between Pec-Ch and CMC can be the pH, molecular weight, and polymer charges. The solution of Ch had a pH 4.5; this polymer has a high degree of deacetylation favoring protonated amine groups, which interact electrostatically with the phosphate and carboxylate groups of Gly. So, when the Gly concentration increases, more amine groups will be interacting with Gly, so the fluorescence changes with Gly concentration. Pec was dissolved in water like CMC, and these polymers have carboxylate groups; however, the molecular weight of Pec is minor, which favors the hydrogen bond with Gly, but the CMC has a higher molecular weight, decreasing the interaction with Gly by the high viscosity. Therefore, a quenching mechanism could be present due to the interaction between Gly and nanocomposites showing a decrease in the absorbance values [76]. Figure 1A presents the UV-Vis spectra for the solutions without Gly with values between 0.3 and 1.8, while Figure 1C presents absorbances between 0.1 and 0.6, which had coherency with the light blue colors observed in the photographs (Figure 1D).
Table 3.
Fluorescent measurement of the nanocomposite solutions with different concentrations of glyphosate (Gly: 1, 10, and 100 µg/mL).
The statistical analysis showed that the fluorescent nanocomposites of CMC differed significantly at the three concentrations of Gly. Ch and Pec formulations did not show differences at 1 and 100 µg/mL concentrations, but the fluorescence changed significantly at 10 µg/mL. The formulations did not present differences, so the formulations in each polymer had the same behavior.
3.3.2. Fluorescent Paper
Concentrations of Gly 10 and 100 µg/mL (10- and 100-Gly) were selected due to the different behavior observed in the solution. The images of the filter papers were analyzed with Adobe PhotoShop Elements 2023 v21.0 software to extract and simulate the color RGB code (Figure 5). The change of the colors was observed from blue to purple, where the blank, F1, and F2 showed a range of blue and F3 purple colors. The formulations showed differences in the R and G values, compared with the blank paper. Samples treated with 10-Gly showed lighter colors, and the samples treated with 100-Gly exhibited darker colors, which evidences the possibility to visually detect Gly. Fluorescent nanocomposites of chitosan and pectin showed a clear difference in the colors; the blank of the papers and the samples treated with Gly exhibited a range of significantly different colors. R values in the sample 10-Gly to chitosan were between 50 and 115, and the sample 100-Gly between 20 and 70. G values were between 40 and 111 in 10-Gly samples, and 12 and 27 in 100-Gly samples. For pectin, R values were found between 60 and 110 in both cases, but G values were between 35 and 95 in 10-Gly, and 45 and 65 in 100-Gly. The fluorescent paper of CMC showed a behavior of “turn-off” due to the color of the formulations and the blank being similar, which evidenced coherency with the previous results obtained in the solution. R values were obtained between 60 and 108, and between 50 and 35 to G, for both concentrations of Gly. Although the fluorescent paper showed a color response to the concentration changes to Gly, it is necessary to analyze narrower concentrations under different conditions, as well as their selectivity to the other pesticides, as has been evaluated in other studies based on QDs of CdTe/ZnCdSe [28,77].
In visual detection strategies using QDs, the interaction between the analyte and single-emitter QDs is based on changes in the photoluminescence intensity. The most used to detect Gly have been CdTe QDs, carbon dots, nanoparticles, and dual systems, indicating that the system polymeric matrix–CdS nanocomposites are a new proposal to detect Gly [78]. Previous studies have shown detection ranges between 0.03 and 10 µg/mL using carbon dots based on turn-on fluorescent to detect Gly in water samples [79]. Recently, green emissive carbon dots were detected until 10 µM of Gly [80], compared to our study, where we found a response at 1 µg/mL~6 µM. A system with mercaptopropionic acid capped with CdTe, reaching a detection limit of 2 pM [14]. Nanoparticles based on CdTe and silica spheres, which were coated with calix[6]arene; the system obtained a detection limit of 0.0725 nmol/L (7.25 × 10⁻⁵ µM) [17]. On the other hand, a fluorescence system based on carbon dots and silver nanoparticles (AgNPs) obtained a detection limit of 12 ng·mL−1 [21]. In a recent study, a hinge-like, paper-based, dual-channel, enzyme-free, ratiometric fluorescent microfluidic platform was developed; this quantified Gly in the range of 5–600 µM, a similar range to that used in this study (~6–600 µM) [81]. Although our results did not show a clear linear range and limit of detection (LOD) value at the concentrations evaluated, this material showed promising results, which could be improved using Cu2+, L-cysteine, and other molecules [68,82,83] for their use as a sensor for Gly or another analyte as ions and toxic metals that can establish an ionic interaction with the polysaccharides of the nanocomposites obtaining a change in the PL intensity.
In this study, the fluorescent nanocomposites were absorbed into a paper filter. According to some studies, the system binding can be determined by the porosity of the paper and the amine, carboxylate, and hydroxyl groups present on the paper surface. In this way, Gly presents interactions of the type of hydrogen bonding, and ionic bond with the groups available on the paper [84,85]. However, it is important to study some interferences such as ions with similar functional groups to Gly and complex water matrices to evaluate their behavior. In practice, it is expected that the sample can be sensed directly on a paper, which would allow evidence of the approximate concentration of an analyte through the change in the intensity of the PL.
4. Conclusions
In summary, fluorescent nanocomposites based on CdS QDs and cationic/anionic polymer matrices were obtained. The three fluorescent systems (solutions, thin films, and paper) were characterized, and their use as a visual sensor system was evaluated with an organophosphorus pesticide. Fluorescent nanocomposite solutions presented an emission maximum of 460 nm. CdS QD nanocrystals presented a hexagonal structure with particle sizes between 3 and 6 nm. Gly standard was detected between 1 and 100 µg/mL concentrations through UV-Vis and fluorescence techniques. The type of polymer matrices influenced the interaction with Gly, but the concentrations of the reagents did not show any effect. The fluorescence analysis evidenced a major interaction with Ch and Pec due to the interactions between Gly and the polymer in terms of the type of ionic and hydrogen bonds.
The formulations formed thin fluorescent films by casting; however, the properties should be improved to be used with aqueous systems. FTIR spectra of the films evidenced an interaction with the sulfur group through the changes in the wavenumber, and the optical properties showed a redshift, due to the drying process, which favors aggregation of the particles increasing the particle size. These films can be used in applications for visible transmitting, according to the band gap values (2.95–2.82 eV).
Fluorescent papers showed a color response at different concentrations of Gly according to the RGB code. Fluorescent paper impregnated with CMC solutions showed a behavior “turn-off”; so, the fluorescence slightly decreased with the increase in Gly concentration. Chitosan and pectin systems showed an increase in the colors, suggesting a behavior “turn-on”. The fluorescent papers can be improved to be used as a sensor for visual detection.
Supplementary Materials
The following supporting information can be downloaded at https://www.mdpi.com/article/10.3390/coatings14101256/s1. Table S1: FTIR peaks with significant shifts in the intensity and wavenumber. Figure S1: Individual FT-IR spectra of chitosan nanocomposite films (A) Range 450–4000 cm−1 and (B) Range 450–2400 cm−1. Figure S2: Individual FT-IR spectra of CMC nanocomposite films (A) Range 450–4000 cm−1 and (B) Range 450–2400 cm−1. Figure S3: Individual FT-IR spectra of pectin nanocomposite films (A) Range 450–4000 cm−1 and (B) Range 450–2400 cm−1.
Author Contributions
K.R. and A.L. developed the nanocomposite solutions and films, and they analyzed the FTIR results (methodology, data curation, software, investigation). P.M. designed the study, interpreted the results, and drafted the manuscript (conceptualization, methodology, validation, software, formal analysis, investigation, writing—original draft preparation, supervision, project administration, funding acquisition). J.R. proportionated some resources and the analysis about the fluorescent paper (writing—review and editing, formal analysis). B.L. carried out the UV-Vis, fluorescence, and TEM analysis, and she interpreted some results (data curation, writing—review and editing, formal analysis, funding acquisition). All authors have read and agreed to the published version of the manuscript.
Funding
This research was funded by Universidad Nacional Abierta y a Distancia, grant number PS2220202, and the APC was funded by Sistema de Gestión de la investigación (SIGI)-UNAD.
Institutional Review Board Statement
Not applicable.
Informed Consent Statement
Not applicable.
Data Availability Statement
The data will be provided if they are requested.
Acknowledgments
The authors would like to thank the research group CIENMATE of the Universidad de Antioquia for the research cooperation.
Conflicts of Interest
The authors declare no conflicts of interest.
References
- Loste, J.; Lopez-Cuesta, J.M.; Billon, L.; Garay, H.; Save, M. Transparent polymer nanocomposites: An overview on their synthesis and advanced properties. Prog. Polym. Sci. 2019, 89, 133–158. [Google Scholar] [CrossRef]
- Zadehnazari, A. Metal oxide/polymer nanocomposites: A review on recent advances in fabrication and applications. Polym.-Plast. Technol. Mater. 2023, 62, 655–700. [Google Scholar] [CrossRef]
- Hári, J.; Pukánszky, B. Nanocomposites: Preparation, Structure, and Properties. In Applied Plastics Engineering Handbook: Processing and Materials; Elsevier: Amsterdam, The Netherlands, 2011; pp. 109–142. [Google Scholar]
- Demchenko, A.P. Nanoparticles and nanocomposites for fluorescence sensing and imaging. Methods Appl. Fluoresc. 2013, 1, 022001. [Google Scholar] [CrossRef] [PubMed]
- Mansur, A.A.P.; Mansur, H.S. Quantum dot/glycol chitosan fluorescent nanoconjugates. Nanoscale Res. Lett. 2015, 10, 172. [Google Scholar] [CrossRef] [PubMed]
- Su, D.; Li, H.; Yan, X.; Lin, Y.; Lu, G. Biosensors based on fluorescence carbon nanomaterials for detection of pesticides. TrAC—Trends Anal. Chem. 2021, 134, 116126. [Google Scholar] [CrossRef]
- Kuznetsova, Y.V.; Popov, I.D.; Yu Gerasimov, E.; Rempel, A.A. Cadmium sulfide quantum dots in water media: Enhanced photoluminescence, dispersion and stability. J. Mol. Liq. 2023, 371, 121084. [Google Scholar] [CrossRef]
- Kyobe, J.W.; Mubofu, E.B.; Makame, Y.M.M.; Mlowe, S.; Revaprasadu, N. Cadmium sulfide quantum dots stabilized by castor oil and ricinoleic acid. Phys. E Low. Dimens. Syst. Nanostruct 2016, 76, 95–102. [Google Scholar] [CrossRef]
- Faridbod, F.; Jamali, A.; Ganjali, M.R.; Hosseini, M.; Norouzi, P. A novel cobalt-sensitive fluorescent chemosensor based on ligand capped CdS quantum dots. J. Fluoresc. 2015, 25, 613–619. [Google Scholar] [CrossRef]
- Rajabi, H.R.; Karimi, F.; Kazemdehdashti, H.; Kavoshi, L. Fast sonochemically-assisted synthesis of pure and doped zinc sulfide quantum dots and their applicability in organic dye removal from aqueous media. J. Photochem. Photobiol. B 2018, 181, 98–105. [Google Scholar] [CrossRef]
- Bera, D.; Qian, L.; Tseng, T.K.; Holloway, P.H. Quantum dots and their multimodal applications: A review. Materials 2010, 3, 2260–2345. [Google Scholar] [CrossRef]
- Rodríguez Ruiz, J.D.; Hernández Álvarez, M.E. La Controversia Sobre el Impacto en Salud de las Aspersiones Aéreas con Glifosato en la Política de Erradicación de Cultivos de Uso Ilícito: Poder, Saber y Política Pública. Doctoral Dissertation, Universidad Nacional de Colombia, Bogotá, Colombia, 2021. [Google Scholar]
- Muñoz, J.P.; Bleak, T.C.; Calaf, G.M. Glyphosate and the key characteristics of an endocrine disruptor: A review. Chemosphere 2021, 270, 128619. [Google Scholar] [CrossRef] [PubMed]
- Bera, M.K.; Mohapatra, S. Ultrasensitive detection of glyphosate through effective photoelectron transfer between CdTe and chitosan derived carbon dot. Colloids Surf. A Physicochem. Eng. Asp. 2020, 596, 124710. [Google Scholar] [CrossRef]
- Wang, D.; Lin, B.; Cao, Y.; Guo, M.; Yu, Y. A Highly Selective and Sensitive Fluorescence Detection Method of Glyphosate Based on an Immune Reaction Strategy of Carbon Dot Labeled Antibody and Antigen Magnetic Beads. J. Agric. Food Chem. 2016, 64, 6042–6050. [Google Scholar] [CrossRef] [PubMed]
- Valle, A.L.; Mello, F.C.C.; Alves-Balvedi, R.P.; Rodrigues, L.P.; Goulart, L.R. Glyphosate detection: Methods, needs and challenges. Env. Chem. Lett. 2019, 17, 291–317. [Google Scholar] [CrossRef]
- Li, T.; Zhou, Y.; Sun, J.; Wu, K. Ultrasensitive Detection of Glyphosate Using CdTe Quantum Dots in Sol-Gel-Derived Silica Spheres Coated with Calix[6]arene as Fluorescent Probes. Am. J. Anal. Chem. 2012, 3, 12–18. [Google Scholar] [CrossRef]
- Hosseinzadeh, H.; Bahador, N. Novel CdS quantum dots templated hydrogel nanocomposites: Synthesis, characterization, swelling and dye adsorption properties. J. Mol. Liq. 2017, 240, 630–641. [Google Scholar] [CrossRef]
- Li, Z.; Du, Y.; Zhang, Z.; Pang, D. Preparation and characterization of CdS quantum dots chitosan biocomposite. React. Funct. Polym. 2003, 55, 35–43. [Google Scholar] [CrossRef]
- Walia, S.; Acharya, A. Fluorescent cadmium sulfide nanoparticles for selective and sensitive detection of toxic pesticides in aqueous medium. J. Nanopart. Res. 2014, 16, 2778. [Google Scholar] [CrossRef]
- Wang, L.; Bi, Y.; Hou, J.; Li, H.; Xu, Y.; Wang, B.; Ding, H.; Ding, L. Facile, green and clean one-step synthesis of carbon dots from wool: Application as a sensor for glyphosate detection based on the inner filter effect. Talanta 2016, 160, 268–275. [Google Scholar] [CrossRef]
- Dilag, J.; Kobus, H.; Ellis, A.V. Cadmium sulfide quantum dot/chitosan nanocomposites for latent fingermark detection. Forensic Sci. Int. 2009, 187, 97–102. [Google Scholar] [CrossRef] [PubMed]
- Devendran, P.; Alagesan, T.; Ravindran, T.R.; Pandian, K. Synthesis of Spherical CdS Quantum Dots Using Cadmium Diethyldithiocarbamate as Single Source Precursor in Olive Oil Medium. Curr. Nanosci. 2014, 10, 302–307. [Google Scholar] [CrossRef]
- Campos, B.B.; Algarra, M.; Esteves Da Silva, J.C.G. Fluorescent properties of a hybrid cadmium sulfide-dendrimer nanocomposite and its quenching with nitromethane. J. Fluoresc. 2010, 20, 143–151. [Google Scholar] [CrossRef] [PubMed]
- Sankhla, A.; Sharma, R.; Yadav, R.S.; Kashyap, D.; Kothari, S.L.; Kachhwaha, S. Biosynthesis and characterization of cadmium sulfide nanoparticles—An emphasis of zeta potential behavior due to capping. Mater. Chem. Phys. 2016, 170, 44–51. [Google Scholar] [CrossRef]
- Zhang, Z.; Ma, X.; Jia, M.; Li, B.; Rong, J.; Yang, X. Deposition of CdTe quantum dots on microfluidic paper chips for rapid fluorescence detection of pesticide 2, 4-D. Analyst 2019, 144, 1282–1291. [Google Scholar] [CrossRef] [PubMed]
- Zhang, Z.; Ma, X.; Li, B.; Zhao, J.; Qi, J.; Hao, G.; Jianhui, R.; Yang, X. Fluorescence detection of 2,4-dichlorophenoxyacetic acid by ratiometric fluorescence imaging on paper-based microfluidic chips. Analyst 2020, 145, 963–974. [Google Scholar] [CrossRef] [PubMed]
- Chen, H.; Hu, O.; Fan, Y.; Xu, L.; Zhang, L.; Lan, W.; Hu, Y.; Xie, X.; Ma, L.; She, Y.; et al. Fluorescence paper-based sensor for visual detection of carbamate pesticides in food based on CdTe quantum dot nano, ZnTPyP. Food Chem. 2020, 327, 127075. [Google Scholar] [CrossRef] [PubMed]
- Wang, G.L.; Jiao, H.J.; Zhu, X.Y.; Dong, Y.M.; Li, Z.J. Enhanced fluorescence sensing of melamine based on thioglycolic acid-capped CdS quantum dots. Talanta 2012, 93, 398–403. [Google Scholar] [CrossRef] [PubMed]
- Yao, J.; Yang, M.; Liu, Y.; Duan, Y. Fluorescent CdS Quantum Dots: Synthesis, Characterization, Mechanism and Interaction. J. Nanosci. Nanotechnol. 2015, 15, 3720–3727. [Google Scholar] [CrossRef]
- Mondal, M.I.H.; Yeasmin, M.S.; Rahman, M.S. Preparation of food grade carboxymethyl cellulose from corn husk agrowaste. Int. J. Biol. Macromol. 2015, 79, 144–150. [Google Scholar] [CrossRef] [PubMed]
- Zhou, J.; Wu, Y.; Shen, Z. Viscous-flow properties and viscosity-average molecular mass of orange peel pectin. J. Cent. S. Univ. Technol. 2008, 15, 520–524. [Google Scholar] [CrossRef]
- Arias, D.; Rodríguez, J.; López, B.; Méndez, P. Evaluation of the physicochemical properties of pectin extracted from Musa paradisiaca banana peels at different pH conditions in the formation of nanoparticles. Heliyon 2021, 7, e06059. [Google Scholar] [CrossRef] [PubMed]
- Kasaai, M.R.; Arul, J.; Charlet, G. Intrinsic viscosity-molecular weight relationship for chitosan. J. Polym. Sci. B Polym. Phys. 2000, 38, 2591–2598. [Google Scholar] [CrossRef]
- Javed, H.; Fatima, K.; Akhter, Z.; Nadeem, M.A.; Siddiq, M.; Iqbal, A. Fluorescence modulation of cadmium sulfide quantum dots by azobenzene photochromic switches. Proc. R. Soc. A Math. Phys. Eng. Sci. 2016, 472, 20150692. [Google Scholar] [CrossRef] [PubMed]
- Liu, M.; Xu, L.; Cheng, W.; Zeng, Y.; Yan, Z. Surface-modified CdS quantum dots as luminescent probes for sulfadiazine determination. Spectrochim. Acta A Mol. Biomol. Spectrosc. 2008, 70, 1198–1202. [Google Scholar] [CrossRef] [PubMed]
- Kandi, D.; Mansingh, S.; Behera, A.; Parida, K. Calculation of relative fluorescence quantum yield and Urbach energy of colloidal CdS QDs in various easily accessible solvents. J. Lumin. 2021, 231, 117792. [Google Scholar] [CrossRef]
- Samadi, N.; Narimani, S. An ultrasensitive and selective method for the determination of Ceftriaxone using cysteine capped cadmium sulfide fluorescence quenched quantum dots as fluorescence probes. Spectrochim. Acta A Mol. Biomol. Spectrosc. 2016, 163, 8–12. [Google Scholar] [CrossRef]
- Jaiswal, A.; Ghsoh, S.S.; Chattopadhyay, A. Quantum Dot Impregnated-Chitosan Film for Heavy Metal Ion Sensing and Removal. Langmuir 2012, 28, 15687–15696. [Google Scholar] [CrossRef]
- Mishra, S.K.; Srivastava, R.K.; Prakash, S.G.; Yadav, R.S.; Panday, A.C. Structural, photoconductivity and photoluminescence characterization of cadmium sulfide quantum dots prepared by a co-precipitation method. Electron. Mater. Lett. 2011, 7, 31–38. [Google Scholar] [CrossRef]
- Chen, J.; Zheng, A.F.; Gao, Y.; He, C.; Wu, G.; Chen, Y.; Kai, X.; Zhu, C. Functionalized CdS quantum dots-based luminescence probe for detection of heavy and transition metal ions in aqueous solution. Spectrochim. Acta A Mol. Biomol. Spectrosc. 2008, 69, 1044–1052. [Google Scholar] [CrossRef]
- Sawant, N.; Salam, A. Chemically Functionalized Polysaccharide-Based Chelating Agent for Heavy Metals and Nitrogen Compound Remediation from Contaminated Water. Ind. Eng. Chem. Res. 2022, 61, 1250–1257. [Google Scholar] [CrossRef]
- Singh, S.; Garg, S.; Chahal, J.; Raheja, K.; Singh, D.; Singla, M.L. Luminescent behavior of cadmium sulfide quantum dots for gallic acid estimation. Nanotechnology 2013, 24, 115602. [Google Scholar] [CrossRef] [PubMed]
- He, Z.; Zhu, H.; Zhou, P. Microwave-assisted aqueous synthesis of highly luminescent carboxymethyl chitosan-coated CdTe/CdS quantum dots as fluorescent probe for live cell imaging. J. Fluoresc. 2012, 22, 193–199. [Google Scholar] [CrossRef] [PubMed]
- Cui, M.; Xin, Y.; Song, R.; Sun, Q.; Wang, X.; Lu, D. Fluorescence sensor for bovine serum albumin detection based on the aggregation release of CdSQDs within CMC. Cellulose 2020, 27, 1621–1633. [Google Scholar] [CrossRef]
- Raj, R.; Kumari, N.; Monalisa Rai, B.C.; Karimi, N.A.; Singh, R.K.; Kr, N. Physical properties of quantum dot cadmium sulphide nanomaterials for its applications, prepared by low cost chemical method. Mater. Today Proc. 2022, 66, 1750–1755. [Google Scholar] [CrossRef]
- KAlgethami, F.; Saidi, I.; Ben Jannet, H.; Khairy, M.; Abdulkhair, B.Y.; Al-Ghamdi, Y.O.; Abdelhamid, H.N. Chitosan-CdS Quantum Dots Biohybrid for Highly Selective Interaction with Copper(II) Ions. ACS Omega 2022, 7, 21014–21024. [Google Scholar] [CrossRef]
- Venegas, F.A.; Saona, L.A.; Monrás, J.P.; Órdenes-Aenishanslins, N.; Giordana, M.F.; Ulloa, G.; Collao, B.; Bravo, D.; Pérez-Donoso, J.M. Biological phosphorylated molecules participate in the biomimetic and biological synthesis of cadmium sulphide quantum dots by promoting H2S release from cellular thiols. RSC Adv. 2017, 7, 40270–40278. [Google Scholar] [CrossRef]
- Borovaya, M.N.; Naumenko, A.P.; Matvieieva, N.A.; Blume, Y.B.; Yemets, A.I. Biosynthesis of luminescent CdS quantum dots using plant hairy root culture. Nanoscale Res. Lett. 2014, 9, 686. [Google Scholar] [CrossRef]
- Blagodatskikh, I.V.; Bezrodnykh, E.A.; Abramchuk, S.S.; Muranov, A.V.; Sinitsyna, O.V.; Khokhlov, A.R.; Tikhonov, V.E. Short chain chitosan solutions: Self-assembly and aggregates disruption effects. J. Polym. Res. 2013, 20, 73. [Google Scholar] [CrossRef]
- Susha, N.; Nandakumar, K.; Nair, S.S. Enhanced photoconductivity in CdS/betanin composite nanostructures. RSC Adv. 2018, 8, 11330–11337. [Google Scholar] [CrossRef]
- Mansur, A.A.P.; de Carvalho, F.G.; Mansur, R.L.; Carvalho, S.M.; de Oliveira, L.C.; Mansur, H.S. Carboxymethylcellulose/ZnCdS fluorescent quantum dot nanoconjugates for cancer cell bioimaging. Int. J. Biol. Macromol. 2017, 96, 675–686. [Google Scholar] [CrossRef] [PubMed]
- Oliveira, T.Í.S.; Rosa, M.F.; Cavalcante, F.L.; Pereira, P.H.F.; Moates, G.K.; Wellner, N.; Mazzetto, S.E.; Waldron, K.W.; Azeredo, H.M.C. Optimization of pectin extraction from banana peels with citric acid by using response surface methodology. Food Chem. 2016, 198, 113–118. [Google Scholar] [CrossRef] [PubMed]
- Méndez, P.A.; López, B.L. Polyelectrolyte Nanoparticles of Amphiphilic Chitosan / Pectin from Banana Peel as Potential Carrier System of Hydrophobic Molecules. Polymers 2020, 12, 2109. [Google Scholar] [CrossRef]
- Pandian, S.R.K.; Deepak, V.; Kalishwaralal, K.; Gurunathan, S. Biologically synthesized fluorescent CdSNPs encapsulated by PHB. Enzym. Microb. Technol. 2011, 48, 319–325. [Google Scholar] [CrossRef] [PubMed]
- Wageh, S.; Maize, M.; Donia, A.M.; Al-Ghamdi, A.A.; Umar, A. Synthesis and characterization of mercaptoacetic acid capped cadmium sulphide quantum dots. J. Nanosci. Nanotechnol. 2015, 15, 9861–9867. [Google Scholar] [CrossRef] [PubMed]
- Na, Y.; Lee, J.; Lee, S.H.; Kumar, P.; Kim, J.H.; Patel, R. Removal of heavy metals by polysaccharide: A review. Polym.-Plast. Technol. Mater. 2020, 59, 1770–1790. [Google Scholar] [CrossRef]
- Azeman, N.H.; Arsad, N.; Bakar, A.A.A. Polysaccharides as the sensing material for metal ion detection-based optical sensor applications. Sensors 2020, 20, 3924. [Google Scholar] [CrossRef] [PubMed]
- Ibarra-Rodríguez, D.; Lizardi-Mendoza, J.; López-Maldonado, E.A.; Oropeza-Guzmán, M.T. Capacity of ‘nopal’ pectin as a dual coagulant-flocculant agent for heavy metals removal. Chem. Eng. J. 2017, 323, 19–28. [Google Scholar] [CrossRef]
- Wang, R.; Liang, R.; Dai, T.; Chen, J.; Shuai, X.; Liu, C. Pectin-based adsorbents for heavy metal ions: A review. Trends Food Sci. Technol. 2019, 91, 319–329. [Google Scholar] [CrossRef]
- Duan, Y.; Tan, J.; Huang, Z.; Deng, Q.; Liu, S.; Wang, G.; Li, L.; Zhou, L. Facile synthesis of carboxymethyl cellulose sulfur quantum dots for live cell imaging and sensitive detection of Cr(VI) and ascorbic acid. Carbohydr. Polym. 2020, 249, 116882. [Google Scholar] [CrossRef]
- Mathew, M.E.; Mohan, J.C.; Manzoor, K.; Nair, S.V.; Tamura, H.; Jayakumar, R. Folate conjugated carboxymethyl chitosan-manganese doped zinc sulphide nanoparticles for targeted drug delivery and imaging of cancer cells. Carbohydr. Polym. 2010, 80, 442–448. [Google Scholar] [CrossRef]
- Ning, J.; Luo, X.; Wang, F.; Huang, S.; Wang, J.; Liu, D.; Liu, D.; Chen, D.; Wei, J.; Liu, Y. Synergetic sensing effect of sodium carboxymethyl cellulose and bismuth on cadmium detection by differential pulse anodic stripping voltammetry. Sensors 2019, 19, 5482. [Google Scholar] [CrossRef] [PubMed]
- Hadjiivanov, K.I.; Panayotov, D.A.; Mihaylov, M.Y.; Ivanova, E.Z.; Chakarova, K.K.; Andonova, S.M.; Drenchev, N.L. Power of Infrared and Raman Spectroscopies to Characterize Metal-Organic Frameworks and Investigate Their Interaction with Guest Molecules. Chem. Rev. 2021, 121, 1286–1424. [Google Scholar] [CrossRef] [PubMed]
- Reda, S.M. Synthesis and optical properties of CdS quantum dots embedded in silica matrix thin films and their applications as luminescent solar concentrators. Acta Mater. 2008, 56, 259–264. [Google Scholar] [CrossRef]
- Guan, W.; Zhou, W.; Lu, J.; Lu, C. Luminescent films for chemo- and biosensing. Chem. Soc. Rev. 2015, 44, 6981–7009. [Google Scholar] [CrossRef] [PubMed]
- Gao, R.; Fang, X.; Yan, D. Recent developments in stimuli-responsive luminescent films. J. Mater. Chem. C Mater. 2019, 7, 3399–3412. [Google Scholar] [CrossRef]
- Liang, R.; Yan, D.; Tian, R.; Yu, X.; Shi, W.; Li, C.; Wei, M.; Evans, D.G.; Duan, X. Quantum dots-based flexible films and their application as the phosphor in white light-emitting diodes. Chem. Mater. 2014, 26, 2595–2600. [Google Scholar] [CrossRef]
- Siddique, A.B.; Singh, V.P.; Pramanick, A.K.; Ray, M. Amorphous carbon dot and chitosan based composites as fluorescent inks and luminescent films. Mater. Chem. Phys. 2020, 249, 122984. [Google Scholar] [CrossRef]
- Liu, W.; Xu, S.; Li, Z.; Liang, R.; Wei, M.; Evans, D.G.; Duan, X. Layer-by-Layer Assembly of Carbon Dots-Based Ultrathin Films with Enhanced Quantum Yield and Temperature Sensing Performance. Chem. Mater. 2016, 28, 5426–5431. [Google Scholar] [CrossRef]
- Li, X.; Hu, Y. Luminescent films functionalized with cellulose nanofibrils/CdTe quantum dots for anti-counterfeiting applications. Carbohydr. Polym. 2019, 203, 167–175. [Google Scholar] [CrossRef]
- Khan, M.T.; Bhargav, R.; Kaur, A.; Dhawan, S.K.; Chand, S. Effect of cadmium sulphide quantum dot processing and post thermal annealing on P3HT/PCBM photovoltaic device. Thin Solid Films 2010, 519, 1007–1011. [Google Scholar] [CrossRef]
- Chen, L.; Lai, C.; Marchewka, R.; Berry, R.M.; Tam, K.C. Use of CdS quantum dot-functionalized cellulose nanocrystal films for anti-counterfeiting applications. Nanoscale 2016, 8, 13288–13296. [Google Scholar] [CrossRef] [PubMed]
- Krainer, S.; Smit, C.; Hirn, U. The effect of viscosity and surface tension on inkjet printed picoliter dots. RSC Adv. 2019, 9, 31708–31719. [Google Scholar] [CrossRef] [PubMed]
- Yuan, X.; Zhang, J.; Yang, H.; Yang, Q.; Li, L.; Zhang, M.; Huang, K. Quantum dots immobilized paper for specific and sensitive quantitation of Ni(II) by headspace photochemical vapor generation: Mechanism and application for RGB detection in tea fusion with a smartphone. Sens. Actuators B Chem. 2022, 372, 132686. [Google Scholar] [CrossRef]
- Clermont-Paquette, A.; Mendoza, D.A.; Sadeghi, A.; Piekny, A.; Naccache, R. Ratiometric Sensing of Glyphosate in Water Using Dual Fluorescent Carbon Dots. Sensors 2023, 23, 5200. [Google Scholar] [CrossRef]
- Wang, Q.; Yin, Q.; Fan, Y.; Zhang, L.; Xu, Y.; Hu, O.; Guo, X.; Shi, Q.; Fu, H.; She, Y. Double quantum dots-nanoporphyrin fluorescence-visualized paper-based sensors for detecting organophosphorus pesticides. Talanta 2019, 199, 46–53. [Google Scholar] [CrossRef] [PubMed]
- Castro, R.C.; Ribeiro, D.S.M.; Santos, J.L.M. Visual detection using quantum dots sensing platforms. Coord. Chem. Rev. 2021, 429, 213637. [Google Scholar] [CrossRef]
- Wang, L.; Bi, Y.; Gao, J.; Li, Y.; Ding, H.; Ding, L. Carbon dots based turn-on fluorescent probes for the sensitive determination of glyphosate in environmental water samples. RSC Adv. 2016, 6, 85820–85828. [Google Scholar] [CrossRef]
- Wu, J.; Chen, X.; Zhang, Z.; Zhang, J. “Off-on” fluorescence probe based on green emissive carbon dots for the determination of Cu2+ ions and glyphosate and development of a smart sensing film for vegetable packaging. Microchim. Acta 2022, 189, 131. [Google Scholar] [CrossRef]
- Yang, Y.; Tong, C.; Zhou, R.; Qin, Z.; Xu, J.; Liao, C.; Zhang, S.; Shi, S.; Guo, Y. Hinge-like paper-based dual-channel enzyme-free ratiometric fluorescent microfluidic platform for simultaneous visual detection of carbaryl and glyphosate. Food Chem. 2024, 431, 137127. [Google Scholar] [CrossRef]
- Han, T.; Kang, H.; Ye, S.; Yuan, Y.; Zhang, Y.; Dong, L. Ultra-stable fluorescent film sensor based on quantum dots for the real-time detection of Cu2+. Sci. Total Environ. 2020, 746, 141412. [Google Scholar] [CrossRef] [PubMed]
- Wang, H.; Chen, C.; Liu, Y.; Wu, Y.; Yuan, Y.; Zhou, Q. A highly sensitive and selective chemosensor for 2,4,6-trinitrophenol based on L-cysteine-coated cadmium sulfide quantum dots. Talanta 2019, 198, 242–248. [Google Scholar] [CrossRef] [PubMed]
- Yao, Z.; Coatsworth, P.; Shi, X.; Zhi, J.; Hu, L.; Yan, R.; Güder, F.; Yu, H.D. Paper-based sensors for diagnostics, human activity monitoring, food safety and environmental detection. Sens. Diagn. 2022, 1, 312–342. [Google Scholar] [CrossRef]
- Levine, M. Fluorescence-Based Sensing of Pesticides Using Supramolecular Chemistry. Front. Chem. 2021, 9, 616815. [Google Scholar] [CrossRef] [PubMed]


Disclaimer/Publisher’s Note: The statements, opinions and data contained in all publications are solely those of the individual author(s) and contributor(s) and not of MDPI and/or the editor(s). MDPI and/or the editor(s) disclaim responsibility for any injury to people or property resulting from any ideas, methods, instructions or products referred to in the content. |
© 2024 by the authors. Licensee MDPI, Basel, Switzerland. This article is an open access article distributed under the terms and conditions of the Creative Commons Attribution (CC BY) license (https://creativecommons.org/licenses/by/4.0/).