Article

Surface Tribological Properties Enhancement Using Multivariate Linear Regression Optimization of Surface Micro-Texture

1
College of Mechanical Engineering, Yangzhou University, Yangzhou 225009, China
2
School of Mechanical and Electrical Engineering, China University of Mining and Technology, Xuzhou 221116, China
*
Author to whom correspondence should be addressed.
Coatings 2024, 14(10), 1258; https://doi.org/10.3390/coatings14101258
Submission received: 4 September 2024 / Revised: 22 September 2024 / Accepted: 24 September 2024 / Published: 1 October 2024

Abstract

:
This work aims to provide a comprehensive understanding of the structural impact of micro-texture on the properties of bearing capacity and friction coefficient through numerical simulation and theoretical calculation. Compared to the traditional optimization method of single-factor analysis (SFA) and orthogonal experiment, the multivariate linear regression (MLA) algorithm can optimize the structure parameters of the micro-texture within a wider range and analyze the coupling effect of the parameters. Therefore, in this work, micro-textures with varying texture size, area ratio, depth, and geometry were designed, and their impact on the bearing capacity and friction coefficient was investigated using SFA and MLA algorithms. Both methods obtained the optimal structures, and their properties were compared. It was found that the MLA algorithm can further improve the friction coefficient based on the SFA results. The optimal friction coefficient of 0.070409 can be obtained using the SFA method with a size of 500 µm, an area ratio of 40%, a depth of 5 µm, and a geometry of the slit, having a 10.7% reduction compared with the texture-free surface. In comparison, the friction coefficient can be further reduced to 0.067844 by the MLA algorithm under the parameters of size of 600 µm, area ratio of 50%, depth of 9 µm, and geometry of the slit. The final optimal micro-texture surface shows a 15.6% reduction in the friction coefficient compared to the texture-free surfaces and a 4.9% reduction compared to the optimal surfaces obtained by SFA.

1. Introduction

Tribology is the study of the mechanisms of friction and wear between the surfaces of objects, encompassing many subject areas. It is estimated that over 80% of industrial equipment damage is attributable to friction and wear [1,2,3]. Furthermore, energy consumption accounts for 30% to 50% of the total energy consumption around the world, resulting in significant economic losses estimated at hundreds of billions of USD [4]. The improvement of tribology properties is of great practical value to engineering equipment, as it can increase service life, save energy, and improve productivity [5,6].
The general tribological theory assumes that superior tribological performance yields smoother surfaces [7]. Consequently, previous investigations focused on enhancing frictional properties by reducing surface roughness [8,9]. However, recent studies have demonstrated that rough surfaces with micro-texture can also exhibit excellent tribological properties [10,11]. Zhang et al. conducted disc-to-disc friction and wear experiments to compare the friction coefficients of surfaces with and without textures, proving that surface textures can effectively reduce friction coefficients and wear rates [12]. However, on the one hand, a unified understanding of the critical parameters for micro-texture design is yet to be achieved, and the parameters that are commonly considered include the geometry, size, depth, area ratio, local micro-texture, etc. [13,14]. Chen et al. investigated the influence of the micro-texture dimensions on the surface tribological behaviors, indicating that the friction coefficient increased with the smaller size and larger distribution density of the micro-texture [15]. Furthermore, Xin et al. prepared 25 groups of surfaces with different distribution densities of micro-textures, observing that the smallest wear rate was obtained when the micro-textures’ diameter and spacing were 30 and 150 µm, respectively [16]. Therefore, performance, including wear, energy consumption, service life, etc., can be regulated by designing the size, area ratio, depth, and geometry of the surface micro-textures. These advantages can become more evident in a hydrodynamic lubrication environment, since micro-textures provide sufficient space for lubricant flow [17,18,19]. On the other hand, numerous variations of micro-texture brought difficulties to micro-texture design. For instance, He et al. analyzed the tribological properties between surfaces with round, square, and ring micro-textures and smooth cemented carbide surfaces, finding that the surface with round micro-textures showed a smaller friction coefficient, with a reduction of 20% compared with smooth surfaces [20]. In contrast, Wang et al. compared the friction and wear properties of texture-free surfaces and square, circular, and triangle micro-texture surfaces, indicating that the square micro-texture exhibited the optimal surface properties [21]. The optimal micro-texture geometry obtained by He et al. and Wang et al. was different because the investigations were based on a few types and a small range of parameters. Additionally, many other similar studies have been reported, but they only focus on limited parameters and values to optimize the texture [22,23,24,25]. In contrast, the coupling effect of multiple parameters and efficient methods for optimizing values in an extensive range are still unknown.
In a short summary, recent investigations focused on limited types and ranges of variants, ignoring the coupling effect of structural parameters on the bearing capacity and friction coefficient. Therefore, in order to gain a more comprehensive understanding of the structural parameter’s impact on the micro-texture on the properties, this article broadens the types and range of parameters optimized, including the micro-texture size, area ratio, depth, and geometry, and compares the optimization results of the single-factor analysis (SFA) method and a multivariate linear regression (MLA) algorithm. The coupling effect and the importance of the parameters to the surface tribological behavior were investigated as well. After optimization, the optimal friction coefficient obtained by the MLA method had a further 4.9% reduction compared with that obtained by the SFA method.

2. Simulation Model Formulation

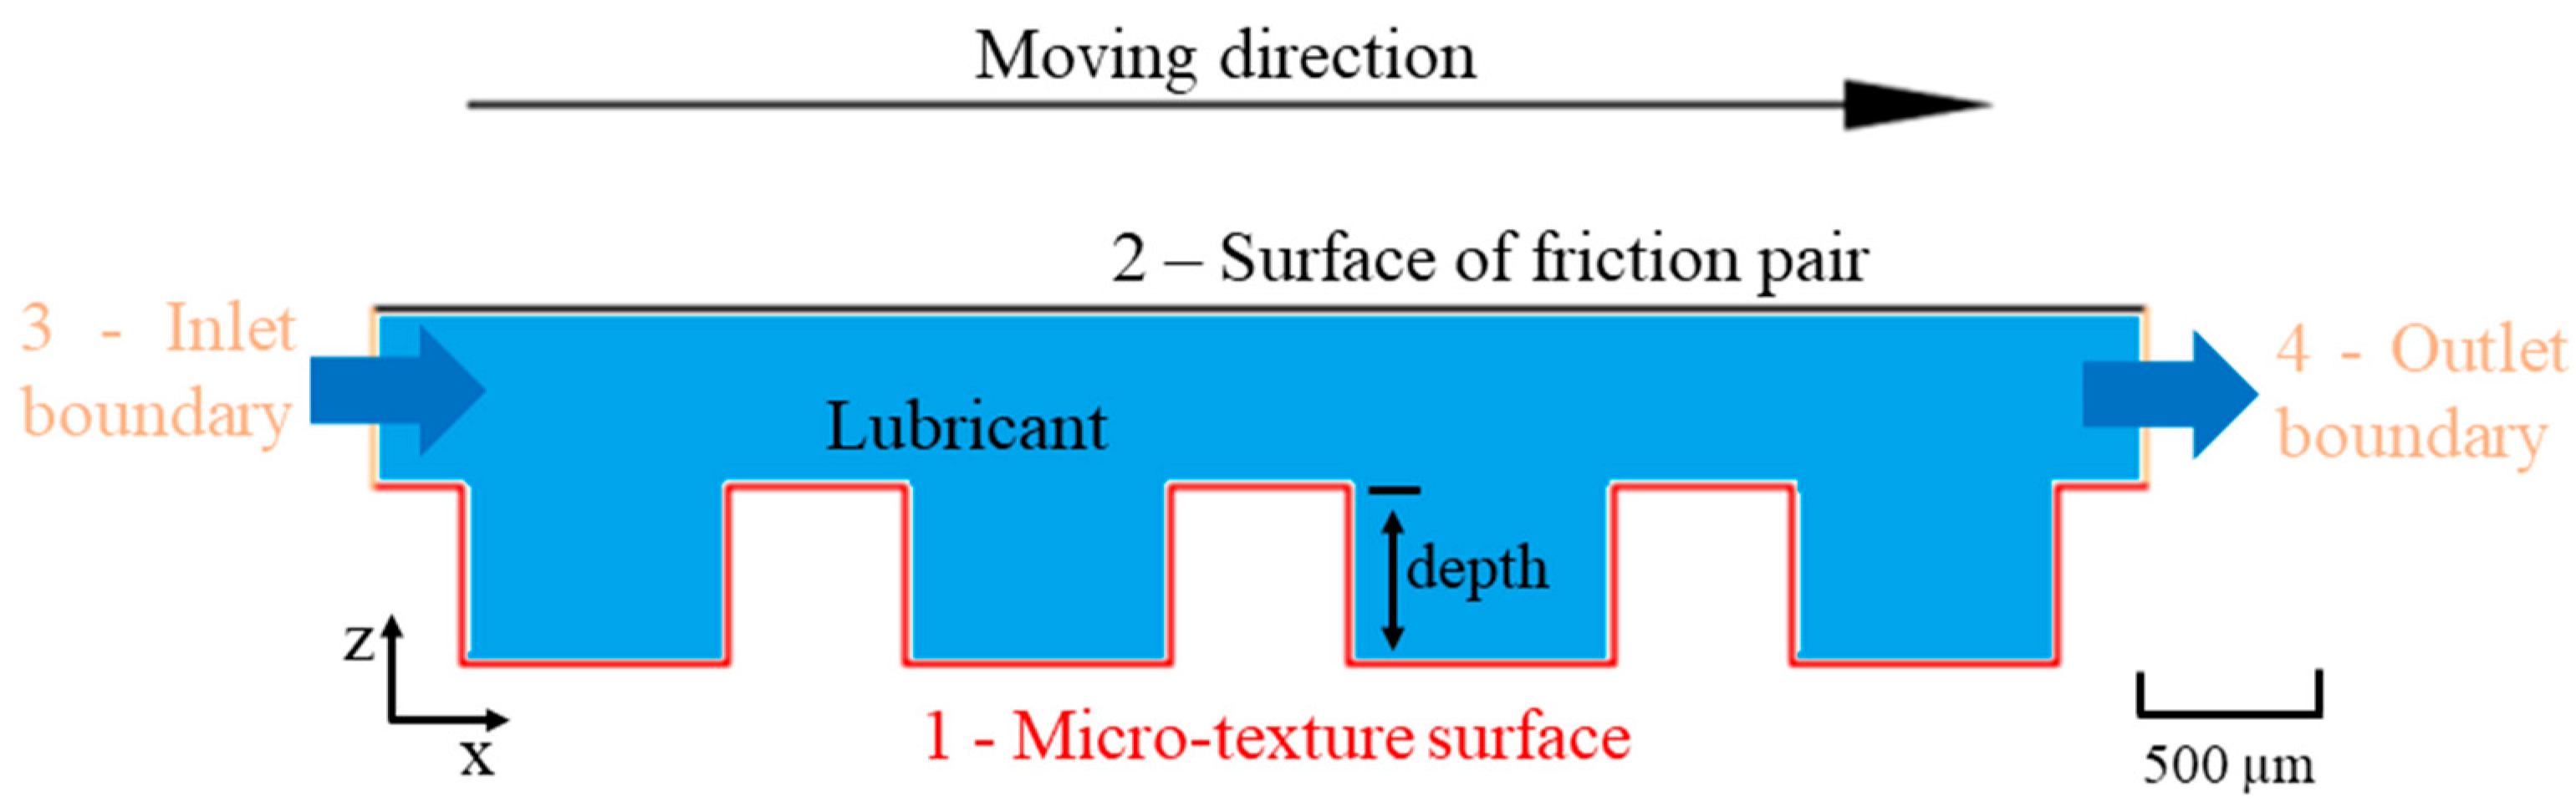
2.1. Problem Definition and Governing Equation

Figure 1a–d shows the two-dimensional (2D) model of surfaces with different micro-textures, including square micro-texture surface (Sq), rectangular micro-texture surface (Re), circular micro-texture surface (Ci) and slit micro-texture surface (Sl). The square micro-texture was composed of 16 square notches with a width of b on the substrate surface. The micro-textures were uniformly distributed on the substrate, and the area ratio between the total micro-textures and the substrate was denoted as area ratio S. Therefore, the relationship between the parameters a, b, and S can be expressed as Equation (1). Similarly, the rectangular, circular, and slit micro-textures were uniformly distributed on the substrate surface, with sizes of c, r, and d, where r was the radius of the circular micro-texture, and d was the width of the slit micro-texture, whose length was denoted as l. Notably, the length of the square micro-texture was considered as the base to guarantee the independence of the size and area ratio. The size of other micro-textures can be calculated via Equations (1)–(4).
a = 16 b 2 S
c = b 2 1.5
r = b 2 π
l = 4 b
The micro-texture surfaces were coated with lubricants, and sliding friction occurred in the horizontal direction with friction pair. The lubrication model was established based on the Navier–Stokes (N–S) equation to solve the fluid domain. The following assumptions were considered:
  • The friction pair was rigid and had no deformation.
  • The fluid was incompressible with constant viscosity and density, and the volumetric forces were ignored.
  • The influence of the heat generation by friction was ignored, and the temperature was kept ambient.
  • The fluid was in laminar and constant mode.
  • Other basic assumptions of the N–S equations [26].
  • Therefore, the N–S equations and the continuity equation can be expressed as follows:
X   direction         ρ u u x + v u y + w u z = p x + η 2 u x 2 + 2 u y 2 + 2 u z 2
Y   direction         ρ u v x + v v y + w v z = p x + η 2 v x 2 + 2 v y 2 + 2 v z 2
Z   direction         ρ u w x + v w y + w w z = p x + η 2 w x 2 + 2 w y 2 + 2 w z 2
u x + v y + w z = 0         d
where u, v, and w represent the velocity of the fluid along the x, y, and z directions, respectively. ρ and η represent the density and dynamic viscosity of the lubricant, respectively. p represents the oil film pressure.

2.2. Boundary Conditions and Solution Method

The boundary conditions of the micro-texture fluid domain were considered based on the work performed by Liu et al. [27]. As shown in Figure 2, number 1 represents the fixed micro-texture surface, number 2 represents the smooth surface of the friction pair that moves at a velocity of 5 m/s, and numbers 3 and 4 represent the inlet and outlet boundary of pressure.
The texture models were established in Solidworks (2024) and then imported to Ansys Fluent. The automatic meshing function was employed in Fluent (2022 R1) with a mesh tetrahedral and a mesh growth rate of 1.2. Since the Reynolds number of the fluid in the flow domain was low, the laminar flow mode was employed. The fluid density was set as 895 kg/m3, and the dynamic viscosity was set to 0.0135145 Pa.s. The pressure with the second order and the momentum with the quick difference were coupled via the Simplec method.

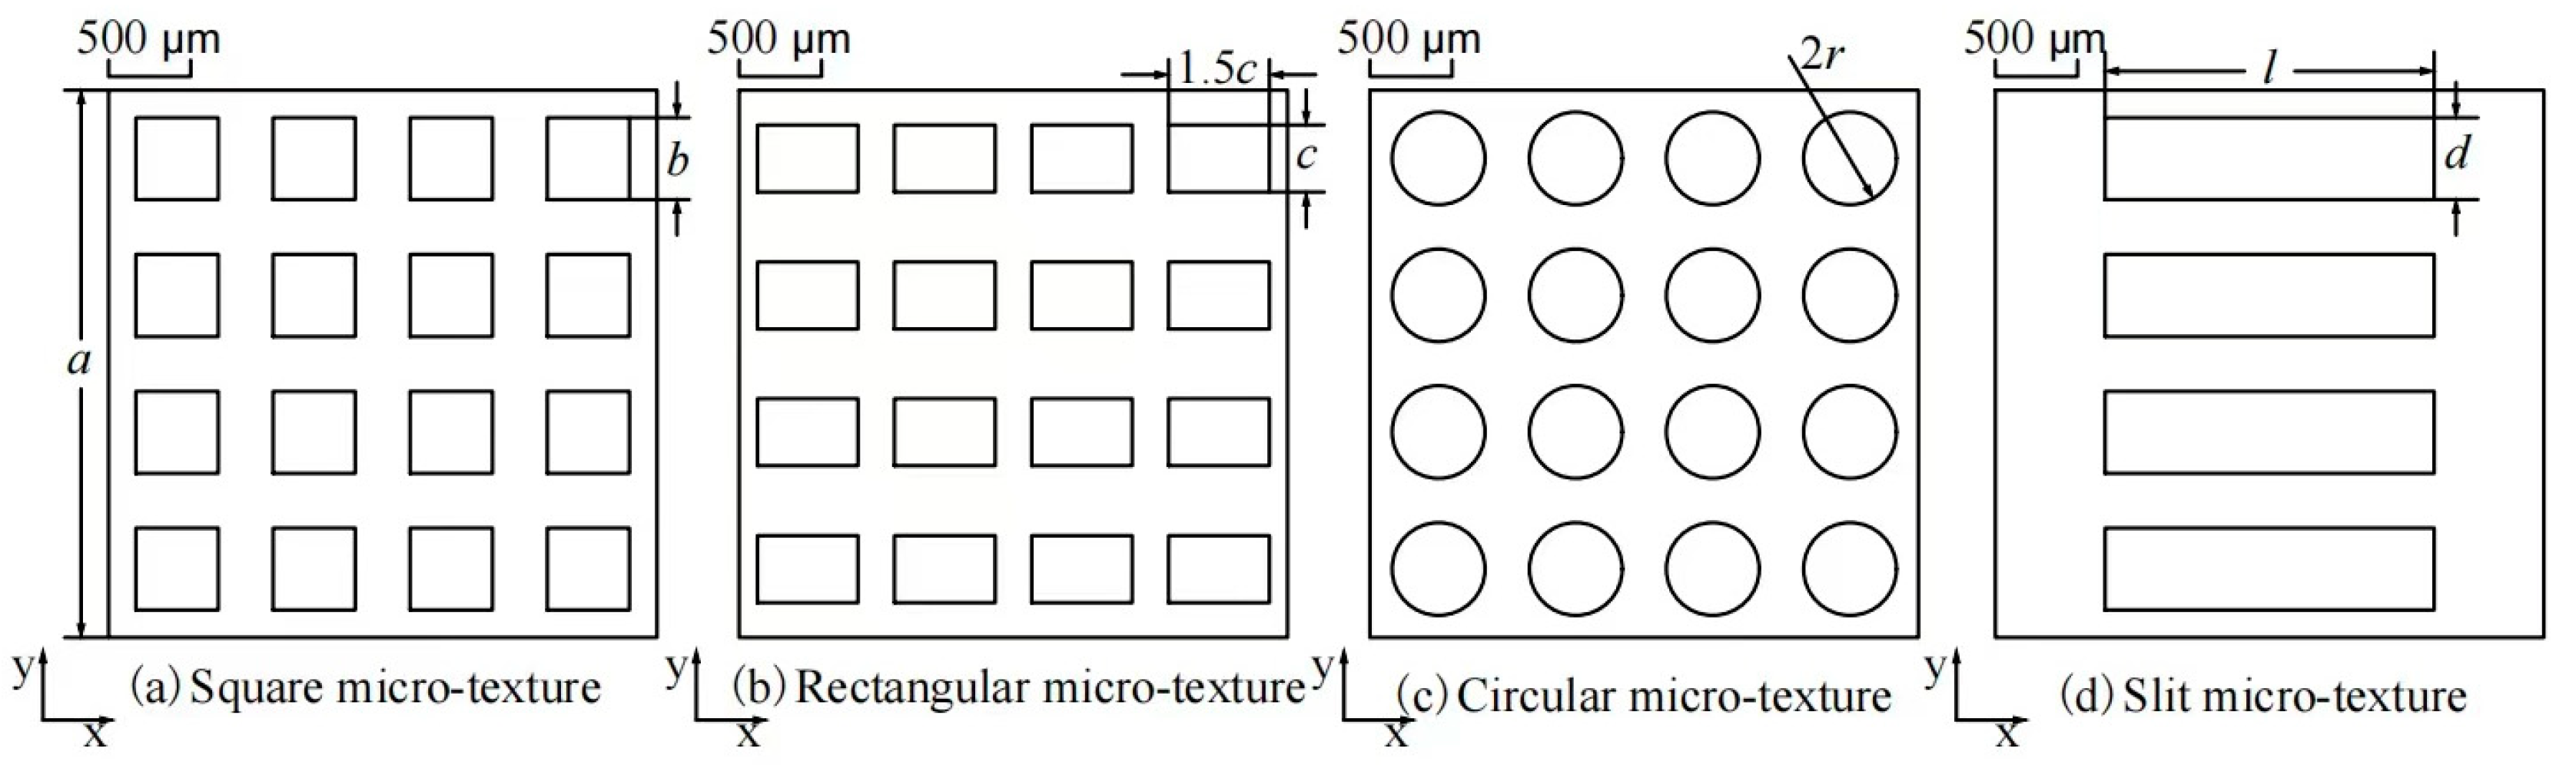
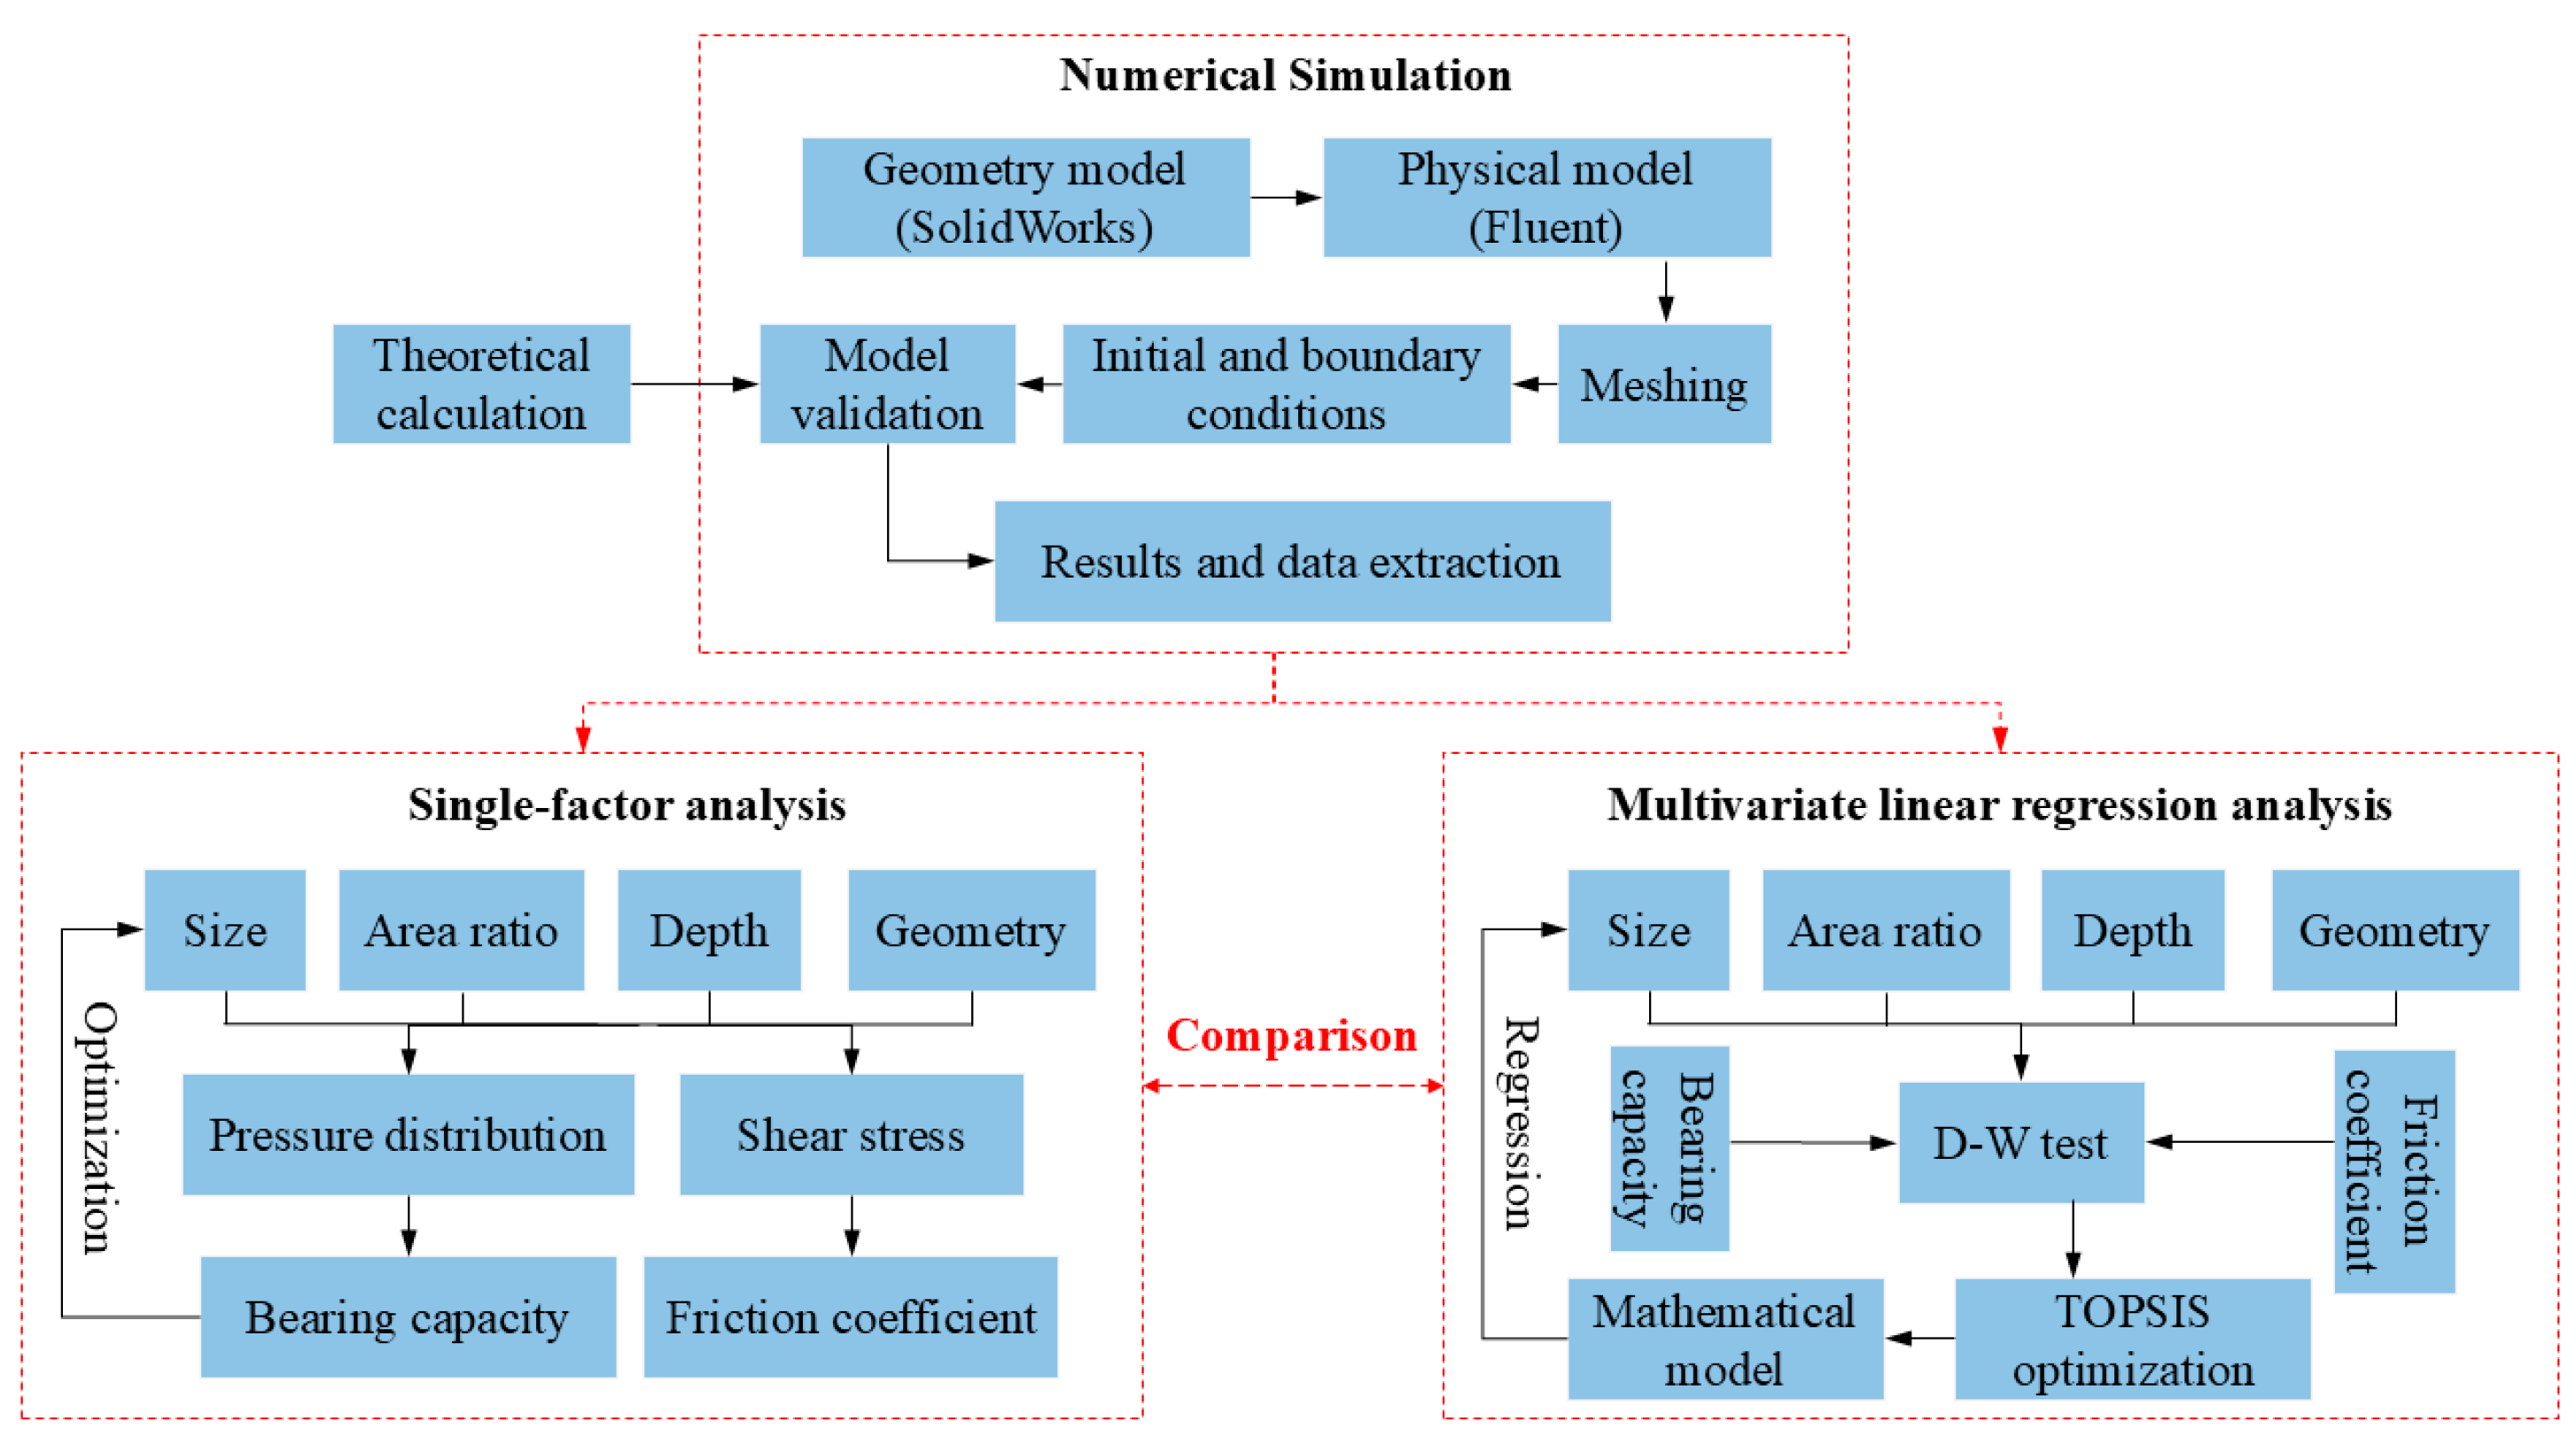
2.3. Single-Factor Analysis Strategy

The parameters, including micro-texture size, area ratio, depth, and geometry, were considered. According to the literature, the most common method and parameters were orthogonal arrays of micro-texture with diameters of 0–300 µm, area ratios of 0%–64%, depths of 0–12 µm, and rectangular, circular, triangular, and rhombic geometries [19,20,21,22]. Therefore, 9, 5, and 7 values of size, area ratio, and depth, as well as 4 types of geometry, were chosen for SFA, as shown in Table 1. In the event of a change to any one of the parameters presented in the table, the remaining three parameters will remain unaltered.
The hydrodynamic pressure effect is primarily observed in the vicinity of the micro-pit. As the lubricant flows into the micro-pit, a diverging wedge-shaped gap is formed due to the increased distance between the friction surfaces, resulting in a negative pressure in the diverging region. Conversely, when the lubricant flows out of the micro-pit, the distance between the surfaces decreases, leading to a converging wedge-shaped gap and a sudden increase in positive pressure in the converging region. It is noteworthy that the maximum value of the positive pressure is typically higher than the minimum value of the negative pressure, which results in an asymmetric pressure distribution at the edges of the micro-pit. This, in turn, generates an additional loading effect [18].
The bearing capacity of the lubricant film on the micro-texture surface can be calculated by an area-weighted integral of the positive pressure on the upper film surface, while an area-weighted integral of the shear stress on the moving surface along the x-direction of the lubricating film can determine the friction force. The corresponding equations can be expressed as follows:
F z = P   d x   d y
F x = τ   d x   d y
μ = F x F z
where Fz and Fx are the bearing capacity of the lubricant film along the z- and x-directions, P is the pressure of the upper film surface, τ is the fluid shear stress, and µ is the friction coefficient.

2.4. Multivariate Linear Regression Optimization Strategy

Since the SFA method was labor-intensive, time-consuming, and less effective in the optimization of numerous parameters, the MLA algorithm was employed to investigate the influence of the micro-texture variations on the surface tribological properties. In comparison to other statistical techniques, MLA does not require the data to adhere to a normal distribution and can be employed as an initial analysis and a baseline indicator.
The data obtained in the single-factor simulation (1305 sets in total) were utilized in SPSS (SPSS26) (Statistical Package for the Social Sciences) optimization with MLA [28]. The parameter autocorrelation was initially examined by the Durbin–Watson test (D-W test) to guarantee the effectiveness of the model prediction [29]. Next, the relationship between the parameters and the properties can be expressed by a multivariate linear regression equation,
Y = β 0 + β 1 X 1 + β 2 X 2 + β 3 X 3 + β 4 X 4 + ε
where Y denotes the surface property of bearing capacity or friction coefficient, X1, X2, X3, and X4 denote the size, area ratio, depth, and geometry, β1, β2, β3, and β4 denote the regression coefficients of the variables, and ε denotes the random disturbance. Finally, the Technique for Order Preference by Similarity to Ideal Solution (TOPSIS) was employed to determine the global optimal solution out of multiple solutions [30]. In the context of the Scientific Platform Serving for Statistics Professional (SPSSPRO), the TOPSIS method represents a methodology employed for the assessment of the degree of superiority or inferiority of a solution [28]. In spatial stochastic simulations, multiple potential solutions are typically generated. The superior–inferior solution distance method can be employed to ascertain the relative merits of the solutions by calculating the distances between them. This method can assist in identifying the optimal solution or in selecting between multiple solutions [31]. It offers an objective approach to evaluating solutions, facilitating the determination of the best solution or an effective comparison between multiple solutions, enhancing the accuracy and reliability of simulation results, and circumventing subjective bias.
In order to gain a deeper understanding of regression analyses, this study employs two key statistical validation methods: the coefficient of determination (R2) and the correlation coefficient (R). The R2 value indicates the proportion of the variance in the dependent variable that can be explained by the independent variable, and it is an essential indicator for evaluating the explanatory power of the model. The correlation coefficient, on the other hand, quantifies the strength of the linear relationship between the parameters and the surface properties, as well as its direction. The detailed investigation procedure is shown in Figure 3.

3. Single-Factor Simulation Results and Discussion

3.1. Model Validation

The texture-free (Tf) surfaces with lengths of 1264.9 µm, 2529.8 µm, and 6325 µm were selected for the model validation. The length was calculated based on the square micro-texture model with an area ratio of 10% and texture lengths of 100, 200, and 500 µm. The shear stresses obtained by the simulation and theoretical calculation were compared. The equation for the shear stress of the texture-free surface is presented below [27]. The comparison results are shown in Table 2. The theoretical shear stresses for the three surfaces were all 8446.56 Pa, while the simulation results were 8545.37, 512.18, and 8475.20 Pa. The corresponding deviations were 1.17%, 0.78%, and 0.34%. The maximum deviation of 1.17% was within the allowable range, proving that the simulation model was accurate.
τ = η d u d z = η U h 0
where τ is the shear stress, η is the dynamic viscosity of the lubricant, du/dz is the velocity gradient, U is the ratio of the sliding speed, and h0 is the film thickness.

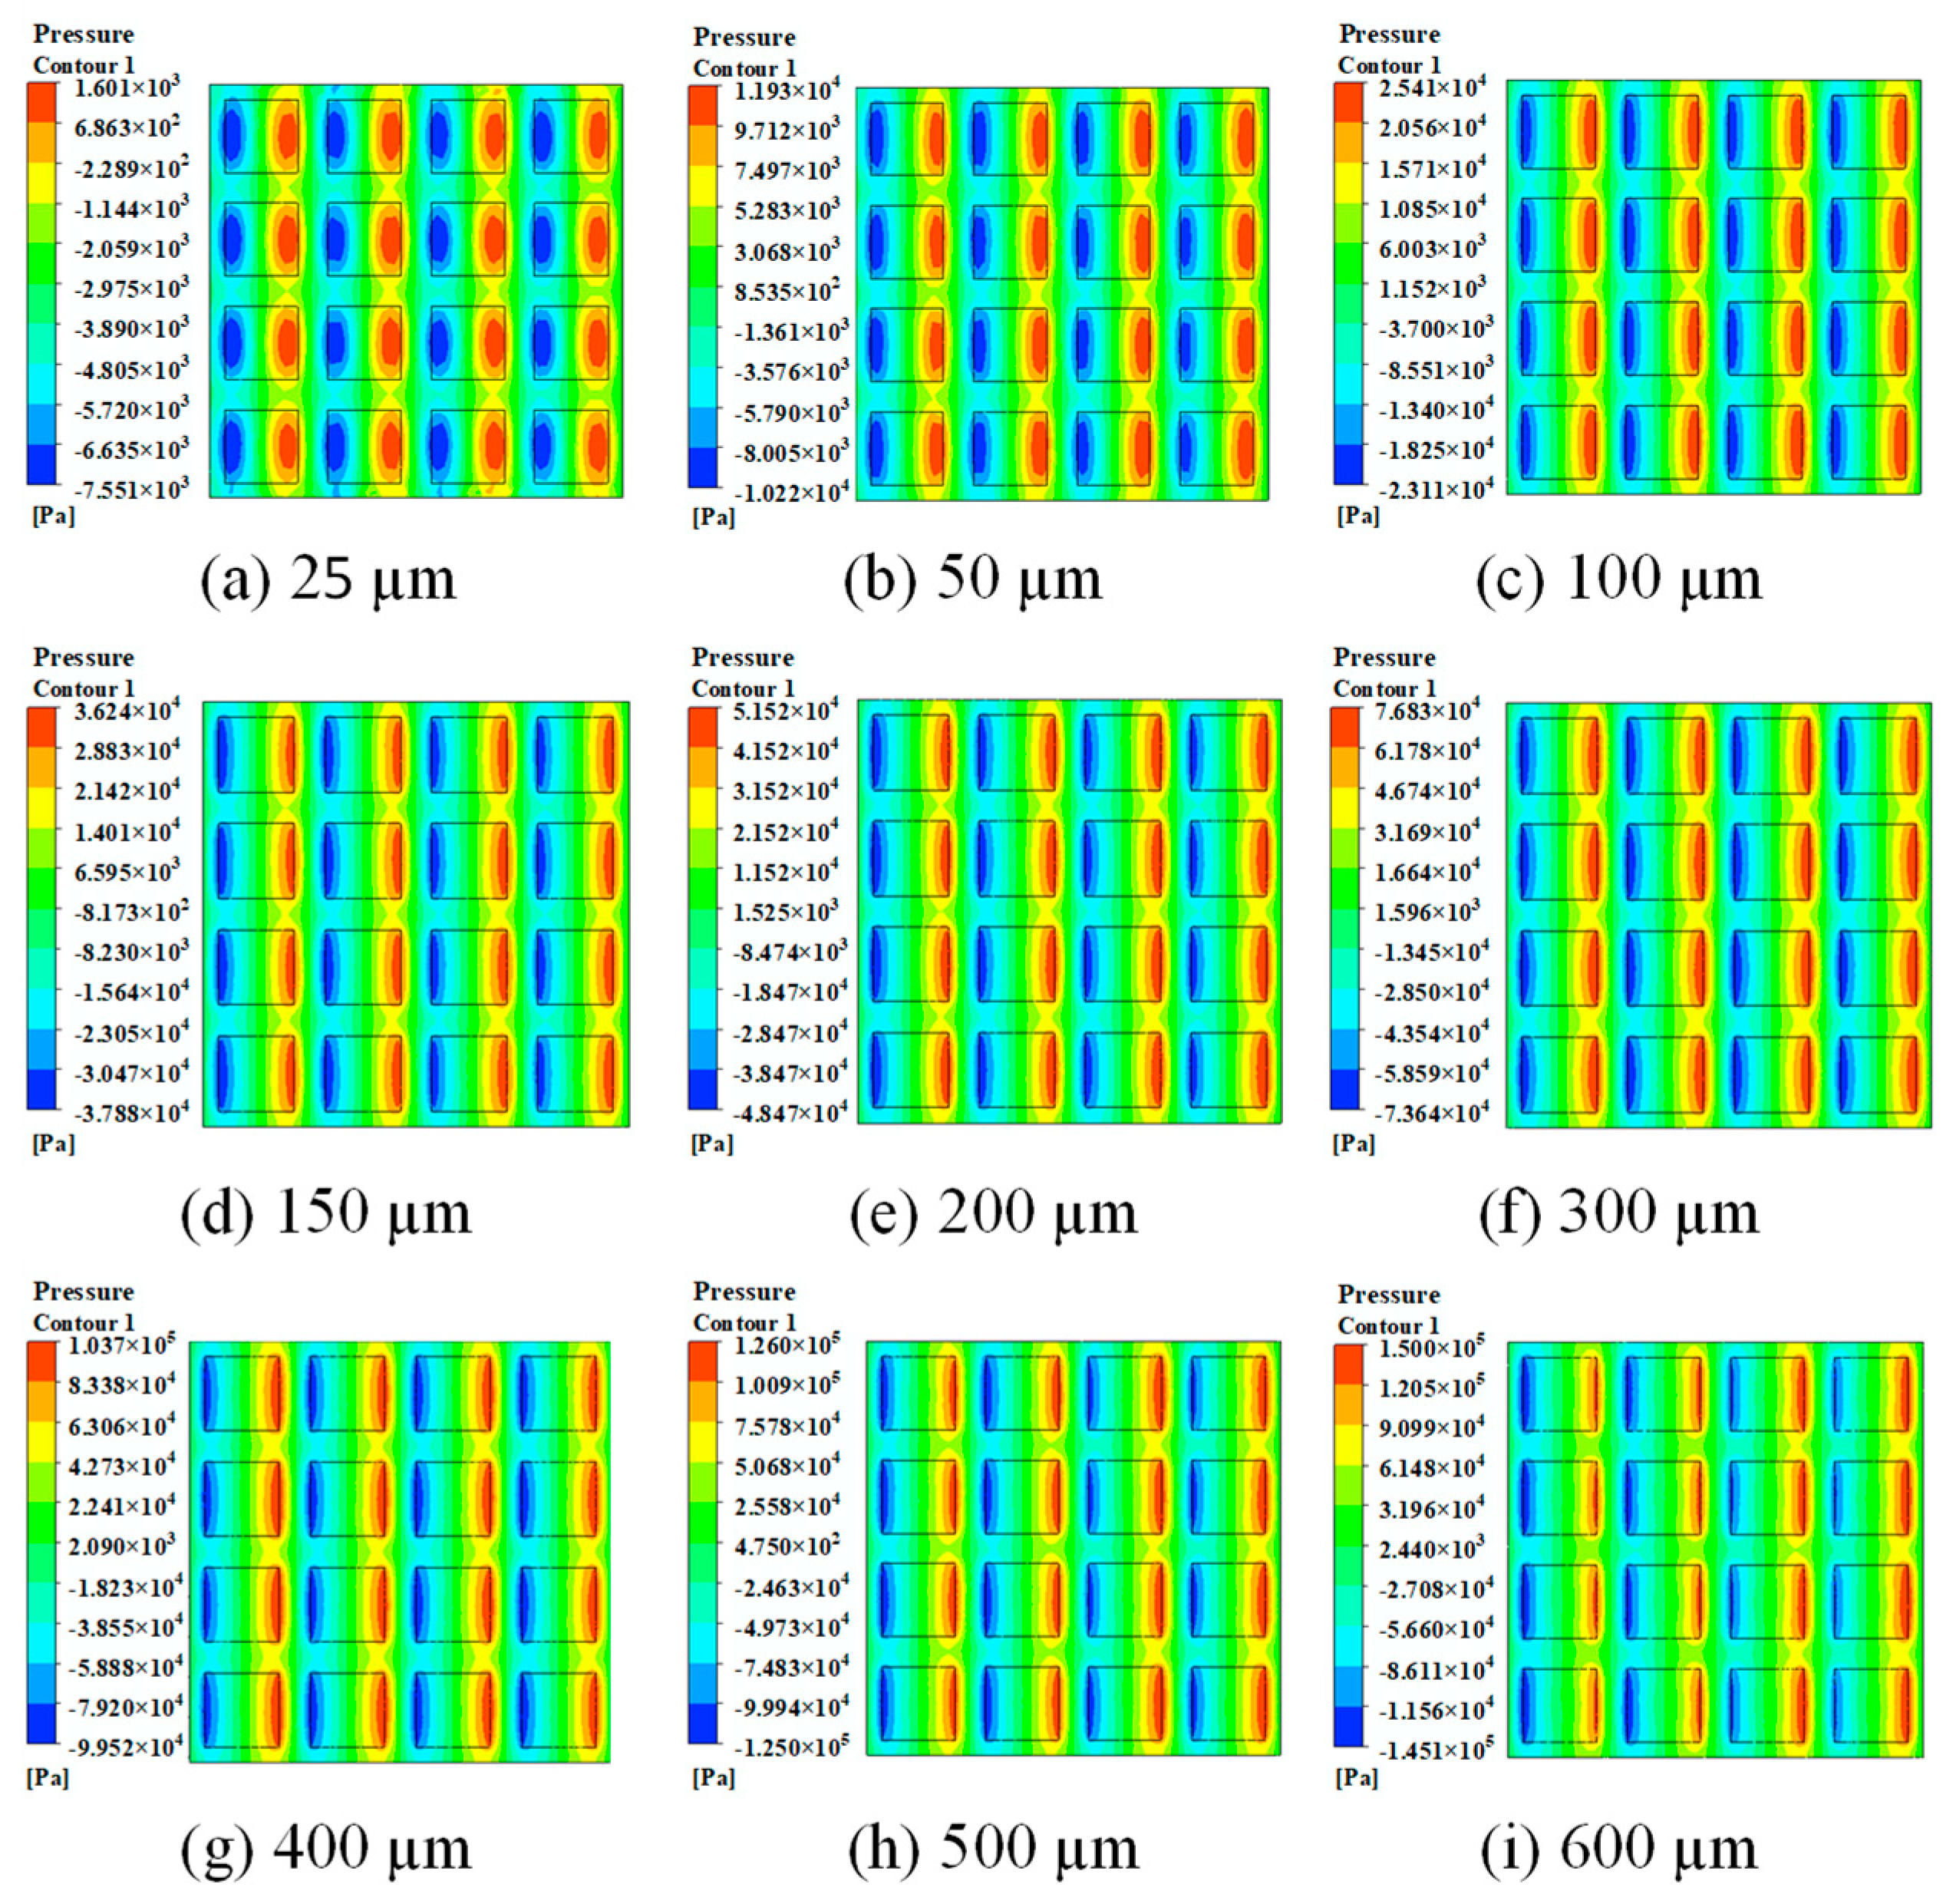
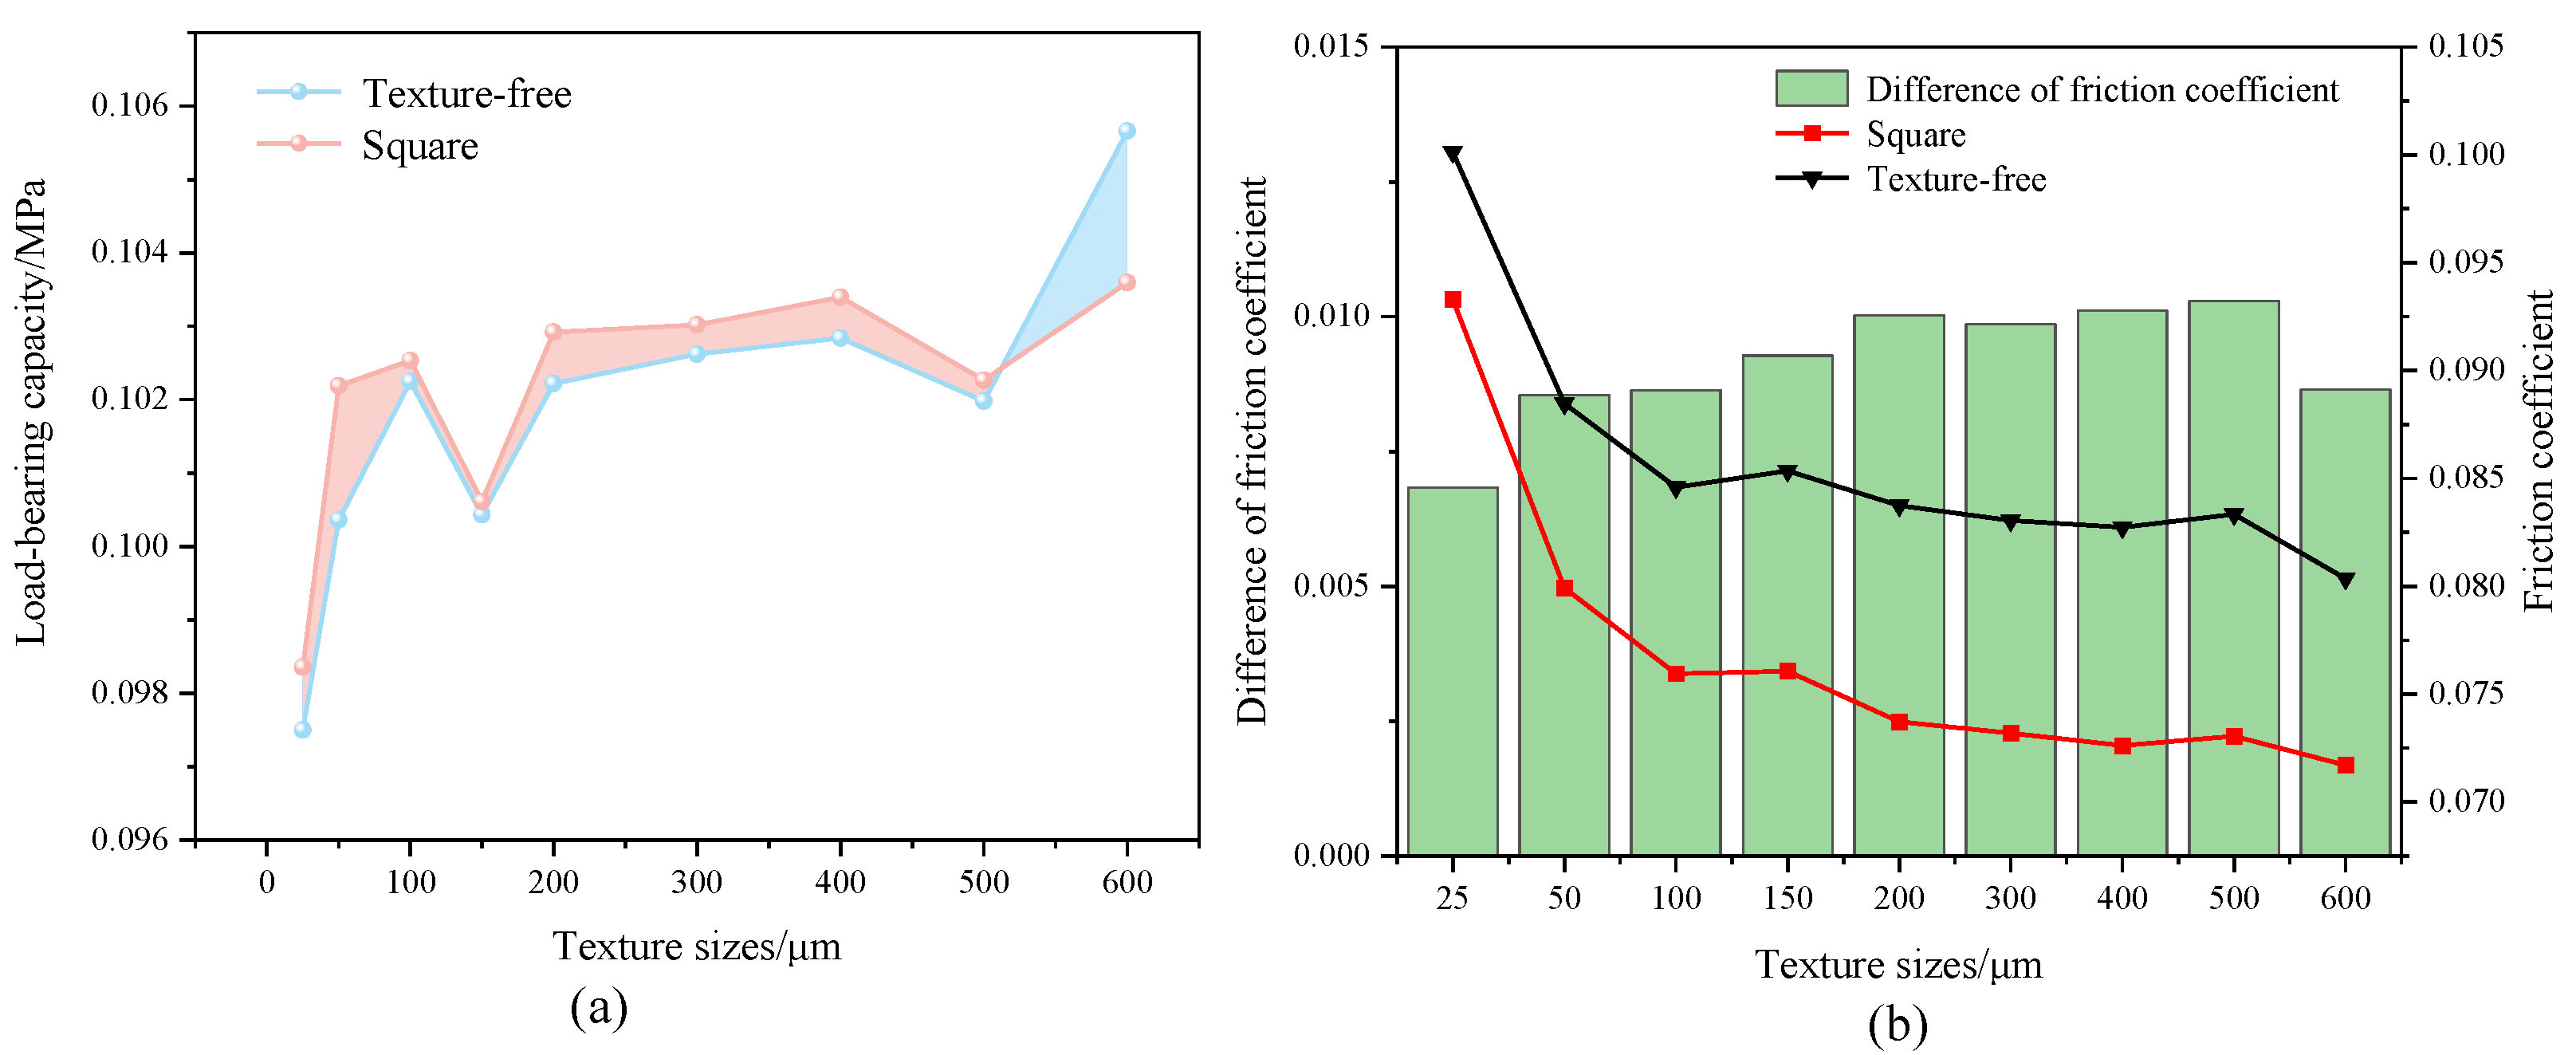
3.2. Influence of Micro-Texture Size on the Surface Tribological Properties

Th texture-free and square micro-texture surfaces with a depth of 5 µm and an area ratio of 50% were chosen. Figure 4 presents the oil film pressure distribution on the square micro-texture surfaces with varying sizes. It was observed that the peak oil film pressure escalates as the size enlarges. After calculation, the influence of the micro-texture size on the surface bearing capacity can be obtained, as shown in Figure 5a. The x coordinate denoted the length of the square micro-texture surface, while the size of the texture-free surface was calculated based on Equation (1). The bearing capacity variation of both surfaces exhibited a similar trend, corresponding to an increase within the length ranges from 25 µm to 100 µm, 150 µm to 400 µm, and 500 µm to 600 µm, and to a decrease within the length ranges from 100 µm to 150 µm, and 400 µm to 500 µm. The maximum and minimum values were obtained at the lengths of 600 µm and 25 µm, respectively. The surface with the square micro-texture had a higher load-bearing capacity than the texture-free surface when the size was below 500 µm, while it was lower when the size exceeded 500 µm, as the orange and blue regions show.
The influence of the micro-texture size on the friction coefficient is shown in Figure 5b. Similarly, the friction coefficient variations of both surfaces showed a similar trend within the specific length range as the bearing capacity variation. The maximum and minimum friction coefficient were also obtained at 600 µm and 25 µm, respectively. Notably, the friction coefficients of the square micro-texture surface were smaller than those of the texture-free surfaces, indicating that the square micro-texture surface had the best friction properties and bearing capacity with a size of 500 µm.
The phenomena shown above can be explained by the fact that when the surfaces of the friction pair moved relative to each other, the viscous force of the lubricant could drive the fluid between the micro-texture surface to move and thereby form a wedge-shaped gap. This flow behavior produced a hydrodynamic effect, which, in turn, increased the bearing capacity and reduced the friction coefficient. The amount of lubricant along the micro-texture surface increased with the increasing micro-texture size, enhancing the fluid hydrodynamic effect. This may be the reason for the increase in the bearing capacity and decrease in the friction coefficient with the increasing micro-texture size. It was noteworthy that sudden drops in micro-texture load-carrying capacity were observed at 150 µm and 500 µm texture sizes (see Figure 5a), which may be attributed to the change in local flow behavior caused by the size effect, breaking the oil film. When the size was small, the size effect was evident, and the local flow behavior was unstable. Thus, in some cases, the load-bearing capacity may have decreased. The size effect was weakened, and the flow behavior became stable with the increased size. Therefore, the drop at 500 µm was smaller than the drop at 150 µm.

3.3. Influence of Micro-Texture Area Ratio on the Surface Tribological Properties

Since the optimal bearing capacity and friction coefficient were obtained for the square micro-texture surface with the size of 500 µm, square micro-texture surfaces with different area ratios with a depth of 5 µm and a length of 500 µm are investigated in this section.
Figure 6 presents the oil film pressure distribution on square micro-texture surfaces with varying area ratios. It was observed that as the area ratios of the square texture escalated, the oil film pressure initially rose and, subsequently, diminished. Figure 7a shows the impact of the area ratio on the bearing capacity for the oil film on the square micro-texture surfaces and texture-free surfaces. Regarding the square micro-texture surfaces, the bearing capacity of the oil film increased as the area ratio rose from 10% to 30%, followed by a decrease from 30% to 50%, reaching its maximum and minimum at area ratios of 30% and 10%, respectively. Regarding the texture-free surfaces, the bearing capacity initially increased, followed by a decrease and then an increase. The maximum and minimum were obtained at the area ratios of 30% and 40%, respectively. However, the friction coefficient variation showed a different trend with the increased area ratio, as shown in Figure 7b. The friction coefficient initially decreased, followed by increasing and then decreasing for the texture-free surfaces, while for the square micro-texture surfaces, it continuously decreased. The maximum and minimum of both surfaces were obtained at the area ratios of 10%, 50%, 40%, and 30%, respectively. However, the maximum difference in the friction coefficient between the surfaces was obtained at the area ratio of 40%. This was because, on the one hand, the distribution of the micro-texture became denser with the increased area ratio, thus enhancing the hydrodynamic effect, resulting in the increased bearing capacity. On the other hand, the improved integrity of the oil film can reduce the direct contact between the friction pair and, thus, reduce the friction coefficient. However, the lubricant film could become unstable when the distribution of micro-texture becomes too dense, leading to a reduction in the bearing capacity.

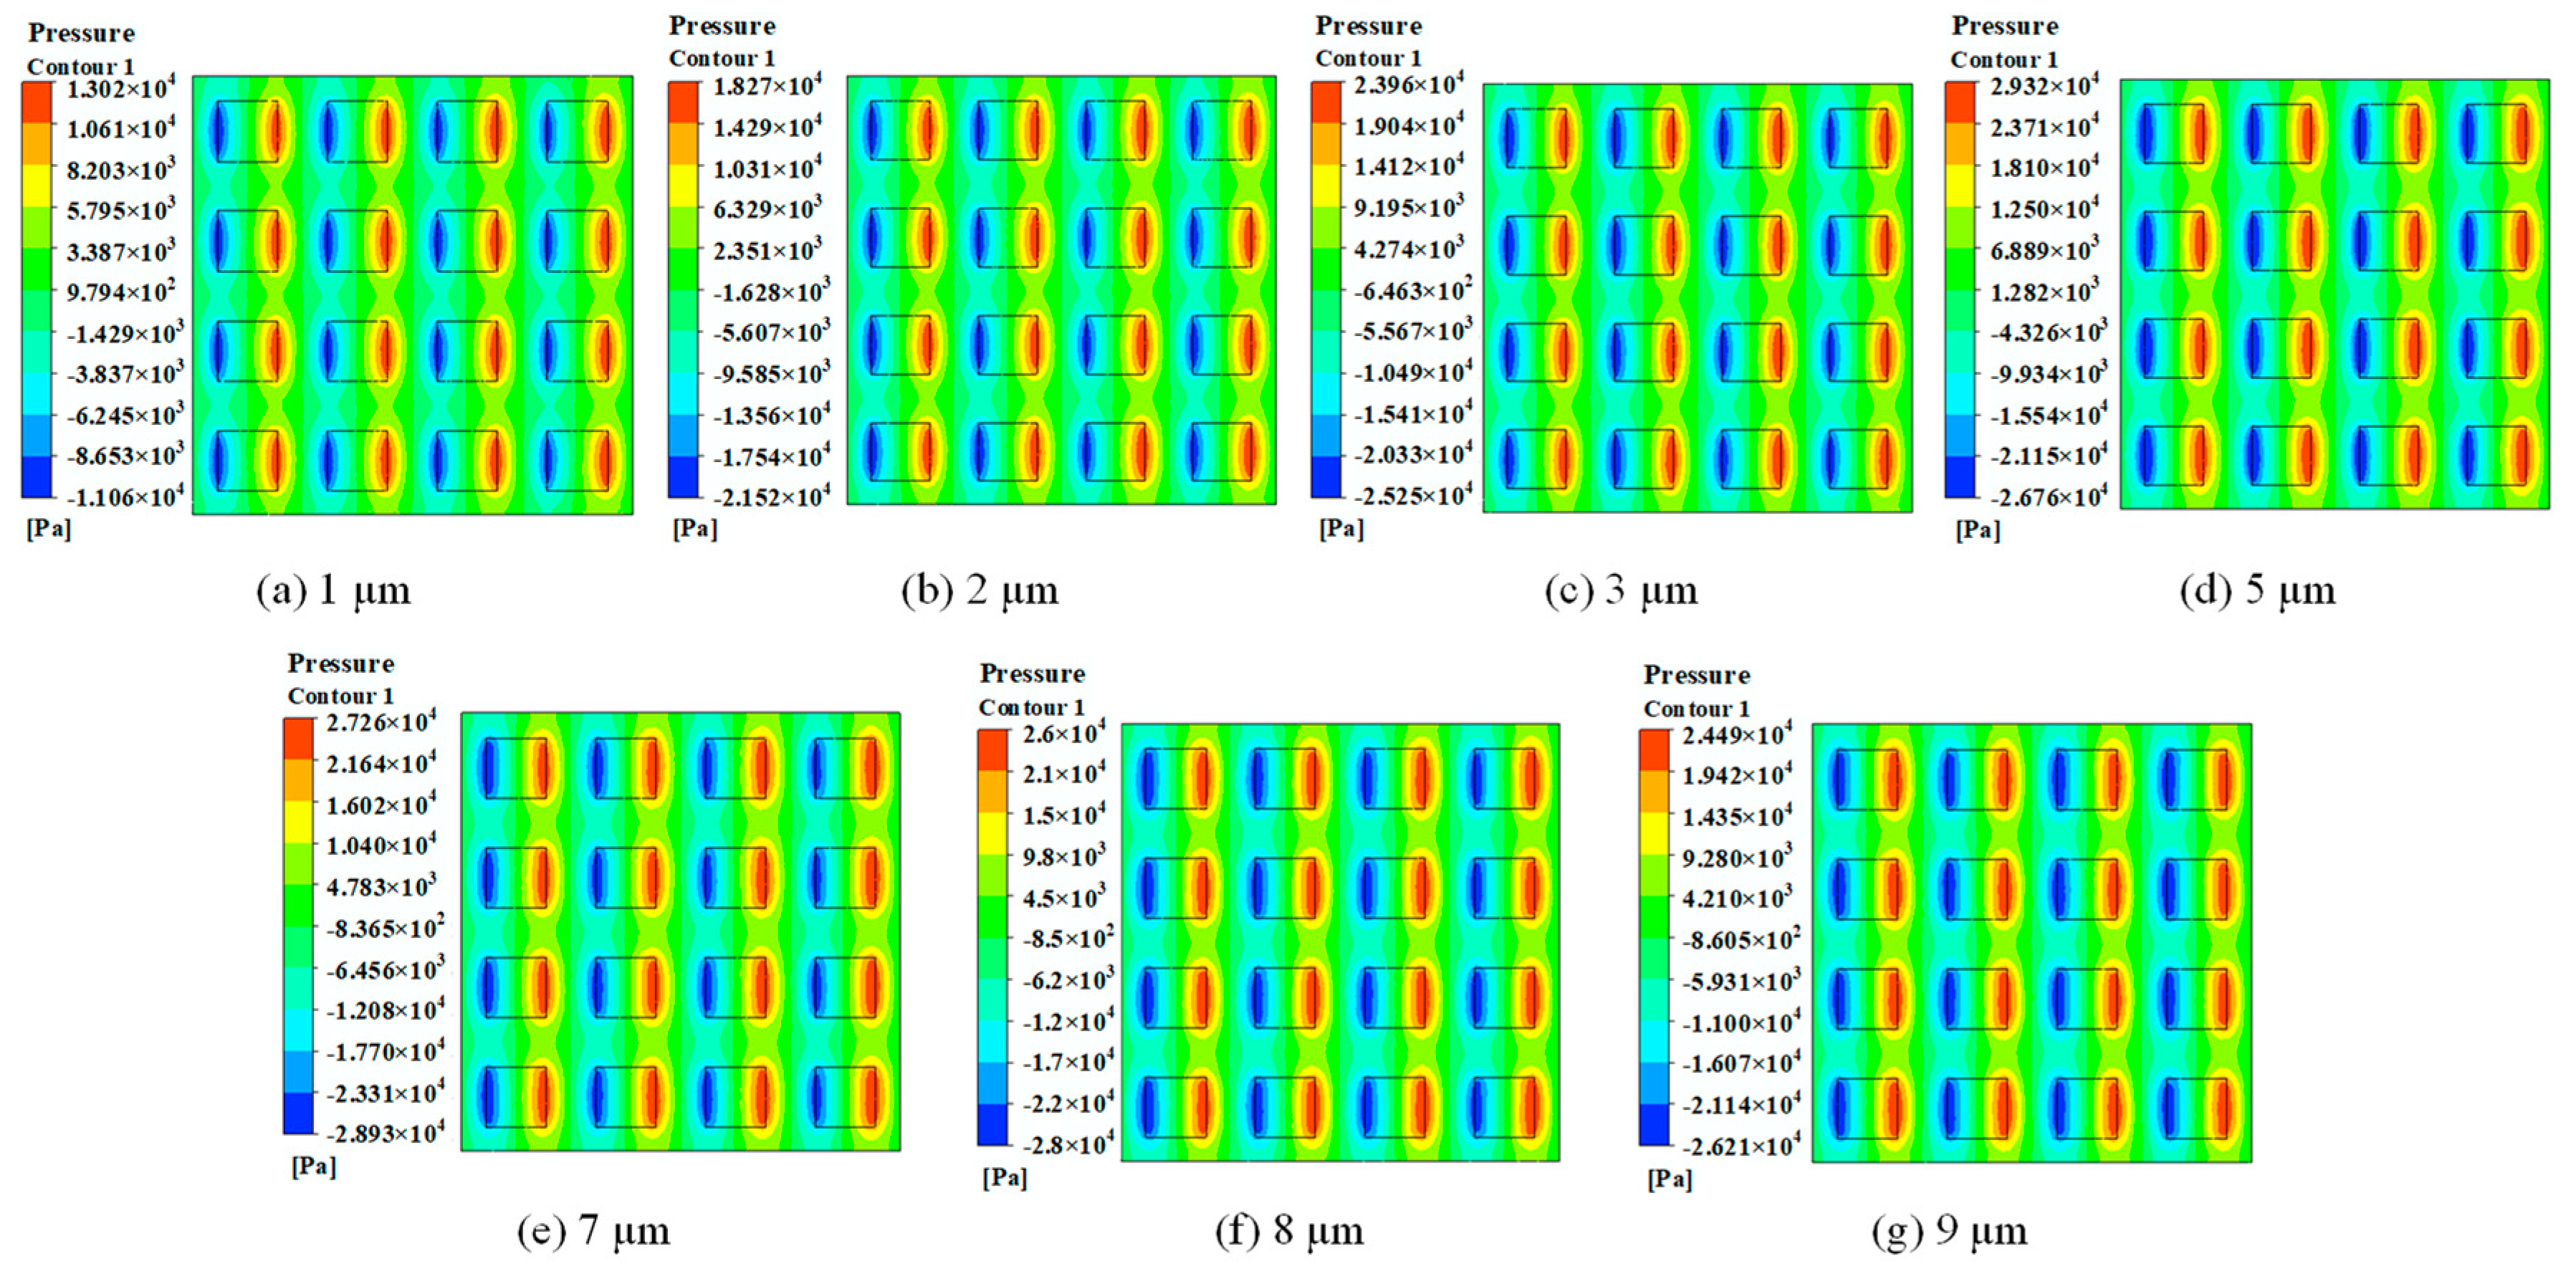
3.4. Influence of Micro-Texture Depth on the Surface Tribological Properties

Similarly, square micro-texture and texture-free surfaces with an area ratio of 40% and a length of 500 µm are discussed in this section.
Figure 8 illustrates the oil film pressure distribution on the square micro-texture surfaces with varying depths. The oil film pressure reached its maximum at the outlet boundary of the micro-texture and reached its minimum at the inlet boundary. Additionally, the maximum pressure initially increased and subsequently decreased with the increased depths. Figure 9a,b shows the variation in the bearing capacity and friction coefficients of both surfaces with increasing depth. Regarding the square micro-texture surfaces, the bearing capacity initially increased and then decreased with increasing depth. Conversely, the friction coefficient showed a reverse trend, corresponding to an initial decrease and then an increase. The maximum and minimum bearing capacities were obtained at depths of 5 µm and 9 µm, and the corresponding friction capacities were obtained at depths of 1 µm and 5 µm. Wu et al. investigated micro-texture depths between 2.86 and 7.42 µm and observed that the friction coefficient diminishes as the depth increases [31]. Conversely, in our study, we examined micro-textures ranging from 1 to 9 µm and determined that the friction coefficient would escalate after decreasing with an increase in texture depth. This was because the value range in Wu et al.’s work was limited, and the coupling effect of other parameters was ignored.
These phenomena were caused by the increase in the amount of lubricant as the depth of the micro-texture increased, offering an adequate lubrication effect to the friction pair and improving the hydrodynamic effect. However, the shear effect of the fluid gradually dominated the process when the depth exceeded the threshold, leading to the generation of a swirl phenomenon, which weakened the hydrodynamic effect. Therefore, the carrying capacity decreased, and the friction coefficient increased. Notably, the properties of the square micro-texture surfaces were better than those of the texture-free surfaces.

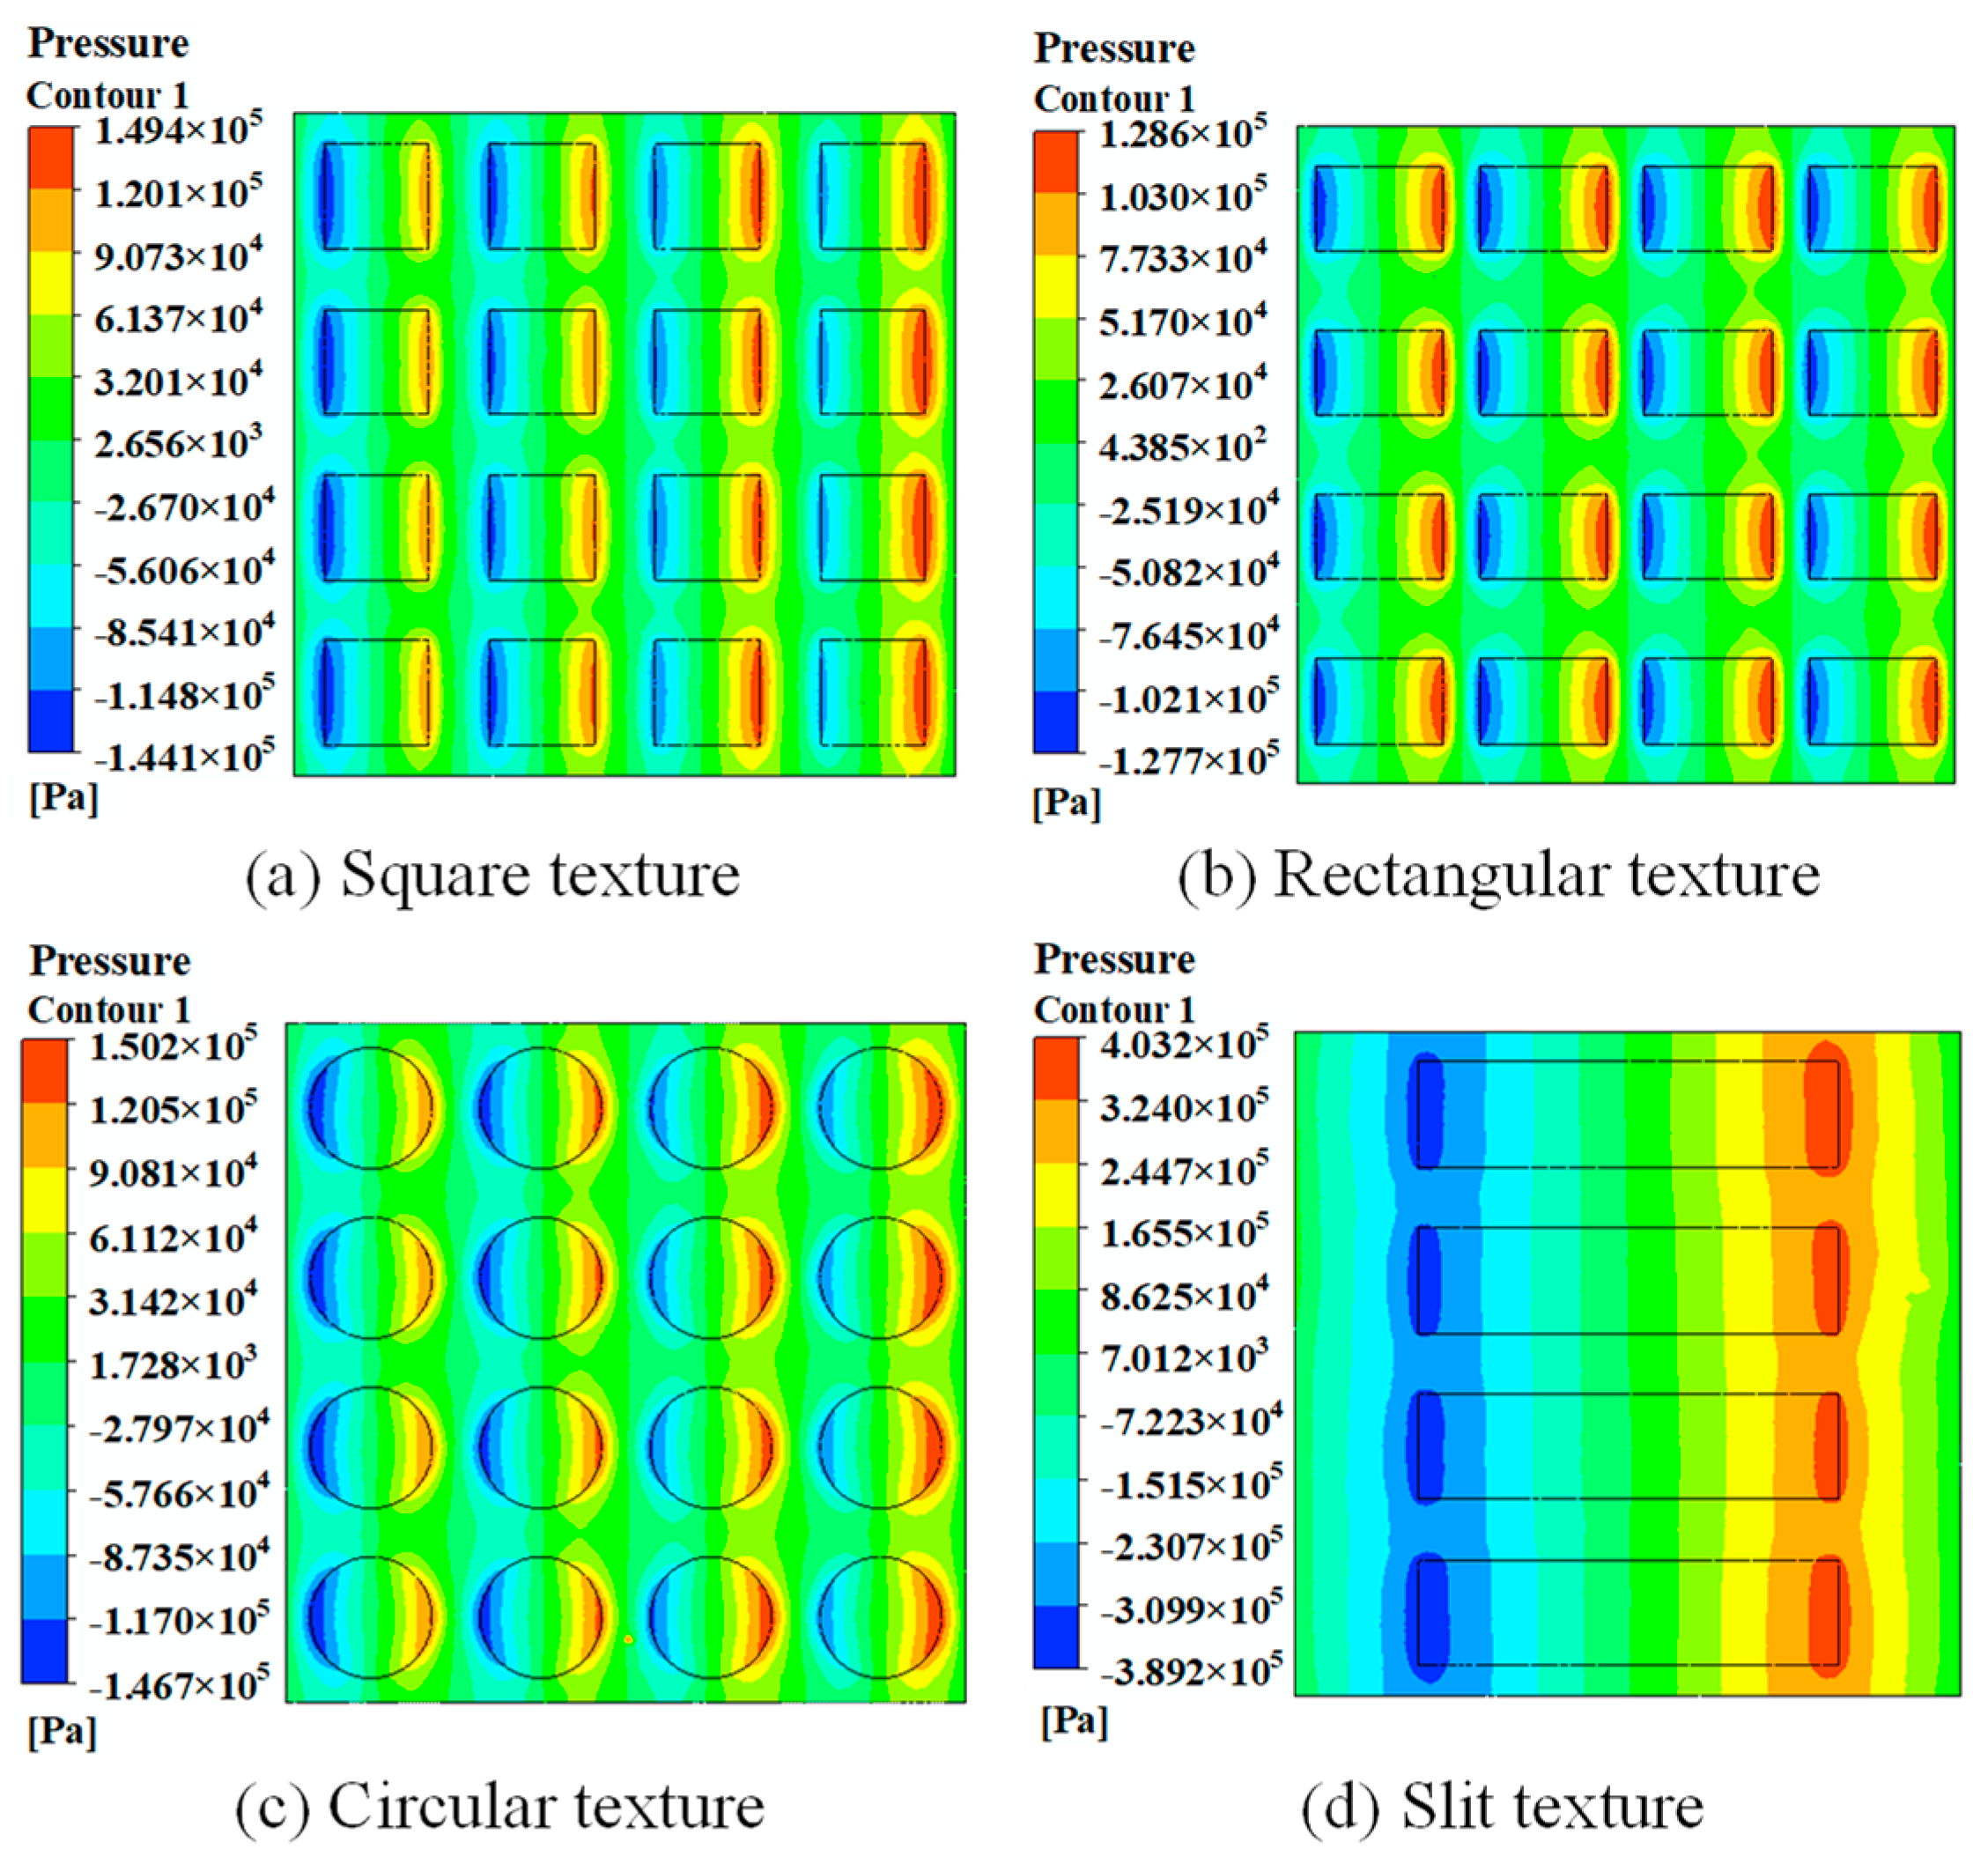
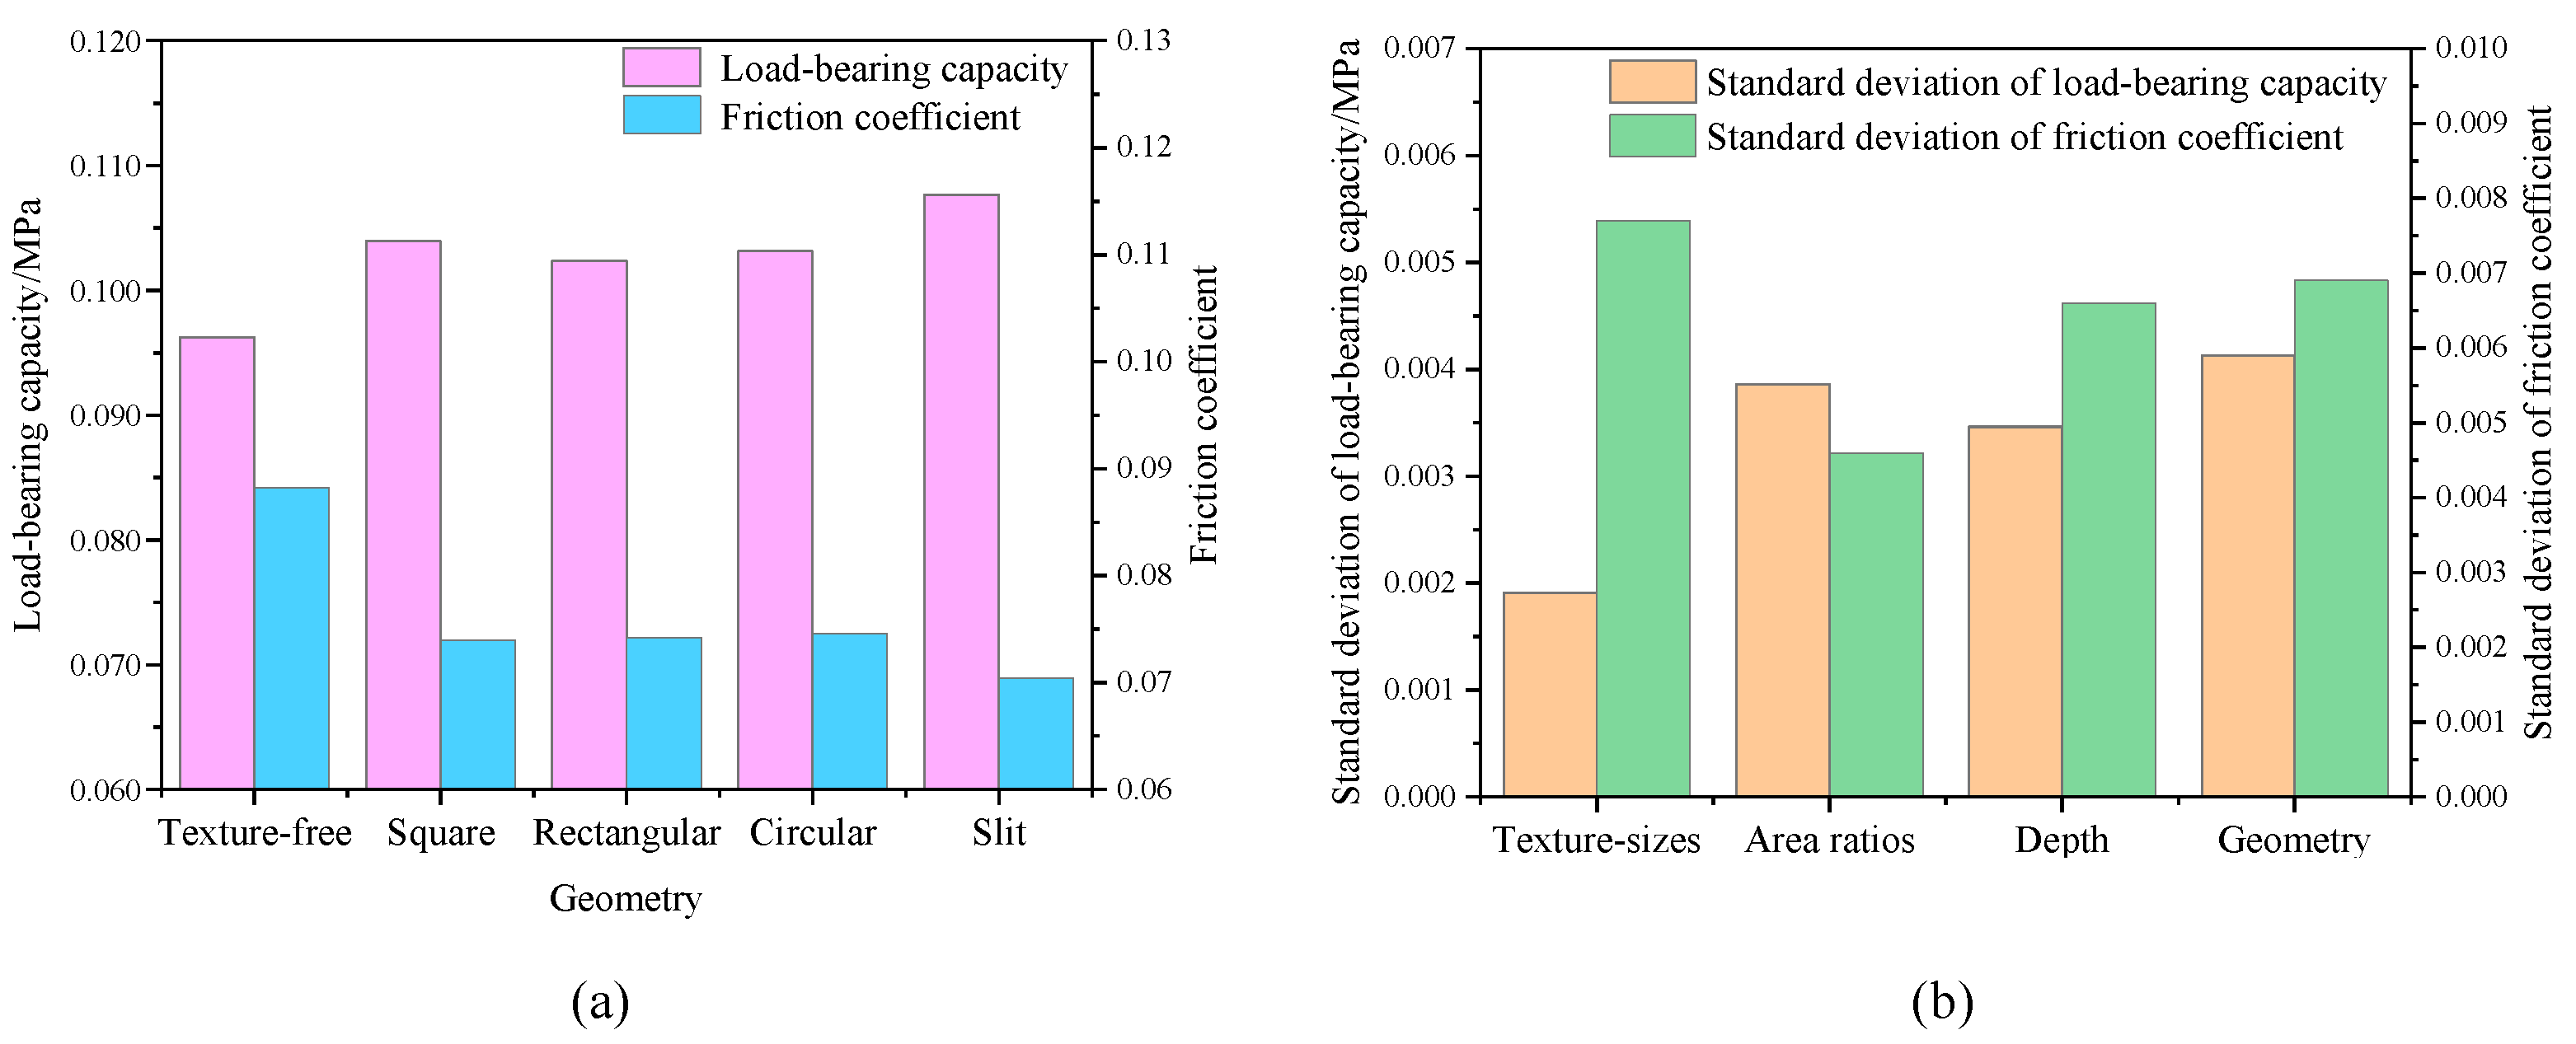
3.5. Influence of Micro-Texture Geometry on the Surface Tribological Properties

According to the aforementioned results, five surfaces with different micro-texture geometries with a length of 500 µm, an area ratio of 40%, and a depth of 5 µm are discussed in this section.
According to the pressure distribution shown in Figure 10a–d, the pressure difference between the middle columns of the square and the circular micro-texture surfaces was diminished. This may be attributed to the large flow space, leading to a lack of lubricant in the middle of the micro-texture and, thus, impeding the hydrodynamic effect of the fluid. In contrast, the rectangular and slit micro-texture produced a conduction effect on the fluid, enhancing the inertial effect. Simultaneously, the small exit area enhanced the hydrodynamic impact, and the pressure around the region with high pressure would have been more uniform because of the transmissibility of the hydrodynamic effect.
Figure 11a shows the variation in the bearing capacity and friction coefficients for the surfaces with different micro-texture geometries. The surfaces possessing high bearing capacity can be sequenced as Sl, Sq, Ci, Re, and Tf, and the surfaces possessing low friction coefficients can be sequenced as Sl, Sq, Re, Ci, and Tf. Noticeably, all the surfaces with micro-textures exhibited higher bearing capacity and lower friction coefficient than the surfaces without micro-textures. Moreover, the properties of the rectangular and slit micro-texture surfaces were better than those of the square and circular micro-texture surfaces. He et al. conducted a comparative analysis of circular, square, and annular micro-textured surfaces, concluding that circular micro-textured surfaces exhibited superior friction reduction performance [20]. However, the findings of this paper suggest that under identical parameters, the friction reduction performance of slit micro-textured surfaces surpasses that of circular microtextured surfaces. Figure 11b shows the standard deviation of the load-bearing capacity and friction coefficient under four types of parameters, indicating the parameter sensitivity for the properties. The standard deviation of the load-bearing capacity was 0.0019, 0.0039, 0.0035, and 0.0041 for the parameters of texture size, area ratio, depth, and geometry, indicating that the geometry was the most important. Similarly, the standard deviation of the friction coefficient was 0.0077, 0.0046, 0.0066, and 0.0069 for the parameters of texture size, area ratio, depth, and geometry, indicating that the texture size was the most important.
In a short conclusion, the optimal friction coefficient of 0.070409 can be obtained under the conditions of 500 µm micro-texture width, 40% area ratio, 5 µm depth, and slit geometry, showing a reduction of 10.7% compared with texture-free surfaces under the same conditions. The bearing capacity under these conditions can reach 107,653 Pa, which is not optimal because of the difficulty of balancing the normal and shear stress distribution on the surface.

4. Regression Optimization Results and Discussion

4.1. Parameter Correlation Analysis

According to the D-W test, Table 3 was obtained, where the DW values of model 1 (the dependent variable was bearing capacity) and model 2 (the dependent variable was friction coefficient) were 1.789 and 1.121, respectively, indicating that the linear model did not have autocorrelation. Furthermore, the results of the analysis suggest that the parameters had a weaker influence on the bearing capacity and a substantial impact on the friction coefficient. This can be approximated as R2 values of 0.057 for model 1 and 0.417 for model 2, with deviations approximated as 3251.49 and 0.0038, respectively.

4.2. Multivariate Linear Regression Optimization

The 1305 sets of data, including the parameters, bearing capacity, friction force, and friction coefficient, were imported into SPSSPRO for analysis using the TOPSIS method. The bearing capacity was designated as a positive indicator, while the friction force and coefficient were designated as negative indicators. The weights of the variables were determined using the entropy weight method. Consequently, the coefficients of the MLA equation were obtained, as shown in Table 4, and thus, the equations for models 1 and 2 can be expressed as follows:
Y 1 = 101692.897 29.1 X 1 + 3.474 X 2 2161.247 X 3 + 244.656 X 4
Y 2 = 0.090 0.000319 X 1 1.336 × 10 5 X 2 0.011 X 3 0.001 X 4
where Y1 and Y2 denote the surface properties of the load-bearing capacity and friction coefficient, and X1, X2, X3, and X4 are the size, area ratio, depth, and geometry, respectively.
According to Table 4, the significance of depth for model 1 was 0.353, which was greater than 0.05. Therefore, depth was not a significant factor. According to the importance of parameters in models 1 and 2, the parameters to which the bearing capacity is most sensitive can be sequenced as size, area ratio, geometry, and depth. Similarly, the friction coefficient’s sensitivity to parameters can be sequenced as size, area ratio, depth, and geometry. The parameter sensitivity of the friction coefficient was consistent with the results obtained by Wu et al. [32], which showed that the impact of depth was more minor than that of the area ratio on the friction coefficient. Notably, the sequence was different from the results obtained by the standard deviation in the SFA, possibly because the amount of research data limited the results in the SFA.
After TOPSIS optimization, the optimal properties with a bearing capacity of 105,569.3 Pa and a friction coefficient of 0.067844 were obtained with a size of 600 µm, an area ratio of 50%, a depth of 9 µm, and a geometry of slit. Compared with the texture-free surface, the friction coefficient was reduced by 15.6%. Compared with the result obtained by the SFA, the friction coefficient was further reduced, by 4.9%.
In a short conclusion, the parameters to which the bearing capacity is most sensitive can be sequenced as size, area ratio, geometry, and depth. The parameters to which the friction coefficient is most sensitive can be sequenced as size, area ratio, depth, and geometry. The optimal friction coefficient of 0.067844 was obtained under the conditions of 600 µm micro-texture size, 50% area ratio, 9 µm depth, and slit geometry, showing a 15.6% reduction compared with the texture-free surfaces under the same conditions, and a 4.6% reduction compared with the optimal surfaces with the SFA method. The corresponding bearing capacity was 105,569.3 Pa.

5. Conclusion and Perspectives

This article numerically investigated the influence of the micro-texture size, area ratio, depth, and geometry on the surface bearing capacity and friction coefficient by using SFA. The MLA method was employed to optimize the parameters to improve the surface properties further. The following conclusions and perspectives can be drawn:
  • The optimal parameters obtained by the SFA were a slit micro-texture 500 µm in size, with a 40% area ratio, and 5 µm in depth. The corresponding bearing capacity and friction coefficient were 107,653 Pa and 0.070409, showing a reduction of 10.7% in the friction coefficient compared with those of the texture-free surfaces with the same parameters.
  • The results of the MLA algorithm indicated that the parameters to which the bearing capacity was sensitive were sequenced as size, area ratio, geometry, and depth, with size and geometry exhibiting a positive correlation, while the depth and area ratio exhibited a negative correlation. Regarding the friction coefficient, the importance of the parameters can be sequenced as size, area ratio, depth, and geometry, with all the parameters exhibiting a negative correlation.
  • The optimal parameters obtained by the MLA were a slit micro-texture 600 µm in size, with an area ratio of 50%, and 9 µm in depth. The corresponding bearing capacity and friction coefficient were 105,569.3 Pa and 0.067844, showing a 15.6% reduction in the friction coefficient compared with those of the texture-free surfaces with the same parameters and a 4.9% reduction compared with those of the optimal surfaces obtained by the SFA.
  • The MLA algorithm can analyze the micro-texture parameters within a more extensive range and broaden the understanding of the coupling effect of these parameters, which is why it is one of the promising statistical analysis methods for optimizing micro-texture parameters in the future. Similarly, other algorithms, such as random forest, deep neural networks, multimodal machine learning, etc., could also be used for comprehensive analysis and prediction in the future. More types of variants can be introduced in these algorithms for better prediction results. However, these methods require a large amount of data while being time-consuming and wasteful. Reliable mathematical models may be among the potential methods to predict properties at a low cost.

Author Contributions

Z.G., Methodology, Investigation, Writing—Review and Editing. Q.H., Investigation, Writing—Original Draft. H.Z., Methodology, Investigation, Writing—Review and Editing. Y.Z., Supervision, Writing—Review and Editing. All authors have read and agreed to the published version of the manuscript.

Funding

This work was financially supported by the Jiangsu Agriculture Science and Technology Innovation Fund (CX(21)3154), the National Natural Science Foundation of China (52175438), and the Innovation Cultivation Fund of Yangzhou University (135030421).

Data Availability Statement

Data are contained within the article.

Conflicts of Interest

The authors declare no conflicts of interest.

References

  1. Holmberg, K.; Erdemir, A. Influence of Tribology on Global Energy Consumption, Costs and Emissions. Friction 2017, 5, 263–284. [Google Scholar] [CrossRef]
  2. Huang, J.; Guan, Y.; Ramakrishna, S. Tribological Behavior of Femtosecond Laser-Textured Leaded Brass. Tribol. Int. 2021, 162, 107115. [Google Scholar] [CrossRef]
  3. Li, S.; Yang, X.; Kang, Y.; Li, Z.; Li, H. Progress on Current-Carry Friction and Wear: An Overview from Measurements to Mechanism. Coatings 2022, 12, 1345. [Google Scholar] [CrossRef]
  4. Wang, P.; Liang, H.; Jiang, L.; Qian, L. Effect of Nanoscale Surface Roughness on Sliding Friction and Wear in Mixed Lubrication. Wear 2023, 530, 204995. [Google Scholar] [CrossRef]
  5. Masuko, M.; Tomizawa, K.; Aoki, S.; Suzuki, A. Experimental Study on the Effects of Sliding Velocity and Roughness Orientation of Metal Surfaces on the Function of Lubricant Additives in Controlling Friction in a Boundary Lubrication Regime. In Tribological Research and Design for Engineering Systems; Dowson, D., Priest, M., Dalmaz, G., Lubrecht, A.A., Eds.; Elsevier Science Bv: Amsterdam, The Netherlands, 2003; pp. 791–798. [Google Scholar]
  6. Zhang, M.; Zhang, J.; Yang, Z.; Bai, J.; Guan, R. Interface of AlCrTiN/6061 laminated composite fabricated by one-pass rolling and its tribological properties. Mater. Charact. 2024, 216, 114299. [Google Scholar] [CrossRef]
  7. Xie, X.; Liu, X.; He, B.; Cheng, W.; Zhang, F.; Liang, J. Fabrication and tribological behavior of laser cladding Cu/Ti3SiC2 reinforced CoCrW matrix composite coatings on Inconel718 surface. Surf. Coat. Technol. 2024, 493, 131289. [Google Scholar] [CrossRef]
  8. Li, M.; Liu, S.; Cao, M.; Zhou, Z.; Rao, J.; Zhang, Y. Fabrication of natural mesoporous Diatom biosilica microcapsules with high oil-carrying capacity and tribological property. Tribol. Int. 2024, 200, 110170. [Google Scholar] [CrossRef]
  9. Chandrasekaran, S.; Check, J.; Sundararajan, S.; Shrotriya, P. The Effect of Anisotropic Wet Etching on the Surface Roughness Parameters and Micro/Nanoscale Friction Behavior of Si(100) Surfaces. Sens. Actuators A-Phys. 2005, 121, 121–130. [Google Scholar] [CrossRef]
  10. Wan, Q.; Gao, P.; Zhang, Z. Friction and Wear Performance of Lubricated Micro-Textured Surface Formed by Laser Processing. Surf. Eng. 2021, 37, 1523–1531. [Google Scholar] [CrossRef]
  11. Chen, W.; Xia, M.; Song, W. Study on the Anti-Friction Mechanism of Nitriding Surface Texture 304 Steel. Coatings 2020, 10, 554. [Google Scholar] [CrossRef]
  12. Na, Z.; Zhentao, L.; Muming, H.; Yancong, L.; Baojie, R.; Wang, Z. Numerical Simulation and Experimental Investigation on Tribological Performance of SiC Surface with Squamous Groove Micro Texture. Lubr. Sci. 2022, 34, 547–562. [Google Scholar] [CrossRef]
  13. Hu, T.; Hu, L.; Ding, Q. Effective Solution for the Tribological Problems of Ti-6Al-4V: Combination of Laser Surface Texturing and Solid Lubricant Film. Surf. Coat. Technol. 2012, 206, 5060–5066. [Google Scholar] [CrossRef]
  14. Yangyi, X.; Jing, L.; Wankai, S.; Minglin, K. Heavy Load Elastohydrodynamic Lubrication Performance of Surface Micro-textured Coating-substrate System. Surf. Technol. 2020, 49, 159–167. [Google Scholar]
  15. Chen, D.; Ding, X.; Yu, S.; Zhang, W. Friction Performance of DLC Film Textured Surface of High Pressure Dry Gas Sealing Ring. J. Braz. Soc. Mech. Sci. Eng. 2019, 41, 161. [Google Scholar] [CrossRef]
  16. Tong, X.; Shen, J.; Su, S. Properties of Variable Distribution Density of Micro-Textures on a Cemented Carbide Surface. J. Mater. Res. Technol. 2021, 15, 1547–1561. [Google Scholar] [CrossRef]
  17. Li, D.; Yang, X.; Lu, C.; Cheng, J.; Wang, S.; Wang, Y. Tribological Characteristics of a Cemented Carbide Friction Surface with Chevron Pattern Micro-Texture Based on Different Texture Density. Tribol. Int. 2020, 142, 106016. [Google Scholar] [CrossRef]
  18. Selvakumar, S.J.; Muralidharan, S.M.; Raj, D.S. Performance Analysis of Drills with Structured Surfaces When Drilling CFRP/O7075 Stack under MQL Condition. J. Manuf. Process. 2023, 89, 194–219. [Google Scholar] [CrossRef]
  19. Wang, Z.; Hu, S.; Zhang, H.; Ji, H.; Yang, J.; Liang, W. Effect of Surface Texturing Parameters on the Lubrication Characteristics of an Axial Piston Pump Valve Plate. Lubricants 2018, 6, 49. [Google Scholar] [CrossRef]
  20. He, C.; Yang, S.; Zheng, M. Analysis of Synergistic Friction Reduction Effect on Micro-Textured Cemented Carbide Surface by Laser Processing. Opt. Laser Technol. 2022, 155, 108343. [Google Scholar] [CrossRef]
  21. Wang, Z.; Sun, L.; Han, B.; Wang, X.; Ge, Z. Study on the Thermohydrodynamic Friction Characteristics of Surface-Textured Valve Plate of Axial Piston Pumps. Micromachines 2022, 13, 1891. [Google Scholar] [CrossRef]
  22. Ye, J.; Zhang, H.; Liu, X.; Liu, K. Low Wear Steel Counterface Texture Design: A Case Study Using Micro-Pits Texture and Alumina-PTFE Nanocomposite. Tribol. Lett. 2017, 65, 165. [Google Scholar] [CrossRef]
  23. Chen, D. Influence of Microtextured Parameters of Dry Gas Sealing Rings on Tribological Performance. Ind. Lubr. Tribol. 2024, 76, 464–473. [Google Scholar] [CrossRef]
  24. Han, J.; Jiang, Y.; Li, X.; Li, Q. Conical Grinding Wheel Ultrasonic-Assisted Grinding Micro-Texture Surface Formation Mechanism. Machines 2023, 11, 428. [Google Scholar] [CrossRef]
  25. Durairaj, S.; Guo, J.; Aramcharoen, A.; Castagne, S. An Experimental Study into the Effect of Micro-Textures on the Performance of Cutting Tool. Int. J. Adv. Manuf. Technol. 2018, 98, 1011–1030. [Google Scholar] [CrossRef]
  26. Jia, J.; Hao, Y.; Ma, B.; Xu, T.; Li, S.; Xu, J.; Zhong, L. Gas-Liquid Two-Phase Flow Field Analysis of Two Processing Teeth Spiral Incremental Cathode for the Deep Special-Shaped Hole in ECM. Int. J. Adv. Manuf. Technol. 2023, 127, 5831–5846. [Google Scholar] [CrossRef]
  27. Liu, W.; Ni, H.; Chen, H.; Wang, P. Numerical Simulation and Experimental Investigation on Tribological Performance of Micro-Dimples Textured Surface under Hydrodynamic Lubrication. Int. J. Mech. Sci. 2019, 163, 105095. [Google Scholar] [CrossRef]
  28. Dunn, P. SPSS Survival Manual: A Step by Step Guide to Data Analysis Using IBM SPSS. Aust. N. Z. J. Public Health 2013, 37, 597–598. [Google Scholar] [CrossRef]
  29. Jeong, J.; Chung, S. Bootstrap Tests for Autocorrelation. Comput. Stat. Data Anal. 2001, 38, 49–69. [Google Scholar] [CrossRef]
  30. Allard, D.J.-P.; Chilès, P. Delfiner: Geostatistics: Modeling Spatial Uncertainty. Math. Geosci. 2013, 45, 377–380. [Google Scholar] [CrossRef]
  31. Paul, J.; Pierre, D. Geostatistics: Modeling Spatial Uncertainty; John Wiley & Sons: Hoboken, NJ, USA, 2012. [Google Scholar] [CrossRef]
  32. Wu, F.; Liu, N.; Ma, Y.; Zhang, X.; Han, Y. Research on the influence of diamond coating microtexture on graphitization law and friction coefficient. Diam. Relat. Mater. 2022, 127, 109153. [Google Scholar] [CrossRef]
Figure 1. Two-dimensional geometric model with different surface micro-textures.
Coatings 14 01258 g001
Figure 2. Boundary condition settings of micro-textured watershed.
Coatings 14 01258 g002
Figure 3. Flow chart of the research procedure.
Coatings 14 01258 g003
Figure 4. Pressure distribution of oil film on the square micro-texture surfaces with varying sizes from 25 µm to 600 µm under different texture sizes, at depth of 5 µm and with an area ratio of 50%.
Coatings 14 01258 g004
Figure 5. (a) Load-bearing capacity and (b) friction force variation of texture-free and square micro-texture surfaces with different texture sizes, at a depth of 5 µm and with an area ratio of 50%.
Coatings 14 01258 g005
Figure 6. Pressure distributions of oil film on the square micro-texture surfaces with varying area ratios from 10% to 50% under different area ratios, at a depth of 5 µm and with a length of 500 µm.
Coatings 14 01258 g006
Figure 7. (a) Load-bearing capacity and (b) friction force variation of texture-free and square micro-texture surfaces under different area ratios, at a depth of 5 µm and with a length of 500 µm.
Coatings 14 01258 g007
Figure 8. Pressure distributions of oil film on the square micro-texture surfaces with varying depths from 1 µm to 9 µm, with an area ratio of 40% and a length of 500 µm.
Coatings 14 01258 g008
Figure 9. (a) Load-bearing capacity and (b) friction force variation of texture-free and square micro-texture surfaces at different depths, with an area ratio of 40% and a length of 500 µm.
Coatings 14 01258 g009
Figure 10. Pressure distribution contours of different texture shapes with a length of 500 µm, an area ratio of 40%, and a depth of 5 µm. (ad) are pressure clouds for square, rectangle, circle, and slit, respectively.
Coatings 14 01258 g010
Figure 11. (a) Load-bearing capacity and friction force of different texture geometries with a length of 500 µm, an area ratio of 40%, and a depth of 5 µm. (b) Standard deviation of load-bearing capacity and friction coefficient under different variants.
Coatings 14 01258 g011
Table 1. Parameter values used in the simulation with four geometries of micro-texture.
GeometrySize
(µm)
Area Ratio (%)Depth
(µm)
Fluid Density
(kg/m3)
Dynamic Viscosity
(Pa.s.)
Texture-freea × a10%, 20%, 30%, 40%, 50%1, 2, 3, 5, 7, 8, 98950.0135145
Square25, 50, 100, 150, 200, 300, 400, 500, 600
Rectangularc × 1.5c
Circularr
Slitd × l
Table 2. Comparison of theoretical and simulated values and errors of shear stress.
Length/µmTheoretical τ1/PaSimulation τ2/PaDeviation δ/%
1264.98446.568545.371.17%
2529.88446.568512.180.78%
63258446.568475.200.34%
Table 3. Durbin–Watson test.
ModelRR2Adjusted R2DeviationDW
10.239a0.0570.0543251.490861.789
20.646a0.4170.4150.00382010921.121
Table 4. Coefficients of multivariate linear regression equation.
ModelUSCSCtSCS
BSDBetaTVIF
1(Constant)101692.897349.919 290.6180.000
Depth−29.10031.326−0.025−0.9290.3530.9951.005
Size3.4740.4670.2017.4470.0001.0001.000
Area ratio−2161.247636.447−0.091−3.3960.0011.0001.000
Geometry244.65675.8680.0873.2250.0010.9951.005
2(Constant)0.0900.000 218.2720.000
Depth0.0003190.000−0.184−8.6600.0000.9951.005
Size−1.336 × 10−50.000−0.516−24.3750.0001.0001.000
Area ratio−0.0110.001−0.312−14.7180.0001.0001.000
Geometry−0.0010.000−0.155−7.3180.0000.9951.005
USC—unstandardized coefficient, SC—standardized coefficient, SD—standard deviation, S—significance, CS—covariance statistic, T—tolerances.
Disclaimer/Publisher’s Note: The statements, opinions and data contained in all publications are solely those of the individual author(s) and contributor(s) and not of MDPI and/or the editor(s). MDPI and/or the editor(s) disclaim responsibility for any injury to people or property resulting from any ideas, methods, instructions or products referred to in the content.

