Article

The Influence of Magnetic Field Orientation on the Efficacy and Structure of Ni-W-SiC Coatings Produced by Magnetic Field-Assisted Electrodeposition

1
School of Mechatronics Engineering, Qiqihar University, Qiqihar 161006, China
2
School of Petroleum Engineering, Northeast Petroleum University, Daqing 163318, China
3
The Engineering Technology Research Center for Precision Manufacturing Equipment and Industrial Perception of Heilongjiang Province, Qiqihar 161006, China
4
College of Engineering, Northeast Agricultural University, Harbin 150030, China
*
Author to whom correspondence should be addressed.
Coatings 2024, 14(10), 1272; https://doi.org/10.3390/coatings14101272
Submission received: 1 September 2024 / Revised: 30 September 2024 / Accepted: 30 September 2024 / Published: 4 October 2024

Abstract

:
This study presents a novel approach to enhancing the performance of Ni-W-SiC coatings through magnetic field-assisted electrodeposition, with a specific focus on the influence of magnetic field orientation. The coatings were evaluated for their structure, surface topology, roughness, corrosion resistance, and wear resistance. The results indicated that the perpendicular magnetic orientation of the coating, obtained at a magnetic field value equal to 0.3 T (S1), showed the largest content of SiC, with a minimal grain size of Ni-W, measuring 84.7 nm with smooth, fine, and dense surface architecture. The S1 coating’s surface roughness, as revealed by AFM images, was 24.46 nm, significantly less than that of the coatings produced with 0 T (S0) and 0.3 T (S2) magnetic inductions. XRD results revealed that the Ni-W grains’ predominant growth direction shifted from the planar direction of (200) to the (111) direction, due to the application of a magnetic field oriented perpendicularly. In addition, the S1 coating had an outstanding corrosion resistance. Furthermore, S1, among all coatings, had the highest value of hardness, along with the lowest coefficient of friction and higher wear resistance. This work sets the stage for future advancements in surface engineering, demonstrating the potential of magnetic field orientation as a tool for material enhancement.

1. Introduction

Recently, nickel-based composite coatings have been widely used for enhancing surface characteristics of metal constituents across various fields, such as mechanical, agricultural, aerospace, and automotive industries [1,2,3]. Nanoparticles (NPs) are frequently utilized as reinforcing phases in nickel-based composite coatings to enhance distinctive properties, including resistance to abrasion, pyro-oxidation, and corrosion, as well as hardness. Generally, electrodeposition (ED) is commonly utilized for fabricating nickel-based coatings, due to its cost-effectiveness, simplicity, and convenience in comparison to other methods reported by Kumar et al. [4]. The method of coating deposition using a magnetic field (MF) is increasingly being adopted as a novel approach to impart high levels of kinetic and thermal energies in an easy, environmentally friendly, non-contact manner. Throughout the ED process, the external MF alters the electrochemical system, affecting processes related to magnetohydrodynamics (MHD), magneto-mechanical processes, and magnetization.
The Ni-W-SiC coating is an inorganic composite comprising Ni-W metal grains and SiC ceramic particles. The exceptional hardness, low density, and remarkable wear and corrosion resistances have made SiC nanoparticles a favorable choice for reinforcement in the Ni-W matrix [5]. The application of the coating onto the surfaces of critical machinery, chemical industry, and agricultural machinery components can markedly extend the service life of these parts [6]. Thus, it is vitally essential to investigate the preparation and properties of Ni-W-SiC coatings.
The use of ED generated by MFs to enhance coating performance has attracted considerable interest [7]. The strength of the MF affects the features and composition of Ni-SiC coatings produced via ED [8]. The composition and characteristics of Ni-based membranes, fabricated employing the MF-assisted ED method, have also been investigated as a function of ceramic particle size in a prior study [9]. Another research focused on the resistance to corrosion and synthesis of Ni-SiC coatings fabricated using a similar technique [10]. The findings showed that this approach can substantially enhance the efficiency of metal-based coatings. These investigations highlighted several advantages over other ED techniques: (1) The MF enables efficient stirring of the plating solution and uniform NP dispersion through magnetization, MHD, and magneto-mechanical effects. (2) It also promotes the deposition process during the co-deposition of metal ions and ceramic particles. Hence, in this investigation, Ni-W-SiC coatings were produced through MF-assisted ED. Moreover, Ni-W-SiC coatings have yet to be thoroughly examined in terms of the impact of magnetic orientation on their properties.
The highlights of this work can be listed as follows: (1) Ni-W-SiC coatings were prefabricated by using the magnetic field-assisted electrodeposition technique. (2) The magnetic field was kept at an intensity of 0.3 T during the deposition process. (3) This study evaluated the corrosion resistance, abrasion resistance, elemental composition of the microstructure, and surface topology of Ni-W-SiC coatings when subjected to various magnetic orientations. The prepared coatings were characterized utilizing a Quanta FEG450 scanning electron microscope (SEM), an Inca X-Max energy-dispersive X-ray spectroscopic (EDS) system, a NanoScope III atomic force microscope (AFM), a D/Max-2400 X-ray diffraction (XRD) setup, a Tecnai-G2-20-S-Twin transmission electron microscope (TEM), and electrochemical tests, along with a hardness tester to study the wear and friction. This study provides a technical support for the MF-assisted, ED-produced, metal-based coatings.

2. Experimental Section

2.1. Synthesis of Coating Material

The schematic depiction of the fabrication method utilized to deposit Ni-W-SiC coatings is provided in Figure 1. The ED system included a 45 steel substrate, an automatic control heating device, a nickel plate, an MF generator and electroplating power supply, and a plating tank. The size of the plating tank was 120 mm × 100 mm × 100 mm. In addition, the anode, a nickel plate measuring 50 mm × 30 mm × 3 mm, and the cathode, a 45 steel plate of the same dimensions, were hung in an electrolyte. The distance between electrodes was kept at 8 mm. The components of the electrolyte and plating parameters for depositing Ni-W-SiC coatings were listed as follows: 250 g/L NiSO4·6H2O, 30 g/L NiCl2·H2O, 25 g/L H3BO3, 10 g/L Na2WO4.2H2O, 5.5 A/dm2 pulse current density, 40% duty cycle, 1 kHz pulse frequency, and 400 μs pulse width. The magnetic field was kept constant at an intensity of 0.3 T during the entire deposition process. The electrolyte bath temperature was maintained at 50 °C throughout the deposition process. The electrolyte pH (4.4) was regulated using solutions of NaOH (0.3 M) and HCl (0.3 M).
The SiC NPs (hexagonal silicon carbide) used in this study were provided by Shanghai Namitech Co. Ltd., Shanghai, China, with a 50 nm average size and a 99.98 wt% purity. The Ni-W-SiC coating deposited without MF was labeled as the S0 sample. When the magnetic field was vertical to the electric field and the magnetic field intensity was 0.3 T, the Ni-W-SiC coating was denoted as the S1 sample. While the magnetic field was parallel to the electric field, the Ni-W-SiC coating deposited at 0.3 T was designated as the S2 sample.

2.2. Characterization

The surface morphologies of Ni-W-SiC coatings were examined using SEM following corrosion tests, and their structures were examined using TEM. For TEM sample preparation, the Ni-W-SiC coatings, which had thicknesses ranging from 25 to 27 μm, were carefully sectioned and thinned to electron transparency using a focused ion beam (FIB) technique. This method ensured that specific regions of the coating were precisely targeted for analysis. The TEM images presented in this study were taken from the near-surface region of the coating, rather than deeper areas closer to the steel substrate. This was performed to analyze the coating’s microstructure where it was most influenced by the electrodeposition process and magnetic field orientation.
The crystalline structure of the coatings was investigated using XRD, scanning from 20° to 100° at 0.02°/s. The mean grain sizes of coatings were determined using Equation (1).
D = 0.94 λ B c o s θ
where D and λ denote the mean crystallite size and diffraction wavelength (equal to 1.5418 Å), respectively. For an angle θ, B represents the full width at half maximum of the peak.
The microhardness values were determined using the HVS-1000AT microhardness tester. An average of five randomly selected test sites within the cross-sectional regions were used to calculate the values. Friction coefficients for the coatings were determined via a friction wear tester (GXP-500A) (Shangdong Jingcheng Technology Co., Ltd, Jinan, China). A 3 mm diameter chromium ball moving at 120 rpm was used to perform reciprocating ball-on-flat wear testing on the coated samples. All of these tests were conducted for 60 min at ambient temperature with a 5 N applied load.
The electrochemical characteristics were examined utilizing an electrochemical workstation (CS350) (Wuhan Corrtest Technology Co., Ltd, Wuhan, China). The auxiliary electrode was based on the platinum plate, while the reference and working electrodes were based on a saturated calomel and a coating sample, respectively. For the corrosion study, a 3.5 wt% NaCl solution was chosen to simulate a marine environment, which is a common standard condition used in corrosion testing, due to its relevance to real-world applications in coastal and marine industries. The 3.5 wt% NaCl concentration is widely accepted, as it closely mimics the chloride ion concentration found in seawater, providing a relevant and challenging environment for testing corrosion resistance. A scan rate of 0.4 mV/s was selected to ensure accurate and reliable measurement of the corrosion potential and current, allowing sufficient time for the electrochemical system to respond without causing excessive polarization. This scan rate is commonly used in corrosion studies to balance between capturing detailed electrochemical behavior and minimizing potential disturbances to the system. Electrochemical impedance spectroscopy (EIS) (Wuhan Corrtest Technology Co., Ltd, Wuhan, China) plots were produced using a sinusoidally varying signal with an amplitude equal to 1 mV vs. the open circuit potential (OCP) of the coating. This approach ensured that the EIS measurements reflected the true electrochemical behavior of the coating under the natural corrosion potential conditions. The frequency range covered was 100 kHz to 100 mHz.

3. Results and Discussion

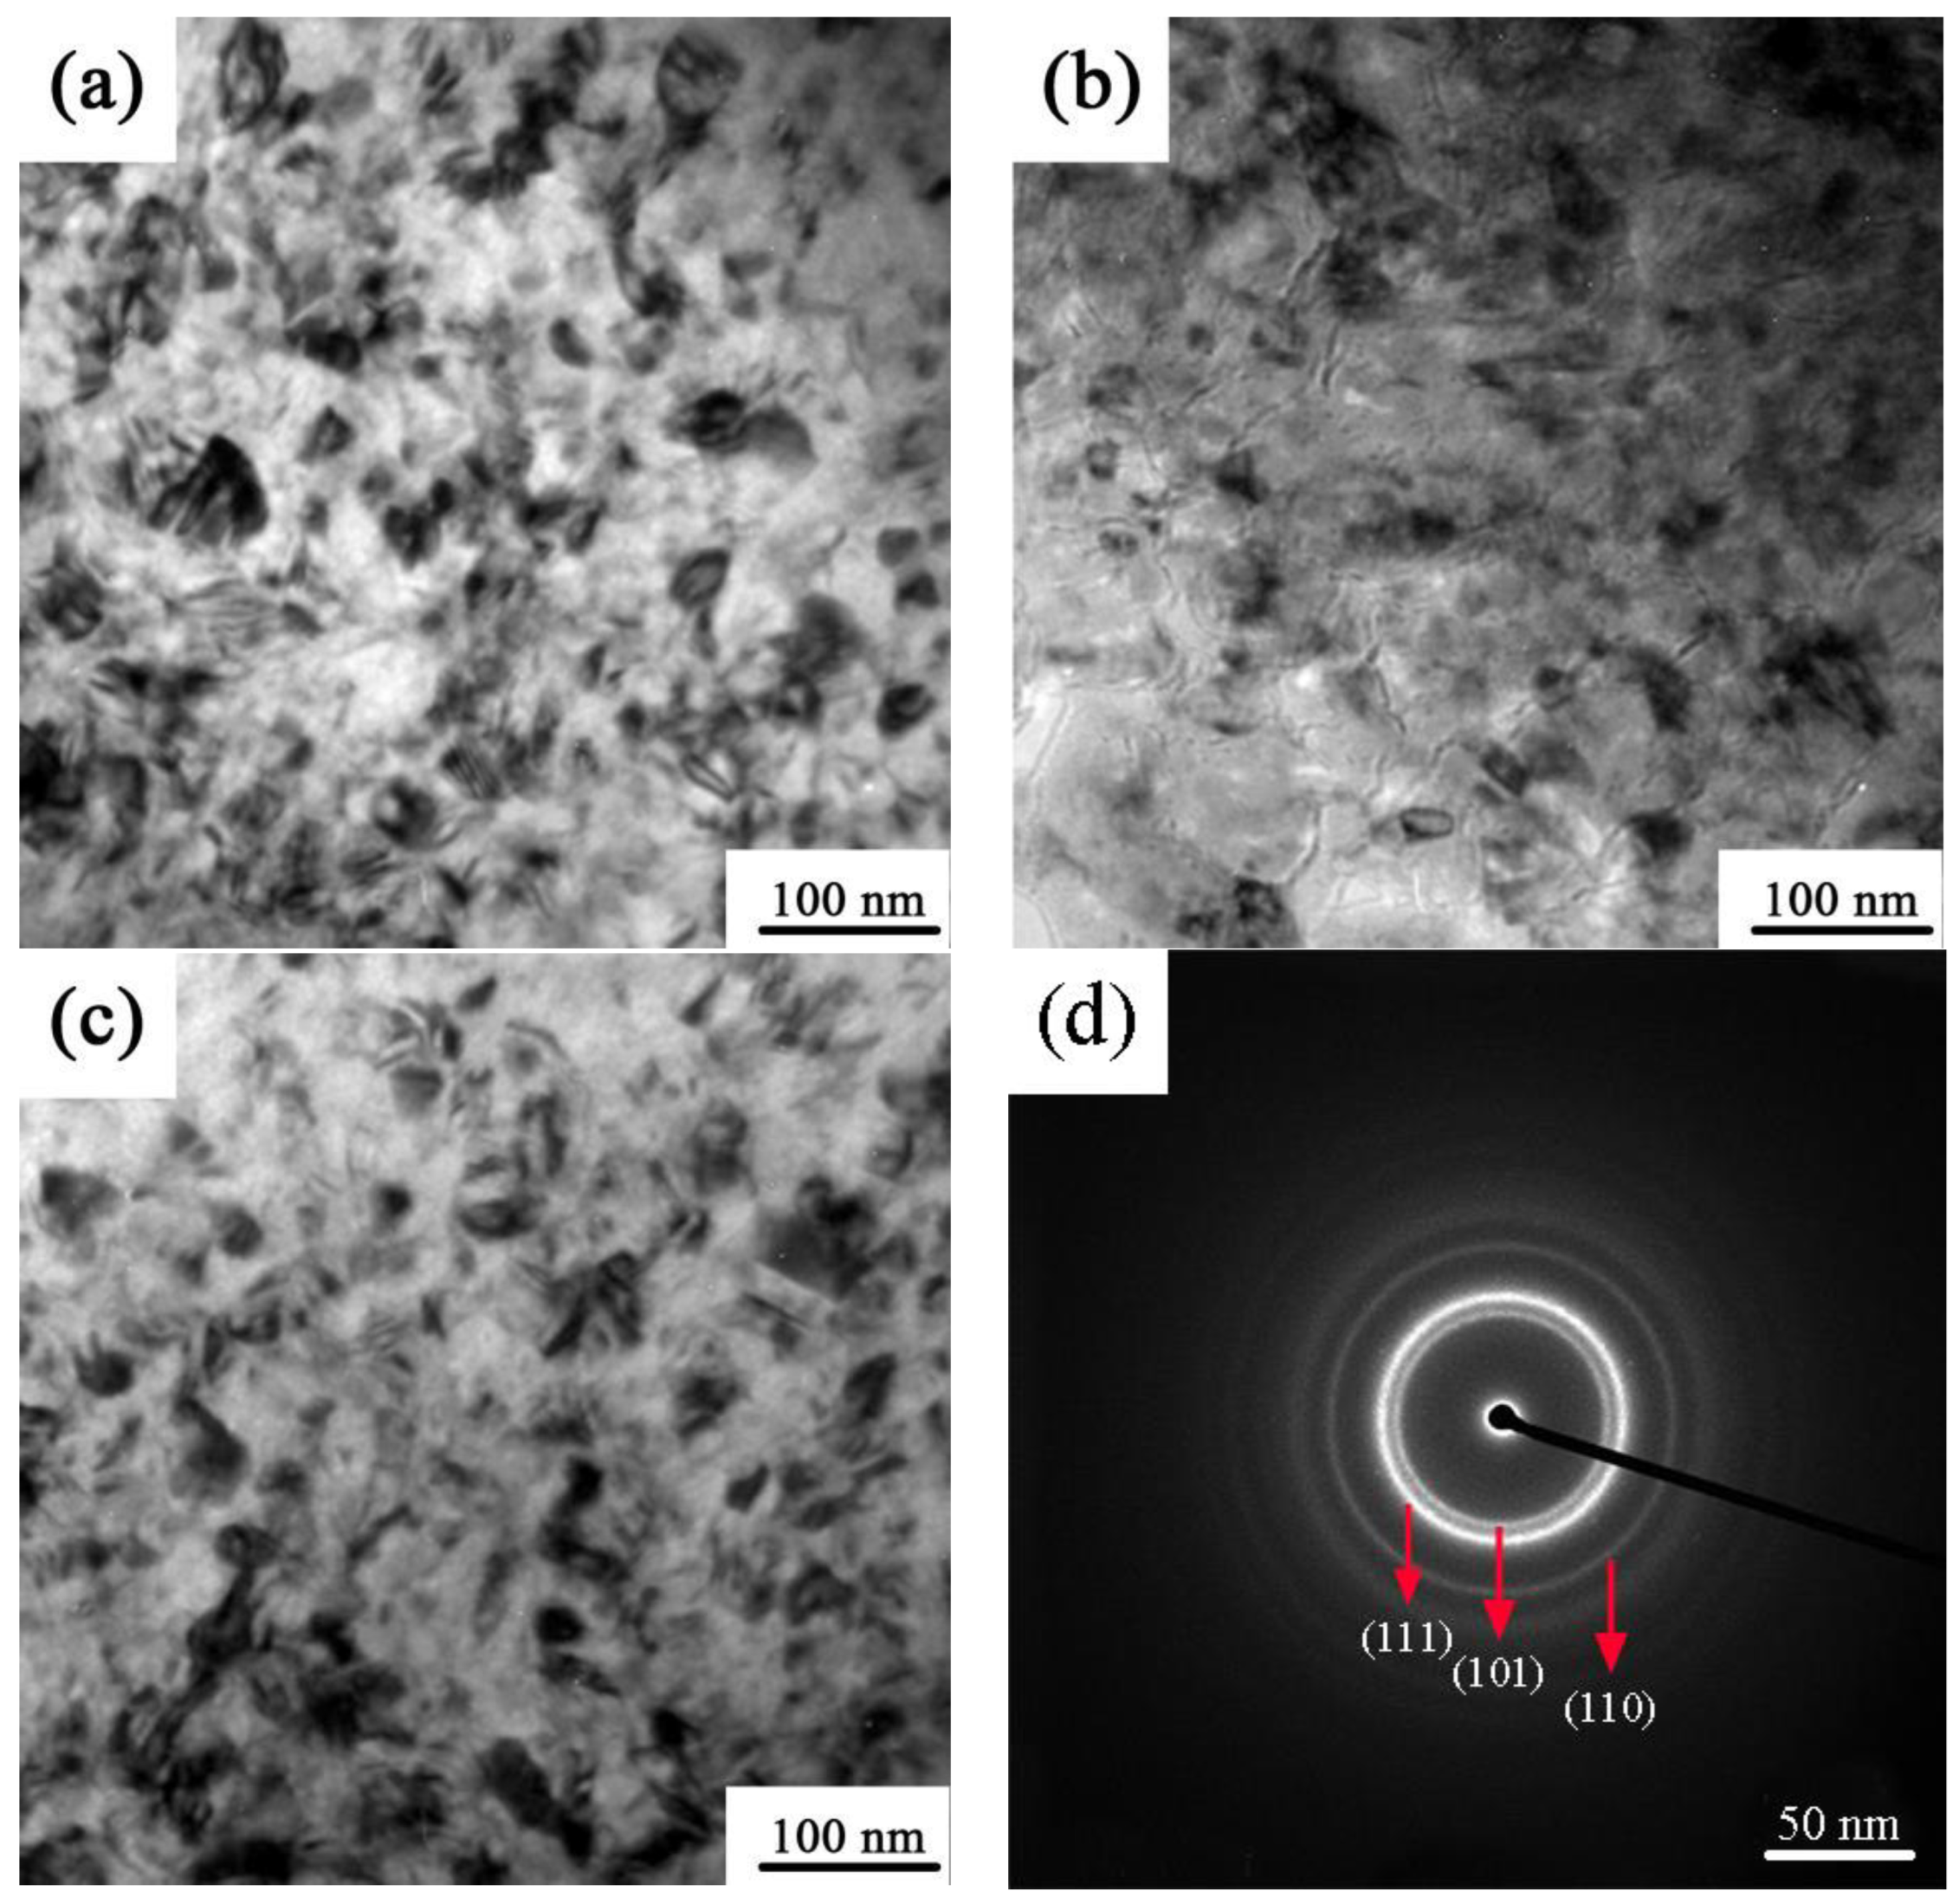
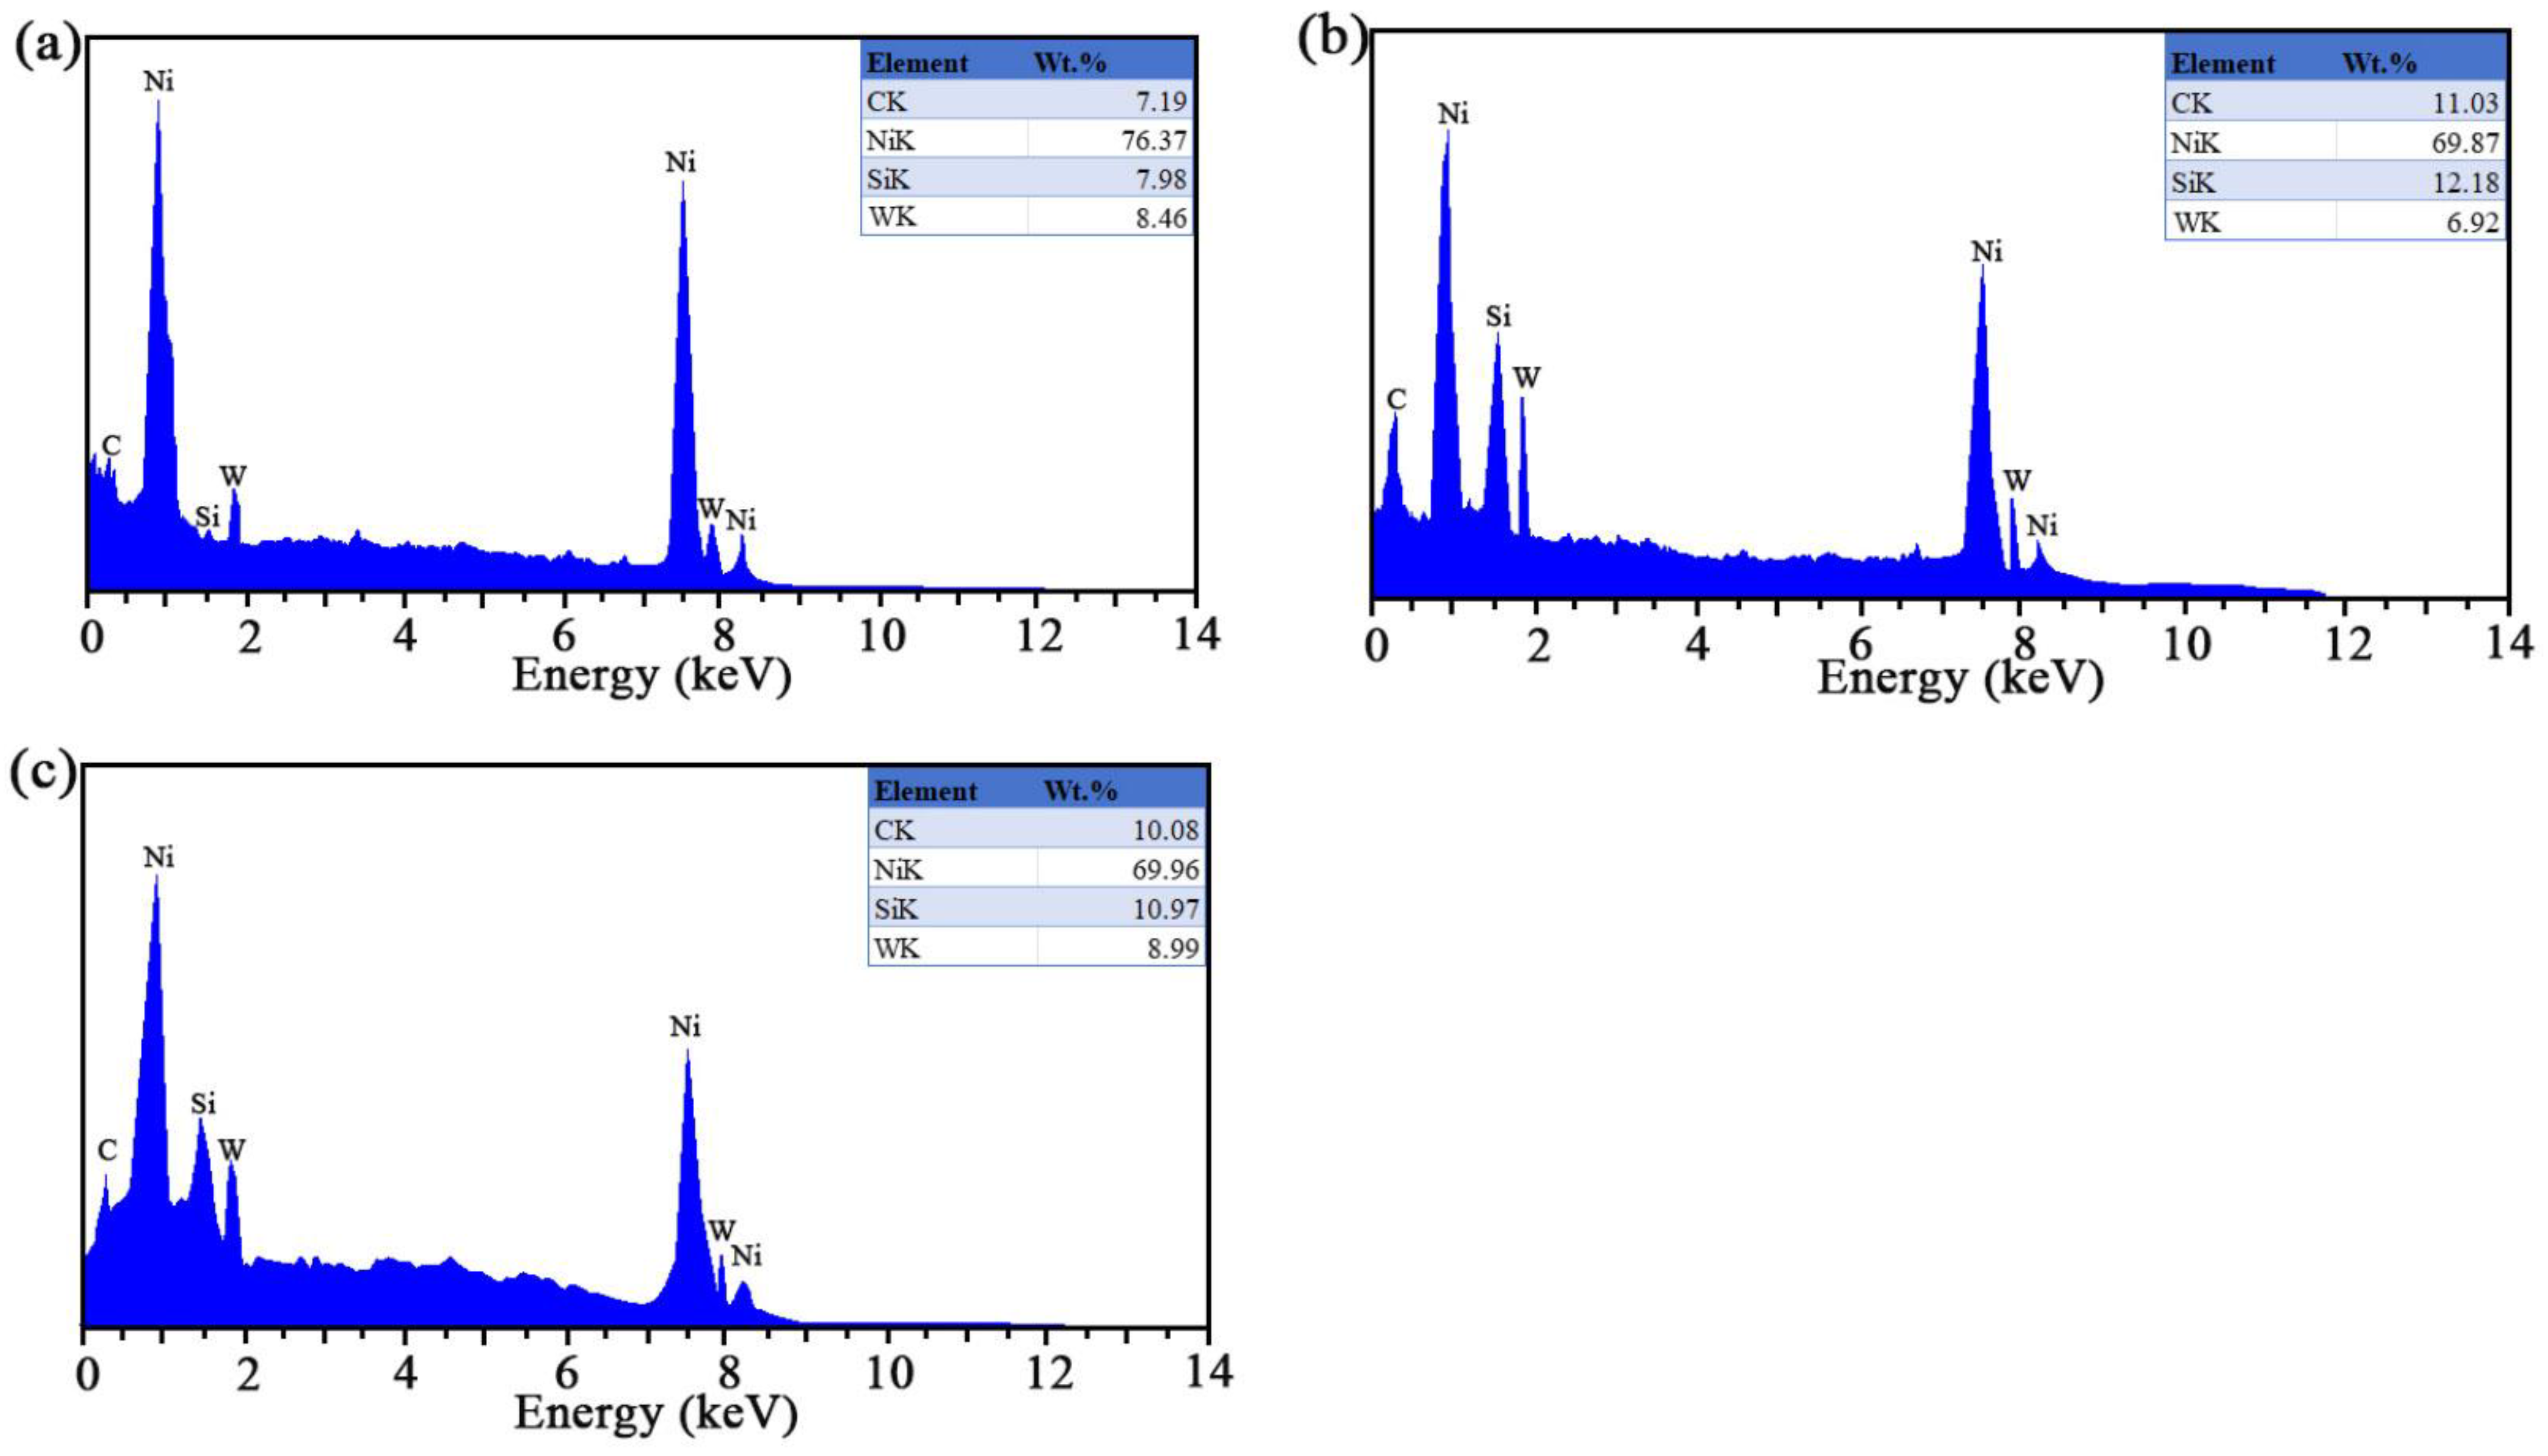
3.1. TEM and EDS Testing

The Ni-W-SiC coatings deposited with MFs applied in various orientations were investigated for their structures (Figure 2). Table 1 shows the average sizes of SiC NPs, as well as Ni-W grains present in the developed coatings. The considerable aggregation of SiC particles and surface porosity were observed in the S0 coating, showing the 76.6 nm average size for SiC and 133.4 nm for Ni-W grains. In contrast, the S1 coating featured a reasonably dense and compact surface. The mean Ni-W grain sizes were determined to be 84.7 nm for S1 and 103.4 nm for S2. The reported average particle sizes of SiC and Ni-W grains, as shown in Figure 2 and Table 1, were calculated using image analysis software on multiple TEM micrographs. At least 100 particles were measured in different regions of the images to obtain a statistically significant average. The particle size distribution was then analyzed, and the mean size was reported as the average particle size. This approach ensured that the reported sizes were representative of the overall microstructure of the coating. Among the three, S1 had the most compact and smooth surface, with SiC NPs averaging 53.1 nm in size. The differences in SiC particle sizes across the coatings can be explained by the higher surface energy of the nanomaterials, which promoted their recombination within the prepared coatings [11].
The SAED pattern was meticulously derived from the S1 sample, as illustrated in Figure 2d. The carefully selected beam irradiation region had a diameter of approximately 300 nm, and the controlled sample thickness was maintained below 100 nm to effectively prevent electron scattering and guarantee the crystal clearness of the diffraction rings. It was observed that diffraction rings corresponding to the (111), (220), and (311) planes were present. These rings confirmed the presence of the Ni-W and SiC phases, consistent with the XRD results. The (111) plane, associated with the Ni-W phase, and the (101) and (110) planes, corresponding to the SiC nanoparticles, indicated the crystalline nature of both phases. This confirms the successful incorporation of SiC nanoparticles into the Ni-W matrix with high crystallinity.
The EDS analysis of the coatings prepared using varying orientations of the MF is presented in Figure 3. The contents of SiC were measured to be 10.97 wt% for S2, 12.18 wt% for S1, and 7.98 wt% for S0 coatings. The increase in SiC content with the application of the magnetic field, especially in the perpendicular orientation (S1), can be scientifically explained by the enhanced magnetohydrodynamic (MHD) effects and magnetization phenomena introduced by the magnetic field. These effects promoted the uniform dispersion of SiC nanoparticles within the electrolyte and facilitated their incorporation into the growing Ni-W matrix. The Lorentz force generated by the perpendicular magnetic field orientation (S1) further aided in overcoming the gravitational sedimentation of SiC particles, leading to their higher concentration in the coating. During the process of ED, the MF application led to an increased SiC content within the coatings. Specifically, aligning the MF oriented perpendicularly to the electric field orientation resulted in a notable enhancement in SiC content, compared to parallel alignment. These findings are consistent with Rao et al.’s research, indicating that the MF introduction enhances the SiC particle deposition [12].
The aforementioned observations can be ascribed to the following processes: (1) The perpendicular orientation of the MF to the electric field resulted in the generation of a Lorentz force (Figure 4a), which caused the occurrence of the MHD effect. The green dot lines was the motion trajectories of SiC particles. This phenomenon, as observed in previous studies by Yih [13], minimized the SiC particles’ aggregation and gravitational sedimentation within the electrolyte, hence providing the smooth and dense surface of the Ni-W-SiC coating (Figure 2b). Conversely, when the MF aligned with the electric field (as depicted in Figure 4b), the Lorentz force was 0 N, and agglomerated SiC particles were deposited on the surface of the substrate. (2) The MHD impact enhanced the mixing of electrolytes, which helped detach hydrogen bubbles from the cathode surface and reduced polarization concentration, as noted in a study undertaken by Li et al. [14]. (3) The effect of magnetization reduced the energy needed for ion deposition onto the surface of the cathode during ED. The combined effects of MHD and magnetization can thus be responsible for the compact, flat, and uniform surface morphologies of S1 and S2 samples, compared to the S0 sample [15].

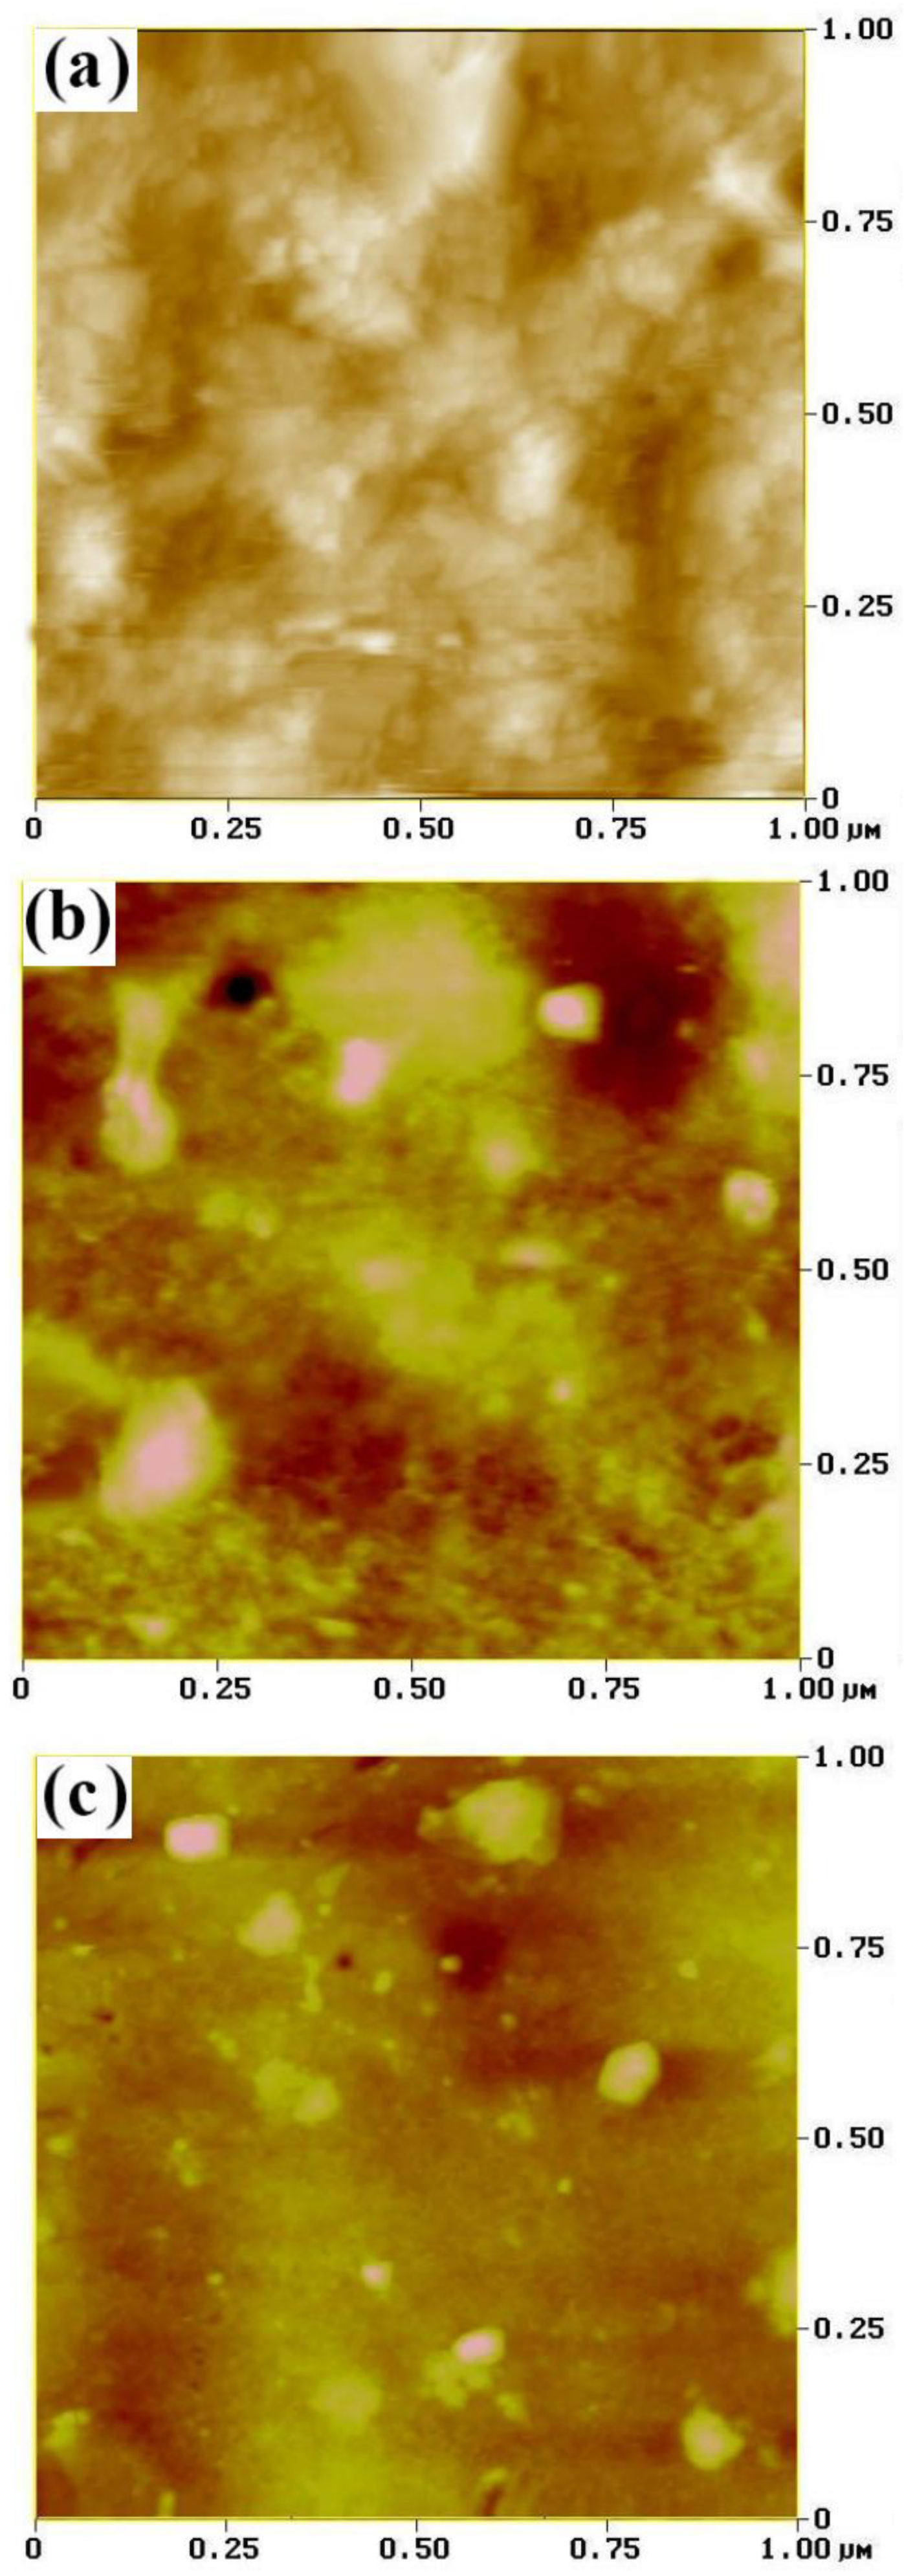
3.2. AFM Measurement
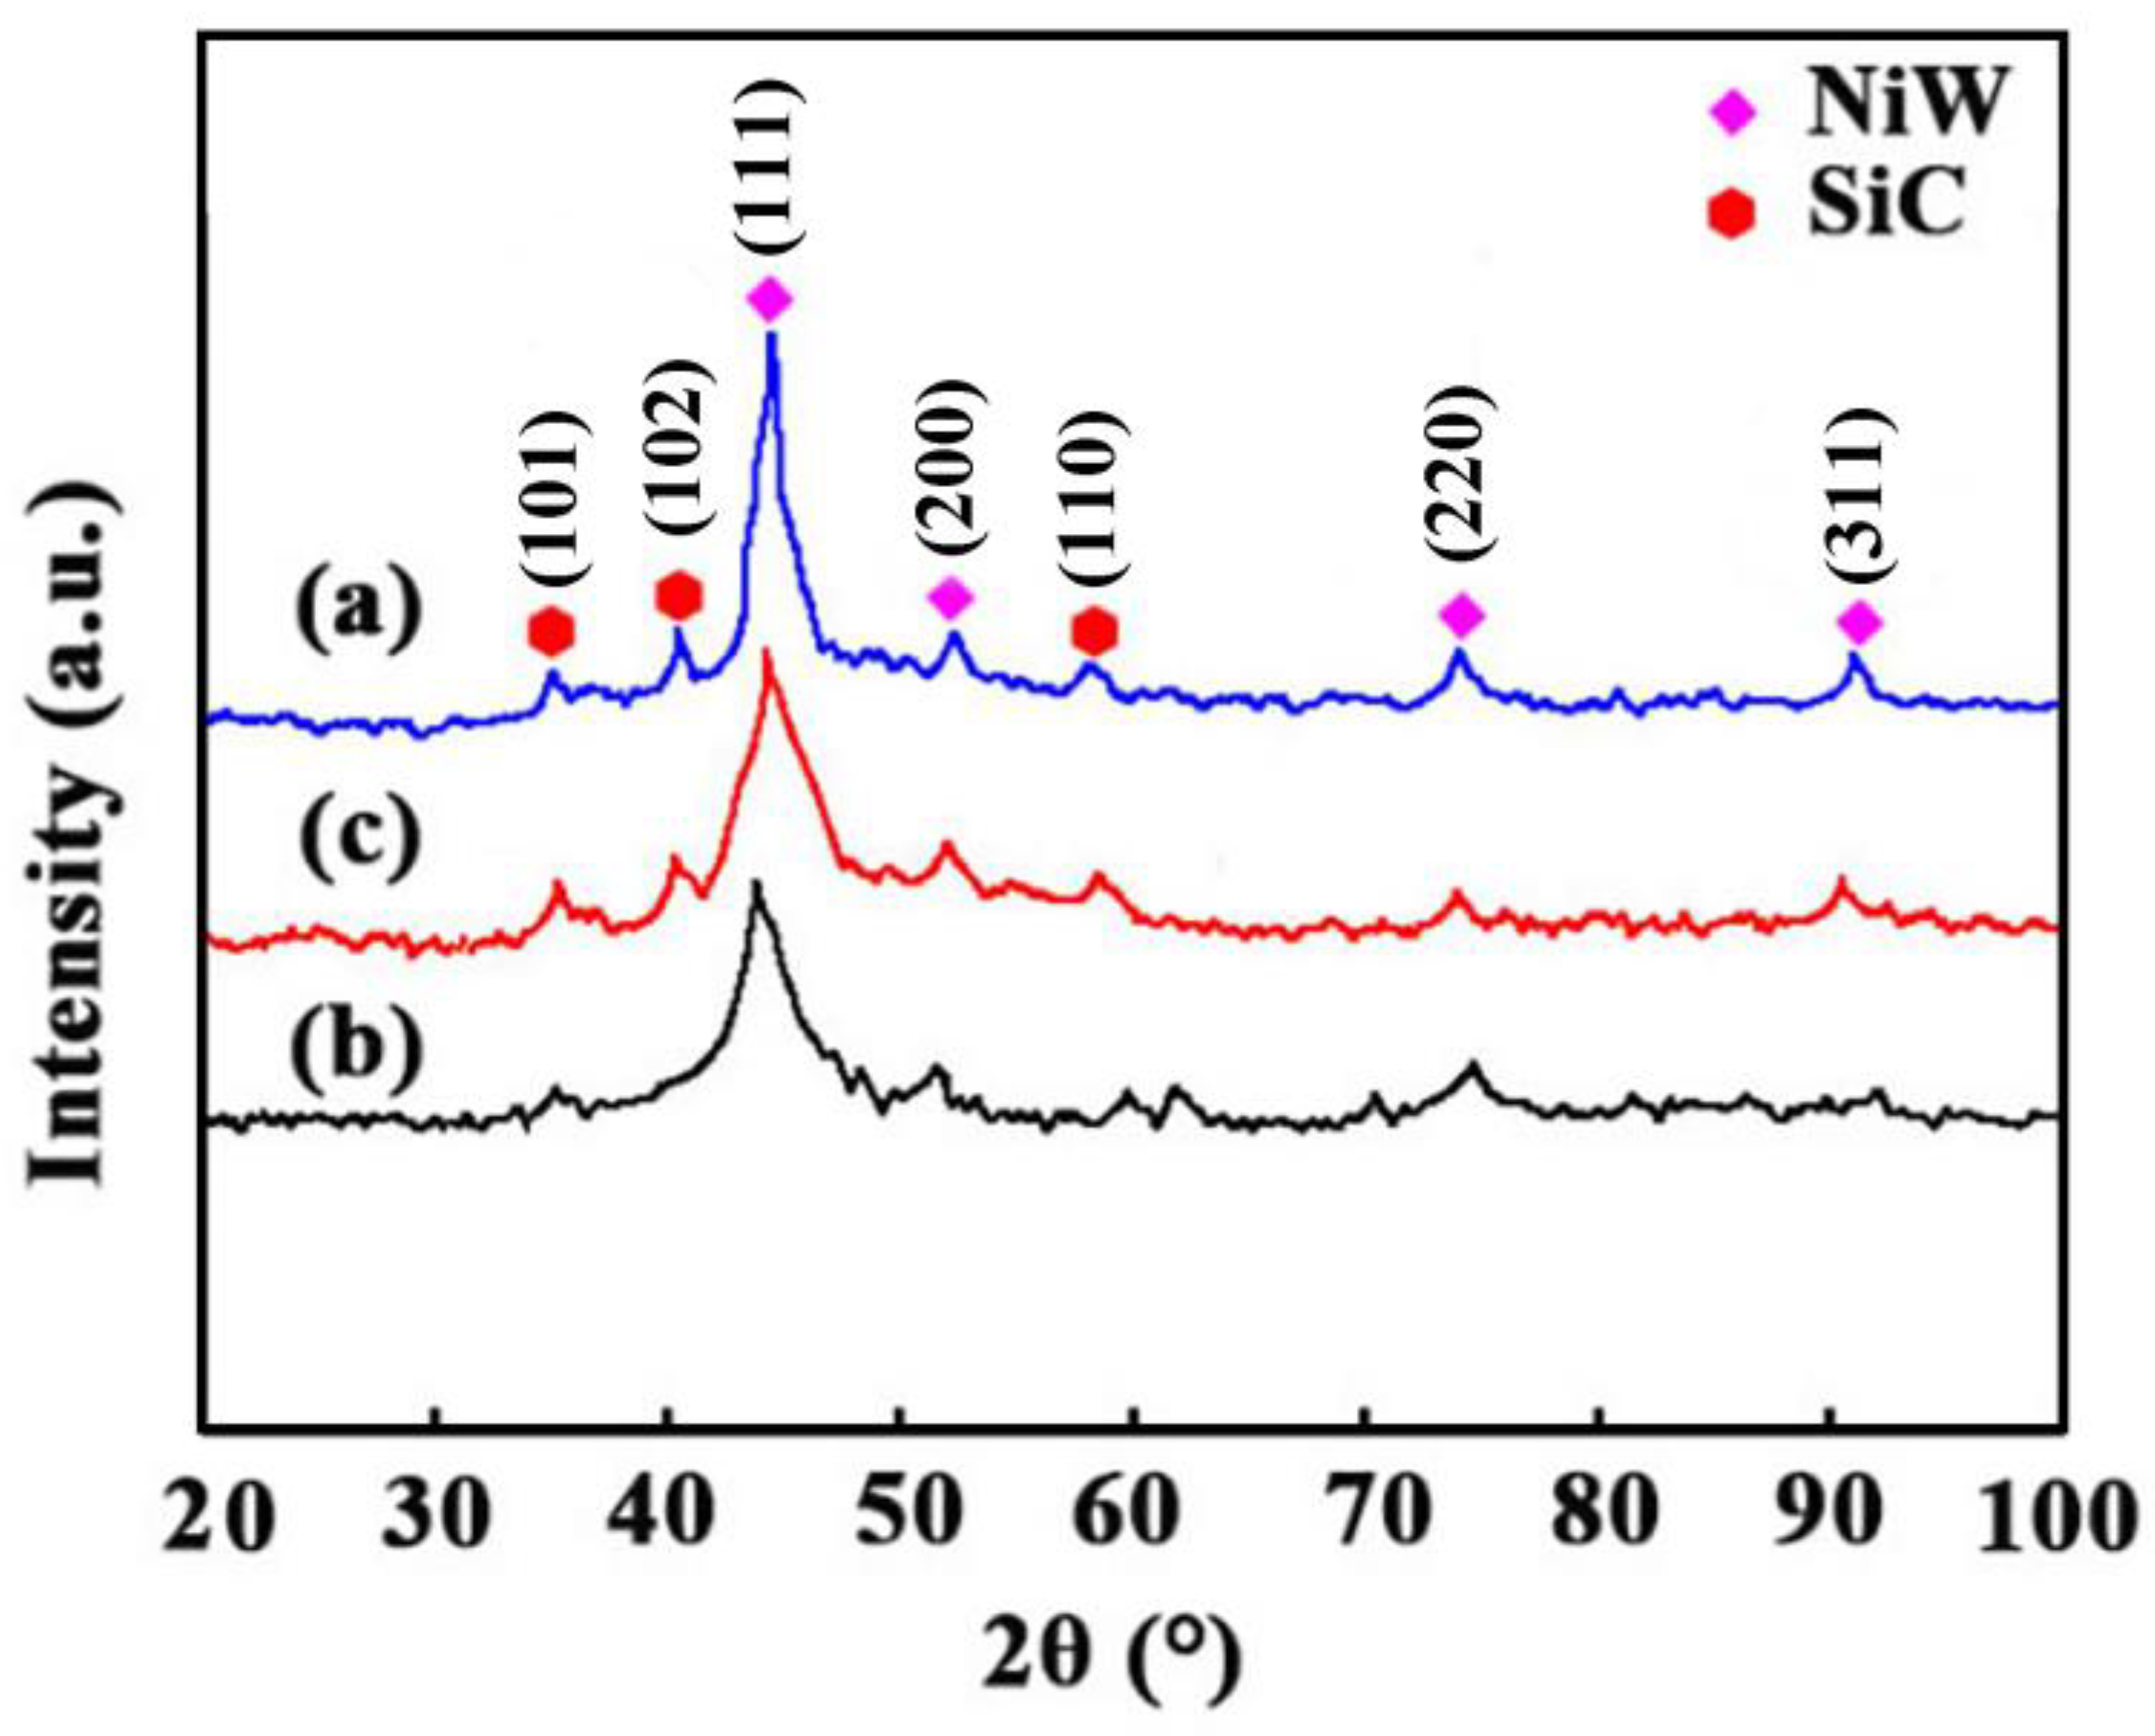
The acquired AFM images for the prepared coatings are provided in Figure 5, illustrating their surface characteristics. S0 displayed a rough surface, with a contour arithmetic mean deviation (Ra) of 223.82 nm. The coatings that were deposited under an MF exhibited reduced SiC particle agglomeration and finer grain size of Ni particles. S1 showed notably less surface roughness, with a 24.46 nm Ra value compared to S0, while S2 exhibited a 47.40 nm Ra value. The correlation between the increased SiC content, particularly in the S1 sample, and the reduced surface roughness can be attributed to the improved uniformity in particle dispersion and the reduced agglomeration of SiC nanoparticles. The perpendicular magnetic field (S1) effectively minimized the clustering of SiC particles due to the MHD effects, leading to a smoother surface with fewer defects. Consequently, the higher SiC content in S1 contributed to both its superior structural properties and enhanced surface smoothness, as observed in the AFM results. Wang et al. [16] indicated that the nucleation site number and the grain growth rate play a vital role in the roughness of Ni-SiC coatings. The MHD phenomenon was induced by introducing a perpendicularly oriented MF to the electric field, leading to the formation of numerous SiC particles serving as a nucleation site, along with providing the function to obstruct grain growth. Consequently, S1 exhibited a significantly lower Ra value in comparison to S2 and S0.

3.3. Crystallinity

Figure 6 and Table 2 illustrate the XRD profiles of Ni-W-SiC coatings, along with the XRD data for Ni-W grains and SiC particles in S0 coatings. According to the XRD data, the Ni-W diffraction peaks at 44.62°, 52.44°, 76.78°, and 92.46° were associated with the (111), (200), (220), and (311) planar directions in the Ni-W-SiC coatings [17]. During the SiC electroplating process, the presence of an MF changed the size and preferred Ni-W grain’s orientation. When an ED method was applied to deposit Ni-W-SiC coatings, a high and narrow diffraction peak (111) appeared in Figure 6a, indicating that the grains of the coating were large. While a parallel magnetic field was utilized during the ED process, the intensity of the peak (111) decreased. However, when a perpendicular magnetic field was employed, the diffraction peak (111) became the lowest and the widest among three coatings, demonstrating a fine, dense, and compact surface in the S1 coating, as shown in Figure 2b. The results illustrated that the perpendicular magnetic field notably impacted the intensity of diffraction peaks more than parallel alignment. These findings can be elucidated by two processes: (1) SiC particles serve as nucleating sites, inhibiting the growth of Ni-W grains in the (111) direction [18,19]. (2) A perpendicular magnetic field enhances the energy of activation needed for the W6+ and Ni2+ ions’ surface diffusion along the (111) plane direction, accelerating the (111) Ni-W grains formation and turning the metal grains in the Ni-W-SiC coating fine. In addition, the mean Ni-W and SiC sizes in S0 coating were 131.69 and 76.31 nm, which were consistent with the TEM results.

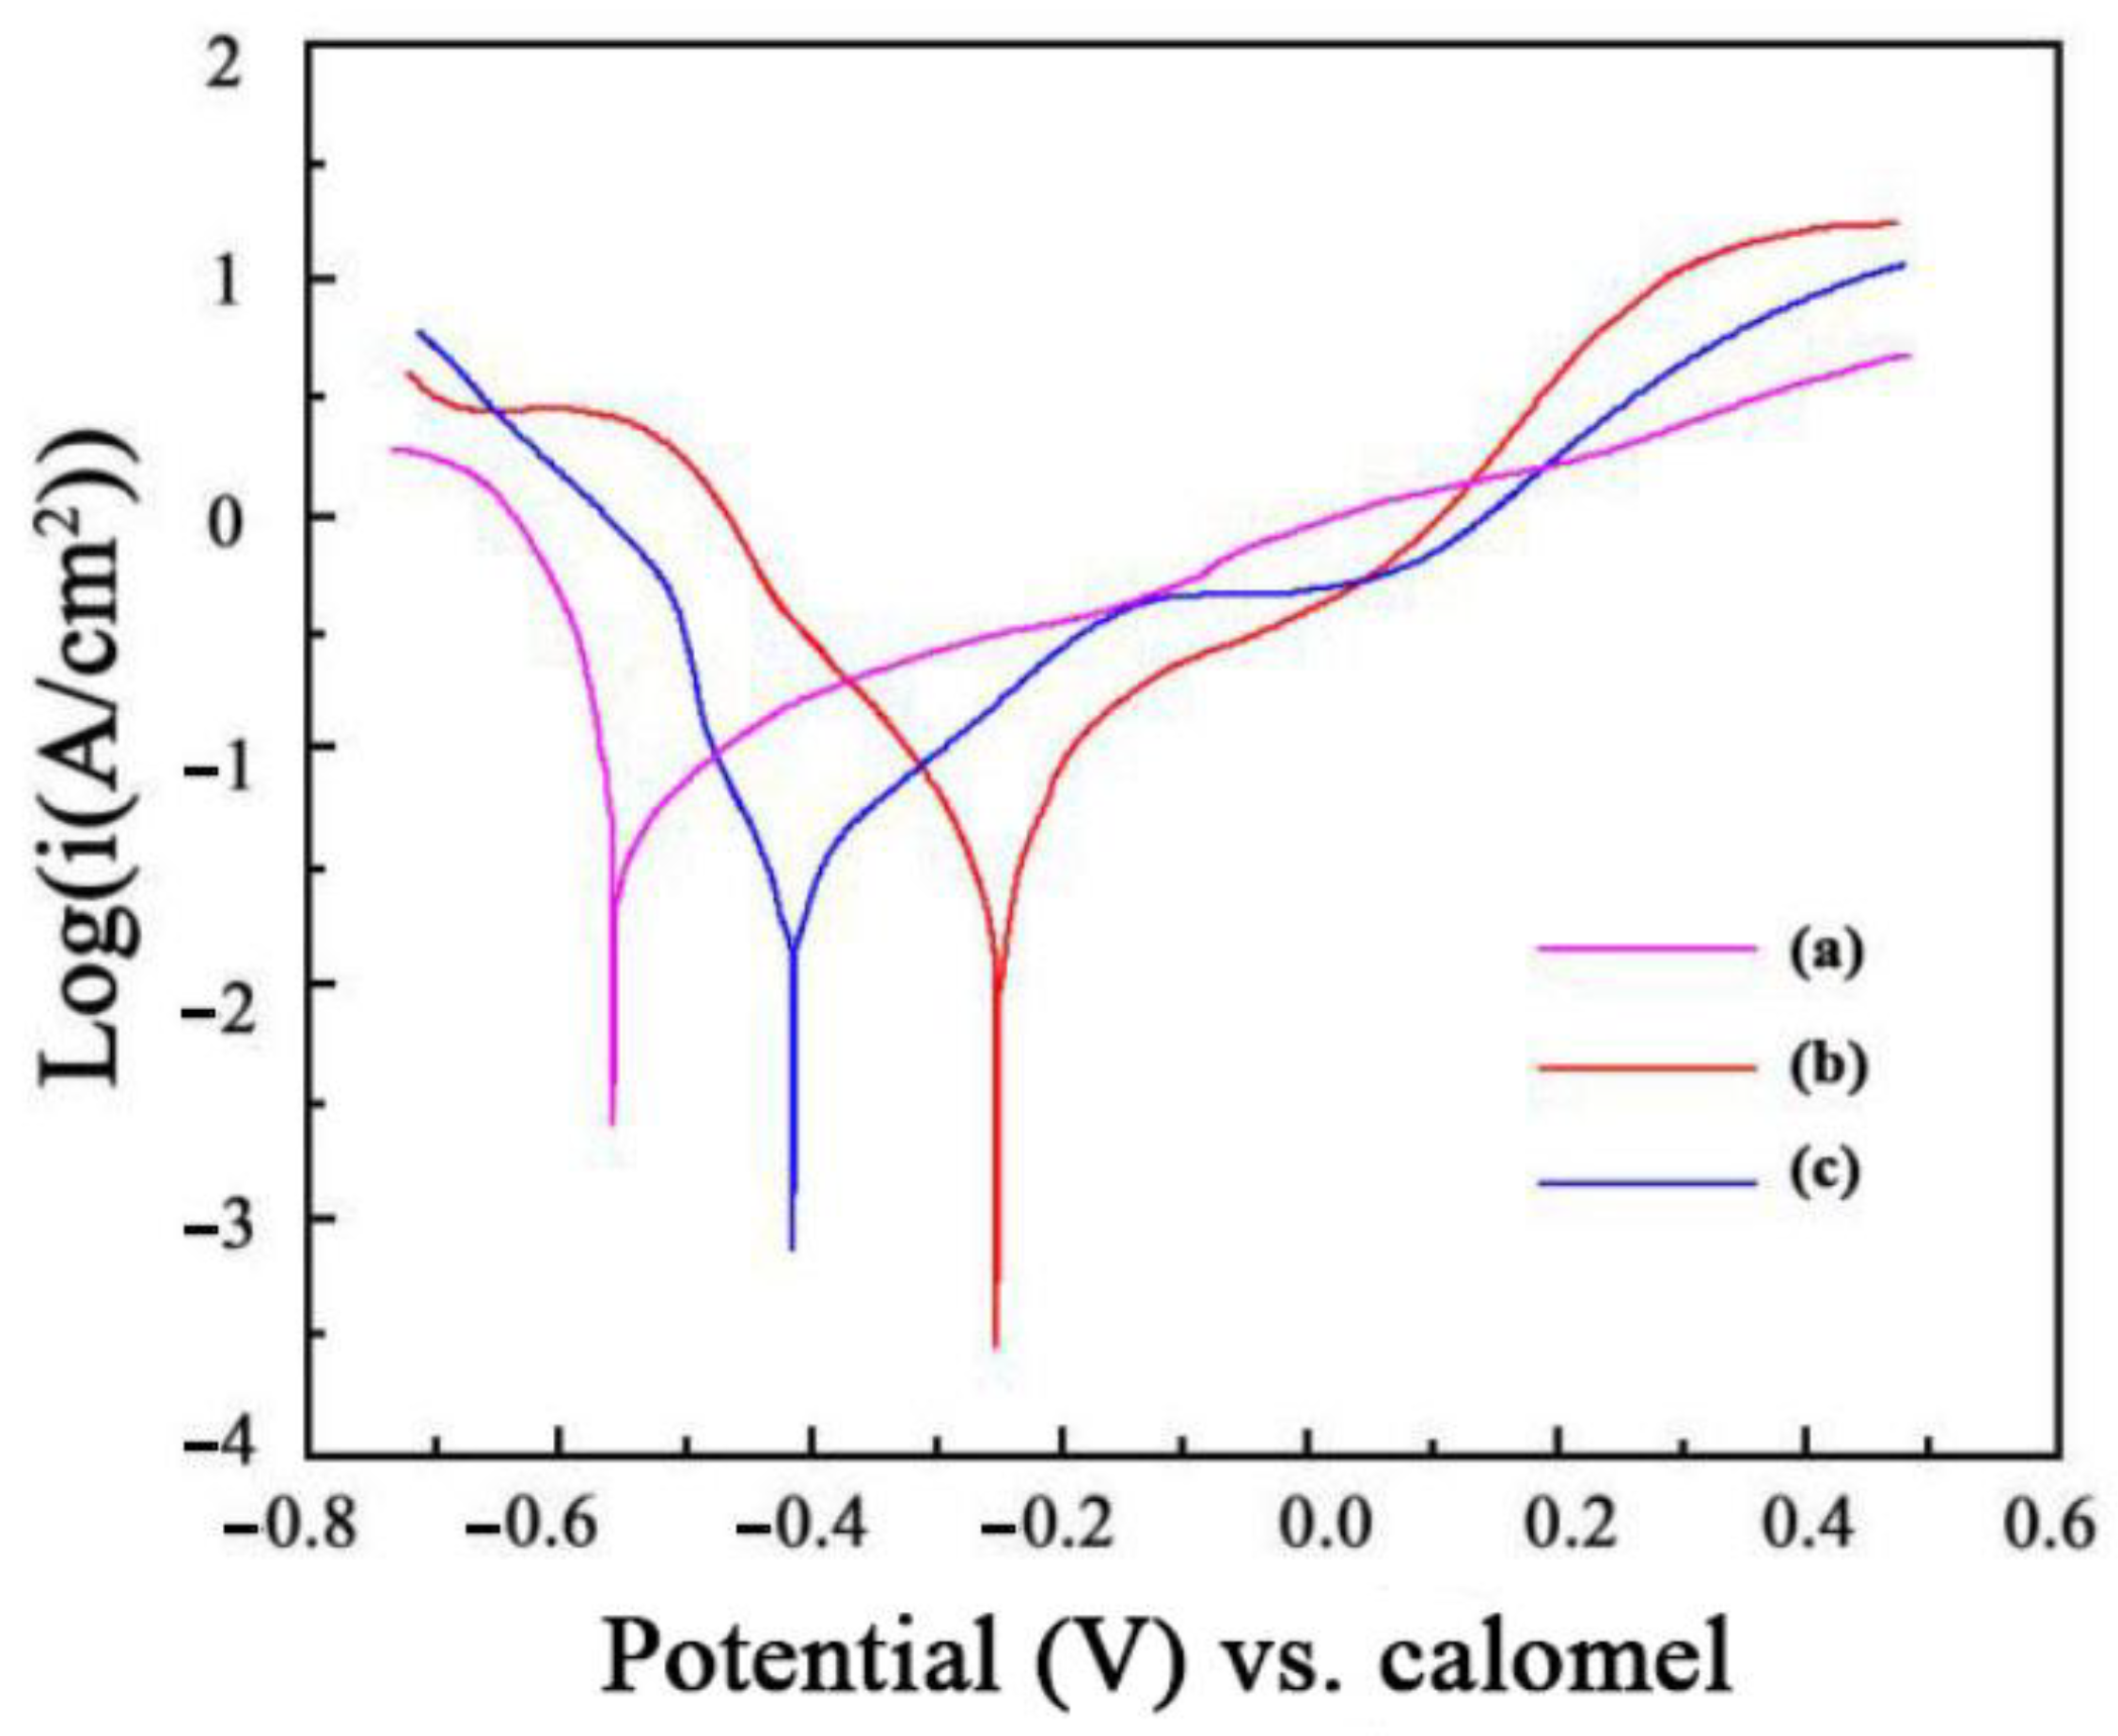
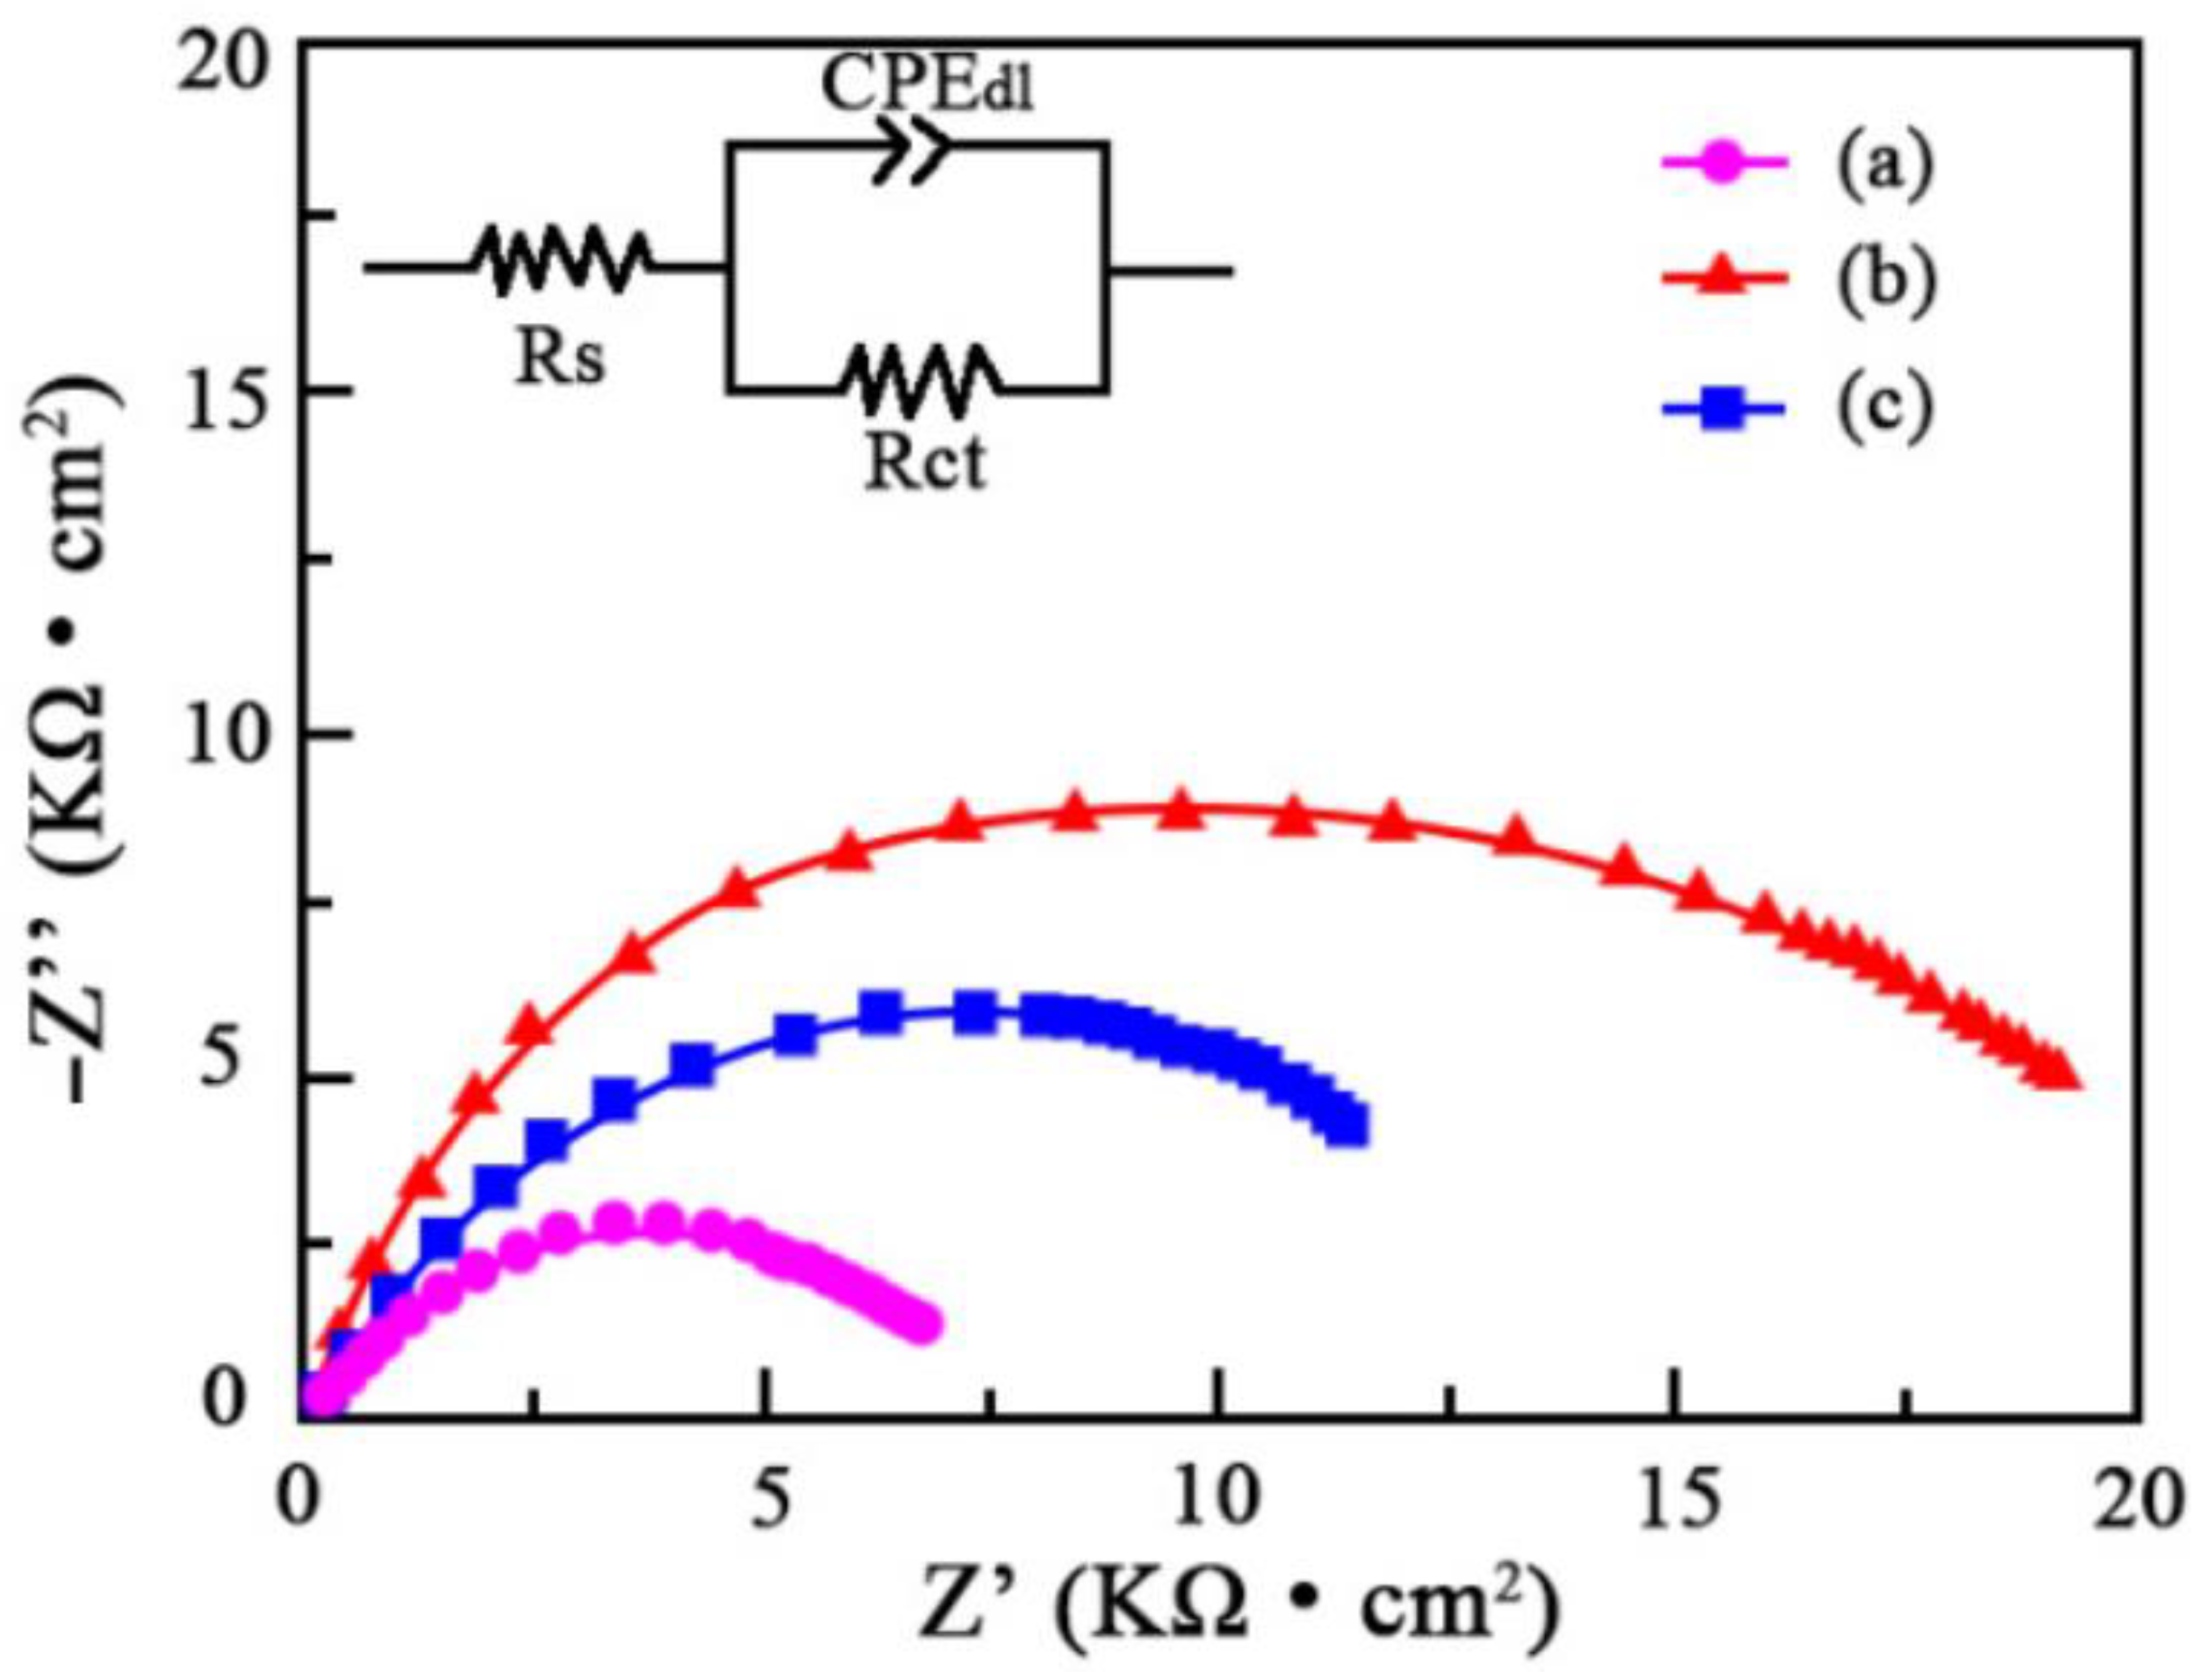
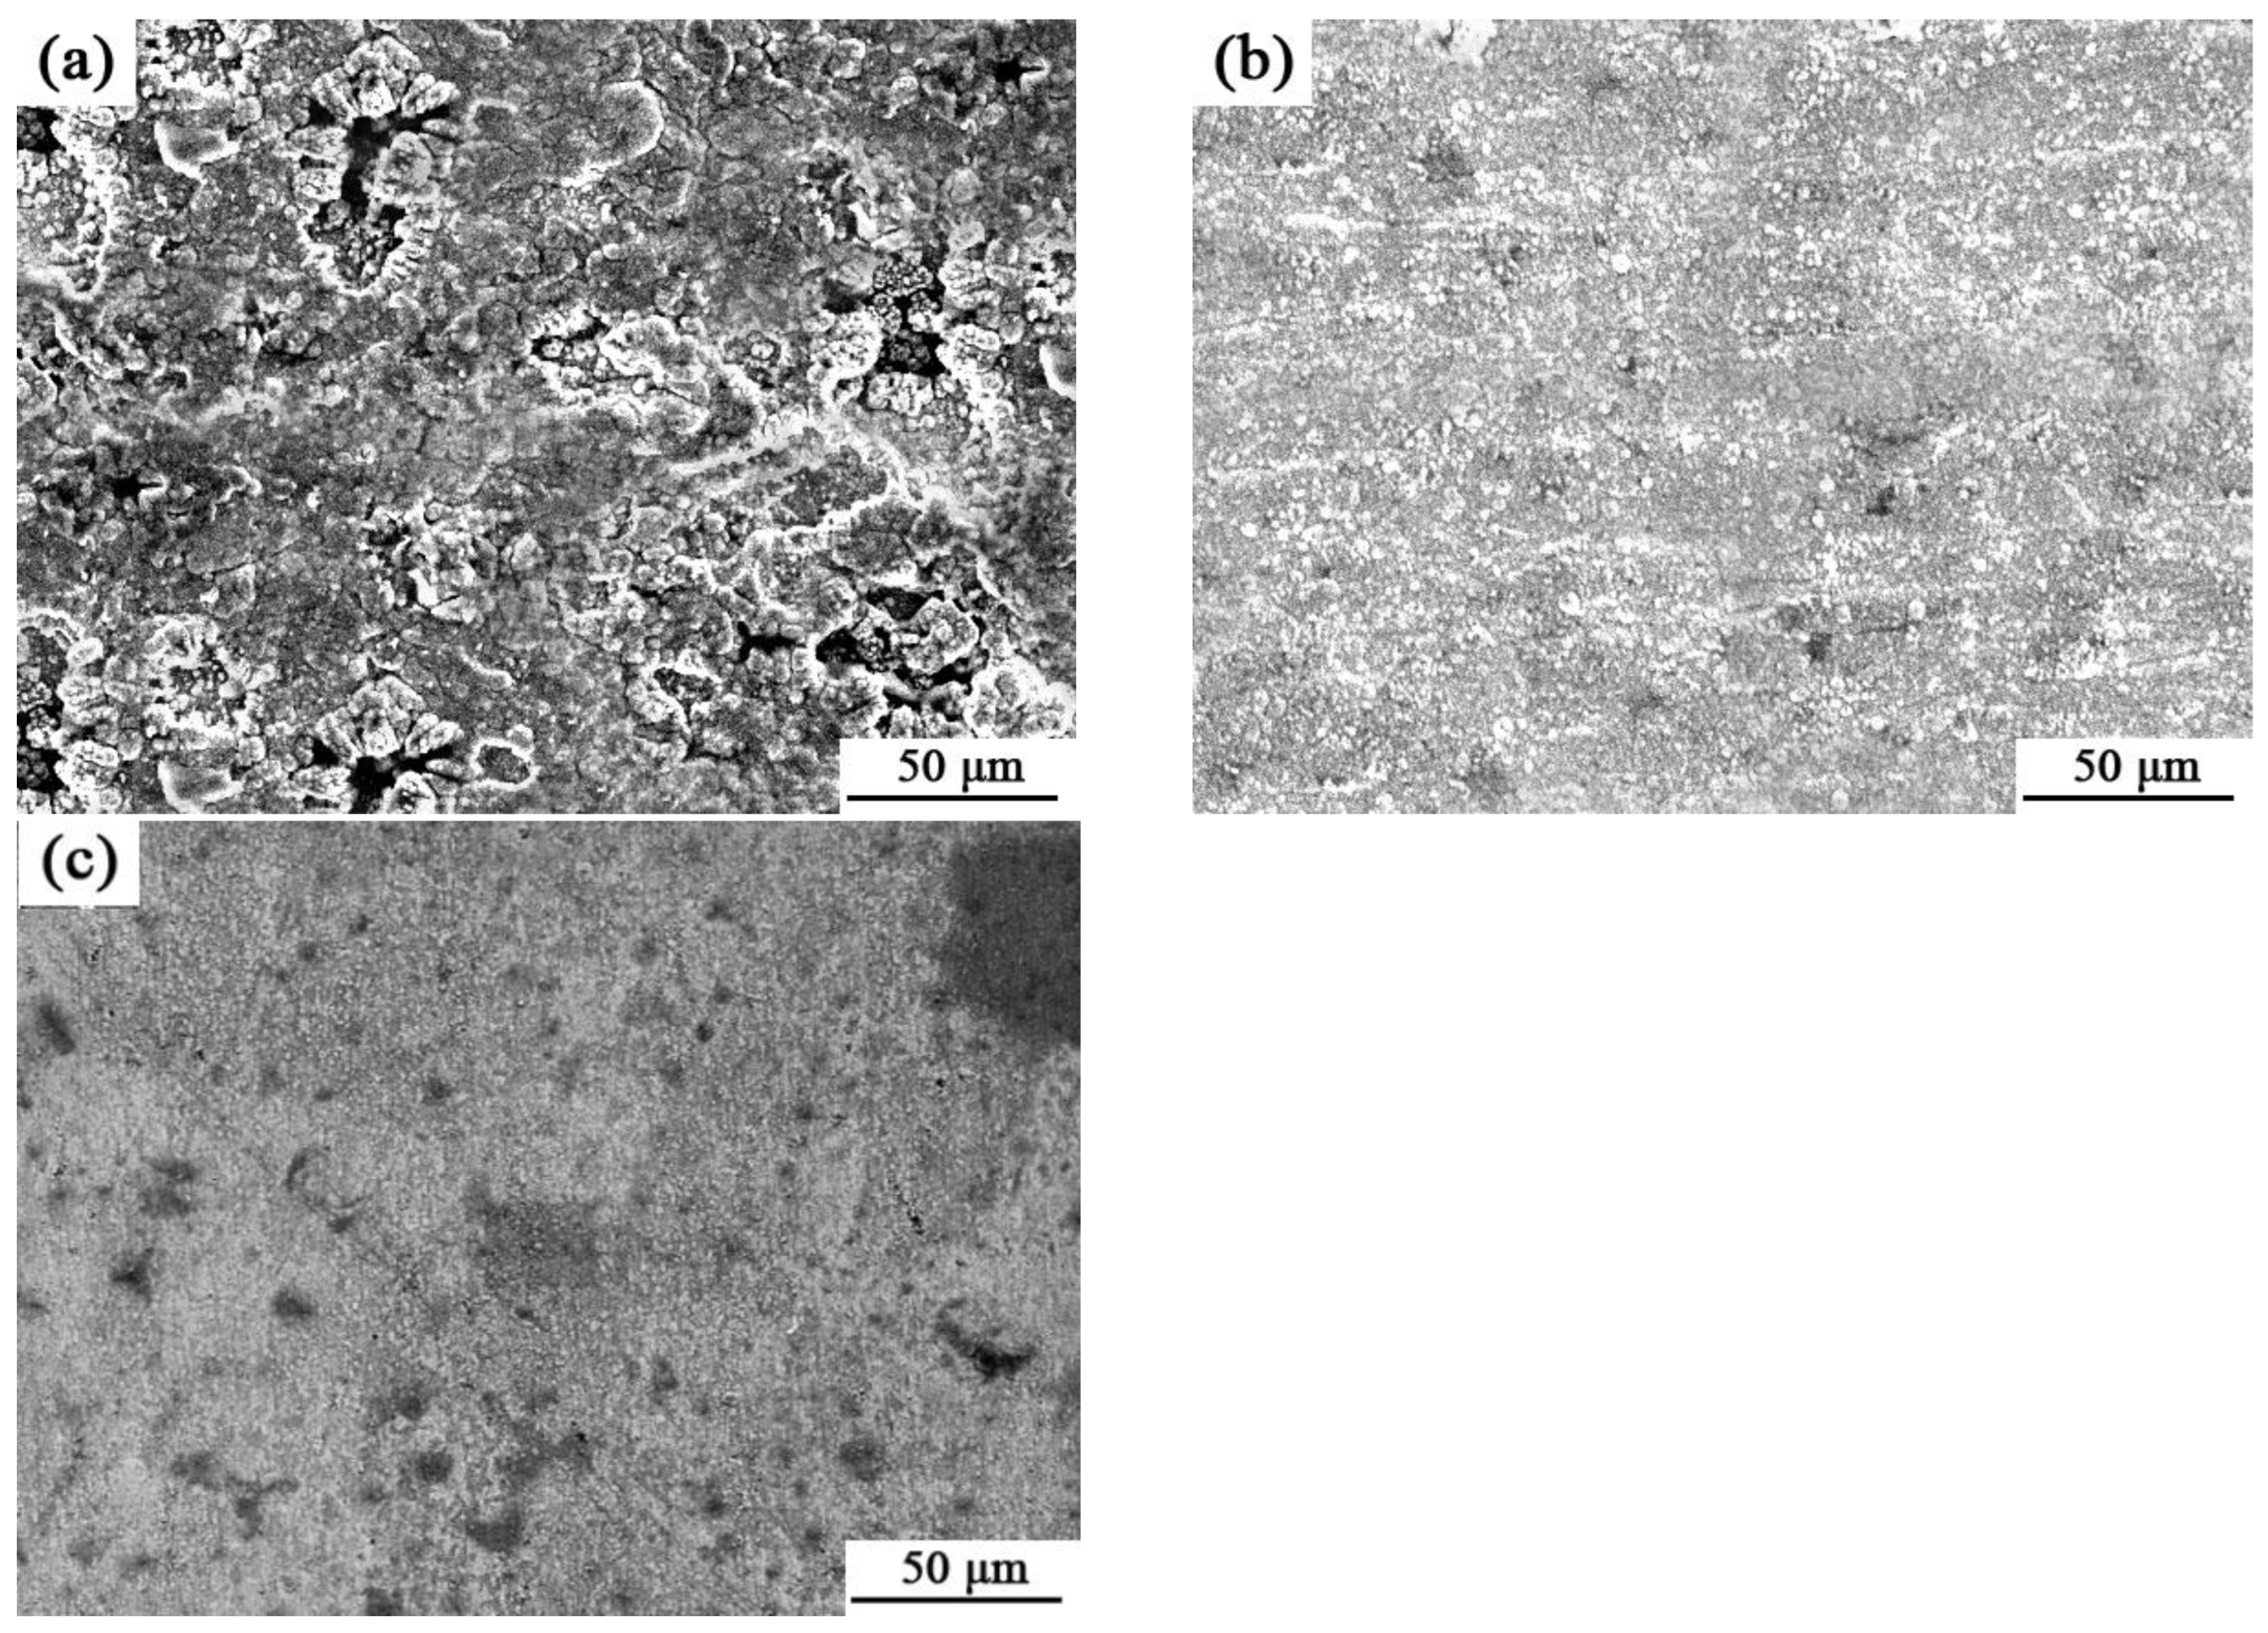
3.4. Corrosion Resistance

Figure 7 illustrates the Ni-W-SiC coatings’ polarization curves when immersed in an NaCl solution (3.5 wt%). In such environments, increased corrosion potential and reduced corrosion current indicate the coating’s enhanced resistance to corrosion [20]. S1 had a 0.479 μA/cm2 corrosion current and a −0.25 V corrosion potential, while S0 had values of 2.125 μA/cm2 and −0.58 V, respectively. These findings suggest that S1 offers increased corrosion resistance, compared to S0. Moreover, the respective rates of corrosion for the S2, S0, and S1 coatings were 2.33 × 10⁻³, 3.84 × 10⁻³, and 7.38 × 10⁻⁴ mm/a. The enhanced corrosion resistance observed in S1 correlated strongly with the increased hardness (Figure 10) and decreased coefficient of friction (Figure 11). The higher hardness of S1, due to its denser microstructure and higher SiC content, resulted in fewer defects and pores on the coating surface, reducing pathways for corrosive agents to penetrate. Additionally, the lower coefficient of friction indicated a smoother surface, which further minimized the interaction with corrosive environments by reducing the effective surface area exposed to the corrosive medium. Therefore, the improved mechanical properties directly contributed to the enhanced corrosion resistance observed in S1.
The prepared coatings were analyzed for their corrosion characteristics using Nyquist plots, as depicted in Figure 8. Table 3 presents the charge transfer and solution resistances of Ni-W-SiC coatings. The electric double-layer capacity is represented as CPEdl. The charge transfer and solution resistances are denoted by Rct and Rs, respectively. The solution resistance (Rs), representing the electrolyte resistance, remained relatively consistent across all samples, ranging from 152 to 206 Ω·cm2. This suggests that the electrolyte composition and conductivity were relatively stable for all tests.
In contrast, the charge transfer resistance (Rct), which is associated with the resistance to electron transfer at the electrode–electrolyte interface, showed significant variation among the samples. The S0 coating, with the lowest Rct value (6391 Ω·cm2), demonstrated superior charge transfer kinetics, which was attributed to better electrode surface characteristics or enhanced catalytic activity. The S1 coating exhibited the highest Rct value (10,582 Ω·cm2), indicating that it experienced greater resistance to charge transfer, due to surface morphology or less efficient electron transport. The intermediate Rct value for the S2 coating (8143 Ω·cm2) suggested moderate performance, due to a combination of factors affecting both the surface structure and electron transfer efficiency. Low resistance to corrosion and lower impedance coatings are related, according to Li et al. [21]. In comparison to S0 and S2, S1 had a noticeably greater impedance, which indicates its improved corrosion resistance. This observation aligns with the polarization plots observed in the Ni-W-SiC coatings (refer to Figure 7).
The corrosion morphologies of Ni-W-SiC coatings are illustrated in Figure 9. Corrosion testing revealed extensive surface deterioration and numerous holes in S0. In contrast, coatings produced under MFs showed reduced corrosion damage. Specifically, Figure 9b indicates that S1 exhibited minimum corrosion damage, compared to S2. This observation suggests that the MF has a role in the structure’s densification and refinement of grains, thereby reducing the contact area present between the coating and the corrosive solution [22,23]. The more uniform distribution of SiC particles within the S1 coating acts as a physical barrier, hindering the penetration of Cl ions from the NaCl solution. When SiC particles are evenly distributed, they create a tortuous path for the corrosive agents to reach the metal matrix, effectively increasing the diffusion distance that Cl ions must travel. This increased pathway delays the onset of corrosion by making it more difficult for the ions to penetrate through the coating to the underlying metal. As a result, the homogeneous SiC particle distribution contributes to enhanced corrosion resistance by disrupting the continuity of the corrosive pathway, thereby protecting the coating from an aggressive Cl ion attack. Moreover, the homogeneous SiC particle distribution during the coatings increases the pathway of Cl ion corrosion, enhancing the coatings’ corrosion resistance [24].

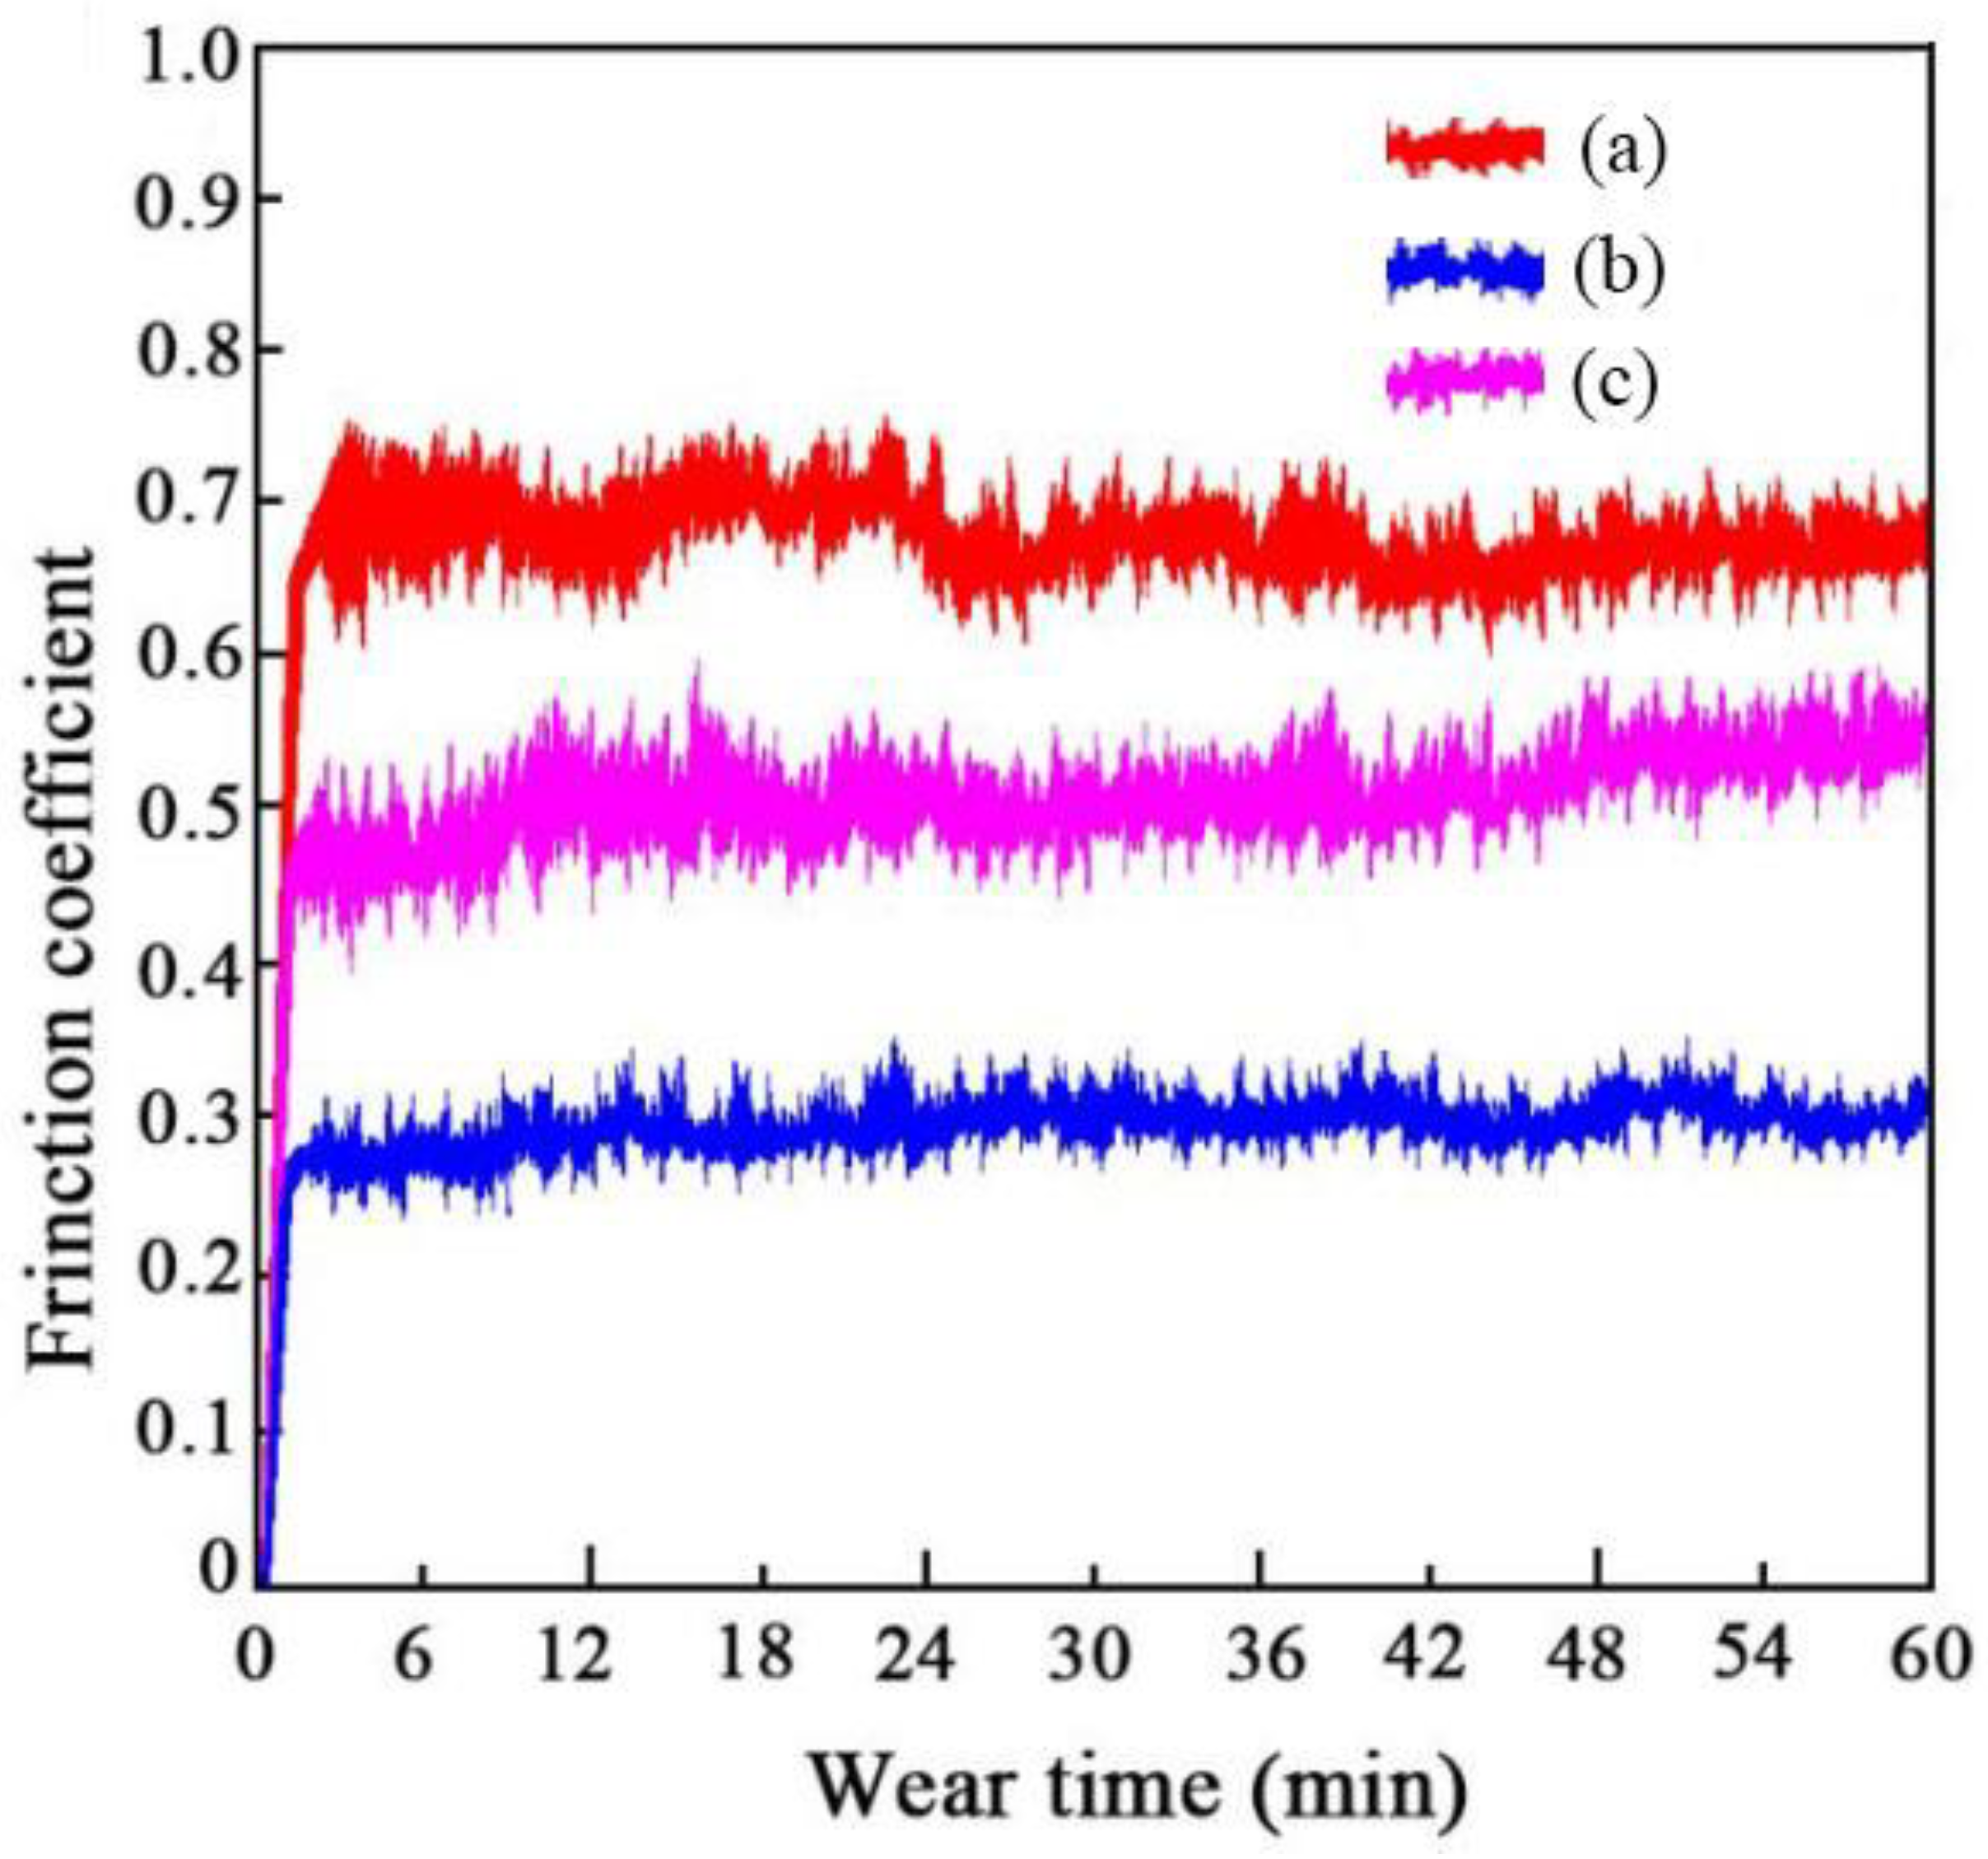
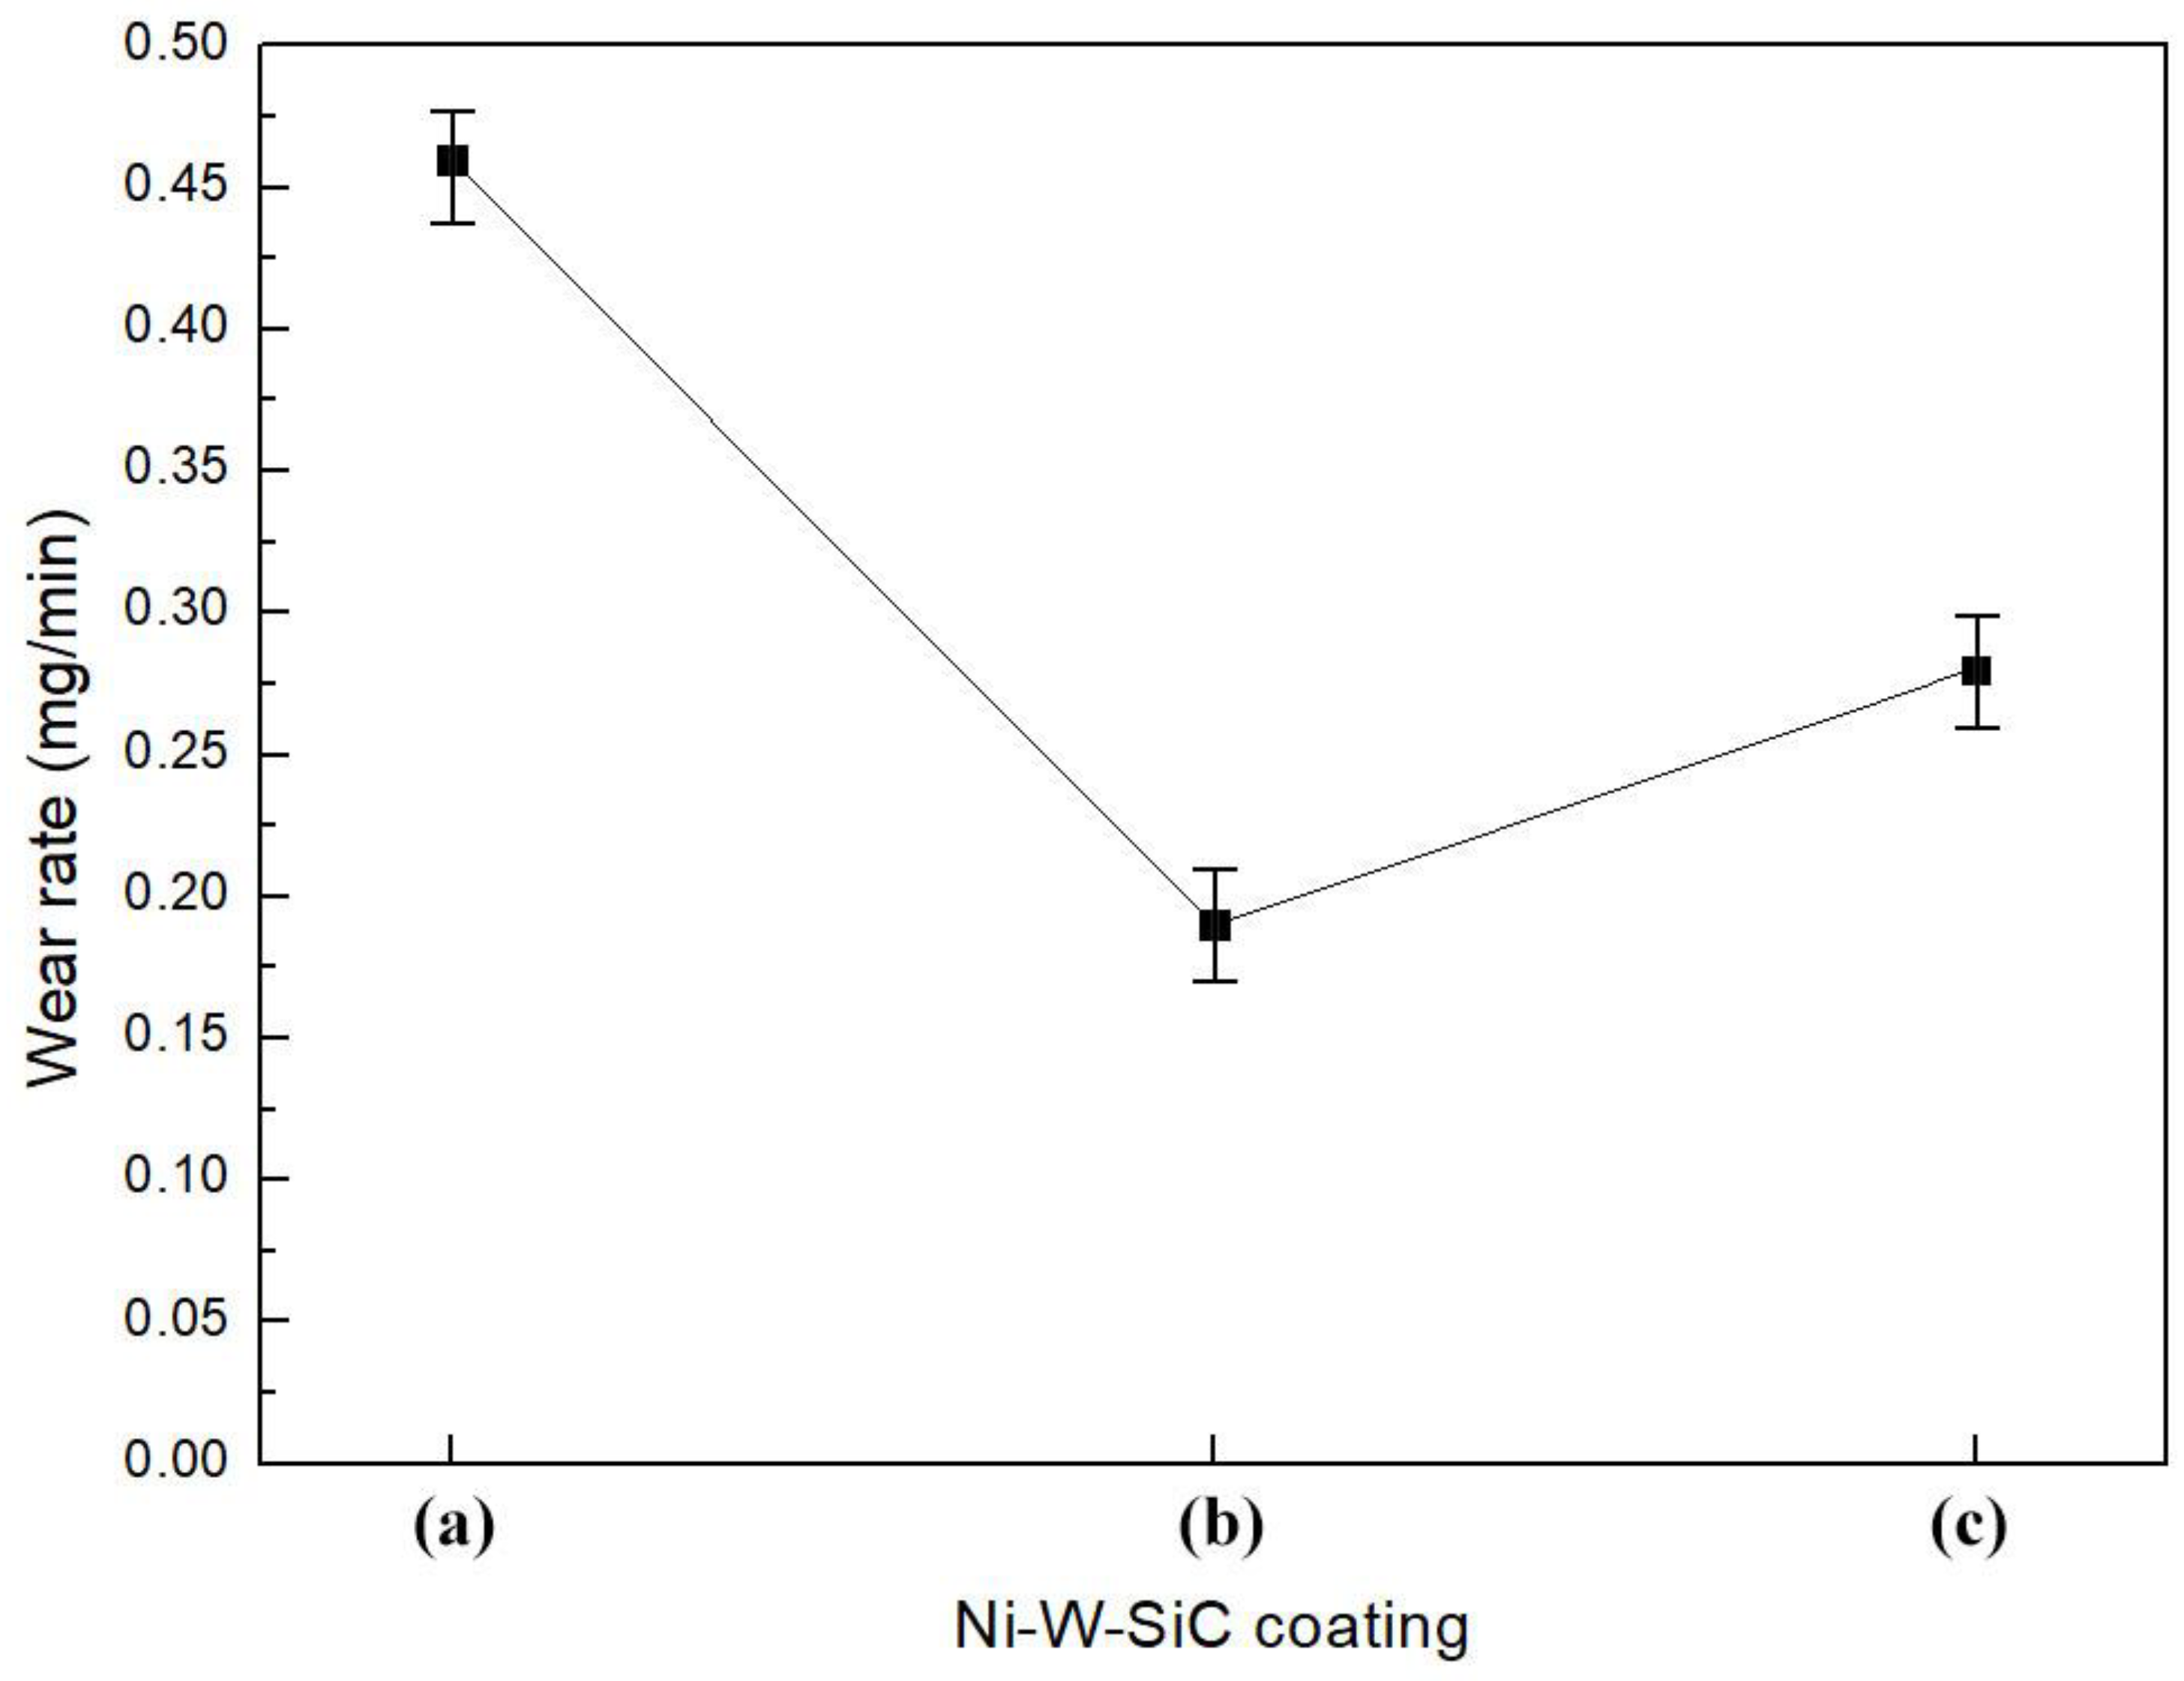
3.5. Abrasion Resistance

The hardness values for the prepared coatings are illustrated in Figure 10, with average microhardness measurements of 759.6 HV for S2, 918.3 HV for S1, and 661.9 HV for S0. An even dispersion of ceramic particles improves microhardness, according to Zhang et al. [25]. In these coatings, the even dispersion of numerous SiC particles contributed to increased dispersion hardening and fine crystal strengthening effects, hence increasing S1 and S2’s microhardness values. The correlation between hardness and corrosion resistance was evident, as a harder coating like S1 resists deformation and wear, leading to a more uniform surface that is less prone to corrosion. Furthermore, SiC particles demonstrated superior microhardness, compared to Ni grains [26,27]. Thus, the improved microhardness of S1 (Figure 3b) was correlated with its greater SiC concentration.
The coefficients of friction for the S0, S1, and S2 coatings are presented in Figure 11, with their values were determined to be 0.69, 0.28, and 0.52, respectively. The incorporation of an MF increased the SiC particles’ concentration and reduced their agglomeration during the ED process. As a result, S1 exhibited the smallest coefficient of friction among the three coatings, due to its smooth and compact surface morphology [28]. The lower coefficient of friction observed in S1 not only correlated with its superior wear resistance but also with its enhanced corrosion resistance. A smoother surface with fewer asperities reduces wear during mechanical interactions and limits sites for corrosion initiation. The interconnected improvements in corrosion resistance (Figure 7), hardness (Figure 10), and friction coefficient (Figure 11) in S1 can be attributed to the optimized microstructure provided by the perpendicular magnetic field, which enhances the uniform distribution of SiC particles and the overall integrity of the coating.
The wear rates for the S0, S1, and S2 coatings were respectively determined to be 0.46, 0.19, and 0.28 mg/min, as presented in Figure 12. The incorporation and distribution of SiC particles within these coatings had a notable effect on their respective wear rates. During ED, the coating’s hardness was enhanced by the introduction of a perpendicularly oriented MF, which enabled the SiC NP content to be uniformly distributed [29]. Consequently, S1 demonstrated the lowest wear rate among the coatings studied. In contrast, applying a parallel MF to the microscale vertex convection produced by ED enhanced the mass transfer of electrolytes and facilitated SiC NPs incorporation into S2, thereby leading to a higher wear rate for S0, compared to S2 (Figure 12a).

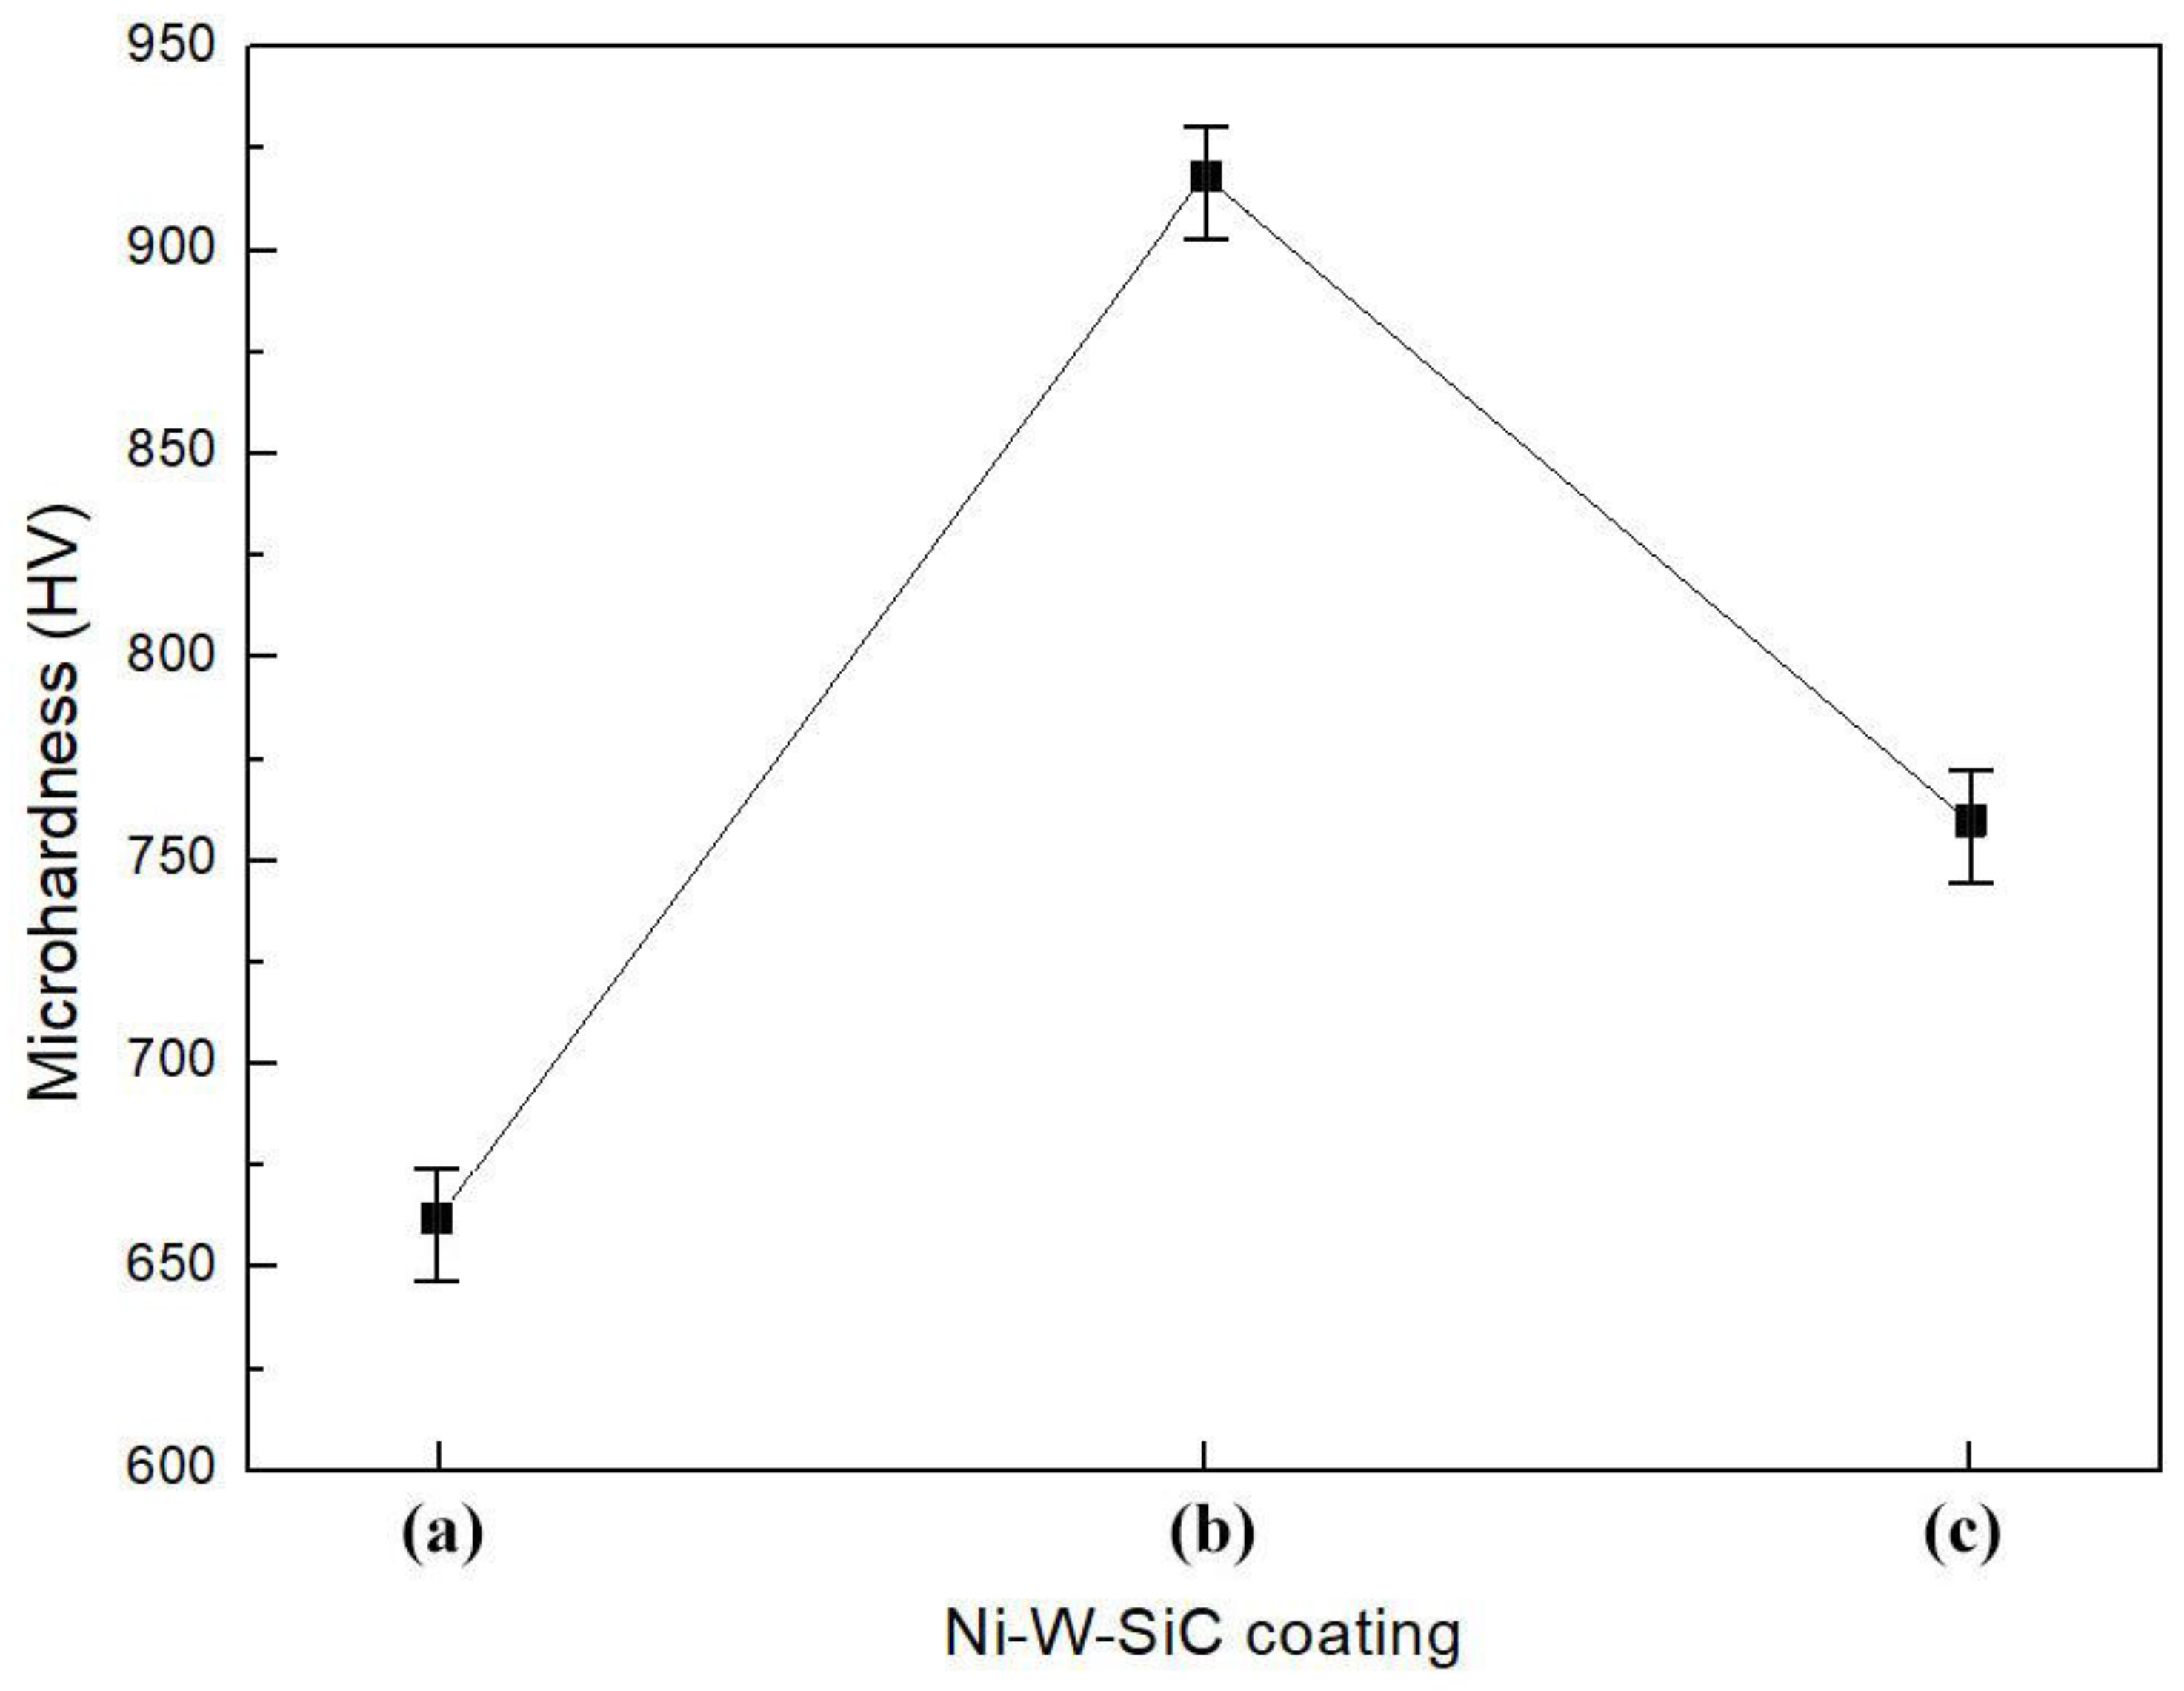
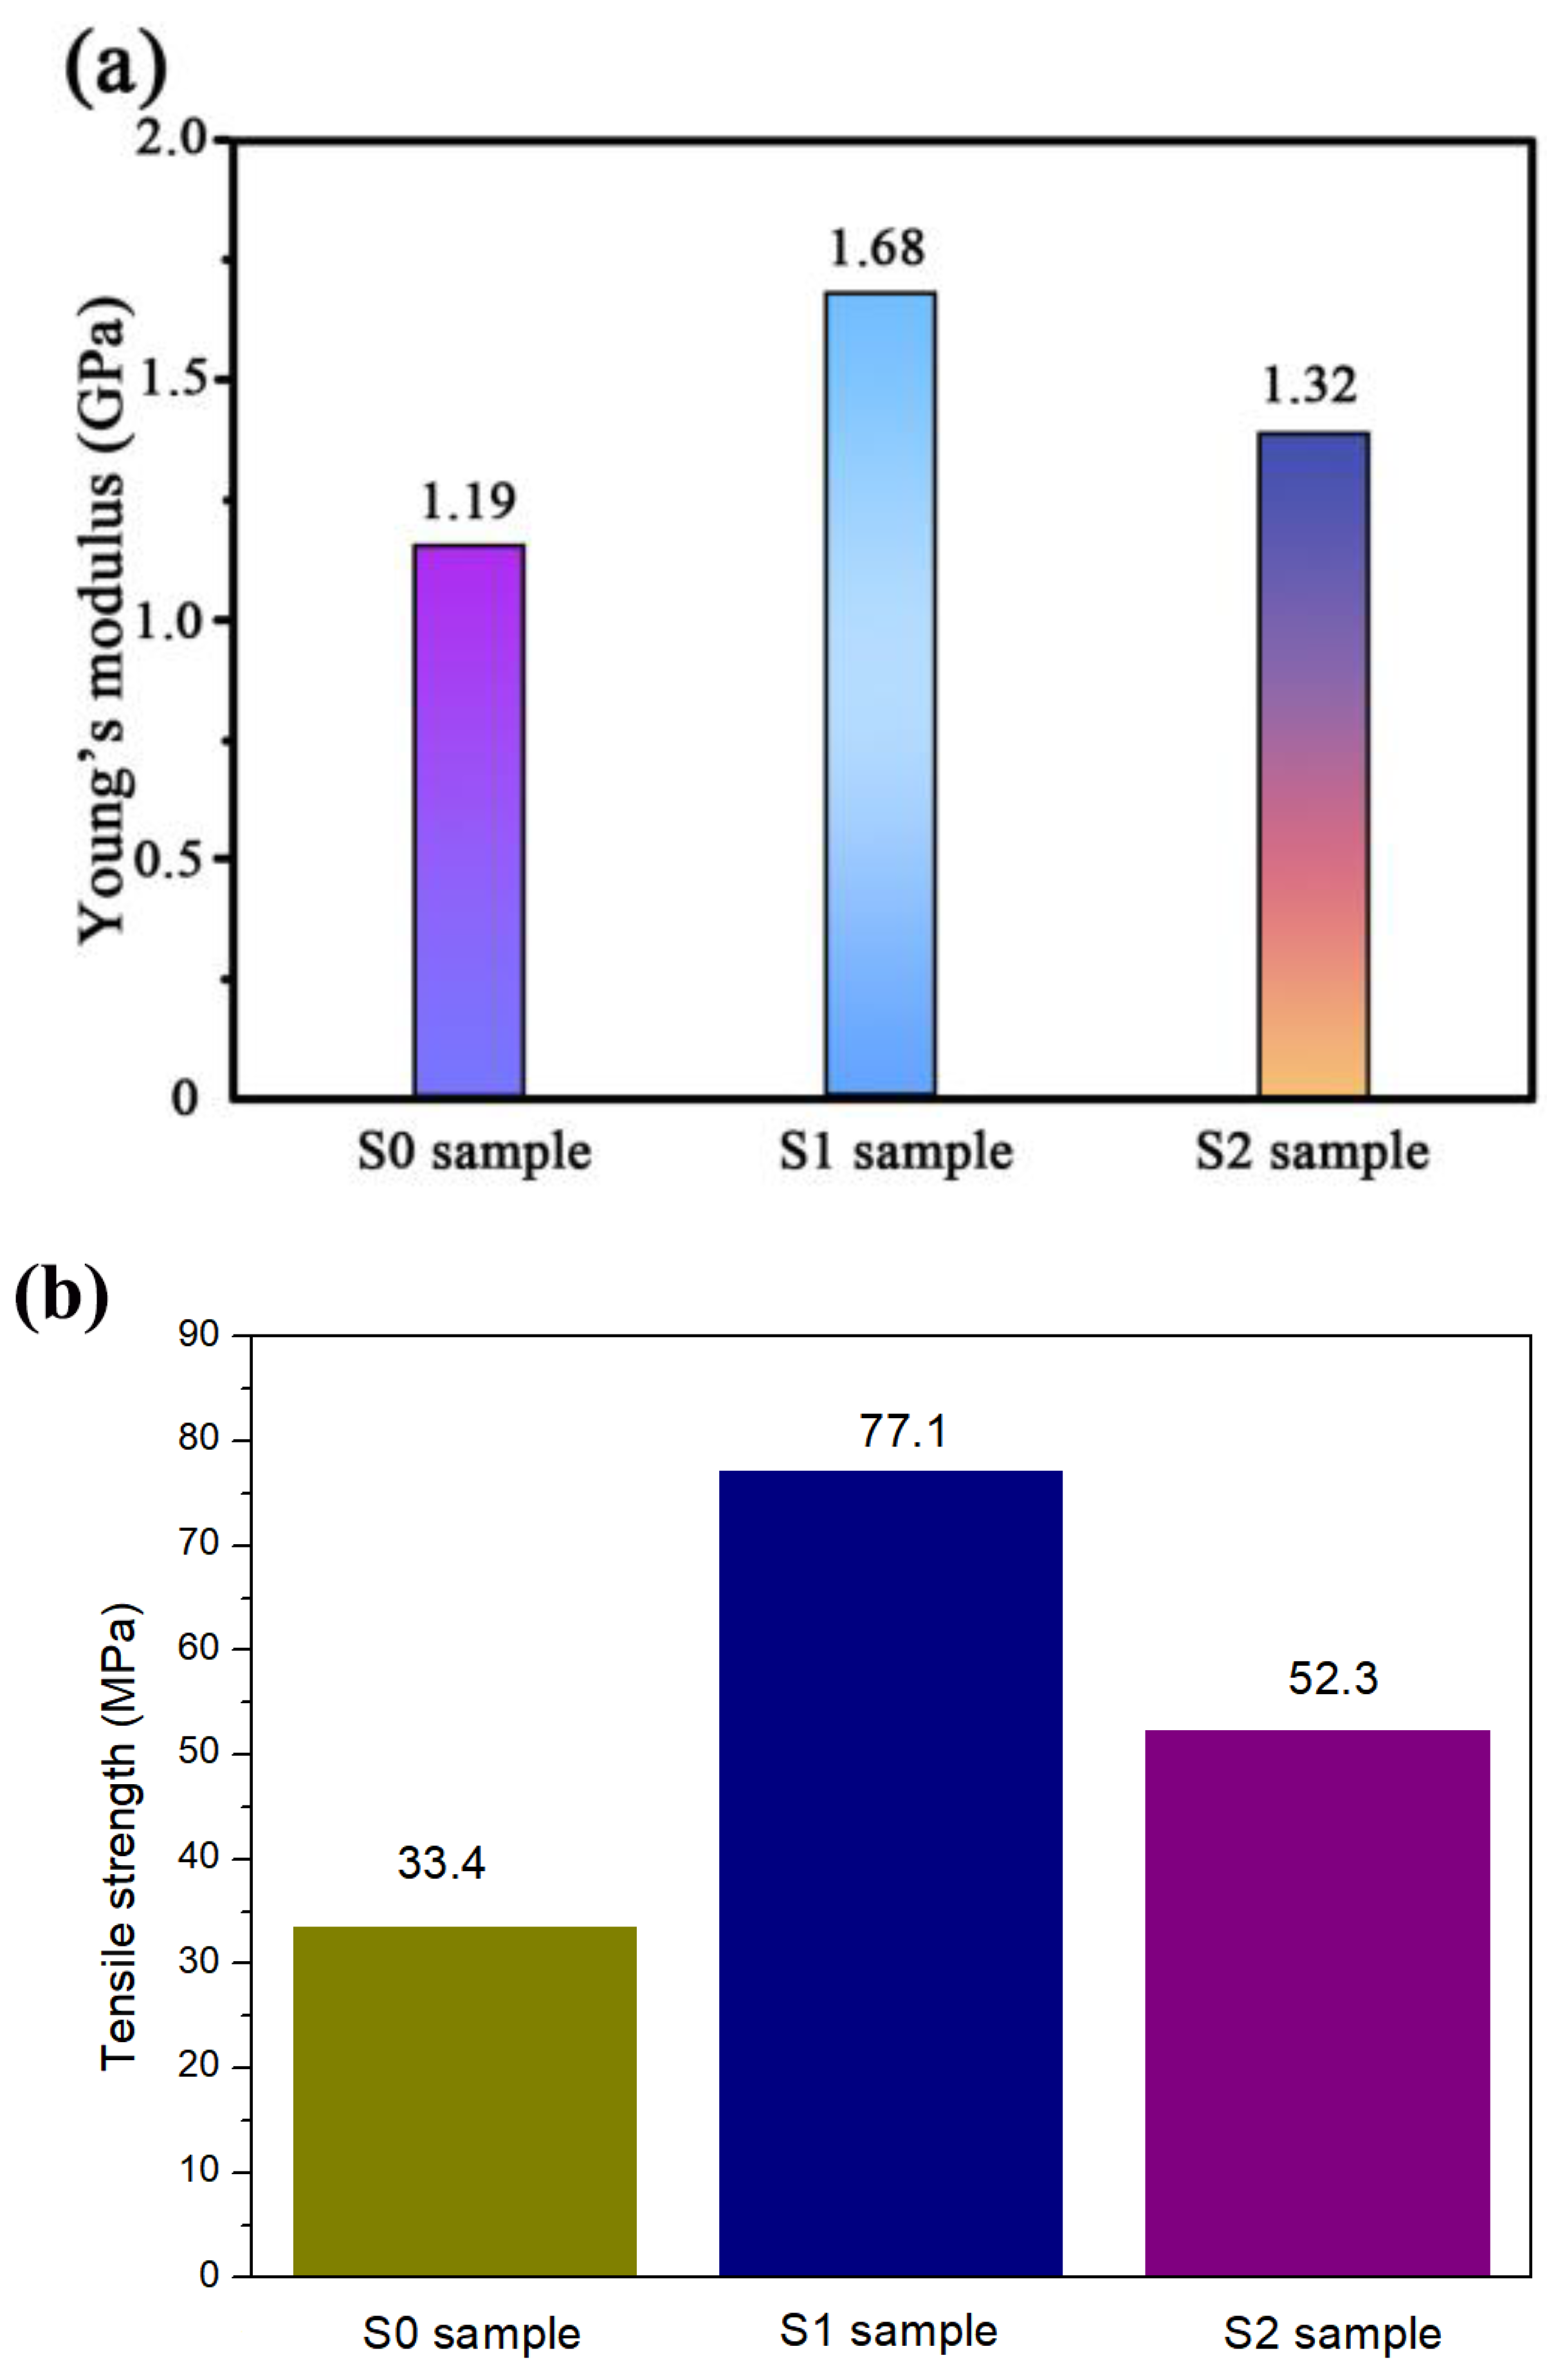
3.6. Mechanical Properties

The mechanical properties of Ni-W-SiC coatings, such as Young’s modulus (Figure 13a) and tensile strength (Figure 13b), were extensively studied to determine the impact of magnetic field orientation during the electrodeposition process. The experimental data revealed distinct differences in these properties across the samples subjected to various magnetic orientations. The S0 sample, devoid of any magnetic influence during deposition, exhibited the lowest Young’s modulus of 1.19 GPa, suggesting a stiffer composition, likely due to a coarser grain structure. Additionally, the S0 sample also showed the lowest tensile strength of 33.4 MPa, which could be attributed to larger, less uniformly distributed grains that may introduce structural weak points under tensile stress.
In stark contrast, the S1 sample, which was fabricated under a perpendicular magnetic field orientation, demonstrated superior tensile strength at 77.1 MPa, and the Young’s modulus was the highest among all three coatings (1.68 GPa). These remarkable increases in tensile strength and Young’s modulus correlate with the observed microstructural benefits, such as smaller and more uniformly distributed SiC particles, as well as a denser and more compact grain configuration. These factors contribute to enhancing the material’s ability to withstand mechanical stress without failure. However, the S2 sample, treated under a parallel magnetic field, displayed intermediate properties, with a Young’s modulus of 1.32 GPa and a tensile strength of 52.3 MPa, suggesting that the directionality of the magnetic field plays a crucial role in dictating the mechanical integrity of the coatings.

4. Conclusions

In this investigation, Ni-W-SiC coatings were successfully fabricated by using electrodeposition generated by a magnetic field. During the ED process, applying a magnetic field resulted in a smoother and denser surface morphology. The perpendicular magnetic field orientation (S1) was particularly effective in enhancing the SiC content, reducing grain size, and improving the overall homogeneity of the coating, which are critical factors in determining the coating’s performance. Among all coatings, S1 exhibited the highest content of SiC and 84.7 nm of Ni-W grain size. The XRD peaks of Ni-W found at 44.62°, 52.44°, 76.78°, and 92.46° corresponded to the planar directions of (111), (200), (220), and (311), respectively. Moreover, the intensity of the Ni-W grain diffraction peaks was predominantly impacted by the perpendicular magnetic field. S1 exhibited superior resistance to corrosion, compared to S2 and S0 coatings. Furthermore, S1 had the lowest coefficient of friction and greatest microhardness of all the coatings, demonstrating better abrasion resistance. The S2 sample, treated under a parallel magnetic field, displayed intermediate properties, with a Young’s modulus of 1.32 GPa and a tensile strength of 52.3 MPa.

Author Contributions

Methodology and validation, H.Z.; writing—original draft, Z.L.; conceptualization, L.W.; investigation and formal analysis, F.X. All authors have read and agreed to the published version of the manuscript.

Funding

The research was supported by the China Postdoctoral Science Foundation (Granted no. 2023M740583), the Key Project of Qiqihar City Science and Technology Plan (Granted no. ZDGG-202201), and the Basic Scientific Research Business Expenses Project of Heilongjiang Provincial Undergraduate University (Granted no. 145209407).

Institutional Review Board Statement

Not applicable.

Informed Consent Statement

Not applicable.

Data Availability Statement

Data are contained within the article.

Conflicts of Interest

The authors declare no conflicts of interest.

References

  1. Dubey, D.; Mukherjee, R.; Singh, M.K. A review on tribological behavior of nickel-based Inconel superalloy. Proc. Inst. Mech. Eng. Part J J. Eng. Tribol. 2024, 238, 706–732. [Google Scholar] [CrossRef]
  2. Zhao, L.; Sun, R.L.; Lei, Y.W. Study of nickel-based composite coatings on H13 steel surface by laser. Adv. Mater. Res. 2011, 154–155, 407–411. [Google Scholar] [CrossRef]
  3. Liu, Y.; Han, X.G.; Kang, L.; Li, Q. Process prediction of Ni-SiC coatings based on RBF-BP model. J. Indian Chem. Soc. 2022, 99, 100513. [Google Scholar] [CrossRef]
  4. Kumar, K.A.; Mohan, P.; Kalaignan, G.P.; Muralidharan, V.S. Electrodeposition and characterization of Ni-ZrO2 nanocomposites by direct and pulse current methods. J. Nanosci. Nanotechnol. 2013, 12, 8364–8371. [Google Scholar] [CrossRef]
  5. Yao, Y.; Yao, S.; Zhang, L. Corrosion behavior of Ni-W/SiC nanocomposite coating in NaCl solution. Surf. Rev. Lett. 2006, 13, 489–494. [Google Scholar] [CrossRef]
  6. Guo, Z.C.; Zhu, X.Y.; Zhai, D.C.; Yang, X.W. Electrodeposition of Ni-W amorphous alloy and Ni-W-SiC composite deposits. J. Mater. Sci. Technol. 2000, 3, 323–326. [Google Scholar]
  7. Ma, C.; He, H.; Xia, F.; Xiao, Z.; Liu, Y. Performance of Ni-SiC composites deposited using magnetic-field-assisted electrodeposition under different magnetic-field directions. Ceram. Int. 2023, 49, 35907–35916. [Google Scholar] [CrossRef]
  8. Ma, C.; He, H.; Zhang, H.; Li, Z.; Wei, L.; Xia, F. Impact of magnetic field direction on performance and structure of Ni-Co-SiC coatings fabricated via magnetic-field-induced electrodeposition. Coatings 2024, 14, 672. [Google Scholar] [CrossRef]
  9. Xia, F.F.; Tian, J.Y.; Ma, C.Y.; Xu, X.Y.; Huang, M. Microstructural, nanomechanical and wear properties of magnetic pulse electrodeposited Ni-TiN composite coatings. Sci. Eng. Compos. Mater. 2016, 23, 535–541. [Google Scholar] [CrossRef]
  10. Zhang, Y.; Wei, L.X.; Zhang, H.B.; Wang, J.D.; Ma, C.Y.; Xu, F.X. Study on magnetic-field-assisted electrodeposited Ni-SiC nanocomposites. J. Mater. Eng. Perform. 2021, 31, 602–612. [Google Scholar] [CrossRef]
  11. Lu, X.; Wang, C.; Wei, Y. One-dimensional composite nanomaterials: Synthesis by electrospinning and their applications. Small 2009, 5, 2349–2370. [Google Scholar] [CrossRef] [PubMed]
  12. Rao, V.R.; Hegde, A.C. Magnetically induced codeposition of Ni-Cd alloy coatings for better corrosion protection. Ind. Eng. Chem. Res. 2014, 53, 5490–5497. [Google Scholar] [CrossRef]
  13. Yih, K.A. Free convection effect on MHD coupled heat and mass transfer of a moving permeable vertical surface. Int. Commun. Heat Mass. 1999, 26, 95–104. [Google Scholar] [CrossRef]
  14. Li, F.C.; Kunugi, T.; Serizawa, A. MHD effect on flow structures and heat transfer characteristics of liquid metal-gas annular flow in a vertical pipe. Int. Commun. Heat Mass. 2005, 48, 2571–2581. [Google Scholar] [CrossRef]
  15. Ke, W.; Jiang, W.; Han, Y.; Chen, Y.; Lao, Y. Effect of parallel magnetic field on growth and properties of jet electrodeposited Ni-Co-SiC composite coatings. J. Alloys Compd. 2023, 946, 169407. [Google Scholar] [CrossRef]
  16. Wang, X.Y.; Cui, H.X.; Zhou, Q.; Zhang, X.L.; Zhang, Y.R. Microhardness and corrosion resistance of electrodeposited Ni-SiC-BN composite coatings. Int. J. Electrochem. Sci. 2022, 17, 220677. [Google Scholar] [CrossRef]
  17. Zhao, Y.; Opata, Y.A.; Wu, W.; Grivel, J.C. Surface defects on the Gd2Zr2O7 oxide films grown on textured NiW technical substrates by chemical solution method. Mater. Charact. 2017, 124, 58–64. [Google Scholar] [CrossRef]
  18. Yang, F.Z.; Guo, Y.F.; Huang, L.; Xu, S.K.; Zhou, S.M. Electrodeposition, structure and corrosion resistance of nanocrystalline NiW alloy. Chin. J. Chem. 2004, 3, 228–231. [Google Scholar] [CrossRef]
  19. Iwasaki, H.; Higashi, K.; Nich, T.G. Tensile deformation and microstructure of a nanocrystalline Ni-W alloy produced by electrodeposition. Scr. Mater. 2004, 50, 395–399. [Google Scholar] [CrossRef]
  20. Liu, W.Q.; Lei, W.N.; Shen, Y.; Wang, C.Y.; Qian, H.F.; Li, Q.L. Performance characterization and preparation of Ni-SiC nanocomposites based on SCF-CO2. Integr. Ferroelectr. 2017, 179, 45–55. [Google Scholar] [CrossRef]
  21. Li, C.Y.; Xia, F.F.; Ma, C.Y.; Li, Q. Research on the corrosion behavior of Ni-SiC nanocoating prepared using a jet electrodeposition technique. J. Mater. Eng. Perform. 2021, 30, 6336–6344. [Google Scholar] [CrossRef]
  22. Ma, H.; Liu, Z.; Li, J.; Liu, Q.; Zhang, J.; Wei, T. Optimization design of environmental-friendly Cu-Fe laser cladding coating for self-grown microchannel in a marine corrosive environment. J. Alloys Compd. 2023, 940, 168820. [Google Scholar] [CrossRef]
  23. Xin, L.; Li, P.; Li, H.; Sun, W.; Zhang, C.; Zhang, K.; Yin, X.; Yu, S. Fabrication of decoupling coatings with robustness and superhydrophobicity for anti-icing and anti-corrosion applications. J. Mater. Sci. 2023, 58, 6038–6054. [Google Scholar] [CrossRef]
  24. Ma, C.Y.; Zhao, D.Q.; Xia, H.Z.; Xia, F.F.; Ma, Z.P.; Williams, T. Microstructure and properties of Ni-SiC nanocomposites fabricated by ultrasonic-assisted electrodeposition. Int. J. Electrochem. Sci. 2020, 15, 4015–4031. [Google Scholar] [CrossRef]
  25. Zhang, L.; Yang, S.; Lv, X.; Jie, X. Wear and corrosion resistance of cold-sprayed Cu-based composite coatings on magnesium substrate. J. Therm. Spray Technol. 2019, 28, 1212–1224. [Google Scholar] [CrossRef]
  26. Lou, B.Y.; Xu, B.; Zhou, Y.B.; Bai, W.J.; Du, H.L. Microstructure and wear response of Ni/SiC laser cladding composite coatings on a carbon steel. Key Eng. Mater. 2008, 373–374, 375–378. [Google Scholar] [CrossRef]
  27. Hu, F.; Chan, K.C.; Song, S.Z.; Yang, X.J. Enhancement of corrosion resistance of electrocodeposited Ni-SiC composites by magnetic field. J. Solid State Electrochem. 2007, 11, 745–750. [Google Scholar] [CrossRef]
  28. Peng, X.S.; Xu, X.Y.; Wang, J. Characterization and performance prediction of jet pulse electrodeposited Ni-SiC nanocomposites by means of artificial neural networks. Ceram. Int. 2018, 44, 8599–8604. [Google Scholar] [CrossRef]
  29. Li, Z.J.; Shi, G.M.; Zhao, Q. Improved microwave absorption properties of core–shell type Ni@SiC nanocomposites. J. Mater. Sci. Mater. Electron. 2017, 28, 5887–5897. [Google Scholar] [CrossRef]
Figure 1. Depiction of the fabrication method utilized to deposit Ni-W-SiC coatings.
Coatings 14 01272 g001
Figure 2. TEM pictures of Ni-W-SiC coatings: (a) S0 sample, (b) S1 sample, (c) S2 sample, and (d) SAED pattern.
Coatings 14 01272 g002
Figure 3. EDS spectrograms of Ni-W-SiC coatings: (a) S0 sample, (b) S1 sample, and (c) S2 sample.
Coatings 14 01272 g003
Figure 4. Schematic representation of the effect of the MF orientation on Ni and W ions and SiC particles. (a) Perpendicular orientation of the MF, and (b) Parallel orientation of the MF.
Coatings 14 01272 g004
Figure 5. AFM images of Ni-W-SiC coatings: (a) S0 sample, (b) S1 sample, and (c) S2 sample.
Coatings 14 01272 g005
Figure 6. XRD curves of Ni-W-SiC coatings: (a) S0 sample, (b) S1 sample, and (c) S2 sample.
Coatings 14 01272 g006
Figure 7. Polarization curves of Ni-W-SiC coatings: (a) S0 sample, (b) S1 sample, and (c) S2 sample.
Coatings 14 01272 g007
Figure 8. Nyquist curves of Ni-W-SiC coatings: (a) S0 sample, (b) S1 sample, and (c) S2 sample.
Coatings 14 01272 g008
Figure 9. Corrosive morphologies of of Ni-W-SiC coatings: (a) S0 sample, (b) S1 sample, and (c) S2 sample.
Coatings 14 01272 g009
Figure 10. Images of the microhardness of Ni-W-SiC coatings: (a) S0 sample, (b) S1 sample, and (c) S2 sample.
Coatings 14 01272 g010
Figure 11. Friction coefficient curves of Ni-W-SiC coatings: (a) S0 sample, (b) S1 sample, and (c) S2 sample.
Coatings 14 01272 g011
Figure 12. Images of the wear rates of Ni-W-SiC coatings: (a) S0 sample, (b) S1 sample, and (c) S2 sample.
Coatings 14 01272 g012
Figure 13. Mechanical properties of Ni-W-SiC coatings: (a) Young’s modulus and (b) tensile strength.
Coatings 14 01272 g013
Table 1. Diameters of Ni-W grains and SiC particles in Ni-W-SiC coatings.
SampleNi-W (nm)SiC (nm)
S0133 ± 176 ± 1
S184 ± 153 ± 1
S2103 ± 171 ± 1
Table 2. XRD data of Ni-W grains and SiC particles in S0 coatings.
Peak Position (2θ)Plane DirectionPeak Height (a.u.)Peak Width (FWHM, 2θ)Crystallite Size
35.62°SiC(101)1310.1176.31
41.44°SiC(102)2540.1652.08
44.62°Ni-W(111)12370.07131.69
52.44°Ni-W(200)1090.1085.10
57.82°SiC(110)1880.1370.95
76.78°Ni-W(220)1590.1272.60
92.46°Ni-W(311)1830.09102.87
Table 3. The charge transfer and solution resistances of Ni-W-SiC coatings.
SampleRs (Ω·cm2)Rct (Ω·cm2)CPEdl (F·cm−2)
S015263918.72 × 10−6
S118710,5825.38 × 10−6
S220681436.94 × 10−6
Disclaimer/Publisher’s Note: The statements, opinions and data contained in all publications are solely those of the individual author(s) and contributor(s) and not of MDPI and/or the editor(s). MDPI and/or the editor(s) disclaim responsibility for any injury to people or property resulting from any ideas, methods, instructions or products referred to in the content.

