Article

Calcium Carbonate Deposition Model Supporting Multiple Operating Conditions Based on the Phase-Field Method for Free-Surface Flows

by
Jianbing Lv
1,*,
Zuru Chen
1,
Li Feng
1,
Chen Liang
1,
Jia Li
2 and
Jingkai Huang
1
1
School of Civil and Transportation Engineering, Guangdong University of Technology, Guangzhou 510643, China
2
Jiangmen Yinzhouhu Expressway Co., Ltd., Building 8, 2nd Floor, No. 3 Xinhui Avenue Middle, Huicheng, Xinhui District, Jiangmen 529728, China
*
Author to whom correspondence should be addressed.
Coatings 2024, 14(10), 1273; https://doi.org/10.3390/coatings14101273
Submission received: 9 August 2024 / Revised: 16 September 2024 / Accepted: 1 October 2024 / Published: 4 October 2024

Abstract

:
The drainage systems of tunnels situated in limestone regions frequently encounter crystallization blockages. Numerous studies have addressed this issue, and their findings identified factors such as the flow velocity and temperature as influencing the crystallization process. However, these studies could not predict the occurrence of crystallization. Regarding theoretical approaches, most studies have focused on full-pipe operations or have solely considered flow-field dynamics without including simulations of the chemical reactions and mass transfers. This study introduces a mass-transfer model for drainage pipes based on a two-phase flow (water and air) with a free surface and non-full pipe flow that simulates the crystallization deposition process in drainage pipes. This model can predict the deposition conditions at varying flow velocities and intuitively visualize the crystallization process under the influence of various factors. The impact of flow velocity on the overall crystallization deposition process can be directly analyzed through simulations developed using this model. The results show that under conditions of incomplete pipe flow with no pressure at the outlet, the weight of the deposition first increases and then decreases within a certain velocity. This model can depict the variations within a 30 d period.

1. Introduction

The tunnels in limestone regions frequently encounter drainage-pipe blockages that are primarily caused by the formation of crystals within the pipes. Crystallization occurs because of the presence of calcium ions and minor amounts of magnesium ions in karst water from mountainous formations. These ions, which are prone to crystallization, undergo chemical reactions within the drainage pipes. The primary product of these reactions is calcium carbonate, and it is accompanied by a small amount of magnesium sulfate crystals that subsequently lead to blockages in the tunnel-drainage system [1,2]. To investigate the causes of crystallization, several researchers have investigated the primary sources of calcium ions. Studies have found that calcium carbonate crystallization originates not only from the concrete of the tunnel lining [3,4,5] but also from the dissolution of carbonate calcium in the surrounding soluble limestone [6]. Additionally, the solubility of calcium carbonate is closely related to the solubility defined by the pH values, indicating that both the electrical conductivity (EC) and pH can be used as indicators of the dissolution of calcium carbonate in the surrounding soil and pore water [7]. The factors influencing the generation of crystals within drainage systems have been the focus of numerous studies that have aimed to clarify the sources of crystallization. For instance, research in non-karst areas has found that the initial lining of tunnels can release significant amounts of calcium ions into the groundwater. Additionally, some CO2 from the air dissolves in the groundwater to form carbonate ions. These carbonate ions react with a significant amount of the calcium ions released from the initial lining of the tunnel in groundwater, resulting in the precipitation of calcium carbonate [8]. Furthermore, the calcium ions from karst water in mountainous formations can react with CO2 in the air to form calcium carbonate crystals. The concentration of CO2 within caves considerably affects the precipitation of calcium carbonate [9,10]. This impact is owing to the concentration of CO2 and the pH of the solution. Under different alkaline conditions, the crystallization product is predominantly calcite-type calcium carbonate. The pH of the solution primarily affects the packing arrangement, crystal morphology, and size of the crystalline bodies. An increase in the pH leads to the tighter packing of crystals with smaller and more uniform grain sizes. Additionally, the crystallization efficiency increases with the pH [11,12]. Furthermore, both on-site investigations and laboratory experiments have revealed that biological factors influence crystallization; that is, microbial activity alters the pH within drainage pipes, creating an environment more conducive to the deposition of calcium carbonate [13,14,15,16]. In addition to the aforementioned factors, Wei [17] investigated the effects of electric fields. The study found that under the influence of an electric field, crystallization fluctuated before stabilization, with greater amounts of crystallization in the fluctuating regions and less in the uniform regions. Moreover, the uniform regions were longer than those of ordinary pipes.
Scholars have devised a fuzzy evaluation model for the crystallization in tunnel-drainage systems, drawing from prior laboratory experiments. Such models can address the relevant issues through continuous improvement and development [18]. However, the interaction coupling effects between the hydrodynamics and sedimentation have not yet been explicitly defined in terms of their impacts and judgments.
Regarding models that describe the interacting coupling effects between hydrodynamics and sedimentation, scholars from the 1970s to the 1990s proposed the calcite dissolution and deposition dynamics PWP model [19] and the deposition dynamics DBL model [20]. Although the results of these early models were feasible, they had certain limitations. With the advancements in computing power and software technology, several scholars have recently developed computer models that are closer to real-world situations. For instance, Chengjun [21] successfully simulated the crystallization blockage in both the lateral and longitudinal pipes of tunnel-drainage systems by utilizing the Navier–Stokes equations in conjunction with Fick’s first law while also considering chemical reactions.
Pääkkönen [22,23] and Hasan et al. [24] demonstrated that the surface temperature is a dominant factor in calcium carbonate scaling-formation. When roughness affects scaling formation, a model that considers the influence of roughness should be employed. Nikoo et al.’s [25] model established a correlation between adhesion work and the shear strength of deposits. The model by Duan [26] simulated the interactive process of fluid flow, heat transfer, and crystal-fouling formation by combining the Boltzmann and finite difference methods. Coto et al.’s [27] simulation quantifies the effect of temperature, pressure, and pH on the solubility of CaCO3. Coto et al. [27] focused on the impact of the local velocity at the elbow. Babuška et al. [28] incorporated the effects of erosion caused by the detachment of the fouling fragments. Adriano [29] proposed a multiphysics turbulence model in which the transfer rates were all determined by computed gradients. Mousavian et al. [30] proposed a model based on nucleation theory to predict the rate of fouling formation. Xiong et al. [31] analyzed the interactions between the fouling layer, temperature, and ion concentration during the fouling-formation process. Zhang et al. [32] and Chao et al. [33] established mathematical representations of the crystallization-fouling process that can estimate the fouling generation. Li et al. [34] considered the impact of the actual geometric shape of the flow channel. Jin et al. [35] used a CFD (Computational Fluid Dynamics) model to simulate the CO2 desorption and crystallization fouling during the evaporation process of thermal desalination with a falling-film horizontal tube.
Although the above models perform well under full-pipe flow conditions, in practical engineering applications, the pipe flow often involves free-surface problems at the gas–liquid interface. Therefore, this study proposes a free-surface model that can achieve hydrodynamic chemical-reaction coupling under a free surface and simulate local blockages following the entry of foreign matter into the pipe.

2. Actual Tunnel Sampling

In this study, field sampling was conducted in an area with an extensive limestone distribution in the northern part of Guangdong, China, by selecting one tunnel for sampling. The tunnel is situated in a geomorphic unit characterized by hills that fall under the category of structural denudation landforms. The strata predominantly consist of limestone and sandstone, with varying degrees of weathering. The surface water has a certain impact on the tunnel during the rainy season, and it permeates into the tunnel through the interlayer fissures, joint developments, and faulted structural zones. The impact of the groundwater is more significant than that of the surface water. In certain sections, the interlayer fissures, solution openings, and solution caves in the limestone layers developed earlier. Moreover, the perennial water gullies around the tunnel result in a substantial inflow of groundwater into the tunnel, which causes significant dripping or water inflow. This results in a greater influx of karst water into the tunnel and thereby leads to the crystallization blockages in the drainage pipes, as illustrated in Figure 1.
Crystallization samples with a high degree of crystallization were collected from two outlets and sent for analysis, resulting in the findings listed in Table 1.
Additionally, varying flow rates at the different outlets were observed, and a water-quality sampling analysis of the karst water flowing from these outlets was conducted.
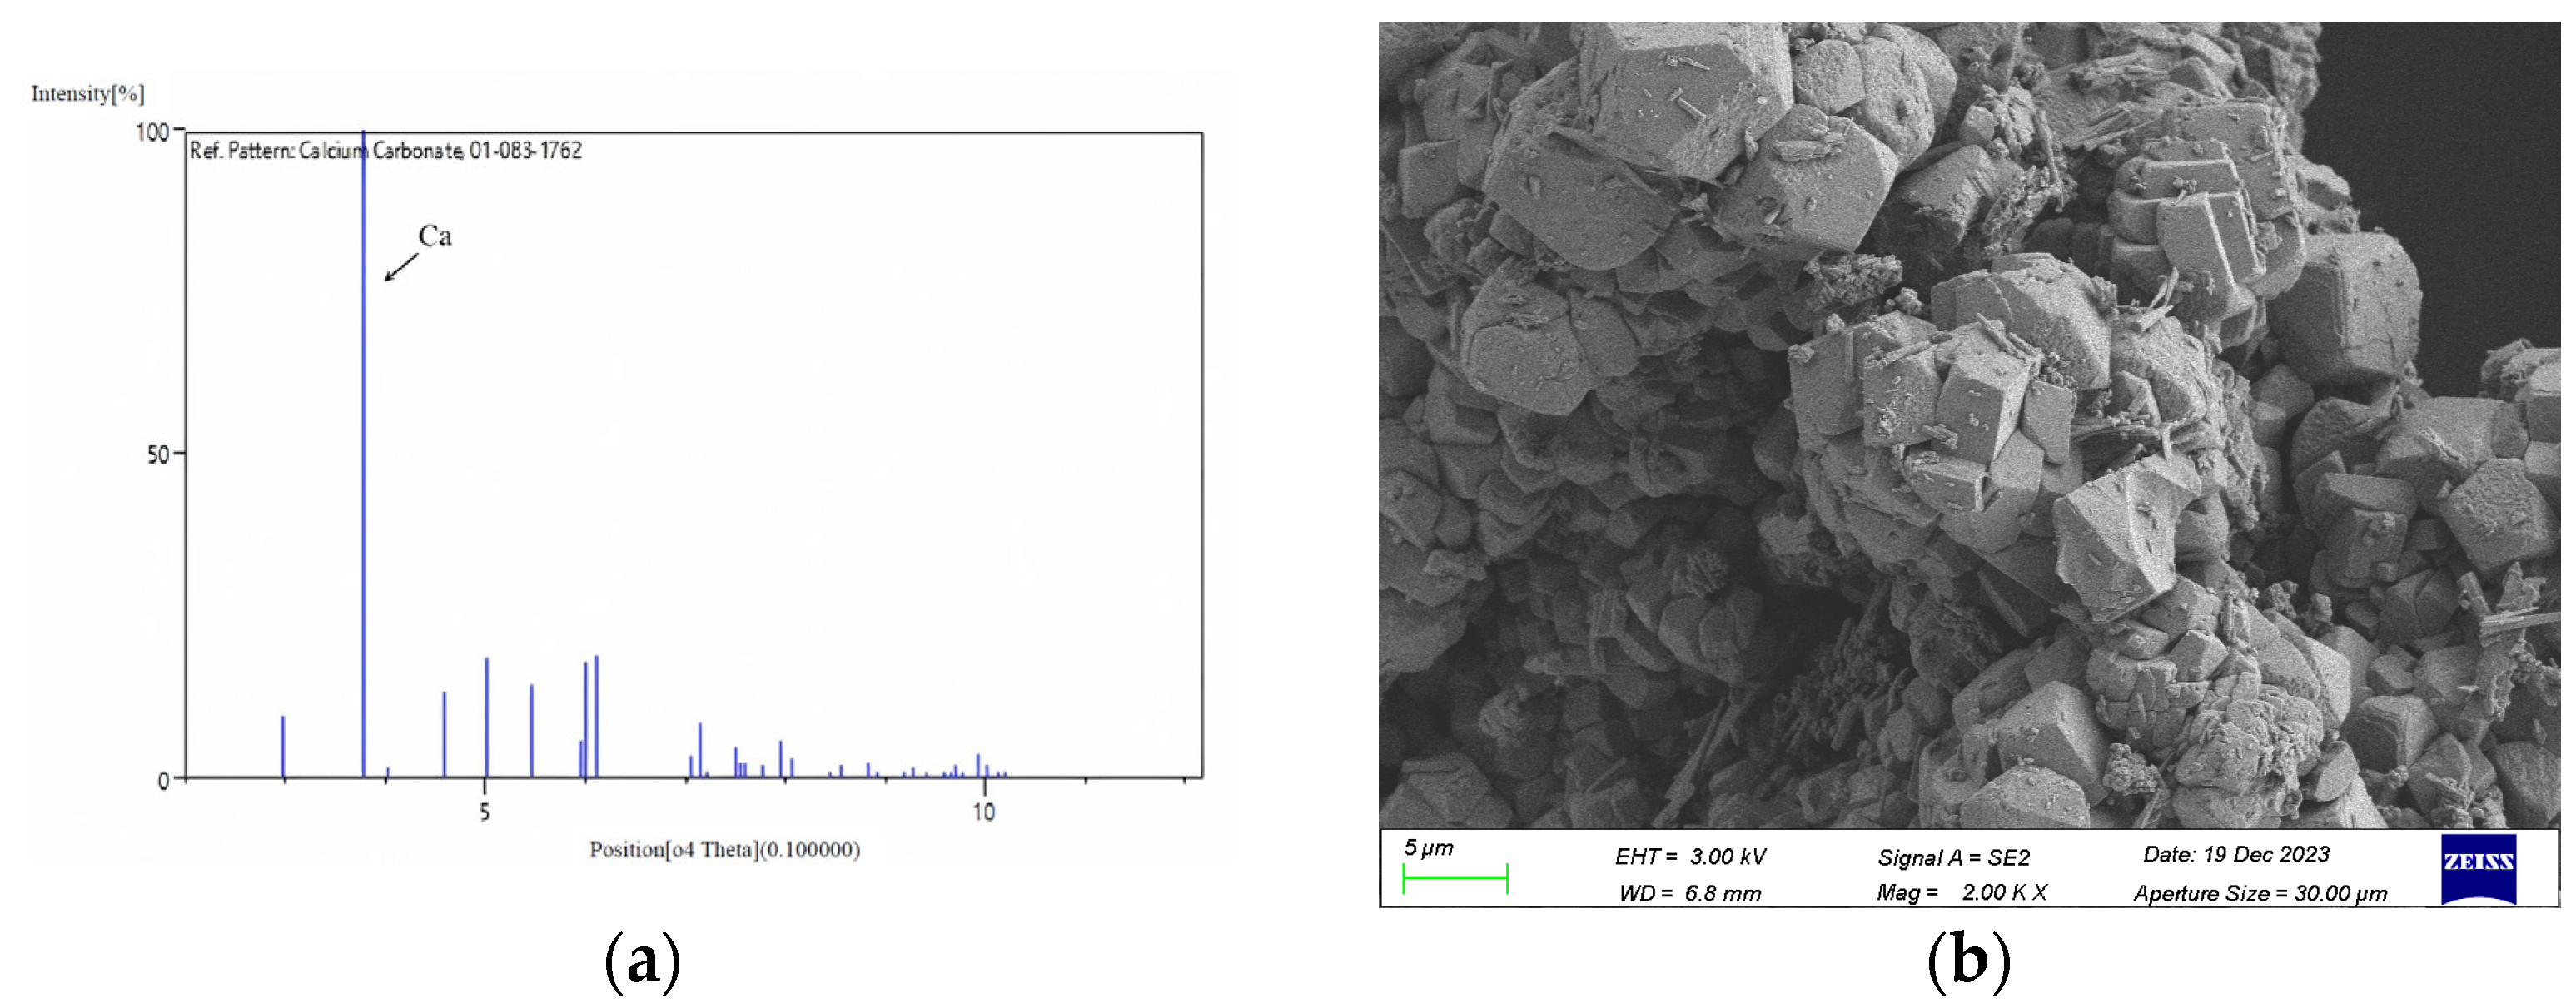
By collecting crystallization blockages from the drainage system, we found that these crystals were predominantly calcite (as shown in Figure 2).

3. Laboratory Experiments

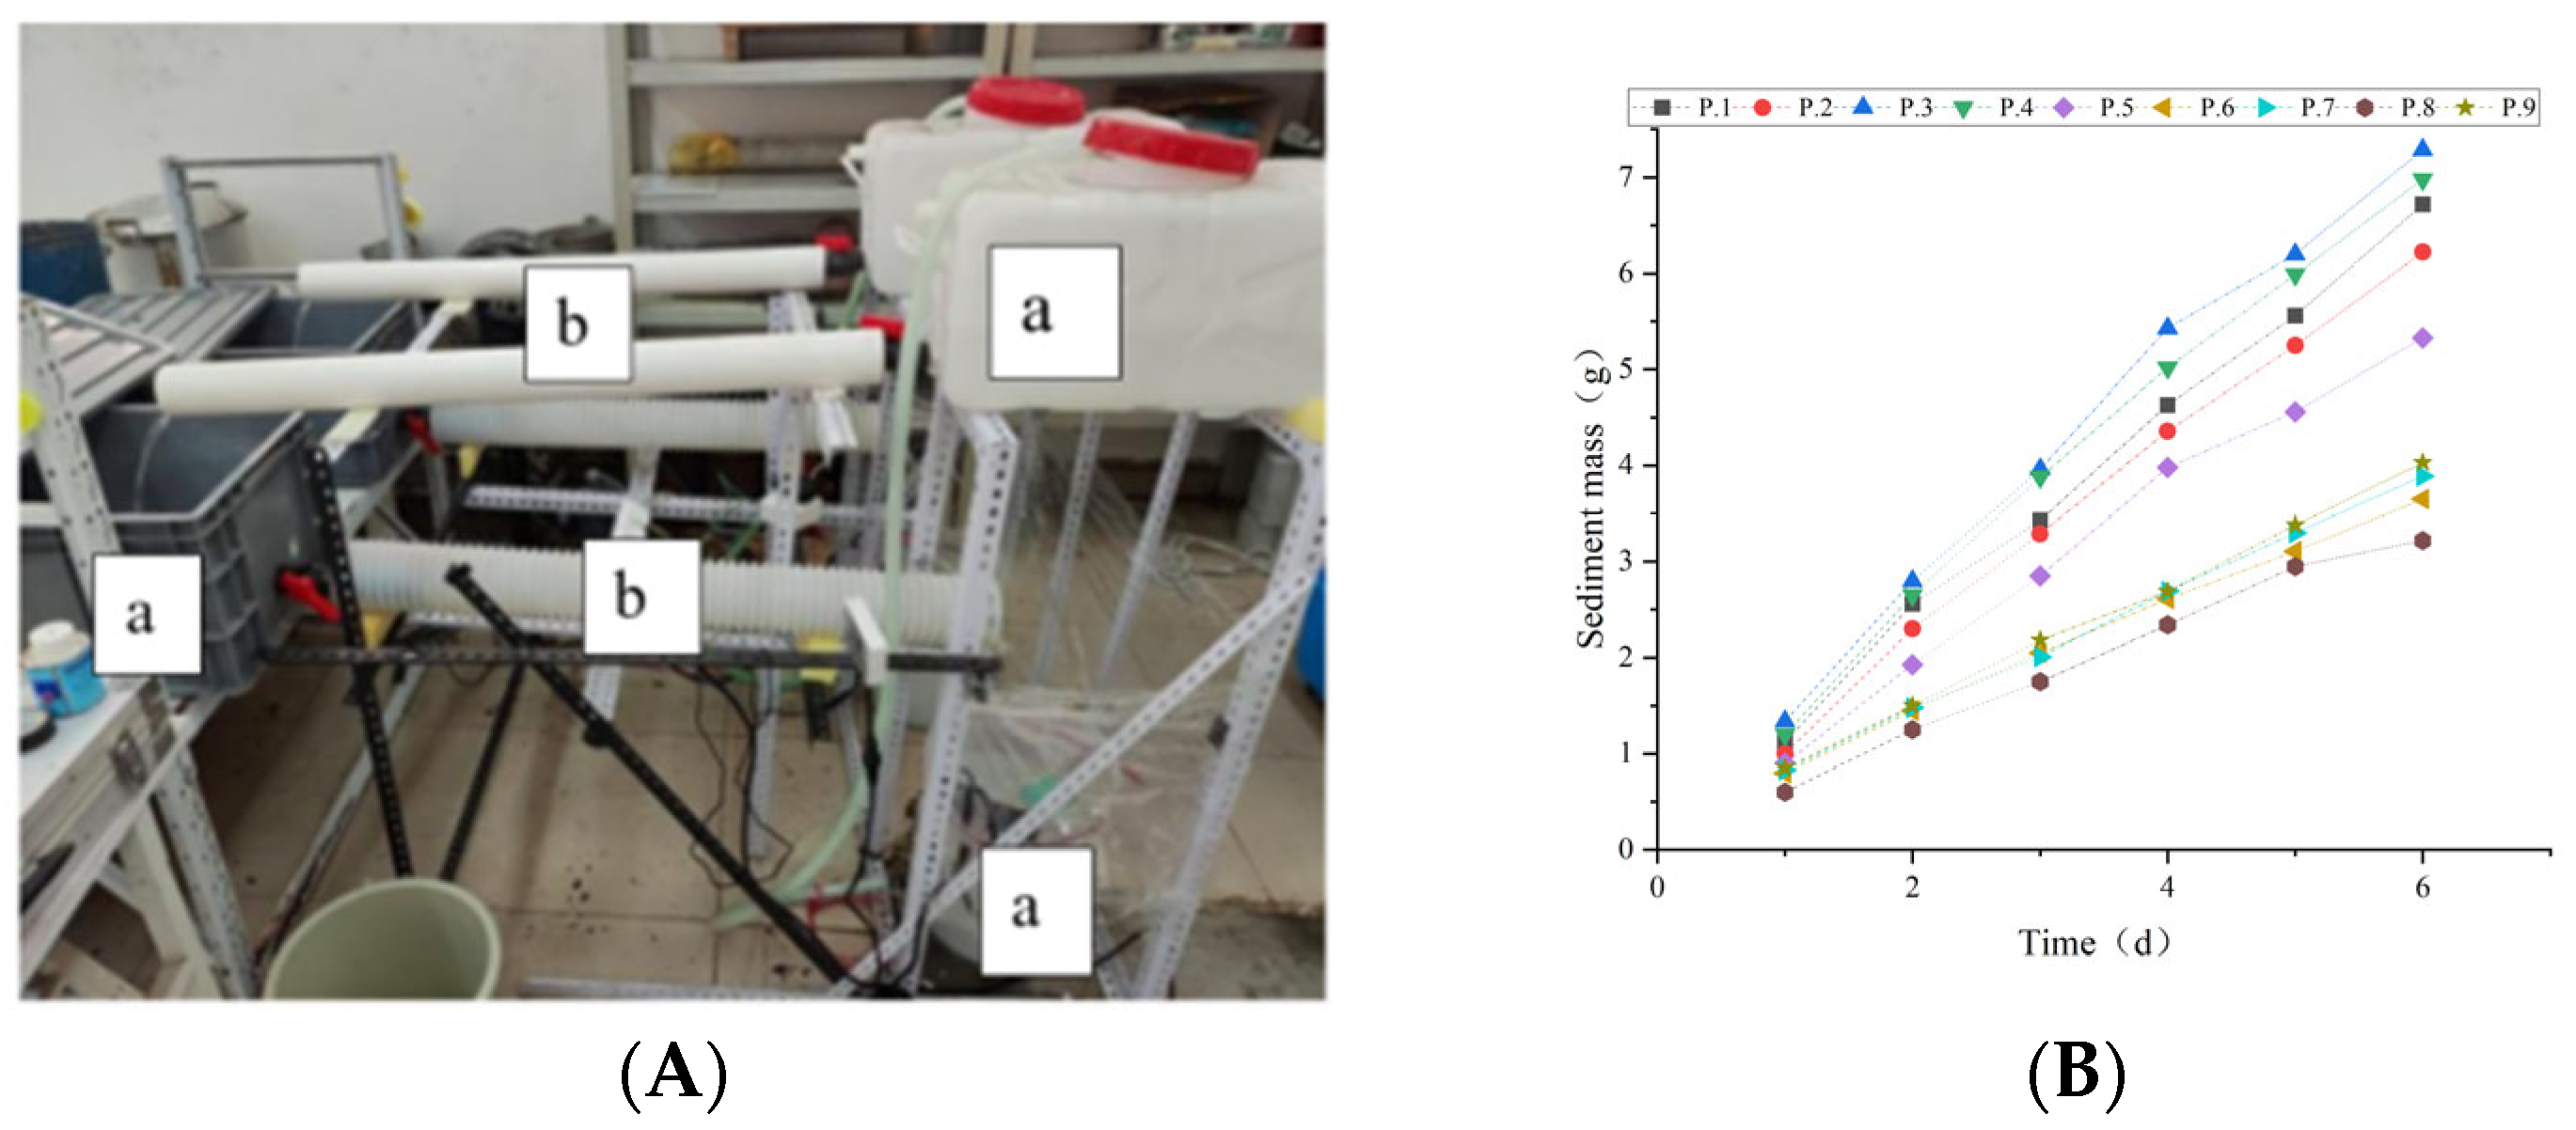
To verify the accuracy of the subsequent models, several laboratory experiments were conducted to obtain the boundary conditions and realistic deposition rates. Based on the field measurements, a calcium ion concentration of 1.6 mmol/L was prepared and the pH was adjusted to 8.1. To simulate the crystallization within the drainage pipes, an indoor experimental setup was constructed, as shown in Figure 3. The apparatus was designed for the quick replacement of experimental pipes, allowing for a variety of experiments to be performed using this setup. Table 2 lists the experimental conditions.

3.1. Monitoring Method

A 10 mL sample of the solution from the experimental apparatus was taken daily to measure the ion concentration and pH value of the solution within the apparatus. The pH values and ion concentrations of the experimental solutions were monitored using titrations. The titration process involved the use of a diluted hydrochloric-acid standard titrant at a concentration of 0.0013 mol/L. The pH value was adjusted to 8.1 by titrating with a 0.1 mmol/L sodium bicarbonate solution, and the calcium ion concentration in the solution was set to 1.6 mmol/L. Any changes in the pH or calcium ion concentration were promptly adjusted. The liquid level height was determined by placing a thin iron wire at the outlet and measuring the length of the wetted wire. The flow rate was determined by the time of collection (500 mL). The velocity was calculated by dividing the flow rate by the cross-sectional area of the water passage. The temperature of the entire apparatus was measured directly using a thermometer and the temperature was controlled at 20 °C.

3.2. Experimental Data

The experiment was conducted for 30 d and the weight of each pipe section was recorded every 5 d to obtain the deposition trends for each section (as shown in Figure 3B).
In this experiment, the variation in pipe diameter affected deposition. At consistent flow rates, the larger-diameter pipes had slower velocities than did the smaller-diameter pipes, resulting in faster deposition rates. Additionally, an increase in the slope resulted in a decrease in the deposition thickness. In the presence of foreign obstacles, the local deposition rates accelerated. The sedimentation formed at the rear of the foreign object was less even and greater, which may be owing to the reduced velocity and increased turbulence caused by the disturbance of the foreign object (as shown in Figure 4c). Evident white sediment was observed attached to the pipe wall and the texture of the generated crystalline material was fine. The calcium carbonate on the surface was loosely attached, resulting in it being highly prone to falling off. In contrast, the calcium carbonate that had strong adherence had a certain hardness, making it less prone to falling off (Figure 4a,b).
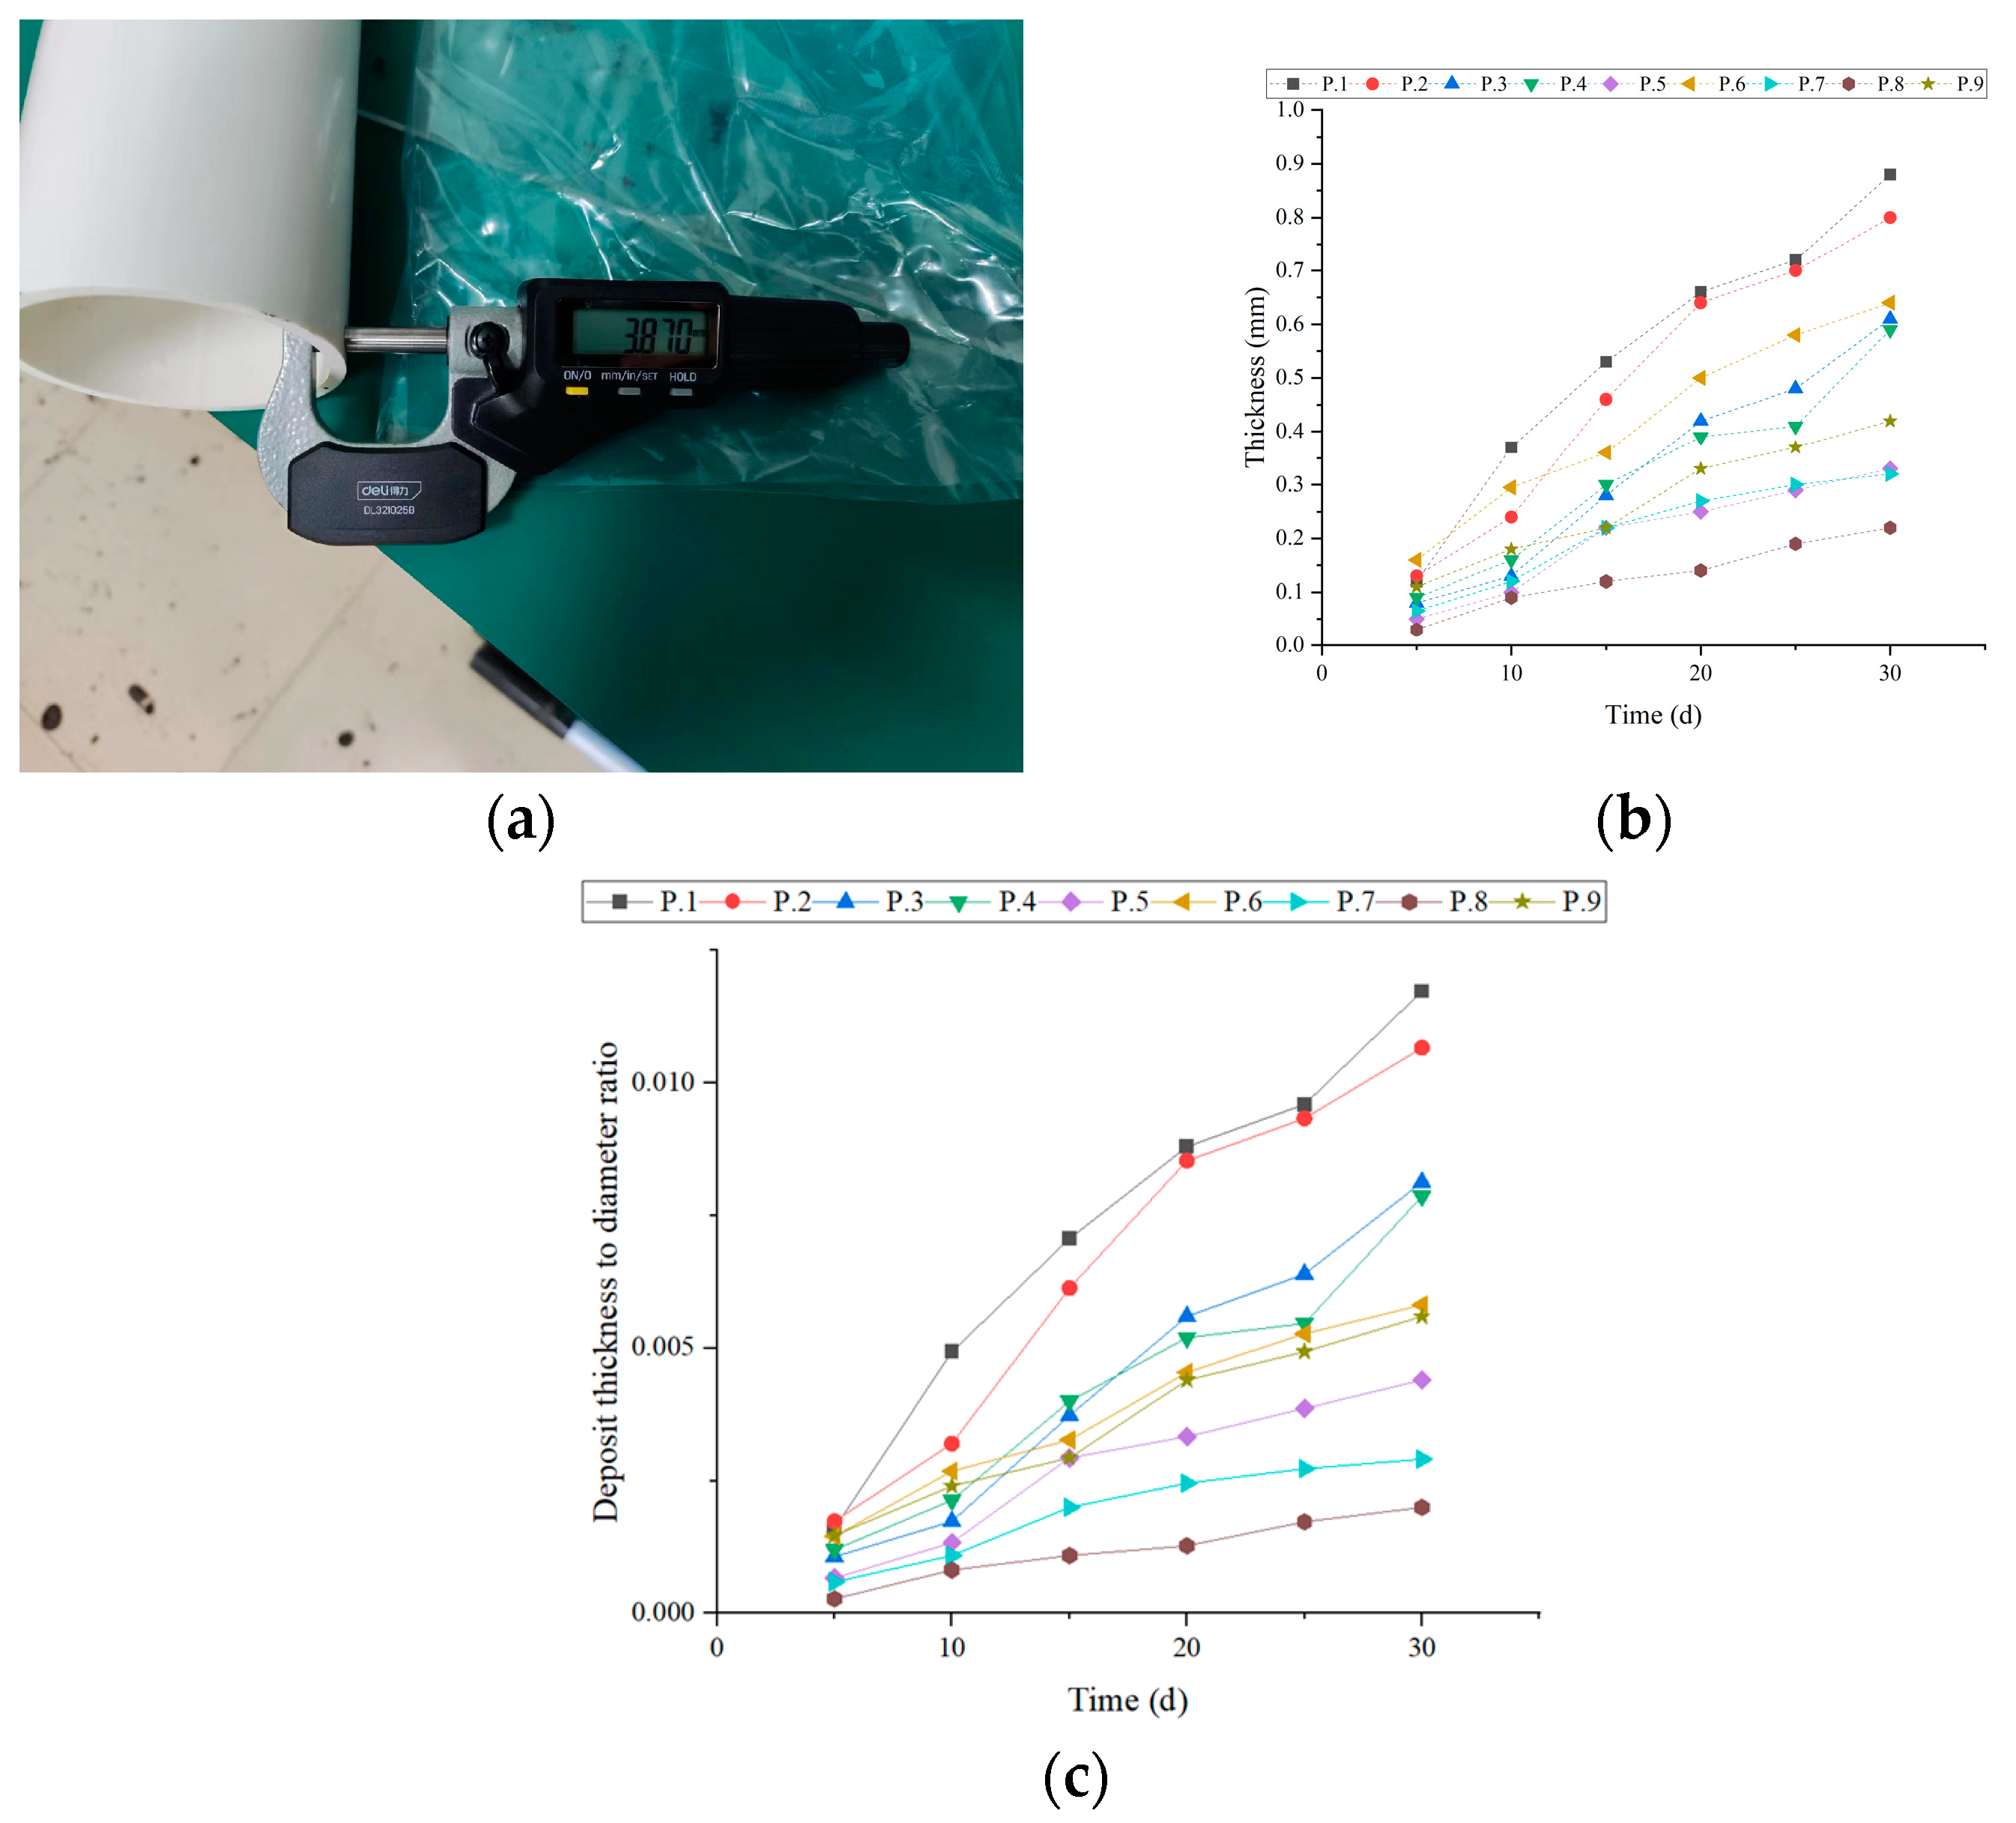
The sediment thickness was measured using a spiral micrometer (Figure 5a).
The calculations revealed that during the one-month deposition process, the density of the formed calcium carbonate sediments did not reach the normal density of calcium carbonate. The density of the formed sediments was lower than that of normal calcium carbonate, which may have been because of the loose crystal structure of the initial calcium carbonate.

4. Mathematical Model

4.1. Model and Basic Assumptions

In the literature [17] and on-site observations, sections of uniform deposition were observed within the tunnel-drainage pipes. Our model simulated the deposition in these uniform sections. To conserve computational resources, the simulation included a segment of 80 cm in length for the calculation. To align more closely with the actual operational conditions, the model employed the phase-field method to describe the movement of the gas–liquid interface, thereby simulating the movement of the free surface. In addition, the use of dynamic meshing allowed for the realization of boundary-condition changes. Considering that the simulation model could not set the entrance to be in contact with the free interface, an entrance segment was set before the actual experimental segment. As the simulation focused on the deposition process in a relatively posterior uniform section, the reaction domain was set to undergo the chemical reactions first, followed by the fluid diffusion and mass transfer. Considering the experimental and actual working conditions of the drainage pipes within the tunnel, the overall temperature was stable; hence, it was assumed that the temperature remained constant.

4.2. Fluid Properties

The model is a coupling of the flow and chemical fields, with the boundary movement affecting the flow field. Navier–Stokes equations were employed to describe the flow field [36]:
ρ u t + ρ u u = p I + K + F ,
where u is the velocity, ρ is the fluid density, I is the turbulence intensity, F is the volumetric force, and K is the viscous stress.
For a fluid described by the Navier–Stokes equations, a continuity assumption that the fluid is continuous and uniform exists [36]:
ρ t + ( ρ u ) = 0
Because a constant temperature was assumed, this model did not incorporate the energy conservation equation. Simultaneously, the k-epsilon model was employed to close the Navier–Stokes equation.
The inlet velocity was determined from the actual measurements. The absolute roughness of the wall was measured using an optical profiler, and the results are listed in Table 3 and Figure 6.

4.3. Chemical Reactions and Mass Transfer

Considering that the rapid formation rate of calcium carbonate precipitates that do not react with water are dispersed as fine particles in the fluid, the mass-transfer process of the calcium carbonate crystals formed by the reaction is described using Fick’s law [36]:
c i t + J i + u c i = R i
J i = D i c i ,
where Ji is the diffusion flux, ci is the concentration of a chemical substance at node i, Ri is the source/sink term that causes the field changes, and Di is the diffusion coefficient of the corresponding substance.
For the chemical field, the Arrhenius formula was used to calculate the chemical reaction rate Kf, which was employed to characterize the rates of the various reactions. For the boundary movement, a combination of the deposition thickness and erosion rate equations was used to determine the net deposition rate, which was then represented by the dynamic mesh [37]:
k = A e E a R T ,
where k is the reaction rate constant at temperature T; A is the pre-exponential factor, which is also known as the Arrhenius constant and has the same units as k; E is the experimental activation energy, which is generally considered to be a constant independent of the temperature; T is the absolute temperature in Kelvin (K); and R is the molar gas constant.

4.4. Boundary Movement Properties

The deposition rate is calculated using the following:
m = m d m r
m d = β 1 2 β k R + Δ c 1 4 β k R 2 + β k R Δ c 1 2
m r = 0.012 u 1.46 m f × 1 + β 2 T w T f × d P × ρ 2 μ g 1 3 ,
where m is the net deposition thickness; md is the sedimentation thickness under static water conditions at concentration c; mr is the erosion rate at flow velocity u; k is the convective mass-transfer coefficient; ks is the surface-reaction rate constant; mf is the deposition per unit area; β2 is the linear expansion coefficient; Tw and Tf are the wall temperature and fluid temperature, respectively; and dP is the crystal particle size [38].

4.5. Model Implementation Form

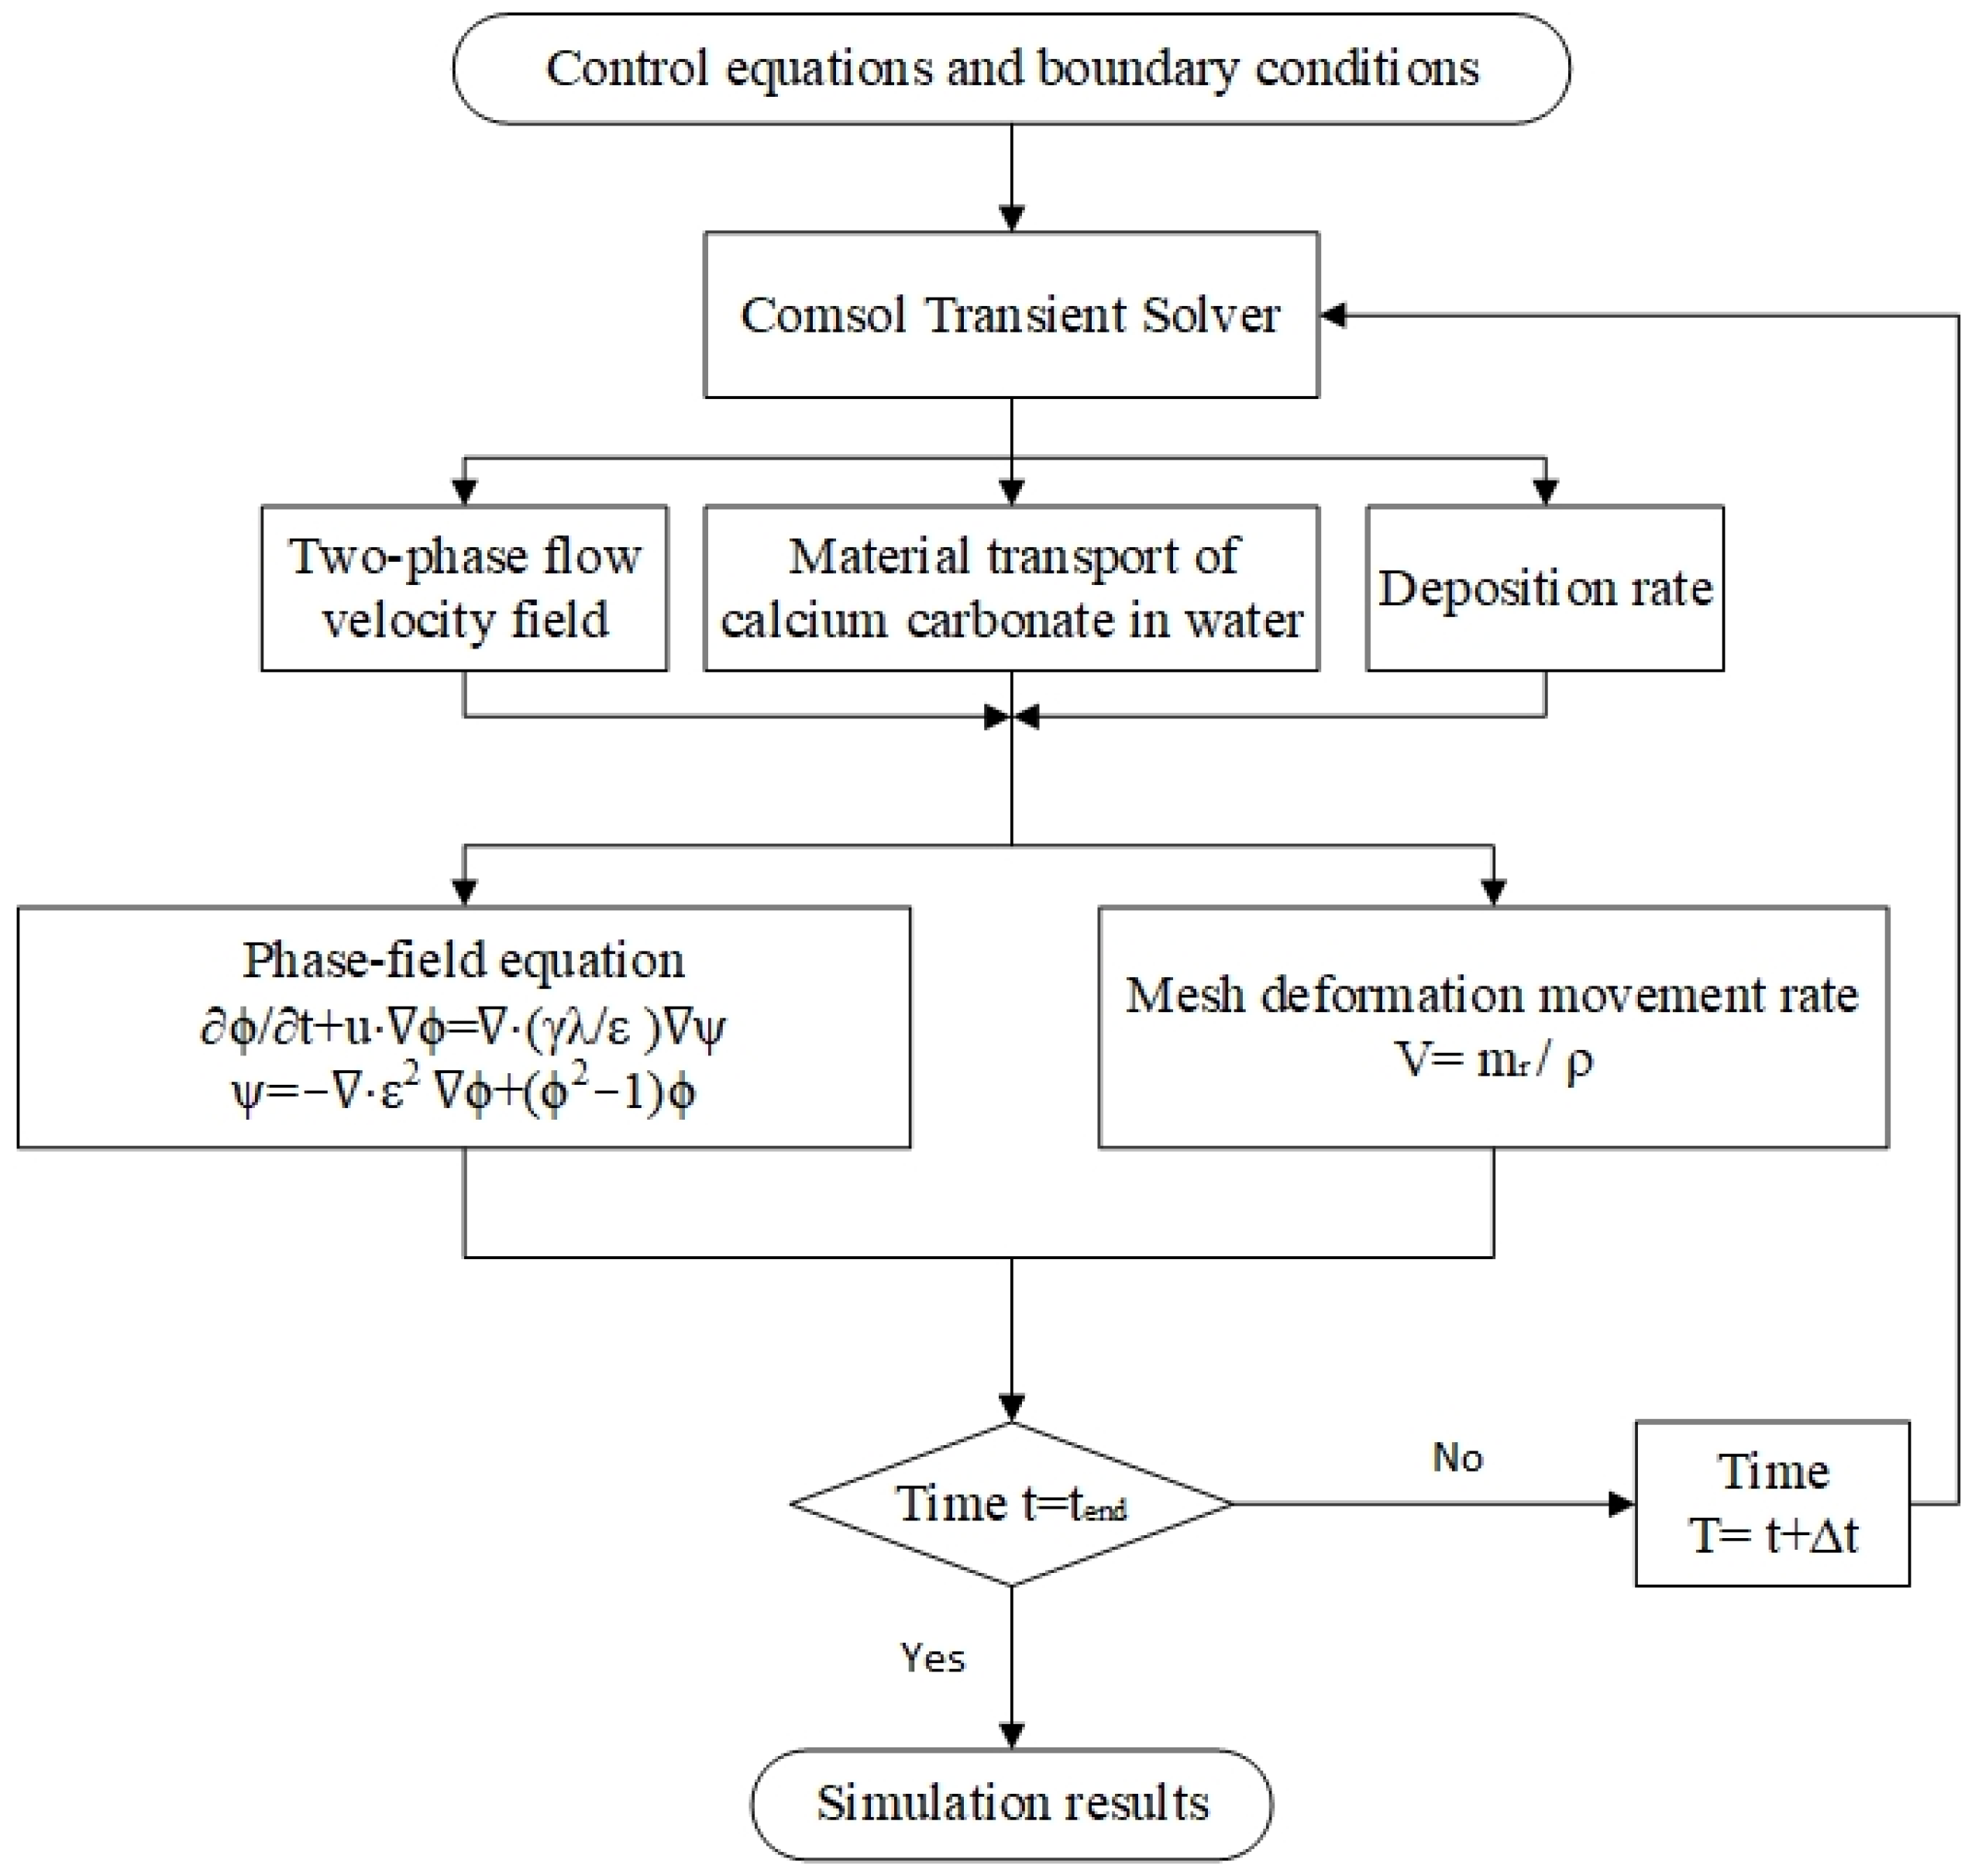
The intercoupling of the aforementioned equations is illustrated in Figure 7, where the erosion rate equation is coupled with the Navier–Stokes equation through the flow velocity u, and the mass-transfer equation serves as an intermediate bridge. The flow and chemical fields are coupled through the flow velocity u and reactant concentration c. The deposition thickness equation is coupled with the mass-transfer equation through the concentration c, and it is also coupled with the Navier–Stokes equation through the flow velocity u:
The model employs the phase-field method to simulate the movement of the gas–liquid interface and the dynamic mesh to simulate the contraction of the deposition boundary to enable the simulation of the free-surface flow, as illustrated in Figure 8. The movement of the gas–liquid interface, simulated by the phase-field method, was influenced by the moving boundary generated by the dynamic mesh. These two factors were mutually influential.
The phase-field method defines a phase function and establishes equations to describe the mutual diffusion between different phases and the phase-transition processes of each phase. The classical Cahn–Hilliard (C–H) nonlinear diffusion model is an example [39]:
c i r , t t = M i j F c i r , t + ξ c i r , t
M i j = k δ i k c i δ j k c j c k M k
M k = D k ϕ R T
D i ϕ = D i 0 , ϕ exp Q i 0 , ϕ R T ,
where ci(r,t) represents the position–time function of the concentration of each substance; Mij represents the chemical mobility of an element; F is the sum of the chemical energy, interface energy, electrical energy, and other energies possessed by the substance; Dϕi is the diffusion coefficient of one phase in another phase; Q i 0 , ϕ is the activation for the corresponding element’s diffusion; R is the ideal gas constant; and T is the thermodynamic temperature.
In the COMSOL model, the C–H nonlinear diffusion model was transformed to describe the gas and liquid phases. Simultaneously, the effect of temperature is not considered in the model. Hence, the thermal noise term can be eliminated. Furthermore, because the described object is a fluid flow, the concentration function on the left side of the equation can be replaced by Navier–Stokes equations [40]:
ϕ ˙ t + u ϕ = γ λ ε ψ
ψ = ε 2 ϕ + ϕ 2 1 ϕ + ε 2 λ f ext ϕ ,
where the mobility is characterized by the mixed-energy density λ, capillary width ε, and migration rate γ. Ψ is the phase-field auxiliary variable, and φ is the phase-field variable used to distinguish the gas phase from the liquid phase.
The dynamic-mesh calculation method involves deforming the grid within a specified computational domain without topological changes. This is achieved using techniques such as moving, stretching, and grid compression. However, for large displacement changes, grid remeshing must be combined to reshape the grid. Otherwise, grid distortions or errors may occur. In this model, the impact of the sediment on the flow field was realized through dynamic meshing. The boundary-movement rate is calculated jointly from the deposition thickness and erosion rate equations, and it possesses a real-time calculation capability that updates synchronously with the flow field. By specifying the boundary-movement rate and combining it with grid remeshing, the impact of sediment on the flow field can be simulated. To ensure smooth grid movement, a condition was set for grid smoothing.

4.6. Grid Independence Verification

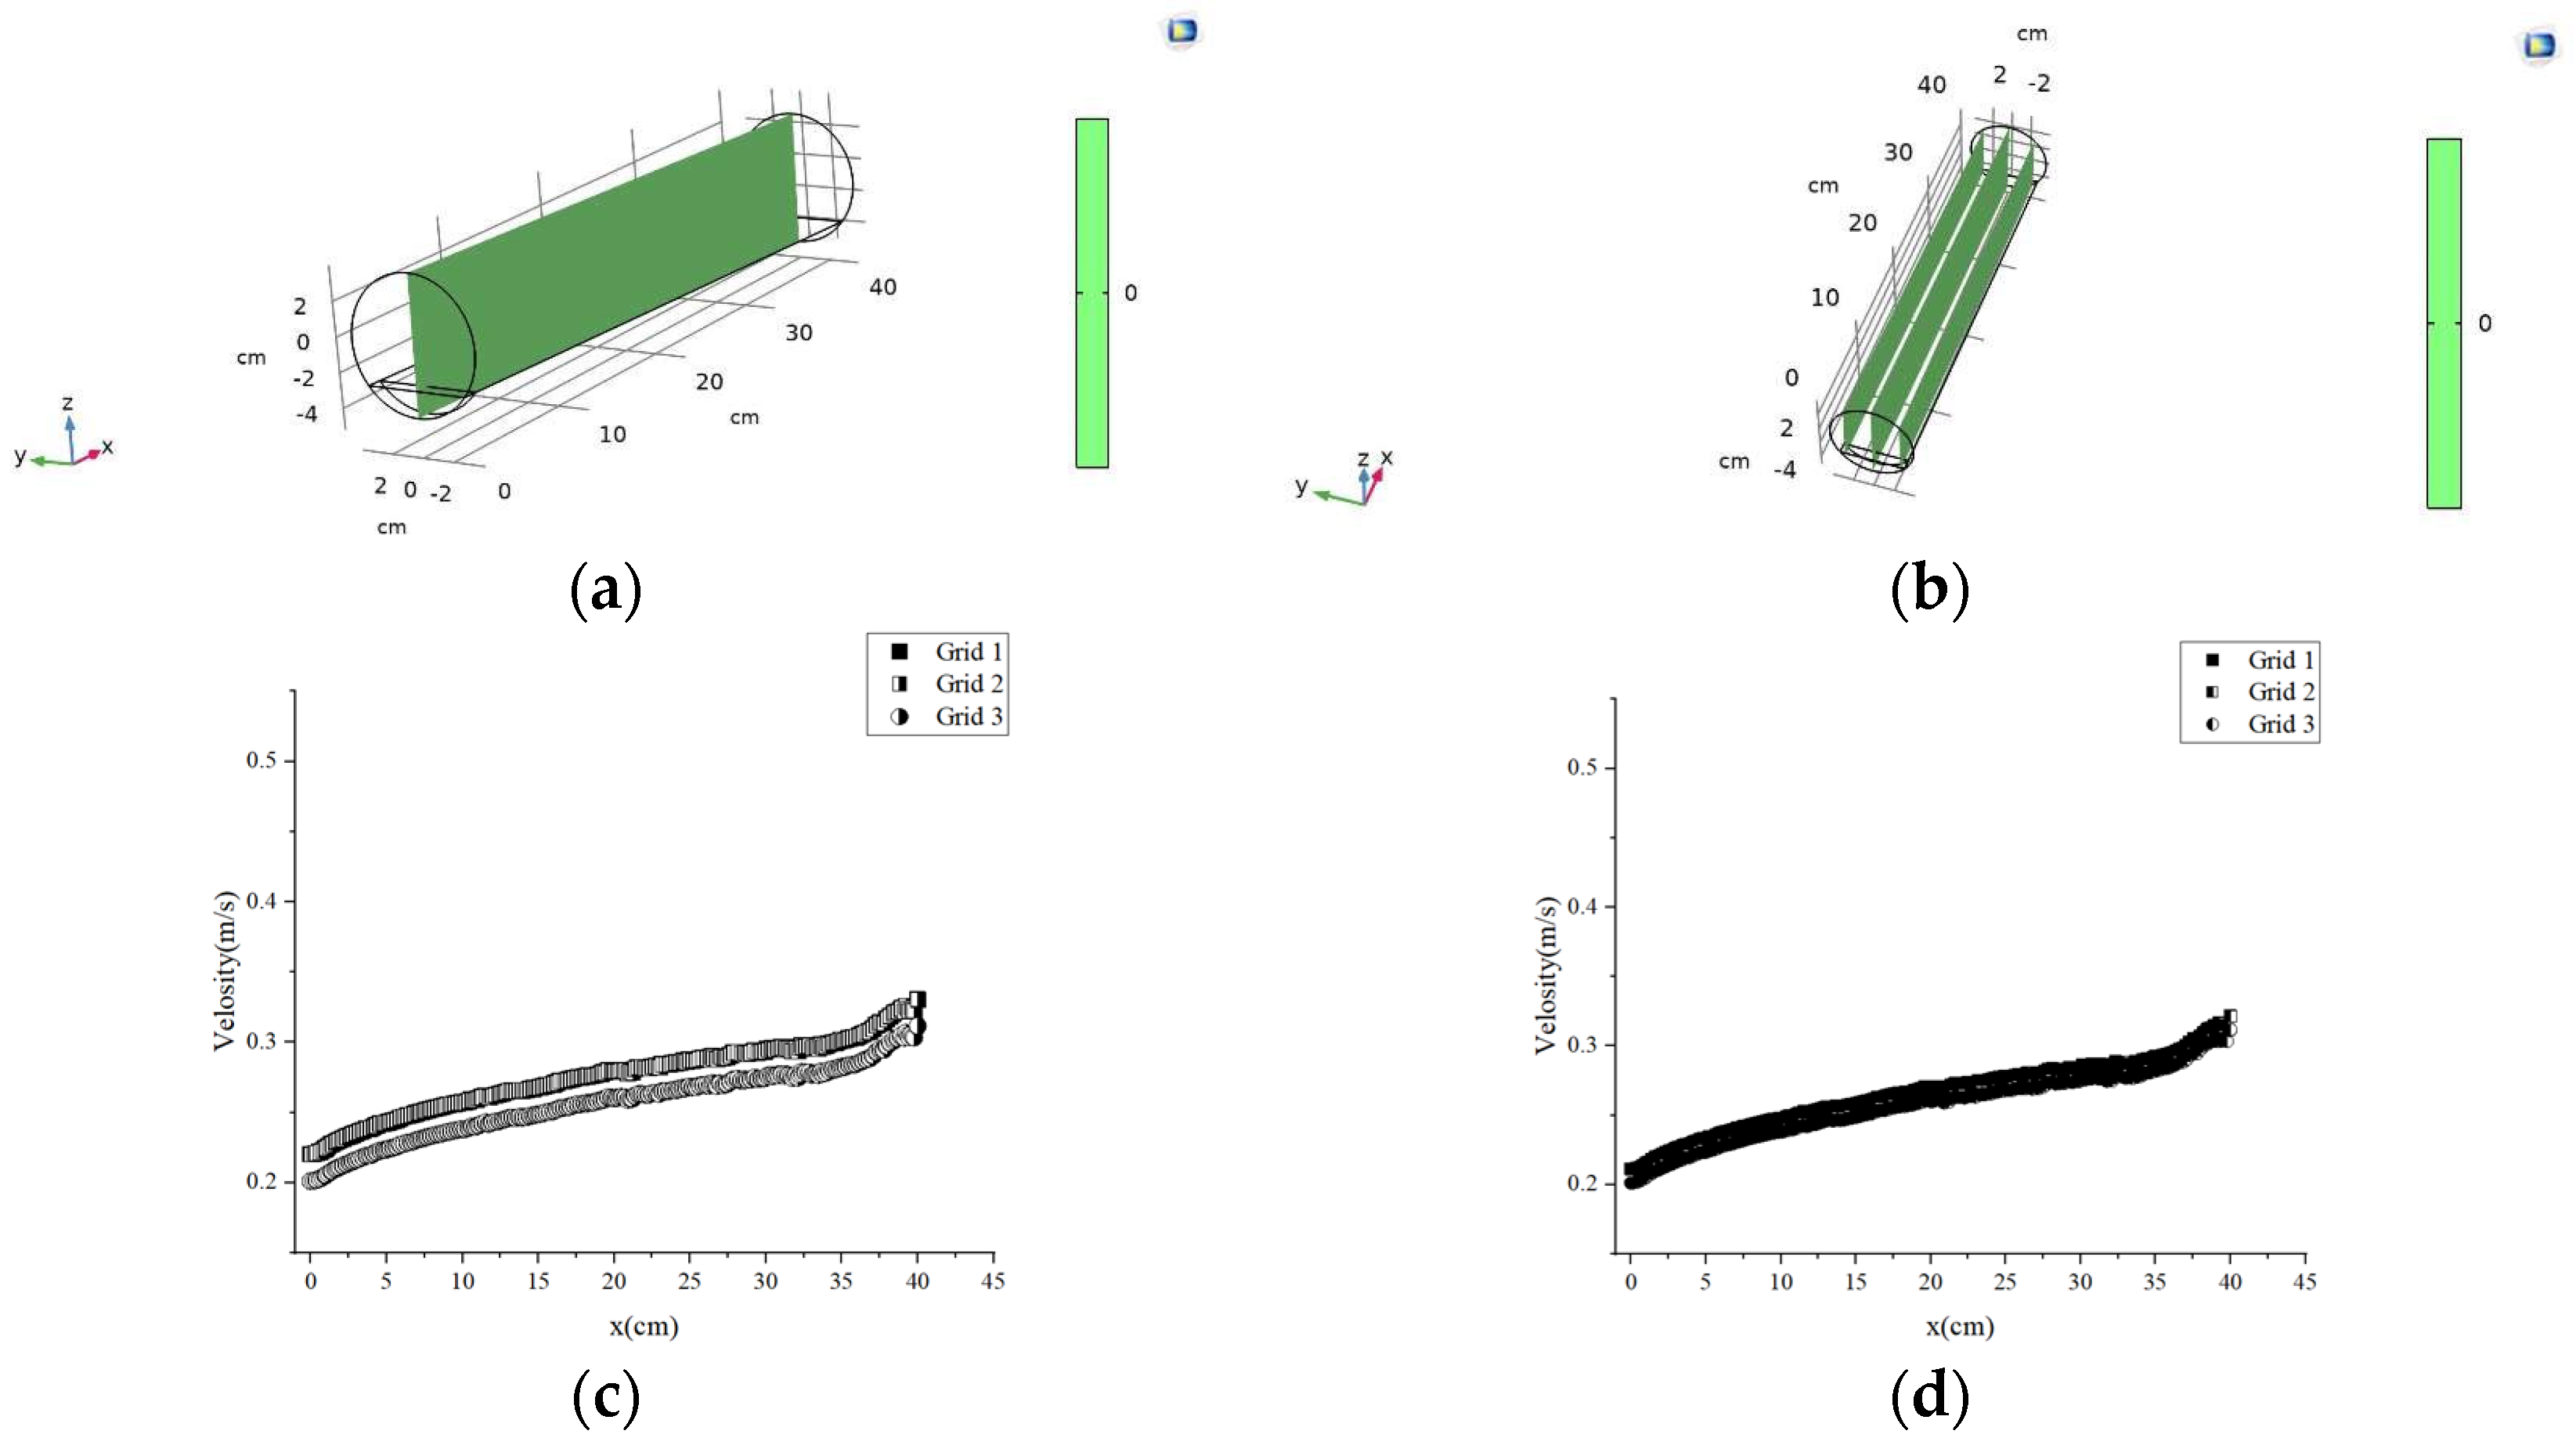
Owing to the regularity of the present model, the built-in meshing algorithm of the COMSOL version 6.1 system was employed. The grid independence was assessed by selecting Plane A, which lies along the longitudinal centerline of the pipe (y = 0), and Plane B, which is 2 cm away from Plane A (y = 2 cm). The analysis was conducted by examining the longitudinal velocity profiles on Planes A and B. As Figure 9 illustrates, taking the calculation results of Pipe 1 as an example, the grid independence was verified by ensuring that the fluctuation in the longitudinal velocity magnitude did not exceed 5%. Considering the balance between the accuracy of the simulation results and the computational effort, the refined mesh count for the system was determined to be 36,758,920.

4.7. Simulation Conditions

Based on the information obtained from the experiments described in Section 3, such as those for the inlet velocity and liquid level height, the boundary conditions listed in Table 3 were set.

4.8. Simulation Results

At the beginning of the model calculation, a significant deviation of >50% was observed. Following multiple adjustments and trials, it was found that dividing mr by 1.8 yielded a better general fit for this experiment. The specific reasons for this are discussed in Section 6. The deposition rate of this model exhibits a process that starts fast and then gradually slows, eventually stabilizing at a certain rate, which can be considered a stable deposition rate. This process was relatively rapid and stabilized within approximately 3 h. This phenomenon is not pronounced at low flow rates and velocities; however, it becomes more evident as the flow rate and velocity increase. According to the results from the boundary probes, such as those under condition 4, the concentration of calcium carbonate deposited at the boundary gradually decreases from 1.6 mol/m3 to 1.375 mol/m3 and then gradually stabilizes. Furthermore, by comparing conditions 1 to 4, the deposition amount decreased significantly as the flow rate and velocity increased. As depicted in the mass-transfer nephogram, the concentration of calcium carbonate was significantly higher at the liquid surface and near the wall than in the middle of the fluid, which is consistent with the experimental findings reported in [6] (Figure 10).

5. Data Comparison

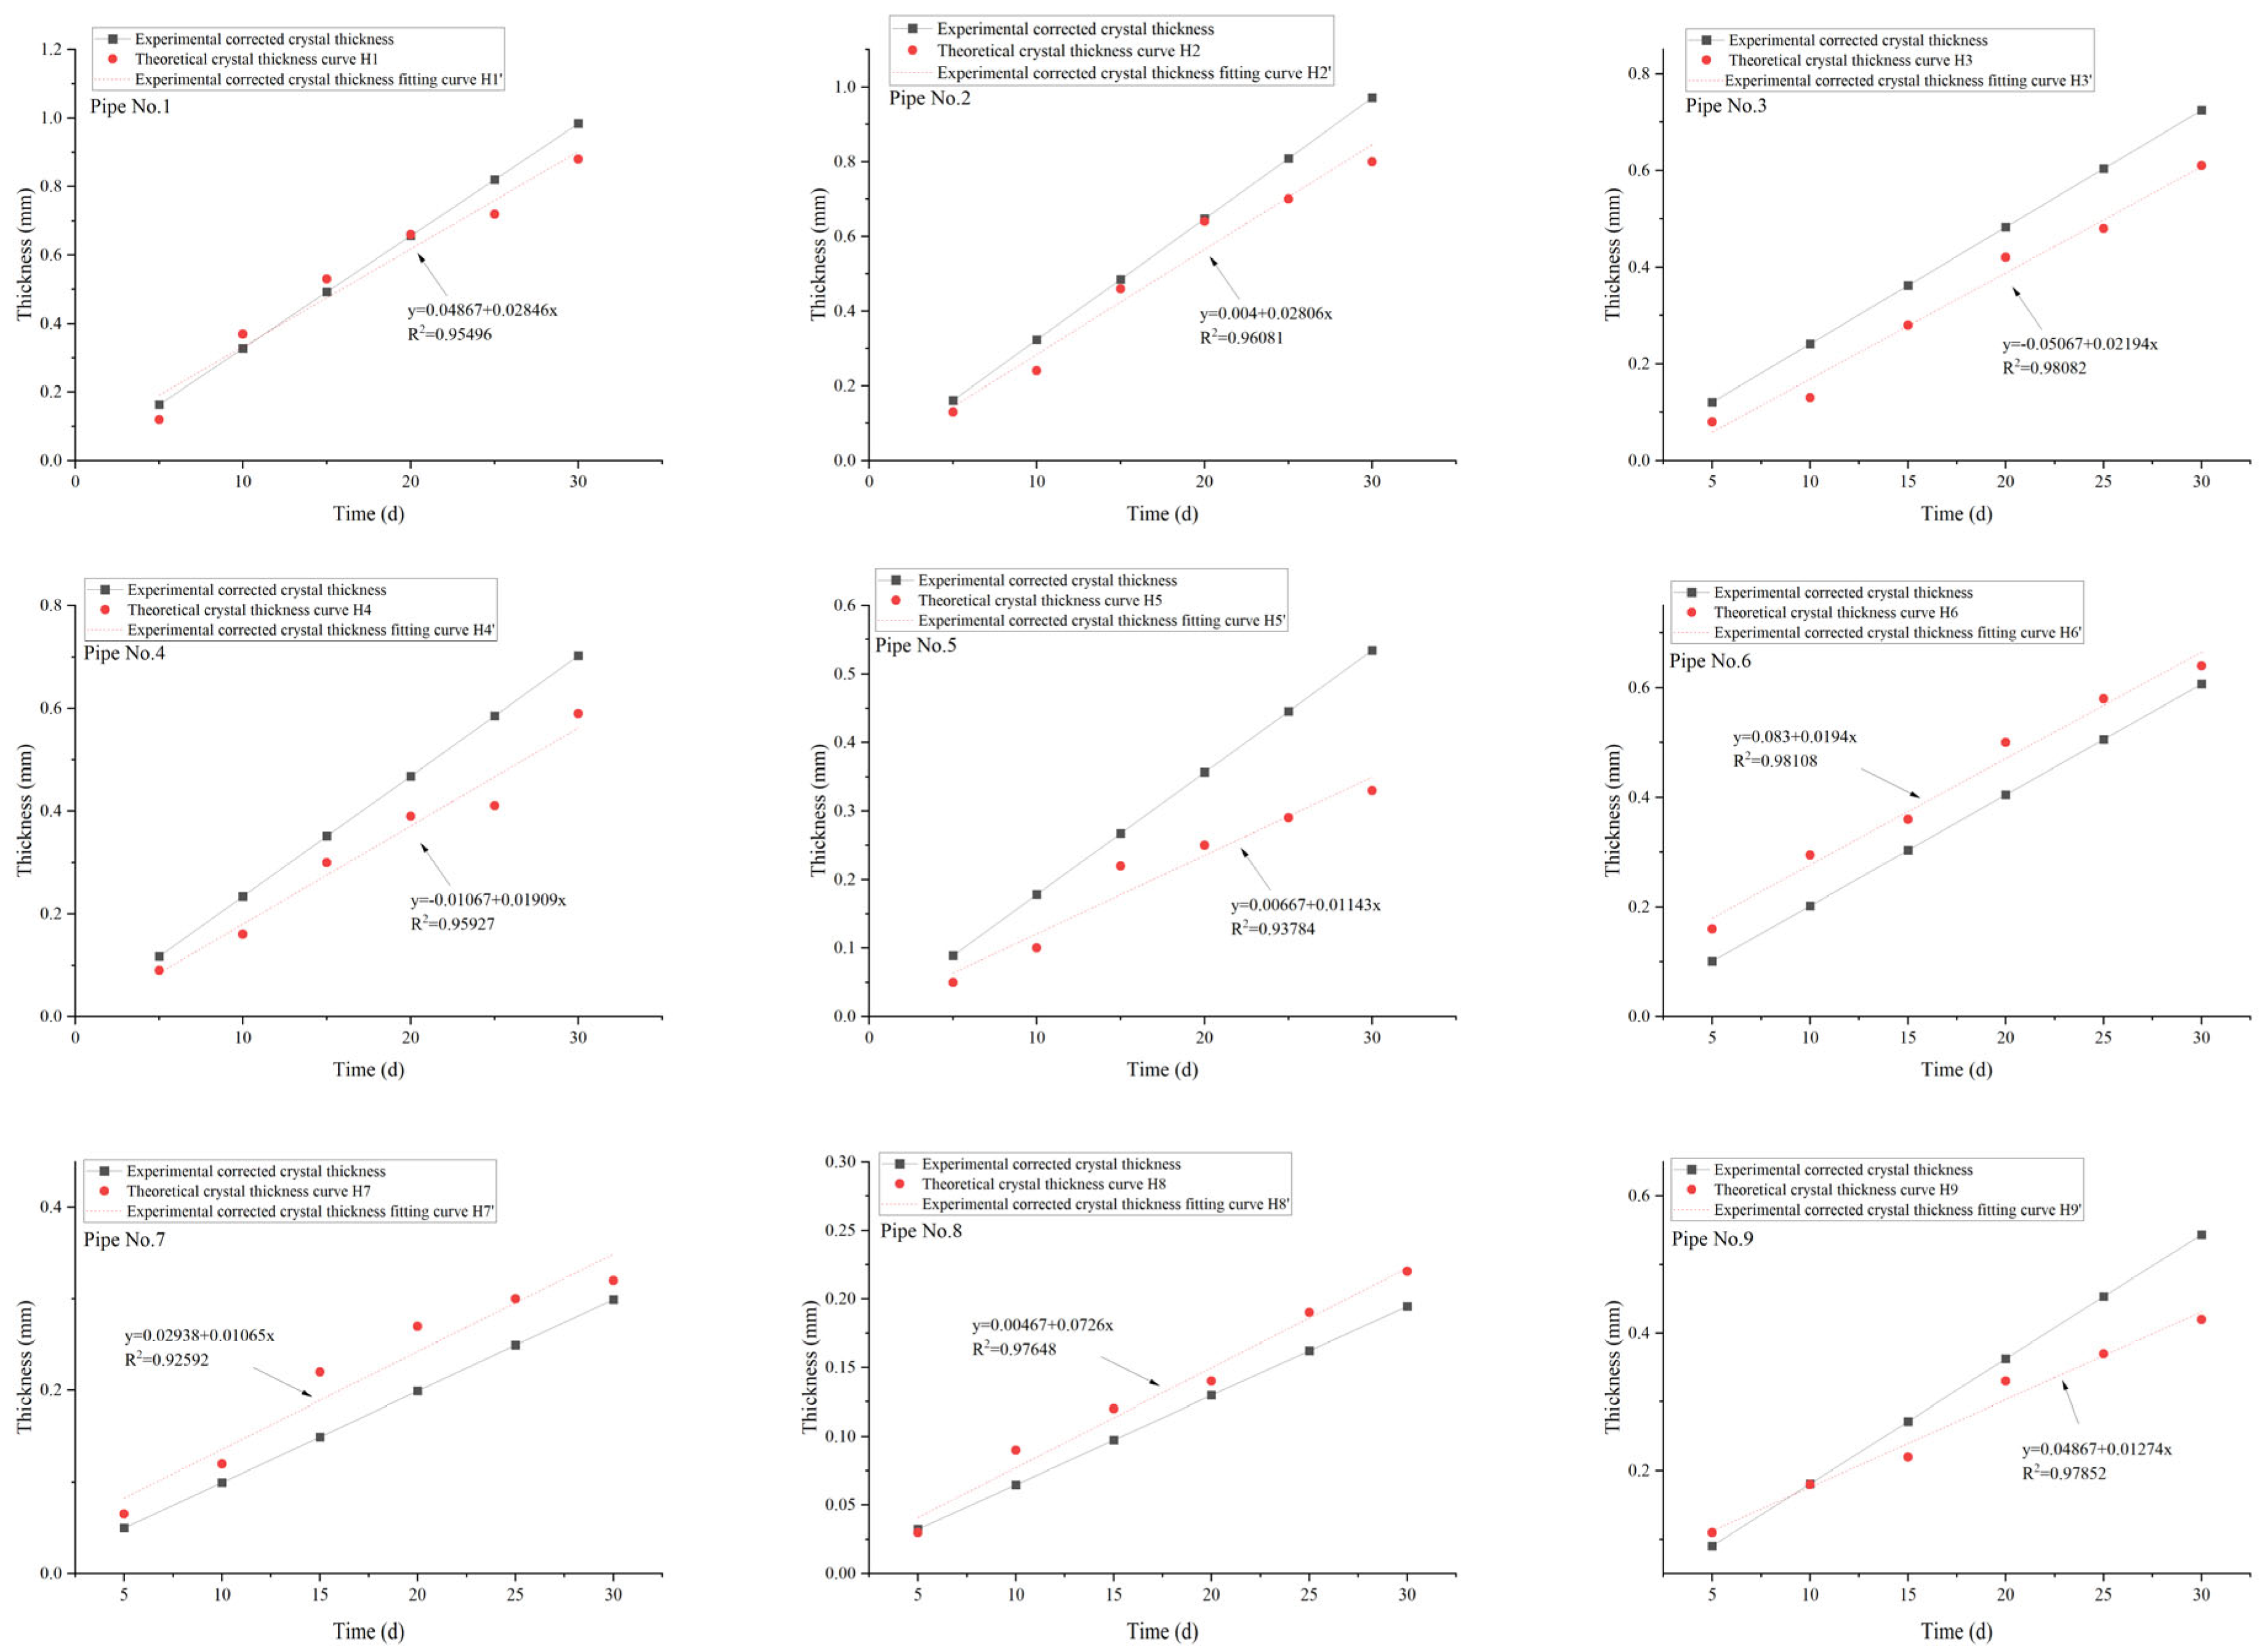
A comparison of the results of the three-dimensional model with the experimental data is presented in Table 4, and the overall deposition trend is shown in Figure 11.
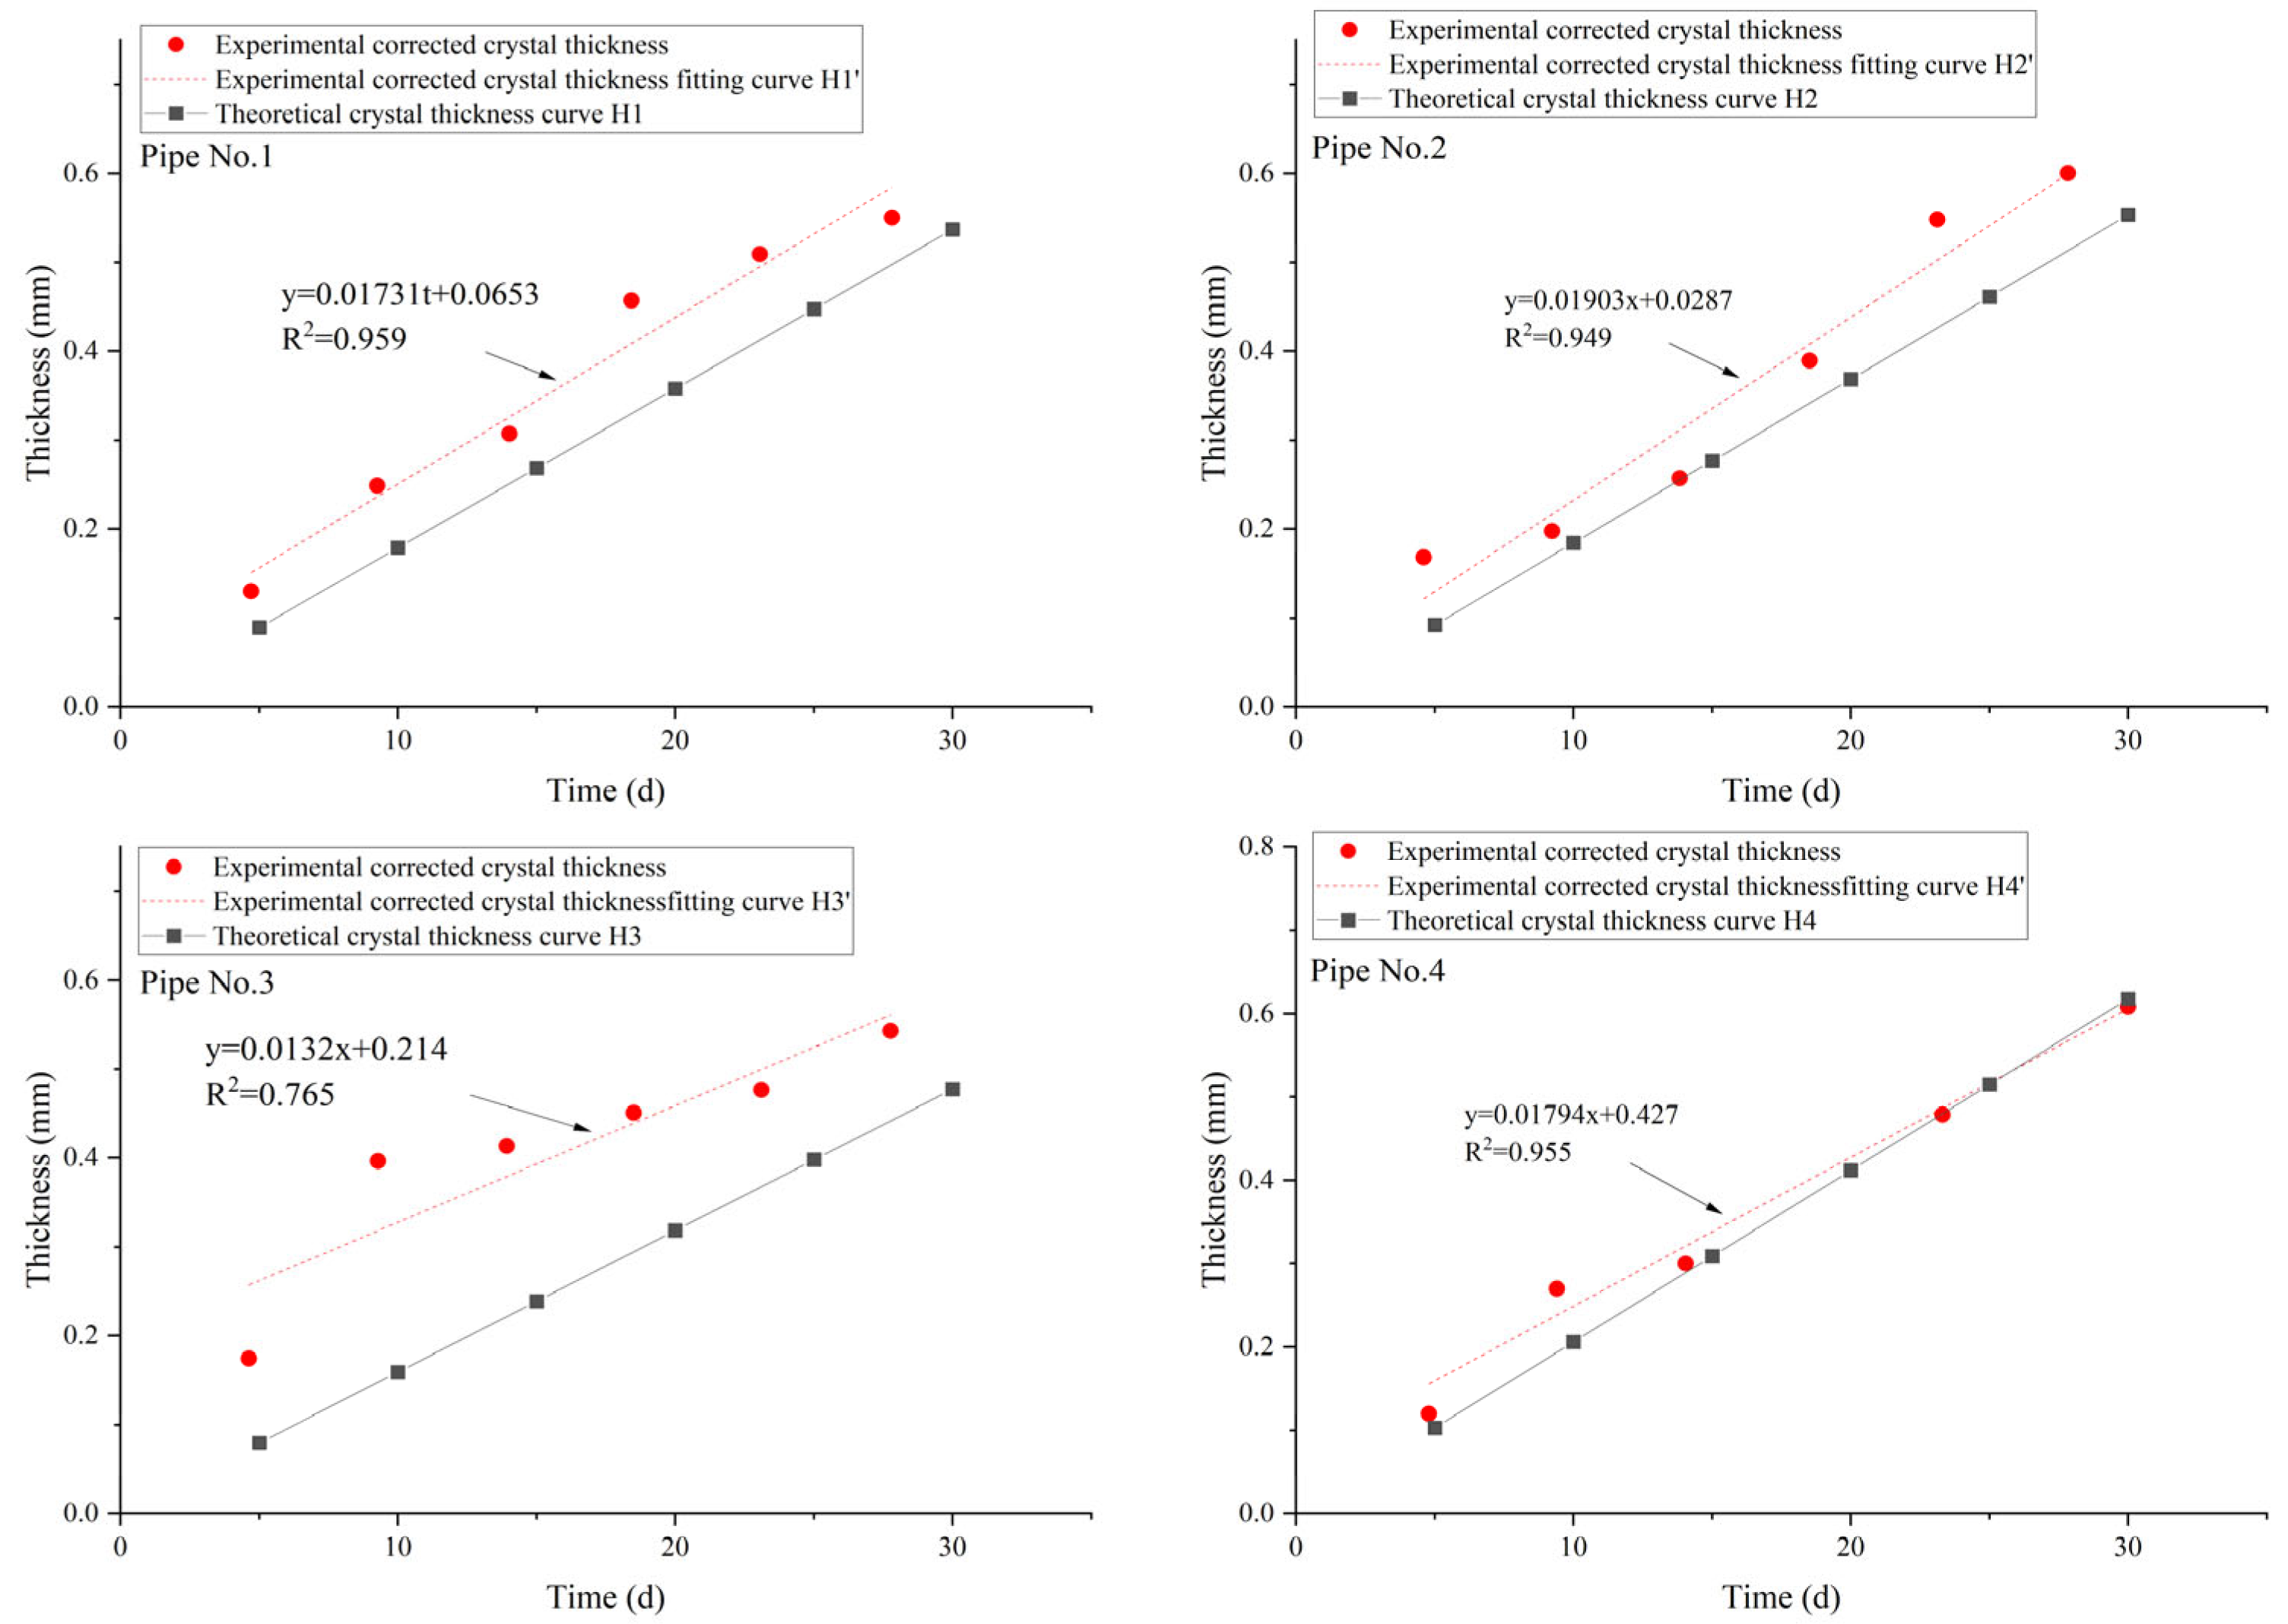
To validate the universality of the model, a study with sufficient boundary conditions was selected for the calculation in [41]. The calculated simulation results are compared with the experimental data in Figure 12 and Table 5. The experiment also utilized DN110 HDPE double-walled corrugated pipes.

6. Analysis

Overall, the model demonstrated good agreement with the current experiment and possessed the ability to simulate practical working conditions to a certain extent. The model exhibited a high degree of consistency with the experiment in terms of the deposition data comparison and the occurrence of relatively high calcium carbonate concentrations at the liquid surface. However, results for the individual pipes deviated significantly.

6.1. Hypothesis of Deviation in the Results

The original deposition formula did not consider the influence of the absolute roughness of the material of the pipe. Therefore, the initial severe deviation improved adaptability after being divided by a correction coefficient. For example, a smoother pipe wall reduces the amount of deposition, as expressed in [42]. This situation is not represented by Formulas (7) and (8). Therefore, under conditions 1–5 with relatively smooth pipe walls, the simulated deposition thickness was greater than the actual thickness, and the greater the erosion, the more severe the deviation. In conditions 6–8, as the absolute roughness of the pipe wall increased, the simulated thickness became smaller than the actual thickness. Furthermore, an increasing flow velocity led to a greater deviation. In summary, this correction coefficient is a function of the nonlinear relationship jointly determined by the absolute roughness of the pipe wall and the flow velocity.
It appears that the No. 5 pipeline might have undergone a considerable impact, owing to a fall during the initial phase of measurement. As indicated in Section 3.2, the susceptibility of crystals to detach during the handling process could have destroyed the deeply embedded crystal structures within the pipe walls after the impact. This disruption may have had a deleterious effect on the subsequent formation of crystals. Simultaneously, the simulation results indicate that the degree and trend of deviation are both most pronounced. The rationale for retaining this set of data is that, within the 30 d experimental period, condition 5 still somewhat reflects the sedimentation trend, indicating that higher flow velocities correspond to lower sediment deposition. As for the issue of significant deviation in the model for smooth pipes under high flow velocities, the deviation does indeed exist, and ongoing research is being conducted to address this matter.

6.2. Calcium Carbonate on the Liquid Surface

The relatively high concentration of calcium carbonate on the liquid surface may be attributed to two factors. The presence of vortices in the turbulent mass-transfer process pushes the particles toward the flow boundary. However, the liquid at the surface can come into contact with air, absorbing more CO2 from the atmosphere and leading to a relatively high concentration of calcium carbonate at the surface.

6.3. Reasons for the Variation in Deposition Weight

According to the theoretical predictions, in the case of a non-pressurized, non-full pipe flow at the outlet, the liquid level rise is expected to be proportional to the increase in both the flow rate and velocity. The increase in velocity leads to a reduction in deposition for two main reasons. First, the increase in velocity enhances the erosion rate. Second, a higher velocity causes a decrease in the concentration of calcium carbonate near the boundary, which further reduces the deposition rate. However, when considering the overall weight increase of the entire pipe, within a certain range of flow velocities, an increase in the flow rate leads to an increase in the wetted perimeter of the cross-section and results in a larger overall deposition area. Although the deposition per unit area decreases as the flow rate increases, the rate of decrease in the deposition per unit area is not as significant as the impact of the overall area increase. However, when the flow velocity reaches 0.35 m/s or higher, the erosion effect becomes more pronounced, and the mere expansion of the deposition area is no longer sufficient to offset the overall deterioration in deposition. At this point, the deposition weight begins to decrease.
Despite the different pipe diameters, the liquid surface height at which the inflection point of the deposition weight change occurred differed. The flow velocity generally reached approximately 0.35 m/s. This may have been related to the flow rate of the pipe, suggesting that the larger the pipe diameter, the greater the flow velocity required for the liquid surface height to increase. Therefore, a larger pipe exhibited a change in weight at a lower liquid surface height. In summary, the deposition thickness decreased as the flow velocity increased. However, within a certain range of flow velocities, owing to the correlation between the flow velocity and the wetted perimeter, an increase in the overall deposition weight occurred, even as the flow velocity increased.
For the model, the most important parameters affecting the deposition thickness were the flow-field velocity u and concentration c. According to the aforementioned statements, the effect of an increased flow velocity is relatively straightforward, but the underlying impact is more complex. Variations in the flow velocity influence the Reynolds number, which affects the mass-transfer coefficient. Changes in the mass-transfer coefficient alter the near-wall concentration, which affect deposition. Additionally, the flow velocity is related to the flow rate. Moreover, an increase in the flow velocity leads to an increase in the flow rate, which expands the wetted perimeter and changes the hydraulic radius, further influencing the deposition. Finally, the flow velocity directly relates to the erosion rate; the higher the flow velocity, the more pronounced the erosion. The impact of the concentration is relatively straightforward; that is, the higher the concentration, the greater the deposition. Therefore, the influence of the flow velocity is relatively significant.

6.4. Influence of Reynolds Number on the Situation

The aforementioned statements describe how flow velocity affects deposition. In the context of the current simulation case, from the perspective of the deposition formula, changes in both the Reynolds number and wetted perimeter jointly affect the mass-transfer coefficient. In this simulation, the mass-transfer coefficient varies within the range of 15–40. When the concentration difference Δc remains constant and the mass-transfer coefficient increases by 45%, the growth rate of the deposition rate md is only 1.3%. Additionally, if the mass-transfer coefficient is in the range of 27–30, further increases in the mass-transfer coefficient no longer contribute positively to the deposition. Overall, the impact of the mass-transfer coefficient is essentially on the order of 10−2. However, under the same influence of the mass-transfer coefficient, the concentration difference Δc has a relatively significant impact. An increase of 20% can lead to an increase of the deposition by approximately 80%. Regarding the erosion rate, an increase in the flow velocity has a positive effect on erosion and the effect becomes more pronounced as the velocity increases. For instance, an increase in the flow velocity of approximately 8% results in an increase in the erosion rate of approximately 12%, and a velocity increase of approximately 25% leads to an erosion rate increase of approximately 38.5% (Figure 13).

6.5. Impact of Local Obstructions

Based on the model results, we can gain a good understanding of why local deposition intensifies when foreign objects enter a pipeline. In the early stages of the flow, the overall flow velocity is impeded by the foreign object, leading to a decrease in velocity and an increase in local concentration. After entering the stable stage, the difference in the concentration between the front and back is not large. A local vortex is formed behind the obstacle with a small area of low-speed flow after the detour, and the flow in the latter half of the foreign object is relatively chaotic. The free surface of this model reflects changes in the flow and concentration fields, which are more in line with real operating conditions. Compared with the full-pipe model of conventional models, the influence of the obstacle does not simply cause local contraction of the flow field and acceleration of the flow velocity. The flow disturbance also manifests as a disruption of the flow field and elevation of the liquid surface. Simultaneously, the free variation in the liquid surface height endows the model with the ability to simulate changes in the flow rate. Furthermore, this capability can be extended by setting the time function of the inflow rate, thus enabling the simulation of changes in the flow field caused by variations in the inflow rate.

7. Discussion

This study simulated the free-liquid surface, which aligns more with the actual conditions. A foundation has been laid for subsequent experiments and simulations to investigate the changes in flow-passage elevation caused by fouling. This aspect also represents a considerable distinction from other studies on pipe scaling. For example, in the case of pipe scaling within heat exchangers, the primary operating environment is one of full pipe flow, accompanied by significant heat transfer processes. In heat exchangers, the formation of scale narrows the flow channels, increasing the flow velocity. However, for tunnel-drainage pipes, the scale formation impact is characterized by a modified-flow passage. In the operating environment of tunnel-drainage pipes, the pipes do not typically run at full capacity for the majority of the time. Additionally, within the same season, there is a minimal variation in temperature, particularly in the South China region, where temperature changes are only observed to a certain degree between the winter and summer.
In the aforementioned model and the indoor experiments, the deposition weight first increased and then decreased within a certain velocity range. However, based on the current experimental and simulation data, we have not yet accurately identified this speed interval or its change pattern. Subsequent research should involve further experiments and simulations to identify the appropriate intervals. Simultaneously, a general rule can be derived that applies to a wider range of pipe diameters to quickly determine whether the pipe is in a region where the deposition and flow rate increments increase in the same direction by measuring the pipe diameter and liquid surface height.
For the correction coefficient of the deposition formula, it is currently known that the correction coefficient is a function of a non-linear relationship jointly determined by the absolute roughness of the pipe wall and the flow velocity. In the future, a reasonable functional-fitting method should be explored to obtain a more reasonable deposition formula. Additionally, regarding the deposition condition, our experiment spanned 30 d. Within this 30 d study, a relatively distinct linear growth rate was observed, and the simulation was also limited to the 30 d research period. However, in the actual long-term deposition process, the deposition rate may undergo significant changes, an aspect that has been relatively less studied. Subsequent research could investigate the impact changes caused by prolonged deposition.
Temperature was not considered a variable in the model simulation. In practical engineering, the water temperature can vary to some extent between the summer and winter. Previous research has also indicated that the influence of temperature on the deposition cannot be ignored. In the experimental process, we overlooked the influence of organic matter, as the determination of organics and their impact on the deposition process are both highly complex. Therefore, in the absence of certainty regarding the feasibility of the simulation, we first conducted the experiments and simulations based on comparatively straightforward and relatively idealized assumptions. Subsequent research and experiments should incorporate the aforementioned factors as variables into the study and analyze their contribution efficiency to the deposition process.

8. Conclusions

From the aforementioned experiments and numerical simulations, we can draw the following conclusions. During the 30 d experimental period, our conclusions were as follows:
  • A two-phase flow model that is more in line with actual conditions was successfully developed, and it is capable of simulating variations in the liquid surface height with an error of approximately 20%. Additionally, the model can simulate flow velocity and concentration distributions under flow channel-blockage conditions. By utilizing the flow-field contours and concentration distributions, the deposition conditions can be better predicted.
  • The deposition formula should be multiplied by a correction coefficient, which is related to the absolute roughness of the wall and the flow velocity.
  • Through simulations using this model, we can visually analyze the impact of the flow velocity on the entire deposition process. Specifically, the flow velocity affects the overall deposition by influencing the mass-transfer coefficient, near-wall concentration, and erosion rate. With the aid of simulations, sedimentation research can gradually transition toward quantitative studies, allowing for the analysis of the effects of various parameters on the deposition process.
  • Under the condition of non-pressurized, non-full pipe flow at the outlet, we observe that the deposition weight first increased and then decreased within a certain velocity range.

Author Contributions

Conceptualization, J.L. (Jianbing Lv) and Z.C.; methodology, Z.C.; software, Z.C.; validation, J.L. (Jianbing Lv), L.F. and C.L.; formal analysis, Z.C.; investigation, Z.C.; resources, J.L. (Jianbing Lv); data curation, J.L. (Jianbing Lv); writing—original draft preparation, Z.C.; writing—review and editing, L.F.; visualization, J.L. (Jia Li); supervision, J.H.; project administration, J.L. (Jia Li); funding acquisition, J.L. (Jianbing Lv). All authors have read and agreed to the published version of the manuscript.

Funding

This research was funded by the National Natural Science Foundation of China (42002249) and the Special Project for Research and Development in Key Areas of Guangdong Province (2019B110207001).

Data Availability Statement

Data are contained within the article.

Acknowledgments

We would like to thank the help from the Shiyanjia Laboratory (http://www.shiyanjia.com, accessed on 13 May 2024) in performing SEM experiments is greatly appreciated.

Conflicts of Interest

Jia Li is employed by Jiangmen Yinzhouhu Expressway Co., Ltd. The funders had no role in the design of the study; in the collection, analysis, or interpretation of data; in the writing of the manuscript; or in the decision to publish the results.

References

  1. Qian, Z.; Peng, H.; Lu, J.; Chen, G. Experimental study on chemical crystallization blockage of drainage pipes in limestone tunnels in southern China. Mod. Tunn. Technol. 2021, 58, 143–149. [Google Scholar]
  2. Lu, G.; Wang, P.; Yang, Y.; Mao, C.; Wu, Y.; Wu, J.; Dong, P.; Wu, J. Review of Research on Groundwater Seepage Induced Crystallization and Blockage Mechanism and Scale Inhibition Technology in the Tunnel Drainage System in Karst Areas. Mod. Tunn. Technol. 2021, 58, 11–20. [Google Scholar]
  3. Cui, Y.-J.; Lamas-Lopez, F.; Trinh, V.N.; Calon, N.; D’aguiar, S.C.; Dupla, J.-C.; Tang, A.M.; Canou, J.; Robinet, A. Investigation of interlayer soil behaviour by field monitoring. Transp. Geotech. 2014, 1, 91–105. [Google Scholar] [CrossRef]
  4. Jia, N.; Tassin, B.; Calon, N.; Deneele, D.; Koscielny, M.; Prévot, F. Scaling in railway infrastructural drainage devices: Site study. Innov. Infrastruct. Solut. 2016, 1, 42. [Google Scholar] [CrossRef]
  5. Chen, Y.; Cui, Y.; Barrett, A.G.; Chille, F.; Lassalle, S. Investigation of calcite precipitation in the drainage system of railway tunnels. Tunn. Undergr. Space Technol. Inc. Trenchless Technol. Res. 2019, 84, 45–55. [Google Scholar] [CrossRef]
  6. Wedenig, M.; Eichinger, S.; Boch, R.; Leis, A.; Wagner, H.; Dietzel, M. Understanding of tunnel drainage scale formation by in-situ monitoring. Tunn. Undergr. Space Technol. 2023, 131, 104853. [Google Scholar] [CrossRef]
  7. Wu, Z.; Cui, Y.; Barrett, A.G.; Moreno, M.M.; Deng, Y. Role of surrounding soils and pore water in calcium carbonate precipitation in railway tunnel drainage system. Transp. Geotech. 2019, 21, 100257. [Google Scholar] [CrossRef]
  8. Lun, M.; Yu, Z.; Hui, R. Study on Crystallization Mechanism & Prevention Measures of Non-Karst Tunnel Drainage System. China Munic. Eng. 2022, 5, 66–69, 124. [Google Scholar]
  9. Tang, Y.; Zhou, Z.; Wang, Y.; Zhang, J.; Tian, C.; Xue, B. Seasonal variations and sources of dripping CO, in karst caves: A case study of the Dafeng cave Guizhou Province. Carsologica Sin. 2021, 40, 521–530. [Google Scholar]
  10. Dietzel, M.; Rinder, T.; Leis, A.; Reichl, P.; Sellner, P.; Draschitz, C.; Plank, G.; Klammer, D.; Schöfer, H. Koralm Tunnel as a Case Study for Sinter Formation in Drainage Systems—Precipitation Mechanisms and Retaliatory Action. Geomech. Tunnelbau 2008, 1, 271–278. [Google Scholar] [CrossRef]
  11. Kun, X.; Jie, Z.; Xuefu, Z.; Chao, H.; Lin, S.; Li, S. Experimental Study on Crystallization Rule of Tunnel Drainpipe in Alkaline Environment. Tunn. Constr. 2019, 39, 207–212. [Google Scholar]
  12. Nie, C.; Rao, J.; Liu, J.; Li, Y.; Wang, S.; Xie, C. Study on the crystal composition and mechanism of tunnel drainage system. J. Henan Polytech. Univ. (Nat. Sci.) 2022, 41, 196–202. [Google Scholar]
  13. Eichinger, S.; Boch, R.; Leis, A.; Koraimann, G.; Grengg, C.; Domberger, G.; Nachtnebel, M.; Schwab, C.; Dietzel, M. Scale deposits in tunnel drainage systems—A study on fabrics and formation mechanisms. Sci. Total Environ. 2020, 718, 137140. [Google Scholar] [CrossRef] [PubMed]
  14. Dong, F.; Chen, Y.; Dai, Q.; Fei, Z.; Liu, M.; Jiang, Z.; Zhang, Q.; Li, B.; Baba, A.; O’Driscoll, M.; et al. Research progress on interfacial crystallization of travertine in secondary organic system. Carsologica Sin. 2021, 40, 34–43. [Google Scholar]
  15. Dong, F.; Chen, Y.; Dai, Q.; Fei, Z.; Liu, M.; Jiang, Z.; Zhang, Q.; Li, B.; Baba, A.; O’Driscoll, M.; et al. Preliminary study on nanometer growth process and regulatory mechanism of travertine nonclassical deposition-A case study of travertine in Jiuzhaigou valley and Huanglong region. Carsologica Sin. 2021, 40, 55–67. [Google Scholar]
  16. Chan, C.S.; Fakra, S.C.; Emerson, D.; Fleming, E.J.; Edwards, K.J. Lithotrophic iron-oxidizing bacteria produce organic stalks to control mineral growth: Implications for biosignature formation. ISME J. 2011, 5, 717–727. [Google Scholar] [CrossRef]
  17. Wei, L.; Guo, J.; Zhang, X.; Li, Y.; Huang, P. Study of electric field impact on crystallization in tunnel drainage pipes in hard water area. Adv. Civ. Eng. 2021, 2021, 1–17. [Google Scholar] [CrossRef]
  18. Nie, C.; Rao, J. Research on Fuzzy Evaluation Model for Crystal Blockage Risk in Tunnel Drainage System. China Water Transp. 2021, 21, 30–32. [Google Scholar]
  19. Plummer, L.N.; Wigley, T.M.; Parkhurst, D.L. The kinetics of calcite dissolution in CO2-water systems at 5 degrees to 60 degrees C and 0.0 to 1.0 atm CO2. Am. J. Sci. 1978, 278, 179–216. [Google Scholar] [CrossRef]
  20. Dreybrodt, W.; Buhmann, D. A mass transfer model for dissolution and precipitation of calcite from solutions in turbulent motion. Chem. Geol. 1991, 90, 107–122. [Google Scholar] [CrossRef]
  21. Mao, C.; Yang, Y.; Wu, J.; Dong, P.; Wu, J. Numerical simulation of crystal blockage in tunnel drainage pipe based ondynamic grid and level set. Carsologica Sin. 2023, 42, 245–256. [Google Scholar]
  22. Pääkkönen, T.M.; Riihimäki, M.; Simonson, C.J.; Muurinen, E.; Keiski, R.L. Crystallization fouling of CaCO3—Analysis of experimental thermal resistance and its uncertainty. Int. J. Heat Mass Transf. 2012, 55, 6927–6937. [Google Scholar] [CrossRef]
  23. Pääkkönen, T.M.; Ojaniemi, U.; Pättikangas, T.; Manninen, M.; Muurinen, E.; Keiski, R.L.; Simonson, C.J. CFD modelling of CaCO3 crystallization fouling on heat transfer surfaces. Int. J. Heat Mass Transf. 2016, 97, 618–630. [Google Scholar] [CrossRef]
  24. Hasan, B.O.; Nathan, G.J.; Ashman, P.J.; Craig, R.A.; Kelso, R.M. The effects of temperature and hydrodynamics on the crystallization fouling under cross flow conditions. Appl. Therm. Eng. 2012, 36, 210–218. [Google Scholar] [CrossRef]
  25. Nikoo, A.H.; Malayeri, M.R. Incorporation of surface energy properties into general crystallization fouling model for heat transfer surfaces. Chem. Eng. Sci. 2020, 215, 115461. [Google Scholar] [CrossRef]
  26. Duan, Z.; Cheng, C.; Tang, W. A mathematical model for predicting crystallization fouling in narrow rectangle channel incorporating crystal growth effect. Energy 2024, 291, 130399. [Google Scholar] [CrossRef]
  27. Coto, B.; Martos, C.; Peña, J.L.; Rodríguez, R.; Pastor, G. Effects in the solubility of CaCO3: Experimental study and model description. Fluid Phase Equilibria 2012, 324, 1–7. [Google Scholar] [CrossRef]
  28. Babuška, I.; Silva, R.S.; Actor, J. Break-off model for CaCO3 fouling in heat exchangers. Int. J. Heat Mass Transf. 2018, 116, 104–114. [Google Scholar] [CrossRef]
  29. Hissanaga, A.M.; Barbosa, J.R., Jr.; da Silva, A.K. Numerical analysis of inorganic fouling with multi-physics turbulent models. Appl. Therm. Eng. 2023, 220, 119624. [Google Scholar] [CrossRef]
  30. Mousavian, S.; Malayeri, M.R.; Fahiminia, F. Mathematical modeling of initial fouling rate of calcium Sulphate Dihydrate based on nucleation rate. Heat Mass Transf. 2020, 56, 2145–2158. [Google Scholar] [CrossRef]
  31. Xiong, C.; Chen, Y.; Ma, C. Prediction model of crystallization fouling of calcium carbonate in circulating cooling water. Int. J. Therm. Sci. 2023, 183, 107829. [Google Scholar] [CrossRef]
  32. Zhang, F.; Xiao, J.; Chen, X.D. Towards predictive modeling of crystallization fouling: A pseudo-dynamic approach. Food Bioprod. Process. 2015, 93, 188–196. [Google Scholar] [CrossRef]
  33. Shen, C.; Cirone, C.; Wang, X. A method for developing a prediction model of water-side fouling on enhanced tubes. Int. J. Heat Mass Transf. 2015, 85, 336–342. [Google Scholar] [CrossRef]
  34. Li, W.; Li, H.; Li, G.; Yao, S. Numerical and experimental analysis of composite fouling in corrugated plate heat exchangers. Int. J. Heat Mass Transf. 2013, 63, 351–360. [Google Scholar] [CrossRef]
  35. Jin, H.-Q.; Athreya, H.; Kalle, A.; Wang, S.; Nawaz, K. CFD modeling of crystallization fouling with CO2 desorption incorporated for a falling-film evaporator in thermal desalination. Desalination 2023, 553, 116456. [Google Scholar] [CrossRef]
  36. Mao, C.; Yang, Y.; Wu, J.; Dong, P.; Wu, J. Comparative study on hydrodynamic chemical reaction coupling simulation of crystallization blockage in karst pipelines. Carsologica Sin. 2023, 42, 245–256. [Google Scholar]
  37. Chen, Z.; Wang, Z.; Wu, W.; Xia, T.; Pan, E. A hybrid battery degradation model combining arrhenius equation and neural network for capacity prediction under time-varying operating conditions. Reliab. Eng. Syst. Saf. 2024, 252, 110471. [Google Scholar] [CrossRef]
  38. Brahim, F.; Augustin, W.; Bohnet, M. Numerical simulation of the fouling process. Int. J. Therm. Sci. 2003, 42, 323–334. [Google Scholar] [CrossRef]
  39. Wang, K.; Yang, W.; Shi, X.; Hou, H.; Zhao, Y. Study of Al by Phase Field Method_Mechanism of Cu rich phase precipitation in xCuMnNiFe high entropy alloy. Acta Phys. Sin. 2023, 72, 319–333. [Google Scholar]
  40. Fontes, E. Using COMSOL Multiphysics® Two Methods for Simulating a Free Liquid Surface. Available online: https://cn.comsol.com/blogs/two-methods-for-modeling-free-surfaces-in-comsol-multiphysics (accessed on 15 May 2024).
  41. Wang, Y.; Liu, Y.; Qi, C.; Zhou, T.; Ye, M.; Wang, T. Crystallization law of karst water in tunnel drainage system based on DBL theory. Open Phys. 2021, 19, 241–255. [Google Scholar] [CrossRef]
  42. Wei, X.; Liu, Y.; Shi, X.; Li, Y.; Ma, H.; Hou, B.; Shangguan, S.; Li, Z.; Niu, Y. Experimental research on brine crystallization mechanism in solution mining for salt cavern energy storage. J. Energy Storage 2022, 55, 105863. [Google Scholar] [CrossRef]
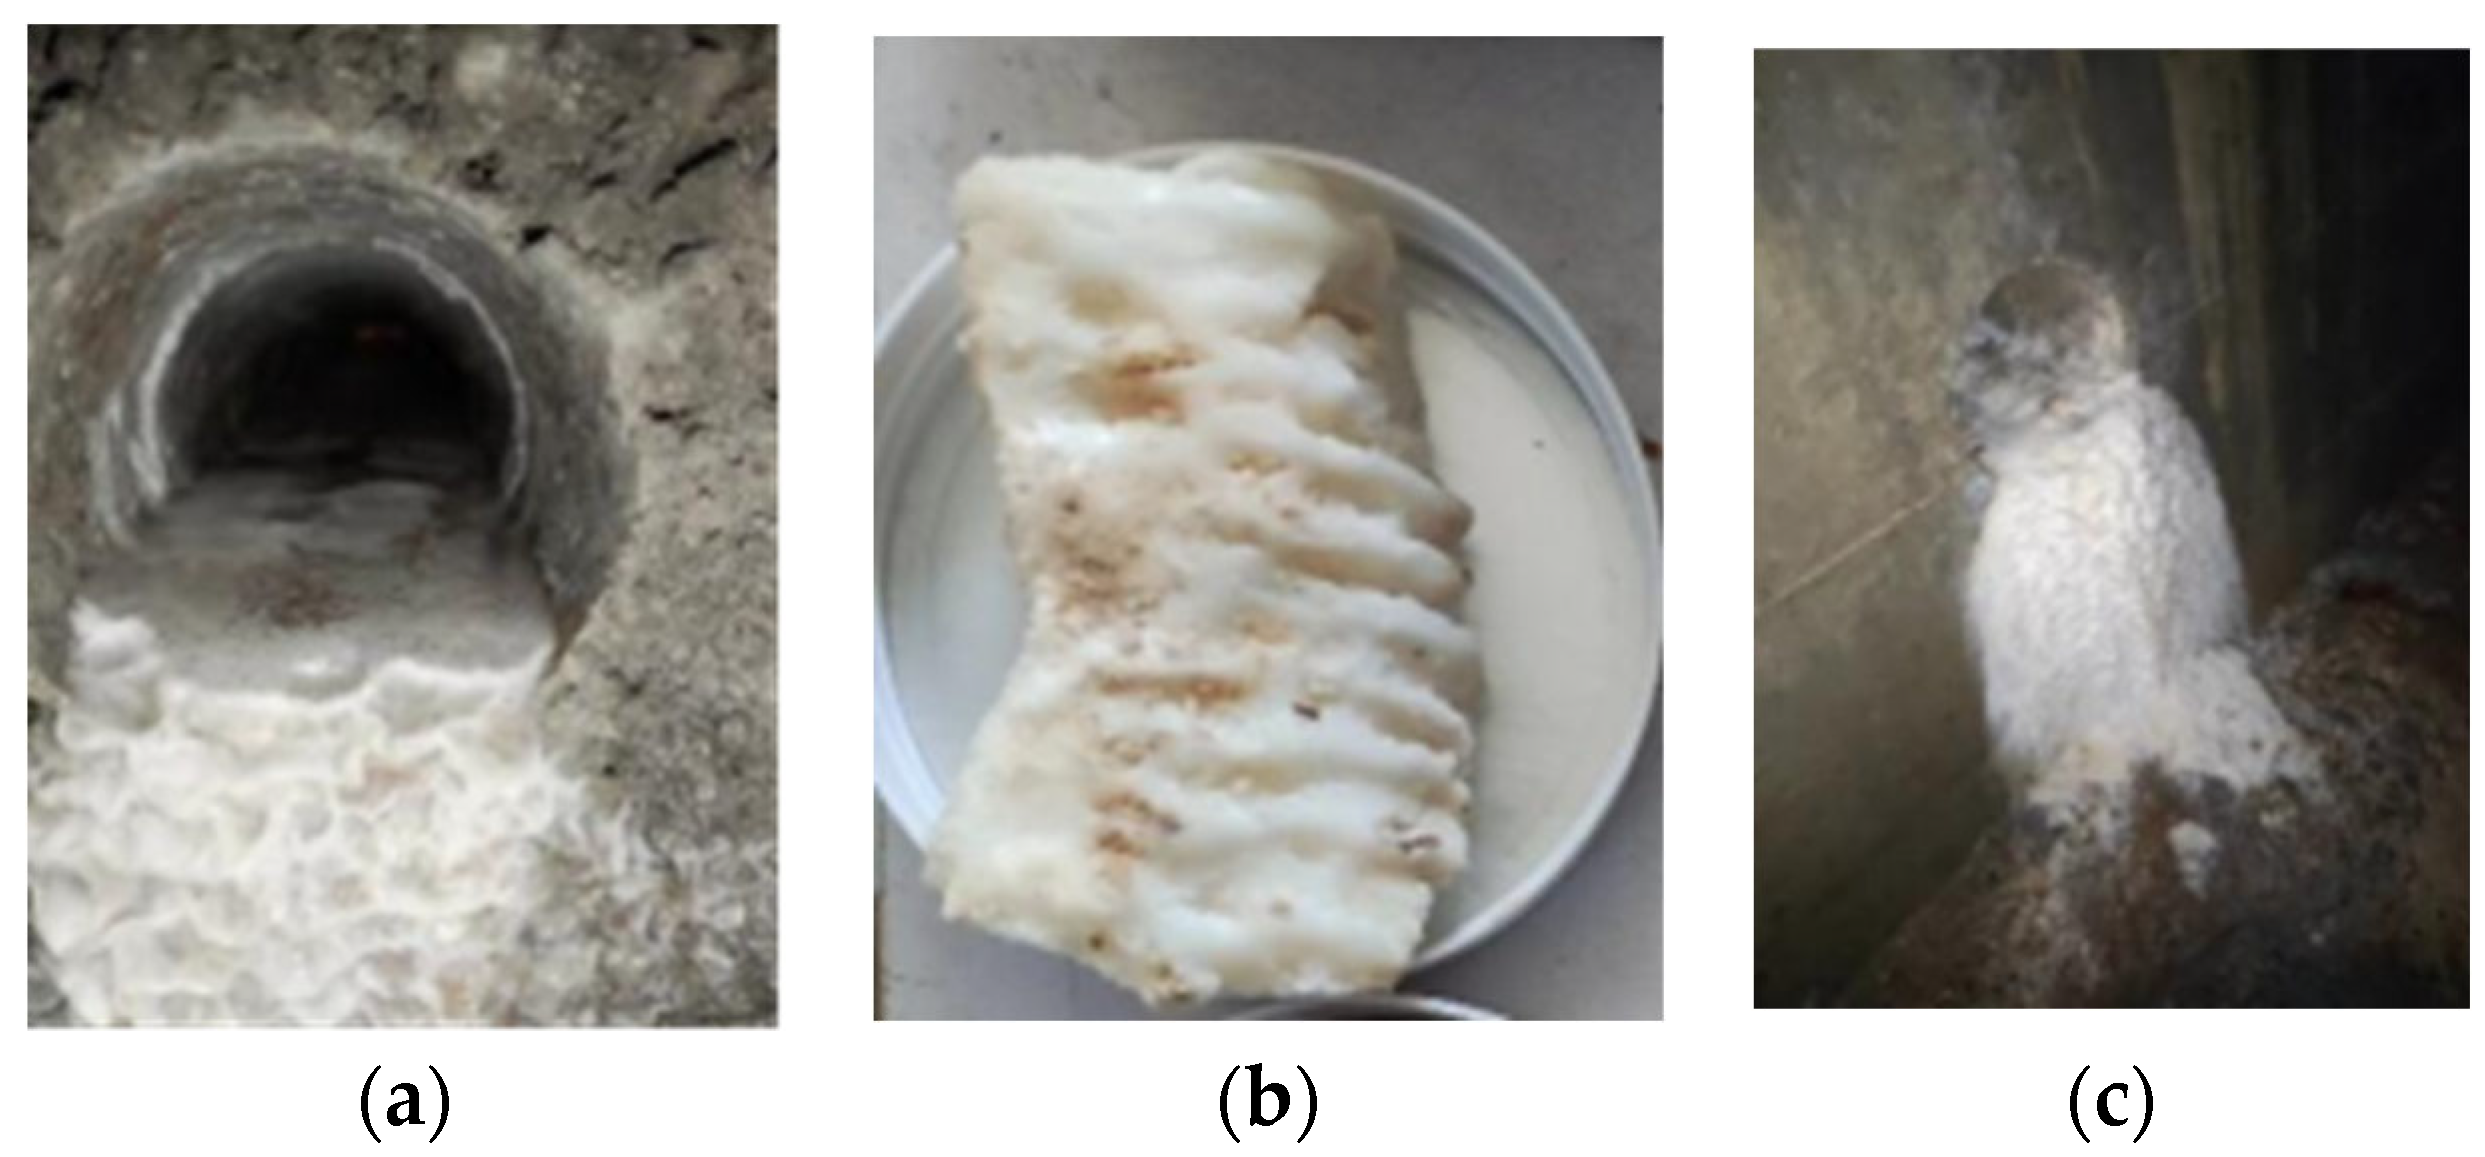
Figure 1. (a) Photograph of crystallization inside a field drainage pipe. (b) Crystallization sample. (c) Photograph of crystallization at the outlet of a field drainage pipe.
Coatings 14 01273 g001
Figure 2. (a) XRD analysis with a scanning range of 5–90°, speed of 5°/min, and continuous scanning at 0.02/s. (b) Scanning electron microscopy observation.
Coatings 14 01273 g002
Figure 3. (A) Photograph of the experimental setup. (a) Collecting-solution for water circulation. (b) Experimental pipe segment. (B) Deposition weight diagram.
Coatings 14 01273 g003
Figure 4. (a) Deposition in smooth round pipes. (b) Deposition in corrugated pipes. (c) Crystallization situation of condition 9.
Coatings 14 01273 g004
Figure 5. (a) Schematic of thickness measurements. (b) Deposition thickness trend for each pipe. (c) Deposit thickness to diameter ratio.
Coatings 14 01273 g005
Figure 6. Illustration of Sample 1 inspection.
Coatings 14 01273 g006
Figure 7. Relationship between basic equations.
Coatings 14 01273 g007
Figure 8. Technical flowchart.
Coatings 14 01273 g008
Figure 9. (a,b) Schematics of selected planes. (c) Longitudinal velocity distribution profile of Plane A (d) Longitudinal velocity distribution profile of Plane B.
Coatings 14 01273 g009
Figure 10. (a,b) Free-surface flow condition. The red arrow represents the streamline of the flow field. (c) Selected zx section for the observation of the transfer. (d) Transfer of calcium carbonate generated in water.
Coatings 14 01273 g010
Figure 11. From the upper left to the lower right, the simulation deposition thicknesses for conditions 1–9 are compared with the actual measured thicknesses and the linear fitting of the actual measured thicknesses.
Coatings 14 01273 g011
Figure 12. Comparison of simulation data with experimental data from [41].
Coatings 14 01273 g012
Figure 13. (a) Local velocity cloud and (b) concentration transfer diagrams of an obstruction. The arrow represents the streamline of the flow field.
Coatings 14 01273 g013
Table 1. Analysis of ion concentration in field water samples.
SampleCa2+ (mg/L)Mg2+ (mg/L)Ba2+ (mg/L)Na+ (mg/L)
a66.63169.33660.11191.0865
b64.37259.30310.10610.7503
c65.23429.29450.11240.9345
Table 2. Experimental condition settings.
ConditionsLiquid Level Height (mm)Pipe SlopePipe Material Type and Diameter
16.13%Length: 1 m; pipe diameter: Ø75 mm; pipe material: PVC.
26.14%
38.73%
49.04%
510.33%
67.13%Length: 1 m; pipe diameter: Ø110 mm; pipe material: PVC.
712.53%Length: 1 m; pipe diameter: Ø110 mm; pipe material: HDPE double-wall corrugated pipe.
812.44%
910.53%Material: PVC smooth pipe; at the outlet, a sponge blockage with dimensions of 1 cm × 1.5 cm × 3 cm is used to obstruct the flow.
Table 3. Simulation condition settings.
Pipe No.Liquid Level Height (mm)Pipe SlopeInlet Velocity (m/s)Absolute Roughness of Pipe Wall (μm)
16.13%0.22052.03
26.14%0.22032.06
38.73%0.36802.04
49.04%0.36902.01
510.33%0.41062.07
67.13%0.41102.66
712.53%0.53282.71
812.44%0.53672.75
910.53%0.41232.05
Table 4. Comparison of experimental data with simulation data.
Pipe No.Average Deposition Thickness from Experiments (mm/d)Average Simulated Deposition Thickness (mm/d)Relative Error (%)
10.029330.0328110.60
20.026670.0323717.61
30.020330.0241615.84
40.019670.0234115.99
50.011000.0178338.30
60.021330.020245.42
70.010670.009976.97
80.007330.0064913.03
Thickness of obstruction rear after experiment (mm)Thickness of obstruction rear after simulation (mm)
90.014000.0181322.79
Table 5. Comparison of simulation data with experimental data from [41].
Pipe No.Average Deposition Thickness from Experiments (mm/d)Average Simulated Deposition Thickness (mm/d)Relative Error (%)
10.01830.01792.53
20.02000.01847.79
30.01800.015912.04
40.02030.02061.56
Disclaimer/Publisher’s Note: The statements, opinions and data contained in all publications are solely those of the individual author(s) and contributor(s) and not of MDPI and/or the editor(s). MDPI and/or the editor(s) disclaim responsibility for any injury to people or property resulting from any ideas, methods, instructions or products referred to in the content.