Abstract
To optimize the crawling phenomenon of slides under circumstances of low speed and a heavy load, a composite lubrication structure is adopted to alleviate the crawling phenomenon. The response surface optimal-design method establishes a quadratic mathematical model for multistage composite lubrication structure parameters, including crawling time and average friction coefficient. The optimal combination parameters of multistage composite lubrication structures have been determined. The optimal ratio of lubricating oil to molybdenum disulfide (MoS2) has been identified, and a composite lubrication structure has been proposed to enhance the crawling phenomenon and friction performance of sliding guide rails under medium-speed and medium-load conditions. These research outcomes indicate that when low speed and a heavy load are present, the crawling time and friction coefficient initially diminish and subsequently augment as the width, spacing, and cycle length of the sinusoidal texture and the diameter of the hexagonal pit expand. The optimum configuration of multistage composite lubrication structures is as follows: The width of the sine-wave texture b amounts to 0.15 mm, the cycle length e is 2 mm, the spacing c is 1.5 mm, and the diameter of the hexagonal pit d is 0.2 mm. When the mass ratio of guide oil to MoS2 is 2:1, it exhibits supreme crawling resistance and antifriction attributes. In circumstances involving a medium load and speed, multistage composite lubrication structures manifest pre-eminent friction performance. These data can steer the design of multistage composite lubrication structures on the surface of slide rails.
1. Introduction
Sliding guide rails represent critical mobile components in machine tools and play an indispensable role in ensuring precision and dynamic stability. These traits are foundational for high-precision machining [1,2]. Under the circumstances of low speed and heavy load, the guide rails of machine tools might encounter a phenomenon denominated “crawling”, which is a self-excited vibration induced by variations in frictional properties [3]. Crawling not only curtails the service life of machine tools but also deteriorates the surface quality of workpieces and expedites the wear of guide rails. As the demand for higher positioning accuracy in machine tools keeps escalating, research aimed at ameliorating the crawling phenomenon of guide rails becomes particularly crucial.
To minimize the occurrence of crawling in guide rails, researchers have suggested diverse approaches. These encompass the utilization of appropriate lubricants [4], the integration of effective additives [5], the implementation of wide and shallow scraping [6], or the employment of plastic guide rails [7]. Nevertheless, these methods frequently encounter challenges, such as unreliable processing, insufficient rigidity, and low wear resistance.
Laser Surface Texturing (LST) is widely recognized for its ability to retain lubricants [8], collect wear particles, and protect contact surfaces [9]. This renders it a valuable technique in mechanical engineering, and it is extensively employed on surfaces like engine cylinder/piston rings [10], sliding bearings [11,12], and mechanical seals [13]. Laser machining enables the precise formation of various texture features, encompassing shape, density, depth, and aspect ratio [14]. The study executed by Libin Lu et al. [15] probed into how diverse texture structures, such as micropits, microgrooves, and microgrids, affect the friction and wear properties of chromium alloy. They ascertained that a microgrid texture with a spacing of 200 nm and a width of 100 nm manifested superior wear resistance, reducing the wear rate by 57%. Another research undertaking by Li Dan et al. [16] utilized a femtosecond laser to fabricate chevron-shaped microgrooves at four dissimilar densities and scrutinized their effects on surface tribological properties. It was perceived that the sample with a texture density of 9.5% exhibited the lowest and most stable friction coefficient. Additionally, Li et al. [17] inspected the antifatigue wear performance of 40Cr alloy steel by adopting biomimetic principles and laser surface texturing techniques at various distances and angles. The optimum results were attained with a spacing of 40 mm and an angle of 2°, significantly prolonging the service life of the alloy.
While single textures can improve the frictional performance of workpiece surfaces, composite lubrication textures offer even more superior friction characteristics. Research conducted by Xie Xuan et al. [18] on the friction properties of GCr15 bearing steel, involving the use of microtextures combined with the solid lubricant MoS2 on the surface, revealed that optimal tribological properties were achieved at a texture density of 20% and a depth of 9 μm. Additionally, Meng et al. [19] confirmed that composite textures (consisting of both composite grooves and pits) could enhance the Life Cycle Cost (LCC) efficiency of bearings and reduce friction compared to single-texture systems.
Currently, both domestic and international research have primarily focused on individual microfabrication techniques or solid self-lubricating technologies to enhance the friction performance of sliding guide rail surfaces. Few studies have explored the utilization of composite lubrication microstructures. The preponderance of studies focusing on either the single condition of low speed and a heavy load of sliding guide rails or medium speed and medium load have neglected to consider the actual circumstances of the combination of low speed, medium speed, and medium load of sliding guide rails. Therefore, it is crucial to investigate the impact of parameters of multilevel composite lubrication structures on the crawling phenomenon under low-speed, heavy-load conditions, and to design optimal parameter outcomes and lubricant-composition ratios. In this paper, a composite lubrication microstructure is utilized, with the crawling time and average friction coefficient serving as evaluation indices. The impact of multistage composite lubrication structure parameters on these indices is investigated using the response surface optimization design method under low-speed and heavy-load conditions. The optimal combination parameters of the multistage composite lubrication structure are determined to enhance slide crawling under low-speed and heavy-load conditions. The optimal mixing ratio of lubricating oil and molybdenum disulfide (MoS2) is studied under the optimum parameters for low speed and heavy load. Ultimately, under the condition of medium speed and medium load, the impact of the multistage composite lubrication structure on the friction performance of the sliding guide rail is analyzed. Moreover, a composite lubrication structure that can ameliorate the sliding guide rail’s crawling phenomenon and friction performance is proposed.
2. Experiment
2.1. Experimental Equipment and Materials
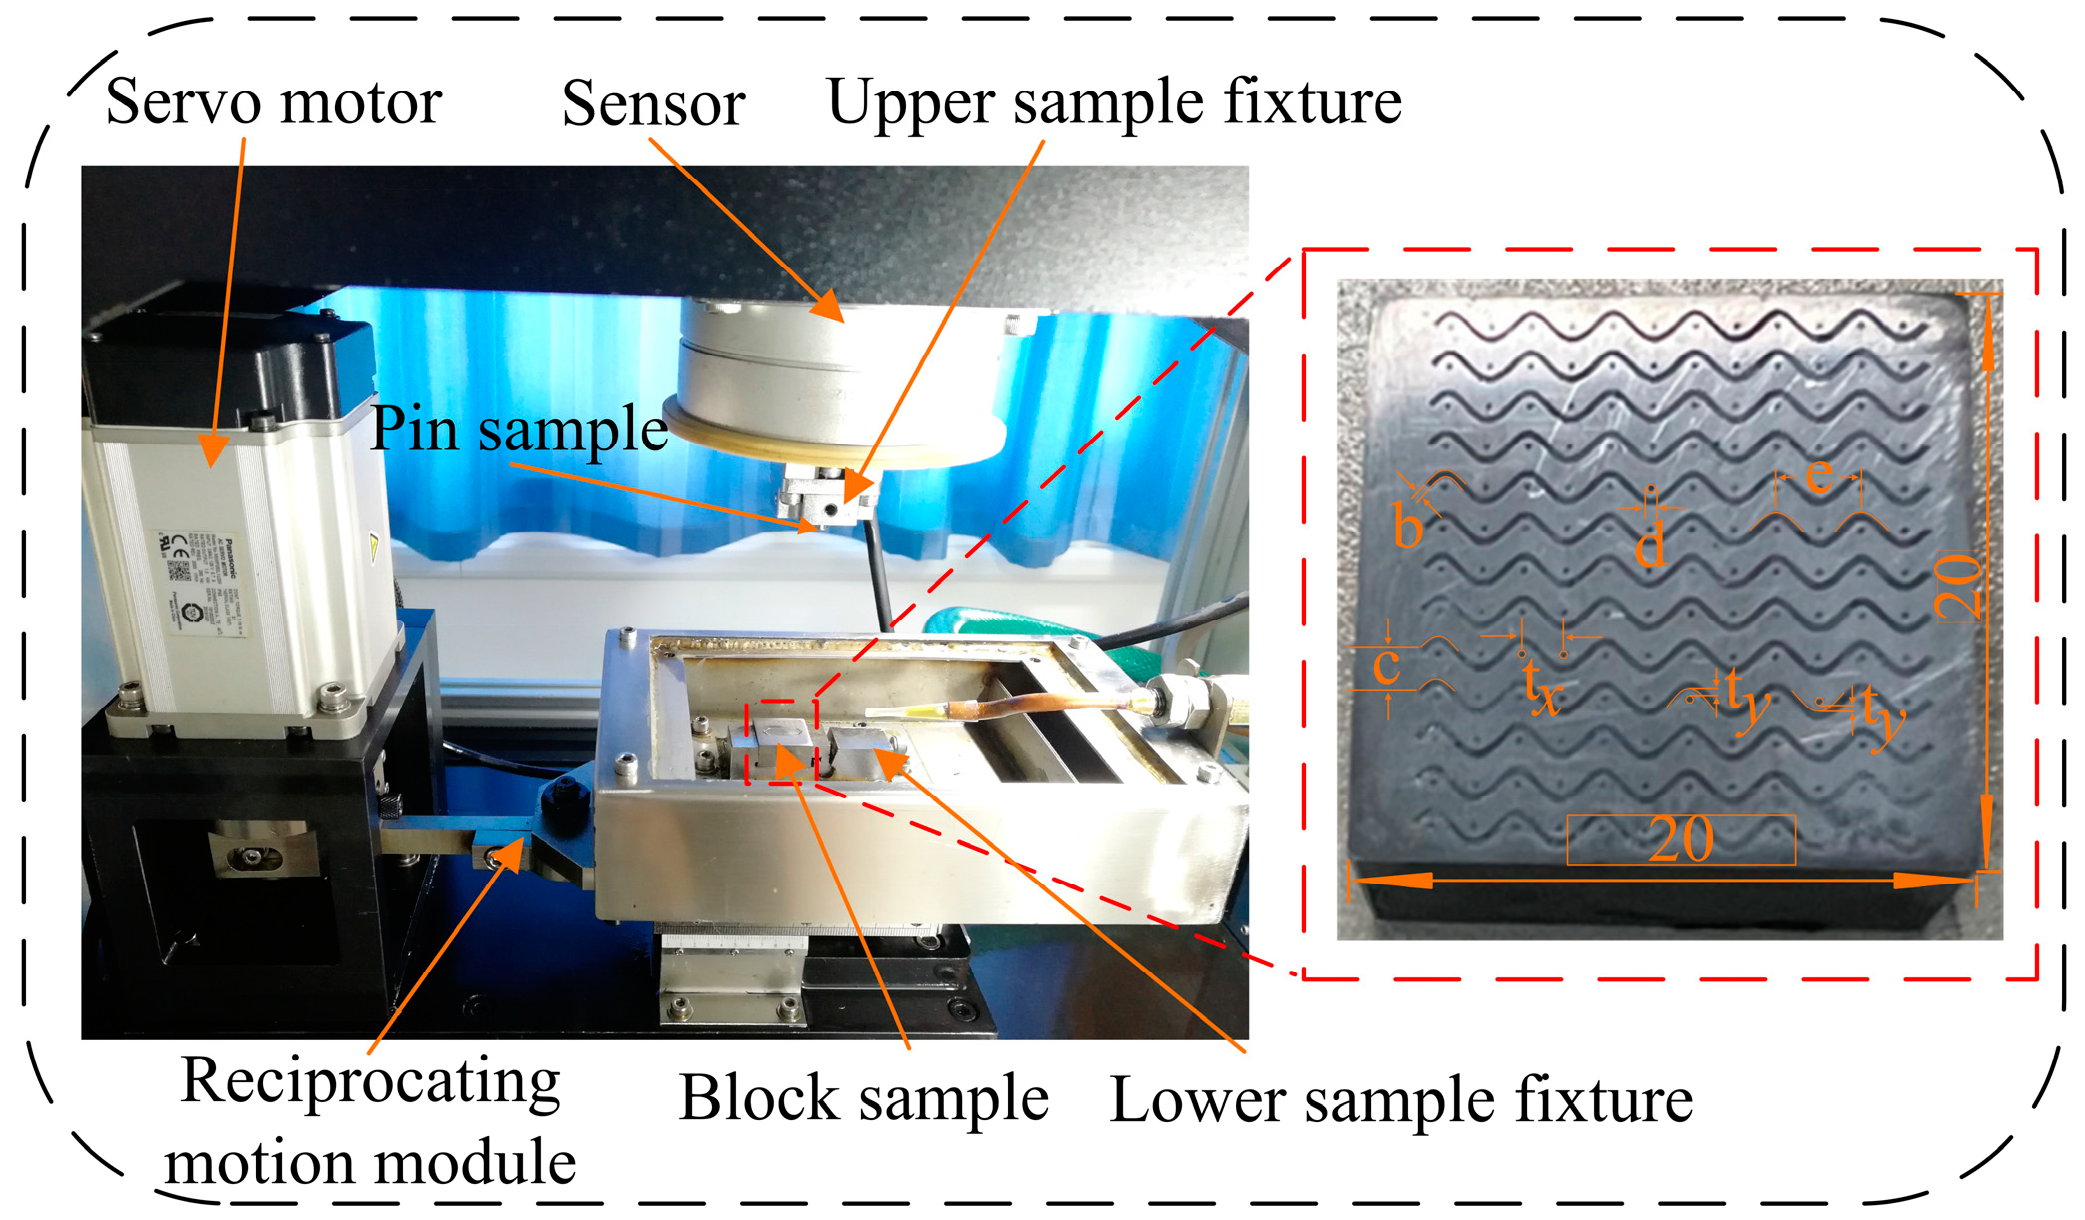
The experiment utilized an FTM M30 multimodule controllable lubrication friction tester (Nanjing Shenyuansheng Intelligent Technology Co., Ltd., Nanjing, China), as depicted in Figure 1, which adopted pin-on-block reciprocating friction. The friction test employed 45# steel (AISI 1045) cylindrical pins and 45# steel blocks as the test materials. The upper sample was a cylindrical pin made of 45# steel, having a diameter of 6 mm and a length of 15 mm. The lower sample was a 45# steel block sized 20 mm × 20 mm × 10 mm. The lubricant utilized was 32# Moroke high-quality guide rail oil, and the environmental temperature for the friction test was 20 °C.
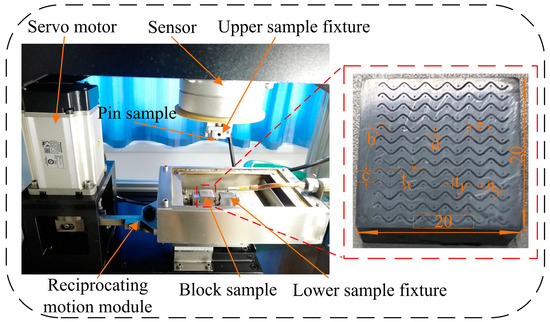
Figure 1.
FTM 30 multimodule controllable lubrication friction testing machine and friction sample [20].
To tackle the circumstances that give rise to crawling the phenomenon on sliding guide rails, reciprocating friction tests were devised for equivalent working conditions under low-speed, heavy-load and medium-speed, medium-load scenarios, as depicted in Table 1.

Table 1.
Low-speed and heavy-load friction test condition.
2.2. Preparation of Surface Microstructures
An FB50-1 nanosecond laser (Changchun New Industry Optoelectronic Technology Co., Ltd., Changchun Institute of Optics, Fine Mechanics and Physics, Chinese Academy of Sciences, Changchun, China) was utilized to create sinusoidal groove textures on the surface of the lower sample. The laser process parameters were as follows: power 10 W, frequency 60 kHz, and ablation performed 10 times. Following ablation, the slag around the surface texture was removed using 2000-grit sandpaper, and the sample was cleaned with anhydrous ethanol in an ultrasonic cleaner for 15 min.
Molybdenum disulfide (MoS2) was uniformly mixed with lubricating oil at a ratio of 3:7 to form a paste, which was then evenly applied to the surface of the microstructure. Subsequently, the sample was placed in an XQ-2B embedding machine. After pressurization, it was maintained at 100 °C for 10 min. Upon cooling down at rest, any hard lumps on the surface were removed to complete the filling [20]. Figure 2 depicts a schematic diagram of the preparation of the multilevel composite lubrication structure.
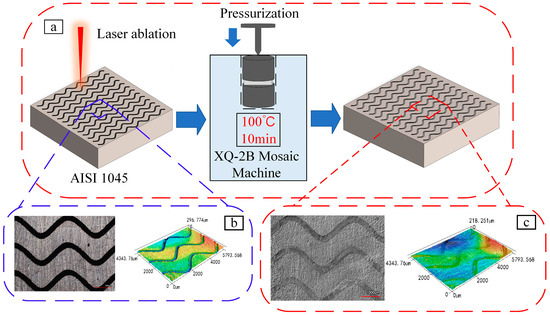
Figure 2.
Schematic diagram of specimen preparation: (a) Laser ablation diagram. (b) Micro-texture before filling. (c) Micro-texture after filling [20].
2.3. Experimental Design for Multilevel Composite Lubrication Structure Parameters
To determine the appropriate dimensional data for the multilevel composite lubrication structure and to identify the primary and secondary factors influencing the experimental results, a response surface analysis was conducted to minimize the crawling time and average friction coefficient. The response factors and indicators were inputted into the Box–Behnken design in Design Expert, and the experimental plan and response results are presented in Table 2. The Box–Behnken design is a good design for response surface methodology because it permits (i) the estimation of the parameters of the quadratic model; (ii) the building of sequential designs; (iii) the detection of lack of fit of the model; and (iv) the use of blocks. A comparison between the Box–Behnken design and other response surface designs (the central composite design and the three-level full factorial design) has demonstrated that the Box–Behnken design is slightly more efficient than the central composite design but much more efficient than the three-level full factorial design.
Table 2.
Response results of crawling time and average friction coefficient.
3. Results and Discussion
3.1. The Impact of Multilevel Composite Lubrication Structure Parameters on Friction Performance
The Impact of Single-Factor Variables on Crawling Time and Friction Coefficient
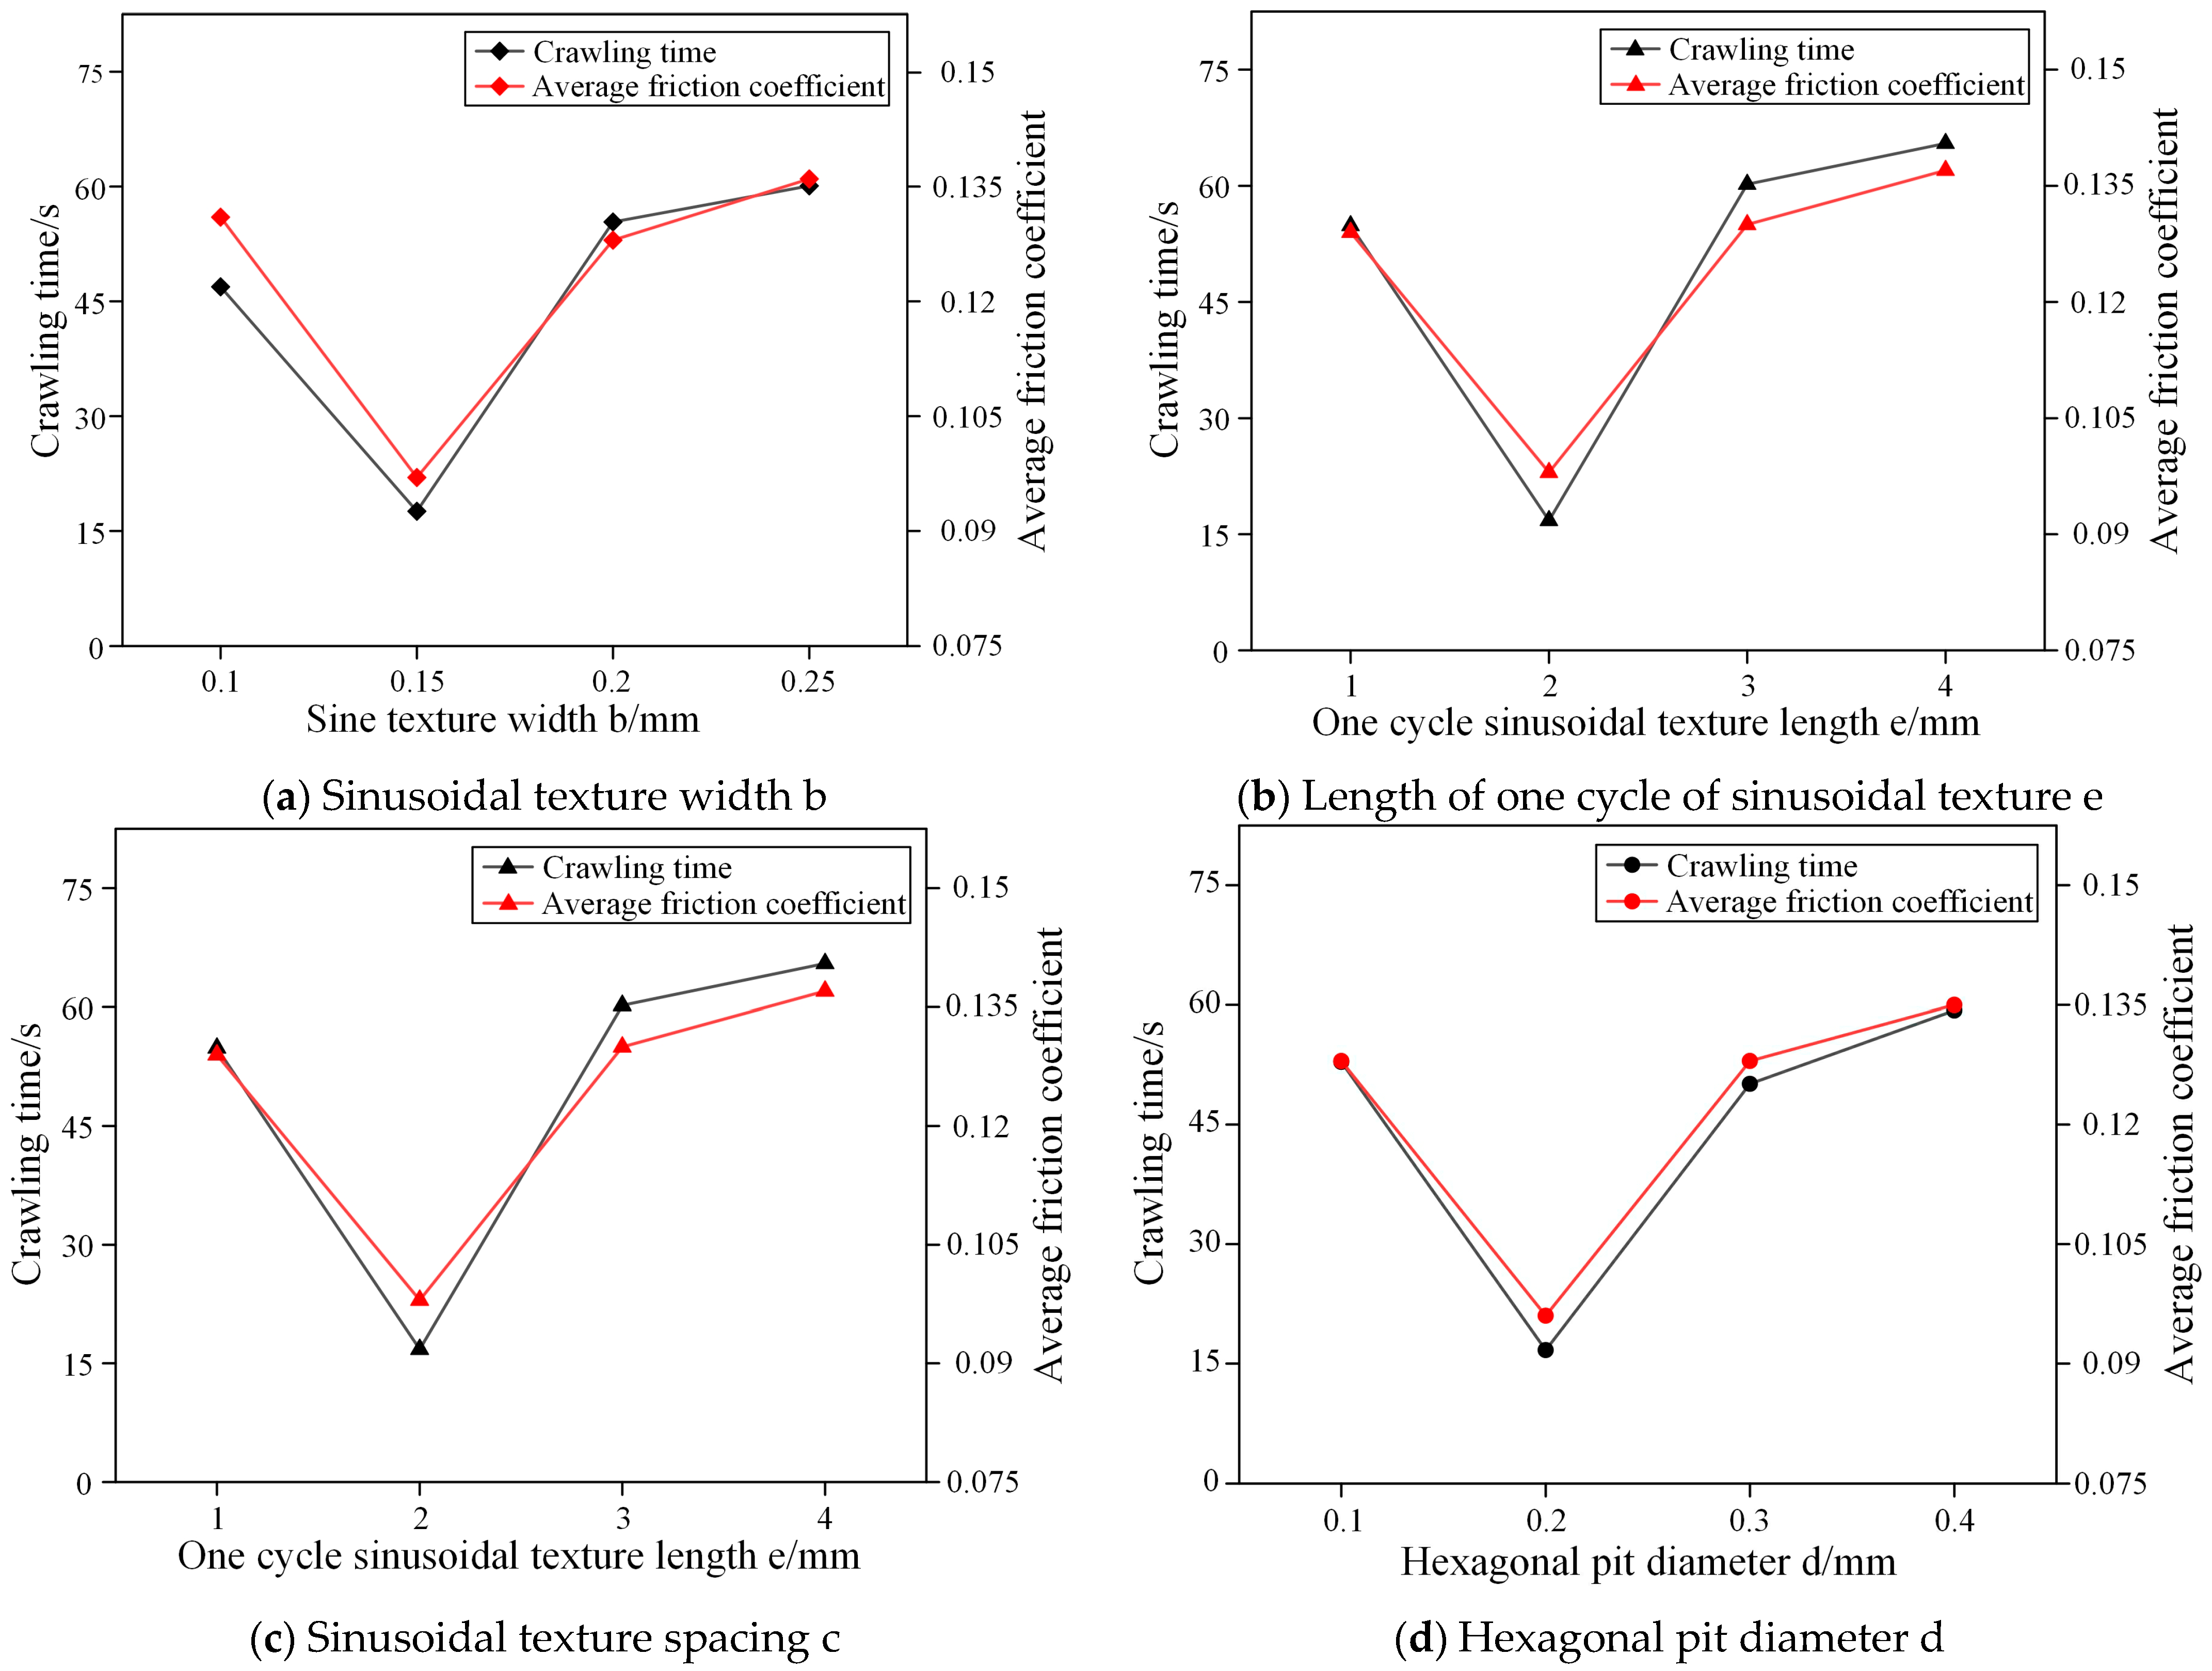
Figure 3 illustrates the impact of various microstructure parameters on crawling time. The crawling time and friction coefficient show a trend of initially decreasing and then increasing with the increase in width, spacing, and cycle length of the sinusoidal texture, as well as the diameter of hexagonal pits. From Figure 3a, it can be observed that the shortest crawling time is approximately 17.43 s and the lowest friction coefficient is 0.097 when the width of the sinusoidal texture is 0.15 mm. In Figure 3b, it is shown that the shortest crawling time is 16.69 s and the lowest friction coefficient is 0.098 when one cycle of the sinusoidal texture measures 2 mm in length. Figure 3c shows that the lowest friction coefficient of 0.099 and a crawling time of approximately 16.79 s are achieved when the sinusoidal texture spacing is 1.5 mm. In Figure 3d, it is demonstrated that with a diameter of the hexagonal pits of 0.2 mm, the lowest friction coefficient is reduced to 0.096 and the crawling time increases to around 17.58 s. According to the analysis, when the sinusoidal texture width, hexagonal pit diameter, spacing, and cycle length are small, the texture area ratio of the sliding guide surface decreases. This reduction leads to a diminished amount of solid lubrication stored within the surface texture, resulting in ineffective lubrication at the friction interface. Consequently, it becomes challenging to retain large abrasive debris, and high contact stress on the friction interface can disrupt the continuity of the molybdenum disulfide transfer film. Such conditions may easily result in lubrication failure, thereby increasing both the friction coefficient and the crawling time. Conversely, when both the sinusoidal texture width and hexagonal pit diameter are larger while spacing and cycle length remain smaller, there is an increase in surface texture area ratio. Although this configuration results in higher contact stress that facilitates more cavities forming as MoS2 is compressed and migrates to participate in lubrication at the friction interface, it simultaneously elevates mutual motion resistance at this interface. The increased contact stress may also exacerbate shear fracture of microconvex bodies present on surfaces, which further contributes to an increase in both the friction coefficient and crawling time.
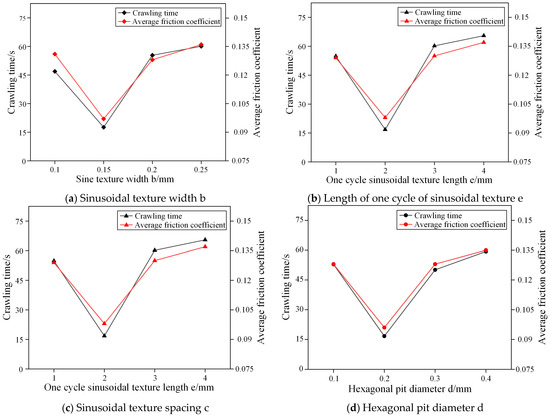
Figure 3.
Effect of single factor variable on crawling time.
3.2. The Impact of Interactive Process Variables on Friction Performance
- (1)
- The Impact of Interactive Process Variables on Crawling Time
A quadratic response surface regression analysis was performed on the crawling time results presented in Table 2. This analysis yielded a quadratic polynomial regression equation that describes the impact of multilevel composite lubrication structure parameters on the crawling time of sliding guide rail surfaces, as depicted in Equation (1). The parameter ranges in the equation are as follows: 0.1 mm ≤ b ≤ 0.2 mm, 1 mm ≤ e ≤ 3 mm, 1 mm ≤ c ≤ 2 mm, and 0.1 mm ≤ d ≤ 0.3 mm.
Crawling time = 583.93842 − 3195.00667 × b − 69.6455 × e − 257.47067 × c − 674.13833 × d−37.9 × be + 26.9 × bc +
144 × bd − 4.11 × ec − 26.725 × ed + 49.55 × cd + 10,670.8 × b2 + 21.887 × e2 + 84.983 × c2 + 1581.075 × d2,
144 × bd − 4.11 × ec − 26.725 × ed + 49.55 × cd + 10,670.8 × b2 + 21.887 × e2 + 84.983 × c2 + 1581.075 × d2,
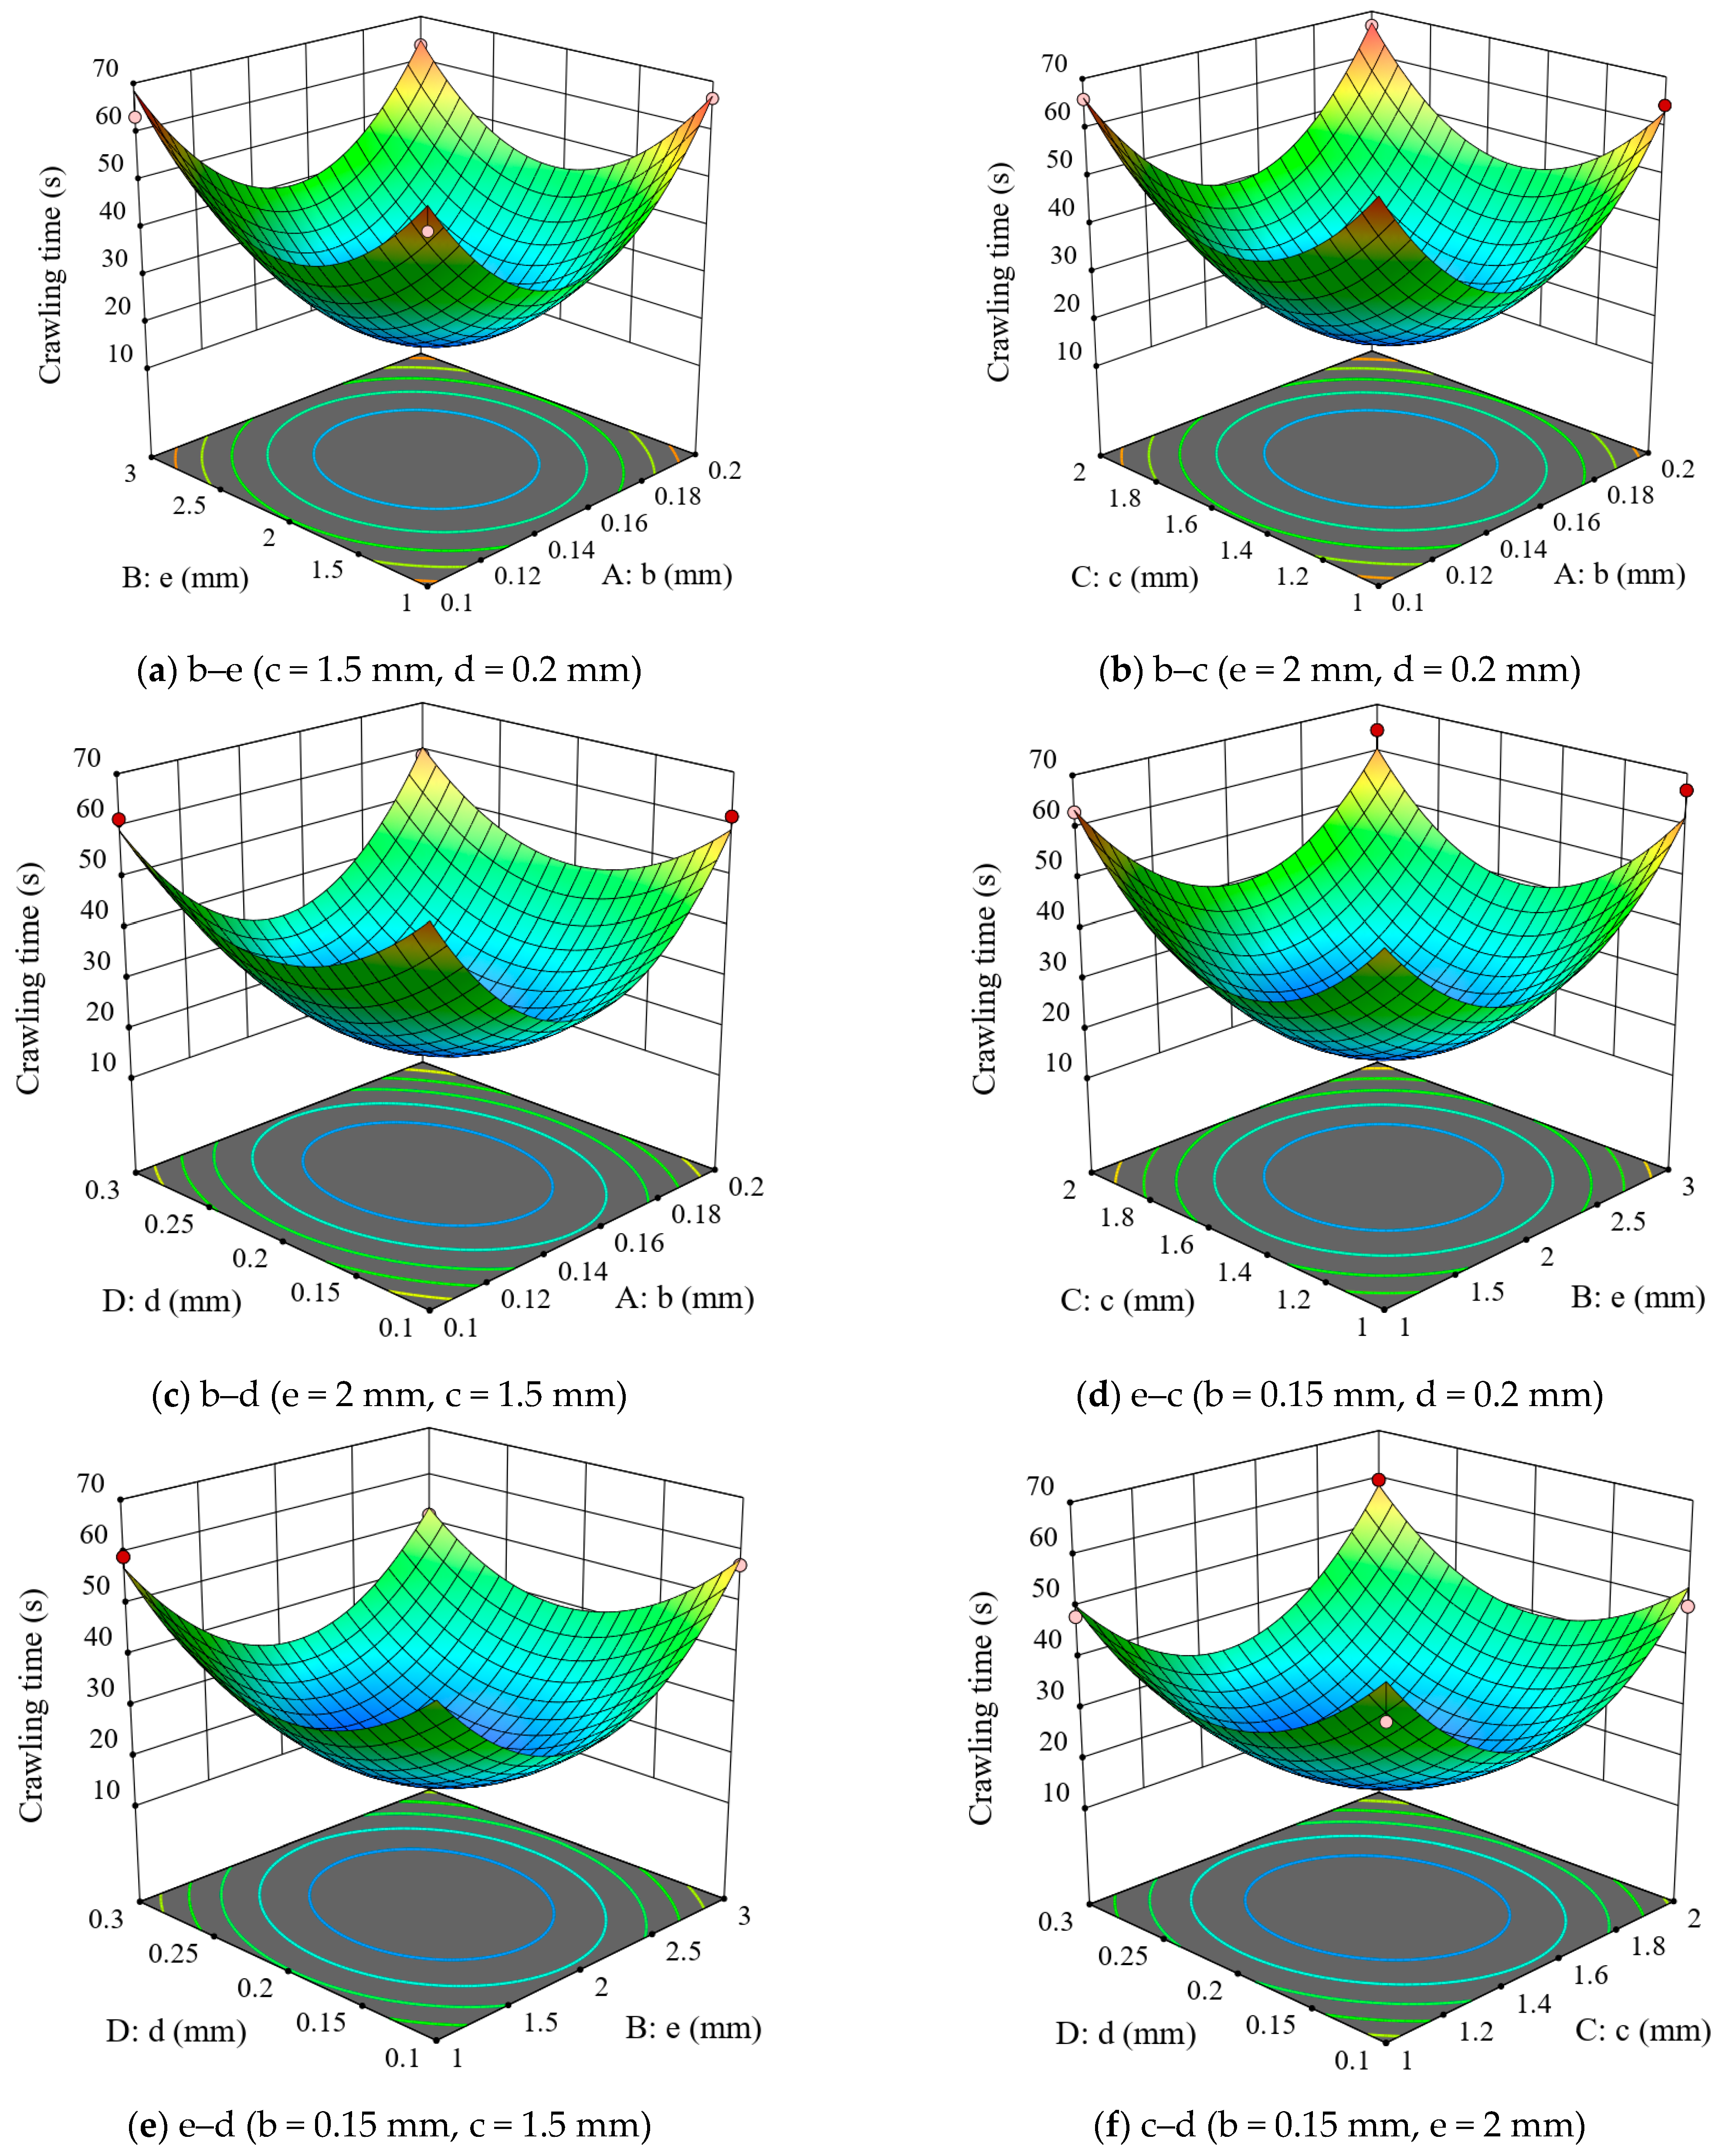
Figure 4 depicts a three-dimensional response surface showing the interaction effects on crawling time. When c = 1.5 mm and d = 0.2 mm (as shown in Figure 4a), the crawling time first decreases and then increases as the width b and length e of one cycle of the sinusoidal texture increase. When e = 2 mm and d = 0.2 mm (as depicted in Figure 4b), the crawling time initially decreases and then increases as both the width b of the sinusoidal texture and spacing c increase. Similarly, when e = 2 mm and c = 1.5 mm (as indicated in Figure 4c), a similar trend can be observed. Crawling time initially decreases and then increases with increases in the width b of the sinusoidal texture and the diameter d of the hexagonal pits.
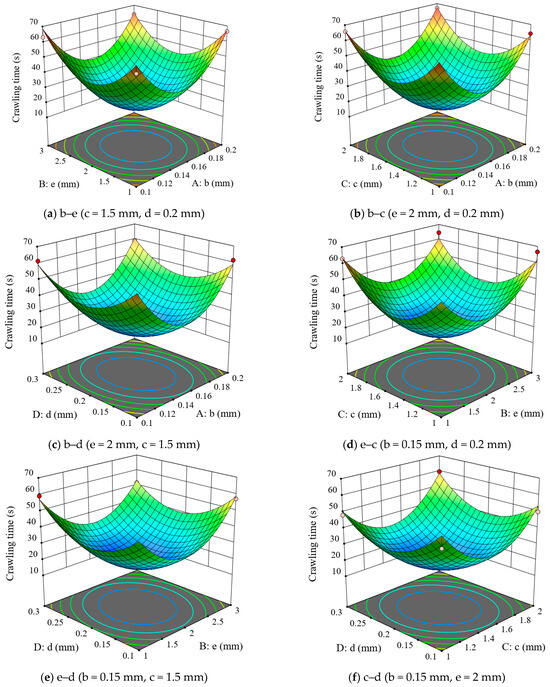
Figure 4.
Interaction process parameters respond to surface crawling time.
When b = 0.15 mm and d = 0.2 mm (as shown in Figure 4d), the crawling time initially decreases and then increases as the length of one cycle of the sinusoidal texture e and the sinusoidal texture spacing c increase. Similarly, when b = 0.15 mm and c = 1.5 mm (as depicted in Figure 4e), the trend is similar for increases in the length of one cycle of the sinusoidal texture e and the diameter of the hexagonal pits d.
When b = 0.15 mm and e = 2 mm (as shown in Figure 4f), the crawling time decreases and then increases as the sinusoidal texture spacing c and the diameter of the hexagonal pits d increase. By comparing the steepness of the interaction effect plots for b–e, b–c, b–d, e–c, e–d, and c–d, it can be observed that the primary factor affecting crawling time is c, followed by e, then d, and finally b.
- (2)
- The Impact of Interactive Process Variables on Average Friction Coefficient
A quadratic response surface regression analysis was performed on the average friction coefficient results from Table 2. The analysis produced a quadratic polynomial regression equation that describes the influence of sinusoidal fill lubrication structure parameters on the friction coefficient of cylinder liner surfaces, as depicted in Equation (2). The parameter ranges in the equation are 0.1 mm ≤ b ≤ 0.2 mm, 1 mm ≤ e ≤ 3 mm, 1 mm ≤ c ≤ 2 mm, and 0.1 mm ≤ d ≤ 0.3 mm.
Average COF = 0.58005 − 2.62067 × b − 0.0478 × e − 0.244733 × c − 0.493 × d − 0.07 × be + 0.06 × bc +
0.1 × bd + 0.002 × ec − 0.06 × ed + 0.02 × cd + 8.78 × b2 + 0.01645 × e2 + 0.0748 × c2 + 1.42 × d2,
0.1 × bd + 0.002 × ec − 0.06 × ed + 0.02 × cd + 8.78 × b2 + 0.01645 × e2 + 0.0748 × c2 + 1.42 × d2,
Figure 5 depicts the three-dimensional response surfaces regarding the interaction effects on the average friction coefficient. In Figure 5a, with c = 1.5 mm and d = 0.2 mm, the average friction coefficient manifests a tendency of initially diminishing and subsequently escalating as the sinusoidal texture width b and the length of one cycle of the sinusoidal texture e increase. In Figure 5b, when e = 2 mm and d = 0.2 mm, the average friction coefficient analogously reveals a decrease followed by an increase with the augmentation in b and the sinusoidal texture spacing c. In Figure 5c, with e = 2 mm and c = 1.5 mm, the trend persists as b and the diameter of the hexagonal pits d increase.
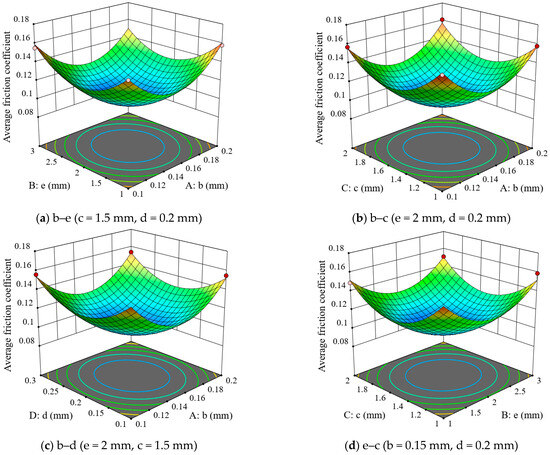
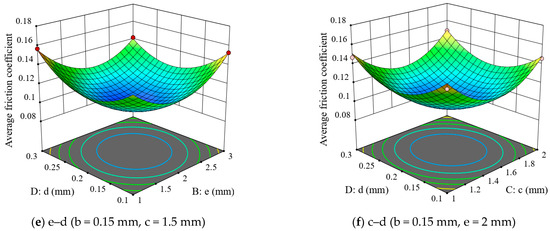
Figure 5.
Interaction process parameters respond to the surface of the average coefficient of friction.
For Figure 5d, with b = 0.15 mm and d = 0.2 mm, the average friction coefficient decreases initially and then increases as the length of one cycle of the sinusoidal texture e and the sinusoidal texture spacing c increase. Figure 5e indicates that when b = 0.15 mm and c = 1.5 mm, there is a decrease followed by an increase in the average friction coefficient as e and d increase. Finally, in Figure 5f, when b = 0.15 mm and e = 2 mm, the average friction coefficient follows the same trend with the increase in c and d. By comparing the steepness of the interaction effect graphs for b–e, b–c, b–d, e–c, e–d, and c–d, it can be ascertained that the primary factor influencing the average friction coefficient is c, followed by e, then b, and lastly d.
3.3. Response Surface Optimization Results
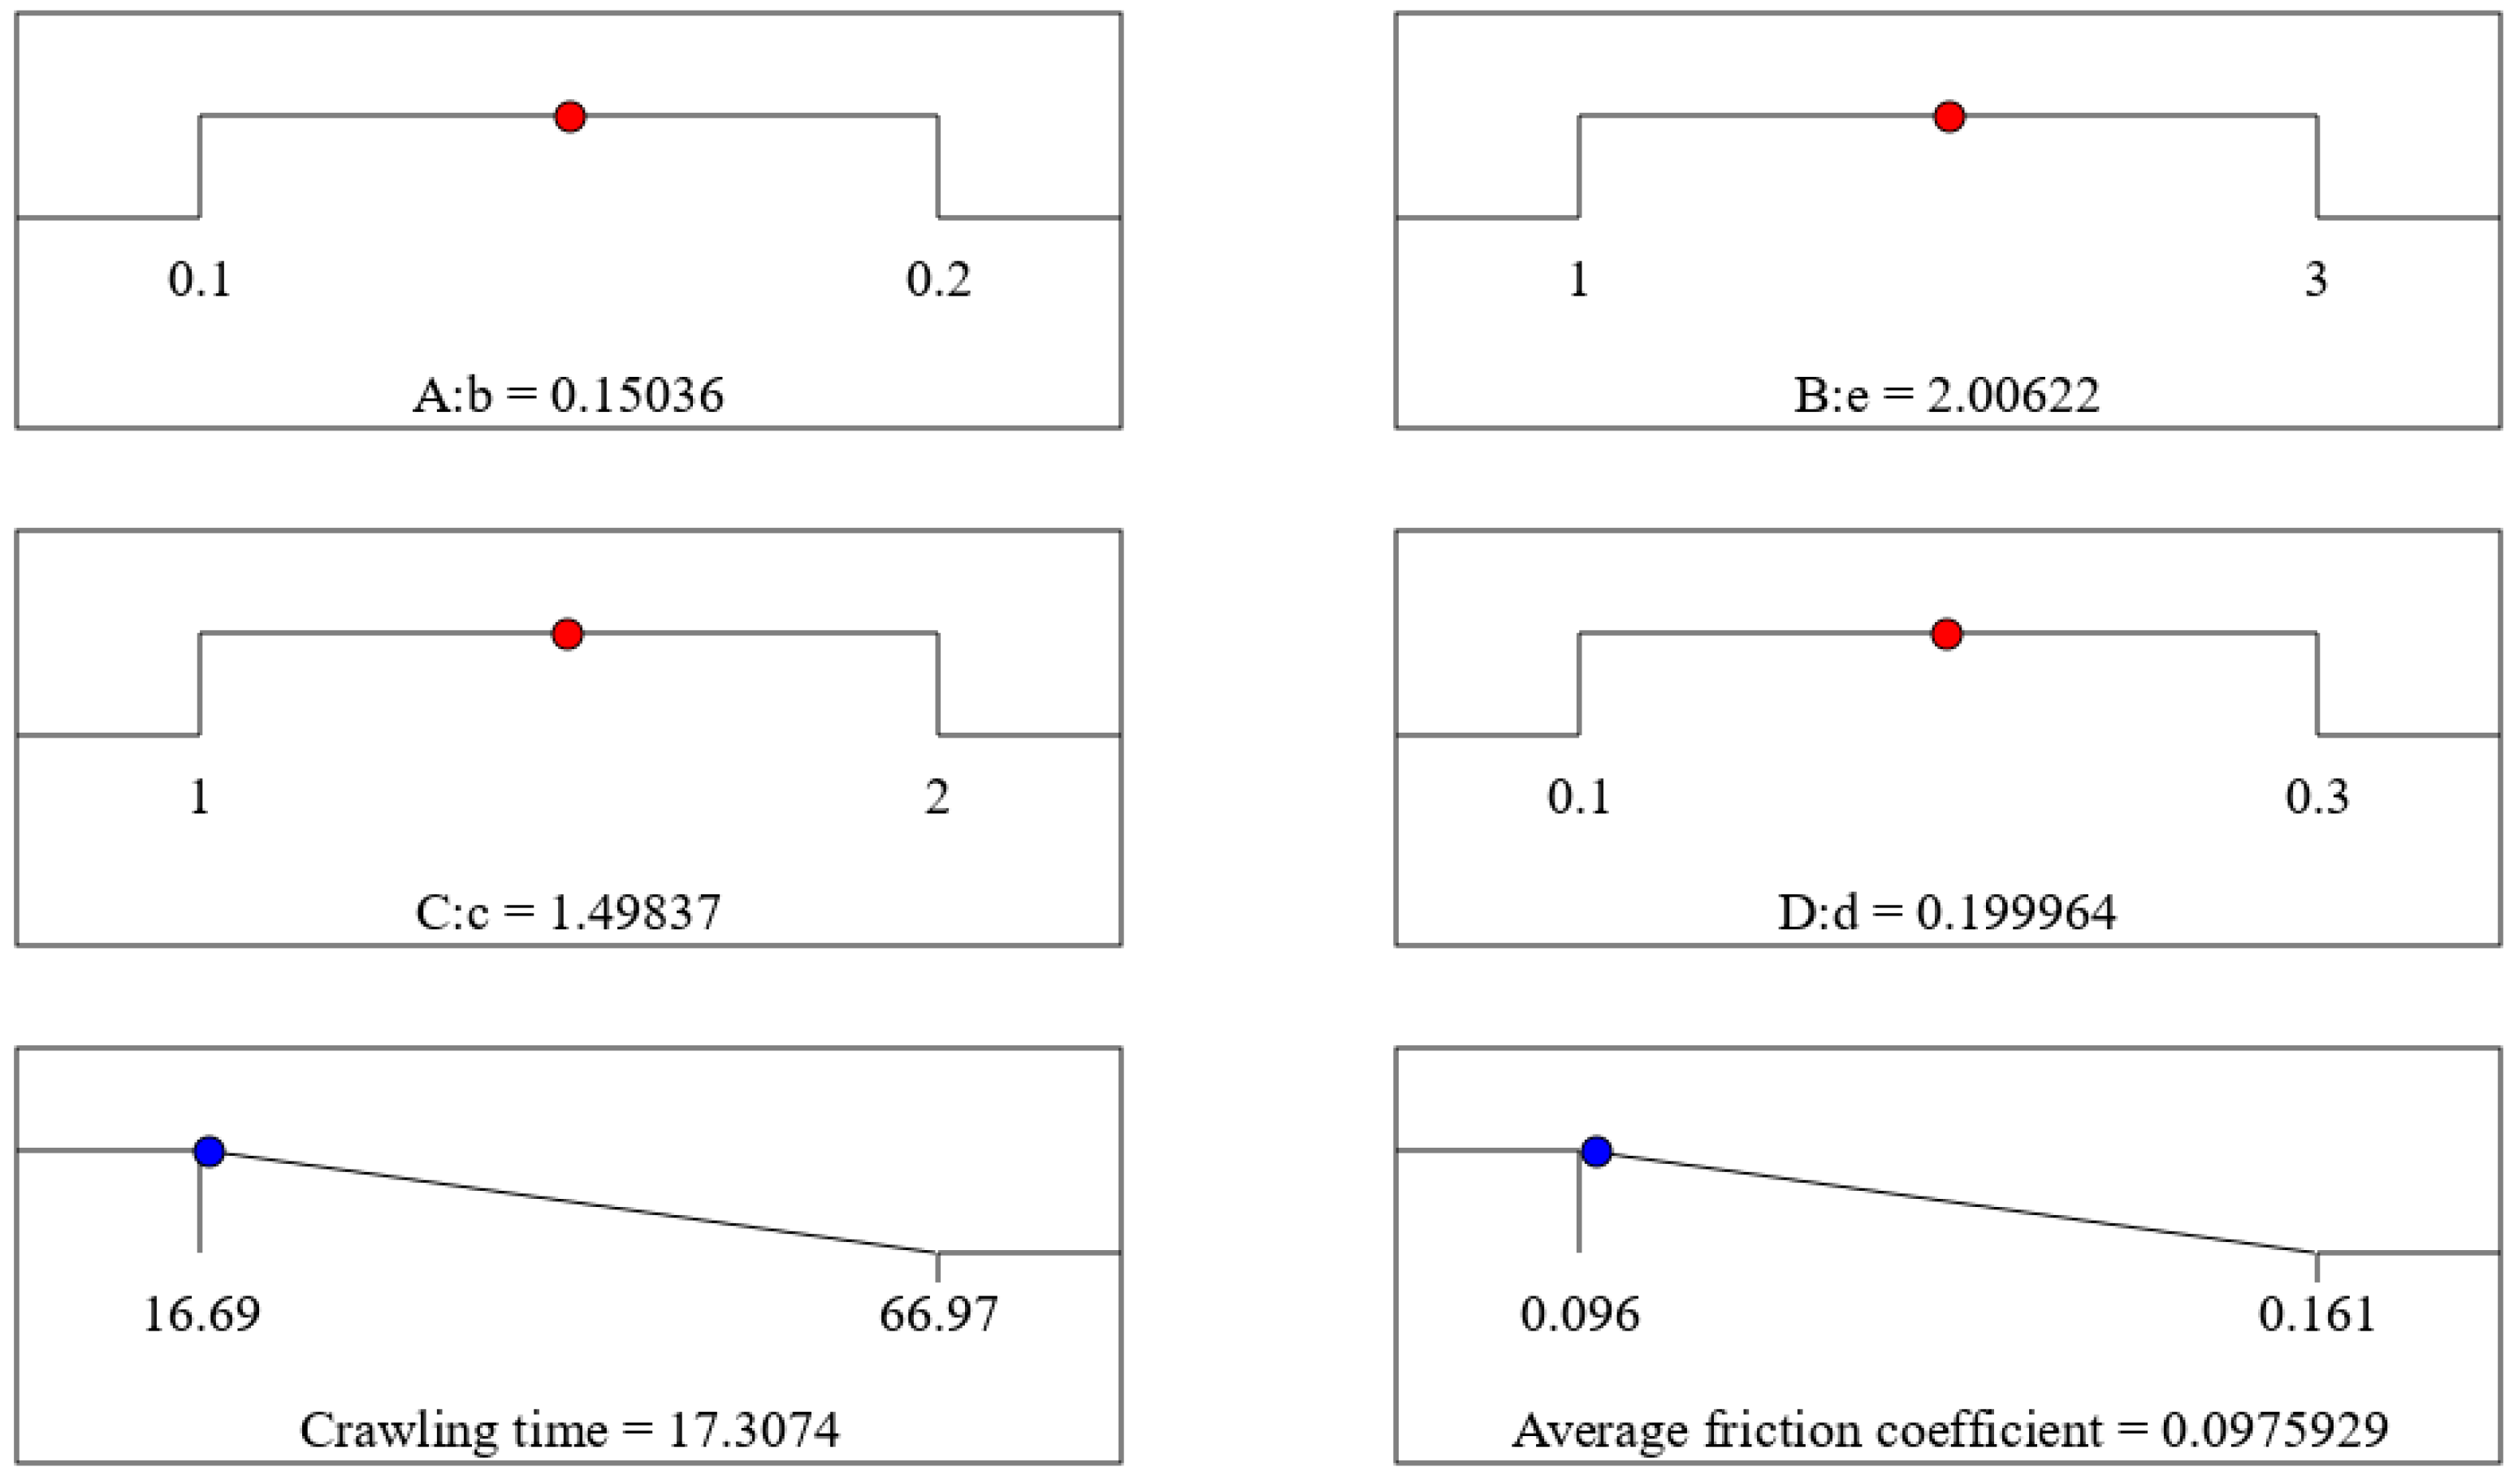
As depicted in Figure 6, based on the numerical analysis and solution within the optimization module, when the sinusoidal texture width b is 0.15036 mm, the length of one cycle of the sinusoidal texture e is 2.00622 mm, the sinusoidal texture spacing c is 1.49837 mm, and the diameter of the hexagonal pits d is 0.199964 mm, the sliding guide rail surface under low-speed, heavy-load conditions attains the minimum values for crawling time and average friction coefficient, which are 17.3074 s and 0.0975929 respectively, with predictability of 98.2%. The optimal combination of parameters for the multilevel composite lubrication structure is presented as follows: b = 0.15036 mm, e = 2.00622 mm, c = 1.49837 mm, and d = 0.199964 mm. This combination significantly reduces the crawling time and the average friction coefficient on the sliding guide rail surface under low-speed and heavy-load conditions. Consequently, it enhances the tribological performance of the sliding guide rail in these circumstances by minimizing the crawling phenomenon and improving its overall performance.
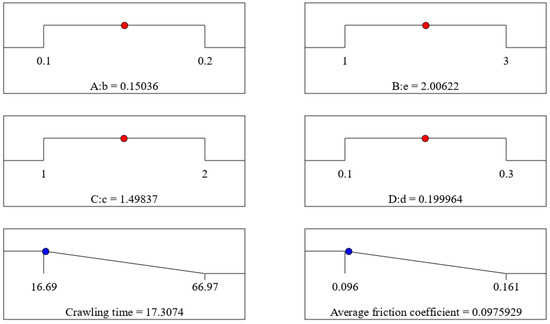
Figure 6.
Numerical forecast result.
To facilitate the manipulation and calculation of parameters, the optimal combination of parameters for the multilevel composite lubrication structure is presented as follows: b = 0.15 mm, e = 2 mm, c = 1.5 mm, and d = 0.2 mm. By substituting these parameters into Equations (1) and (2), the predicted values for crawling time and average friction coefficient are 17.3406 s and 0.0976, respectively.
3.4. Optimization of Solid Lubricant Filling Ratio
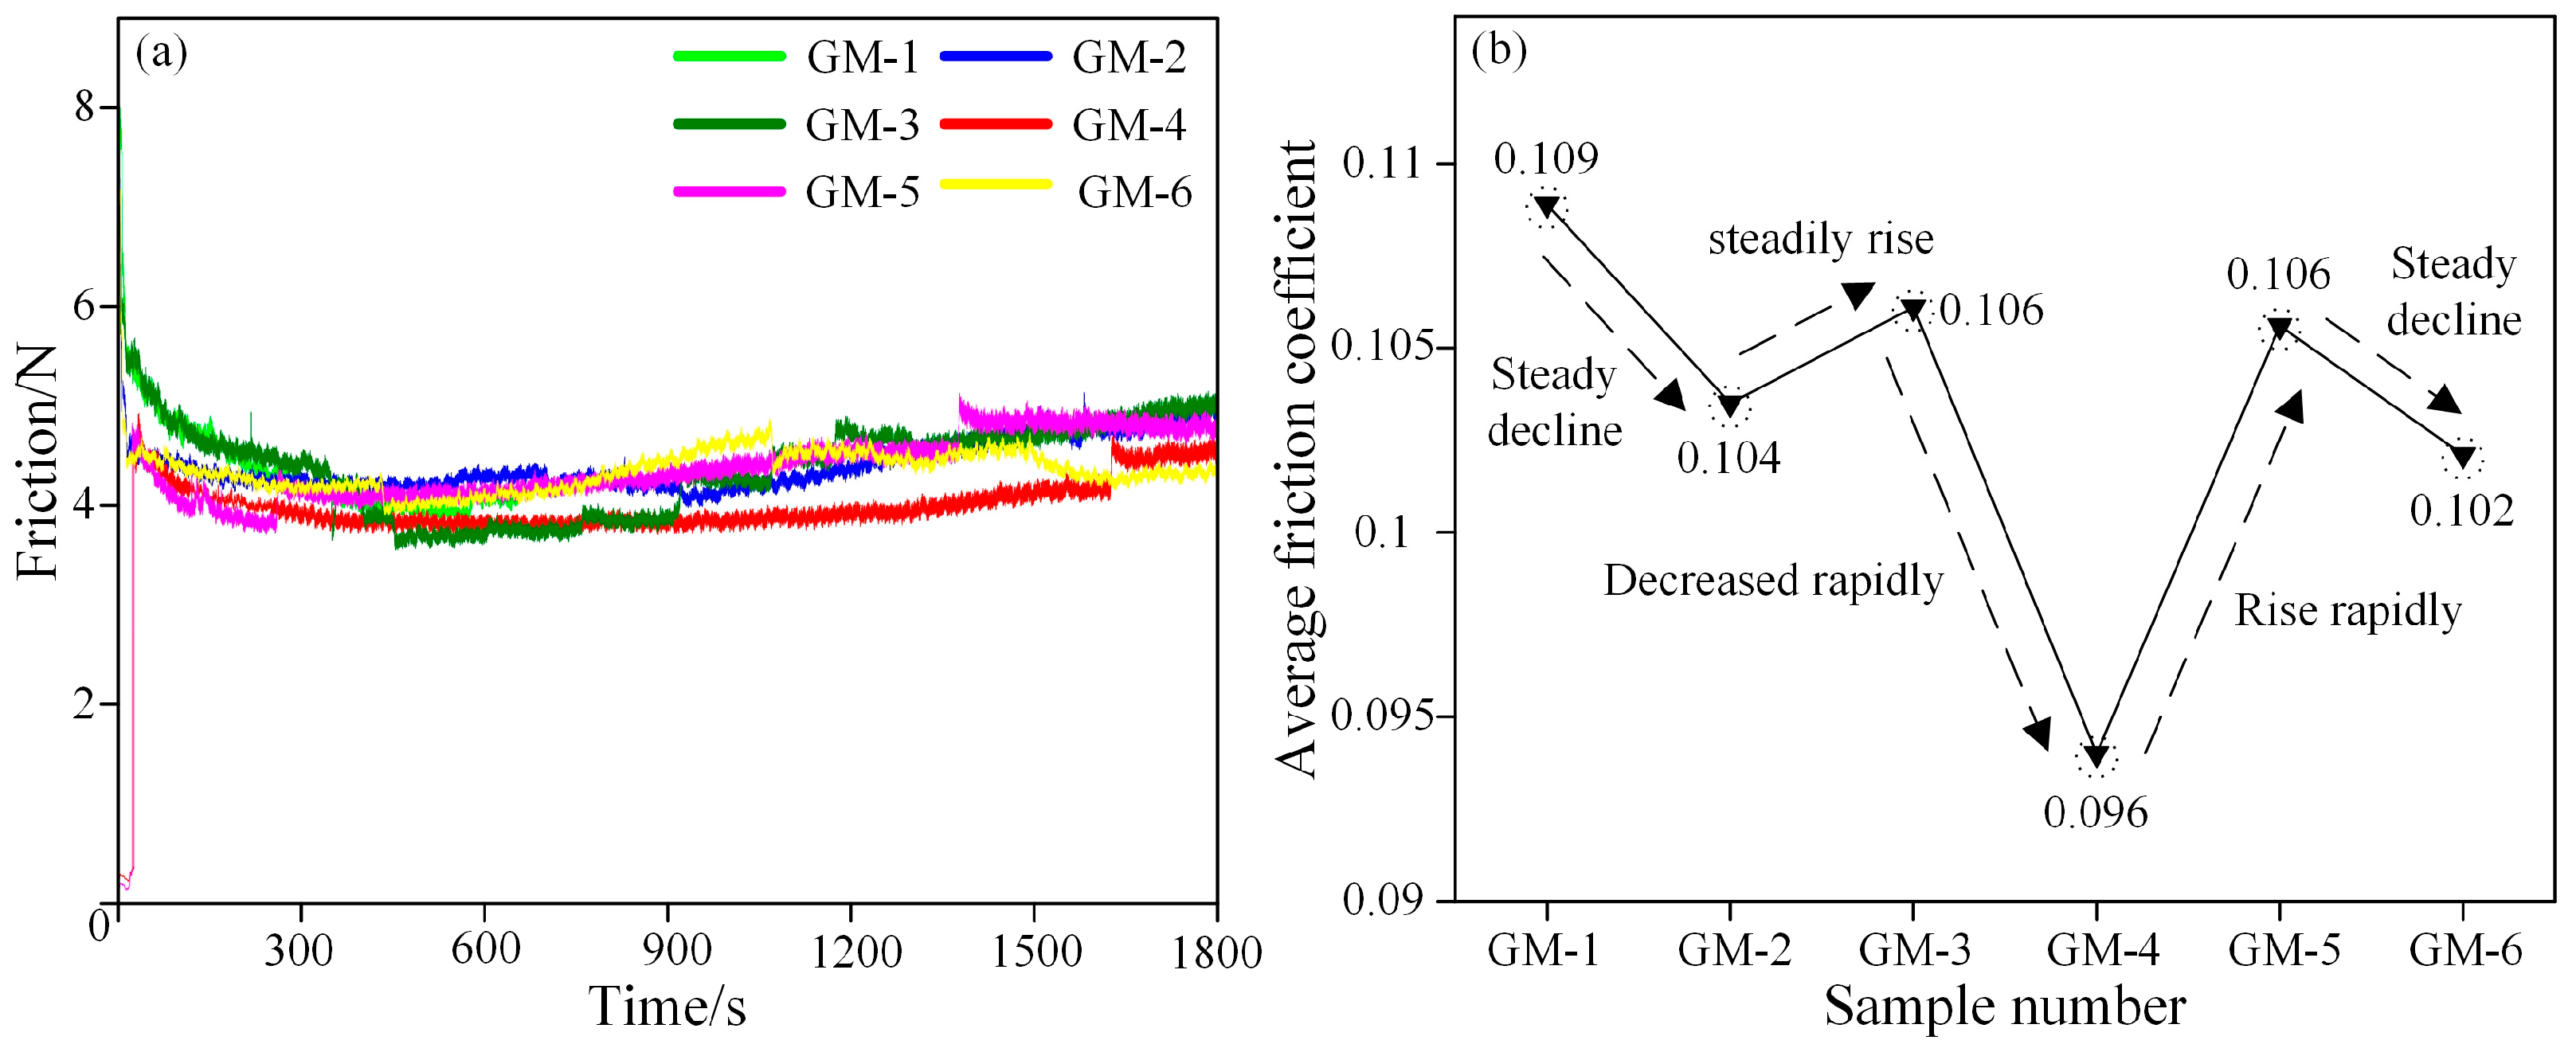
In light of the diverse mass ratios of mixtures consisting of guide rail oil and molybdenum disulfide (MoS2), the samples were coated and subsequently underwent high-temperature embedding. The mass ratios and the microhardness of the embedments are depicted in Table 3. In Figure 7, the graphs depict the curves of the friction force and the average friction coefficient under low-speed, heavy-load conditions for diverse mass ratios of guide rail oil to MoS2. The graphs suggest that all the friction force curves diminish rapidly and subsequently stabilize. Moreover, the average friction coefficient varies with the ratio of guide rail oil to MoS2, attaining its nadir at a ratio of 2:1, which amounts to 0.096. This is attributed to the fact that, under low-speed, heavy-load conditions where the speed is low and the load is high, a greater amount of binding agent is requisite within the microstructures to prevent the swift loss of MoS2 during friction. This guarantees that the solid lubricant stored in the microstructures can gradually shift to the friction interface under high loads, achieving prolonged lubrication. Consequently, a ratio of 2:1 for guide rail oil to MoS2 exhibits exceptional anticrawling and friction-reducing performance under low-speed, heavy-load conditions.
Table 3.
Guideway oil /MoS2 formulations with different mass ratios.
Figure 7.
Friction curve of guideway oil/MoS2 with different mass ratio (a), average friction coefficient curve (b).
3.5. Friction Performance of Sliding Guide Rails under Medium-Speed and Medium-Load Conditions
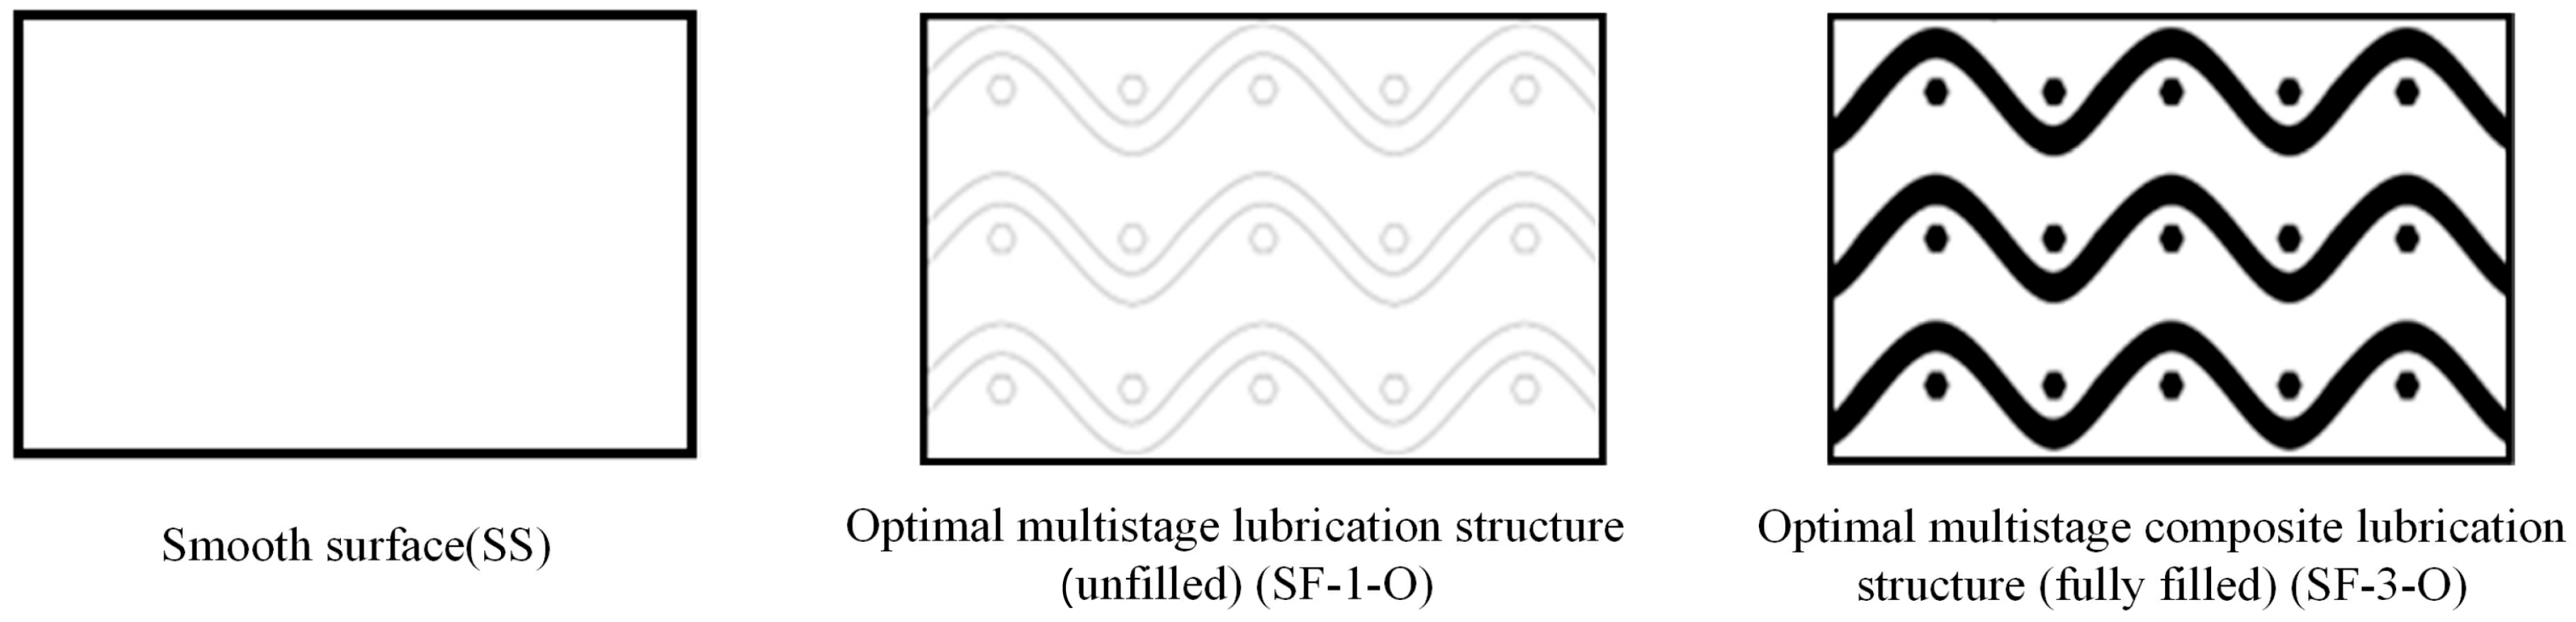
Figure 8 presents schematic illustrations of diverse lubrication structures on the guide rail surface. The optimum parameters for the sinusoidal fill lubrication structure on the guide rail surface are as follows: the width of the sinusoidal texture, b = 0.15 mm; the length of one cycle of the sinusoidal texture, e = 2 mm; the spacing between adjacent sinusoidal textures, c = 1.5 mm; the depth of the sinusoidal texture, H = 100 μm. Hexagonal micropits are generated around it to constitute a multilevel lubrication structure. Molybdenum disulfide is treated with no fill and complete fill in the hexagonal micropits, and the optimal parameters are the pit diameter, d = 0.2 mm; the lateral spacing of the pits, tx = 1 mm; the longitudinal spacing of the sinusoidal textures, ty = 0.33 mm; the pit depth, h = 100 μm.

Figure 8.
Diagram of different lubrication textures [20].
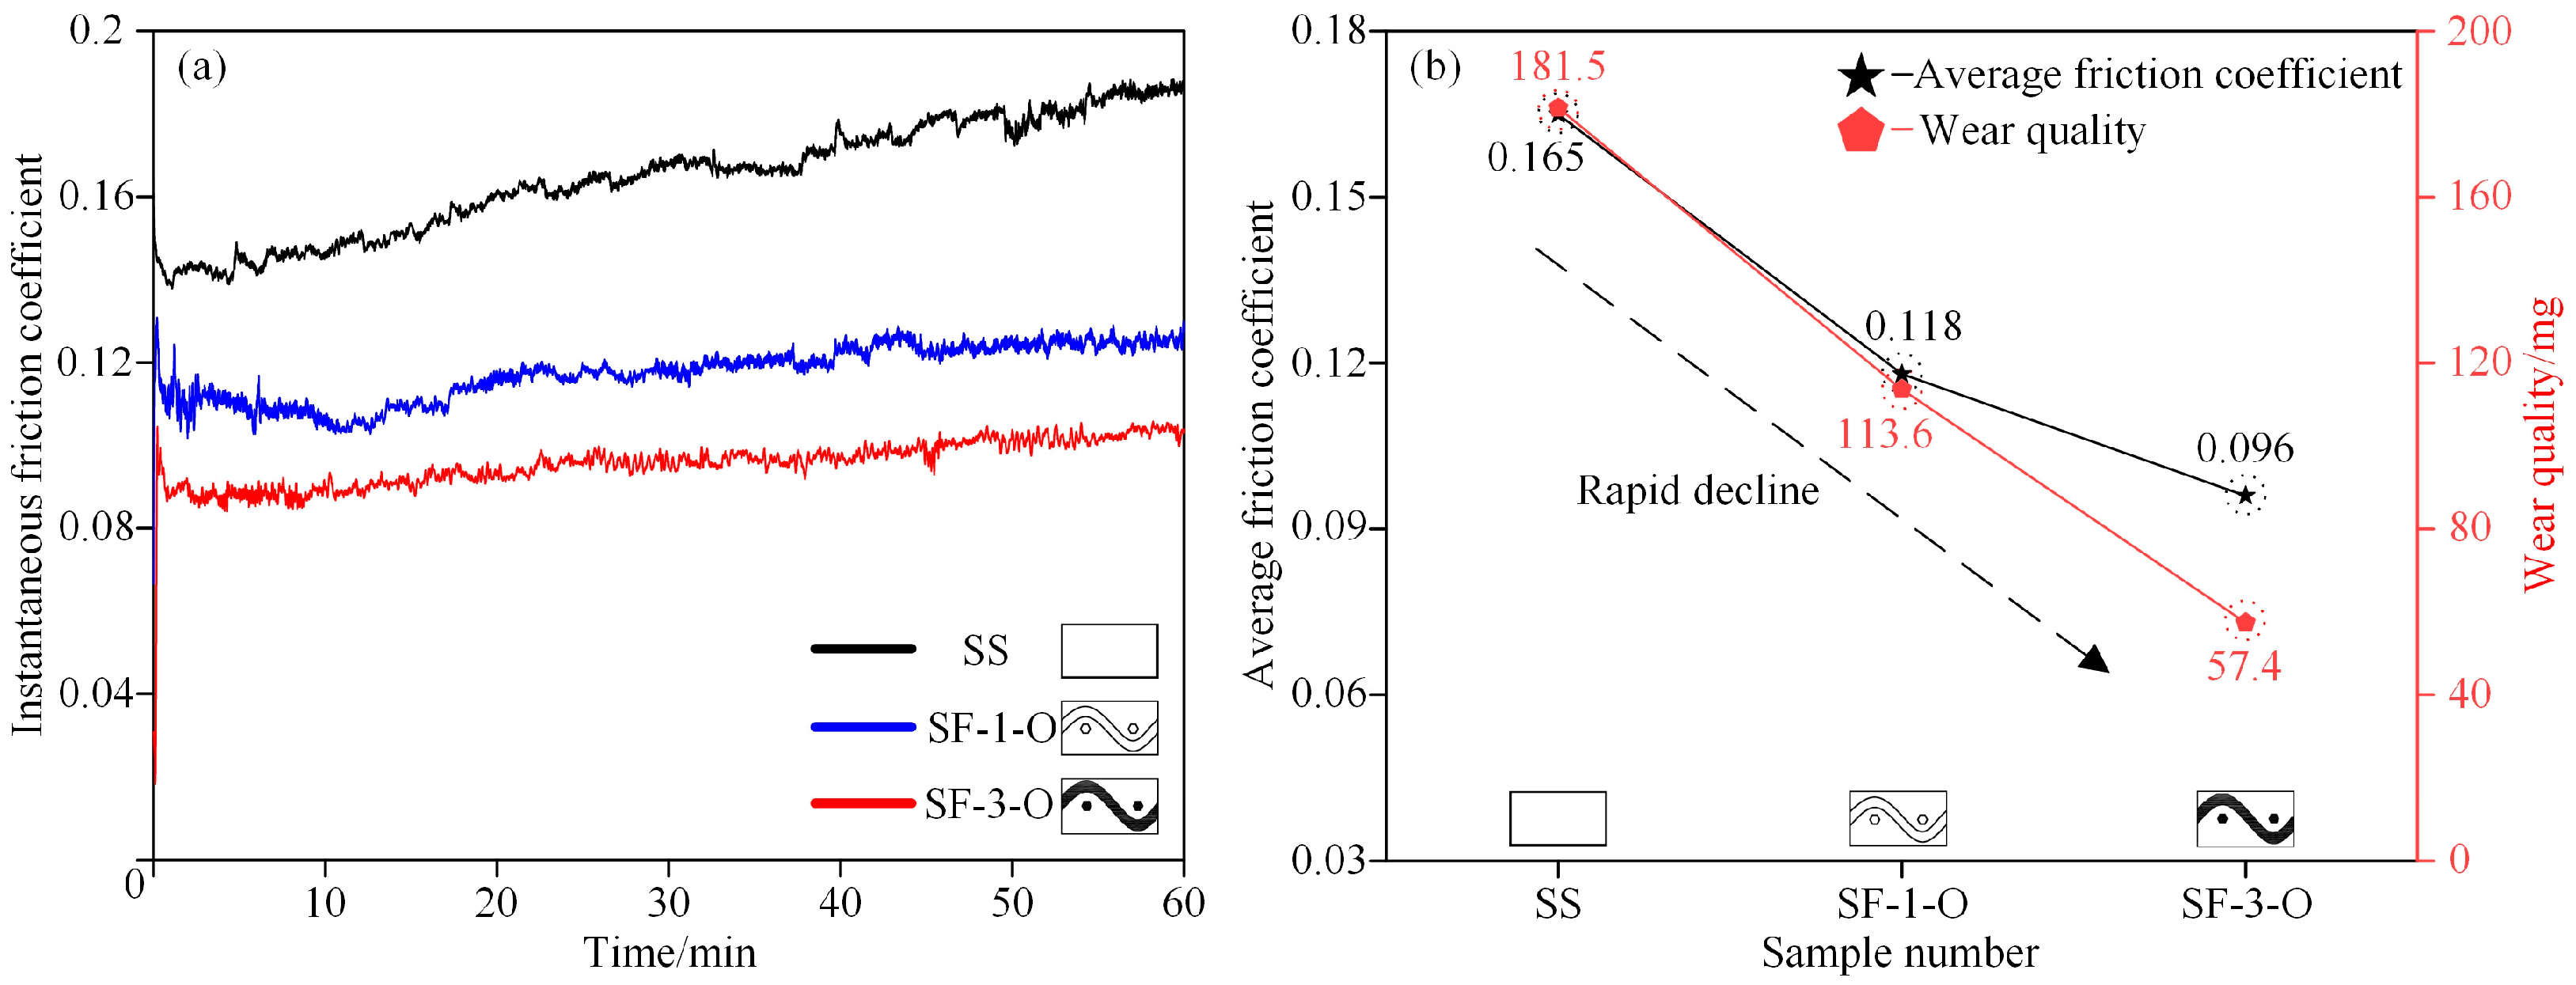
Figure 9 exhibits the instantaneous and average friction coefficients of diverse samples under normal operating conditions (load of 18 N). Observing Figure 9a, it is manifest that the SS (smooth surface) sample undergoes considerable fluctuations in the friction coefficient throughout the friction process. After 20 min of running-in, the friction coefficient commences to ascend. The SF-1-O (Optimal multistage lubrication structure (unfilled)) sample presents smaller fluctuations in the friction coefficient in comparison with the SS sample. After 18 min of running-in, the friction coefficient stabilizes at approximately 0.12 without any conspicuous upward tendency. The friction coefficient of the SF-3-O (Optimal multistage composite lubrication structure (fully filled)) sample is even stabler than that of the SF-1-O sample. It stabilizes after merely 3 min of running-in and settles at approximately 0.095.
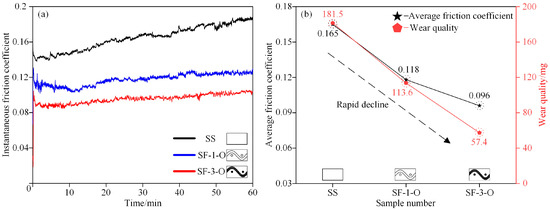
Figure 9.
Instantaneous friction coefficient (a), average friction coefficient, and wear mass (b) of different samples.
Based on Figure 9b, it is conspicuous that the SS sample holds the highest average friction coefficient, attaining 0.165, and the greatest wear mass, totaling 181.5 mg. The SF-1-O sample has an average friction coefficient of 0.118 and a wear mass of 113.6 mg. The SF-3-O sample manifests the lowest average friction coefficient, at 0.096, signifying a 41.8% reduction in contrast to the SS sample, and the smallest wear mass, at 57.4 mg, denoting a 68.4% reduction in comparison with the SS sample.
4. Conclusions
The study explored the effects of multilevel composite lubrication structure parameters on the crawling time and friction coefficient of sliding guide rail surfaces under low-speed, heavy-load conditions. Based on the optimal structural parameters, the influence of lubricant ratios on friction force and average friction coefficient was also investigated. The conclusions are as follows:
- (1)
- The crawling time and friction coefficient initially decrease and then increase with the increase in sinusoidal texture width, spacing, cycle length, and hexagonal pit diameter. The primary factor affecting the friction performance of the guide rails is the sinusoidal texture spacing c, followed by the sinusoidal texture length e, then the sinusoidal texture width b, and finally the hexagonal pit diameter d.
- (2)
- The optimal combination of parameters for the multilevel composite lubrication structure includes a sinusoidal texture width b = 0.15 mm, a cycle length of the sinusoidal texture e = 2 mm, a sinusoidal texture spacing c = 1.5 mm, and a hexagonal pit diameter d = 0.2 mm. The predicted values for crawling time and average friction coefficient are 17.3406 s and 0.0976, respectively.
- (3)
- Based on ratio experiments under low-speed, heavy-load conditions, the anticrawling and friction-reducing performance of different mass ratios of guide rail oil and MoS2 was studied. It was found that a mass ratio of guide rail oil to MoS2 of 2:1 offers the best anticrawling and friction-reducing performance, with the lowest average friction coefficient being 0.096.
- (4)
- Under normal operating conditions (medium speed and medium load), samples with multilevel composite lubrication structures demonstrated the best friction performance, showing more stable instantaneous friction coefficient curves. Compared to smooth and multilevel lubricated surface structures, the average friction coefficient was reduced by 41.8% and 18.6%, respectively.
Author Contributions
Investigation, Y.C.; Methodology, H.B.; Supervision, Y.C.; Writing—original draft, H.B.; Writing—review & editing, M.H. and Y.D. All authors have read and agreed to the published version of the manuscript.
Funding
The Postgraduate Research & Practice Innovation Program of Jiangsu Province (Grant No. SJCX24_2467) and The Industry-university-research Cooperation Project in Jiangsu Province (Grant No. BY20231184).
Institutional Review Board Statement
Not applicable.
Informed Consent Statement
Not applicable.
Data Availability Statement
Data are contained within the article.
Conflicts of Interest
The authors declare no conflict of interest.
References
- Xu, M.; Zhang, W.; Li, C. Local subsidence behavior of linear guideway assembly resting on a rough elastic foundation. Tribol. Int. 2023, 189, 108941. [Google Scholar] [CrossRef]
- Wang, S.; He, G.; Zhang, D.; Chen, F.; Yao, C.; Yan, Y. Innovative design methods for the geometric accuracy of machine tool guide rail oriented to spatial accuracy. J. Manuf. Process. 2024, 119, 483–498. [Google Scholar] [CrossRef]
- Yang, J.; Zhou, H.; Li, S.; Chen, J.; Xiang, H. Analysis of the critical Stick-slip velocity of CNC machine tool combining friction parameters identification and dynamic model. Int. J. Adv. Manuf. Technol. 2024, 131, 1849–1865. [Google Scholar] [CrossRef]
- Singla, Y.K.; Arora, N.; Dwivedi, D.K.; Rohilla, V. Influence of niobium on the microstructure and wear resistance of iron-based hard-facings produced by pre-placement technique—A novel approach. Int. J. Adv. Manuf. Technol. 2017, 93, 2667–2674. [Google Scholar] [CrossRef]
- Grzesik, W.; Żak, K.; Kiszka, P. Comparison of surface textures generated in hard turning and grinding operations. Procedia CIRP 2014, 13, 84–89. [Google Scholar] [CrossRef]
- Park, J.; Lee, W.; Choi, T.; Hwang, S.-H.; Myoung, J.M.; Jung, J.-H.; Kim, S.-H.; Kim, H. Layer-modulated synthesis of uniform tungsten disulfide nanosheet using gas-phase precursors. Nanoscale 2015, 7, 1308–1313. [Google Scholar] [CrossRef] [PubMed]
- Dumitru, G.; Romano, V.; Weber, H.; Haefke, H.; Gerbig, Y.; Pflüger, E. Laser microstructuring of steel surfaces for tribological applications. Appl. Phys. A 2000, 70, 485–487. [Google Scholar] [CrossRef]
- Gropper, D.; Wang, L.; Harvey, T.J. Hydrodynamic lubrication of textured surfaces: A review of modeling techniques and key findings. Tribol. Int. 2016, 94, 509–529. [Google Scholar] [CrossRef]
- Gu, C.; Meng, X.; Xie, Y.; Yang, Y. Effects of surface texturing on ring/liner friction under starved lubrication. Tribol. Int. 2016, 94, 591–605. [Google Scholar] [CrossRef]
- Tomanik, E.; Profito, F.J.; Zachariadis, D.C. Modelling the hydrodynamic support of cylinder bore and piston rings with laser textured surfaces. Tribol. Int. 2013, 59, 90–96. [Google Scholar] [CrossRef]
- Rosenkranz, A.; Costa, H.L.; Profito, F.; Gachot, C.; Medina, S.; Dini, D. Influence of surface texturing on hydrodynamic friction in plane converging bearings—An experimental and numerical approach. Tribol. Int. 2019, 134, 190–204. [Google Scholar] [CrossRef]
- Yang, L.; Ding, Y.; Cheng, B.; He, J.; Wang, G.; Wang, Y. Investigations on femtosecond laser modified micro-textured surface with anti-friction property on bearing steel GCr15. Appl. Surf. Sci. 2018, 434, 831–842. [Google Scholar] [CrossRef]
- Ahmed, A.; Masjuki, H.; Varman, M.; Kalam, M.; Habibullah, M.; Al Mahmud, K. An overview of geometrical parameters of surface texturing for piston/cylinder assembly and mechanical seals. Meccanica 2016, 51, 9–23. [Google Scholar] [CrossRef]
- Kasem, H.; Stav, O.; Grützmacher, P.; Gachot, C. Effect of low depth surface texturing on friction reduction in lubricated sliding contact. Lubricants 2018, 6, 62. [Google Scholar] [CrossRef]
- Lu, L.; Zhang, Z.; Guan, Y.; Zheng, H. Comparison of the effect of typical patterns on friction and wear properties of chromium alloy prepared by laser surface texturing. Opt. Laser Technol. 2018, 106, 272–279. [Google Scholar] [CrossRef]
- Dan, L.; Xuefeng, Y.; Chongyang, L.; Jian, C.; Shouren, W.; Yanjun, W. Tribological characteristics of a cemented carbide friction surface with chevron pattern micro-texture based on different texture density. Tribol. Int. 2020, 142, 106016. [Google Scholar] [CrossRef]
- Li, H.; Zhou, H.; Zhang, D.; Zhang, P.; Zhou, T. Influence of varying distribution distance and angle on fatigue wear resistance of 40Cr alloy steel with laser bionic texture. Mater. Chem. Phys. 2022, 277, 125515. [Google Scholar] [CrossRef]
- Xie, X.; Hua, X.; Li, J.; Cao, X.; Tian, Z.; Peng, R.; Yin, B.; Zhang, P. Synergistic effect of micro-textures and MoS2 on the tribological properties of PTFE film against GCr15 bearing steel. J. Mech. Sci. Technol. 2021, 35, 2151–2160. [Google Scholar] [CrossRef]
- Meng, F.; Zhang, W. Effects of compound groove texture on noise of journal bearing. J. Tribol. 2018, 140, 031703. [Google Scholar] [CrossRef]
- Fan, Y.; Chen, Y.; Hao, M.; Wang, S.; Du, Y.; Xia, Y.; Guan, X. Study on the improvement of crawling phenomenon of sliding guideway by composite lubrication texture. China Mech. Eng. 2024, 1–8. [Google Scholar]


Disclaimer/Publisher’s Note: The statements, opinions and data contained in all publications are solely those of the individual author(s) and contributor(s) and not of MDPI and/or the editor(s). MDPI and/or the editor(s) disclaim responsibility for any injury to people or property resulting from any ideas, methods, instructions or products referred to in the content. |
© 2024 by the authors. Licensee MDPI, Basel, Switzerland. This article is an open access article distributed under the terms and conditions of the Creative Commons Attribution (CC BY) license (https://creativecommons.org/licenses/by/4.0/).