Article

Road Surface Texture Evaluation and Relation to Low-Speed Skid Resistance for Different Types of Mixtures

1
School of Civil and Transportation Engineering, Beijing University of Civil Engineering and Architecture, No. 1 Zhanlanguan Road, Xicheng District, Beijing 100044, China
2
Collaborative Innovation Center of Energy Conservation & Emission Reduction and Sustainable Urban-Rural Development in Beijing, No. 1 Zhanlanguan Road, Xicheng District, Beijing 100044, China
3
Beijing Advanced Innovation Center for Future Urban Design, No. 1 Zhanlanguan Road, Xicheng District, Beijing 100044, China
4
Research Institute of Highway Ministry of Transport, No. 8 Xitucheng Road, Haidian District, Beijing 100088, China
*
Author to whom correspondence should be addressed.
Coatings 2024, 14(11), 1367; https://doi.org/10.3390/coatings14111367
Submission received: 25 September 2024 / Revised: 24 October 2024 / Accepted: 25 October 2024 / Published: 27 October 2024

Abstract

:
Pavement skid resistance is significant for driving safety. British Pendulum Number (BPN) is commonly used as a low-speed skid resistance indicator, whereas sometimes it is impractical for data collection on roads in service. Since skid resistance is greatly affected by pavement surface texture, this research aims to evaluate pavement surface texture comprehensively and estimate the low-speed friction BPN from road surface texture on macro- and micro- scale. Asphalt Concrete (AC) and Stone Mastic Asphalt (SMA) were included. Road surface texture was evaluated from four aspects, texture depth, amplitude-related Root Means Square (RMS), elevation variances corresponding to different wavebands and texture spectral analysis. Texture depth indicators include Mean Texture Depth (MTD) and Mean Profile Depth (MPD). Elevation variances with three wavebands, from 5 mm to 50 mm, from 0.5 mm to 5 mm and from 0.024 mm to 0.5 mm respectively, were obtained. The results show that MPD is well correlated with MTD. Elevation variances with different wavebands demonstrates that the elevation variance of macro-texture with long wavelengths from 5 mm to 50 mm dominates the total variance. Spectral analysis shows that texture level is larger when the wavelength is beyond 4 mm, which is consistent with elevation variances. A linear regression between BPN and single texture index, as well as multiple linear regression analysis were conducted. The former regression result indicates that it is not feasible to estimate BPN using single index due to low correlation coefficient R2. The latter shows that the BPN can be estimated from texture levels corresponding to 64 mm and 2 mm, and the micro-texture. The R2 can be up to 0.684. This research will contribute to fast acquisition of BPN from pavement surface texture, thus improving skid resistance.

1. Introduction

Skid resistance has been considered as one of the most important factors influencing traffic safety. A sufficient level of skid resistance allows vehicles to be controlled even in case of adverse conditions, such as acceleration, braking and turning maneuvers, while inadequate performance of skid resistance results in poor friction and may lead to reduced braking efficiency, increased driving risks, crash accidents, and human causalities in extreme cases, especially on rainy days [1]. Traffic accidents caused by inadequate skid resistance below a certain threshold are one of the major concerns for road administrators and authorities. In most cases, the skid resistance of these road sections prone to accidents are below a certain safe level. This means that the traffic accidents may increase significantly when the skid resistance is lower than a certain value [2,3], so it is a key performance to be concerned for road management and preventive maintenance.
Skid resistance is known as the force preventing a tire from slipping on the pavement surface [3]. It is derived from the frictional force from the interaction between the pavement surface and a vehicle tire. The tire-pavement frictional force is generally considered to be composed of two components theoretically, adhesion and hysteresis [4,5]. The adhesion comes from molecular forces at the contact interface between the tire and the pavement surface, while the hysteresis component arises from energy storage and dissipation associated with tire deformation. The two friction components are both affected by the pavement surface significantly from pavement aspects, known as the micro-texture and macro-texture [6,7]. The micro-texture affects adhesion friction by enlarging the actual tire-pavement contact area to improve the molecular shearing [6]. The macro-texture affects hysteresis friction by sufficient asperities of a pavement surface to contribute to tire deformation [7]. It is widely acknowledged that the hysteresis friction is much larger than adhesion friction in both dry and wet conditions [8,9]. In dry condition, the adhesion friction is significant for a smooth surface, and reaches is maximum at a low speed. In wet conditions, due to the lubricant effect of water film on the wet pavement surface, the skid resistance is much lower than on a dry road. In addition, the lubricating effect of water at high speeds induces hydroplaning when water cannot flow through channels at the macro-texture level of the pavement surface [4]. In this case, a hydrodynamic force is generated to give a lifting force on the tire rubber from the road, thus decreasing the contribution of hysteresis friction to the total wet skid resistance [9].
Pavement surface texture is simply defined as the deviations of a pavement surface from a true planar surface [10]. It can be classified into the following four categories according to the wavelengths and amplitudes by the Permanent International Association of Road Congress (PIARC) [11], micro-texture with wavelengths between 0.001 and 0.5 mm and vertical amplitudes less than 0.2 mm; macro-texture with wavelengths between 0.5 and 50 mm and vertical amplitudes between 0.1 and 20 mm; mega-texture wavelengths between 50 and 500 mm and vertical amplitudes between 0.1 and 50 mm and unevenness (or roughness) with wavelengths beyond 500 mm [11,12,13]. Micro-texture and macro-texture have been found to contribute to tire-pavement friction significantly, and a comprehensive understanding of them leads to a safe traffic system.
The pavement surface, as the direct contact part between the tire and the pavement, has received great attention, especially the micro-texture and macro-texture, due to their significant effects on the anti-skidding performance. Based on the statistical characteristics [14], spectral characteristics [15,16,17], fractal analysis [18], etc., many researchers have investigated the surface texture evaluation, the effects of surface texture on skid resistance, as well as their evolution. Xiao, et al. [18,19] mainly investigated the pavement texture evolution by the spatiotemporal analysis based on the Mean Texture Depth (MTD), Mean Profile Depth (MPD) and Sensor Measured Texture Depth (SMTD) data series during a four-year period on the Research Institute of Highway (RIOH) track and demonstrated that pavement texture depth exhibited obvious fluctuation with time and space. Ji et al. [14] found that statistical amplitude-related indictors could reach a strong correlation with skid resistance. Rezaei et al. [20] found that correlation coefficient R2 was only 0.237 when the skid number was only associated with the MPD and the MPD cannot be considered to explain variations of the texture sufficiently [21]. Necessary awareness of constraints should be noted when using only pavement macro-texture to develop prediction models for skid resistance [22].
The micro-texture plays an important role for anti-skidding performance under wet conditions. Kanafi et al. [16] found that the changes in macro- and micro-scales occurred within full surface profile using the statistical characteristics and fractal analysis, and demonstrated that the fractal parameter Hurst exponent (H) could not be used as texture-friction studies at actual pavement conditions due to poor correlation. Pavement surface texture with different wavelengths could be characterized by spectral analysis [17]. Since the micro-texture of pavement surface is mainly affected by the aggregate characteristics used in the surface, Li et al. [23], Li et al. [24] and Ergin, et al. [25] conducted research on the micro-texture from the perspective of aggregates, whereas this would ignore the effect of the asphalt on the early skid resistance on a pavement [26,27]. Therefore, a multi-scale evaluation and comprehensive understanding of pavement surface are essential.
The pavement friction can be directly tested, as specified in many standard test methods [28,29] and T 0964-2008 in Chinese specification JTG 3450-2019 [30]. British Pendulum Tester (BPT) is a worldwide utilized device for low-speed skid resistance, with relatively cheap price and easy operation [29]. British Pendulum Number (BPN) is also regarded as a surrogate test method for micro-texture [5,31]. The multi-scale surface texture indicators directly acquired, combined with the BPN as the indirect evaluation indicator of the micro-texture, will contribute to comprehensive understating of the surface texture and skid resistance. On the other hand, Xiao et al. [32] established a numerical friction model to estimate the hysteresis friction of BPT ignoring the adhesion friction. Since it is always thought that hysteresis friction is more affected by the macro-texture. This seems that different opinions appear and more research is still needed on the effects of surface texture on BPN. Meanwhile, the friction measurement using the BPT is time-consuming, influenced by operators, and needs to close traffic. BPN prediction based on the macro- and micro- texture of the pavement surface, which are relatively easy to be measured, will alleviate the problem. At the same, laser development in road surface detection has contributed to convenient acquisition of road surface texture.
For methods to establish the correlation between BPN and surface texture, many new methods emerge, such as the machine learning method [33]. Although the machine learning can process and analyze large amounts of data, extract useful information, i.e., data-driven analysis, it needs a large number of data to train the model and the minimum number of train samples need to reach a predefined level of accuracy is unknown. Jamhiri et al. [34] proposed a multiple linear regression considering the robust analysis and error diagnoses, which contribute to our analysis. The correlation coefficient R2 [35] in previous prediction of BPN still needs to be improved.
According to above-mentioned descriptions, it is necessary to develop multi-scale evaluation of the pavement surface and to clarify the effects of the surface texture on BPN. In this research, the multi-scale surface texture evaluation was conducted on two types of commonly used asphalt mixtures, Asphalt Concrete (AC) and Stone Mastic Asphalt (SMA), with each mixture of three gradations. The surface texture indicators include commonly used texture depth indexes including MPD and MTD, amplitude-related statistical indicator Root Mean Square (RMS), filtered elevation variances corresponding to specific wavebands, and spectral analysis. The estimation of BPN from both macro-texture and micro-texture calculated from road surface original elevation data, which are easier to measure, was attempted by the multiple linear regression.

2. Scope and Objectives

This research aims to give a multi-scale evaluation of pavement surface texture for two types of asphalt mixtures by a Laser Texture Scanner (LTS) and estimate BPN based on them. In this way, the effects of surface on BPN can be further explained. This will also provide a possible way to acquire low-speed resistance fast and conveniently. The road surface texture was investigated on both macro- and micro- scale quantitatively for different types of pavements, which may contribute to interpretation of skid resistance. Multiple linear regression was conducted on the relation between BPN and pavement surface texture. The main contents are as follows:
  • Common texture evaluation indices included in this research were determined. The commonly used macro-texture indices MTD and MPD were obtained. The statistical index RMS was calculated and included as an amplitude-related indicator due to its strong correlation with the skid resistance [14,36]. Namely, three common texture indices, MTD, MPD and RMS were included.
  • Elevation variances with three different wavebands were calculated by signal filtering. Elevation variances for micro-texture with wavelengths from 0.024 mm to 0.5 mm was achieved, and even macro-texture was also divided into long and short groups by 5 mm to better understand the texture components with different wavelengths.
  • Texture spectrums was obtained by signal processing and spectral analysis was conducted to analyze the texture distribution considering the general shape, peak value and corresponding wavelengths. The effects of aggregates gradating on the texture spectrums were also explained.
  • Based on the above-mentioned texture and BPN for two types of asphalt mixtures, multiple linear regression was carried out to establish a prediction model of BPN from the surface texture considering the multicollinearity between different texture indices. The possible use of macro-texture and micro-texture to estimate BPN by linear regression was investigated.

3. Materials and Methods

3.1. Materials and Specimen Fabrication

In this research, two types of asphalt mixtures, AC and SMA with a nominal maximum aggregate size (NMAS) of 13.2 mm were studied, i.e., AC-13 and SMA-13 respectively. The asphalt utilized was Styrene Butadiene Styrene (SBS) modified asphalt. The aggregates used were diorite from Xingluo quarry in Shaanxi province. Mineral filler used was ground limestone powder. Cellulose fibers, with a content of 0.3% (mass fraction of asphalt mixture), were adopted when fabricating SMA specimens. All properties of the above materials meet the requirements of Chinese Standard Specification JTG F40-2004 [37].
Three gradations, naming coarse gradation, middle gradation and fine gradation were included for both AC-13 and SMA-13, and two specimens were fabricated for each gradation. All gradations of the two types of asphalt mixtures are shown in Figure 1. AC-13C means AC with NMAS of 13.2 mm and coarse gradation; C, M and F means coarse, middle and fine gradation respectively. Other mixtures obey similar naming rules.
The specimens used were slabs with dimensions of 50 cm × 50 cm × 5 cm. They were fabricated via a single-drum walking-behind roller. Before fabricating the specimens, Marshall specimens corresponding to the two types of mixtures were prepared. Their void indexes were then tested. Based on the density and slab dimensions, the mass of asphalt mixtures can be calculated. In this way, masses of the asphalt mixtures were better controlled during the slab fabrication process. In the compacting process, a rubber sheet with a thickness of 5 mm was put on the mold after the surface of the mixture was levelled, so that the mixture was uniformly forced. Each specimen was compacted for totally 24 times, with 8 times static rolling firstly, then 8 times vibratory compaction and finally 8 times static rolling [38].

3.2. Test Programme

Two mixture types, AC-13 and SMA-13, were involved, with each type of three gradations (coarse, middle and fine). They were named AC-13C, AC-13M, AC-13F, SMA-13C, SMA-13M, SMA-13F respectively. For each gradation, two specimens were fabricated. This means totally 12 specimens were included.

3.2.1. Measurement Devices and Test Positions

Since traditional volumetric patch method and laser measurement are commonly used to evaluate the texture depth recently, in this research, the two methods were included. Road surface texture was measured by the commonly used Sand Patch Test (SPT) according to the American Society for Testing and Materials (ASTM) E965-15 [39], as shown in Figure 2a. The MPD was obtained by using the LTS according to the International Standards Organization (ISO) 13473-2 [10], as shown in Figure 2b. The detailed laser sample specifications of LTS are as follows, vertical sample resolution is 0.005 mm; maximum width resolution is 0.02469 mm; and maximum length resolution is 0.003175 mm. This indicates the capacity of LTS to identify the minimum length or height in three different directions. When using the LTS, the parameters, such as the sample interval in the length direction, the space between adjacent profiles can be adjusted according to the need. More time for LTS to scan a certain area of surface texture is needed when the sample interval and the space become smaller. In this research, considering the research objective and the work efficiency of LTS, the sample interval in the length direction was set as 0.009525 mm and the space between adjacent profiles was set as 0.4445 mm. In this case, according to the Nyquist Sampling Theorem, the setting is enough to obtain the micro-texture for two-dimensional spectral analysis. During the scanning process, the supplied shield from the manufacturer was employed to block direct sunlight on the scanning surface to avoid its effects on the results.
The low-speed skid resistance BPN was tested by employing the BPT according to ASTM E303-22 [29], as shown in Figure 2c. For each specimen with dimensions of 50 cm × 50 cm × 5 cm, three positions, No. 1, No. 2 and No. 3 respectively, as shown in Figure 2d, were measured with regards to LTS and BPT. While SPT was only conducted on the center position (No. 2) due to the fact that the spreading area in the SPT is larger than each position area.
The LTS was employed to obtain the elevation data of road surface texture. The maximum scanning area is 104 mm × 72.01 mm. Three positions were scanned on each specimen with an area of 104 mm × 72.01 mm and they were numbered as shown in Figure 2d. In a scanned position, 163 profiles with a length of 104 mm were obtained, and they were evenly distributed. The sample interval for each line was 0.009525 mm. During the test, it should be noted that the SPT should be conducted after the road surface was scanned by the LTS in order to avoid the effect of small particles remained on the road surface after SPT tests, because small particles on the road surface affected the laser scanning.

3.2.2. Road Surface Texture Evaluation

MTD was obtained by SPT method [39]. It is a world widely used method to evaluate the macro-texture. Other road surfaces indicators used were calculated from the original elevation data acquired by the LTS after the invalid points (drop-outs) of original road surface elevations were dealt with [38]. By doing this, the scanned surface is closer to real road surface. The scanned surfaces of SMA slab before and after invalid data processing are shown in Figure 3. The outliers are within 10%, meeting the ISO requirements [15].
Based on elevation data after dealing with drop-outs, texture depth indicators including MTD and MPD, amplitude-related indicator including RMS, filtered elevation variances corresponding to different wavebands, and spectral information were determined. They are listed and described below.
(1) MPD and MTD
MPD is employed to characterize the macro-texture. It is an alternative to the traditional volumetric patch method [39]. For each type of mixture, two specimens were fabricated. For each specimen, three positions were scanned as shown in Figure 2d. At each position, 163 profile lines were obtained, and a Mean Segment Depth (MSD) was calculated based on each profile. Totally, 163 MSD values were calculated on each position. MPD for each measurement position was the mean value of all MSD values. MPD for each specimen was the mean value of MPD values of the three measurement positions. MPD for each mixture type was the mean value of the MPD values from its two specimens.
MTD was measured on only No. 2 position in the middle section of the specimen since the area of the spread circle during SPT was usually larger than that of each LTS measurement position. For each specimen, SPT was carried out twice. The mean value of MTDs measured on the two specimens for the same mixture was regarded as the MTD of this mixture.
(2) Root Mean Square (RMS)
RMS was calculated based on each scanned profile along the length direction. It is one of the most commonly used indictors in pavement analysis, acting as a measure of the magnitude of asperities in a profile, i.e., an amplitude-related parameter. Previous research has demonstrated that amplitude-related parameters correlate with skid resistance [14,36]. The calculation was done by firstly removing the least-squares-fit line from each scan line, and then calculating the RMS of the resulting data according to Equation (1). Its calculation method was similar to that of MPD. RMS for a measurement position was based on 163 scanned profiles. RMS for a specimen was obtained by averaging the RMS values measured at three measurement positions. RMS for a mixture type was calculated by averaging the RMS values from two parallel specimens.
RMS = 1 l 0 l Z 2 ( x ) d x
where l denotes the evaluation length, Z(x) is the ordinate values.
(3) Variances of micro-texture and macro-texture
The variance used in this research was the elevation variance. More information can be found in previous research [38]. The variance calculation was the same as the square of the standard deviation, but the benefit is that we can filter the scan line data into three separate band pass filtered wavebands by high and low pass filter depending on demands, and calculate the elevation variances of different wavelength ranges. This is helpful to characterize the surface texture containing different wavelength ranges of micro-texture and macro-texture. Considering that macro-texture includes textures with wavelengths between 0.5 and 50 mm, which is a large range, the macro-texture was divided into two groups by the wavelength 5 mm in this research according previous research [38], i.e., the wavebands for macro-texture with long wavelengths greater than 5 mm and short wavelengths shorter than 5 mm. Why the wavelength 5 mm is adopted is that the 5 mm approaches the critical value for coarse and fine aggregates in road engineering. Therefore, three wavebands, from 5 mm to 50 mm (long macro-texture), from 0.5 mm to 5 mm (short macro-texture) and from 0.024 mm to 0.5 mm (micro-texture), were included.
(4) Texture spectrum
This can be done because the road surface texture has many statistical properties of random signals. Spectral analysis was conducted based on the scanned data by employing the LTS [15]. This was carried out to investigate the texture distribution by signal analysis. Texture spectrum was obtained by several processing and transformation, including dealing with invalid data known as drop-outs, slope and offset suppression, Split Cosine Bell Windowing, Discrete Fourier Transform, Power Spectral Density, transformation from constant bandwidth to constant-percentage bandwidth, and texture level calculation. In the meantime, the texture levels corresponding to micro-texture LTX,0.06→0.5 and macro-texture LTX,0.5→32 were also calculated according to Equation (2).
L TX , i j = 10 lg ( m = i j 10 L TX , m 10 )
where LTX,ij denotes the texture level corresponding to wavelength range from i to j. LTX,m denotes texture level corresponding to wavelength m within the wavelength range from i to j.

4. Results and Discussion

4.1. Road Surface Texture Analysis for Different Mixtures

4.1.1. Texture Depth for Different Mixtures

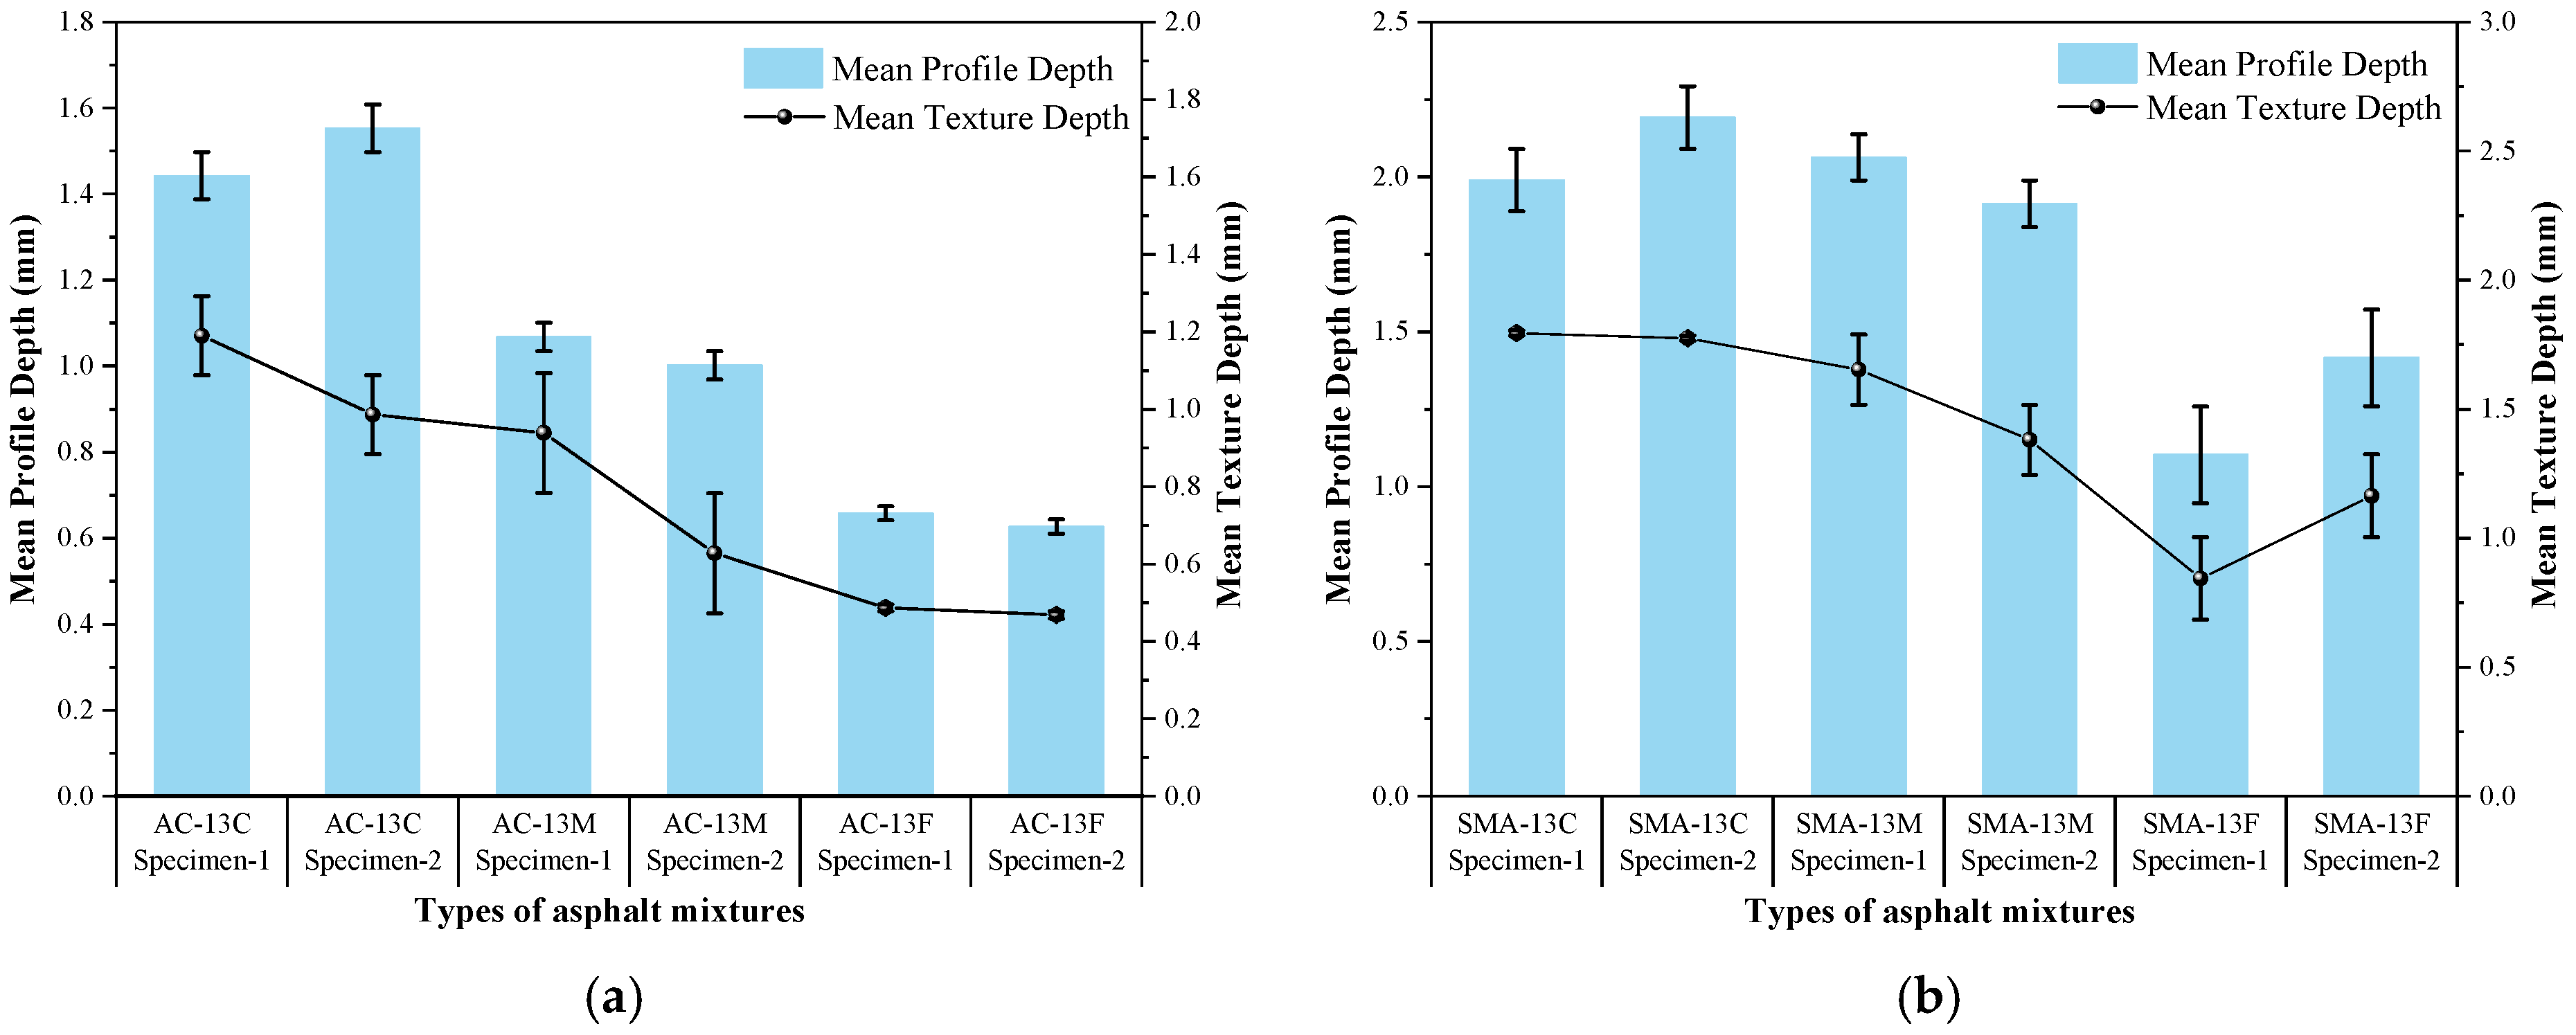
MTD and MPD are two commonly used indexes to evaluate macro-texture. They were both included in this research. The MTD and MPD of the two types of asphalt mixtures are shown in Figure 4. In this figure, the AC-13C Sepcimen-1 means test results measured on Specimen-1 for AC with NMAS 13.2 mm and coarse gradation. The same naming rule was used in figures and tables in this research. From Figure 4a,b, it can be found that, no matter which macro-texture evaluation index is used, MPD or MTD, the texture depth for AC mixture is generally smaller than that of SMA for the same gradation type, coarse, middle or fine gradation. This may be attributed to larger proportion of coarse aggregates in SMA mixtures. With regards to different gradations for AC mixtures, as shown in Figure 4a, the macro-texture indicators are generally in a descending order for coarse, middle and fine gradations. Similar trends can be found in Figure 4b for SMA mixtures with the three gradations.
With regards to the two indicators MPD and MTD, they can differentiate different gradations for AC and SMA mixtures. As shown in Figure 4, the larger MPD, larger the MTD. The same trends can be obtained no matter which evaluation indicator is employed. Figure 4a,b also demonstrate that the error by using MTD is generally greater than MPD. This is because that the SPT is operator related and a little subjective when determining whether the spread circle reaches its maximum. For the MPD obtained by the LTS, it seemed that the error when measuring SMA is generally greater compared with AC, which may be caused by large gaps on the SMA specimen surface.
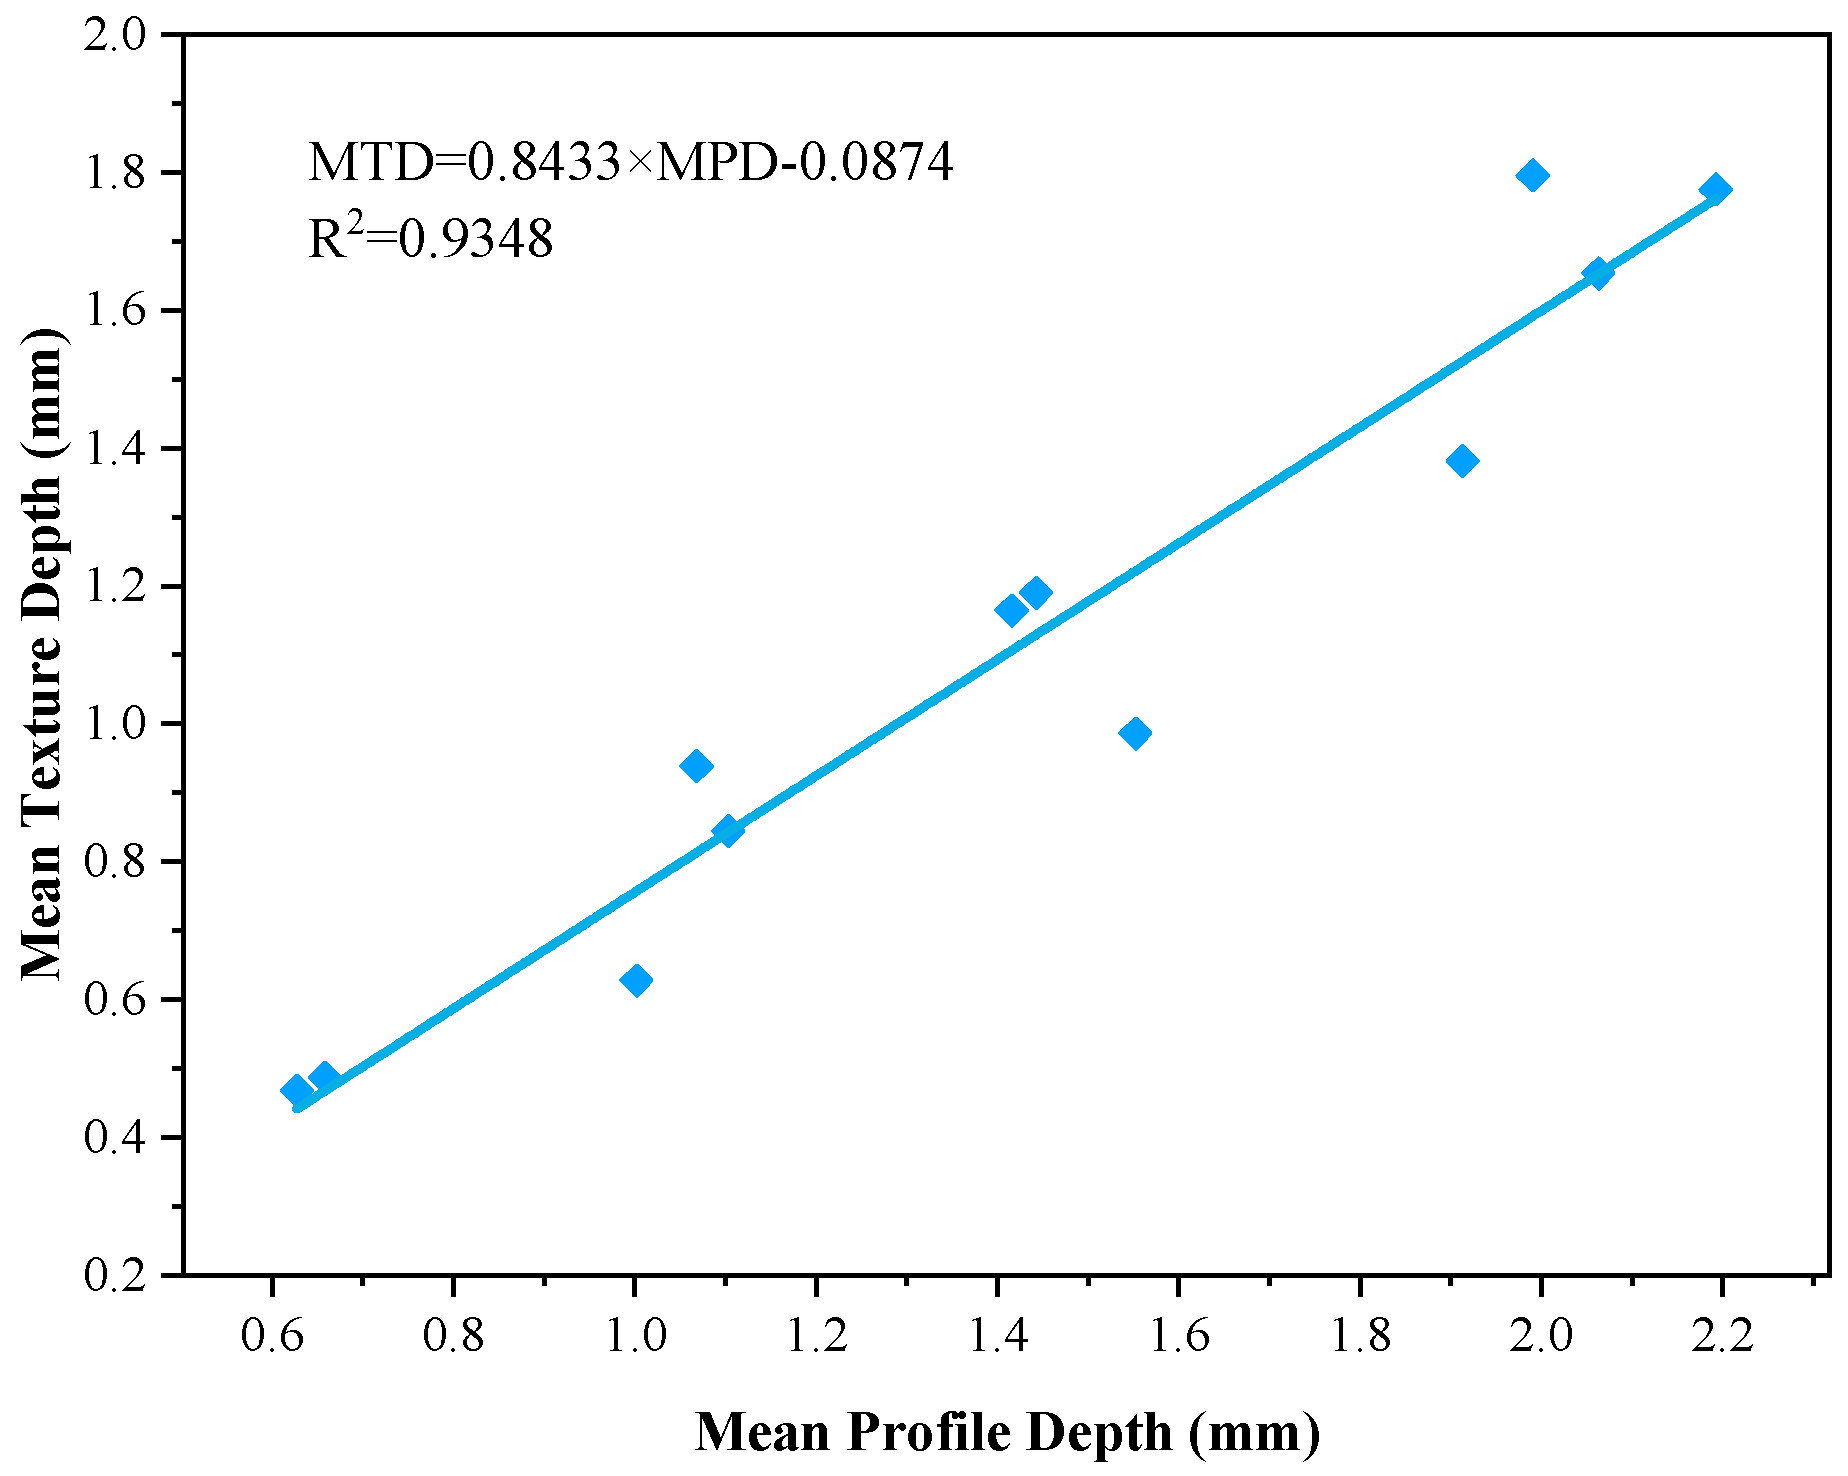
In order to better analyze the correlation between MPD and MTD, considering that linear correlation between them exists in previous research [40], a linear regression between them was conducted based on AC-13 and SMA-13 mixtures with each mixture of three gradations, coarse, middle and fine respectively. The linear regression results are shown in Figure 5. Totally 12 groups of texture depth data were included. Figure 5 illustrates that significant linear correlation exists between them and the linear correlation coefficient R2 reaches 0.9348. MTD is positively correlated with MPD, with a slope of 0.8433 and an interception of negative 0.0874, as shown in Figure 5. The linear regression result is similar to ISO 13473-2 [41], as shown in Equation (3). Estimated Texture Depth (ETD) means texture depth predicted from MPD. The slope of 0.8433 in Figure 5 approaches the slope value 0.8 in Equation (3) while the interception is different. Whereas, a little greater slope than 0.8 and a negative interception may lead to similar results to that in ISO 13473-2. The ISO has updated the equation in ISO 13473-1 [10]. More data set and regression analysis are still needed since human factors while conducting SPT.
E T D = 0.2 + 0.8 × M P D

4.1.2. Root Mean Square (RMS) for Different Mixtures

Previous research has demonstrated that amplitude-related indexes are related with skid resistance [14,36], so RMS is utilized to characterize the magnitude of the asperities. The RMS results for two types of mixtures are shown in Figure 6a,b respectively.
From Figure 6, it can be seen that the RMS for AC and SMA mixtures are in an ascending order. Namely, for the same gradation type, for example the coarse gradation, the RMS for AC mixture is generally smaller than SMA mixture. The same trend goes for middle and fine gradations. For both AC and SMA mixtures, RMS of specimens with coarse, middle and fine gradations are in a descending order. Both the trends are consistent with MPD and MTD generally. This indicates that RMS may be also a macro-texture surrogate in some cases.

4.1.3. Variances with Regard to Different Wavelength Ranges for Different Mixtures

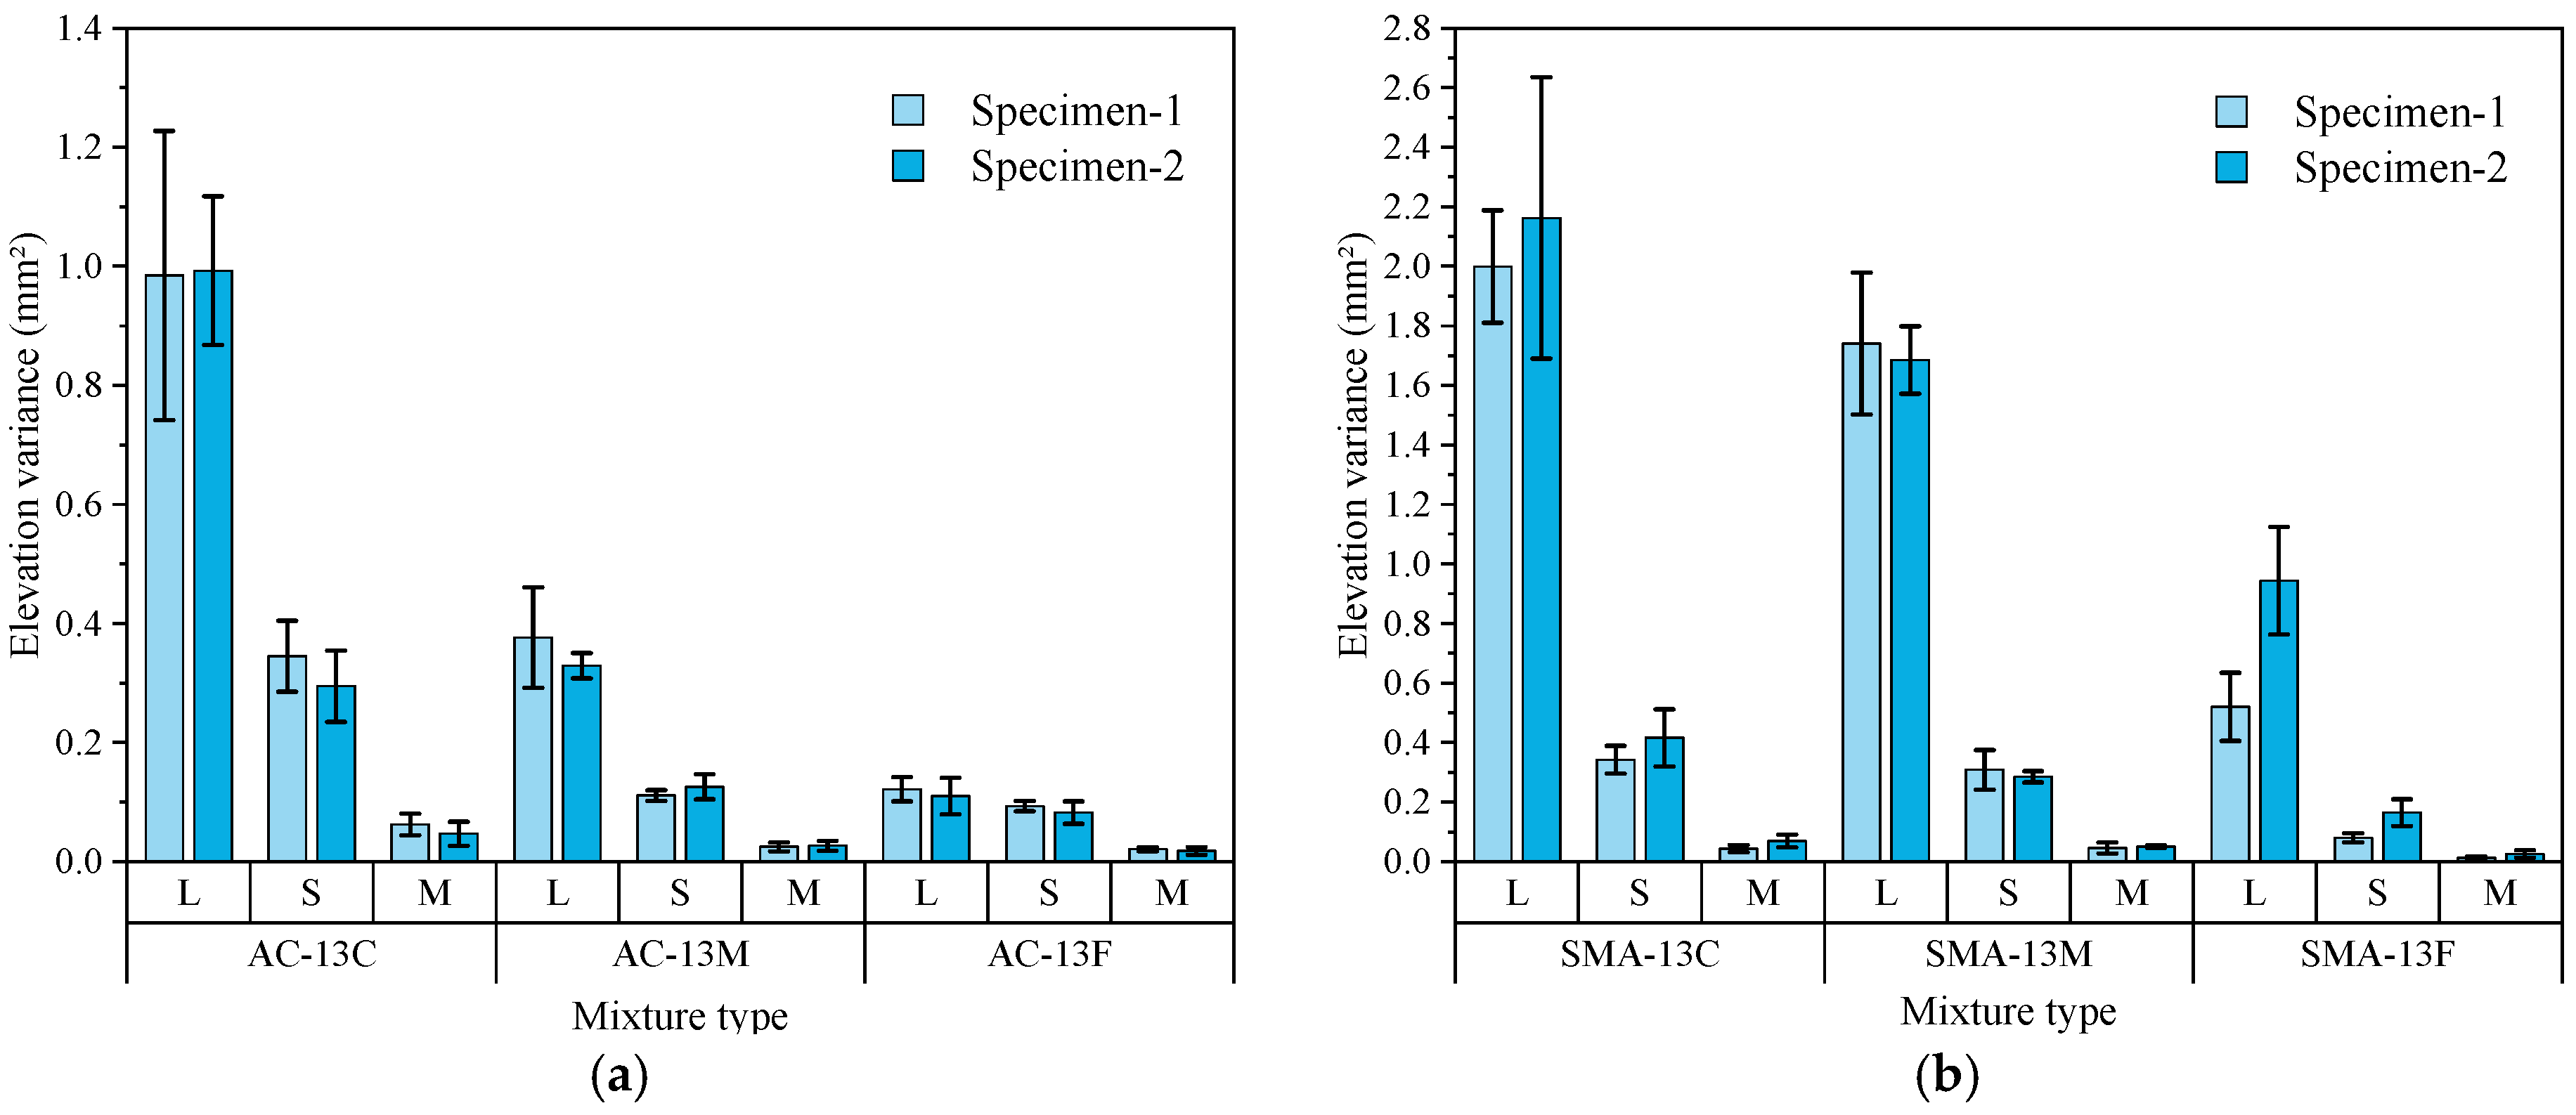
Three wavebands of two types of asphalt mixtures, AC and SMA, were included. They were all used to evaluate texture fluctuating conditions in the surface corresponding to different wavelengths. Their corresponding elevation variances are shown in Figure 7. The waveband with wavelengths from 5 mm to 50 mm is indicated by “L” to represent the long macro-texture wavelengths. The second waveband with wavelengths from 0.5 mm to 5 mm is indicated by the “S” to represent the short macro-texture wavelengths. The third waveband from 0.024 mm to 0.5 mm is indicated by the “M” to characterize micro-texture wavelengths.
Figure 7 shows that generally the AC, as shown in Figure 7a, exhibits smaller variances than SMA mixtures, as shown in Figure 7a, for the three indicators L, S and M. For each mixture, the variance of long macro-texture wavelengths is the greatest, followed by short macro-texture wavelengths and micro-texture wavelengths. For AC-13C, supposing that the total variance of a pavement surface is 100%, the elevation variance of long macro-texture wavelengths accounts for above 70% of the total variance while the micro- wavelengths accounts for less than 5%. For the same mixture type AC-13 shown in Figure 7a, long macro-texture wavelength variance L accounts for the highest proportion. The proportions of L decreases with the gradation changing from coarse, middle to fine gradations while the proportions of S and M increases. The proportion of L for SMA mixtures is generally above 80%, which is much higher than AC mixtures, while the proportion of M is lower than AC mixtures. This is due to the high proportion of coarse aggregates and relatively high asphalt usage in SMA mixtures, inducing covered aggregates by asphalt and asphalt mastic [26]. The sample interval of the measured profiles, taking a point every 9.525 µm, would also ignore some asperities of the micro-texture. A larger error of L for both AC-13C and SMA-13C is observed. This may be caused by the fact that each measurement position is limited for the LTS and significant fluctuations exhibits. The error bar is based on results tested on three measurement positions for the same specimen.

4.1.4. Texture Spectral Analysis for Different Mixtures

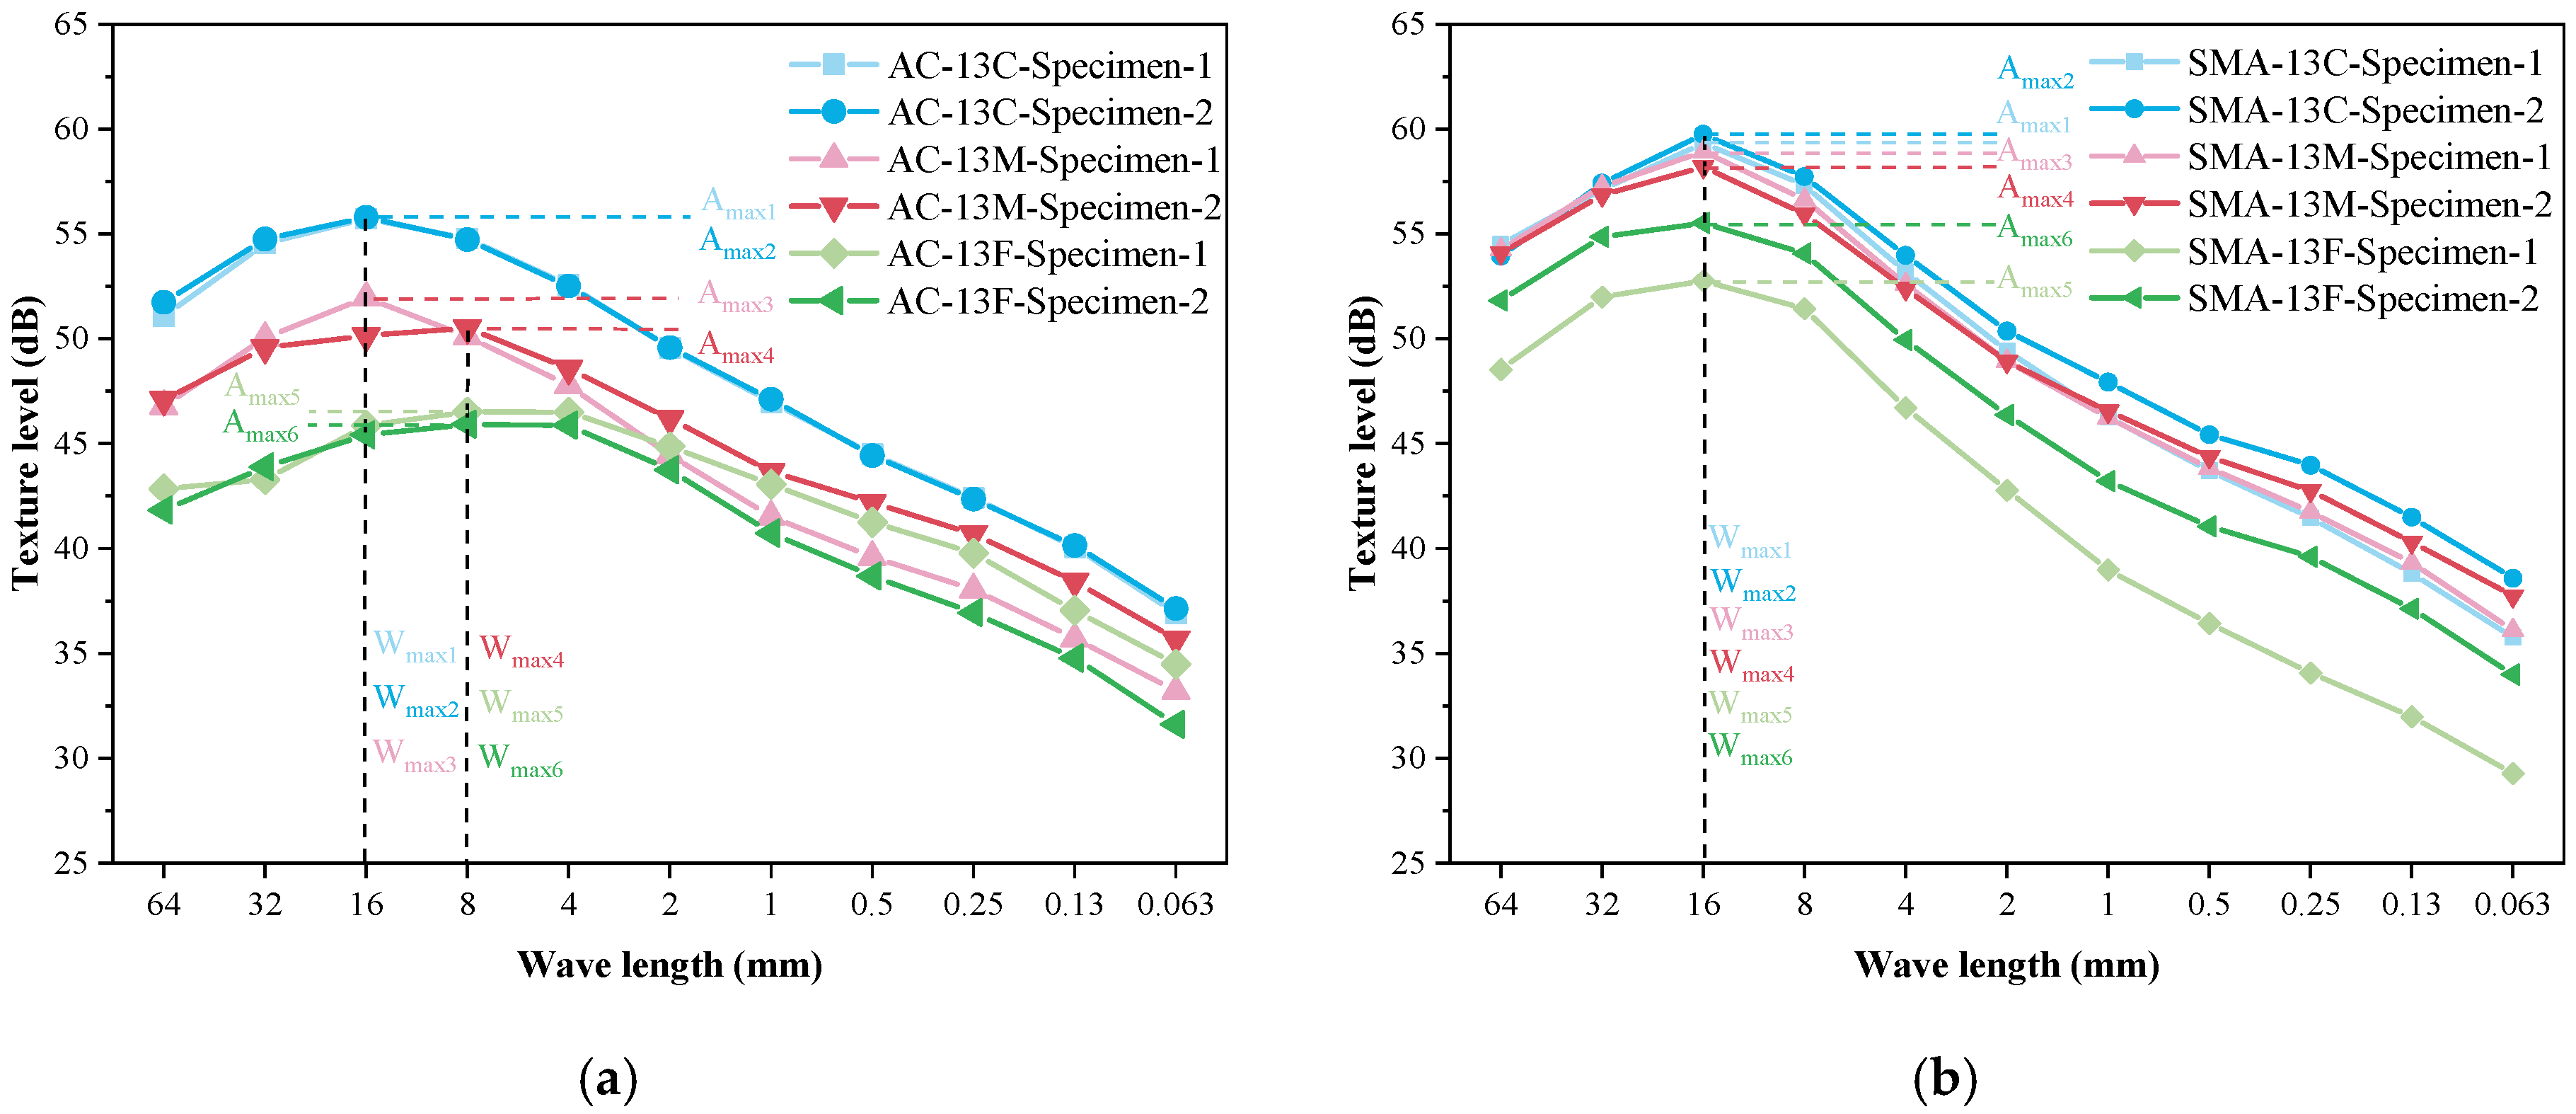
Texture spectral analysis is a powerful tool for characterizing both the asperity amplitude and distribution. Texture spectrums for AC and SMA mixtures are shown in Figure 8a,b respectively. Figure 8 demonstrates that texture levels corresponding to wavelengths longer than 4 mm are generally greater that shorter than 4 mm. This is consistent with the variance results that the variance of long macro-texture with wavelengths larger than 5 mm predominates in the texture variances for the two types of mixtures. In general, texture levels at each wavelength for SMA is greater than AC for coarse and middle gradation. This is also generally consistent with the elevation variance results. For the fine gradation, the texture levels corresponding to wavelengths greater than 8 mm for SMA mixtures is greater than AC mixtures, while a contrary trend exhibits for wavelengths shorter than 8 mm. This is because the aggregates are covered by the asphalt mastic due to high contents of asphalt and fillers in SMA mixtures.
For texture distributions characterized by texture spectrums, it can be analyzed from the maximum texture level Amax, corresponding wavelength Wmax, and the general trend. From Figure 8a,b, it can be found that the texture levels for coarse, middle and fine gradations are overall in a descending order in texture spectrums. The maximum texture level Amax is also in a descending order among the three gradations. For example, the Amax1 and Amax2 for coarse gradation in Figure 8a is the greatest, followed by Amax3 and Amax4 for middle gradation, and Amax5 and Amax6 for fine gradation. For the wavelength Wmax the maximum texture level corresponds to, there exhibits a trend that the Wmax shifts to a shorter wavelength when the gradation changes from coarse gradation to middle and fine gradations. For example, the Wmax1 and Wmax2 for coarse gradation and Wmax3 for middle gradation are 16 mm, while the Wmax4 for middle gradation, and Wmax5 and Wmax6 for fine gradation are 8 mm. Similar trends can be found for Amax for SMA mixtures in the Figure 8b.

4.2. Prediction of BPN from Road Surface Texture

4.2.1. BPN and Its Linear Regression with a Single Road Surface Index

BPN is employed to characterize the low-speed skid resistance. It is often regarded as a surrogate for pavement surface micro-texture. BPN results for the two types of asphalt mixtures, AC and SMA, are shown in Figure 9. From Figure 9a,b, it can be found that the BPN of AC is generally larger than SMA. This trend is even more evident for each gradation. For example, the BPN is significantly larger than SMA for coarse gradation, and similar trends are found for middle and fine gradations. This may be attributed to the larger contact areas between the rubber slider of BPT and the test specimen. Positive correlation between contact areas and BPN exhibits, which has been demonstrated by previous research [42,43].
In order to find a simple way to estimate BPN from road surface texture, which are obtained more easily due to laser scanning, a multiple linear regression between BPN and pavement surface texture was attempted. In order to achieve this, among the two texture depth evaluation indexes MTD and MPD, only MPD was included since a significant linear correlation between them was observed and MPD showed smaller error, as describe in Section 4.1.1. For texture spectrums, texture levels corresponding to micro-texture wavelengths LTX,0.06→0.5 and macro-texture wavelengths LTX,0.5→32 were included. Linear regression was conducted between BPN and MPD, RMS, elevation variances with three wavelength ranges (i.e., L, S and M), LTX,0.06→0.5 and LTX,0.5→32 respectively based on only one parameter. The results are shown in Table 1.
Table 1 shows that it is difficult to establish an excellent linear correlation between BPN and surface texture based on only on texture parameter since the correlation coefficient R2 in Table 1 are generally lower than 0.30. This is consistent with previous research that the relation between single road surface texture indicator and BPN is generally poor [20,21]. This implies that it is not feasible to estimate BPN using single surface texture indicator. When investigating the statistical prediction model of BPN from road surface texture, multiple linear analysis, especially including macro- and micro-texture, should be noted. This is consistent with previous descriptions when predicting BPN from surface texture in a thesis [35].

4.2.2. Relation Establishing Between Road Surface and BPN

In order to better analyze the relation between BPN and road surface texture, Pearson correlation coefficient calculation was conducted on indexes mentioned in Table 1 for the two types of mixtures, AC-13 and SMA-13, with each mixture of three gradations, coarse, middle and fine gradations. Totally, 36 groups of surface texture data were included. The results are shown Figure 10. The symbol * means that correlation coefficients are significant at the 0.05 level. By doing this, the Pearson correlation coefficients between each two indicators can be observed. From Figure 10, it can be seen that the influence of elevation variance L, MPD, RMS and LTX,0.5→32 on BPN is statistically significant at the 0.05 confidence level when the Pearson correlation coefficient is calculated on indicators for AC-13 and SMA-13 mixtures. It can be also found that MPD, RMS and LTX,0.5→32 have large correlation coefficients with the elevation variance L, S and M. The majority of road surface texture indices are correlated. This shows that when conducting the multiple linear regression analysis, it is noteworthy that texture collinearity may exist. An interesting result is that BPN is not affected by LTX,0.06→0.5 statistically significantly while the LTX,0.5→32 was statistically significantly for AC-13 and SMA-13 asphalt mixtures. This is different from the findings by Zuñiga Garcia [35] that the BPT is significantly affected by both macro- and micro-texture. Further research is still needed about the effect of surface texture on BPN by establishing the correlation between BPN and different surface texture indicators.
In order to quantitatively correlate BPN and road surface texture, multiple linear regression analysis was conducted based on 36 groups of surface texture indices and BPN mensurated on 12 specimens fabricated in the laboratory. In the multiple linear regression analysis, the MPD, elevation variances L, S and M, RMS, texture levels corresponding to different wavelengths, texture level corresponding to micro-texture LTX,0.06→0.5 and texture level corresponding to macro-texture LTX,0.5→32 were included as independent variables and BPN was regarded as the dependent variable. In the regression process, the stepwise method was employed with a stepping method criteria of probability of F lower than or equal to 0.05 to enter and probability of F higher than or equal to 0.1 to remove. In this way, variables that were correlated with BPN were entered to the regression model with unnecessary parameters eliminated from the regression model. At the same time, in order to avoid correlation effects of texture indices themselves when analyzing the relationship between the road surface texture and BPN, collinearity statistics was also conducted, which were characterized by the tolerance and variance inflation factor (VIF). The VIF is the inverse of the tolerance. The VIF is considered when considering the multicollinearity. When the VIF is smaller than 10, it is thought that there is no multicollinearity. When the VIF is among the range from 10 to 100, it is considered that there is weak multicollinearity. When the VIF is among the range from 100 to 1000, there is moderate multicollinearity. When the VIF is greater than 1000, there is strong multicollinearity. The residual error was considered by the Durbin-Watson values. When the Durbin-Watson value is among the range from 1.5 to 2.5, it is considered that the residual error is independent, which ensures the robustness. The multiple linear regression results and potential models are shown in Table 2. This was determined by considering the multiple linear regression analysis results R2, multicollinearity conditions charactered by VIF, residual error conditions evaluated by Durbin-Watson and physical meanings, which are all shown in Table 2. From Table 2, it can be seen that all the Durbin-Watson values are among the range from 1.5 to 2.5, showing a good robustness to some degree, and the collinearity statistics in Table 2 is acceptable with the maximum VIF of 12.501. The R2 of regression results of AC and SMA varies from 0.497 to 0.684, with the 0.684 a little greater than that of 0.649 in the document [35]. At the same time, the regression result also seems reasonable from physical meanings. No.1 model indicates that short macro-texture with wavelength 0.5 mm to 5 mm affects the BPN. Compared with No.2 model, the R2 of No. 3 and No. 4 model is greater. The two models also demonstrates that BPN is affected by the surface texture at wavelengths of 64 mm and 2mm and the micro- texture, especially for the texture at a wavelength of 0.25 mm.

4.2.3. Verification of the Skid Resistance Prediction

In order to verify the statistical prediction model of BPN, another two AC specimens (totally 6 data sets) with a different gradation were fabricated in the laboratory to verify the regression results. They were not included during the model establishment process but were tested using the same methods as AC and SMA with coarse, middle and fine aggregate gradations. The verification results are shown in Table 3 by comparing the predicted and measured BPN. In T 0964-2008 specified in Chinese specification JTG 3450-2019 [30], BPT test should be conducted again when the range of the five values in a test is beyond 3. For No. 1 and No. 2 model, all the deviations meet with the requirements. For No.3 and No.4 models, most of the deviations meet with the requirements with exceptions of 4 and 5. So the deviations are thought to be generally acceptable. In No. 3 and No. 4 models, texture indicators including information on texture levels corresponding to 64 mm and 2 mm, and micro-texture, which can better explain the model from physical meaning. The establishment of the correlation model between the surface texture and BPN, and the verification are all based on specimens fabricated in the laboratory.

5. Summary and Conclusions

In this research, the surface texture for two types of asphalt mixtures, AC and SMA, were evaluated comprehensively by texture depth, RMS, variances corresponding to different wavebands and spectral analysis. Based on this, the low-speed skid resistance BPN was predicted by a single texture index and multiple linear regression analysis using the stepwise method. Based on the research results and analysis, the following conclusions could be drawn:
(1) The relation between MPD and MTD indicates that the two texture depth indicators are linearly correlated with a correlation coefficient R2 of up to 0.9348. Corresponding coefficients are generally consistent with previous research. MPD can be employed to characterize the texture depth due to convenient and accurate acquisition by laser scanning.
(2) RMS of AC mixture is generally smaller than SMA for the same type of gradation, including coarse, middle and fine gradation. RMS for the same type of mixtures with coarse, middle and fine gradation is in a descending order. The above-mentioned laws are similar with MTD and MPD. This demonstrates that RMS is also correlated with texture depth indicators and collinearity should be not ignored while conducting multiple linear regression. Collinearity between the RMS and MPD can also be found in linear regression results that MPD and RMS are not both included in a regression equation.
(3) Elevation variances with different wavebands for AC and SMA mixtures demonstrate that the variance of macro-texture with long wavelengths, from 5 mm to 50 mm dominates the total variance. The result is consistent with texture spectral analysis, in which texture levels is larger when the wavelength is beyond 4 mm.
(4) Pearson correlation coefficients for different surface texture indexes indicate that many of the road surface texture indicators are correlated. This shows that when conducting the multiple linear regression analysis and other related researches, it is noteworthy that texture collinearity may exist.
(5) Linear regression between the BPN and a single road surface texture index indicates that it is not feasible to estimate the skid resistance using one single texture index. The multiple linear regression was conducted. Four potential models are recommended considering robustness from R2, VIF, Durbin-Watson value and physical meanings. The R2 varies from 0.497 to 0.684. The regression results indicate that BPN is affected significantly by texture at a wavelength of to 64 mm, 2 mm, and micro-texture.
In this research, the R2 of the regression results are still needed to be improved. Due to limited number of data sets for each mixture type, the regression analysis is based on AC and SMA fabricated in the laboratory. Further research will be conducted on the correlation between the BPN and surface texture by a larger set of data considering the aggregate grading and surface types to bring to updated results, both in the laboratory and actual road sections.

Author Contributions

Conceptualization, W.R. and J.L.; methodology, W.R. and J.L.; software, W.R.; validation, J.L., Y.Z., X.W. and R.S.; formal analysis, W.R. and J.L.; investigation, W.R. and J.L.; resources, W.R.; data curation, W.R.; writing—original draft preparation, W.R., Y.Z., X.W. and R.S.; writing—review and editing, W.R., Y.Z., X.W. and R.S.; visualization, Y.Z., X.W. and R.S.; supervision, W.R.; project administration, W.R.; funding acquisition, W.R. and J.L. All authors have read and agreed to the published version of the manuscript.

Funding

This work was funded by the National Natural Science Foundation of China [Grant No. 52108391]; the Pyramid Talent Training Project of Beijing University of Civil Engineering and Architecture [Grant No. JDYC20220810]; the National Environmental Protection Engineering and Technology Center for Road Traffic Noise Control [Grant No. F20231080]; the Beijing Natural Science Foundation [Grant No. 8222014]; and the Project of Construction and Support for High-level Innovative Teams of Beijing Municipal Institutions [Grant No. BPHR20220109] and the Research Project of Beijing Municipal Commission of Education [Grant No. KM202110016011].

Institutional Review Board Statement

Not applicable.

Informed Consent Statement

Not applicable.

Data Availability Statement

All data, models, and codes generated or used in this study are included in the submitted manuscript.

Conflicts of Interest

The authors declare no conflicts of interest.

References

  1. Najafi, S.; Flintsch, G.W.; Medina, A. Linking roadway crashes and tire–pavement friction: A case study. Int. J. Pavement Eng. 2017, 18, 119–127. [Google Scholar] [CrossRef]
  2. Kumar, A.; Tang, T.; Gupta, A.; Anupam, K. A state-of-the-art review of measurement and modelling of skid resistance: The perspective of developing nation. Case Stud. Constr. Mater. 2023, 18, e02126. [Google Scholar] [CrossRef]
  3. Mataei, B.; Zakeri, H.; Zahedi, M.; Nejad, F.M. Pavement friction and skid resistance measurement methods: A literature review. Open J. Civ. Eng. 2016, 6, 537–565. [Google Scholar] [CrossRef]
  4. Rasol, M.; Schmidt, F.; Ientile, S.; Adelaide, L.; Nedjar, B.; Kane, M.; Chevalier, C. Progress and monitoring opportunities of skid resistance in road transport: A critical review and road sensors. Remote Sens. 2021, 13, 3729. [Google Scholar] [CrossRef]
  5. Taher, M.; Aman, M.; Bujang, H. The effect of aggregate micro and macro texture on pavement skid resistance of Malaysia road network. IOP Conf. Ser. Earth Environ. Sci. 2024, 1347, 012054. [Google Scholar] [CrossRef]
  6. Serigos, P.A.; De Fortier Smit, A.; Prozzi, J.A. Incorporating surface microtexture in the prediction of skid resistance of flexible pavements. Transp. Res. Rec. 2014, 2457, 105–113. [Google Scholar] [CrossRef]
  7. Yu, M.; You, Z.; Wu, G.; Kong, L.; Liu, C.; Gao, J. Measurement and modeling of skid resistance of asphalt pavement: A review. Constr. Build. Mater. 2020, 260, 119878. [Google Scholar] [CrossRef]
  8. Yang, Y.; Zhu, X.; Jelagin, D.; Guarin, A.; Steyn, W.J. Numerical analysis concerning the skid resistance of rubber-contaminated runway grooves. Tribol. Int. 2021, 163, 107157. [Google Scholar] [CrossRef]
  9. Zhang, L.; Wang, R.; Zhou, H.; Wang, G. Estimation of the friction behaviour of rubber on wet rough road, and its application to tyre wet skid resistance, using numerical simulation. Symmetry 2022, 14, 2541. [Google Scholar] [CrossRef]
  10. ISO 13473-1:2019; Characterization of Pavement Texture by Use of Surface Profiles—Part 1: Mean Profile Depth. International Standards Organization (ISO): Geneva, Switzerland, 2019.
  11. Permanent International Association of Road Congresses (PIARC). Report of the committee on surface characteristics. In Proceedings of the XVIII World Road Congress, Brussels, Belgium, 13–19 September 1987. [Google Scholar]
  12. Snyder, M.B. Current Perspectives on Pavement Surface Characteristics. In R&T Update: Concrete Pavement Research and Technology; 2007; Available online: http://overlays.acpa.org/Downloads/RT/RT%208.02%20Current%20Perspectives%20on%20Pavement%20Surface%20Characteristics.pdf (accessed on 24 October 2024).
  13. Chen, S.; Liu, X.; Luo, H.; Yu, J.; Chen, F.; Zhang, Y.; Ma, T.; Huang, X. A state-of-the-art review of asphalt pavement surface texture and its measurement techniques. J. Road Eng. 2022, 2, 156–180. [Google Scholar] [CrossRef]
  14. Ji, J.; Jiang, T.; Ren, W.; Dong, Y.; Hou, Y.; Li, H. Precise characterization of macro-texture and its correlation with anti-skidding performance of pavement. J. Test. Eval. 2022, 50, 1934–1946. [Google Scholar] [CrossRef]
  15. ISO/TS 13473-4:2008; Characterization of Pavement Texture by Use of Surface Profiles–Part 4: Spectral Analysis of Surface Profiles. International Standards Organization (ISO): Geneva, Switzerland, 2008.
  16. Kanafi, M.M.; Kuosmanen, A.; Pellinen, T.K.; Tuononen, A.J. Macro- and micro-texture evolution of road pavements and correlation with friction. Int. J. Pavement Eng. 2015, 16, 168–179. [Google Scholar] [CrossRef]
  17. Miller, T.; Swiertz, D.; Tashman, L.; Tabatabaee, N.; Bahia, H.U. Characterization of asphalt pavement surface texture. Transp. Res. Rec. J. Res. Board 2012, 2295, 19–26. [Google Scholar] [CrossRef]
  18. Xiao, S.; Li, M.; Chen, B.; Zhou, X.; Xi, C.; Tan, Y. Understanding the pavement texture evolution of RIOH Track using multi-scale and spatiotemporal analysis. Tribol. Int. 2023, 184, 108492. [Google Scholar] [CrossRef]
  19. Xiao, S.; Zhou, X.; Tan, Y.; Li, J. Spatiotemporal evolution analysis of pavement texture depth on RIOH track using statistical and rescaled range approaches. Constr. Build. Mater. 2022, 338, 127560. [Google Scholar] [CrossRef]
  20. Rezaei, A.; Masad, E. Experimental-based model for predicting the skid resistance of asphalt pavements. Int. J. Pavement Eng. 2013, 14, 24–35. [Google Scholar] [CrossRef]
  21. Do, M.T.; Cerezo, V.; Ropert, C. Questioning the approach to predict the evolution of tire/road friction with traffic from road surface texture. Surf. Topogr. Metrol. Prop. 2020, 8, 024004. [Google Scholar] [CrossRef]
  22. Pomoni, M.; Plati, C.; Loizos, A.; Yannis, G. Investigation of pavement skid resistance and macrotexture on a long-term basis. Int. J. Pavement Eng. 2020, 23, 1060–1069. [Google Scholar] [CrossRef]
  23. Li, Q.J.; Zhan, Y.; Yang, G.; Wang, K.C. Pavement skid resistance as a function of pavement surface and aggregate texture properties. Int. J. Pavement Eng. 2020, 21, 1159–1169. [Google Scholar] [CrossRef]
  24. Li, P.; Yi, K.; Yu, H.; Xiong, J.; Xu, R. Effect of aggregate properties on long-term skid resistance of asphalt mixture. J. Mater. Civ. Eng. 2021, 33, 04020413. [Google Scholar] [CrossRef]
  25. Ergin, B.; Gökalp, İ.; Uz, V.E. Effect of aggregate microtexture losses on skid resistance: Laboratory-based assessment on chip seals. J. Mater. Civ. Eng. 2020, 32, 04020040. [Google Scholar] [CrossRef]
  26. Kane, M.; Edmondson, V. Modelling the bitumen scour effect: Enhancement of a dynamic friction model to predict the skid resistance of rubber upon asphalt pavement surfaces subjected to wear by traffic polishing. Wear 2018, 400, 100–110. [Google Scholar] [CrossRef]
  27. Vaiana, R.; Capiluppi, G.F.; Gallelli, V.; Iuele, T.; Minani, V. Pavement surface performances evolution: An experimental application. Procedia Social Behav. Sci. 2012, 53, 1149–1160. [Google Scholar] [CrossRef]
  28. ASTM E1911-19:2019; Standard Test Method for Measuring Surface Frictional Properties Using the Dynamic Friction Tester. ASTM International: West Conshohocken, PA, USA, 2019.
  29. ASTM E303-22:2022; Standard Test Method for Measuring Surface Frictional Properties Using the British Pendulum Tester. ASTM International: West Conshohocken, PA, USA, 2022.
  30. JTG 3450-2019:2019; Field Test Methods of Highway Subgrade and Pavement. China Communications Press Co., Ltd.: Beijing, China, 2019.
  31. Hall, J.; Smith, K.; Titus-Glover, T.; Wambold, J.; Yager, T.; Rado, Z. Guide for Pavement Friction; National Cooperative Highway Research Program (NCHRP) Project 01-43, Transportation Research Board of the National Academies: Washington, DC, USA, 2009. [Google Scholar]
  32. Xiao, S.; Sun, Z.; Tan, Y.; Li, J.; Lv, H. Hysteresis friction modelling of BPT considering rubber penetration depth into road surface. Int. J. Pavement Eng. 2023, 24, 2027415. [Google Scholar] [CrossRef]
  33. Leukel, J.; Scheurer, L.; Sugumaran, V. Machine learning models for predicting physical properties in asphalt road construction: A systematic review. Constr. Build. Mater. 2024, 440, 137397. [Google Scholar] [CrossRef]
  34. Jamhiri, B.; Jalal, F.E.; Chen, Y. Hybridizing multivariate robust regression analyses with growth forecast in evaluation of shear strength of zeolite–alkali activated sands. Multiscale Multidiscip. Model. Exp. Des. 2022, 5, 317–335. [Google Scholar] [CrossRef]
  35. Zuñiga Garcia, N. Predicting Friction with Improved Texture Characterization. Master’s Thesis, The University of Texas at Austin, Austin, TX, USA, 2017. [Google Scholar]
  36. Ji, J.; Ren, W.; Jiang, T.; Dong, Y.; Hou, Y.; Li, H. Establishment and Analysis of the Relationship Model between Macro-Texture and Skid Resistance Performance of Asphalt Pavement. Coatings 2022, 12, 1464. [Google Scholar] [CrossRef]
  37. JTG F40-2004:2004; Technical Specifications for Construction of Highway Asphalt Pavements. China Communications Press Co., Ltd.: Beijing, China, 2004.
  38. Ren, W.; Han, S.; He, Z.; Li, J.; Wu, S. Development and testing of a multivariable accelerated abrasion machine to characterize the polishing wear of pavement by tires. Surf. Topogr. Metrol. Prop. 2019, 7, 035006. [Google Scholar] [CrossRef]
  39. ASTM E965-15:2019; Standard Test Method for Measuring Pavement Macrotexture Depth Using a Volumetric Technique. ASTM International: West Conshohocken, PA, USA, 2019.
  40. Ren, W. Study on the Abrasion Characteristic of Surface Texture and Its Effect on Noise for Asphalt Pavements. Ph.D. Thesis, Chang’an University, Xi’an, China, 2019. [Google Scholar]
  41. ISO 13473-2:2002; Characterization of Pavement Texture by Use of Surface Profiles-Terminology and Basic Requirements Related to Pavement Texture Profile Analysis. International Standards Organization (ISO): Geneva, Switzerland, 2002.
  42. Fwa, T.; Choo, Y.; Liu, Y. Effect of aggregate spacing on skid resistance of asphalt pavement. J. Transp. Eng. 2003, 129, 420–426. [Google Scholar] [CrossRef]
  43. Lee, Y.P.K.; Fwa, T.F.; Choo, Y.S. Effect of pavement surface texture on British pendulum test. J. East. Asia Soc. Transp. Stud. 2005, 6, 1247–1257. [Google Scholar] [CrossRef]
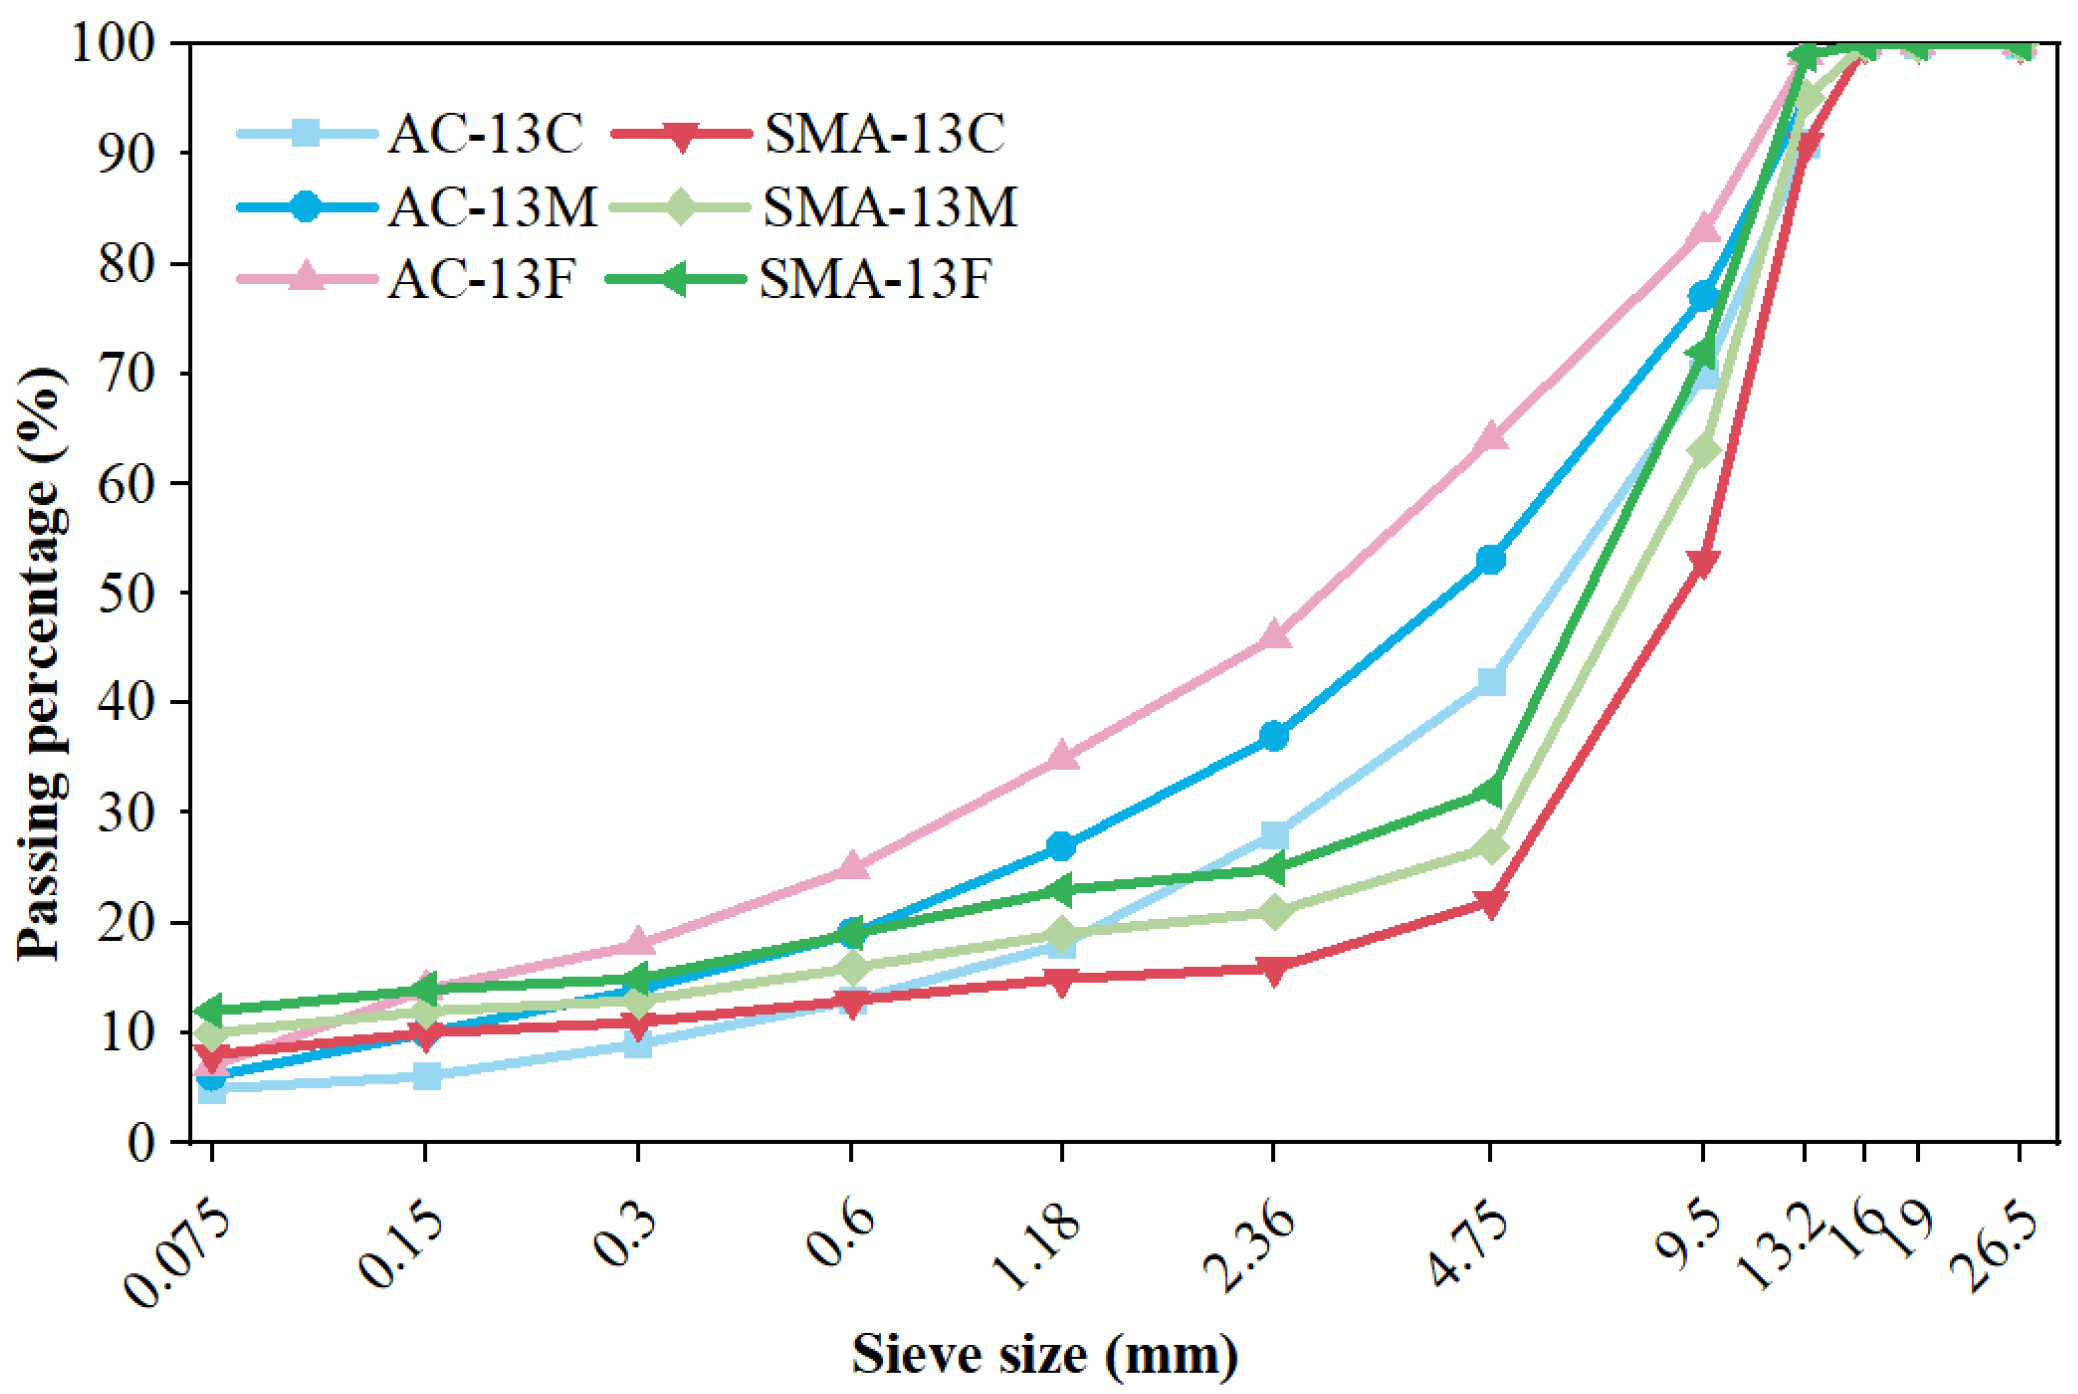
Figure 1. Gradation compositions of the two types of mixtures, AC-13 and SMA-13.
Coatings 14 01367 g001
Figure 2. Measurement devices and test positions. (a) Sand Patch Test; (b) Laser Texture Scanner; (c) British Pendulum Tester; (d) The diagram of test positions.
Coatings 14 01367 g002
Figure 3. The scanned surfaces of SMA slab. (a) Before outlier treatment; (b) After outlier treatment.
Coatings 14 01367 g003
Figure 4. Mean Texture Depth (MTD) and Mean Profile Depth (MPD) of the two types of asphalt mixtures with different gradations. (a) Asphalt Concrete (AC); (b) Stone Mastic Asphalt (SMA).
Coatings 14 01367 g004
Figure 5. The linear regression between the Mean Profile Depth (MPD) and Mean Texture Depth (MTD).
Coatings 14 01367 g005
Figure 6. Root Mean Square (RMS) for the two types of asphalt mixtures. (a) Asphalt Concrete (AC); (b) Stone Mastic Asphalt (SMA).
Coatings 14 01367 g006
Figure 7. Variances of two types of asphalt mixtures with different wavebands. (a) Asphalt Concrete (AC); (b) Stone Mastic Asphalt (SMA).
Coatings 14 01367 g007
Figure 8. Texture spectrums of the two types of asphalt mixtures. (a) Asphalt Concrete (AC); (b) Stone Mastic Asphalt (SMA).
Coatings 14 01367 g008
Figure 9. BPN results of the two types of asphalt mixtures. (a) Asphalt Concrete (AC); (b) Stone Mastic Asphalt (SMA).
Coatings 14 01367 g009
Figure 10. Pearson correlation coefficients between different indices for AC and SMA mixtures.
Coatings 14 01367 g010
Table 1. Linear regression between BPN and different surface texture indicators.
Surface IndicatorsLinear Regression EquationCorrelation Coefficient R2
Elevation variance LBPN = −2.443 × L + 55.2970.259
Elevation variance SBPN = −6.230 × S + 54.2340.05
Elevation variance MBPN = −20.769 × M + 53.6300.017
MPDBPN = −3.704 × MPD + 58.1170.309
RMSBPN = −4.006 × RMS + 57.3210.239
LTX,0.06→0.5BPN = 0.027 × LTX,0.06→0.5 + 51.6270.001
LTX,0.5→32BPN = −0.434 × LTX,0.5→32 + 78.6190.232
Table 2. Multiple linear regression results.
Model No.Linear Regression Equation R2VIFDurbin-Watson
No. 1BPN = 21.848 × S − 8.043 × MPD + 59.4600.4973.261/3.2611.705
No. 2BPN = −0.935 × LTX,64 + 0.997 × LTX,2 + 52.5500.6142.220/2.2201.623
No. 3BPN = −1.114 × LTX,64 + 1.97 × LTX,2 − 0.678 × LTX,0.25 + 42.7650.6703.089/12.501/7.7191.623
No. 4BPN = −0.99 × LTX,64 + 1.71 × LTX,2 − 92.464 × M + 25.2140.6842.287/6.685/4.7222.012
Table 3. Comparison of predicted and tested BPN.
MeasurementPredicted BPN by Different ModelsMeasured BPNDeviations for Different Models
No. 1 No. 2 No. 3 No. 4No. 1 No. 2 No. 3 No. 4
1 54555555562 1 1 1
254535351562 3 35
353535354530 0 0 1
455525251550 3 3 4
553535353503 3 3 3
655565857541 2 4 3
Disclaimer/Publisher’s Note: The statements, opinions and data contained in all publications are solely those of the individual author(s) and contributor(s) and not of MDPI and/or the editor(s). MDPI and/or the editor(s) disclaim responsibility for any injury to people or property resulting from any ideas, methods, instructions or products referred to in the content.