Abstract
Laser cladding has unique technical advantages, such as precise heat input control, excellent coating properties, and local selective cladding for complex shape parts, which is a vital branch of surface engineering. During the laser cladding process, the parts are subjected to extreme thermal gradients, leading to the formation of micro-defects such as cracks, pores, and segregation. These defects compromise the serviceability of the components. Ultrasonic vibration can produce thermal, mechanical, cavitation, and acoustic flow effects in the melt pool, which can comprehensively affect the formation and evolution for the microstructure of the melt pool and reduce the microscopic defects of the cladding layer. In this paper, the coupling model of temperature and flow field for the laser cladding of 45 steel 316L was established. The transient evolution laws of temperature and flow field under ultrasonic vibration were revealed from a macroscopic point of view. Based on the phase field method, a numerical model of dendrite growth during laser cladding solidification under ultrasonic vibration was established. The mechanism of the effect of ultrasonic vibration on the solidification dendrite growth during laser cladding was revealed on a mesoscopic scale. Based on the microstructure evolution model of the paste region in the scanning direction of the cladding pool, the effects of a static flow field and acoustic flow on dendrite growth were investigated. The results show that the melt flow changes the heat and mass transfer behaviors at the solidification interface, concurrently changing the dendrites’ growth morphology. The acoustic streaming effect increases the flow velocity of the melt pool, which increases the tilt angle of the dendrites to the flow-on side and promotes the growth of secondary dendrite arms on the flow-on side. It improves the solute distribution in the melt pool and reduces elemental segregation.
1. Introduction
Laser cladding is an emerging surface repair technology which adds high-performance materials to the substrate surface [1,2]. With the thermal effect generated by the high-energy-density laser beam, the added material and the substrate material are rapidly melted to achieve metallurgical bonding between the two. Laser cladding can significantly improve the substrate surface properties, including hardness, wear resistance, high temperature stability, and corrosion resistance. Coaxial powder feeding laser cladding has the advantages of unlimited forming size, high flexibility, wide material selectivity, and easy automation. In this paper, the coaxial powder feeding laser cladding method was used in the study, and the schematic is shown in Figure 1.
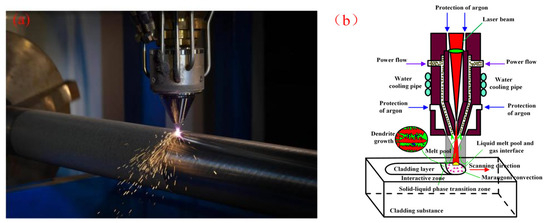
Figure 1.
Coaxial laser cladding: (a) physical drawings for laser cladding and (b) schematic of laser cladding process.
During the laser cladding process, there are extremely hot and cold characteristics, and a high energy density produces rapid temperature change rates. Micro-defects such as cracks, pores, and tissue segregation are produced, which affect the serviceability of the parts [3,4]. To further improve the defects and properties for the laser cladding layer, ultrasonic vibration-assisted laser cladding has become the focus of current research. Ultrasonic vibration can produce thermal, mechanical, cavitation, and acoustic flow effects in the melt pool, which comprehensively affect the formation and evolution of the microstructure and reduce the microscopic defects of the cladding layer [5,6,7,8]. Introducing ultrasonic vibration into the laser cladding process has important research significance and application value for improving the cladding layer quality and optimizing its performance.
Zhuang et al. [9] prepared a 316L cladding layer on a Q345 steel substrate surface and investigated the effect of ultrasonic vibration on the organization of the 316L cladding layer. The results showed that ultrasonic vibration can improve the macroforming quality of the cladding layer and can also significantly refine the cladding layer grain. The average grain size of the cladding layer was reduced by about 42% under the optimum parameters. Song H et al. [10] prepared laser-melted iron-based crystalline/amorphous composite cladding layers with and without ultrasonic vibration. The effect of ultrasonic vibration on the organization evolution of the cladding layer was observed by scanning electron microscopy. The results showed that the amorphous phase content of the fused cladding layer with ultrasonic vibration was increased, the growth of columnar crystals at the interface was suppressed, and the transformation of columnar crystals to equiaxed crystals was promoted along with the refinement of grains. Ma et al. [11] prepared yttria-stabilized zirconia-fused cladding layers on titanium alloy substrates using ultrasonic vibration-assisted laser cladding. The organization of the cladding layer was characterized by scanning electron microscopy. The results showed that ultrasonic vibration could improve the wettability of the cladding layer with the substrate. It reduces the grain size and makes the band structure in the fused cladding layer broken and dispersed. Geng et al. [12] used a phase field model of microstructure evolution in the solidification process of the laser cladding melt pool. The growth process of dendrites at the bottom of the cladding layer of an aluminum–copper alloy was simulated in the arc welding additive manufacturing process. It was found that the growth process of dendrites consists of a linear growth stage, a competitive growth stage, and a stabilization stage. Wu et al. [13] used a phase field model of microstructure evolution in the solidification process of a laser additive manufacturing melt pool. The solidification process of dendrites in additively manufactured Ti-6Al-4V alloys was simulated. It was found that the larger the temperature gradient, scanning velocity, and cooling rate, the smaller the dendrite spacing and the faster the dendrite growth rate. The simulated dendrite morphology and dendrite spacing are in good agreement with the experimental results. Zhang et al. [14] used the phase field model of microstructure evolution during the solidification process in a molten pool. The organizational evolution of the selective laser melting of titanium alloys was investigated. It was found that the dendrites grew along the direction of heat flow. Microsegregation can be observed during the formation of dendrites. The solute enrichment phenomenon exists near the dendrite tip and between the dendrite arms. The temperature gradient and scanning velocity are inversely related to the main dendrite spacing. Sun et al. [15] conducted a two-dimensional coupling simulation of the macroscopic temperature field and the microscopic tissue growth at the bottom of the melt pool during the laser cladding of pure nickel coaxial powder feed. The phase field method was used to calculate the coupling of the phase field and temperature field in the microscopic region, and the microstructure morphology was obtained. The results showed that the growth direction of the microstructure at the bottom of the melt pool is from the bottom to the top of the melt pool, which is slightly biased towards the laser scanning direction and the competition between the microstructures, which is basically parallel to the direction of heat flow. Li et al. [16] studied the influence of ultrasonic vibration on the fluidity and microstructure for aluminum alloys. The results showed that a sufficient intensity of ultrasonic vibration would cause melt turbulence and destroy the growth of α-Al dendrites, thus achieving the purpose of improving the fluidity. Lian et al. synthesized a Nb-C-reinforced phase in situ on a Ni substrate by ultrasonic vibration-assisted laser cladding and found that ultrasonic vibration could significantly reduce the grain size of the coating without changing the coating phase composition, thus making the coating microstructure finer and more uniform [17]. Lv et al. conducted an experimental analysis on the IN178/WC composite coating with applied ultrasonic vibration. The study showed that the effect of ultrasonic vibration could promote the uniform distribution of WC particles without changing the phase composition, thus improving the microhardness friction and wear properties for the coating [18].
Most of the current studies on ultrasonic-assisted laser cladding tend to use experimental analysis and macroscopic numerical simulations, which cannot directly reveal the dendrite evolution law of the laser cladding solidification process assisted by ultrasonic vibration. Also, it is difficult to quantify the mechanism of ultrasonic vibration assistance on the laser cladding process. In this paper, the mechanism of ultrasonic vibration on the laser cladding process was analyzed from a mesoscopic perspective for melt pool solidification. The effect of ultrasonic vibration and acoustic streaming on the microstructure of the melt pool was directly revealed. A theoretical foundation for optimizing the ultrasonic vibration-assisted laser cladding process was established.
2. Materials and Methodology
2.1. Material Parameterization for Laser Cladding
In this paper, 45 steel was selected as the substrate and 316L powder was selected as the cladding material. In the paper, the thermodynamic simulation software JMatPro 7.0, which is based on the calculated phase diagram method (CALPHAD), was first used to calculate the temperature change physical property parameters of the 45 steel and 316L powder materials. The elemental compositions of the 45 steel and 316L powder are listed in Table 1 and Table 2. Fully considering the influence of material physical properties by temperature change is crucial. The temperature change physical property parameter curves for 45 steel and 316L are shown in Figure 2. A 3D numerical model for the laser cladding process was established, and the growth boundary of the solidified microstructure was obtained. The influence of laser scanning velocity parameters on dendrite growth was studied, and the microstructure mechanism of laser scanning velocity and the influence of different scanning velocities on the laser cladding pool were further revealed.

Table 1.
Elemental composition of 45 steel (wt%).

Table 2.
Elemental composition of 316L powder (wt%).
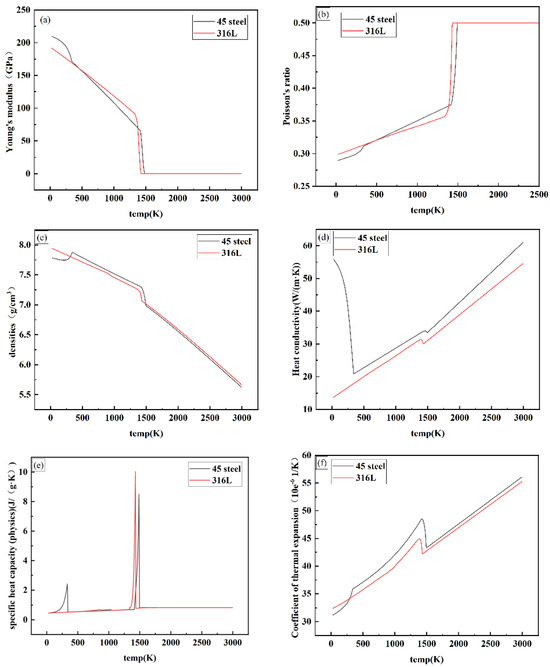
Figure 2.
Temperature change physical property parameter curves for 45 steel and 316L. (a) Young’s modulus for 45 steel and 316L; (b) Poisson’s ratio of 45 steel and 316L; (c) density of 45 steel and 316L; (d) heat conductivity of 45 steel and 316L; (e) specific heat capacity of 45 steel and 316L; (f) coefficient of thermal expansion for 45 steel and 316L.
2.2. Governing Equation for Laser Cladding
The cladding model was established to obtain the 3D model boundary morphology for the melt pool, the size of the paste zone, and the flow velocity in the melt pool. As shown in Figure 1b, the laser cladding powder feeding method adopts a coaxial powder feeding system, in which the powder is distributed around the laser beam in a multi-beam circumferential surrounding. The cladding head is provided with a protective gas (argon). To save time and reduce computational difficulty, basic physical assumptions and model formulas are used in this section to describe the formation of a monorail laser cladding pool [19].
The basic assumptions in the model are as follows:
- (1)
- The energy density of the laser heat source acting on the melt has a Gaussian distribution;
- (2)
- The fluid in the melt pool is an incompressible Newtonian fluid;
- (3)
- The melt metal flow in the melt pool is laminar;
- (4)
- The impact caused by momentum when the powder enters the melt pool is ignored;
- (5)
- The loss of heat dissipation caused by the high temperature of the melt is ignored;
- (6)
- The process of powder addition to the substrate follows a Gaussian distribution;
- (7)
- The absorption and reflection of the laser energy of the powder are linearly related to the amount of powder delivery.
The above assumptions were used as initial data and boundary conditions for solidification analysis, making the model more feasible. In this paper, based on the finite element method and finite volume method, a predictive cladding pool model is established. The heat–flow coupling can clearly reveal the evolution process of the melt pool. At the same time, the temperature field and the flow field are coupled to obtain the size and temperature gradient for the melt pool.
Considering the conservation equations of mass, momentum, and energy in the cladding process, the governing equation for the temperature field (Fourier’s law) is obtained as follows [20,21,22]:
where ρ is the melt density, Cp is the heat capacity at constant pressure, T is the temperature of the cladding process, u is the melt flow velocity, and k is the thermal conductivity.
The latent heat of the melt is considered, where ΔHT is the latent enthalpy and the equation is
where βL is the latent heat, fL is the mass fraction of the fluid, and fL is the function to judge the fluid, the equation of which is
where TS and TL represent the melt solid and liquidus temperatures, respectively. When fL is 0, it represents the solid phase; when fL is 1, it represents the liquid phase.
The melt flow in a melt pool follows hydrodynamics. According to the assumed conditions, the continuity equation and the Navier–Stokes momentum equation describing the fluid motion are expressed as follows:
where I is the spatial unit substrate, p is the melt pressure, and μL is the dynamic viscosity of the melt.
Melt flow is the main factor affecting the morphology of the melt pool. To better understand the flow state inside the melt pool, the parameter Marangoni number (Ma represents the ratio of thermal capillary force to viscous force) is selected for evaluation, and the equation is as follows:
where RL is the laser heat source radius, α0 is the thermal diffusion coefficient of the melt, and dσt/dT is the temperature gradient coefficient of the surface tension.
2.3. Ultrasonic Vibration Theory
Ultrasonic waves include sound waves with frequencies higher than 20 kHz and vibration waves in objects, which comprise not only a wave mode but also a form of energy transfer [23,24]. There are two main forms of ultrasound, namely power ultrasound and detection ultrasound. In this paper, power ultrasound is selected, which is a kind of ultrasound with high intensity, and its energy can change the structure and properties of the medium during the transfer process [25,26]. In an elastic medium, power ultrasound causes periodic changes for sound pressure and stress in the medium [27,28]. With the vibration, some of the energy is released in the form of internal energy, resulting in secondary effects such as acoustic flow effects and cavitation effects in a solution and mechanical and thermal effects in solids. Power ultrasound is used in a wide range of industries, including ultrasonic rust removal, ultrasonic brazing, ultrasonic cutting, ultrasonic assisted-casting, and other processes [29,30,31,32].
The introduction of ultrasonic vibration is to input an electrical signal through an ultrasonic generator and transform the electrical signal into a mechanical vibration of high-frequency particles through an ultrasonic transducer. This is then reinforced by an amplitude transformer and transmitted to the substrate and metal melt pool [33]. What actually affects the melt pool is the ultrasonic sound field. The ultrasonic vibration equation is
where X1 is the displacement of the vibration point of the horn, A is the ultrasonic amplitude, ω is the angular frequency of particle vibration, and φ is the sinusoidal phase angle.
Ultrasonic power and sound intensity are used to measure the energy intensity of sound waves. Power is the total energy passing through a surface per unit of time and is affected by attenuation. The sound intensity represents the energy concentrated in a unit area per unit of time. For a melt pool subjected to ultrasonic vibration, the sound intensity is expressed as follows:
where c0 is the ultrasonic propagation velocity in the melt and ρL is the medium density.
The sound pressure amplitude is
2.4. Acoustic Streaming Effect
When there is strong sound wave propagation in the medium solution, there is often a non-periodic flow, which is called acoustic streaming. The phenomenon of acoustic streaming was first discovered by experimental phenomena. Michael Faraday [34] studied the air vibration phenomenon around an elastic plate under high-velocity vibration and considered the relationship between the motion state of the surrounding air and the vibration. Subsequently, in an experiment, Dvorak found that under a strong amplitude vibration, a small average flow from the amplitude peak to trough would be generated near the wall surface of the Kundt tube, and a backflow phenomenon would be formed in the Kundt tube [1,35]. In the 1940s, Rayleigh [36] carried out theoretical analyses and research on the strange flow phenomena observed in the experiment in plates and Kundt tubes for the first time. In the process of solving the flow control equation, the influence of second-order nonlinear terms on the flow was ignored, and the iterative approximation (successive approximation) method was adopted to solve the control equation. By conducting in-depth theoretical research on this phenomenon, Eckart [37] systematically analyzed the first-order sound field and derived the equation of the force generated in the sound field. The mechanism and properties of the acoustic streaming effect were theoretically described. These theoretical methods provide an important theoretical basis for the follow-up study of acoustic streaming problems.
According to the linear acoustics principle (Hooke’s Law), we can assume that an acoustic disturbance of a sinusoidal waveform propagates through a medium [38,39]. In the linear acoustic system, each particle in the medium vibrates sinusoidally according to its initial phase. Therefore, at any point in the liquid medium, the average velocity in time is zero, meaning that small amplitude sound waves do not produce macroscopic acoustic streaming in a linear medium.
However, in the acoustic field, if the initial state of the liquid medium is stationary, sound flow can be generated during the propagation of the sound wave. Based on the law of conservation of energy, the direction of sound flow must be accompanied by a change in energy. Considering the energy change as the action of a force, it can be inferred that there must be a force in the sound field with a non-zero time average in the Δt time interval. The action of this force may lead to the displacement of the fluid element, which is manifested as the acoustic streaming phenomenon on a macroscopic level.
By studying the propagation process of the first-order sound field, Eckart [37] deduced the directional constant velocity flow caused by the attenuation of sound intensity in the fluid medium, and its calculation equation is as follows:
where is the driving force acting on the direction of sound flow, is the energy density gradient in the sound field, ρL and cL are the first-order terms of the density and sound propagation velocities of the liquid medium, respectively, P1 is the pressure, and is the second-order term of the displacement velocity of any intermediate particle in the sound field.
In the finite element calculation process, the driving force of acoustic flow is added to the flow equation in the form of a volume force source term, and the calculation equation is as follows [40]:
where is the conjugate complex number of density perturbations, u is the velocity of the particle in the flow field, and ux and uy are the velocity components of the particle velocity in the x and y directions, respectively.
When Eckart deduced the theory of acoustic streaming in the process of first-order sound field propagation, the finite amplitude effect of sound vibration was not considered. CTaTHNKOB improved the calculation method of acoustic fluid force based on the equations of viscous fluid dynamics. The equation is as follows [41]:
where β is the nonlinear coefficient of the medium, ω is the angular frequency of ultrasonic vibration, lm is the amplitude of the vibration velocity of the contact end face of the horn, , M is the Mach number of the fluid, k is the wave number, and x is the distance between the particle and the end face of the horn. According to the calculation results of this equation, it can be concluded that the different positions of the ultrasonic vibration source will cause different equal effects, even in the medium without viscous force. Due to the absorption effect produced by the finite amplitude, the same effects will be produced. Compared with Eckart’s acoustic streaming theory, the above equation can calculate the acting volume force of acoustic streaming at different positions in the melt pool.
2.5. Phase Field-Controlling Equations
According to the phase field model of the free energy function, in the case of time dependence, the total free energy must be guaranteed to be brief with time. The phase field equation for the solidified alloy and the governing equation for the solute field can be deduced as follows [42]:
According to the principle of classical thermodynamics, the variational equation of F in equilibrium must be satisfied.
When the energy gradient coefficient is constant, the constant in Equation (16) is the total amount of solute in the space region Ω, that is, the concentration is a conserved constant.
The concentration c of the binary alloy solution varies between cL and cS of the two components. To solve the phase mobility and solute diffusion mobility in the phase field chamber, the following equation can be given [43]:
where A and B are the two pure components of the alloy solution, DS and DL are the diffusion coefficients of the solid phase and the liquid phase, respectively, and R′ is the gas constant.
Beckermann et al. [44] adopted the description of a regular solution to describe the solute field and provided a better method. In a two-dimensional space, considering the phase indicator equation ψ(r, t), whose interface is described as ψ, the geometry is described as
where is the normal direction on the ψ interface, k is the interface curvature, and v is the interface normal velocity.
According to Equation (7), the condition of the solid–liquid interface can be obtained as
where mL is the liquidus slope, is the equilibrium temperature (i is A, B), σ is the surface free energy, and Li is the latent heat.
The change in the phase field parameter ψ on the interface along the normal direction can be expressed by the following equation:
According to Equation (21), it can be obtained that
The relationship between the phase field parameter ψ in the normal direction and the interface thickness δm is obtained by Equations (22) and (23). By bringing Equations (21)–(23) into the interface equation, the phase field control equation can be obtained as follows:
where μk is the kinetic coefficient, TM is the melting temperature of the alloy, δm is the interface thickness, Γ is the Gibbs–Thomson coefficient, and mL is the liquidus slope of the alloy solution.
According to the heat transfer equation, the temperature field equation is
where αT is the thermal diffusion coefficient, Lm is the latent heat, and Cp is the specific heat.
The law of solute diffusion is described by Fick’s law, and the conservation equation for the solute field is derived by using the weighted value of the average concentration.
According to the mean concentration evolution equation, the liquid and solid concentration can be expressed as the mean concentration.
where kf [45] is the solute partition coefficient.
2.6. Anisotropy of Interfacial Growth
During the solidification process, the interfacial energy at the solid–liquid interface has anisotropy. The anisotropy is manifested as the preferred orientation of dendrite growth, which is always in the direction of the least energy at the interface. Therefore, the interface energy anisotropy has a very important influence on the dendrite morphology evolution and the interface stability [1]. The anisotropy ε of the interface depends on the direction of the normal vector outside the interface; the angle is expressed as
The anisotropic expression is
where is the average value of the anisotropic gradient energy coefficient; δ is the anisotropy intensity, generally between 0.02 and 0.1; kε is the anisotropic modulus, generally 4 or 6 because the material simulated in this paper is FCC (face-centered cubic structure), kε = 4; θ is the angle between the main dendrite arm and the interface normal vector; and θ0 is the initial angle defined when the dendrite begins to grow.
2.7. Establishment of Quantitative Binary Alloy Phase Field Model
The phase field model for the binary alloy is derived according to Section 2.1, and the interface growth anisotropy was added. Thus, the governing equation for the phase field model of the binary alloy can be obtained as
By inputting the interface growth anisotropy into Equation (30), we can expand it to obtain
Ranadip Acharya et al. [46] further modified Equation (31) to include the linear relationship between the interface temperature and the phase composition and melting temperature of the binary alloy, thus sorting out Equation (31).
In the process of numerical calculation, to improve the convergence of the phase field equation, the linear function is replaced by a nonlinear bounded function as follows:
where is dimensionless temperature, = (TL − T)/(TL − TS).
By , means of dimensionless parameters, the phase field equation is dimensionless and can be written in the following form:
By introducing phase field interface parameters , , the phase field equation can be expressed as
where is the gradient coefficient of interfacial anisotropy, τc is the relaxation time parameter (which is a fitting parameter), α and γ are the interfacial coupling coefficients (both of which are constant), is the dimensionless liquidus slope, cL is the average liquid phase concentration of secondary elements, and c0 is the average concentration of secondary elements.
Due to the effect of austenite on coating properties during the laser cladding of 316L powder on 45 steel, the physical properties for the Fe-Ni binary solution were selected as the input parameters of the phase field model.
According to Equations (25) and (26), the governing equations for the temperature field and solute field in the solidification process of the binary alloy can be obtained as
where Dψ is the description of solute diffusion in the phase field variable, Dψ = DS + (DL − DS)(1 − ψ)/(1 – ψ + kfψ).
3. Selection for Microscopic Boundary
3.1. Temperature Field Boundary Selection
The properties and quality of the cladding layer are affected by the temperature variation during the cladding process. The temperature distribution in the melt pool is an important factor determining the microstructure of the solidification. Therefore, it is of great significance to accurately grasp the temperature distribution of the cladding process for the accuracy of the microstructure simulation. This section analyzes the transient changes for temperature in the process of cladding and discusses the influence. The corresponding temperature distribution is shown in Figure 3.
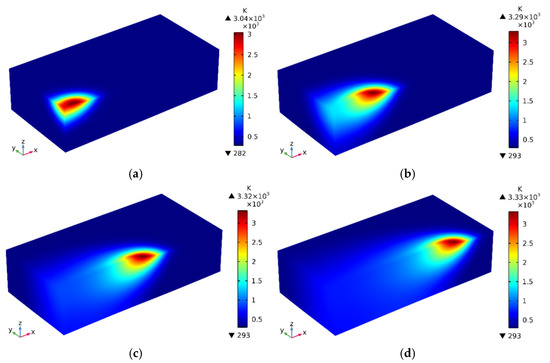
Figure 3.
Cloud image for temperature field distribution at different moments of laser cladding 316L powder on 45 steel. (a) Temperature field distribution at 0.3 s; (b) temperature field distribution at 1.0 s; (c) temperature field distribution at 2.0 s; (d) temperature field distribution at 3.0 s.
According to the calculation method of phase diagram, the solid phase line temperature of 316L stainless steel and 45# carbon steel is 1602.26 K and 1656.15 K, respectively. As shown in Figure 3a, when the cladding is carried out for 0.3 s, the peak temperature of the cladding region reaches 2725 K, exceeding the melting point of the substrate and the cladding material. At this stage, because of the short laser irradiation time, the melt pool has not been completely formed. With continuous laser scanning, the melt pool temperature continues to rise, and the heat exchange between the melt pool and the substrate causes heat accumulation in the melt pool. The width and depth of the melt pool gradually increases. At 1.0 s, the melt pool is fully formed and the maximum temperature at this moment rises to 2951 K, as shown in Figure 3b. As shown in Figure 3c,d, the temperature distribution in the melt pool tends to be stable at 2.0 s and 3.0 s as the heat absorption and diffusion after the melt pool is formed reach a state of equilibrium. The temperature in the melt pool center is the highest and the temperature gradient is large, while the temperature at the edge is relatively low and the temperature gradient is reduced. An obvious thermal diffusion layer was formed between the melt pool and the substrate, and the temperature distribution showed a unique “comet tail”.
To better simulate the microstructure evolution during the melt pool solidification process, the temperature distribution at the moment of 2.0 s was selected as the boundary condition for the simulation of dendrite growth behavior, as shown in Figure 3. Figure 4a shows that the paste region position at the bottom of the longitudinal section of the melt pool is selected as the boundary of the simulation. The temperature at mark 1 is still in the melting state at about 2000 K, and the temperature at mark 2 fluctuates around 1700 K, which is just in the position of the solid phase line and liquidus of the melt pool material. The temperature of the outer boundary at mark 2 was selected as the simulated boundary condition of the microstructure. As shown in Figure 4b, a cross-sectional temperature field at a distance from the center of the melt pool is selected. At the same time, according to the solid–liquidus temperature range of the cladding material, the temperature boundary at the cross-section is selected to draw an “ellipse” shape by the black line in Figure 4.
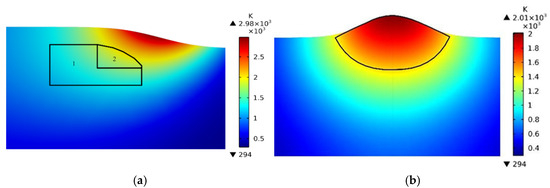
Figure 4.
Temperature boundary selection in solidification microstructure simulation. (a) Temperature field boundary selection for longitudinal section; (b) temperature field boundary selection for cross-section.
3.2. Flow Field Boundary Extraction Under Silent Flow
Figure 5 shows the cloud image for the flow field distribution in the melt pool during laser cladding. At 0.3 s, the flow field in the melt pool has not completely formed, and a small circulation has formed. The maximum flow velocity is 0.23 m/s, as shown in Figure 5a. At 1 s, an obvious Marangoni convection had formed in the melt pool, and the flow field was completely formed and the maximum flow velocity is 0.34 m/s, as shown in Figure 5b. Compared with the flow field distribution in the melt pool at 1 s, the flow field distribution in the melt pool remained basically unchanged at 2.0 s and 3.0 s, and the maximum flow velocity changed slightly to 0.35 m/s, as shown in Figure 5b–d.
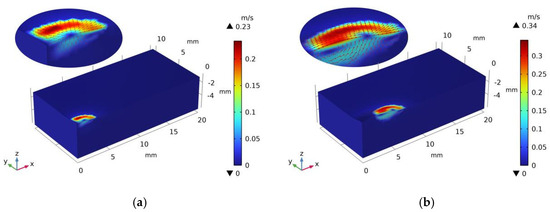
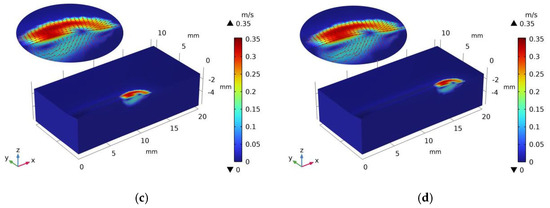
Figure 5.
Velocity distribution cloud image at different times. (a) Velocity distribution at 0.3 s; (b) velocity distribution at 1.0 s; (c) velocity distribution at 2.0 s; (d) velocity distribution at 3.0 s.
To better select the flow velocity size and direction for the static flow field simulation, the flow field distribution cloud image after stability at 2.0 s is selected, as shown in Figure 6. As shown in Figure 6a, melt flow is affected by surface tension, and the flow direction of the melt pool surface gradually spreads from the center of the spot to the periphery. Therefore, the flow velocity on the melt pool surface is characterized by a small center and a large edge. As shown in Figure 6b, there is an obvious Marangoni convection in the melt pool. Because of the effect of surface tension, two circulation structures are formed in front and behind the melt pool, and the circulation behind the melt pool is more significant. At the same time, the maximum flow velocity appears on the surface of the melt pool and is 0.35 m/s. According to the numerical simulation results of the flow field, when analyzing the influence of melt pool flow velocity on dendrite growth, the flow velocity direction in the simulation is from left to right.
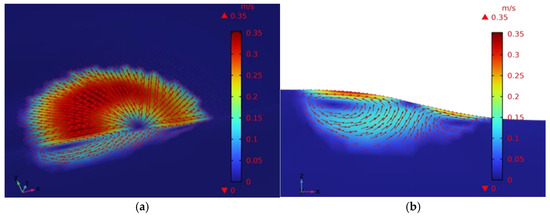
Figure 6.
Distribution cloud image for the flow field in the melt pool at 2.0 s. (a) Temperature distribution on the surface of the melt pool; (b) temperature distribution inside the melt pool.
This section aims to deeply explore the evolution process of the microstructure in the laser cladding pool. Based on the macroscopic 3D numerical results, the downstream field simulation results at the time of 2.0 s are selected in this section. According to the simulation results of the temperature field, the solidification zone is mainly located in the back part of the melt pool. Therefore, the flow field data on the black scan line were adopted in this simulation, which was set as the input boundary condition of the static flow rate. The direction of flow velocity flowing from the left side to the right side of the melt pool was selected, as shown in Figure 7. According to the flow field results at the time of 2.0 s, the static flow velocity can be obtained, as shown in Figure 8a. Dimensionless the actual flow velocity, and the result is shown in Figure 8b. Because microstructure solidification under actual flow is a complex process, the movement of dendrites under the action of the flow field (such as translation, etc.) was ignored in this section’s numerical simulation, including the breakage of dendrites caused by flow shear force and the influence of gravity.
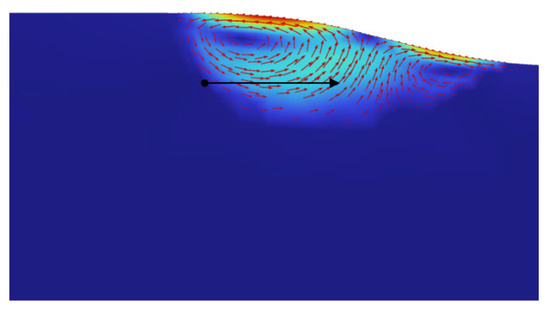
Figure 7.
The position of the flow field collection line at 2.0 s.
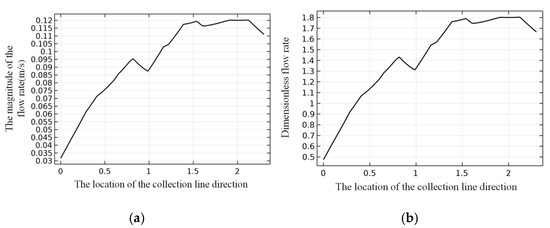
Figure 8.
Static flow velocity and dimensionless flow velocity. (a) Velocity of static flow field; (b) dimensionless velocity of static flow field.
3.3. Flow Field Boundary Extraction Under Acoustic Flow
In this paper, acoustic flow action is introduced into the source term of the flow equation in the form of volume force. The flow field distribution cloud image under the action of ultrasonic acoustic flow was calculated, as shown in Figure 9. Figure 9 shows that under the action of acoustic streaming generated by ultrasonic vibration, the fluidity of the cladding process increases and the flow velocity on the surface and inside the melt pool increases. At 2.0 s, the circulation in the latter part of the melt pool significantly increases, which can promote the flow of solute elements during the solidification process, as shown in Figure 9b.
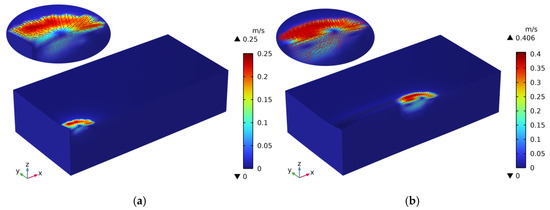
Figure 9.
Flow field distribution cloud image under action of ultrasonic flow. (a) Velocity distribution at 0.3 s; (b) velocity distribution at 2.0 s.
The direction of flow from the left side of the melt pool to the right side of the flow was selected, as shown in Figure 10. According to the flow field results at the time of 2.0 s, the static flow velocity under the action of acoustic flow is obtained, as shown in Figure 11a. Dimensionless the actual flow velocity, and the result is shown in Figure 11b. The acoustic streaming effect increases the flow velocity inside the melt pool, improves the flow state inside the melt pool, and promotes the flow of solute elements inside the melt pool to be more uniform.
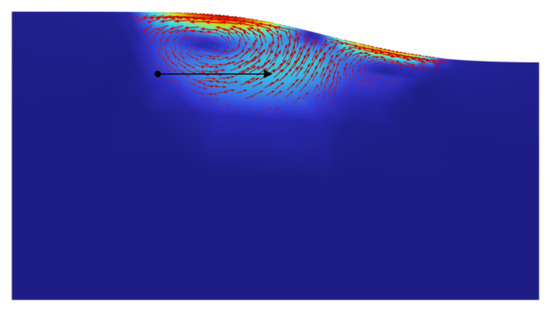
Figure 10.
The acoustic flow field acquisition line position at 2.0 s.
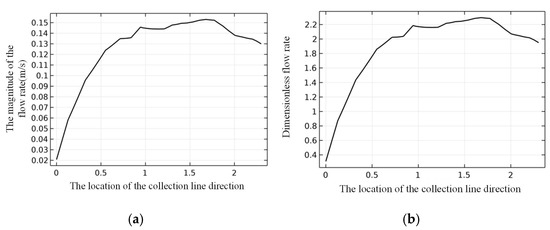
Figure 11.
Static flow velocity and dimensionless flow velocity under action of acoustic streaming. (a) Velocity of sound flow field; (b) dimensionless velocity of acoustic flow field.
4. Results and Discussion
4.1. Dendrite Growth Behavior of Laser Cladding Without Flow Field
The finite element difference method is used to solve and analyze the numerical model. The normalized scale of the feature length is l0 = 25 μm, and the mesh is divided by a free triangle mesh. The maximum cell size is lmesh/l0 = 0.1. The total number of units in the longitudinal section is 52,918, and the total number of units in the transverse section is 43,906. The phase field model parameters used in this paper are τc = 0.0003, γ = 10, δ = 0.1, αT = 5.48 × 10⁻⁶, μk = 0.05, kf = 0.88, DL = 4.8 × 10⁻⁹ m2/s, DS = 0.2 × 10⁻¹² m2/s, τ = /αT, αT = /τ = kT/(ρCp), and = 0.01.
Figure 12 describes the microstructure evolution for the paste zone in the longitudinal section of the melt pool during laser cladding. According to the temperature distribution boundary, crystal nuclei are set at boundaries 3, 4, and 5 on the longitudinal section. The temperature distribution is higher at boundaries 6 and 7, and the solidification process will not occur, as shown in Figure 12a. As shown in Figure 12b, the evolution process of the interface morphology at the bottom of the paste region is from plane to cellular. Due to the rapid heat dissipation to the outside of the joint at the bottom, the initial growth of the crystal nucleus appears as a plane crystal. With the solidification process, the direction of the temperature gradient in the melt pool is consistent with the preferred growth direction of the crystal. The initial plane interface gradually becomes uneven, thus transforming into cell growth. As shown in Figure 12c, dendrite growth accelerates at a faster rate due to the change in the crystal growth rate after plane interface instability compared to dendrite growth at 10 to 1000 Δt times. At the same time, there is obvious competitive growth among dendrites, and the winning crystal tip is obvious and the radius is larger; it continues to grow along the direction of the temperature gradient, and its shape is transformed into a columnar crystal. As shown in Figure 12d, at the time of 3500 Δt, the dendrites have fully grown, the growth rate of dendrites decreases, and the dendrite trunk begins to form secondary dendrite arms and tertiary dendrite arms. During the process of fierce competition, the dendrites that failed to grow formed elongated columnar crystals and elongated cellular crystals. It can be clearly seen at the left boundary that some dendrites that fail to grow fuse in the competition process to form larger cellular crystals.
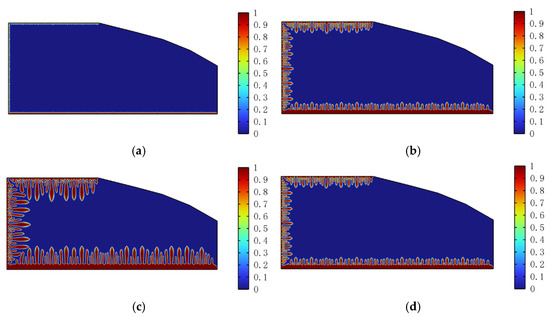
Figure 12.
Dendrite growth process on laser cladding longitudinal section. (a) Dendrite morphology at 10 Δt; (b) dendrite morphology at 1000 Δt; (c) dendrite morphology at 2000 Δt; (d) dendrite morphology at 3500 Δt.
The solute field morphology on the longitudinal section of the laser cladding pool is shown in Figure 13. As shown in Figure 13a, at 1000 Δt, the dendrites can be observed to have just begun to grow. At this time, the solute diffusion phenomenon at the dendrite growth boundary just appeared, but the change in the overall solute distribution was not obvious. With the solidification process, an obvious solute diffusion layer begins to form near the solid–liquid interface of the dendrites. Figure 13b shows that the solute field distribution on the longitudinal section of the melt pool is highly consistent with the dendrite morphology simulated by the phase field method. This indicates that the dynamic variation in the solute field is closely related to the morphological development of dendrites during dendrite growth.

Figure 13.
Solute field morphology on laser cladding longitudinal section. (a) Solute field morphology at 1000 Δt; (b) solute field morphology at 3500 Δt.
4.2. Growth Behavior of Convective Dendrites Under Silent Flow
Figure 14a shows the effect of flow velocity in the melt pool on dendrite growth at 2000 Δt. The effect of flow on dendrite growth is not significant because of the low flow velocity in the melt pool. At the left boundary, dendrites grow in the same direction as the velocity (i.e., parallel to the flow), resulting in a slight shortening of the primary dendrite arm length of these dendrites, but the orientation remains the same. In contrast, the dendrite growth direction at the top and bottom of the melt pool is perpendicular to the velocity direction (i.e., shear flow), causing some of the primary dendrite arms to tilt slightly towards the onstream direction. Some of the dendrite arms have formed small protrusions on the onstream side.
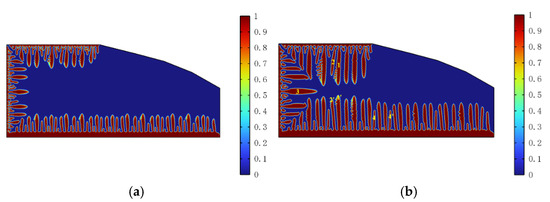
Figure 14.
Dendrite morphology under static flow field. (a) Dendrite morphology at 2000 Δt; (b) dendrite morphology at 3500 Δt.
As shown in Figure 14b, the top and bottom dendrites are about to come in contact at 3500 Δt; the dendrites are considered to be fully grown. At the left boundary, the dendrites at position 3 are not disturbed by the growth of other dendrites in the vertical direction, making it an ideal reference for analyzing the change in the growth rate of the last dendrite arm in the parallel downstream direction. Under the condition with no flow, the distance from the dendrite tip at position 3 to the left boundary is about 113.75 μm. Under the condition of parallel concurrent flow, the distance from the dendrite tip at position 3 to the left boundary is about 103.15 μm. Therefore, it can be seen that the parallel flow trend in the process of inhibiting dendrite growth is mainly manifested in inhibiting the emergence of secondary dendrite arms and the growth rate of primary dendrite arms. This is in agreement with the conclusions of most researchers.
Under the action of the flow field, because the flow direction of shear flow flows from left to right, the oncoming side is washed by the flow and the latent heat released by solidification can quickly dissipate. At the same time, part of the heat is carried from the oncoming side to the downstream side, resulting in an increase in the temperature of the downstream side, which is not conducive to diffusion. The solid–liquid boundary advances faster towards the oncoming side, and the growth rate of secondary dendrite arms on the oncoming side accelerates and the number of secondary dendrite arms increases. On the contrary, the dendrite growth on the downstream side is inhibited and the dendrite morphology is “almost smooth”. The simulation results show that at both the top and bottom boundaries, dendrites that originally grew perpendicular to the boundary are now tilted in the direction of the oncoming flow. Specifically, the dendrite tilt at the boundary can be divided into three different cases. The first case shows the morphology of dendrites 1 and 1′, and this branching crystal is not disturbed by neighboring dendrites during the growth process. Therefore, under the influence of shear flow, these dendrites tilt towards the oncoming flow, but the tilt angle is relatively small. The second case shows the morphology of dendrite 2 and dendrite 2′. During the growth of this branch crystal, due to the interference and limitation of the right dendrite, the tilt angle of this branch crystal which originally tilted to the left increases under the action of shear flow, and the tilt towards the oncoming flow is more significant. The third case shows the morphology of dendrite 4 and dendrite 4′. Due to the interference and limitation of the left dendrite, the branch crystal that originally tilted to the right is still tilted to the right under the action of shear flow, but the tilt angle decreases.
Figure 15a shows the solute field distribution morphology at 3500 Δt under the condition of pure diffusion. It can be seen that there is a uniform solute film at the interface of primary dendrite arms and secondary dendrite arms, and the distribution of solute elements has a good symmetry along the dendrite center. After the static flow field is introduced, the solute elements in the solidification process can be washed by the flow, and the distribution of the solute between the primary dendrite arms will spread along the flow direction. At the left boundary, the solute layer film thickens, and the solute concentration decreases at the dendrite tip parallel to the flow. At the top and bottom boundaries, the concentration of solute elements on the dendrite side increases, the solute gradient on the dendrite side increases, and the solute film becomes thinner. This promotes the advancement of the solid–liquid interface and the formation of secondary dendrite arms. However, the concentration of solute elements decreases, the solute layer films significantly increase, and the dendrite growth is inhibited, as shown in Figure 15b.
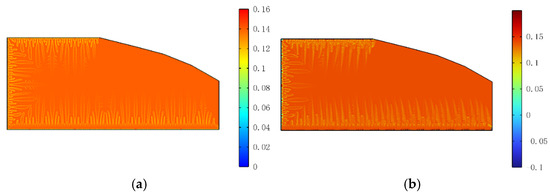
Figure 15.
Solute distribution with and without flow field. (a) Morphology of solute field without flow field; (b) solute field morphology in static flow field.
4.3. Growth Behavior of Convective Dendrites Under Acoustic Flow
Figure 16a shows the dendrite morphology under the action of acoustic streaming at the time 2000 Δt. The dendrite growth at the left boundary is basically the same as that at static flow velocity. Due to the effect of acoustic streaming, the flow velocity in the melt pool is accelerated and more stable. The number of secondary dendrite arms on the top and bottom side of the oncoming flow is increased, and the secondary dendrite arms are more developed. Figure 16b shows that the distance from the dendrite tip to the left boundary at position 3 in the static acoustic flow field is reduced to 98.25 μm, indicating that the inhibition effect of flow on dendrite growth velocity is enhanced with the increase in parallel flow velocity.
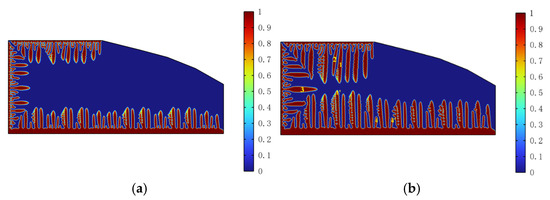
Figure 16.
Dendrite morphology under static acoustic streaming field. (a) Dendrite morphology at 2000 Δt; (b) dendrite morphology at 3500 Δt.
The acoustic streaming effect of ultrasonic vibration enhances the fluidity and makes the flow more uniform during the solidification process. It leads to an increase in the temperature gradient and solute gradient on the dendrite onstream side, accelerates the advancing velocity of the solid–liquid interface on the onstream side, and promotes the formation and growth of secondary dendrite arms. Therefore, on the top and bottom dendrite onstream sides, secondary dendrite arm growth is observed to be more significant. The dendrite morphology of the downstream side is “smooth”. In the process of dendrite growth under the static acoustic flow field, three different states of dendrite tilt at the top and bottom boundaries are also observed. It can be seen that under the static acoustic streaming field, the number of dendrites with inclined morphology 1 and 1′ significantly increases, while the number of dendrites with inclined morphology 2 significantly decreases. This is because the inclined angle of dendrite 1 increases and the growth of secondary dendrite arms on the oncoming side is more developed, which limits the growth of tilted dendrites on the left side. The dendrites with reduced shape 2 failed to grow. In addition, the number of dendrites with inclined morphologies 4 and 4′ is also reduced because the growth of these branches is affected by the restriction of the right dendrites and the inhibition of parallel flow. As shown in Figure 17, the dendrite tilt angle under the flow field is 2.27° and the dendrite tilt angle under the acoustic streaming field is 3.05°.
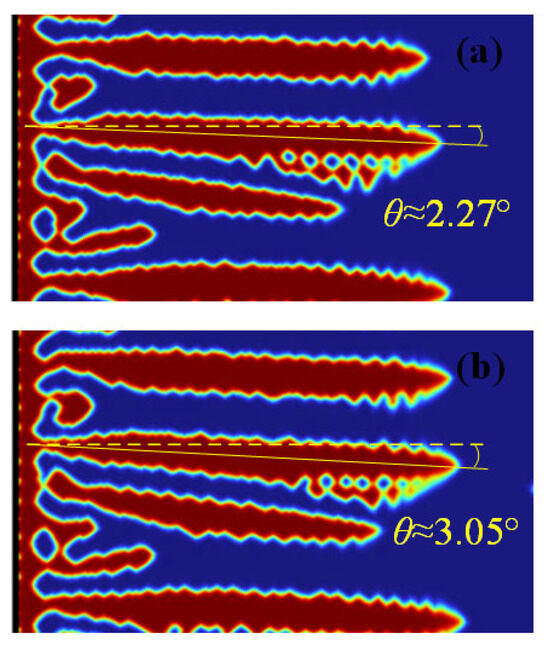
Figure 17.
Dendrite tilt angle under the action of flow field. (a) Dendrite tilt angle under static flow field; (b) dendrite tilt angle under static acoustic flow field.
To verify the validity of the numerical simulation results, laser cladding experiments were carried out. The experiment selected a TruDisk4002 laser produced by TRUMPF, Ditzingen, Germany. The laser power was 1600 W, the minimum fiber diameter was 0.2 mm, and the laser wavelength was 1030 nm. The substrate material and powder of cladding were 45 steel and 316L, respectively. The specimen was cut lengthwise along the vertical scanning direction and the section was polished and corroded with a 4% nitrate alcohol solution. The metallographic experiment was carried out with an optical microscope to observe the microstructure of the coating layer. Figure 18 shows that the secondary dendrite arms of labeled columnar crystals 1, 2, and 3 grow significantly on the oncoming side, while the wall of the main shaft arm on the downstream side presents a relatively “smooth” feature. At the same time, the dendrites are inclined in the direction of the oncoming flow. The comparison shows that the numerical simulation results are consistent with the experimental results, which verifies the validity of the model.
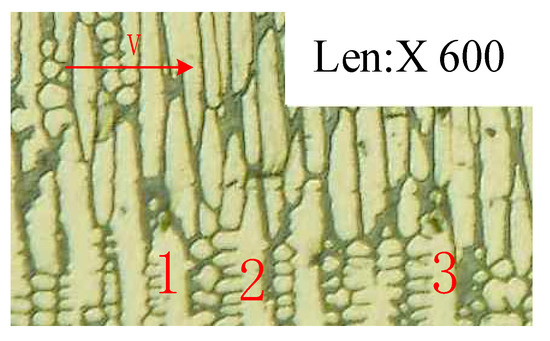
Figure 18.
Cladding layer microstructure.
The cladding layer produced by the laser cladding of 316L powder is mainly composed of an austenite phase. The experimental results of Gao Jingxiang show that the 316L laser cladding assisted by ultrasonic vibration does not change the phase structure but significantly improves the performance of the cladding layer. Therefore, it can be concluded that ultrasonic vibration has the effect of strengthening the austenite phase. Considering that Fe and Ni are the main components of the austenite phase, the Ni element expands the austenite and stabilizes the austenite structure. The strength of the austenitic phase is determined by the dissolution and precipitation of Ni during the solidification of the Fe-Ni alloy. Figure 19 shows the precipitation and distribution of Ni as a solute when dendrites grow in the melt pool under the flow field and sound flow field. As shown in Figure 19a, due to the small and uneven fluidity of the static flow field, the area near the dendrite root on the oncoming side exhibits solute element enrichment and segregation. In Figure 19b, under the action of acoustic streaming, the fluidity of the supercooled melt is enhanced, the flow is more uniform, and the solute segregation between the dendrites is significantly reduced. The decrease in Ni segregation indicates the increase in its solubility in an Fe base, which enhances the strength of the austenite phase and provides the possibility for obtaining a cladding coating with better performance.
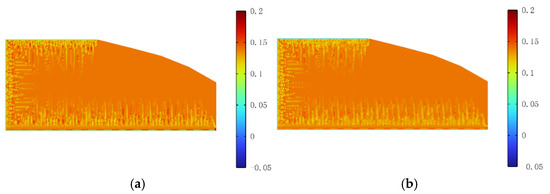
Figure 19.
Solute segregation and enrichment under static and acoustic flow fields. (a) Solute precipitation in flow field; (b) solute precipitation in acoustic flow field.
5. Conclusions
- (1)
- The numerical simulation results of coupling a static flow field and a sound flow field show that melt flow changes the heat and mass transfer behavior at the solidification interface and also changes the growth morphology of dendrites. The dendrite growth is inhibited under parallel concurrent flow, and the dendrite at the original vertical interface under shear flow inclines to the oncoming side. The dendrite tilt in the flow field is as follows: influenced by convection, the dendrite tilts to the oncoming side, and the tilt angle is small. Due to the influence of convection and the orientation of oncoming dendrites (the dendrites that are inclined to the oncoming side due to competitive growth), the dendrites are inclined to the oncoming side, and the inclination angle is large. Influenced by convection and consequent dendrite orientation (the dendrites that grow inclined to the consequent side due to competitive growth), the dendrites grow inclined to the consequent side, and the inclination angle is large.
- (2)
- Acoustic flow increases the flow velocity of the melt pool, increases the dendrite tilt angle to the onstream side, and promotes the growth of secondary dendrite arms on the onstream side. At the same time, the melt flow is more uniform, the solute distribution of dendrite growth is improved, and the enrichment and segregation of secondary elements between dendrites are reduced.
Author Contributions
X.H. and H.Z. acquired the grant and revised the paper; C.L. and X.W. performed modeling and wrote the paper; S.L. and J.L. extracted and analyzed the data; Q.S. and F.K. checked the grammar. All authors have read and agreed to the published version of the manuscript.
Funding
This work was supported by the Applied Basic Research Program of Liaoning Province (2023JH2/101300226), Liaoning Supported by the Fundamental Research Funds for the Liaoning Universities (LJ222410146021), Liaoning Province Metallurgical equipment and process control key laboratory open project (2024KFKT-01), Project for Graduate Education Reform and Technological Innovation and Entrepreneurship of the University of Science and Technology Liaoning (2023YJSCX02).
Institutional Review Board Statement
Not applicable.
Informed Consent Statement
Not applicable.
Data Availability Statement
The data that supports the findings of this study are available within the article.
Conflicts of Interest
The authors declare no potential conflicts of interest in the research, authorship, and/or publication of this article.
References
- Valente, C.; Morgado, T.; Sharma, N. LASER cladding—A post processing technique for coating, repair and re-manufacturing. In Materials Forming, Machining and Post Processing; Springer: Berlin/Heidelberg, Germany, 2020; pp. 231–249. [Google Scholar] [CrossRef]
- Zhu, L.; Xue, P.; Lan, Q.; Meng, G.; Ren, Y.; Yang, Z.; Xu, P.; Liu, Z. Recent research and development status of laser cladding: A review. Opt. Laser Technol. 2021, 138, 106915. [Google Scholar] [CrossRef]
- Siddiqui, A.A.; Dubey, A.K. Recent trends in laser cladding and surface alloying. Opt. Laser Technol. 2021, 134, 106619. [Google Scholar] [CrossRef]
- Qi, K.; Yang, Y.; Sun, R.; Hu, G.; Lu, X.; Li, J.; Liang, W.; Jin, K.; Xiong, L. Effect of magnetic field on crack control of Co-based alloy laser cladding. Opt. Laser Technol. 2021, 141, 107129. [Google Scholar] [CrossRef]
- Campbell, J. Effects of vibration during solidification. Int. Met. Rev. 1981, 26, 71–108. [Google Scholar] [CrossRef]
- Ji, F.; Qin, X.; Hu, Z.; Xiong, X.; Ni, M.; Wu, M. Influence of ultrasonic vibration on molten pool behavior and deposition layer forming morphology for wire and arc additive manufacturing. Int. Commun. Heat Mass Transf. 2022, 130, 105789. [Google Scholar] [CrossRef]
- Wei, X.; Li, X.; Zhang, L.; Lv, Q. Effect of in-situ ultrasonic impact treatment on flow and solidification behavior of laser metal deposition: By finite element simulation. Int. J. Heat Mass Transf. 2022, 192, 122914. [Google Scholar] [CrossRef]
- Wang, Z.; Jiang, F.; Guo, C.; Xing, X.; Yang, Z.; Li, H.; Liu, C.; Xu, D.; Jiang, G.; Konovalov, S. Effects of ultrasonic vibration on microstructure and mechanical properties of 1Cr12Ni3MoVN alloy fabricated by directed energy deposition. Ultrasonics 2023, 132, 106989. [Google Scholar] [CrossRef]
- Zhuang, D.-D.; Du, B.; Zhang, S.-H.; Tao, W.-W.; Wang, Q.; Shen, H.-B. Effect and action mechanism of ultrasonic assistance on microstructure and mechanical performance of laser cladding 316L stainless steel coating. Surf. Coat. Technol. 2022, 433, 128122. [Google Scholar] [CrossRef]
- Song, H.; Jiang, F.; Guo, C.; Sun, Q.; Li, H.; Yang, Z.; Li, L.; Diao, M.; Zhang, Z. Effect of ultrasonic vibration on the microstructure and microhardness of laser cladding Fe-based crystalline/amorphous composite coatings. Mater. Lett. 2023, 335, 133780. [Google Scholar] [CrossRef]
- Ma, G.; Yan, S.; Wu, D.; Miao, Q.; Liu, M.; Niu, F. Microstructure evolution and mechanical properties of ultrasonic assisted laser clad yttria stabilized zirconia coating. Ceram. Int. 2017, 43, 9622–9629. [Google Scholar] [CrossRef]
- Geng, R.W.; Du, J.; Wei, Z.Y.; Zhao, G.X. An adaptive-domain-growth method for phase field simulation of dendrite growth in arc preheated fused-coating additive manufacturing. J. Phys. Conf. Ser. 2018, 1063, 012077. [Google Scholar] [CrossRef]
- Wu, L.; Zhang, J. Phase field simulation of dendritic solidification of Ti-6Al-4V during additive manufacturing process. Jom 2018, 70, 2392–2399. [Google Scholar] [CrossRef]
- Zhang, Y.; Jung, Y.-G.; Zhang, J. Phase field modeling of microstructure evolution in selective laser melting-manufactured titanium alloy. In Multiscale Modeling of Additively Manufactured Metals; Elsevier: Amsterdam, The Netherlands, 2020; pp. 141–154. [Google Scholar] [CrossRef]
- Sun, D.; Liu, J.; Li, Q. Phase-field method simulation of microstructure evolution at the bottom of melt pool in coaxial laser cladding. Zhongguo Jiguang (Chin. J. Lasers) 2013, 40, 0403005-6. [Google Scholar] [CrossRef]
- Li, A.; Wang, Z.; Sun, Z. Effect of Ultrasonic Vibration on Microstructure and Fluidity of Aluminum Alloy. Materials 2023, 16, 4110. [Google Scholar] [CrossRef] [PubMed]
- Lian, G.; Yue, K.; Zeng, J.; Feng, M.; Lan, R.; Kong, L. Microstructures and Properties of NbC-Reinforced Ni-Based Coatings Synthesized In Situ by Ultrasonic Vibration-Assisted Laser Cladding. Materials 2023, 16, 1704. [Google Scholar] [CrossRef] [PubMed]
- Lv, J.; Zhou, J.; Zhang, T.; Meng, X.; Li, P.; Huang, S. Microstructure and Wear Properties of IN718/WC Composite Coating Fabricated by Ultrasonic Vibration-Assisted Laser Cladding. Coatings 2022, 12, 412. [Google Scholar] [CrossRef]
- Han, X.; Li, C.; Chen, X.; Jia, S. Numerical simulation and experimental study on the composite process of submerged arc cladding and laser cladding. Surf. Coat. Technol. 2022, 439, 128432. [Google Scholar] [CrossRef]
- Lugscheider, E.; Bolender, H.; Krappitz, H. Laser cladding of paste bound hardfacing alloys. Surf. Eng. 1991, 7, 341–344. [Google Scholar] [CrossRef]
- Fellowes, F.; Steen, W.; Coley, K. Ceramic coatings for high temperature corrosion resistance by laser processing. Key Eng. Mater. 1990, 46, 435–446. [Google Scholar] [CrossRef]
- Zhou, J. Stress Evolution and Control in Laser Deposition Manufacturing; Shenyang University of Aeronautics and Astronautics: Shenyang, China, 2016; pp. 15–20. [Google Scholar]
- Kumar, S.; Wu, C.; Padhy, G.; Ding, W. Application of ultrasonic vibrations in welding and metal processing: A status review. J. Manuf. Process. 2017, 26, 295–322. [Google Scholar] [CrossRef]
- Humphrey, V.F. Ultrasound and matter—Physical interactions. Prog. Biophys. Mol. Biol. 2007, 93, 195–211. [Google Scholar] [CrossRef] [PubMed]
- Yao, Y.; Pan, Y.; Liu, S. Power ultrasound and its applications: A state-of-the-art review. Ultrason. Sonochemistry 2020, 62, 104722. [Google Scholar] [CrossRef] [PubMed]
- Khavari, M.; Priyadarshi, A.; Hurrell, A.; Pericleous, K.; Eskin, D.; Tzanakis, I. Characterization of shock waves in power ultrasound. J. Fluid Mech. 2021, 915, R3. [Google Scholar] [CrossRef]
- Wells, P.N.T. Physics of ultrasound. In Ultrasonic Exposimetry; CRC Press: Boca Raton, FL, USA, 2020; pp. 9–45. [Google Scholar]
- Čáp, I.; Čápová, K.; Smetana, M.; Borik, Š. Mechanical Waves. Electromagn. Acoust. Waves Bioeng. Appl. 2021, 57. [Google Scholar] [CrossRef]
- Li, Y.; Chen, C.; Yi, R. Recent development of ultrasonic brazing. Int. J. Adv. Manuf. Technol. 2021, 114, 27–62. [Google Scholar] [CrossRef]
- Sui, D.; Han, Q. Ultrasound-assisted cast-on method: Obtaining high-quality metallurgical bonds between a bare steel insert and A354 aluminum alloy within a composite casting. J. Mater. Process. Technol. 2023, 311, 117783. [Google Scholar] [CrossRef]
- Sonia, P.; Jain, J.K.; Saxena, K.K. Influence of ultrasonic vibration assistance in manufacturing processes: A Review. Mater. Manuf. Process. 2021, 36, 1451–1475. [Google Scholar] [CrossRef]
- Li, Q.; Jiang, W.; Xu, Y.; Yu, L.; Niu, Y.; Fan, Z. Development of prominent bonding strength in Al/Mg bimetal composites prepared by ultrasonic vibration-assisted compound casting: Effects of ultrasonic powers. J. Mater. Sci. Technol. 2024, 197, 78–93. [Google Scholar] [CrossRef]
- Kardyś, W.; Milewski, A.; Kogut, P.; Kluk, P. Universal ultrasonic generator for welding. Acta Phys. Pol. A 2013, 124, 456–458. [Google Scholar] [CrossRef]
- Faraday, M. On a peculiar class of acoustical figures; and on certain forms assumed by groups of particles upon vibrating elastic surfaces. Abstr. Pap. Print. Philos. Trans. R. Soc. Lond. 1837, 3, 49–51. [Google Scholar] [CrossRef]
- Liu, F. Numerical Study of Acoustic Flow Effects Based on Weakly Compressible Equations; Huazhong University of Science and Technology: Wuhan, China, 2017; Available online: https://kns.cnki.net/kcms2/article/abstract?v=k15566fjT2nTsAZ-sqgee1b4BNxqOltVHx21XJoEUw7bNtCOqYzYSWGERnYH1MGfAoo32d2CVyVqb7TdCmWLtSUN93VzIXQj1lYU5uVmM_Hzi9kZCJlF38DF6folUvNOKTZCHIcld6KhkMLOxU5seiLSTLBDGvQ0_pZHlW84BOl_hRDi7iviXVxPNsbtKYh492Im8E5NtMg=&uniplatform=NZKPT&language=CHS (accessed on 27 September 2024).
- Rayleigh, J.W.S.B. The Theory of Sound; Macmillan: New York, NY, USA, 1896. [Google Scholar]
- Eckart, C. Vortices and streams caused by sound waves. Phys. Rev. 1948, 73, 68. [Google Scholar] [CrossRef]
- Pierce, A.D. Mathematical theory of wave propagation. In Handbook of Acoustics; Springer: Berlin/Heidelberg, Germany, 1998; pp. 21–37. [Google Scholar]
- Schuster, G. Basic Principles of Wave Propagation. 2011. Available online: http://csim.kaust.edu.sa/files/Short.Courses/BasicSeismology.pdf (accessed on 27 September 2024).
- Muller, P.B.; Barnkob, R.; Jensen, M.J.H.; Bruus, H. A numerical study of microparticle acoustophoresis driven by acoustic radiation forces and streaming-induced drag forces. Lab Chip 2012, 12, 4617–4627. [Google Scholar] [CrossRef] [PubMed]
- Qian, Z. Nonlinear Acoustics; Science Press: New York, NY, USA, 2009. [Google Scholar]
- Hou, C. Simulation of NiCu Alloys by Phase Field Method and Study of Related Models; North Central University: Minneapolis, MN, USA, 2016; Available online: https://kns.cnki.net/kcms2/article/abstract?v=k15566fjT2m4VwbB8a1o4IdKakPlMIzF8joXRahBIhL_5XhhSFPkad11WvqKa_FJezOgySqm4QSXJcE79ykPa_At_Ug7gIaCbQ_eP9U7oaWdVF8dLQp3yUzpGDkroGPvsOBwK_1o5SaUJLGIZwa8dHdRoCedj99BYXvDzw2bW6f3wvG-dzzijx1bv8Rye7RoBnBpraSmSh4=&uniplatform=NZKPT&language=CHS (accessed on 27 September 2024).
- Boettinger, W.J.; Warren, J.A.; Beckermann, C.; Karma, A. Phase-field simulation of solidification. Annu. Rev. Mater. Res. 2002, 32, 163–194. [Google Scholar] [CrossRef]
- Beckermann, C.; Diepers, H.-J.; Steinbach, I.; Karma, A.; Tong, X. Modeling melt convection in phase-field simulations of solidification. J. Comput. Phys. 1999, 154, 468–496. [Google Scholar] [CrossRef]
- Alexiades, V. Mathematical Modeling of Melting and Freezing Processes; Routledge: London, UK, 2018. [Google Scholar] [CrossRef]
- Acharya, R.; Sharon, J.A.; Staroselsky, A. Prediction of microstructure in laser powder bed fusion process. Acta Mater. 2017, 124, 360–371. [Google Scholar] [CrossRef]
Disclaimer/Publisher’s Note: The statements, opinions and data contained in all publications are solely those of the individual author(s) and contributor(s) and not of MDPI and/or the editor(s). MDPI and/or the editor(s) disclaim responsibility for any injury to people or property resulting from any ideas, methods, instructions or products referred to in the content. |
© 2024 by the authors. Licensee MDPI, Basel, Switzerland. This article is an open access article distributed under the terms and conditions of the Creative Commons Attribution (CC BY) license (https://creativecommons.org/licenses/by/4.0/).