Article

Effect of Over-Aging Degree on Microstructures, Precipitation Kinetics, and Mechanical Properties of an Ultra-High-Strength Al-Zn-Mg-Cu Alloy

1
School of Materials Science and Engineering, Northeastern University, Shenyang 110819, China
2
Key Lab of Electromagnetic Processing of Materials, Ministry of Education, Northeastern University, Shenyang 110819, China
*
Author to whom correspondence should be addressed.
Coatings 2024, 14(11), 1415; https://doi.org/10.3390/coatings14111415
Submission received: 24 September 2024 / Revised: 20 October 2024 / Accepted: 30 October 2024 / Published: 7 November 2024
(This article belongs to the Special Issue Research and Application of High Entropy Alloys)

Abstract

:
The effect of over-aging on the precipitation behavior and mechanical properties of an ultra-high-strength Al-Zn-Mg-Cu alloy was investigated using various over-aging treatment regimes. To reveal the influence of over-aging on matrix precipitation, nucleation and coarsening mechanisms were analyzed based on thermodynamic models and calculated precipitation data. Precipitation kinetics at different over-aging degrees were determined through differential scanning calorimetry analysis and the Johnson–Mehl–Avrami–Kolmogorov equations, revealing the activation energy required to precipitate the η’ phase precipitates ranging from 166.08 to 343.28 kJ/mol, and the activation energy required to precipitate the η phase precipitates ranging from 802.03 to 288.42 kJ/mol from the T6 to T73 conditions. In conjunction with a quantitative microstructure analysis, a highly accurate model was developed by systematically calculating the strengthening components of the ultra-high-strength Al-Zn-Mg-Cu alloy under various aging conditions.

1. Introduction

Al-Zn-Mg-Cu alloys are widely used in the aerospace and modern transportation industries for their outstanding mechanical properties, high specific strength, and superior fracture toughness compared to other categories of aged aluminum alloys [1,2,3]. For Al-Zn-Mg-Cu alloys with constant compositions and manufacturing processes, their performance is highly dependent on the heat treatment regime including the solid solution and aging treatments [4,5]. Among them, aging treatments have received wide attention for their ability to modify the microstructures by altering the type, size, and distribution of the intracrystalline/granular boundary aging precipitates, ultimately affecting the performance of the alloys [4,5].
The precipitation sequence in Al-Zn-Mg-Cu alloys can be summarized as follows: supersaturated solid solution (SSS) → vacancy solute clusters (VRC) → GP zones → metastable η′ phase precipitates→ stable η phase precipitates [4,6,7,8]. These homogeneously distributed nanoscale precipitates in the matrix are the main factors affecting the mechanical properties of Al-Zn-Mg-Cu alloys. The addition of Zn and Mg to the these alloys results in a higher potential difference between the Zn- and Mg-rich aging precipitation phase and the aluminum matrix, resulting in the higher corrosion sensitivity of the alloys, making the alloys susceptible to intergranular and stress corrosion [9]. Conventional T6 treatments achieve excellent static strength performance, but their high corrosion sensitivity limits their suitability for highly corrosion-resistant applications [9,10]. Therefore, researchers are focusing on developing suitable aging processes that can improve the corrosion resistance of Al-Zn-Mg-Cu alloys for broader applications. The conventional single-step over-aging by extending aging time at the peak aging temperature can improve the corrosion resistance. Su et al. reported the effect of single-step aging treatments on the stress corrosion of Spray-Formed 7075 Alloy, and found that extending the aging time at the T6 aging temperature up to 84 h reduces the stress corrosion sensitivity index by about 61% compared with T6 (aging time 24 h) [11]. However, its drawback lies in the excessive aging time required to achieve better corrosion resistance. Subsequently, the two-step aging process improves on the above shortcomings by adding a second aging stage above the peak aging temperature. Cheng et al. reported that the T6 and T7X over-aging processes were adopted for Al-5.8Zn-2.6Mg-1.7Cu, and the T7X over-aging process could reduce the stress corrosion sensitivity index by at least 47% compared with T6 [12]. Murat et al. reported that the selection of an appropriate retrogression time and temperature in the RRA aging process can improve the hardness of 7075-T6 aluminum alloy sheet by about 20% relative to T6, and the anti-SCC property can be improved by 85% relative to T6 in terms of pit concentration [13]. However, Yang et al. reported that when taking the T74 and RRA aging processes for Al-6.0Zn-2.3Mg-1.8Cu-0.1Zr, although RRA improved the static strength by 13% compared to T74, the intergranular corrosion depth increased by 56% compared with T74 [14]. Therefore, due to the characteristics of the above aging processes and the requirement to balance the performance needs and output ratio, the T7X over-aging process is the most commonly used aging treatment process in the industry for corrosion-prone environments [12]. However, most of the studies have focused on the evolution of the precipitation behavior and mechanical properties of the T7X aging process for conventional medium-strength Al-Zn-Mg-Cu alloys with a Zn content of 5.0–8.0 wt.% [12,14,15,16,17,18,19]. For the ultra-high-strength Al-Zn-Mg-Cu alloys with zinc contents greater than 8.0 wt.%, the higher additions of the main alloying elements undergo solid solution treatment for a larger degree of solid solubility in the matrix after quenching compared to the conventional medium-strength Al-Zn-Mg-Cu alloys. This leads to the differences in the precipitation behavior and the evolution of the mechanical properties of the high Zn content Al-Zn-Mg-Cu alloys as compared to the conventional medium strength Al-Zn-Mg-Cu alloys. However, studies on the evolution of the precipitation behavior, precipitation kinetics, and quantitative analysis of the strengthening mechanism of the ultra-high-strength Al-Zn-Mg-Cu alloys under progressively deepening of over-aging by applying the T7X over-aging process are very limited and need to be further investigated.
Therefore, T6, T79, T74, T74, and T73 aging treatments are adopted in the present study to obtain the progressively evolving aging precipitation and mechanical properties, investigate the effect of the over-aging degree on the precipitation behavior, and mechanical properties of a new kind of high Zn-containing Al-Zn-Mg-Cu alloy. The effect of over-aging on the kinetics of matrix precipitation is then analyzed using thermodynamic models, differential scanning calorimetry (DSC) analysis and the Johnson–Mehl–Avrami–Kolmogorov (JMAK) kinetics equations. Ultimately, a suitability strengthening model for the alloy is developed through quantitative analysis of the microstructures of the aged samples. This experiment is dedicated to finding a suitable over-aging process, the appropriate microstructure, and mechanical property prediction for the new kind of high Zn-containing Al-Zn-Mg-Cu alloy.

2. Materials and Methods

The alloy utilized in this research originated from a 152 mm diameter ingot, horizontally cast using the continuous casting method in the laboratory’s foundry. After homogenization in a pit-type cyclone furnace, the ingot was subjected to reverse extrusion to obtain the deformed alloy used in this experiment. The reverse extrusion was performed at 340 °C with a speed of 0.4 mm/s, producing a final extruded bar of 16 mm in diameter. Furthermore, to ensure consistency and eliminate any influence from production variations, all aging samples were derived from the same batch of extruded bars. The chemical compositions of the alloy are shown in Table 1. The elaborate heat treatment processes utilized in the present study are summarized in Table 2. The microstructures of the aged samples were characterized by employing the TECNAI G2 20 Transmission Electron Microscopy (TEM) (Thermo Fisher Scientific Inc., Waltham, MA, USA) with an operating voltage of 200 kV and JEM-ARM200F High Resolution Transmission Electron Microscopy (HRTEM) (Jeol Inc., Akishima, Tokyo, Japan) with an operating voltage of 200 kV. The samples for TEM characterization were milled to a thickness of less than 100 µm and punched into 3 mm diameter sheets. Subsequently, the characterization samples were prepared using the TenuPol-5 Electrolytic Dual Sprayer (Struers Inc, Ballerup, Denmark) with an operating voltage of 17.5 V under −25 °C. The electrolyte compositions were 70% methanol and 30% nitric acid. Tensile samples were designed following ASTM-E8M with a working end diameter of 9 mm. The room aging temperature tensile tests were carried out on the SANSCMT−5000 experimental machine (SANS Shenzhen Experimental Equipment Co., Shenzhen, China) Two parallel tensile specimens are used for each aging sample, and the strain rate of tensile is about 2.5 %/min, and the axial loading speed of 2 mm/min. The DSC test uses DSC-Q100 (TA Instruments Inc.). Nitrogen was used as the shielding gas, and the samples were heated in aluminum crucibles with a diameter of 6 mm. The sample weight was kept below 25 mg, and the heat temperature range of the DSC test is 25 °C to 375 °C with a ramp rate of 10 °C/min. All samples are prepared without secondary heating of the sample to ensure that the preparation process does not interfere with microstructural observations and tensile results.

3. Results

3.1. Aging Precipitation Behavior

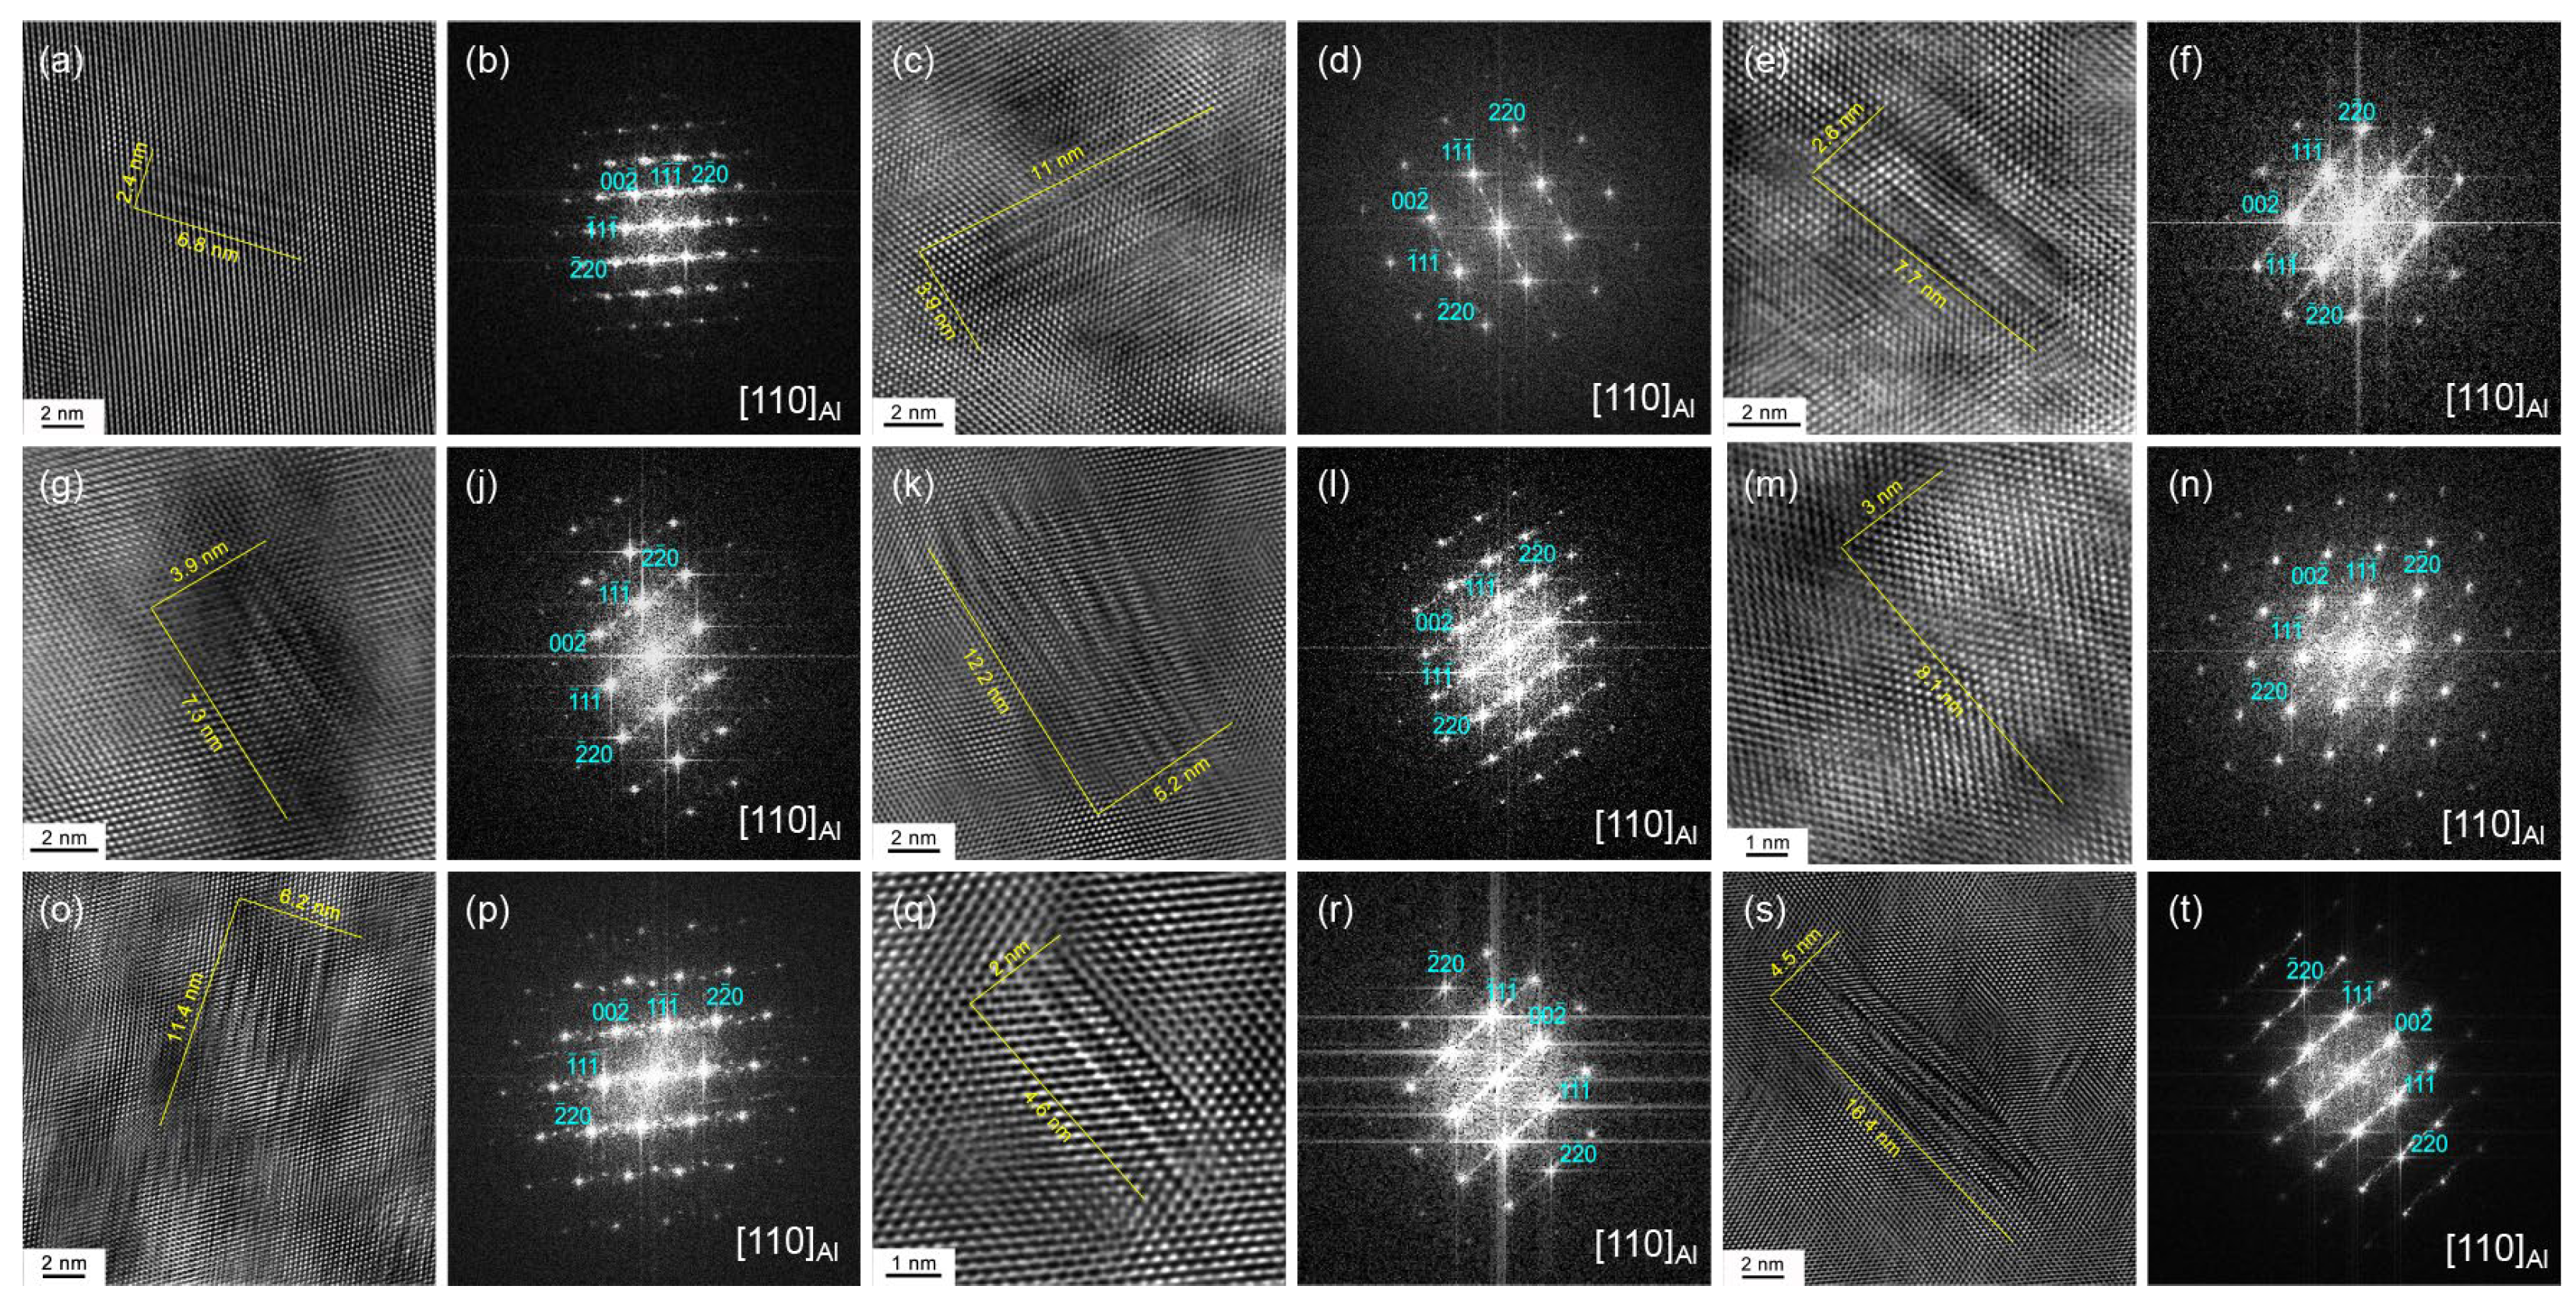
To reveal the impact of the over-aging degree on precipitation behavior, matrix precipitates in samples under various aging conditions were characterized using TEM and HRTEM. Figure 1a–e presents the bright-field TEM images illustrating the matrix precipitates in the various aged samples. Figure 2 shows the high-resolution images of matrix precipitates of the aged samples in the HRTEM mode along the 110 Al zone axis and the diffraction patterns obtained by Fourier transform, respectively. In the T6 aged sample, as shown in Figure 2b, diffraction spots of precipitates are observed at approximately 1/3 and 2/3 of the 1 1 ¯ 1 plane along the 110 Al zone axis, which are attributed to η′ phase precipitates [20,21,22]. The T79 aged sample shows the diffraction spots of precipitates at approximately 1/3 and 2/3 of the 1 1 ¯ 1 ¯ plane along the 110 Al zone axis, which are also attributed to η′ phase precipitates, as shown in Figure 2d [20,21,22]. Furthermore, the T79 aged sample also shows the diffraction spots of precipitates at approximately 1/2 of the 1 1 ¯ 1 plane along the 110 Al zone axis, as illustrated in Figure 2f, which are identified as η phase precipitates [23,24]. The diffraction spots associated with both η′ and η phase precipitates are similarly observed in the T76 to T73 aged samples, as shown in Figure 2j,i,n,p,r,t. Thus, the above analysis suggests that the main matrix precipitates in the T6 aged sample are η′ phase precipitates, whereas the main matrix precipitates in the aged samples shift to include both η′ and η phase precipitates following over-aging treatments.
To precisely assess the influence of various aging treatments on the evolution of the matrix precipitation, precipitation size distribution statistics and the average diameter of the matrix precipitation in the aged samples were carried out using the ImageJ image processing software (https://imagej.net). For each aging sample, at least 300 precipitates were measured within the same field of view under TEM. The results show that the precipitation length, thickness, and diameter of all aged samples show Gaussian distributions, respectively, as shown in Figure 3. Furthermore, the length, thickness, and diameter of matrix precipitates increase as the over-aging progresses, suggesting that matrix precipitation progressively becomes coarser with a greater degree of over-aging.
In addition, the volume fractions of the matrix precipitates are calculated using the following method [25]:
f platelet = f sphere + 2 f platelet f cor
f sphere = f platelet = N platelet t platelet D platelet 2 π / 4
f cor = ( 4 π / 3 ) R ¯ mean 3 N platelet
where f s p h e r e represents the volume fraction of the observed round precipitates; f p l a t e l e t represents the volume fraction of the observed platelet-shaped precipitates; f c o r represents the volume fraction of the observed round precipitates which are platelets; t p l a t e l e t represents the thickness of the observed platelet-shaped precipitates; D p l a t e l e t represents the diameter of the observed platelet-shaped precipitates; and N p l a t e l e t is the density of edge-on platelet-shaped precipitates. From the T6 to T73 aged samples, the volume fractions of matrix precipitation are 2.75%, 2.91%, 3.07%, 3.25%, and 3.32%, respectively.

3.2. Tensile Properties

Figure 4 illustrates the ultimate tensile strength (UTS), yield strength (YS), and elongation (El) of various aged samples. The T6 aged sample exhibits the highest UTS and YS. As the degree of over-aging increases, the UTS and YS of the aged samples decrease. Conversely, the El progressively increases as the static strength of the aged samples decreases, aligning with the conventional inverse relationship between static strength and plasticity.

4. Discussion

4.1. Effect of the Over-Aging Degree on the Precipitation Evolution of Matrix Precipitation

Based on the above results, it is evident that the size, number density, and volume fraction of matrix precipitation precipitates significantly affect the degree of over-aging. As depicted in Figure 1, the precipitation behavior in all aged samples exhibit uniform precipitation behavior. Generally, the evolution of matrix precipitation in aluminum alloys can be divided into the following three discrete, yet continuous steps: (1) the nucleation of the new phase precipitates; (2) the growth of the nucleated phase precipitates; and (3) the coarsening of the phase precipitates [26]. The driving force for precipitation ( Δ g ) during the ageing process is described by the following equation [27,28]:
g = k T ln C m / C e q v a t
where v a t is the atomic volume, treated as a constant for a given alloy composition; k is the Boltzmann constant; T is the current aging temperature; C e q and C m refer to the equilibrium and matrix solute concentrations, respectively. From Equation (4), it is clear that the nucleation driving force is influenced by the aging temperature when the matrix solute concentration is constant. The higher the aging temperature, the stronger the nucleation drive. Meanwhile, the evolution of the precipitation not only depends on Δ g , but the critical nucleation radius also plays a crucial role in the precipitation/dissolution of new precipitates. The critical nucleation radius ( R ) can be defined by the following equation [28]:
R = 2 γ v a t k T ln ( C m / C e q ) = 2 γ Δ g
where γ represents the surface energy between the precipitate and matrix. Based on Equation (5), higher temperatures reduce the critical nucleation radius while increasing the nucleation drive. Precipitate growth is a dynamic process where new precipitates form continuously around the existing ones. According to the Gibbs–Thomson effect, the smaller-size precipitates have larger surface-to-volume ratios, causing a solute concentration gradient between large and small precipitates. Solute elements tend to diffuse from smaller precipitates to larger ones, leading to the dissolution of smaller precipitates and the coarsening of larger ones. This process is known as the Ostawald ripening process. The kinetics of this coarsening process can be expressed as [29]:
r ¯ 3 r 0 3 = D γ C e t
where r ¯ is the average precipitate radius; r 0 is the initial radius at the aging time t = 0 ; D is the diffusion coefficient; C e is the solid concentrations for larger precipitates. According to Equation (6), it can be inferred that as aging progresses at a constant temperature, the average precipitate radius increases. Furthermore, D and C e increase exponentially as the aging temperature rises. Therefore, the coarsening rate of precipitates increases with higher aging temperatures.
Under the T6 peak-aging condition, a lower aging temperature results in a relatively smaller precipitation nucleation drive, larger critical nucleation radius, and slower coarsening rate compared to the T7X condition. Consequently, matrix precipitates nucleate and grow more slowly, resulting in a denser and finer precipitate distribution, as shown in Figure 1a. However, in the T7X two-stage aging process, pre-aging ensures that a certain amount of matrix precipitates already exist. During the second aging stage, the higher temperature generates a stronger nucleation drive, leading to smaller critical nucleation radii and the formation of matrix precipitates early in the stage. However, a large size gap would be created between newly formed and pre-existing precipitates. According to the Gibbs–Thomson effect, the smaller nascent precipitates dissolve quickly, while the larger ones continue to grow [29]. As the second stage of aging treatment continues, smaller precipitates dissolve, and larger ones persistently coarsen. Meanwhile, it can be concluded from Equation (6) that a higher aging temperature results in a faster coarsening rate. Therefore, Equation (6) shows that a higher aging temperature accelerates the coarsening rate, leading to larger precipitates, lower number density, and higher volume fraction for the T79 condition compared to the T6 condition. Additionally, as the degree of over-aging progresses, the average precipitation size increases due to the higher coarsening rate. Consequently, small precipitates continue to dissolve during coarsening, resulting in larger precipitates, lower number density, and a gradually increasing precipitate volume fraction from T79 to T73 conditions.

4.2. Effect of the Over-Aging Degree on the Precipitation Kinetics of Matrix Precipitation

In this study, the selected diffraction patterns from HRTEM results reveal that the primary matrix precipitates in the T6 condition are η′ phase precipitates, while both η′ and η phase precipitates appear in the T7X aged samples, as shown in Figure 2. This suggests that the over-aging degree significantly affects the type of matrix precipitation of the samples. Since the aging treatment regimes constantly affect the precipitation kinetics, which in turn leads to alterations in the matrix precipitation behavior. The precipitation and dissolution of phase precipitates during the heating of aged samples represent endothermic and exothermic reactions, respectively, and can be characterized by DSC thermograms [30,31,32]. Therefore, to gain insight into the effect of the over-aging degree on the precipitation behavior of the alloy, the precipitation kinetics of each aged sample need to be analyzed by using DSC thermograms.
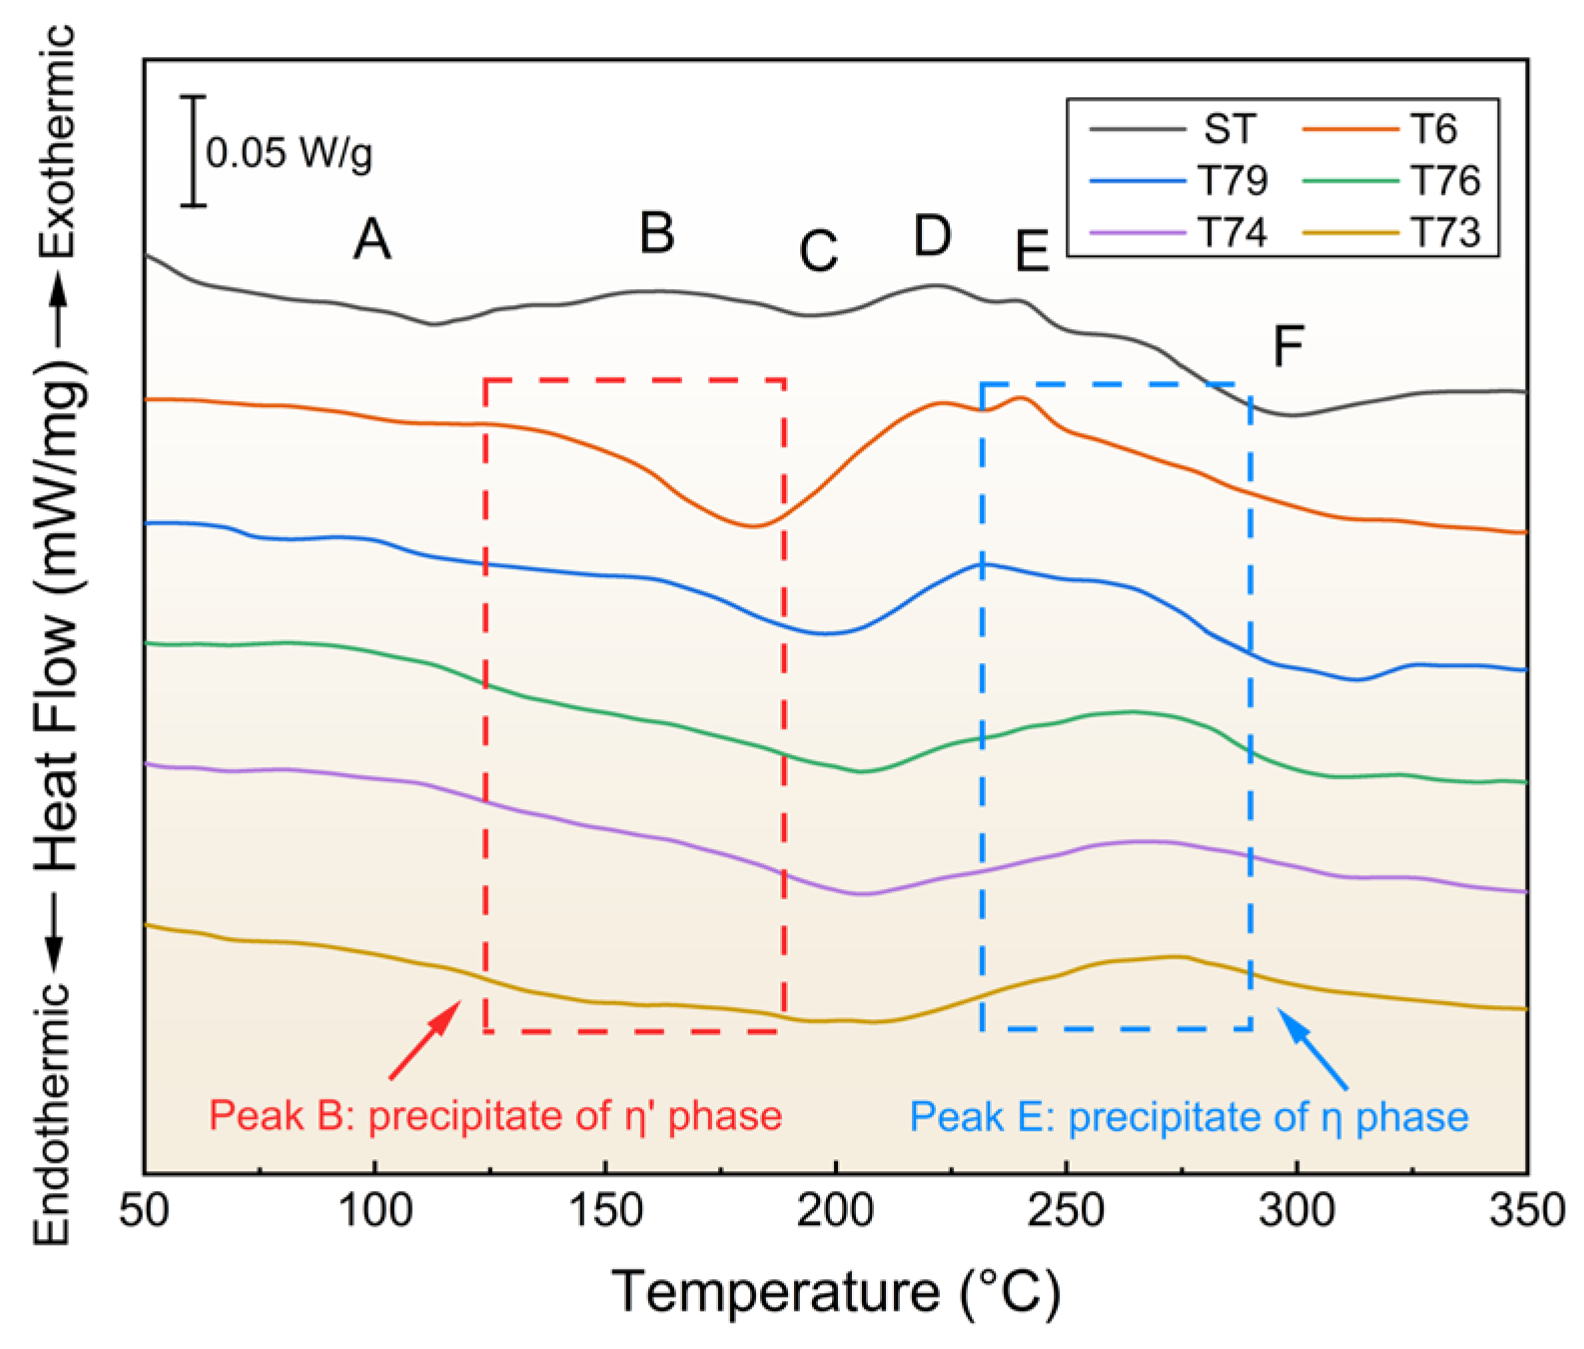
According to previous studies, the overheating temperature for Al-Zn-Mg-Cu alloys is typically above 485 °C [33]. Since none of the samples were heated beyond this temperature range, no oxidation was observed during the heating process. Therefore, the experimental results were not affected by the presence of oxides. As a reference, the solid solution treatment sample was first analyzed via DSC, as shown in Figure 5. In the DSC thermogram of the solid solution sample, the first endothermic peak (peak A) appears at about 112 °C and is considered to be related to the dissolution of the GP zone’s phase precipitates [34,35]. Subsequently, the first exothermic peak (peak B) appears at about 160 °C, corresponding to the formation of η’ phase precipitates [34,35]. As the aging temperature increases, the η′ phase precipitates dissolve, resulting in the endothermic peak (peak C) at approximately 194 °C [34,35]. Then, two consecutive exothermic peaks (peaks D and E) are detected at about 222 °C and 240 °C, respectively, which are associated with the occurrence of the transformation of the residual η’ phase precipitates as precursors to the η phase precipitates (η2) and the formation of the η phase precipitates (η1), respectively [34,35]. Finally, the endothermic peak (peak F) present at about 298 °C corresponds to the dissolution of the stabilized equilibrium phase precipitates [34,35].
The JMAK equations can be implemented in combination with the DSC thermograms of the aged samples to estimate the precipitation activation energies of the η′ and η phase precipitates for each aged sample [36,37]. The JMAK model is expressed as [38,39]:
Y = 1 exp ( k n t n )
k = k 0 exp ( Q R T )
where Y is the precipitate volume fraction; k is the nucleation type constant; n is the growth mode constant; Q is the activation energy; T is the absolute temperature; and R is the gas constant (8.314 J / mol   ×   K ) [39]. Equation (7) can be used to describe non-isothermal transformations. According to Equations (7) and (8), the transformation rate can be obtained. Thus, the equation of the rate of transformation can be written as:
d Y d t = k ( T ) f ( Y )
where f Y is the implicit function of Y from Equation (7). Generally, the reaction function f Y is unspecified at the beginning of the analysis. A series of standard functions representing a particular ideal reaction model are proposed [39,40]. The function f Y is determined by assuming a suitable form and verifying it with experimental data [39,40]. A general relationship for given sigmoidal behavior is [39,40]:
f ( Y ) = Y r ( 1 Y ) m
where exponents r and m are constant. Equation (10) can be incorporated with JMAK kinetics equations, and the sigmoidal behavior is also expressed as:
f ( Y ) = n ( 1 Y ) ln ( 1 Y ) n 1 n
where the exponent n is the growth parameter and is a constant that depends on the growth modes of precipitates. For Al-Zn-Mg-Cu alloys, the growth parameter n can be represented as 1, 3/2, 2, and 3 [39,41]. From the DSC thermograms, the mole fraction Y which is the amount of phase precipitates or dissolved within the specified aging temperature range can be expressed as [41]:
Y = A ( T ) A f
where A T is the area under a certain endothermic or exothermic peak from the initial aging temperature T i and a given aging temperature T ; A f is the overall area of the peak of the thermograph. Thus, the transformation rate can be also written as [39,41]:
d Y d t = d Y d T d T d t = u d Y d T
where u is the heating rate. In the current study, the heating rate is 10 °C/min. Combining Equations (5), (6) and (10), the final equation can be written as:
ln d Y d T u f ( Y ) = ln k 0 Q R 1 T
through the linear fitting of the curve of l n d Y / d T u / f Y vs. 1 / T , the slope of the fitted line can be obtained, and the activation energy Q of the corresponding thermal reaction peak can be calculated [39,41].
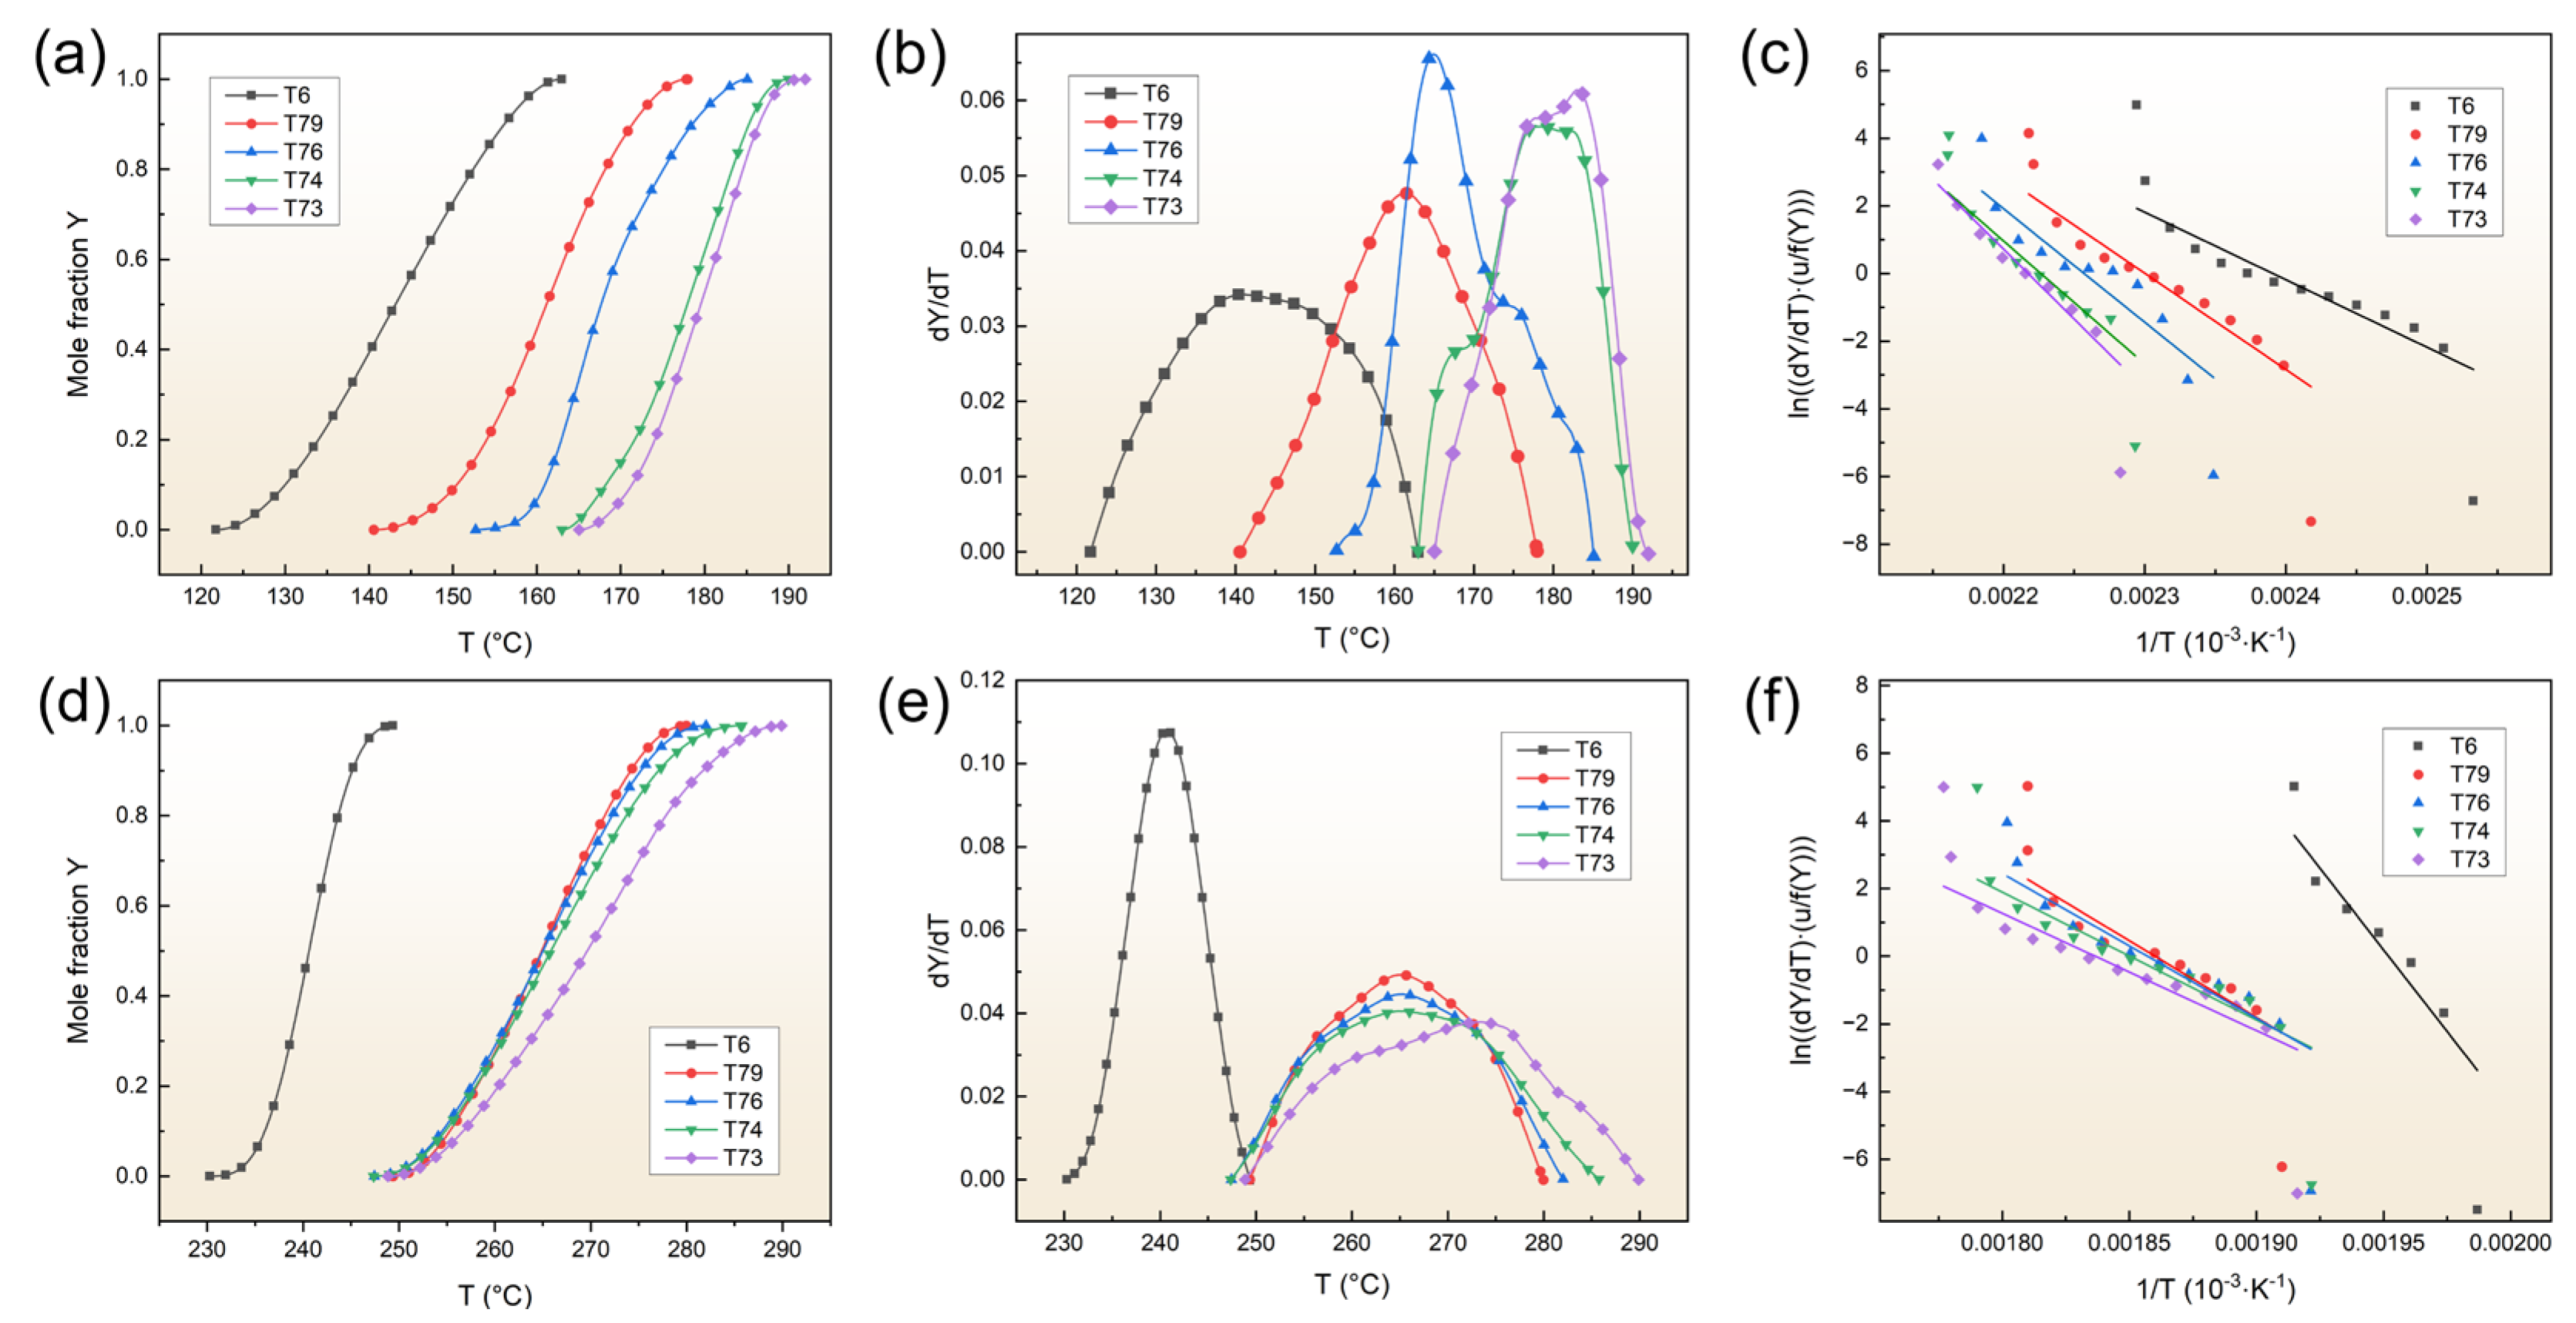
The Y vs. T curves, d Y / d T vs. T curves, and l n d Y / d T u / f Y vs. 1 / T curves representing the exothermic peaks B and E of η′ and η phase precipitates in the DSC curves of various aged samples are calculated using Equations (12)–(14), as shown in Figure 6. It should be noted that all l n d Y / d T u / f Y vs. 1 / T curves are fitted with the highest accuracy when the growth parameter n = 1 . Therefore, the activation energies of η′ and η phase precipitates are calculated for various aged samples as shown in Figure 7. Combining Figure 6c and Figure 7a, it is observed that the T6 aged sample has the largest slope of l n d Y / d T u / f Y vs. 1 / T about η′ phase precipitates, and the lowest activation energy required to precipitate the η′ phase precipitates. This suggests that the η′ phase precipitates most easily precipitate in the matrix under the T6 aging treatment. However, the slopes of l n d Y / d T u / f Y vs. 1 / T concerning η′ phase precipitates decrease progressively with the increasing over-aging degree, leading to a gradual growth of the activation energy required to precipitate η′ phase precipitates under the T7X aging treatments, as shown in Figure 6c and Figure 7a. However, the presence of η’ phase precipitates is still found in the T7X samples, as shown in Figure 2. It can still be assumed that as over-aging proceeds, the precipitates of the η′ phase precipitates will become increasingly resistant to precipitation in the matrix.
In contrast, the calculations for the exothermic peak E show the opposite trend concerning peak B. From Figure 6f and Figure 7b, it can be observed that the T6 aged sample has the smallest slope of l n d Y / d T u / f Y vs. 1 / T for η phase precipitates. According to Figure 7b, the activation energy required for η phase precipitation in the T6 sample is about twice that of the T79 sample. This suggests that η phase precipitates are difficult to form in the T6 sample, which is why they are rarely found in T6 samples. For the T7X aged samples, the slopes of l n d Y / d T u / f Y vs. 1 / T for η phase precipitates gradually increase with the deepening of over-aging, and the activation energy required to precipitate the η phase precipitates progressively decreases, as shown in Figure 6f and Figure 7b. It can be assumed that the precipitation of η phase precipitates is eases with the deepening of over-aging.

4.3. Strengthening Model

It has been shown that the over-aging degree has a significant impact on the static strength of the aged samples according to the above research results. This phenomenon is caused by the differences in microstructures among the various aged samples. In general, the enhancement in strength of ultra-high strength aluminum alloys is achieved through the synergistic interaction of multiple mechanisms, mainly including grain boundary strengthening, solid solution strengthening, dislocation strengthening, and precipitation strengthening.
Grain boundary strengthening σ g b is typically described using the Hall–Petch relation [42]:
σ g b = σ 0 + k y d 1 / 2
where σ 0 represents the frictional stress of pure aluminum (~10 MPa); k y is the Hall–Petch coefficient, approximately 0.12 MPa·m−1/2 for the Al-Zn-Mg-Cu alloy [43]; and d denotes the average grain size. As supported by previous studies, the recrystallization temperature of Al-Zn-Mg-Cu alloy is typically above 300 °C [44]. Since the aging treatment temperature used was significantly lower than the recrystallization temperature, the same solid solution treatment was used for all aging samples. Therefore, it can be assumed that the grain size remains essentially constant under different aging conditions. The solid solution state specimens were coated using the anodic coating technique to facilitate the presentation of the grains in the extrusion direction and the grain morphology was observed using the optical microscope as shown in Figure 8a,b. Further, the grain diameter in the extrusion direction was measured by ImageJ image analysis software and the average grain size was calculated to be about 27.13 µm, as shown in Figure 8c.
The solid solution contribution to the sample strength σ s s can be evaluated using the following equation [45]:
σ s s = σ s s 0 ( 1 0.5 f v f p e a k ) 2 / 3
where σ s s 0 represents the initial contribution strength from the solid solution of the samples; f v is the volume fraction of the current sample; and the f p e a k is the volume fraction of precipitation under the peak strength, which can be chosen from the T6 aged sample in the present study. The value of σ s s 0 can be determined by the equation below [46]:
σ s s 0 = Σ i K i C i 2 / 3
where C i is the concentration (wt.%) of element i of the sample; K i is the hardening constant for element i . The strengthening effect of other trace elements can be disregarded, as the major alloying elements of the alloy are Zn, Mg, and Cu. For the Al-Zn-Mg-Cu alloys, the values of K i reported by Dixit et al. are K Z n = 3.085 MPa·wt.%2/3, K M g = 20.481 MPa·wt.%2/3, and K C u = 12.431 MPa·wt.%2/3 for zinc, magnesium and copper, respectively [47].
The increase in strength resulting from dislocation work hardening σ d i s is described by the following equation [47]:
σ d i s = B G m b L s
where B is a constant, set to 0.2 for FCC alloys [47]; G m is the shear modulus of the alloy matrix, valued at 26.9 GPa for aluminum alloys [47]; b represents the Burgers vector, which is 0.286 nm for aluminum alloys [47]; and L s is the average spacing of precipitation, determined using Equation (19) [48]:
L s = R ¯ 2 π 3 f v
where the R ¯ is the average radius of precipitates.
For age-strengthened Al-Zn-Mg-Cu alloys, matrix precipitation is uniformly distributed in the matrix and acts as a barrier to dislocations, contributing significantly to the increment of strength. The interaction of the matrix precipitation and dislocations determines the differences in strength contributions, which can be divided into shear and bypass mechanisms. The critical shear radius R c determines the interaction of the precipitation and dislocations. When the precipitation radius R < R c , the dislocation can shear the precipitation. When the precipitation radius R > R c , the dislocation needs to bypass the precipitation. Hornbogen et al. calculated the critical shear radius R c for precipitation-hardening alloys containing a combination of shearable and non-shearable precipitates [49]:
R c = 2 π G m b G p
where G m is the shear modulus of the aluminum matrix (26.9 GPa), b is the Burgers vector, and G p is the shear modulus of the non-coherent precipitation. For the Al-Zn-Mg-Cu alloys, the η phase is the non-coherent precipitation with a shear modulus of 24.3GPa [50]. The critical shear radius R c is determined to be 2 nm using Equation (20). The contribution of the shear mechanism σ p / s h e a r to the strength can be given by the following equation [51,52,53]:
σ p / s h e a r = 3 4 π β k p 3 / 2 M T G m b f v R 1 / 2
where G m is the shear modulus of the aluminum matrix (26.9 GPa); b is the Burgers vector (0.286 nm); β and k p are coefficients, which are defined as 0.43 and 0.07 for the Al-Zn-Mg-Cu alloys [53]; M T is the Taylor factor, which is an appropriate value of 2 for the above model in the Al-Zn-Mg-Cu system [53]. The bypass mechanism’s contribution to the strength σ p / b y p a s s can be provided by the following equation [51,52,53]:
σ p / b y p a s s = 0.6 M T G m b f v R
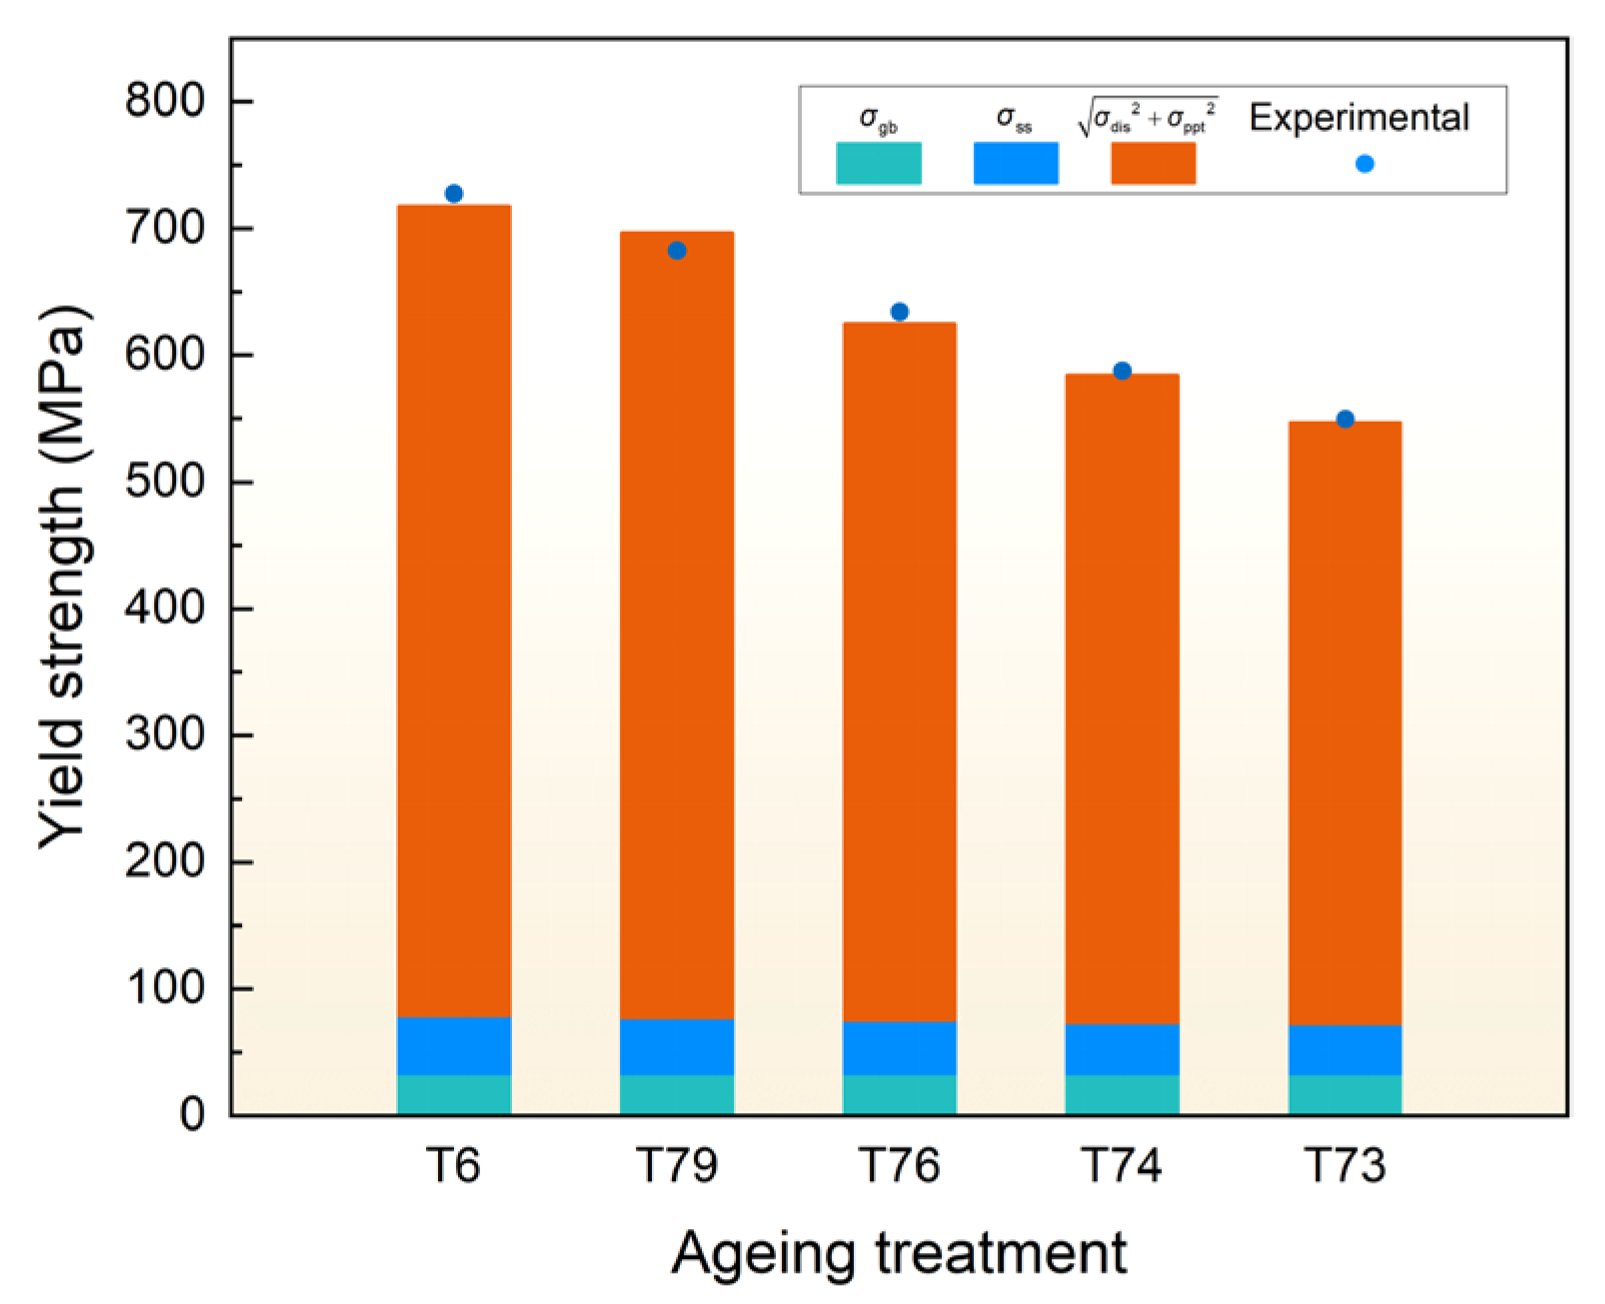
Ultimately, the contribution of each strengthening component to the yield strength has been calculated by using the following equation [28], and the results are shown in Figure 9:
σ y = σ g b + σ s s + σ d i s 2 + σ p 2
Moreover, the calculated values are further compared with the experimentally measured yield strengths of the various over-aging samples, as shown in Figure 9. It is found that the strength errors are within 3%, suggesting that the above strengthening model can be suitable for evaluating the yield strength of the present alloy under the over-aging degree.

5. Conclusions

In summary, the effect of the over-aging degree on the precipitation behavior and mechanical properties of an ultra-high-strength Al-Zn-Mg-Cu alloy was investigated using T6, T79, T76, T74, and T73 aging treatment regimes, and the microstructure analyses were carried out by TEM, HRTEM, and DSC. The main findings of this study are the following:
  • Both the average size and volume fraction of matrix precipitates increased with the deepening of the over-aging;
  • The static strengths of the alloy decreased with the deepening of over-aging, while elongation improved with increased over-aging;
  • TEM confirms that the matrix precipitates are η′ phase precipitates in the T6 sample, and η′ and η phase precipitates in the T7X samples. The activation energies required to precipitate the η′ and η phase precipitates of the various aging samples were determined using the DSC and JMAK equations. The results indicate that the precipitation of η′ and η phases in all samples is controlled by the kinetics of the aging process. After the calculations of the JMAK equations, the activation energy required to precipitate the η′ phase precipitates ranging from 166.08 to 343.28 kJ/mol, and the activation energy required to precipitate the η phase precipitates ranging from 802.03 to 288.42 kJ/mol from the T6 to T73 conditions. Compared to the T7X treatments, the lowest activation energy required to precipitate the η′ phase precipitates, and the highest for η phase precipitates were calculated under the T6 treatment, suggesting that η phase precipitates are difficult to precipitate under the T6 treatment. Under T7X treatments, the activation energy required to precipitate η′ phase precipitation increased with increasing over-aging, while the opposite trend was observed for η phase precipitates, indicating that T7X treatments promote η phase precipitation;
  • The strengthening components of the ultra-high strength Al-Zn-Mg-Cu alloy under various over-aging degrees are systematically calculated through quantitative microstructure analysis. A high-precision model suitable for evaluating the yield strength of the current alloy under over-aging conditions was established.

Author Contributions

Conceptualization, Y.L., Z.Z., and G.W.; methodology, Y.L., Z.Z., and G.W.; software, Y.L.; validation, Y.L., Z.Z., and G.W.; formal analysis, Y.L.; investigation, Y.L.; resources, Z.Z., and G.W.; data curation, Y.L.; writing–original draft preparation, Y.L.; writing–review and editing, Y.L., and Z.Z.; visualization, Y.L.; supervision, Z.Z.; project administration, Z.Z., and G.W.; funding acquisition, Z.Z., and G.W. All authors have read and agreed to the published version of the manuscript.

Funding

This work was supported by the National Key Research and Development Program of China (Grant No. 2023YFB3710902), and the Liaoning Province Science and Technology Program Projects (Grant No. 2022JH2/101300011).

Institutional Review Board Statement

The study not involving humans or animals.

Informed Consent Statement

The study not involving humans.

Data Availability Statement

The authors declare that data analyzed and shown in the paper are available from the corresponding authors on reasonable request.

Acknowledgments

This work was supported by the National Key Research and Development Program of China (Grant No. 2023YFB3710902), and the Liaoning Province Science and Technology Program Projects (Grant No. 2022JH2/101300011). Special thanks are due to the instruments from the Analytical and Testing Center, Northeastern University.

Conflicts of Interest

The authors declare no conflicts of interest.

Nomenclature

f the volume fraction of precipitates
N the density of precipitates
t the thickness of precipitates
D p l a t e l e t the diameter of platelet-shaped precipitates
Δ g the driving force for precipitation
v a t the atomic volume
k the Boltzmann constant for the driving force for precipitation ( Δ g )
T the current aging temperature
C refer to the solute concentrations
R the critical nucleation radius
γ the surface energy
r ¯ the average precipitate radius
r 0 the initial radius at the aging time t = 0
D is the diffusion coefficient
Y the precipitate volume fraction for the JMAK equations
k the nucleation type constant for the JMAK equations
n the growth mode constant for the JMAK equations
Q the activation energy
T the absolute temperature for the JMAK equations
R the gas constant for the JMAK equations
u the heating rate
A the area fraction for DSC thermograms
σ g b the contribution of grain boundary strengthening
σ 0 the frictional stress of pure aluminum
k y the Hall–Petch coefficient
d the average grain size
σ s s the contribution of solid solution strengthening
σ s s 0 the initial contribution strength from the solid solution of the samples
K i is the hardening constant for element i
σ d i s the contribution of dislocation work hardening
L s the average spacing of precipitation
R ¯ the average radius of precipitates
R c the critical shear radius
σ p the contribution of the precipitation strengthening
G m the shear modulus of the aluminum matrix
b the Burgers vector
β the coefficient
β thecoefficient
M T the Taylor factor

References

  1. Dursun, T.; Soutis, C. Recent developments in advanced aircraft aluminium alloys. Mater. Des. (1980–2015) 2014, 56, 862–871. [Google Scholar] [CrossRef]
  2. Froes, F. Advanced metals for aerospace and automotive use. Mater. Sci. Eng. A-Struct. Mater. Prop. Microstruct. Process. 1994, 184, 119–133. [Google Scholar] [CrossRef]
  3. Mouritz, A.P. Introduction to Aerospace Materials; Elsevier: Amsterdam, The Netherlands, 2012. [Google Scholar]
  4. Azarniya, A.; Taheri, A.K.; Taheri, K.K. Recent advances in ageing of 7xxx series aluminum alloys: A physical metallurgy perspective. J. Alloy. Compd. 2019, 781, 945–983. [Google Scholar] [CrossRef]
  5. Rometsch, P.A.; Zhang, Y.; Knight, S. Heat treatment of 7xxx series aluminium alloys—Some recent developments. Trans. Nonferrous Met. Soc. China 2014, 24, 2003–2017. [Google Scholar] [CrossRef]
  6. Hadjadj, L.; Amira, R.; Hamana, D.; Mosbah, A. Characterization of precipitation and phase transformations in Al–Zn–Mg alloy by the differential dilatometry. J. Alloy. Compd. 2008, 462, 279–283. [Google Scholar] [CrossRef]
  7. Berg, L.; Gjønnes, J.; Hansen, V.; Li, X.; Knutson-Wedel, M.; Schryvers, D.; Wallenberg, L. GP-zones in Al–Zn–Mg alloys and their role in artificial aging. Acta Mater. 2001, 49, 3443–3451. [Google Scholar] [CrossRef]
  8. Liu, J.; Chen, J.; Yang, X.; Ren, S.; Wu, C.; Xu, H.; Zou, J. Revisiting the precipitation sequence in Al–Zn–Mg-based alloys by high-resolution transmission electron microscopy. Scr. Mater. 2010, 63, 1061–1064. [Google Scholar] [CrossRef]
  9. Rao, A.U.; Vasu, V.; Govindaraju, M.; Srinadh, K.S. Stress corrosion cracking behaviour of 7xxx aluminum alloys: A literature review. Trans. Nonferrous Met. Soc. China 2016, 26, 1447–1471. [Google Scholar] [CrossRef]
  10. Speidel, M.O. Stress corrosion cracking of aluminum alloys. Metall. Trans. A 1975, 6, 631–651. [Google Scholar] [CrossRef]
  11. Su, R.; Liu, T.; Qu, Y.; Bai, G.; Li, R. Mechanical properties and corrosion behavior of spray-formed 7075 alloy with one-stage aging. J. Mater. Eng. Perform. 2019, 28, 2212–2220. [Google Scholar] [CrossRef]
  12. Cheng, Q.; Ye, L.; Huang, Q.; Dong, Y.; Liu, S. Effect of two-stage overaging on microstructure and corrosion properties of an Al–Zn–Mg–Cu alloy. J. Mater. Res. Technol.-JMRT 2022, 20, 3185–3194. [Google Scholar] [CrossRef]
  13. Baydogan, M.; Cimenoglu, H.; Sabri Kayali, E.; Rasty, J. Improved resistance to stress-corrosion-cracking failures via optimized retrogression and reaging of 7075-T6 aluminum sheets. Metall. Mater. Trans. A-Phys. Metall. Mater. Sci. 2008, 39, 2470–2476. [Google Scholar] [CrossRef]
  14. Yang, W.; Ji, S.; Zhang, Q.; Wang, M. Investigation of mechanical and corrosion properties of an Al–Zn–Mg–Cu alloy under various ageing conditions and interface analysis of η′ precipitate. Mater. Des. 2015, 85, 752–761. [Google Scholar] [CrossRef]
  15. Cao, F.; Qin, Z. Effect of two-stage aging on hardness and electrical conductivity of as-extruded 7075 aAluminum Alloy. J. Phys. Conf. Ser. 2021, 1885, 042035. [Google Scholar] [CrossRef]
  16. Cai, S.; He, Y.; Song, R. Study on the strengthening mechanism of two-stage double-peaks aging in 7075 aluminum alloy. Trans. Indian Inst. Met. 2020, 73, 109–117. [Google Scholar] [CrossRef]
  17. Liu, K.; Zhao, G.; Tian, N. Two-step Aging Treatment in Ultra-High-Strength Al-Zn-Mg-Cu Aluminum Alloy. In MATEC Web of Conferences; EDP Sciences: Les Ulis, France, 2016; p. 05020. [Google Scholar]
  18. Lin, L.; Liu, Z.; Ying, P.; Liu, M. Improved stress corrosion cracking resistance and strength of a two-step aged Al-Zn-Mg-Cu alloy using Taguchi method. J. Mater. Eng. Perform. 2015, 24, 4870–4877. [Google Scholar] [CrossRef]
  19. Puiggali, M.; Zielinski, A.; Olive, J.; Renauld, E.; Desjardins, D.; Cid, M. Effect of microstructure on stress corrosion cracking of an Al-Zn-Mg-Cu alloy. Corros. Sci. 1998, 40, 805–819. [Google Scholar] [CrossRef]
  20. Chen, Z.; Yan, K.; Ren, C.; Naseem, S. Precipitation sequence and hardening effect in 7A85 aluminum alloy. J. Alloys Compd. 2021, 875, 159950. [Google Scholar] [CrossRef]
  21. Liu, Y.; Liang, S.; Jiang, D. Influence of repetitious non-isothermal aging on microstructure and strength of Al-Zn-Mg-Cu alloy. J. Alloys Compd. 2016, 689, 632–640. [Google Scholar] [CrossRef]
  22. Yang, W.; Ji, S.; Wang, M.; Li, Z. Precipitation behaviour of Al–Zn–Mg–Cu alloy and diffraction analysis from η′ precipitates in four variants. J. Alloys Compd. 2014, 610, 623–629. [Google Scholar] [CrossRef]
  23. Luo, J.; Luo, H.; Li, S.; Wang, R.; Ma, Y. Effect of pre-ageing treatment on second nucleating of GPII zones and precipitation kinetics in an ultrafine grained 7075 aluminum alloy. Mater. Des. 2020, 187, 108402. [Google Scholar] [CrossRef]
  24. Park, S.; Kayani, S.H.; Euh, K.; Seo, E.; Kim, H.; Park, S.; Yadav, B.N.; Park, S.J.; Sung, H. High strength aluminum alloys design via explainable artificial intelligence. J. Alloys Compd. 2022, 903, 163828. [Google Scholar] [CrossRef]
  25. Dumont, M.; Lefebvre, W.; Doisneau-Cottignies, B.; Deschamps, A. Characterisation of the composition and volume fraction of η′ and η precipitates in an Al–Zn–Mg alloy by a combination of atom probe, small-angle X-ray scattering and transmission electron microscopy. Acta Mater. 2005, 53, 2881–2892. [Google Scholar] [CrossRef]
  26. Nicolas, M.; Deschamps, A. Characterisation and modelling of precipitate evolution in an Al–Zn–Mg alloy during non-isothermal heat treatments. Acta Mater. 2003, 51, 6077–6094. [Google Scholar] [CrossRef]
  27. Aaronson, H.; Kinsman, K.; Russell, K. The volume free energy change associated with precipitate nucleation. Scr. Metall. 1970, 4, 101–106. [Google Scholar] [CrossRef]
  28. Deschamps, A.; Brechet, Y. Influence of predeformation and ageing of an Al–Zn–Mg alloy—II. Modeling of precipitation kinetics and yield stress. Acta Mater. 1998, 47, 293–305. [Google Scholar] [CrossRef]
  29. Wen, Y.; Wang, Y.; Chen, L. Coarsening dynamics of self-accommodating coherent patterns. Acta Mater. 2002, 50, 13–21. [Google Scholar] [CrossRef]
  30. Panigrahi, S.; Jayaganthan, R.; Pancholi, V.; Gupta, M. A DSC study on the precipitation kinetics of cryorolled Al 6063 alloy. Mater. Chem. Phys. 2010, 122, 188–193. [Google Scholar] [CrossRef]
  31. Birolia, G.; Cagliotiab, G.; Martini, L.; Riontino, G. Precipitation kinetics of AA4032 and AA6082: A comparison based on DSC and TEM. Scr. Mater. 1998, 39, 197–203. [Google Scholar] [CrossRef]
  32. Lang, P.; Wojcik, T.; Povoden-Karadeniz, E.; Falahati, A.; Kozeschnik, E. Thermo-kinetic prediction of metastable and stable phase precipitation in Al–Zn–Mg series aluminium alloys during non-isothermal DSC analysis. J. Alloy. Compd. 2014, 609, 129–136. [Google Scholar] [CrossRef]
  33. Wang, Z.; Geng, J.; Pu, Q.; Li, K.; Luo, T.; Li, Y.; Xia, P.; Li, X.; Chen, D.; Sha, G. Achieving high performance by optimized heat treatment in a spray formed Al–Zn–Mg–Cu alloy. Mater. Sci. Eng. A 2024, 893, 146134. [Google Scholar] [CrossRef]
  34. Jiang, J.; Tang, Q.; Yang, L.; Zhang, K.; Yuan, S.; Zhen, L. Non-isothermal ageing of an Al–8Zn–2Mg–2Cu alloy for enhanced properties. J. Mater. Process. Technol. 2016, 227, 110–116. [Google Scholar] [CrossRef]
  35. Jiang, J.; Xiao, W.; Yang, L.; Shao, W.; Yuan, S.; Zhen, L. Ageing behavior and stress corrosion cracking resistance of a non-isothermally aged Al–Zn–Mg–Cu alloy. Mater. Sci. Eng. A-Struct. Mater. Prop. Microstruct. Process. 2014, 605, 167–175. [Google Scholar] [CrossRef]
  36. Satrink, M.; Zahra, A.-M. The kinetics of isothermal β′ precipitation in Al-Mg alloys. J. Mater. Sci. 1999, 34, 1117–1127. [Google Scholar] [CrossRef]
  37. Aouabdia, Y.; Boubertakh, A.; Hamamda, S. Precipitation kinetics of the hardening phase in two 6061 aluminium alloys. Mater. Lett. 2010, 64, 353–356. [Google Scholar] [CrossRef]
  38. Luo, A.; Lloyd, D.; Gupta, A.; Youdelis, W. Precipitation and dissolution kinetics in Al-Li-Cu-Mg alloy 8090. Acta Metall. Mater. 1993, 41, 769–776. [Google Scholar] [CrossRef]
  39. Ghosh, K.; Gao, N. Determination of kinetic parameters from calorimetric study of solid state reactions in 7150 Al-Zn-Mg alloy. Trans. Nonferrous Met. Soc. China 2011, 21, 1199–1209. [Google Scholar] [CrossRef]
  40. Ghosh, K.; Das, K.; Chatterjee, U. Kinetics of solid-state reactions in Al-Li-Cu-Mg-Zr alloys from calorimetric studies. Metall. Mater. Trans. A-Phys. Metall. Mater. Sci. 2007, 38, 1965–1975. [Google Scholar] [CrossRef]
  41. Ghosh, A.; Ghosh, M.; Shankar, G. On the role of precipitates in controlling microstructure and mechanical properties of Ag and Sn added 7075 alloys during artificial ageing. Mater. Sci. Eng. A-Struct. Mater. Prop. Microstruct. Process. 2018, 738, 399–411. [Google Scholar] [CrossRef]
  42. Hall, E. The deformation and ageing of mild steel: III discussion of results. Proc. Phys. Society. Sect. B 1951, 64, 747. [Google Scholar] [CrossRef]
  43. Starink, M.; Wang, S. A model for the yield strength of overaged Al–Zn–Mg–Cu alloys. Acta Mater. 2003, 51, 5131–5150. [Google Scholar] [CrossRef]
  44. Ma, Z.; Robson, J. Understanding the effect of deformation combined with heat treatment on age hardening of Al–Zn–Mg–Cu alloy AA7075. Mater. Sci. Eng. A 2023, 878, 145212. [Google Scholar] [CrossRef]
  45. Esmaeili, S.; Lloyd, D.; Poole, W. A yield strength model for the Al-Mg-Si-Cu alloy AA6111. Acta Mater. 2003, 51, 2243–2257. [Google Scholar] [CrossRef]
  46. Shercliff, H.; Ashby, M. A process model for age hardening of aluminium alloys—I. The model. Acta Metall. Et Mater. 1990, 38, 1789–1802. [Google Scholar] [CrossRef]
  47. Dixit, M.; Mishra, R.; Sankaran, K. Structure–property correlations in Al 7050 and Al 7055 high-strength aluminum alloys. Mater. Sci. Eng. A 2008, 478, 163–172. [Google Scholar] [CrossRef]
  48. Ardell, A.J. Precipitation hardening. Metall. Trans. A 1985, 16, 2131–2165. [Google Scholar] [CrossRef]
  49. Hornbogen, E.; Zum Gahr, K.-H. Distribution of plastic strain in alloys containing small particles. Metallography 1975, 8, 181–202. [Google Scholar] [CrossRef]
  50. Yunlong, M.; Ben, L.; Xiao, Z.; Huang, Y. First-Principles Study of Mechanical and Electronic Properties of η and η' Phases Present in 7xxx Alloys. Phys. Met. Metallogr. 2021, 122, 1257–1263. [Google Scholar] [CrossRef]
  51. Kocks, U. Statistical treatment of penetrable obstacles. Can. J. Phys. 1967, 45, 737–755. [Google Scholar] [CrossRef]
  52. Kocks, U. A statistical theory of flow stress and work-hardening. Philos. Mag. 1966, 13, 541–566. [Google Scholar] [CrossRef]
  53. Duchaussoy, A.; Sauvage, X.; Deschamps, A.; De Geuser, F.; Renou, G.; Horita, Z. Complex interactions between precipitation, grain growth and recrystallization in a severely deformed Al-Zn-Mg-Cu alloy and consequences on the mechanical behavior. Materialia 2021, 15, 101028. [Google Scholar] [CrossRef]
Figure 1. The matrix precipitation’s bright-field TEM photographs: (a) T6, (b) T79, (c) T76, (d) T74, (e) T73.
Coatings 14 01415 g001
Figure 2. The matrix precipitation’s HRTEM photographs and the diffraction patterns obtained after the Fourier transform: (a,b) T6, (cf) T79, (gl) T76, (mp) T74, (qt) T73.
Coatings 14 01415 g002
Figure 3. The length, thickness, and average diameter of the matrix precipitation of the various aged samples: (a) T6, (b) T79, (c) T76, (d) T74, (e) T73.
Coatings 14 01415 g003
Figure 4. The UTS, YS, and El of various aged samples.
Coatings 14 01415 g004
Figure 5. DSC thermograms of various aged samples.
Coatings 14 01415 g005
Figure 6. The various aged samples’ estimation amounts of the precipitate fraction with aging temperature: (a) peak B, (d) peak E; the precipitate rate with aging temperature: (b) peak B, (e) peak E; and the precipitation activation energy: (c) peak B, (f) peak E, respectively.
Coatings 14 01415 g006
Figure 7. Precipitation activation energies of various aging samples: (a) η′ phase precipitates; (b) η phase precipitates.
Coatings 14 01415 g007
Figure 8. The optical microscope micrograph of the solid solution sample with the extrusion direction: (a) near the edge; (b) near the center; (c) the statistical histogram of the grain size of the solid solution sample.
Coatings 14 01415 g008
Figure 9. Comparison of yield strengths for experiment and model prediction.
Coatings 14 01415 g009
Table 1. Chemical compositions of the present study’s material.
ElementsZnMgCuZrFeSiAl
Content (wt.%)8.72.82.00.130.050.02Balance
Table 2. Heat treatment regimes were adopted in the present study.
Solid Solution Treatment RegimesAging Treatment Regimes
T6475 °C × 2 h120 °C × 24 h
T79120 °C × 24 h + 165 °C × 3 h
T76120 °C × 24 h + 165 °C × 6 h
T76120 °C × 24 h + 165 °C × 10 h
T73120 °C × 24 h + 165 °C × 16 h
Disclaimer/Publisher’s Note: The statements, opinions and data contained in all publications are solely those of the individual author(s) and contributor(s) and not of MDPI and/or the editor(s). MDPI and/or the editor(s) disclaim responsibility for any injury to people or property resulting from any ideas, methods, instructions or products referred to in the content.