
Optimization of Laser Cladding Parameters for High-Entropy Alloy-Reinforced 316L Stainless-Steel via Grey Relational Analysis


Abstract
:1. Introduction
2. Materials and Methods
3. Results
3.1. Analysis of Microhardness
3.2. Analysis of Dilution Rate
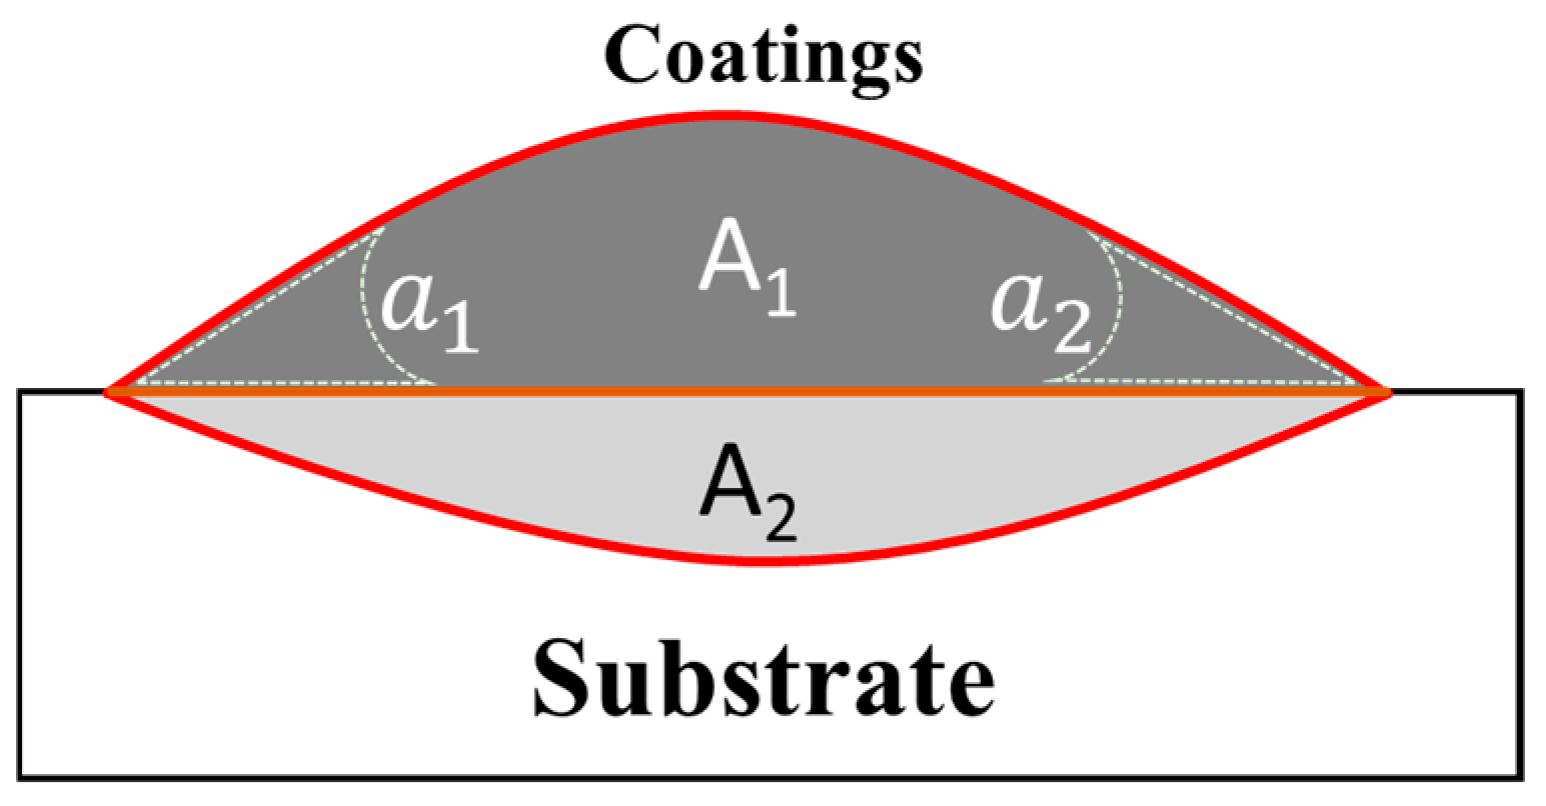
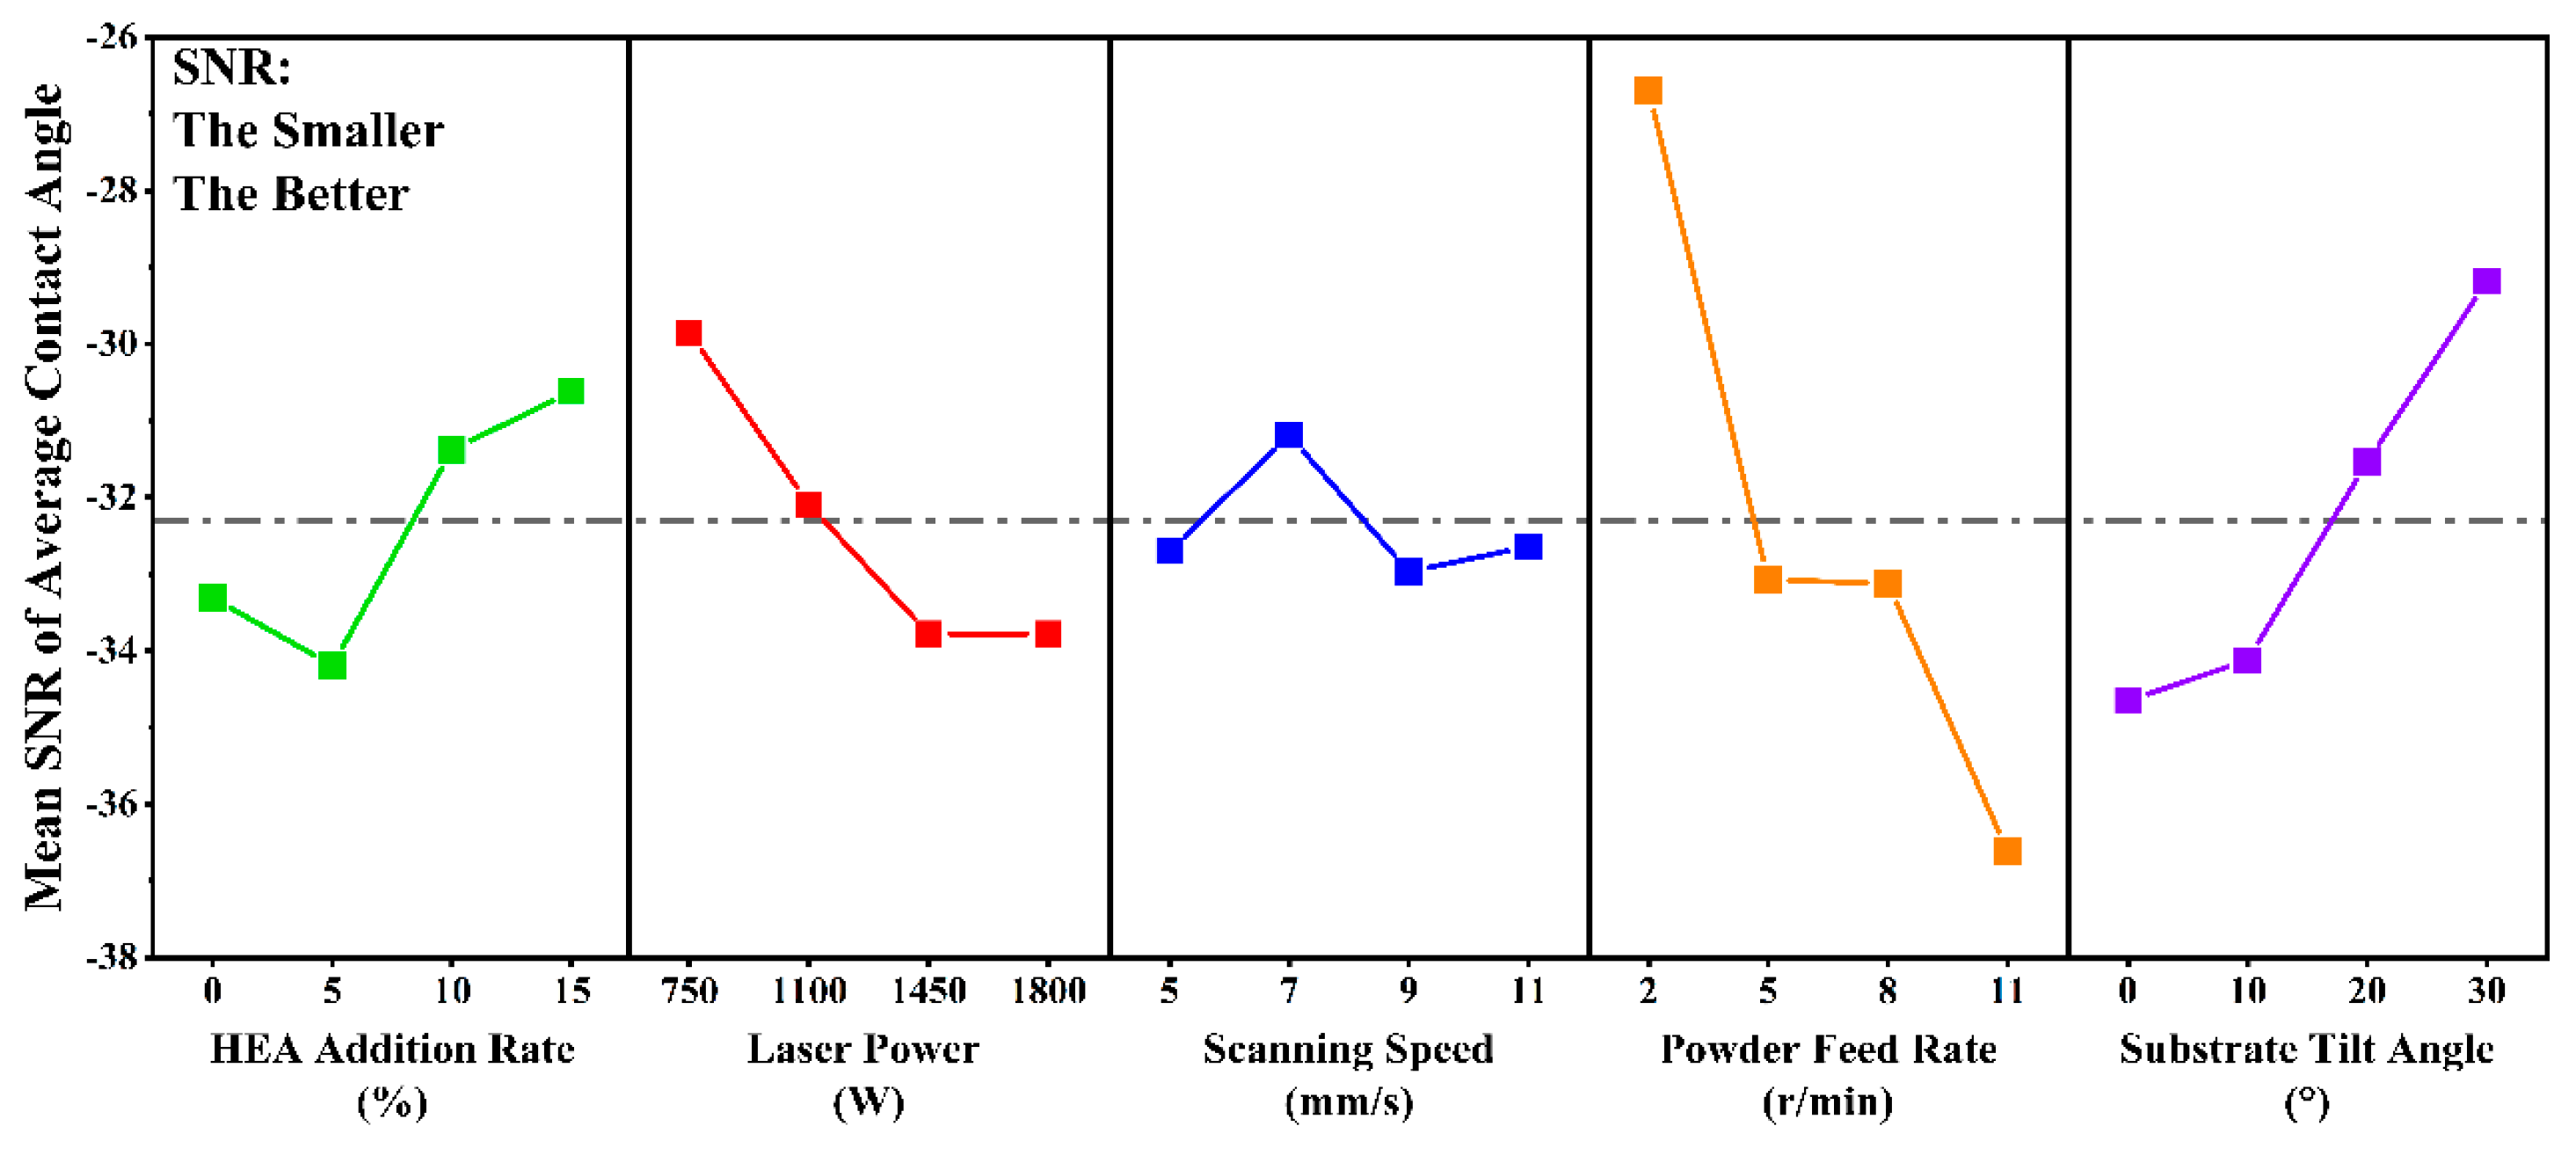
3.3. Analysis of Average Contact Angle
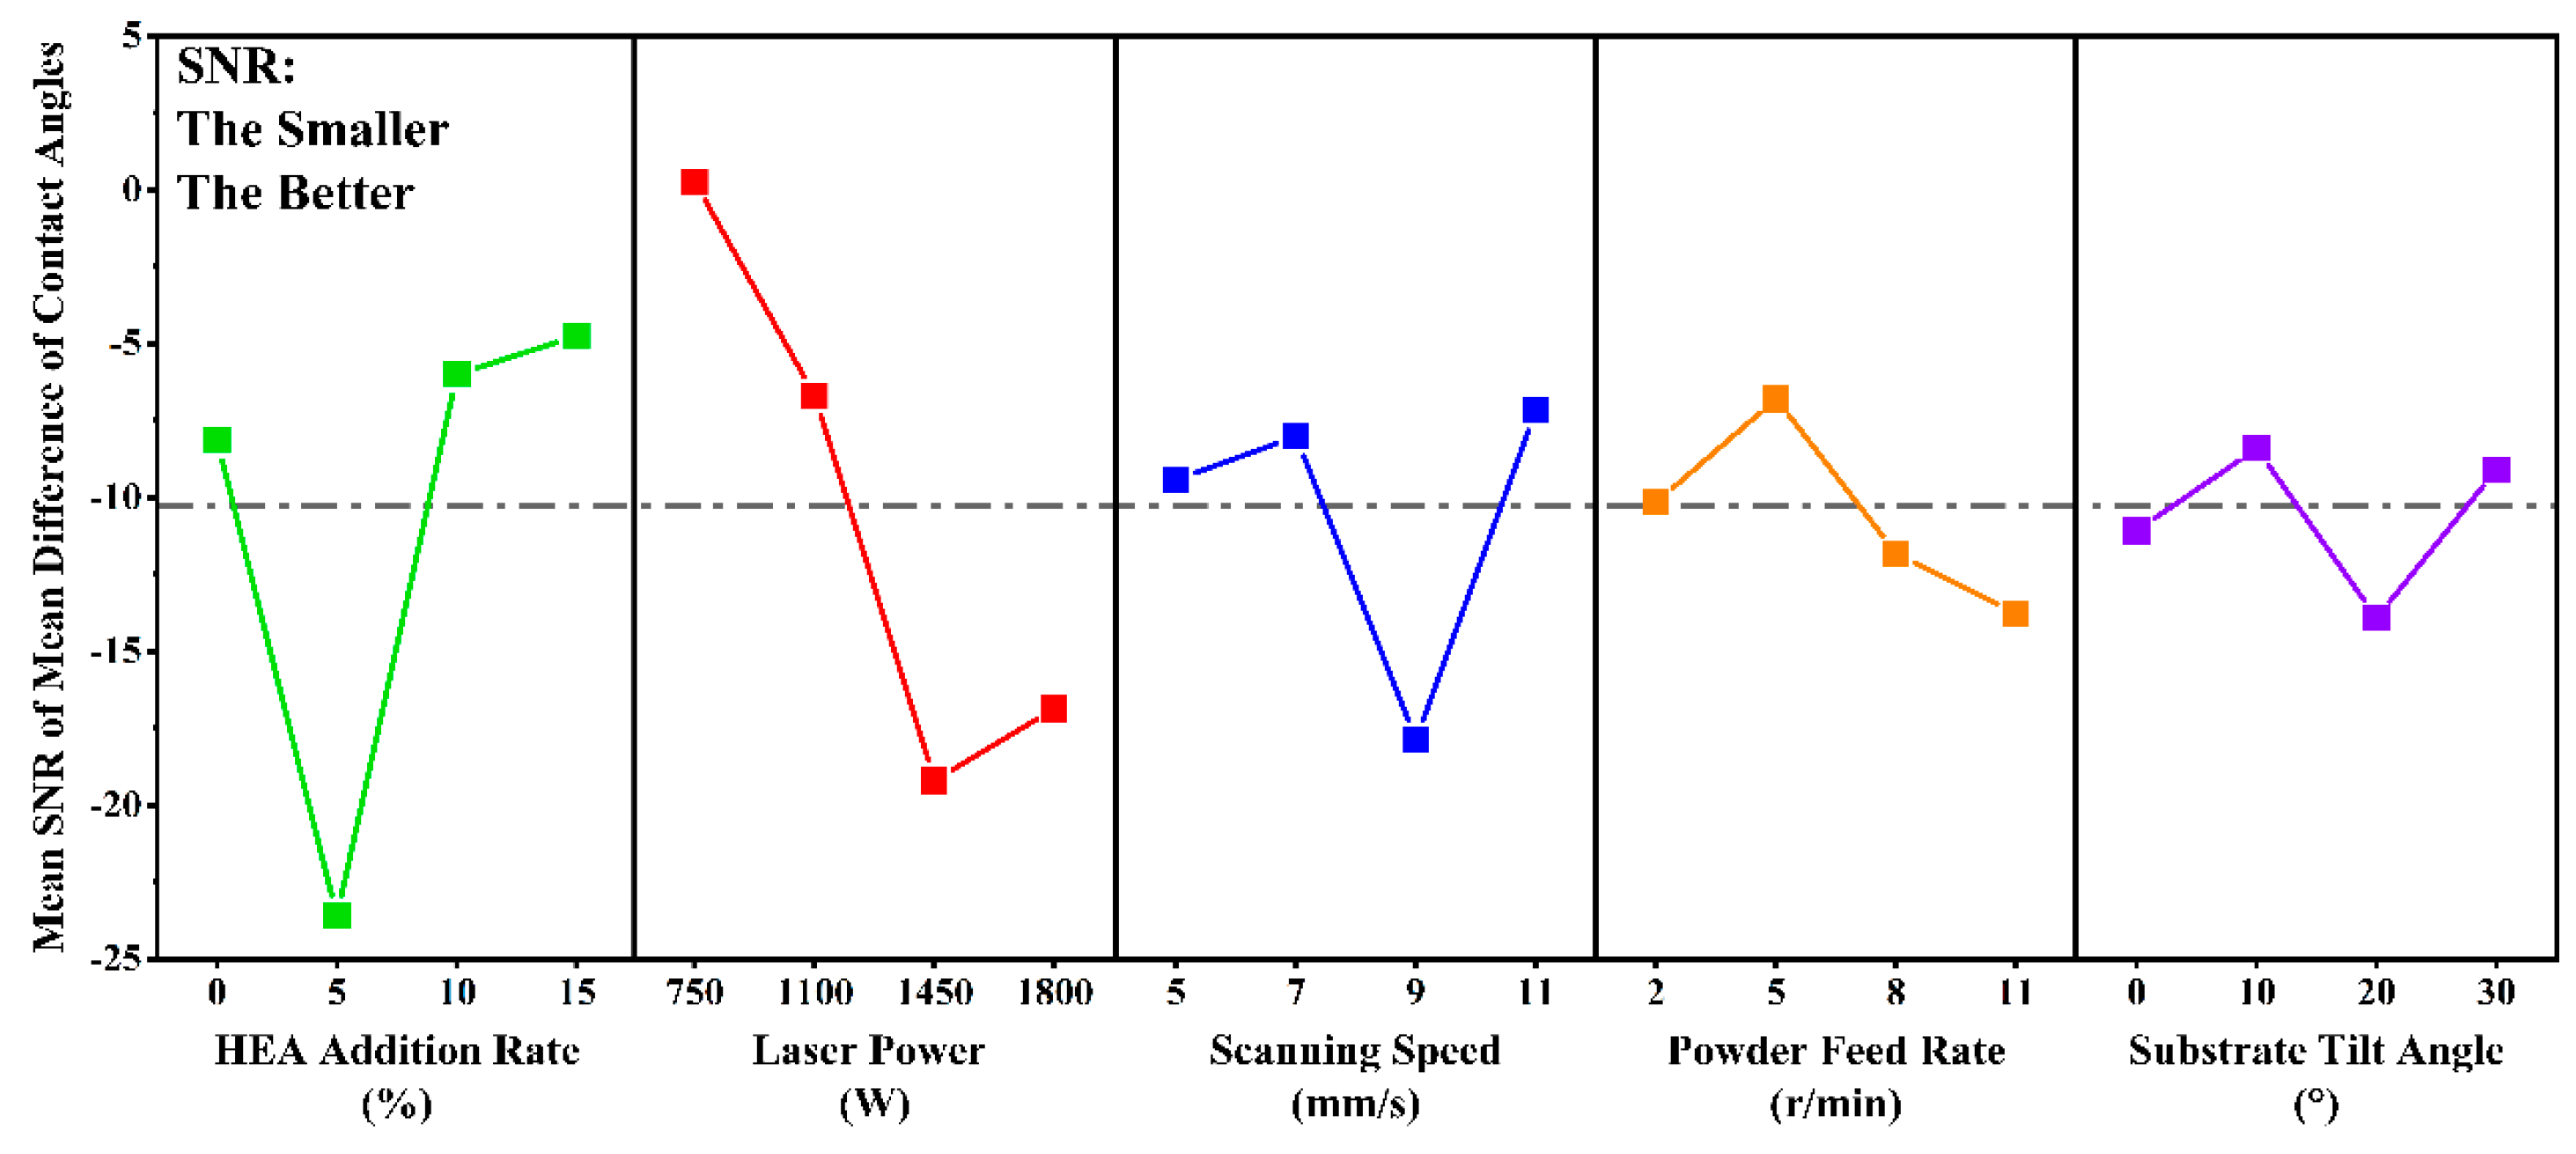
3.4. Analysis of Mean Difference of Contact Angles
3.5. Multi-Response Grey Relational Analysis
3.6. Processing Parameters Optimization and Experimental Validation
3.7. Economic, Energy, and Sustainability Analyses
4. Conclusions
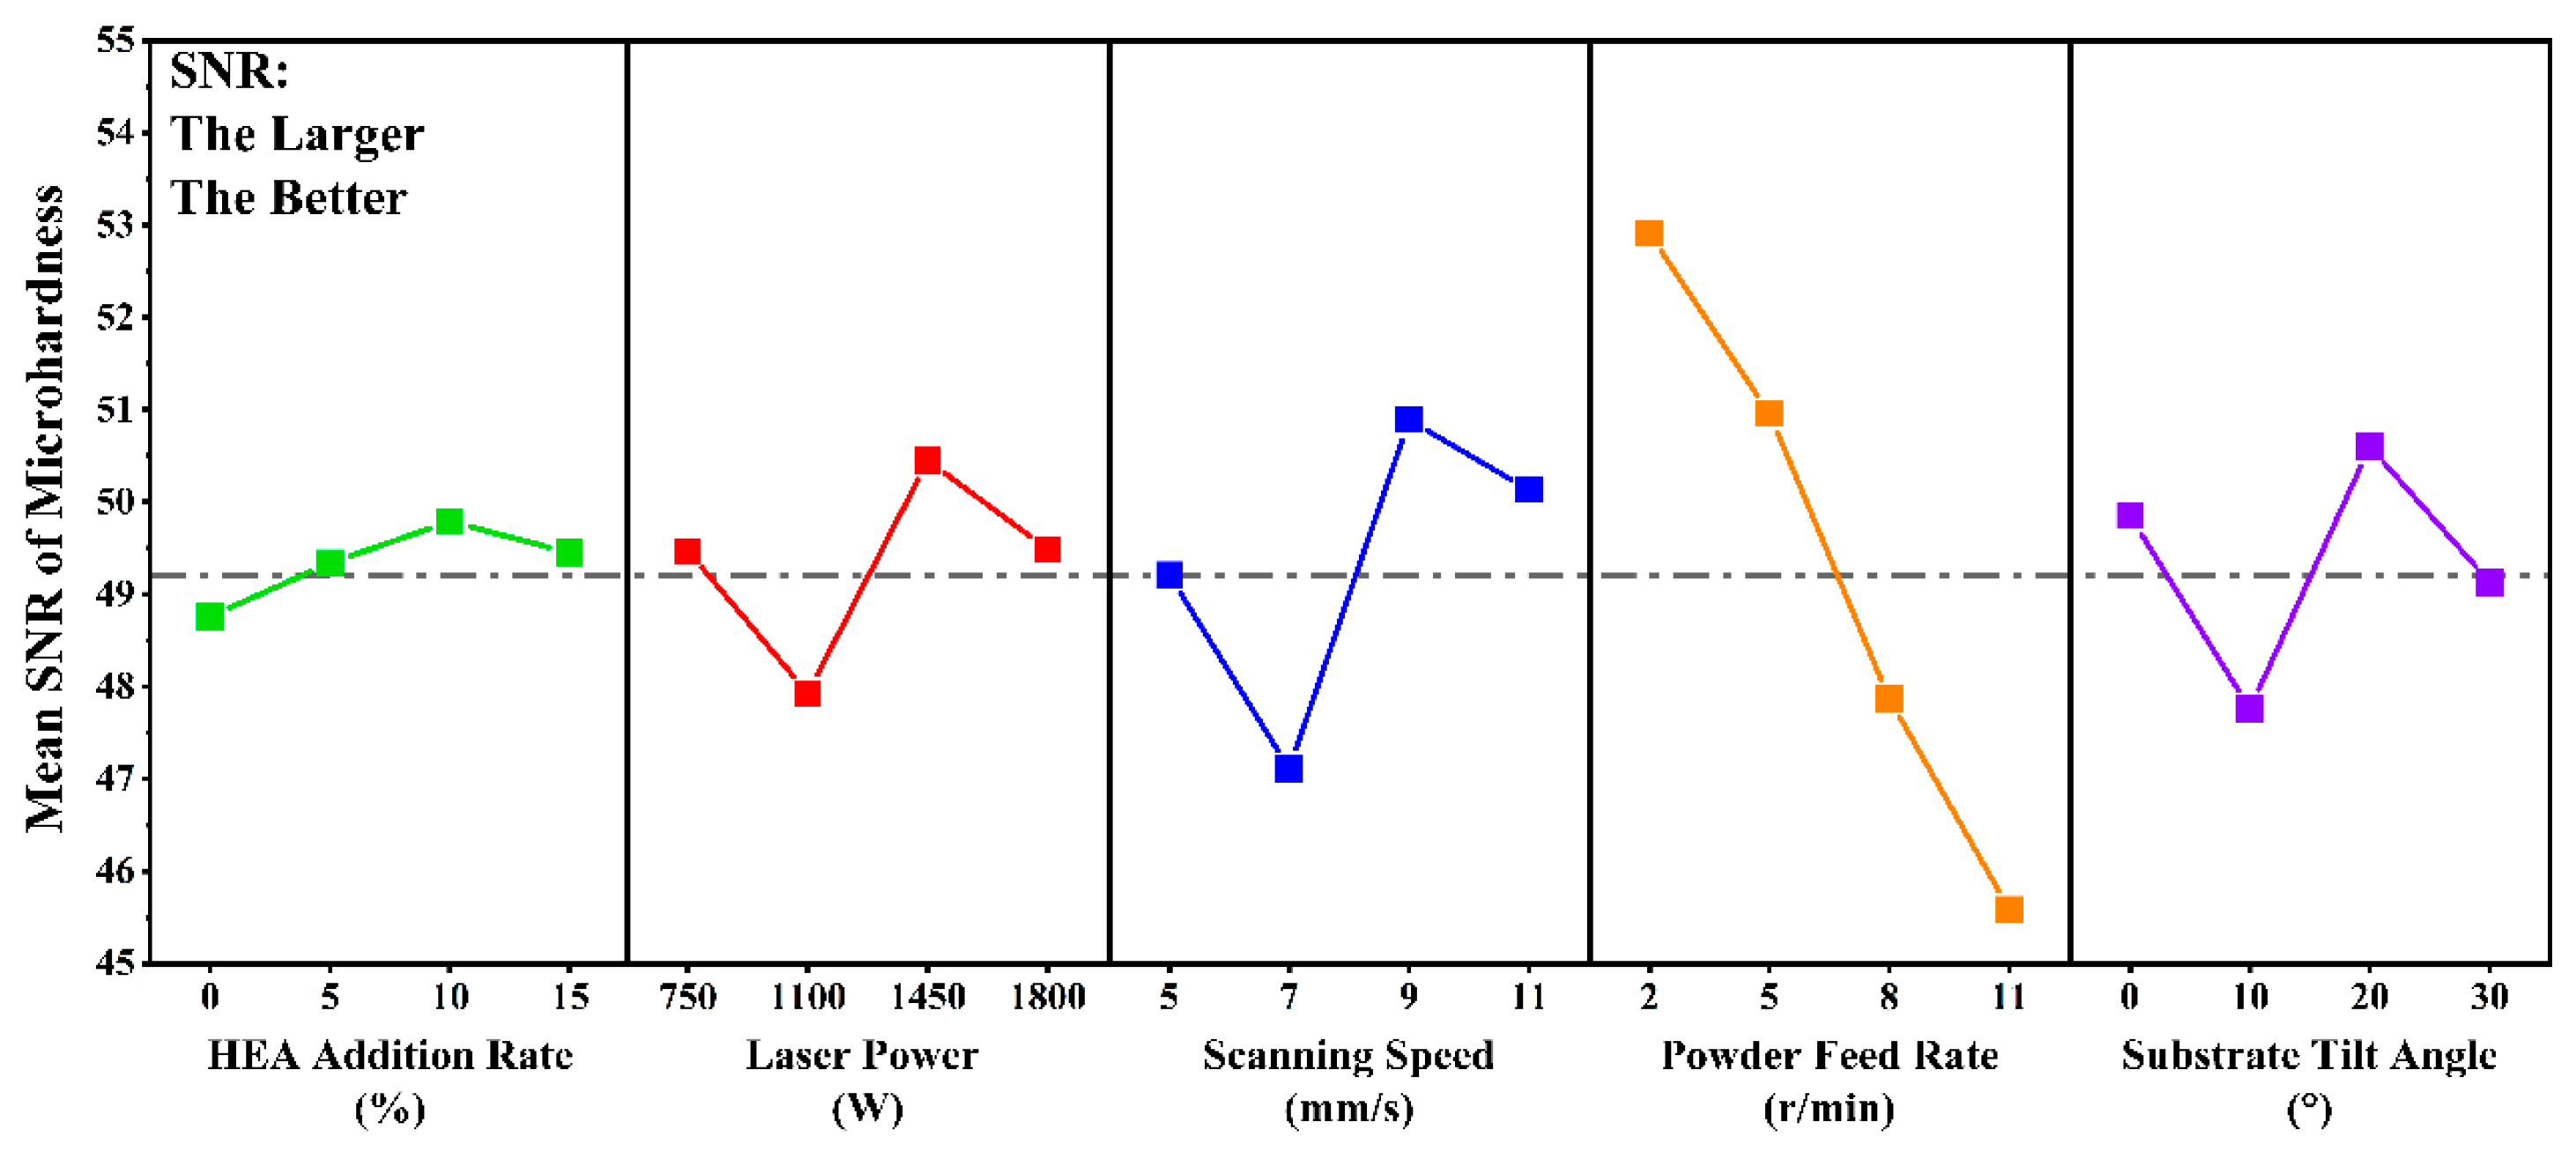
- The analysis of microhardness as the sole response variable indicates a notable decrease with higher powder feed rates. Moreover, variations in laser power, scanning speed, and substrate tilt angle initially lead to a reduction in microhardness, followed by subsequent improvements and subsequent declines.
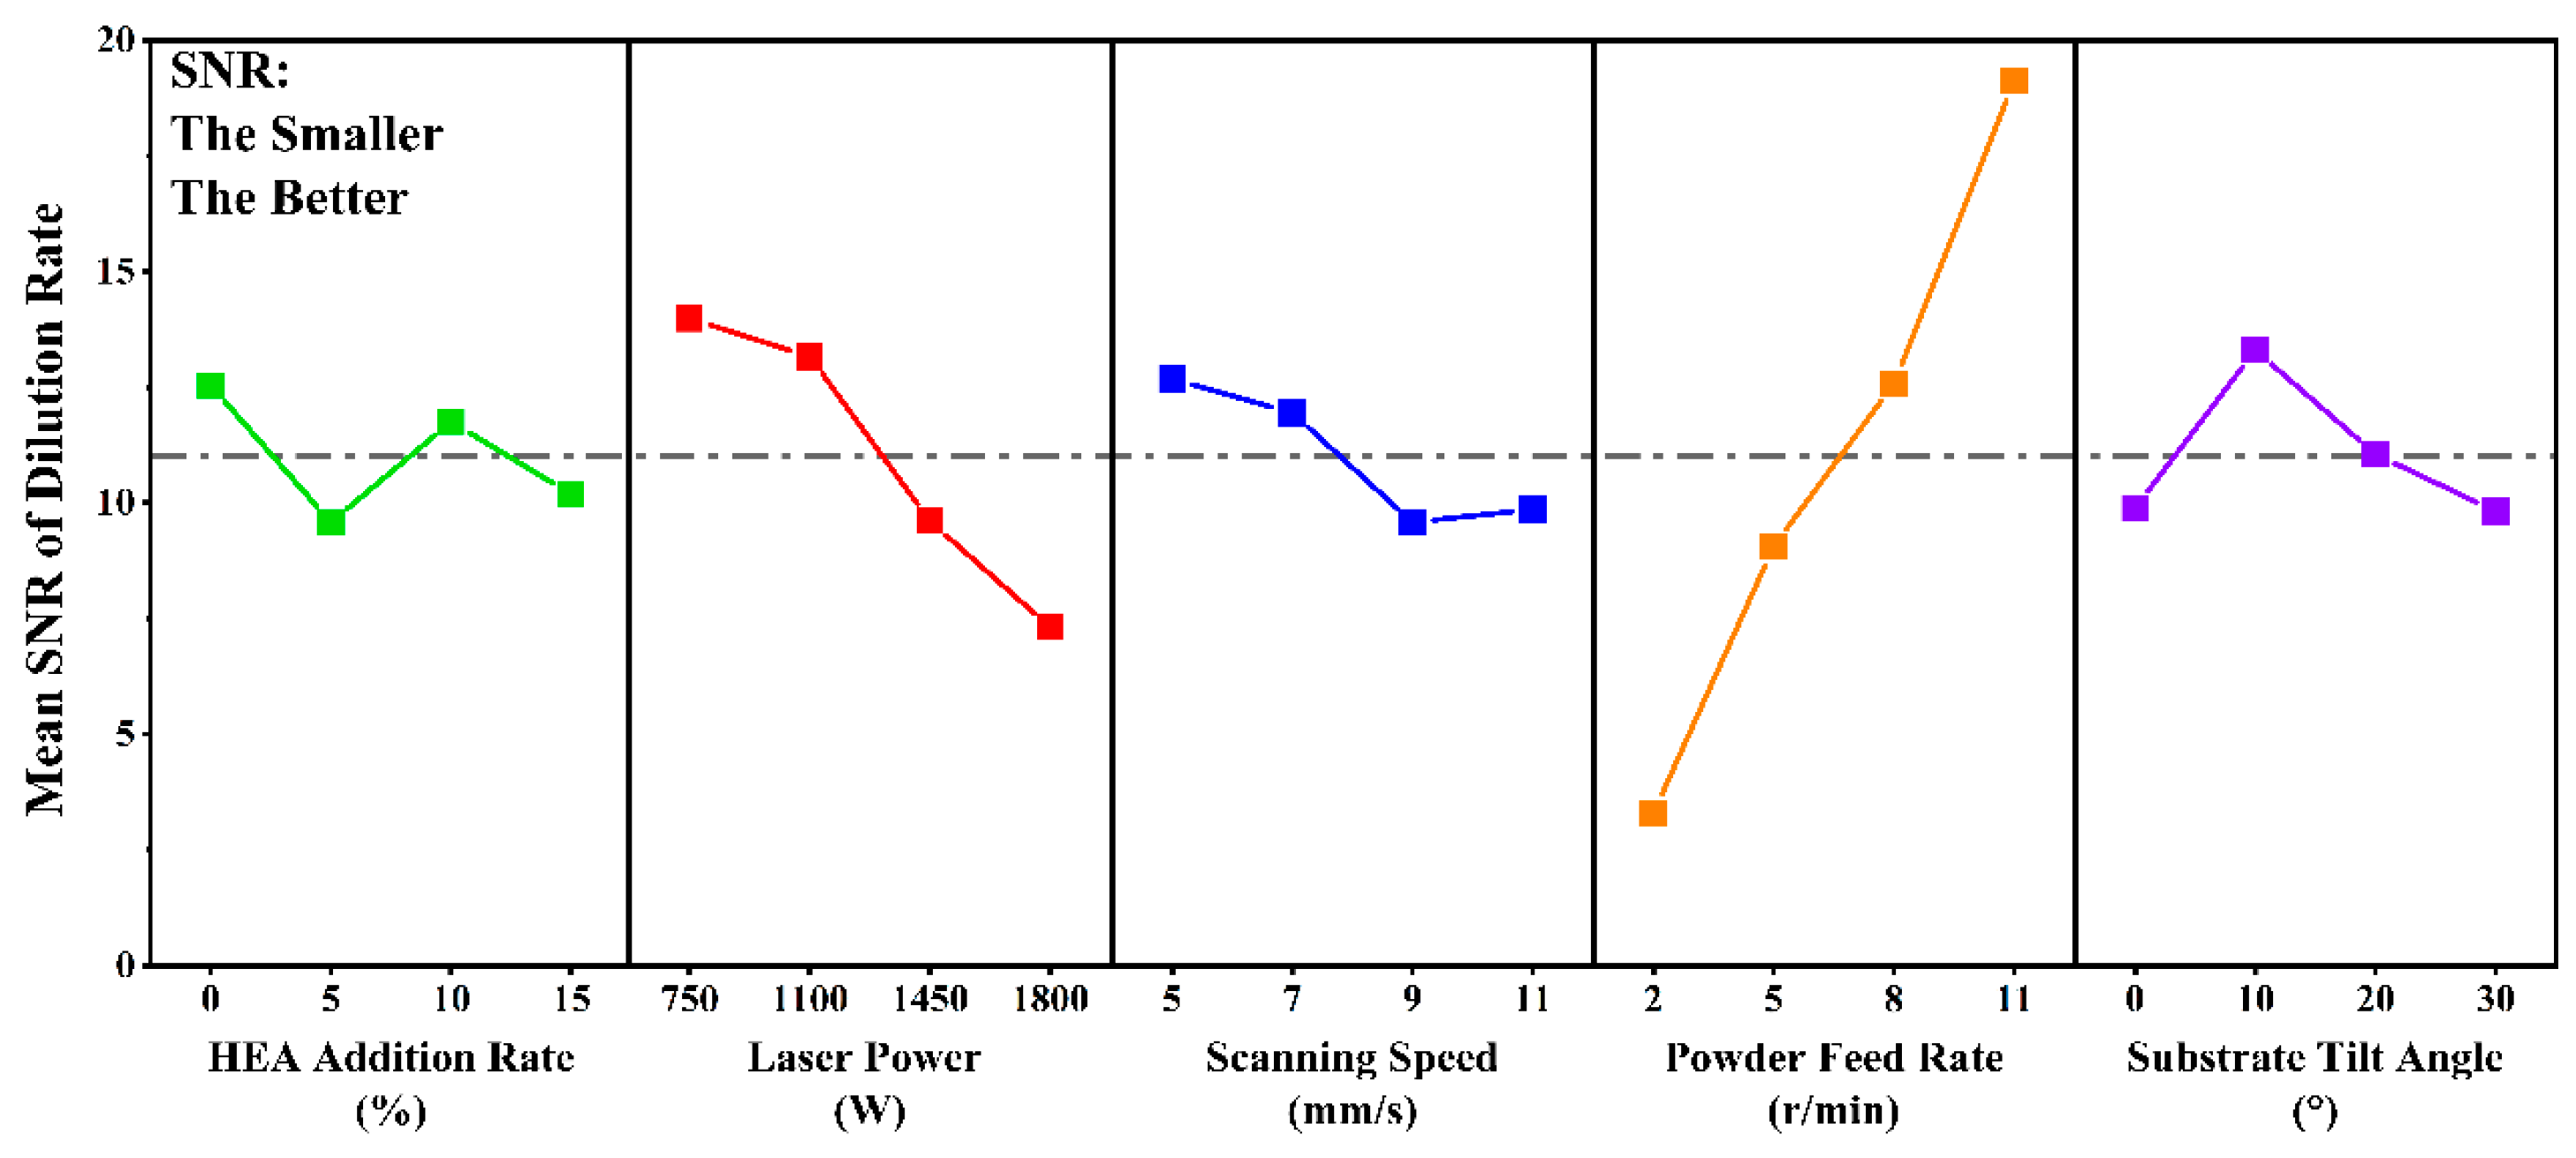
- The analysis of the dilution rate indicates a significant decrease with higher powder feed rates and an increase with greater laser power. As scanning speed increases, the dilution rate initially rises and then declines. Conversely, as the substrate tilt angle increases, the dilution rate first decreases and then rises. Regarding the average contact angle, there is a progressive increase with higher powder feed rates, while an increase in substrate tilt angle leads to a decrease. The addition of HEA initially raises the average contact angle and subsequently reduces it, whereas higher laser power consistently enhances it. The mean difference in contact angles shows an initial sharp increase followed by a slight decrease with increasing laser power. Increases in the HEA addition rate, scanning speed, and powder feed rate result in an initial rise followed by a decline in the mean difference of contact angles.
- Grey relational analysis effectively discerns the processing parameters that optimize coating quality. The optimal combination comprises a 15% HEA addition rate, 750 W laser power, 7 mm/s scanning speed, 2 r/min powder feed rate, and a 30° substrate tilt angle. Coatings produced under these conditions exhibit markedly enhanced microhardness and average contact angle compared to those achieved using the optimal parameters identified in the orthogonal test.
- The validation experiment, conducted using optimal parameter settings identified through grey relational analysis, demonstrates a minimal error of 0.95% relative to the predicted value, underscoring the efficacy of GRA in optimizing laser cladding parameters. The preparation of laser cladding coatings utilizing the optimal parameters derived through GRA demonstrates enhanced economic efficiency and superior environmental sustainability compared to conventional methods. The methodologies presented in this study can also be applied to optimize laser processing parameters in selective laser melting of titanium alloys and laser powder bed fusion of aluminum alloys. These methodologies offer a robust framework for advancing laser cladding technology in industrial applications, thereby facilitating the fabrication of wear-resistant coatings and the enhancement or repair of component surfaces. Specifically, laser cladding coatings optimized through GRA can be used for corrosion resistance treatment of ships in the maritime industry, surface enhancement of specialized parts in the aerospace industry, and service protection of cooling tower components in the power industry.
Author Contributions
Funding
Institutional Review Board Statement
Informed Consent Statement
Data Availability Statement
Conflicts of Interest
References
- Jiang, Y.; Tang, H.; Li, Z.; Zheng, D.; Tu, Y. Additive manufactured Mg-Gd-Y-Zr alloys: Effects of Gd content on microstructure evolution and mechanical properties. Addit. Manuf. 2022, 59, 103136. [Google Scholar] [CrossRef]
- Tan, H.; Fan, W.; Qian, Y.; Chen, Y.; Liu, S.; Liu, X. Influence of inclined substrate on process characteristics of directed energy deposition. Opt. Laser Technol. 2020, 129, 106288. [Google Scholar] [CrossRef]
- Zhang, X.Q.; Yang, D.; Jia, Y.; Wang, G.; Prashanth, K.G. Microstructure evolution and tensile property of high entropy alloy particle reinforced 316 L stainless steel matrix composites fabricated by laser powder bed fusion. J. Alloys Compd. 2023, 965, 171430. [Google Scholar] [CrossRef]
- Kahya, H.; Gurun, H.; Kucukturk, G. Experimental and Analytical Investigation of the Re-Melting Effect in the Manufacturing of 316L by Direct Energy Deposition (DED) Method. Metals 2023, 13, 1144. [Google Scholar] [CrossRef]
- Wang, J.; Fang, J.; Zhang, P.; Wang, S.; Wang, D. Research on Geometrical Features of FGH95 Nickel-based Superalloy by Coaxial Single Track Laser Cladding. J. Phys. Conf. Ser. 2022, 2390, 012027. [Google Scholar] [CrossRef]
- Yang, S.; Xu, Z.; Peng, S.; Cao, S.; Liu, W.; Wang, F. Investigation on the relationships among process parameters, molten pool characteristics, and fabrication quality of Ti-10V-2Fe-3Al by laser direct energy deposition. Optik 2023, 275, 170521. [Google Scholar] [CrossRef]
- Zhang, C.; Zhu, J.; Ji, C.; Guo, Y.; Fang, R.; Mei, S.; Liu, S. Laser powder bed fusion of high-entropy alloy particle-reinforced stainless steel with enhanced strength, ductility, and corrosion resistance. Mater. Des. 2021, 209, 109950. [Google Scholar] [CrossRef]
- Gu, B.; Chu, J.; Wang, Y.; Xu, G.; Gao, L.; Yang, Y. Effects of ultrasonic impact treatment on the corrosion resistance of laser-cladded CrMnFeCoNi high-entropy alloy coatings. Surf. Coat. Technol. 2024, 489, 131102. [Google Scholar] [CrossRef]
- Wilson, J.M.; Piya, C.; Shin, Y.C.; Zhao, F.; Ramani, K. Remanufacturing of turbine blades by laser direct deposition with its energy and environmental impact analysis. J. Clean. Prod. 2014, 80, 170–178. [Google Scholar] [CrossRef]
- Guo, C.; Zhou, Y.; Xu, Z.; Li, Y.; Li, G.; Shi, Z. Macro Co-Al-W-based superalloy single-crystal fabrication using selective laser melting. Scr. Mater. 2024, 251, 116213. [Google Scholar] [CrossRef]
- Yadroitsev, I.; Krakhmalev, P.; Yadroitsava, I. Selective laser melting of Ti6Al4V alloy for biomedical applications: Temperature monitoring and microstructural evolution. J. Alloys Compd. 2014, 583, 404–409. [Google Scholar] [CrossRef]
- Zhang, S.; Sun, Y.; Cheng, W.; Chen, Y.; Gu, J. High temperature oxidation behavior of CoCrFeNiMo0.2 high-entropy alloy coatings produced by laser cladding. Mater. Today Commun. 2024, 39, 108639. [Google Scholar] [CrossRef]
- Zia Ullah, A.; Muhammad Yasir, K.; Ehtsham ur, R. Laser-aided additive manufacturing of high entropy alloys: Processes, properties, and emerging applications. J. Manuf. Proc. 2022, 78, 131–171. [Google Scholar]
- Duchaniya, R.K.; Pandel, U.; Rao, P. Coatings based on high entropy alloys: An overview. Mater. Today Proc. 2021, 44, 4467–4473. [Google Scholar] [CrossRef]
- Lu, K.; Zhu, J.; Ge, W.; Hui, X. Progress on New Preparation Methods, Microstructures, and Protective Properties of High-Entropy Alloy Coatings. Coatings 2022, 12, 1472. [Google Scholar] [CrossRef]
- Meng, Y.; Yang, Z.; Shi, Y.; Liu, X.; Wang, L.; Zhang, Q. Microstructural evolution and enhanced properties of multi-layer TiZrNbCrCo high entropy alloy coatings laser-clad onto Ti–6Al–4V alloy. Intermetallics 2024, 173, 108407. [Google Scholar] [CrossRef]
- Yu, B.; Ren, Y.; Zeng, Y.; Ma, W.; Morita, K.; Zhan, S. Recent progress in high-entropy alloys: A focused review of preparation processes and properties. J. Mater. Res. Technol. 2024, 29, 2689–2719. [Google Scholar] [CrossRef]
- Ping, Z.; Ziwei, L.; Haomin, L.; Yuanbin, Z.; Huaixue, L.; Chuanwei, S. Recent progress on the microstructure and properties of high entropy alloy coatings prepared by laser processing technology: A review. J. Manuf. Process. 2022, 76, 397–411. [Google Scholar]
- Lian, G.; Xiao, S.; Zhang, Y.; Jiang, J.; Zhan, Y. Multi-objective optimization of coating properties and cladding efficiency in 316L/WC composite laser cladding based on grey relational analysis. Int. J. Adv. Manuf. Technol. 2021, 112, 1449–1459. [Google Scholar] [CrossRef]
- Gao, J.; Han, Q.; Soe, S.; Wang, L.; Zhang, Z.; Zhang, H. Laser additive manufacturing of TiB2-modified Cu15Ni8Sn/GH3230 heterogeneous materials: Processability, interfacial microstructure and mechanical performance. Mater. Sci. Eng. A 2024, 900, 146496. [Google Scholar] [CrossRef]
- Patil, V.V.; Mohanty, P.C.; Prashanth, G.K. Parametric Optimization of Selective Laser Melted 13Ni400 Maraging Steel by Taguchi Method. J. Manuf. Mater. Process. 2024, 8, 52. [Google Scholar] [CrossRef]
- Zhao, Y.; Wu, Y.; Liu, Y.; Zhang, Z.; Che, X.; Chen, H. Effect of Mn alloying on the microstructure and micro-shear properties of laser direct energy deposition Stellite21 cobalt-based coating and its process research. Surf. Coat. Technol. 2024, 483, 130786. [Google Scholar] [CrossRef]
- Javidrad, H.; Aydin, H.; Karakaş, B.; Alptekin, S.; Kahraman, A.S.; Koc, B. Process parameter optimization for laser powder directed energy deposition of Inconel 738LC. Opt. Laser Technol. 2024, 176, 110940. [Google Scholar] [CrossRef]
- Barekat, M.; Lashani Zand, M.; Shoja Razavi, R.; Erfanmanesh, M.; Ilanlou, M.; Reza Borhani, M. Experimental and numerical investigation of the effect of process parameters on crack formation and residual stresses in the laser coating process of stellite 6 alloy on X19CrMoNbVN11-1 steel substrate. Opt. Laser Technol. 2024, 176, 111038. [Google Scholar] [CrossRef]
- Khaleghi, S.; Azdast, T.; Doniavi, A.; Hasanzadeh, R. Performance optimization of acrylonitrile butadiene styrene/thermoplastic polyurethane composite foams blown with carbon dioxide using Taguchi technique. J. Appl. Polym. Sci. 2023, 141, e54996. [Google Scholar] [CrossRef]
- Udaya Prakash, J.; Ananth, S.; Jebarose Juliyana, S.; Cep, R.; Khedkar, N.; Salunkhe, S. Parametric optimization of wear parameters of hybrid composites (LM6/Bsub4/subC/fly ash) using Taguchi technique. Front. Mech. Eng. 2023, 9, 1279481. [Google Scholar] [CrossRef]
- Tai, Z.; Yang, Y.; Lv, J.; Zhou, H.; Trofimov, V.; Wei, Y. In-situ synthesis of high-performance TiN/TC4 sandwich structures via nitrogen-controlled laser directed energy deposition. Mater. Sci. Eng. A 2024, 896, 146231. [Google Scholar] [CrossRef]
- Thanumoorthy, R.S.; Sekar, P.; Bontha, S.; Balan, A.S.S. A study on the effect of process parameters and scan strategies on microstructure and mechanical properties of laser directed energy deposited IN718. J. Mater. Process. Tech. 2023, 319, 118096. [Google Scholar] [CrossRef]
- Sachin, A.; Chaitanya, V.; Bhargavi, A.; Ramesh, S. Modeling of Deposition Geometry in Laser Directed Energy Deposition over Inclined Surfaces for Restoration and Remanufacturing. Trans. Indian Natl. Acad. Eng. 2021, 6, 1057–1069. [Google Scholar]
- Cheng, F.; Wang, H.; Li, Z.; Cheng, X.; Zheng, D.; Zhang, S.; Hu, X.; Zhang, H.; Liu, M. Dynamic compression deformation behavior of laser directed energy deposited α + β duplex titanium alloy with basket-weave morphology. Addit. Manuf. 2023, 61, 103336. [Google Scholar] [CrossRef]
- Ilo, S.; Just, C.; Xhiku, F. Optimisation of multiple quality characteristics of hardfacing using grey-based Taguchi method. Mater. Des. 2012, 33, 459–468. [Google Scholar] [CrossRef]
- Yusuf, S.; Yakup, T. Experimental and statistical investigation of mechanical properties and surface roughness in additive manufacturing with selective laser melting of AlSi10Mg alloy. J. Braz. Soc. Mech. Sci. Eng. 2023, 45, 515. [Google Scholar]
- Cheng, K.-C.; Chen, J.-H.; Stadler, S.; Chen, S.-H. Properties of atomized AlCoCrFeNi high-entropy alloy powders and their phase-adjustable coatings prepared via plasma spray process. Appl. Surf. Sci. 2019, 478, 478–486. [Google Scholar] [CrossRef]
- Nagase, T.; Takemura, M.; Matsumuro, M.; Maruyama, T. Solidification microstructure of AlCoCrFeNi2.1 eutectic high entropy alloy ingots. Mater. Trans. 2018, 59, 255–264. [Google Scholar] [CrossRef]
- Jiang, H.; Han, K.; Li, D.; Cao, Z. Microstructure and Mechanical Properties Investigation of the CoCrFeNiNbx High Entropy Alloy Coatings. Crystals 2018, 8, 409. [Google Scholar] [CrossRef]
- Chu, M.; Xiao, H.; Ren, L.; Mo, T.; Lin, B. Microstructure and properties of Ti–Al–C composite coatings prepared by laser cladding. Ceram. Int. 2024, 50, 12498–12509. [Google Scholar] [CrossRef]
- Cui, Y.-H.; Zhang, Q.; Shao, Y.-X.; Yang, Y.; Ma, Y.-D.; Sun, W.-W. Microstructure and properties of in-situ ZrBsub2/sub-ZrC composite coatings by plasma spraying. Surf. Coat. Technol. 2021, 409, 126846. [Google Scholar] [CrossRef]
- Liang, J.; Li, G.; Ding, X.; Li, Y.; Wen, Z.; Zhang, T.; Qu, Y. Effect of C14 Laves/BCC on microstructure and hydrogen storage properties of (Ti32.5V27.5Zr7.5Nb32.5)1−xFex (x = 0.03, 0.06, 0.09) high entropy hydrogen storage alloys. J. Energy Storage 2023, 73, 108852. [Google Scholar] [CrossRef]
- Cui, P.; Ma, Y.; Zhang, L.; Zhang, M.; Fan, J.; Dong, W. Microstructure and mechanical behaviors of CoFeNiMnTixAl1−x high entropy alloys. Mater. Sci. Eng. A 2018, 731, 124–130. [Google Scholar] [CrossRef]
- Dong, Z.; Feng, L.; Long, H.; Lu, B.; Zhu, J.; Yan, X. A multi-objective optimization of laser cladding processing parameters of AlCoCrFeNi2.1 eutectic high-entropy alloy coating. Opt. Laser Technol. 2024, 170, 110302. [Google Scholar] [CrossRef]
- Li, B.; Zhang, L.; Xu, Y.; Liu, Z.; Qian, B.; Xuan, F. Selective laser melting of CoCrFeNiMn high entropy alloy powder modified with nano-TiN particles for additive manufacturing and strength enhancement: Process, particle behavior and effects. Powder Technol. 2020, 360, 509–521. [Google Scholar] [CrossRef]
- Gnanasekaran, S.; Padmanaban, G.; Balasubramanian, V.; Kumar, H.; Albert, S.K. Optimizing the laser parameters to attain maximum hardness in nickel based hardfacing surfaces. J. Mech. Behav. Mater. 2017, 26, 113–125. [Google Scholar] [CrossRef]
- Liu, Y.; Xu, T.; Li, G.; Li, Z.; Du, F.; Chen, G. A multi-objective optimization of laser cladding process of Ni-based coating on the preheated copper alloy. Mater. Today Commun. 2023, 35, 105614. [Google Scholar] [CrossRef]
- Nie, M.H.; Zhang, S.; Wang, Z.Y.; Zhang, C.H.; Chen, H.T.; Chen, J. Effect of laser power on microstructure and interfacial bonding strength of laser cladding 17-4PH stainless steel coatings. Mater. Chem. Phys. 2022, 275, 125236. [Google Scholar] [CrossRef]
- Yang, M.; Lu, J.; Wang, H.; Liu, Y.; Yang, H.; Zhang, W.; Tan, J.; Chen, J. Effect of the laser power on the microstructure and mechanical properties of the laser-MIG hybrid welding joints of the 2195 Al–Li alloy. Sci. Technol. Weld. Join. 2020, 26, 75–83. [Google Scholar] [CrossRef]
- Ratanapongpien, K.; Khantachawana, A.; Kondoh, K. Effect of Laser Scanning Speed and Fine Shot Peening on Pore Characteristics, Hardness, and Residual Stress of Ti-6Al-4V Fabricated by Laser Powder Bed Fusion. Metals 2024, 14, 250. [Google Scholar] [CrossRef]
- Ni, C.; Shi, Y.; Liu, J. Effects of inclination angle on surface roughness and corrosion properties of selective laser melted 316L stainless steel. Mater. Res. Express 2019, 6, 036505. [Google Scholar] [CrossRef]
- Ma, M.; Xiong, W.; Lian, Y.; Han, D.; Zhao, C.; Zhang, J. Modeling and optimization for laser cladding via multi-objective quantum-behaved particle swarm optimization algorithm. Surf. Coat. Technol. 2020, 381, 125129. [Google Scholar] [CrossRef]
- Rafiei, J.; Ghasemi, R.A. Development of thermo-mechanical simulation of WC/Inconel 625 metal matrix composites laser cladding and optimization of process parameters. Int. J. Therm. Sci. 2024, 198, 108883. [Google Scholar] [CrossRef]
- Zhang, H.; Pan, Y.; Zhang, Y.; Lian, G.; Cao, Q.; Yang, J. Influence of laser power on the microstructure and properties of in-situ NbC/WCoB–TiC coating by laser cladding. Mater. Chem. Phys. 2022, 290, 126636. [Google Scholar] [CrossRef]
- Shi, B.; Mu, X.; Zhan, H.; Deng, L.; Li, T.; Zhang, H. Crack Behavior of Ni60A Coating Prepared by Laser Cladding on a Tilted Substrate. Coatings 2022, 12, 966. [Google Scholar] [CrossRef]
- Li, Y.; Su, K.; Bai, P.; Wu, L. Microstructure and property characterization of Ti/TiBCN reinforced Ti based composite coatings fabricated by laser cladding with different scanning speed. Mater. Charact. 2020, 159, 110023. [Google Scholar] [CrossRef]
- Wang, C.; Yu, J.; Zhang, Y.; Yu, Y. Phase evolution and solidification cracking sensibility in laser remelting treatment of the plasma-sprayed CrMnFeCoNi high entropy alloy coating. Mater. Des. 2019, 182, 108040. [Google Scholar] [CrossRef]
- Al-Ruqeishi, M.S.; Mohiuddin, T.; Al-Amri, K.; Rohman, N. Graphene Surface Energy by Contact Angle Measurements. Arab. J. Sci. Eng. 2022, 48, 757–762. [Google Scholar] [CrossRef]
- Segura-Cardenas, E.; Ramirez-Cedillo, E.; Sandoval-Robles, J.; Ruiz-Huerta, L.; Caballero-Ruiz, A.; Siller, H. Permeability Study of Austenitic Stainless Steel Surfaces Produced by Selective Laser Melting. Metals 2017, 7, 521. [Google Scholar] [CrossRef]
- Zhao, S.; Yang, L.; Huang, Y.; Xu, S. Feasibility study of producing Ni/WC composite coatings by laser deposition with a tubular cored wire. J. Mater. Process. Tech. 2020, 285, 116745. [Google Scholar] [CrossRef]
- Luo, W.; Liu, Y.; Tu, C. Wetting behaviors and interfacial characteristics of molten AlxCoCrCuFeNi high-entropy alloys on a WC substrate. J. Mater. Sci. Technol. 2021, 78, 192–201. [Google Scholar] [CrossRef]
- Zhang, Y.; Han, T.-F.; Xiao, M.; Shen, Y.-F. Effect of process parameters on the microstructure and properties of laser-clad FeNiCoCrTi 0.5 high-entropy alloy coating. Int. J. Miner. Metall. Mater. 2020, 27, 630–639. [Google Scholar] [CrossRef]
- Ding, Y.; Gui, W.; Nie, B.; Bi, W.; Zhong, C.; Xue, Y.; Luan, B. Elimination of elemental segregation by high-speed laser remelting for ultra-high-speed laser cladding Inconel 625 coatings. J. Mater. Res. Technol. 2023, 24, 4118–4129. [Google Scholar] [CrossRef]
- Gao, Q.; Ling, W.; Zhou, Y.; Zhan, X.; Shen, H. Correlation between special bud-shaped area and molten pool flow in laser cladding high-entropy alloy on TC4 surface. Int. J. Therm. Sci. 2023, 183, 107825. [Google Scholar] [CrossRef]
- Sun, Z.; Chen, L.; Chen, X.; Meng, F.; Yu, T.; Zhao, J. Analysis and prediction of Cu-Sn-Ti alloy deposited on 316 L steel by coaxial laser cladding. Optik 2023, 282, 170839. [Google Scholar] [CrossRef]
- Liu, L.; Wang, G.; Ren, K.; Di, Y.; Wang, L.; Rong, Y.; Wang, H. Marangoni flow patterns of molten pools in multi-pass laser cladding with added nano-CeO2. Addit. Manuf. 2022, 59, 103156. [Google Scholar] [CrossRef]
- Deng, D.; Li, T.; Huang, Z.; Jiang, H.; Yang, S.; Zhang, Y. Multi-response optimization of laser cladding for TiC particle reinforced Fe matrix composite based on Taguchi method and grey relational analysis. Opt. Laser Technol. 2022, 153, 108259. [Google Scholar] [CrossRef]
- Yu, T.; Yang, L.; Zhao, Y.; Sun, J.; Li, B. Experimental research and multi-response multi-parameter optimization of laser cladding Fe313. Opt. Laser Technol. 2018, 108, 321–332. [Google Scholar] [CrossRef]
- Lian, G.; Yue, K.; Liu, Z.; Lu, H.; Wang, Y. Influences of the cladding method and overlapping rate on the multi-channel overlapping of composite coatings. Optik 2023, 283, 170896. [Google Scholar] [CrossRef]
- Agapovichev, A.V.; Khaimovich, A.I.; Smelov, V.G.; Kokareva, V.V.; Zemlyakov, E.V.; Babkin, K.D.; Kovchik, A.Y. Multiresponse Optimization of Selective Laser Melting Parameters for the Ni-Cr-Al-Ti-Based Superalloy Using Gray Relational Analysis. Materials 2023, 16, 2088. [Google Scholar] [CrossRef]
- Yue, H.; Lv, N.; Guo, C.; Zhai, J.; Dai, W.; Zhang, J. Multi-Objective Process Optimization of Laser Cladding Co-Based Alloy by Process Window and Grey Relational Analysis. Coatings 2023, 13, 1090. [Google Scholar] [CrossRef]
- Sneha, S.; Jaromír, K.; Petr, Š. Interfacial Adhesion of Thick NiTi Coating on Substrate Stainless Steel. Materials 2022, 15, 8598. [Google Scholar] [CrossRef]
- Li, B.; Wang, B.; Zhu, G.; Zhang, L.; Lu, B. Low-Roughness-Surface Additive Manufacturing of Metal-Wire Feeding with Small Power. Materials 2021, 14, 4265. [Google Scholar] [CrossRef]
- Meghwal, A.; Anupam, A.; Murty, B.S.; Berndt, C.C.; Kottada, R.S.; Ang, A.S.M. Thermal Spray High-Entropy Alloy Coatings: A Review. J. Therm. Spray Technol. 2020, 29, 857–893. [Google Scholar] [CrossRef]
- Santosh, K. Comprehensive review on high entropy alloy-based coating. Surf. Coat. Technol. 2024, 477, 130327. [Google Scholar]
- Wang, L.; Ran, X.; Li, Y.; Li, F.; Liu, J.; Du, J. Energy consumption model of plasma spraying based on unit process life cycle inventory. J. Mater. Res. Technol. 2020, 9, 15324–15334. [Google Scholar] [CrossRef]
- Minx, J.C.; Lamb, W.F.; Andrew, R.M.; Canadell, J.G.; Crippa, M.; Döbbeling, N.; Forster, P.M.; Guizzardi, D.; Olivier, J.; Peters, G.P.; et al. A comprehensive and synthetic dataset for global, regional, and national greenhouse gas emissions by sector 1970–2018 with an extension to 2019. Earth Syst. Sci. Data 2021, 13, 5213–5252. [Google Scholar] [CrossRef]
- Koide, R.; Lettenmeier, M.; Akenji, L.; Toivio, V.; Amellina, A.; Khodke, A.; Watabe, A.; Kojima, S. Lifestyle carbon footprints and changes in lifestyles to limit global warming to 1.5 °C, and ways forward for related research. Sustain. Sci. 2021, 16, 2087–2099. [Google Scholar] [CrossRef]
- Jack, T.; Bååth, J.; Heinonen, J.T.; Gram-Hanssen, K. Correction: How individuals make sense of their climate impacts in the capitalocene: Mixed methods insights from calculating carbon footprints. Sustain. Sci. 2024, 19, 1117. [Google Scholar] [CrossRef]
- Dominique, M.V.; Christos, Z. “Take your responsibility”: The politics of green sacrifice for just low-carbon transitions in rural Portugal. Sustain. Sci. 2024, 19, 1313–1326. [Google Scholar]


| C | Si | Mn | S | P | Fe |
|---|---|---|---|---|---|
| ≤0.22 | ≤0.35 | ≤1.4 | ≤0.050 | ≤0.045 | Bal. |
| Fe | Ni | Cr | Al | Cu |
|---|---|---|---|---|
| 22.15 | 22.41 | 19.72 | 10.39 | Bal. |
| C | Si | Mn | S | P | Cr | Ni | Mo | Fe |
|---|---|---|---|---|---|---|---|---|
| <0.03 | <1.00 | <2.00 | <0.03 | <0.045 | <18 | <14 | <3 | Bal. |
| Processing Parameter | Notation | Unit | Levels | |||
|---|---|---|---|---|---|---|
| 1 | 2 | 3 | 4 | |||
| HEA Addition Rate | A | % | 0 | 5 | 10 | 15 |
| Laser Power | B | W | 750 | 1100 | 1450 | 1800 |
| Scanning Speed | C | mm/s | 5 | 7 | 9 | 11 |
| Powder Feed Rate | D | r/min | 2 | 5 | 8 | 11 |
| Substrate Tilt Angle | E | ° | 0 | 10 | 20 | 30 |
| Run | A (%) | B (W) | C (mm/s) | D (r/min) | E (°) | Parameter Combination | H (HV) | λ (%) | (°) | Δa (°) |
|---|---|---|---|---|---|---|---|---|---|---|
| 1 | 0 | 750 | 5 | 2 | 0 | A1B1C1D1E1 | 439.87 | 38.32 | 24.26 | 0.634 |
| 2 | 0 | 1100 | 7 | 5 | 10 | A1B2C2D2E2 | 181.60 | 15.92 | 51.85 | 0.600 |
| 3 | 0 | 1450 | 9 | 8 | 20 | A1B3C3D3E3 | 364.09 | 27.24 | 57.76 | 26.464 |
| 4 | 0 | 1800 | 11 | 11 | 30 | A1B4C4D4E4 | 194.13 | 18.65 | 63.27 | 4.236 |
| 5 | 5 | 750 | 7 | 8 | 30 | A2B1C2D3E4 | 190.05 | 20.31 | 25.21 | 3.076 |
| 6 | 5 | 1100 | 5 | 11 | 20 | A2B2C1D4E3 | 184.72 | 8.39 | 76.15 | 17.584 |
| 7 | 5 | 1450 | 11 | 2 | 10 | A2B3C4D1E2 | 460.28 | 83.32 | 39.42 | 20.054 |
| 8 | 5 | 1800 | 9 | 5 | 0 | A2B4C3D2E1 | 457.03 | 85.50 | 90.81 | 48.533 |
| 9 | 10 | 750 | 9 | 11 | 10 | A3B1C3D4E2 | 203.30 | 6.55 | 59.06 | 1.460 |
| 10 | 10 | 1100 | 11 | 8 | 0 | A3B2C4D3E1 | 257.83 | 21.93 | 52.39 | 1.029 |
| 11 | 10 | 1450 | 5 | 5 | 30 | A3B3C1D2E4 | 407.13 | 36.07 | 33.94 | 2.513 |
| 12 | 10 | 1800 | 7 | 2 | 20 | A3B4C2D1E3 | 424.47 | 86.27 | 17.95 | 4.194 |
| 13 | 15 | 750 | 11 | 5 | 20 | A4B1C4D2E3 | 461.30 | 31.26 | 25.79 | 0.312 |
| 14 | 15 | 1100 | 9 | 2 | 30 | A4B2C3D1E4 | 445.02 | 79.53 | 12.67 | 2.010 |
| 15 | 15 | 1450 | 7 | 11 | 0 | A4B3C2D4E1 | 180.04 | 14.64 | 73.75 | 5.192 |
| 16 | 15 | 1800 | 5 | 8 | 10 | A4B4C1D3E2 | 209.81 | 25.15 | 55.20 | 2.743 |
| Processing Parameter | Notation | Unit | Levels | |||
|---|---|---|---|---|---|---|
| 1 | 2 | 3 | 4 | |||
| HEA Addition Rate | A | % | 0 | 5 | 10 | 15 |
| Laser Power | B | W | 750 | 750 | 750 | 750 |
| Scanning Speed | C | mm/s | 7 | 7 | 7 | 7 |
| Powder Feed Rate | D | r/min | 2 | 2 | 2 | 2 |
| Substrate Tilt Angle | E | ° | 30 | 30 | 30 | 30 |
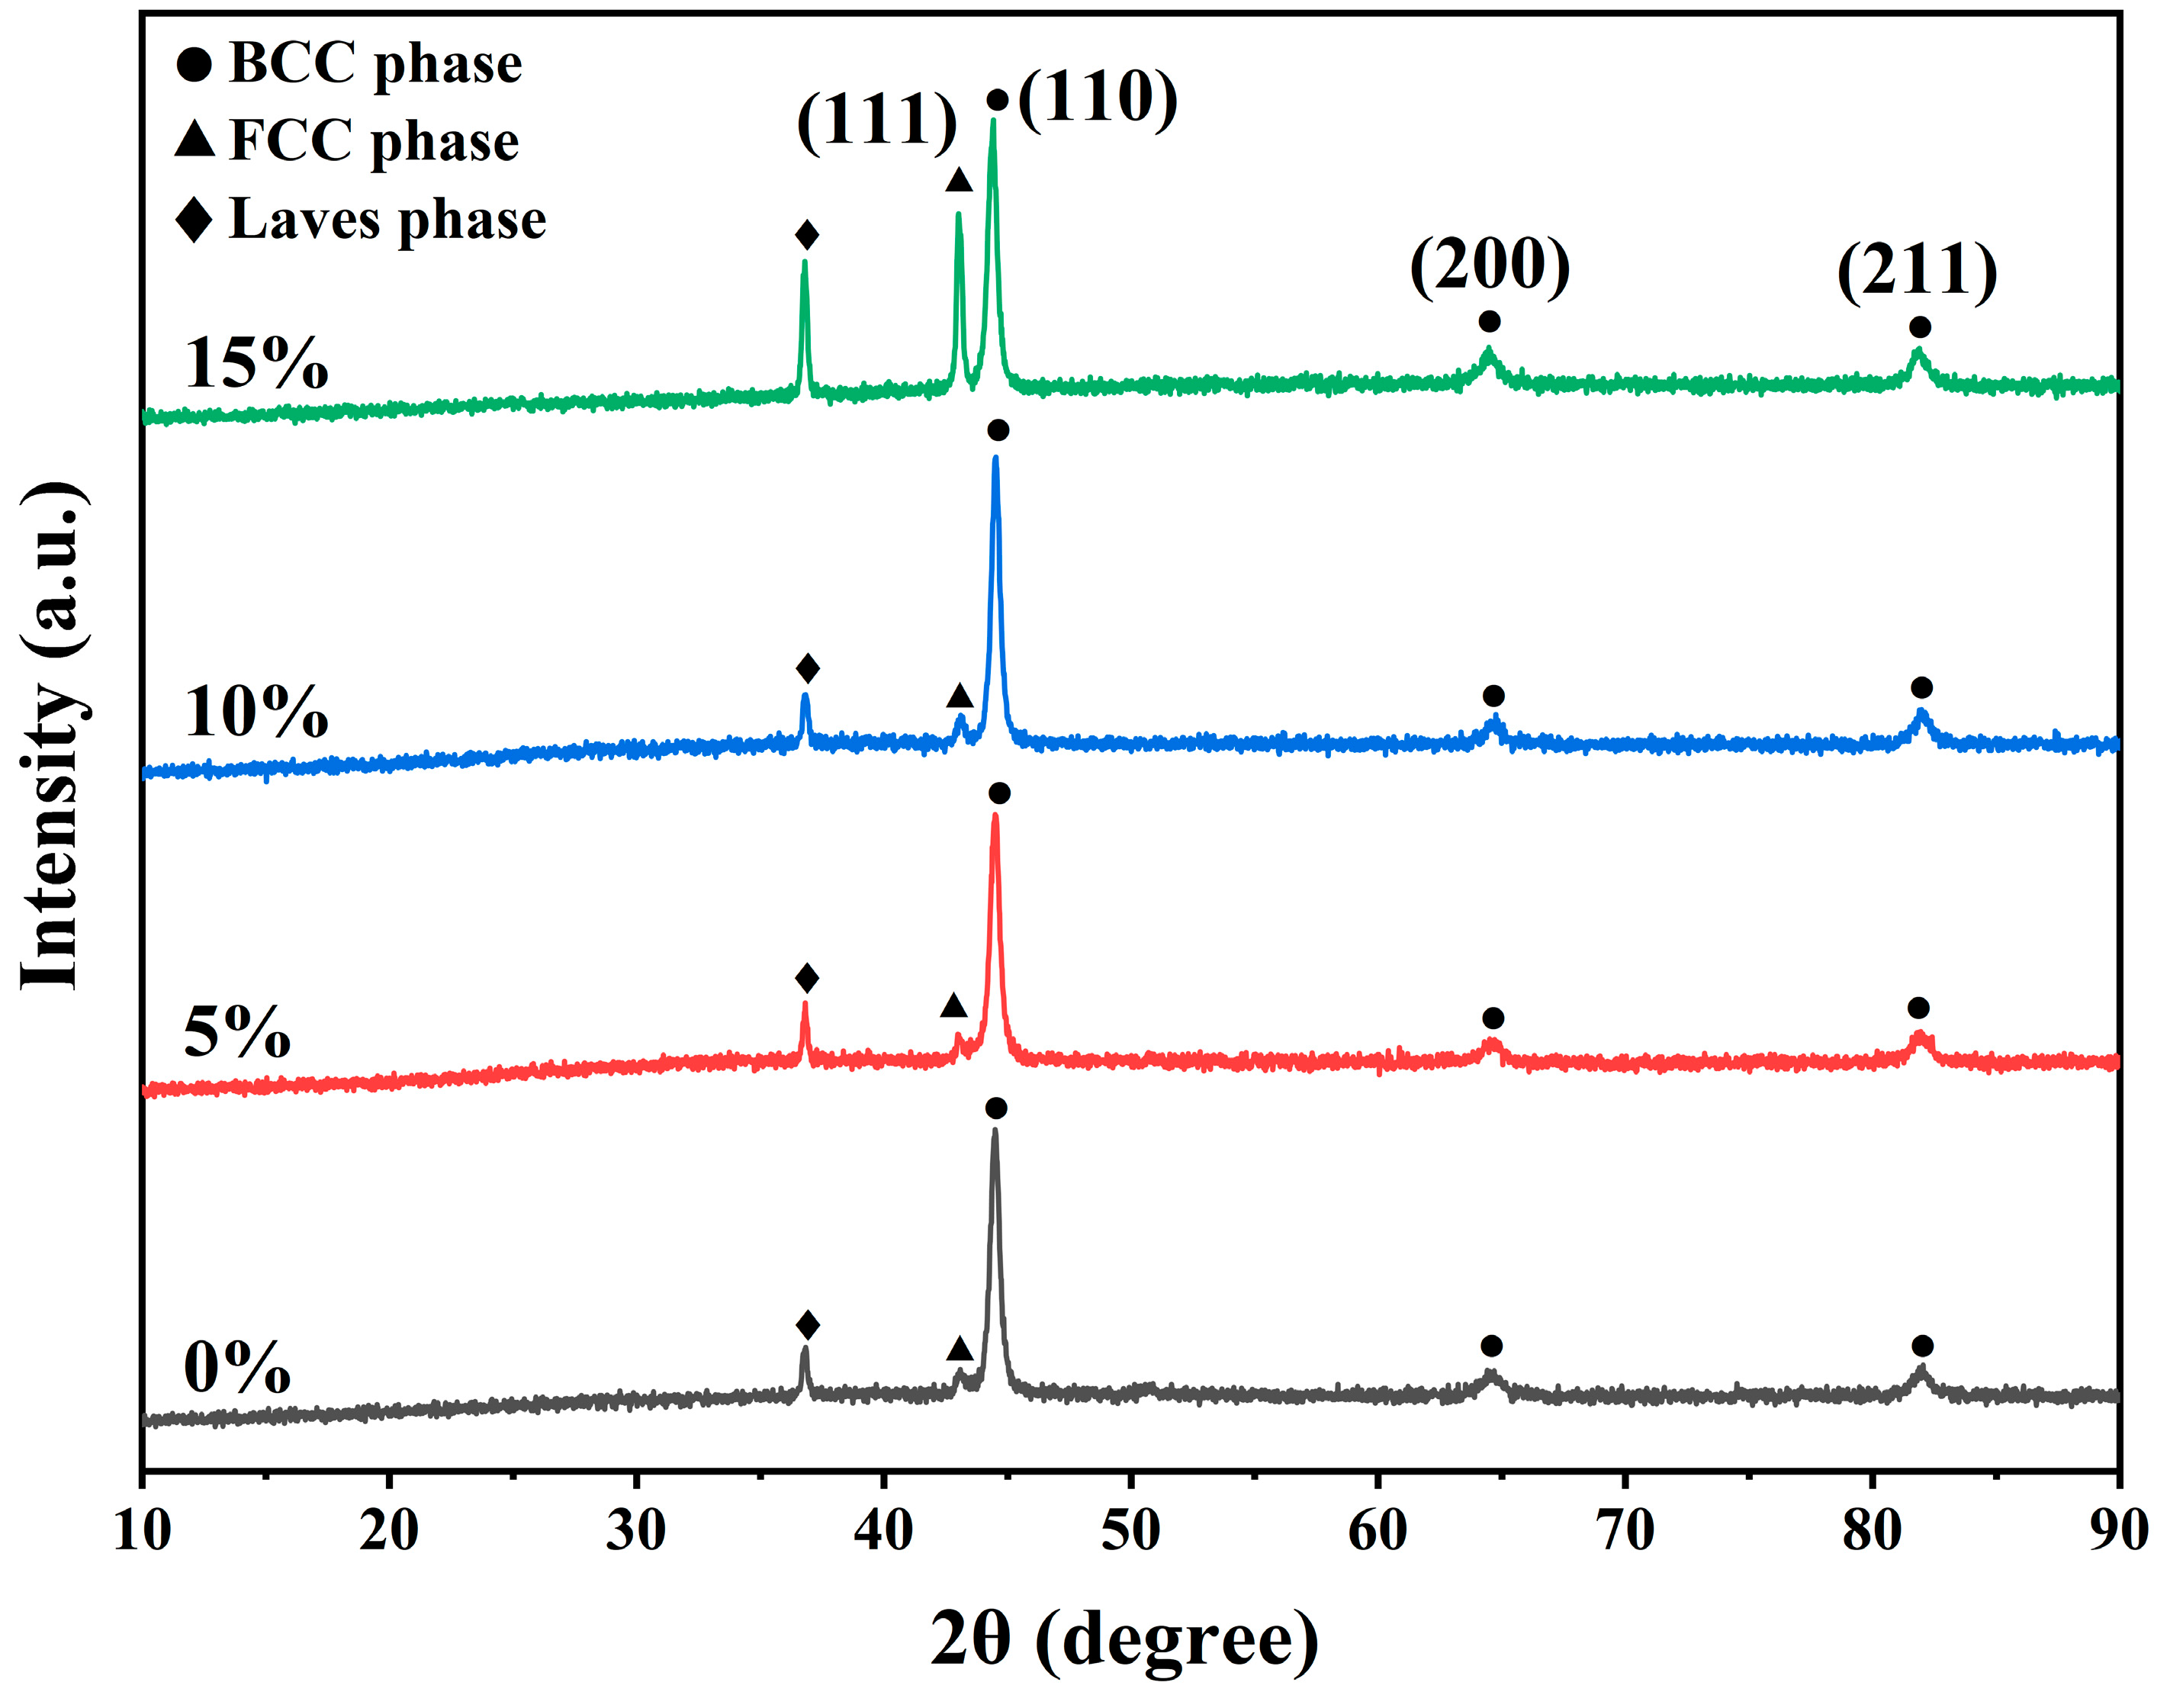
| Criterion | Phase | HEA Addition Rate | |||
|---|---|---|---|---|---|
| 0% | 5% | 10% | 15% | ||
| Lattice constant (nm) | Laves | 0.4891 | 0.4881 | 0.4885 | 0.4885 |
| FCC | 0.4198 | 0.4206 | 0.4203 | 0.4203 | |
| BCC | 0.2883 | 0.2886 | 0.2888 | 0.2885 | |
| Level | A | B | C | D | E |
|---|---|---|---|---|---|
| 1 | 48.76 | 49.47 | 49.21 | 52.91 | 49.85 |
| 2 | 49.34 | 47.93 | 47.11 | 50.96 | 47.76 |
| 3 | 49.79 | 50.45 | 50.89 | 47.87 | 50.60 |
| 4 | 49.45 | 49.49 | 50.13 | 45.59 | 49.13 |
| Delta | 1.03 | 2.52 | 3.78 | 7.32 | 2.84 |
| Rank | 5 | 4 | 2 | 1 | 3 |
| Level | A | B | C | D | E |
|---|---|---|---|---|---|
| 1 | 12.54 | 13.99 | 12.68 | 3.30 | 9.89 |
| 2 | 9.58 | 13.16 | 11.95 | 9.07 | 13.30 |
| 3 | 11.75 | 9.61 | 9.58 | 12.58 | 11.05 |
| 4 | 10.19 | 7.31 | 9.86 | 19.12 | 9.82 |
| Delta | 2.97 | 6.68 | 3.10 | 15.82 | 3.48 |
| Rank | 5 | 2 | 4 | 1 | 3 |
| Level | A | B | C | D | E |
|---|---|---|---|---|---|
| 1 | −33.31 | −29.85 | −32.7 | −26.69 | −34.65 |
| 2 | −34.19 | −32.09 | −31.19 | −33.07 | −34.12 |
| 3 | −31.38 | −33.78 | −32.97 | −33.12 | −31.54 |
| 4 | −30.62 | −33.78 | −32.64 | −36.61 | −29.18 |
| Delta | 3.57 | 3.93 | 1.78 | 9.92 | 5.47 |
| Rank | 4 | 3 | 5 | 1 | 2 |
| Level | A | B | C | D | E |
|---|---|---|---|---|---|
| 1 | −8.15 | 0.26 | −9.43 | −10.15 | −11.08 |
| 2 | −23.61 | −6.69 | −8.02 | −6.79 | −8.41 |
| 3 | −6.00 | −19.20 | −17.88 | −11.81 | −13.92 |
| 4 | −4.75 | −16.87 | −7.17 | −13.76 | −9.09 |
| Delta | 18.86 | 19.46 | 10.71 | 6.97 | 5.51 |
| Rank | 2 | 1 | 3 | 4 | 5 |
| Run | Y(H) | ∆0(H) | Y(λ) | ∆0(λ) | ) | ∆0) | ) | ∆0) |
|---|---|---|---|---|---|---|---|---|
| 1 | 0.92381 | 0.07619 | 0.60226 | 0.39774 | 0.85170 | 0.14830 | 0.99332 | 0.00668 |
| 2 | 0.00555 | 0.99445 | 0.88331 | 0.11669 | 0.49864 | 0.50136 | 0.99403 | 0.00597 |
| 3 | 0.65438 | 0.34562 | 0.74153 | 0.25847 | 0.42301 | 0.57700 | 0.45766 | 0.54234 |
| 4 | 0.05010 | 0.94990 | 0.84818 | 0.15182 | 0.35247 | 0.64754 | 0.91863 | 0.08138 |
| 5 | 0.03559 | 0.96441 | 0.82811 | 0.17190 | 0.83960 | 0.16040 | 0.94268 | 0.05732 |
| 6 | 0.01664 | 0.98336 | 0.97742 | 0.02259 | 0.18761 | 0.81239 | 0.64182 | 0.35818 |
| 7 | 0.99637 | 0.00363 | 0.03764 | 0.96236 | 0.65775 | 0.34225 | 0.59059 | 0.40941 |
| 8 | 0.98482 | 0.01518 | 0.01004 | 0.98996 | 0 | 1 | 0 | 1 |
| 9 | 0.08270 | 0.91730 | 1 | 0 | 0.40630 | 0.59370 | 0.97619 | 0.02381 |
| 10 | 0.27658 | 0.72342 | 0.80803 | 0.19197 | 0.49171 | 0.50829 | 0.98513 | 0.01487 |
| 11 | 0.80740 | 0.19260 | 0.62986 | 0.37014 | 0.72783 | 0.27218 | 0.95436 | 0.04564 |
| 12 | 0.86905 | 0.13095 | 0 | 1 | 0.93246 | 0.06755 | 0.91950 | 0.08050 |
| 13 | 1 | 0 | 0.69009 | 0.30991 | 0.83219 | 0.16781 | 1 | 0 |
| 14 | 0.94212 | 0.05788 | 0.08532 | 0.91468 | 1 | 0 | 0.96479 | 0.03521 |
| 15 | 0 | 1 | 0.89962 | 0.10038 | 0.21841 | 0.78159 | 0.89880 | 0.10120 |
| 16 | 0.10585 | 0.89416 | 0.76663 | 0.23338 | 0.45573 | 0.54427 | 0.94959 | 0.05041 |
| Run | GRC(H) | GRC(λ) | ) | ) | GRG | Rank |
|---|---|---|---|---|---|---|
| 1 | 0.86777 | 0.55695 | 0.77125 | 0.98682 | 0.80883 | 2 |
| 2 | 0.33457 | 0.81078 | 0.49932 | 0.98820 | 0.70690 | 8 |
| 3 | 0.59128 | 0.65922 | 0.46426 | 0.47969 | 0.54251 | 15 |
| 4 | 0.34485 | 0.76708 | 0.43572 | 0.86003 | 0.64119 | 11 |
| 5 | 0.34143 | 0.74416 | 0.75711 | 0.89715 | 0.71920 | 7 |
| 6 | 0.33707 | 0.95678 | 0.38098 | 0.58263 | 0.58204 | 14 |
| 7 | 0.99280 | 0.34191 | 0.59365 | 0.54981 | 0.59483 | 13 |
| 8 | 0.97053 | 0.33558 | 0.33333 | 0.33333 | 0.45854 | 16 |
| 9 | 0.35278 | 1.00000 | 0.45717 | 0.95455 | 0.73666 | 4 |
| 10 | 0.40869 | 0.72258 | 0.49589 | 0.97112 | 0.69312 | 9 |
| 11 | 0.72192 | 0.57462 | 0.64752 | 0.91635 | 0.73350 | 5 |
| 12 | 0.79246 | 0.33333 | 0.88099 | 0.86132 | 0.72156 | 6 |
| 13 | 1.00000 | 0.61735 | 0.74871 | 1.00000 | 0.84899 | 1 |
| 14 | 0.89625 | 0.35344 | 1.00000 | 0.93421 | 0.79775 | 3 |
| 15 | 0.33333 | 0.83281 | 0.39014 | 0.83167 | 0.63556 | 12 |
| 16 | 0.35864 | 0.68178 | 0.47880 | 0.90841 | 0.64853 | 10 |
| Processing Parameter | Notation | Levels | Absolute Value Difference | Rank | |||
|---|---|---|---|---|---|---|---|
| 1 | 2 | 3 | 4 | ||||
| HEA Addition Rate | A | −3.51 | −4.71 | −2.84 | −2.77 | 1.94 | 2 |
| Laser Power | B | −2.20 | −3.22 | −4.11 | −4.31 | 2.11 | 1 |
| Scanning Speed | C | −3.25 | −3.16 | −4.18 | −3.25 | 1.01 | 4 |
| Powder Feed Rate | D | −2.79 | −3.48 | −3.78 | −3.79 | 1 | 5 |
| Substrate Tilt Angle | E | −3.93 | −3.49 | −3.57 | −2.84 | 1.09 | 3 |
| Output | Best Parameter Set fromOrthogonal Design | GRA Prediction | Validation on GRA Prediction |
|---|---|---|---|
| Parameter Set | A4B1C4D2E3 | A4B1C2D1E4 | A4B1C2D1E4 |
| H | 461.30 HV | - | 549.14 HV |
| λ | 0.31 | - | 0.536 |
| 25.79° | - | 16.16° | |
| Δa | 0.312 | - | 1.69 |
| GRG | 0.84899 | 0.94316 | 0.93427 |
| Technical Categories | China/kg | The United Kingdom/kg | France/kg | The United States/kg | The Russian Federation/kg |
|---|---|---|---|---|---|
| Laser cladding | 161.59 | 61.21 | 11.88 | 108.21 | 93.32 |
| Plasma spray | 239.60 | 90.76 | 17.62 | 160.45 | 138.37 |
Disclaimer/Publisher’s Note: The statements, opinions and data contained in all publications are solely those of the individual author(s) and contributor(s) and not of MDPI and/or the editor(s). MDPI and/or the editor(s) disclaim responsibility for any injury to people or property resulting from any ideas, methods, instructions or products referred to in the content. |
© 2024 by the authors. Licensee MDPI, Basel, Switzerland. This article is an open access article distributed under the terms and conditions of the Creative Commons Attribution (CC BY) license (https://creativecommons.org/licenses/by/4.0/).
Share and Cite
Gao, S.; Fu, Q.; Li, M.; Huang, L.; Liu, N.; Cui, C.; Yang, B.; Zhang, G. Optimization of Laser Cladding Parameters for High-Entropy Alloy-Reinforced 316L Stainless-Steel via Grey Relational Analysis. Coatings 2024, 14, 1103. https://doi.org/10.3390/coatings14091103
Gao S, Fu Q, Li M, Huang L, Liu N, Cui C, Yang B, Zhang G. Optimization of Laser Cladding Parameters for High-Entropy Alloy-Reinforced 316L Stainless-Steel via Grey Relational Analysis. Coatings. 2024; 14(9):1103. https://doi.org/10.3390/coatings14091103
Chicago/Turabian StyleGao, Senao, Qiang Fu, Mengzhao Li, Long Huang, Nian Liu, Chang Cui, Bing Yang, and Guodong Zhang. 2024. "Optimization of Laser Cladding Parameters for High-Entropy Alloy-Reinforced 316L Stainless-Steel via Grey Relational Analysis" Coatings 14, no. 9: 1103. https://doi.org/10.3390/coatings14091103
APA StyleGao, S., Fu, Q., Li, M., Huang, L., Liu, N., Cui, C., Yang, B., & Zhang, G. (2024). Optimization of Laser Cladding Parameters for High-Entropy Alloy-Reinforced 316L Stainless-Steel via Grey Relational Analysis. Coatings, 14(9), 1103. https://doi.org/10.3390/coatings14091103