Article

Microstructure and Oxidation Behaviors of (TiVCr)2AlC MAX-Phase Coatings Prepared by Magnetron Sputtering

1
School of Materials Chemistry and Chemical Engineering, Ningbo University, Ningbo 315201, China
2
Zhejiang Key Laboratory of Data-Driven High-Safety Energy Materials and Applications, Ningbo Key Laboratory of Special Energy Materials and Chemistry, Ningbo Institute of Materials Technology and Engineering, Chinese Academy of Sciences, Ningbo 315201, China
3
Qianwan Institute of CNITECH, Ningbo 315336, China
*
Author to whom correspondence should be addressed.
Coatings 2024, 14(12), 1504; https://doi.org/10.3390/coatings14121504
Submission received: 24 October 2024 / Revised: 27 November 2024 / Accepted: 27 November 2024 / Published: 29 November 2024
(This article belongs to the Special Issue Magnetron Sputtering Coatings: From Materials to Applications)

Abstract

:
A solid solution is an effective approach to regulate the microstructure and hence the various properties such as hardness and oxidation behavior of materials. In this study, an M-site solid-solution medium-entropy-alloy MAX-phase coating (TiVCr)2AlC was prepared through combining the magnetron sputter deposition at low- and high-temperature vacuum annealing. The mechanical properties and high-temperature oxidation resistance in the 700–1000 °C temperature range in air of these coatings were then evaluated. The results showed that the 211-MAX-phase can be formed in the 700 °C vacuum for 3 h, and the crystallinity depended on the annealing temperature. Compared to the amorphous coating, the MAX-phase sample demonstrated superior oxidation resistance in terms of the onset temperature of the oxidation and the oxidation products. During high-temperature oxidation, a mixed oxide layer containing V2O5, TiO2, and Cr2O3 was formed at 700 °C on the surface of an amorphous coating, whereas only a thin continuous Al2O3 scale was observed at ≤800 °C for the crystalline (TiVCr)2AlC coating. Additionally, the maximum hardness of the coating reached 18 GPa after annealing. These results demonstrate the application potential of the medium-entropy-alloy MAX-phase coating in extreme environments such as aerospace, nuclear energy, and other fields.

1. Introduction

In recent studies, the application of medium-entropy-alloy (MEA) coatings in multi-directional fields has been widely investigated, such as high-temperature oxidation resistance [1], electrochemical corrosion [2,3,4], wear resistance [5,6,7,8], and dynamic recrystallization behavior [9]. For example, Agustianingrum et al. studied the high-temperature oxidation behavior of a CoCrNi medium-entropy alloy at 900–1100 °C for different exposure times and found that the oxidation mechanism and the corresponding activation energy of CoCrNi were related to the slow diffusion of the Co, Cr, and Ni elements and the accumulation of vacancies near the surface [10]. Similarly, Kai et al. reported the oxidation behavior of four NiCoCrAlx (x = 0, 0.1, 0.3, or 0.5) medium-entropy alloys in dry air at 600–900 °C [11]. In the field of biomedicine, medium-entropy-alloy coatings have also demonstrated contributions. Lin et al. reported that (TiZr)90−xNbxTa5Mo5 coatings exhibit remarkable corrosion resistance because of the formation of a passivation film comprising titanium oxide and zirconium oxide during the corrosion process, thereby enhancing the coating’s durability [12]. These excellent properties make the MEA coatings suitable for applications in extreme environments.
MAX-phase materials are ternary layered compounds with a hexagonal structure, represented by the general formula Mn+1AXn. In this formula, M typically denotes a transition metal element such as Ti, Zr, Hf, V, Cr, etc., A represents a main group element such as Al or Si, and X is either carbon or nitrogen, with n taking values of 1, 2, 3, or 4. MAX-phase materials exhibit a unique combination of physical properties from both ceramics and metals, making them highly versatile [13,14,15,16,17]. Researchers have conducted studies on different MAX-phase coatings to understand their oxidation behavior and performance under specific conditions. For example, Berger et al. investigated the oxidation behavior of a Cr2AlC coating in air at temperatures ranging from 700 to 1200 °C. The oxidation process was observed to transition from a disordered solid solution (Cr, Al)2Cx to the ordered Cr2AlC-MAX phase, leading to the formation of a continuous and dense α-Al2O3 oxide layer [16]. Similarly, Azina et al. studied the oxidation behavior of a V2AlC coating in air at temperatures between 400 and 800 °C. The researchers observed the formation of different V-based oxides during oxidation, with α-Al2O3 being formed after oxidation at ≥800 °C for 5 min, and the coating cracked at 700 °C [18]. In another study, Wang et al. investigated the oxidation behavior of a Ti2AlN coating in air at temperatures ranging from 700 to 900 °C. During the oxidation process, an Al-rich oxide layer formed on the coating’s surface, providing effective protection against further oxidation of the substrate; after oxidation at 900 °C for 100 h, the coating composition was still dominated by the Ti2AlN-MAX phase [19]. From these reported results, it is evident that, although they are all Al-containing MAX phases, the oxidation behaviors are very different due to the various chemical elements at the M-site.
At present, researchers have repeatedly reported the study of M-site two-element solid-solution MAX-phase coatings, while M-site three-element solid-solution MAX-phase coatings have rarely been reported. For example, Zhang et al. reported that the structure of the (Cr, Mo)2AlC solid solution is stable [20]. The introduction of the Mo element at the M-site accelerates the formation of the Al2O3 passivation layer on the surface of the coating during electrochemical corrosion, which plays a role in protecting the electrochemical properties and prolonging the service life of the coating. Wang et al. reported that a (Cr, V)2AlC MAX-phase coating was obtained by introducing V at the M-site to replace part of the Cr in Cr2AlC [21]. The high-temperature friction experiment proved that the (Cr, V)2AlC solid solution has more advantages in terms of its mechanical properties and tribological performance than Cr2AlC. In this paper, primarily, the crystal structure of a (TiVCr)2AlC high-entropy-alloy MAX-phase coating is taken as the starting point and the difference between the as-deposited and crystalline (TiVCr)2AlC coatings in high-temperature oxidation experiments is studied. At the same time, the composition, microstructure, hardness, and high-temperature oxidation resistance of the (TiVCr)2AlC medium-entropy-alloy coating were explored, and its oxidation behavior in high temperature environments was described in detail.

2. Experimental Details

The TiVCrAlC coatings were prepared on c-plane sapphire and quartz substrates at 450 °C by magnetron co-sputtering from three targets of Ti2AlC (99.9% in purity), CrC (99.9% in purity), and VAl (99.95% in purity), which were driven by the direct-current power supplies at 150 W, 90 W, and 150 W, respectively. The details of the system have been reported in our previous works [22,23]. Prior to deposition, the base pressure was better than 5 × 10⁻⁵ Pa. The targets were then pre-sputtered for at least 15 min. All the depositions were performed in pure Ar discharges at a pressure of 0.3 Pa, with the substrate holder rotating at a speed of ~10 rounds per minute. With a growth rate of ~17.5 nm/min, all the films were grown to ~2.8 μm. Subsequently, the as-deposited samples were isothermally annealed at 700–900 °C for 3 h in vacuum using a furnace. Prior to the annealing, the chamber was pumped down to 1.0 × 10⁻⁴ Pa. Both the heating and cooling rates were fixed at 5 °C/min.
The elemental compositions of the coatings were determined by means of energy-dispersive X-ray spectrometry (EDX). Phase identification was performed by X-ray diffraction (XRD) on a Bruker D8 Advance diffractometer (in the θ-θ configurations with a step of 0.01°) and Raman spectroscopy on a Renishaw inVia Reflex system with the excitation laser of 532 nm. Both the surface and the cross-sectional morphologies were examined by a Hitachi S4800 high-resolution field emission SEM (Hitachi, Japan) with the electron gun set at 4 KV. Subsequently, more microstructural examination was conducted on a Talos F200x transmission electron microscope (TEM, Thermo Fisher Scientific, Waltham, MA, USA) operated at an acceleration voltage of 200 kV. A focus ion beam (FIB) workstation (Auriga, Carl Zeiss, Dublin, CA, USA) was used to prepare the TEM specimens.
Hardness and indentation modulus were obtained by analyzing the load–displacement curves with the Oliver–Pharr method through an MTS nano-indenter XP system. The indentation depth was limited to ~300 nm. The as-deposited and 700 °C annealed coatings were then air-oxidized in an open furnace. The oxidation temperatures were set to 700 °C, 800 °C, 900 °C, and 1000 °C. When the temperature reached the setup, the sample was then transferred into the furnace within ~4 min. The oxidation times were maintained at 15 min. After that, the samples were removed from the tube and subsequently cooled to room temperature and then characterized. Unless otherwise specified, the characterizations and tests were performed on all samples grown on sapphire substrates.

3. Results and Discussion

3.1. Microstructure

Figure 1 shows the XRD patterns of the as-deposited TiVCrAlC and the annealed (TiVCr)2AlC coatings on both sapphire and quartz substrates. Apart from the diffraction peaks corresponding to the sapphire substrate, the as-deposited coating exhibited no reflections from the MAX or other phases, indicating poor crystallinity or extremely small size in terms of the coherent diffraction domains, thus being regarded as X-ray-amorphous. After the annealing at 700 °C, a noticeable improvement in crystallinity can be observed, and all the diffraction peaks can be indexed to be of a single 211-MAX phase (ICDD PDF # 29-0101). Based on Bragg’s law regarding all the diffraction peaks, the calculated lattice parameters of a = 2.92 Å and c = 13.06 Å are close to that of the V2AlC phase. No other phases such as carbides or intermetallic compounds were detected. The temperature at which the TiVCrAlC coatings begin to crystallize is consistent with the reported values for V2AlC of 580–750 °C and for Ti2AlC of 600–800 °C [15,24], and it is higher than the range of 450–500 °C for Cr2AlC [25]. As the annealing temperature continued to increase, the crystallinity of the coating was significantly improved, as clearly illustrated by the disappearance of the broadened peak corresponding to the (103) reflection (Figure 1b). However, as the temperature increased to 900 °C, the full width at half maximum (FWHM) of the (103) reflection was not narrowed much, for example, decreasing from 0.266° to 0.254°, implying that the grains have not grown significantly. According to the obtained TEM results, a possible reason lies in the fact that the dispersed nanoparticles within the coating inhibited the grains’ growth.
The Raman spectra that were used as fingerprints for the MAX phases were analyzed, and the results are shown in Figure 1c,d. No distinct characteristics in the range of 100–400 cm−1 corresponding to the 211-MAX phase were observed, which is indicative of the amorphous features of the as-deposited state. In comparison, the annealed counterparts exhibited distinct peaks at ~250 cm−123 modes) and ~350 cm−14 mode), confirming the formation of the 211-MAX phase [26,27]. Concurrently, as the annealing temperature increased, the intensity of the Raman peak initially showed a significant rise. This trend further substantiates that the crystallinity of the (TiVCr)2AlC coating experiences enhancement to a certain extent with the elevation of the annealing temperature. These observations align with the XRD analysis.
The SEM images of the surface- and cross-sectional morphologies of the as-deposited and annealed coatings are shown in Figure 2. The as-deposited amorphous coating (Figure 2a) surface exhibits dispersed particles with varying sizes and irregular shapes. In Figure 2b, the crystal growth of the coating after annealing at 700 °C is evident. The particles became closely arranged, and their shape and size remained relatively unchanged. Following the annealing at 800 °C (Figure 2c), the coating underwent further crystallization and growth. Notably, distinct pit defects emerged locally, and, as the annealing temperature increased (Figure 2d), the number density of the pits within the layer increased significantly. The formation mechanism of these pits is not fully understood; however, it may be related to the increased mass density and hence volume shrinkage caused by the crystallization. Some direct evidence is the decrease in coating thickness with increasing annealing temperature. The cross-sectional morphology of the amorphous coating is depicted in Figure 2e. The coating with a thickness of ~2.8 μm exhibits a highly dense and glassy structure. After annealing at 700 °C (Figure 2f), the coating undergoes crystallization and growth, giving rise to numerous granular crystals. Subsequent to annealing at 800 °C (Figure 2g), the coating further crystallizes and grows, and the granular crystals are more pronounced. Meanwhile, the coating thickness was reduced to ~2.7 μm. Following the annealing at 900 °C (Figure 2h), the pits observed on the surface (Figure 2d) can clearly be found within the upper part of the coating, and the coating thickness was further reduced by 8% to ~2.6 μm.
The cross-sectional morphology of the as-deposited TiVCrAlC coating is illustrated in Figure 3. The coating has a thickness of ~2.8 μm and exhibits a highly dense glassy structure without noticeable features, in agreement with the mentioned SEM studies (Figure 2e). The inset in Figure 3a displays its selective-area electron diffraction (SAED) pattern, which reveals a characteristic diffuse halo that confirms the amorphous nature of the as-deposited coating. In the high-resolution transmission electron microscopy (HRTEM) image (Figure 3b), there are no obvious grains or grain boundaries, only what appear to be faint and very localized lattice fringes. Additionally, Figure 3 illustrates the element distribution of the as-deposited coating on the sapphire substrate. Notably, each element in terms of Al, C, Cr, V, and Ti exhibits a uniform distribution without any localized enrichment.
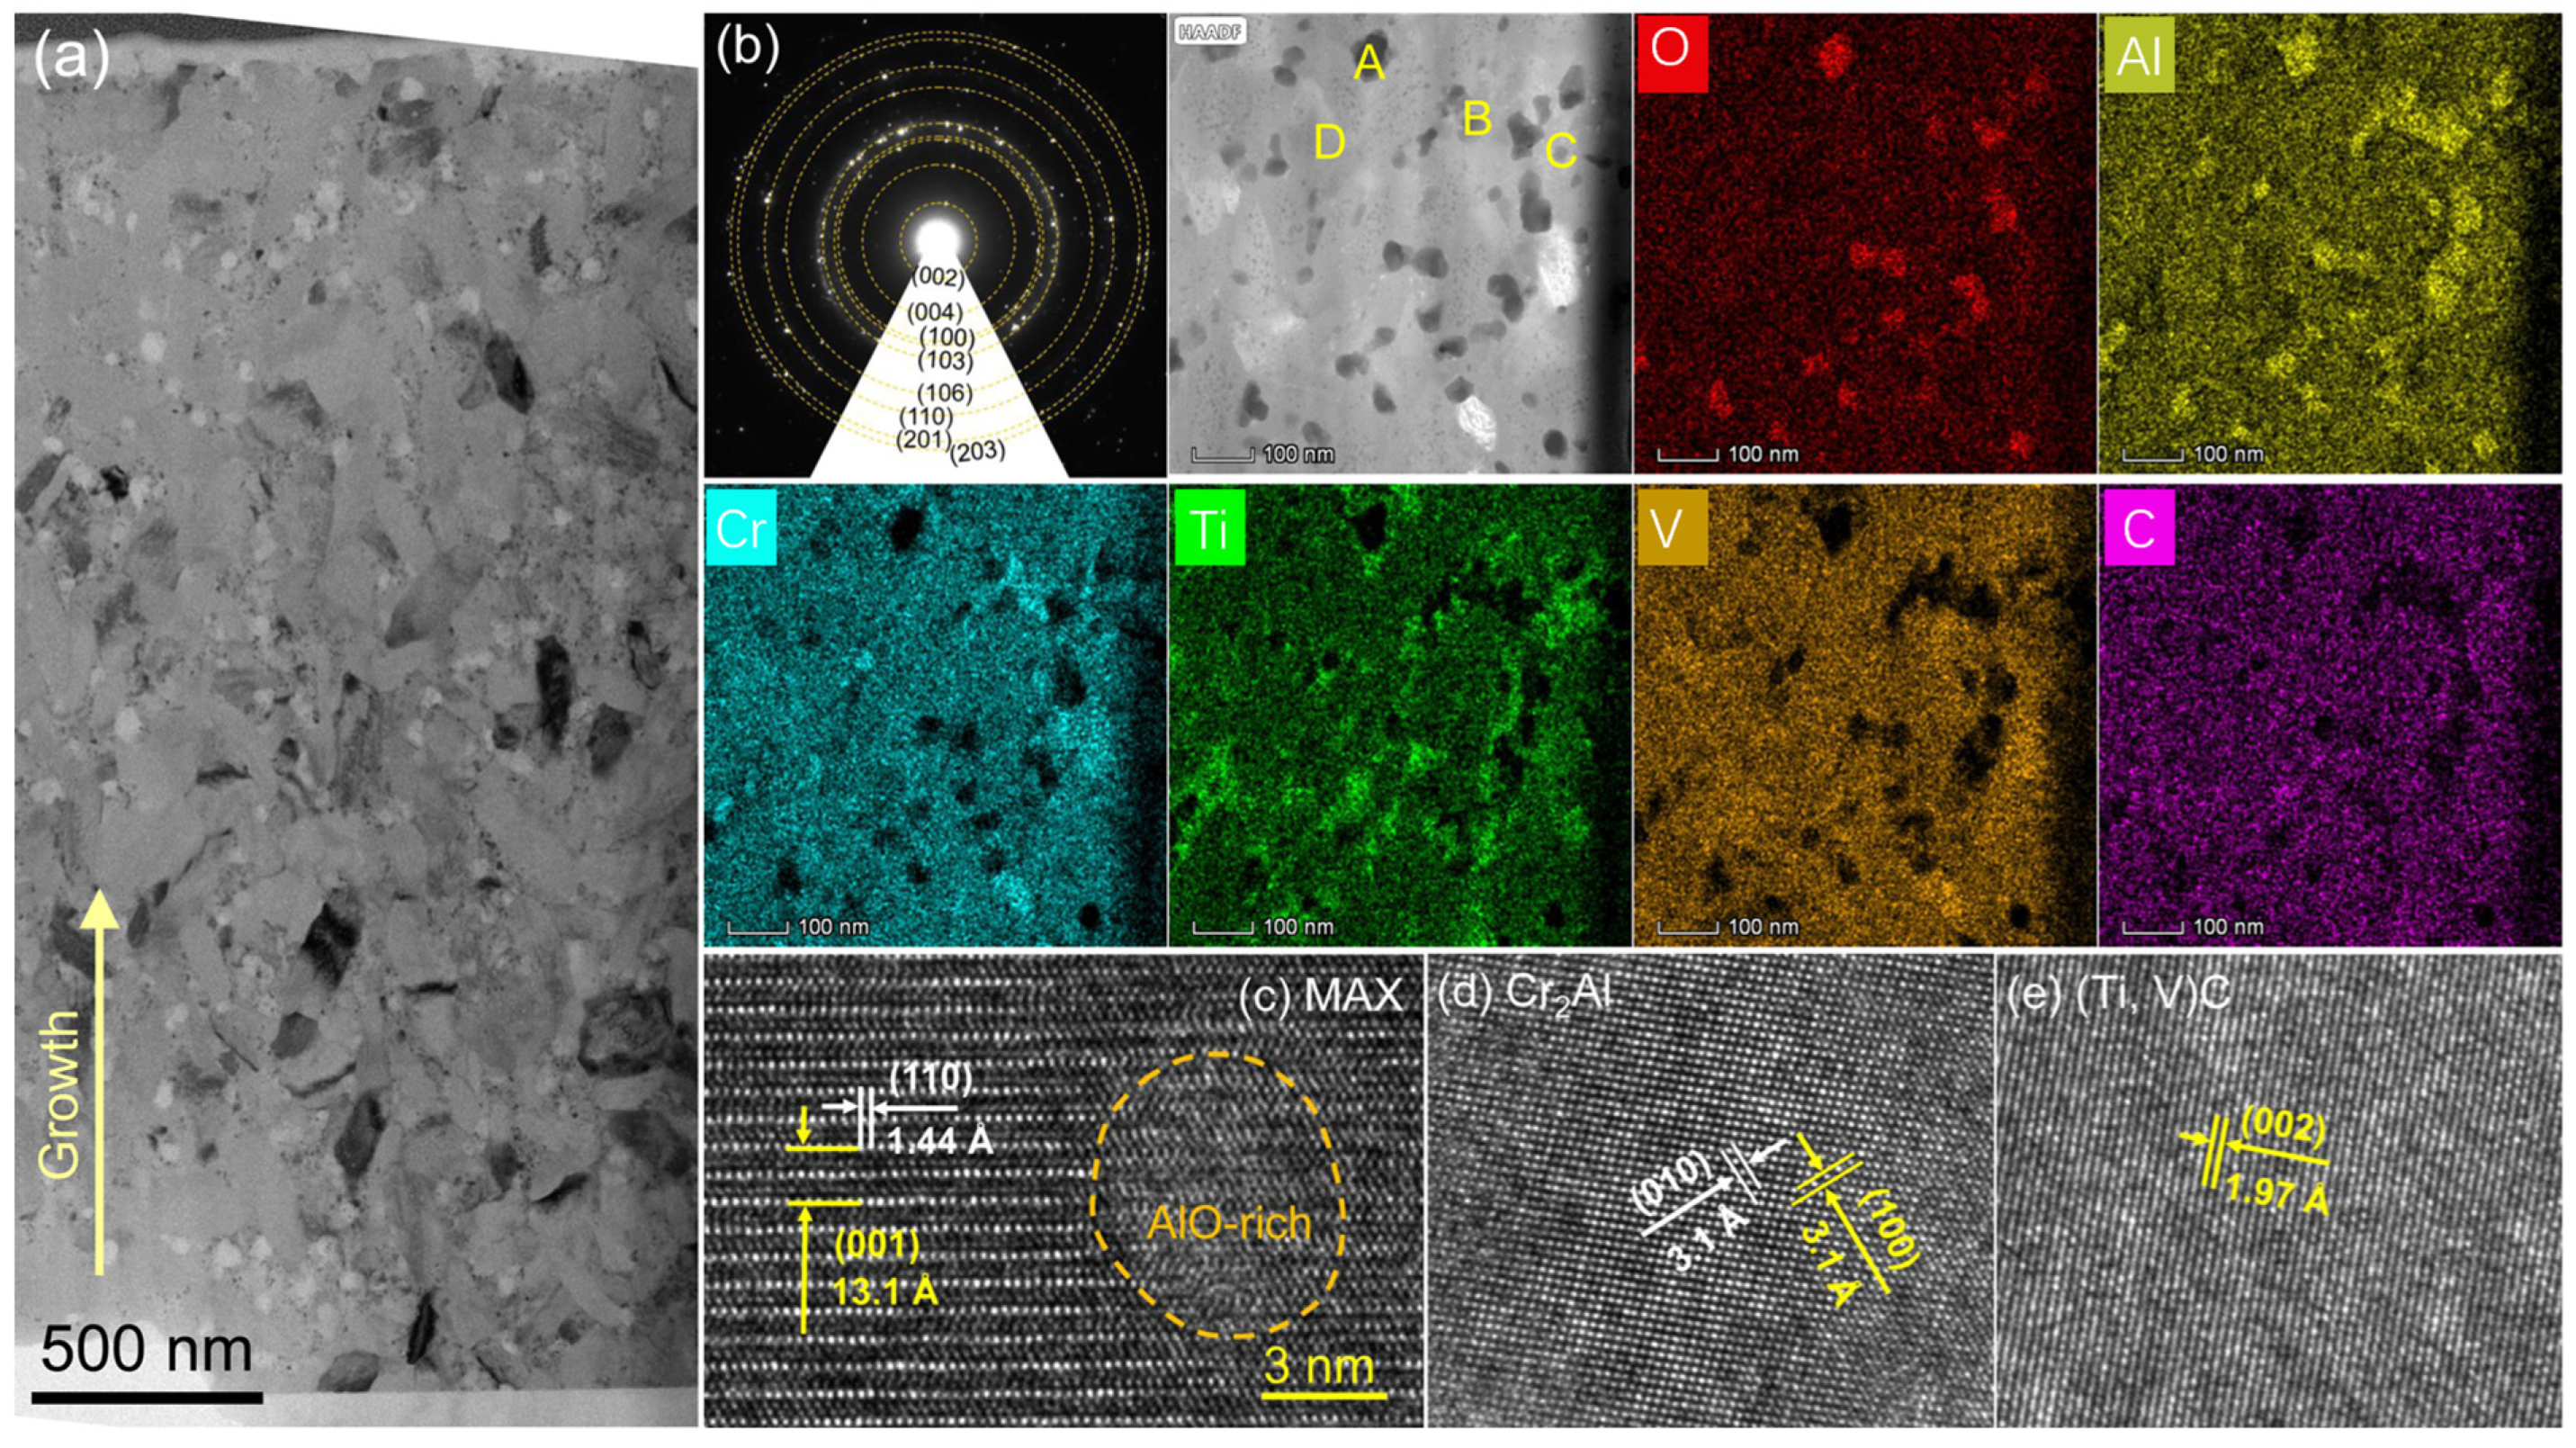
Figure 4 presents the cross-sectional TEM images and EDS surface scanning results of each element of the 700 °C annealed (TiVCr)2Al coating. In the low-magnification micrograph (Figure 4a), distinct bright and dark separated long-strip grains and numerous irregular white spots are prominently visible, indicating that the crystallization of the coating has occurred. The corresponding SAED pattern suggests that the 211-type MAX phase is the predominant phase, with few diffraction spots of other phases appearing. However, the high-angle annular dark field (HAADF) scanning transmission electron microscopy (STEM) image and corresponding EDS mapping results revealed an inhomogeneous element distribution in some areas. Specifically, the contrast in the HAADF image arose from the phase separation of a CrAl-rich phase (point B), a TiVC-rich phase (point C), and several AlOx-rich nanoparticles (point A, 10–40 nm in diameter) randomly segregated at the grain boundaries of the uniform MAX-phase matrix (point D). The compositions of those typical phases were determined by EDS point analysis, and the results are tabulated in Table 1. Their crystal structures were further examined by high-resolution TEM (HRTEM), as presented in Figure 4c–e. Through combining the composition and the HRTEM image, they can be assigned to the hexagonal MAX phase (P63/mmc space group), tetragonal Cr2Al phase (P4/mmm space group), and cubic (Ti, V)C phase (Fm-3m space group), respectively, and the AlOx-rich particles have poor crystallinity. Despite the presence of these precipitated phases identified in the HRTEM, they were not detected in the XRD (Figure 1) and SAED patterns (Figure 4b), indicating that the amount of these precipitated phases is exiguous.

3.2. Mechanical Properties

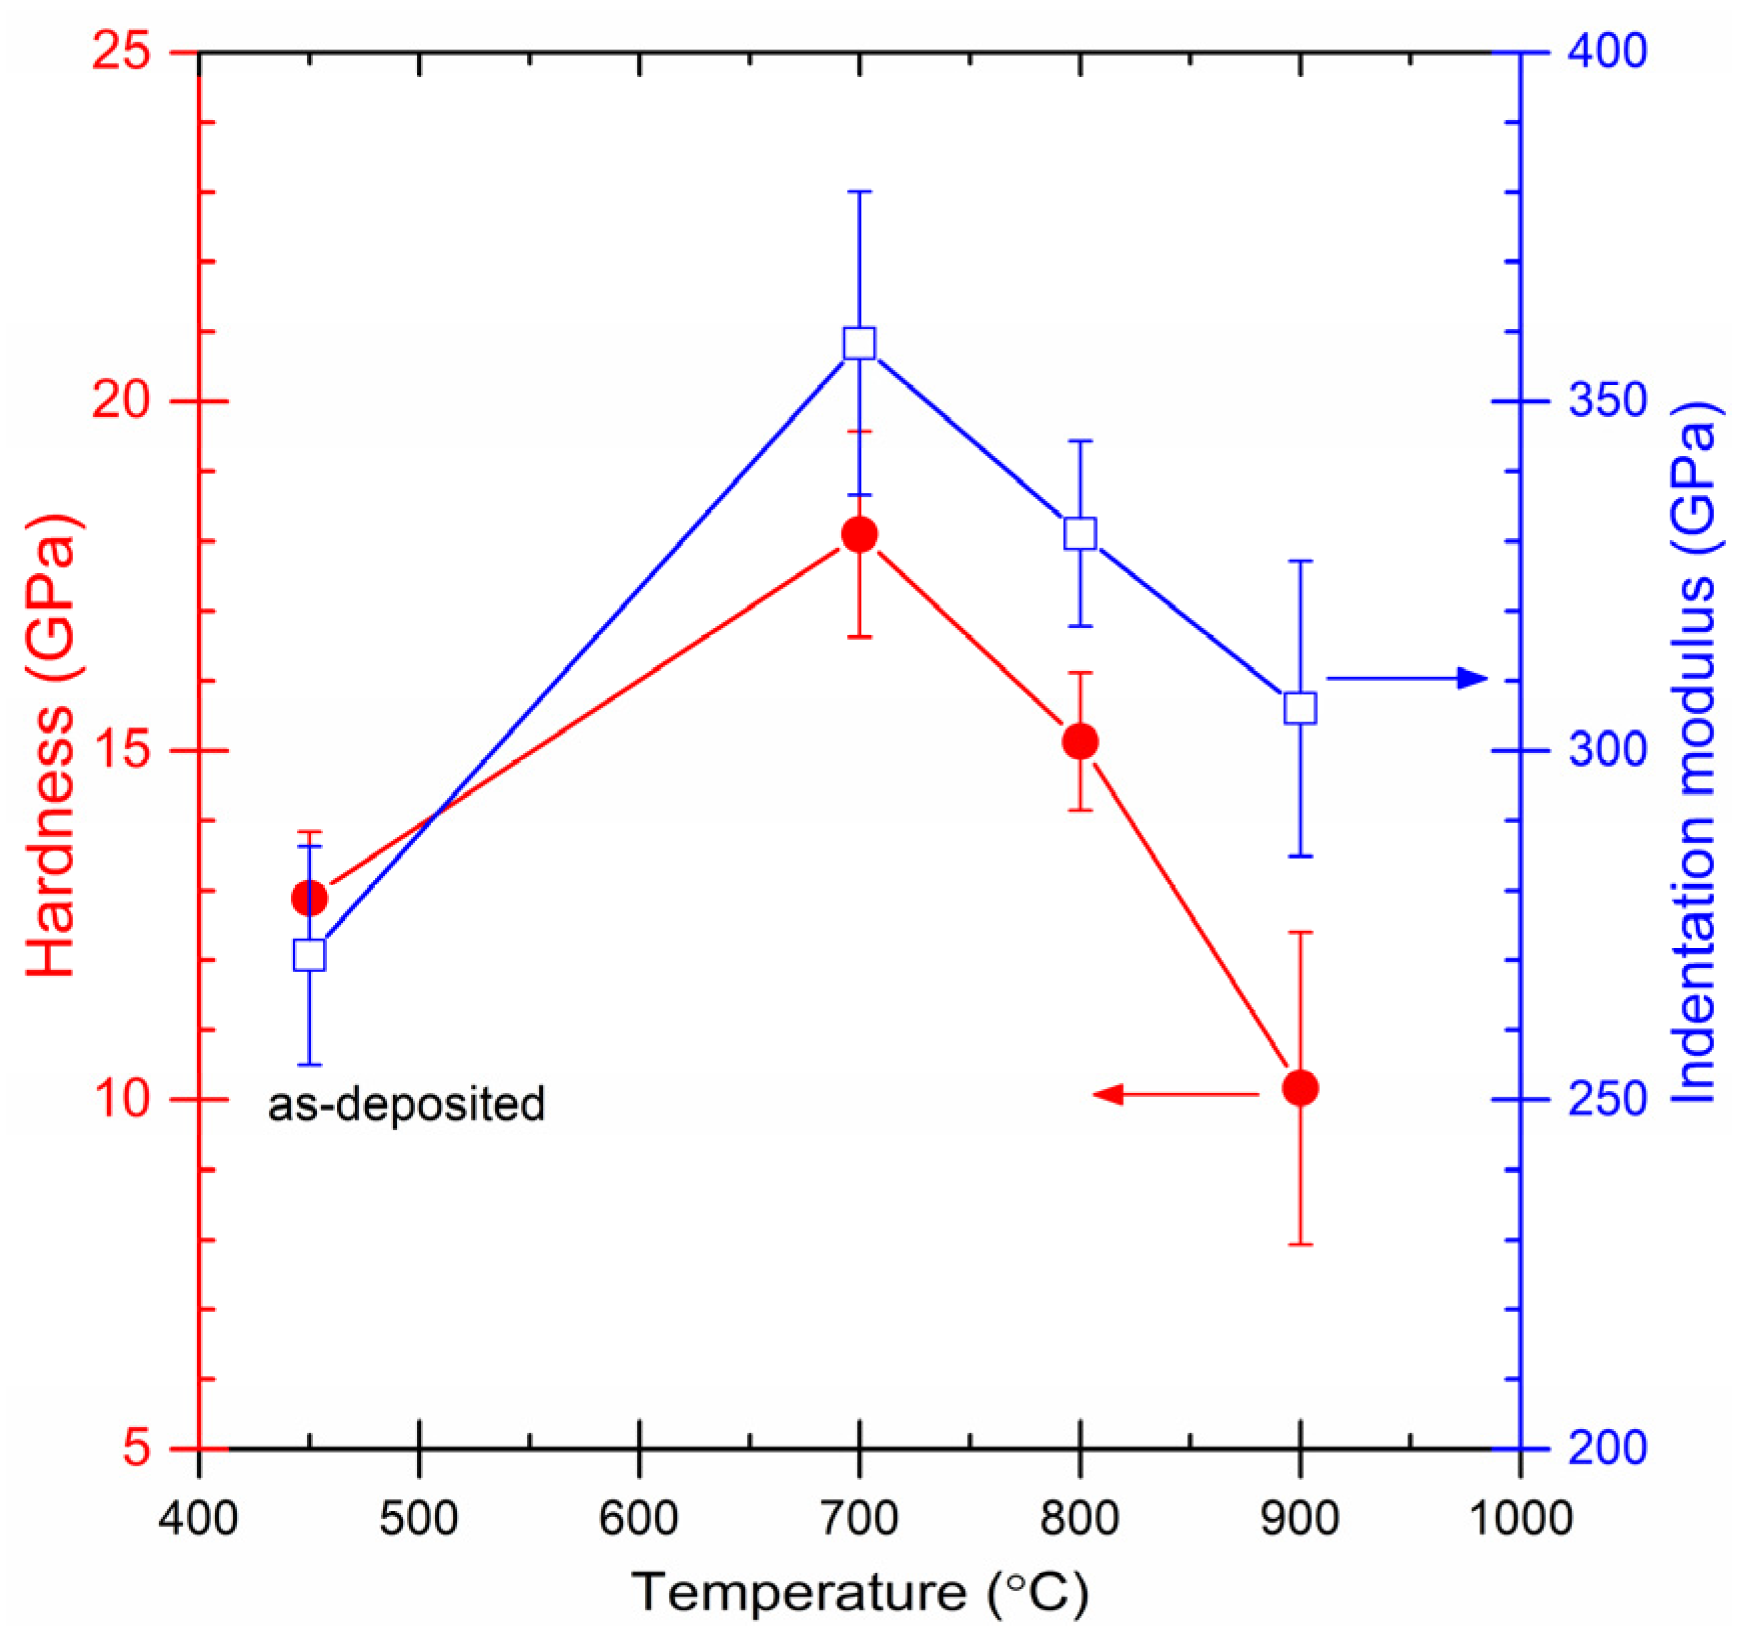
The hardness of the as-prepared and annealed (TiVCr)2AlC coatings at different temperatures is illustrated in Figure 5. The as-prepared amorphous coating exhibits a hardness of approximately 13 GPa. The annealed coating demonstrates significantly improved hardness compared to the as-prepared coating. The highest hardness value reaching ~18 GPa was achieved after annealing at 700 °C. However, when the annealing temperature reached 800 °C, holes appeared inside the coating, leading to the integrity structure being destroyed; hence, the hardness of the coating was reduced. Therefore, with increasing annealing temperature, the hardness gradually decreases, measuring ~15 GPa at 800 °C and ~10 GPa at 900 °C. The indentation modulus shows the same trend as the hardness; i.e., it first increased from ~270 GPa to the highest ~360 GPa for the 700 °C annealed sample and then decreased gradually to ~305 GPa.
For the Ti2AlC coatings, a similar trend regarding the hardness was reported in the samples prepared via the same process, i.e., deposition at low temperatures and then high-temperature annealing. Tang et al. [28] found that, as the annealing temperature increased, the hardness increased from 7.6 GPa to the highest value of 17.7 GPa in the 800 °C annealed sample and then slightly decreased to ~13 GPa upon the annealing temperature reaching 900 °C. However, the modulus values continuously increased in the whole annealing temperature range, reaching 270 GPa at 900 °C. Li et al. [29] reported hardness and modulus values of 14.3 GPa and 231 GPa, respectively, for the film annealed at 600 °C. For Cr2AlC, Liu et al. [30] obtained the highest hardness value of ~19 GPa for the coatings annealed at 750 °C. However, the value was ~13 GPa for the films directly grown at a 650 °C substrate temperature. As for V2AlC, we obtained a hardness of 20 GPa and an indentation modulus of 362 GPa in our preliminary studies [31]. Therefore, taking into account the hardness values of these unitary MAX-phase materials mentioned above, the hardness in the medium-entropy MAX phase (TiVCr)2AlC is reasonable and comparable to them. Furthermore, compared to the medium-entropy (TiVNb)2AlC MAX-phase material, the (TiVCr)2AlC coatings exhibit superior mechanical properties [32].

3.3. Oxidation Behaviors

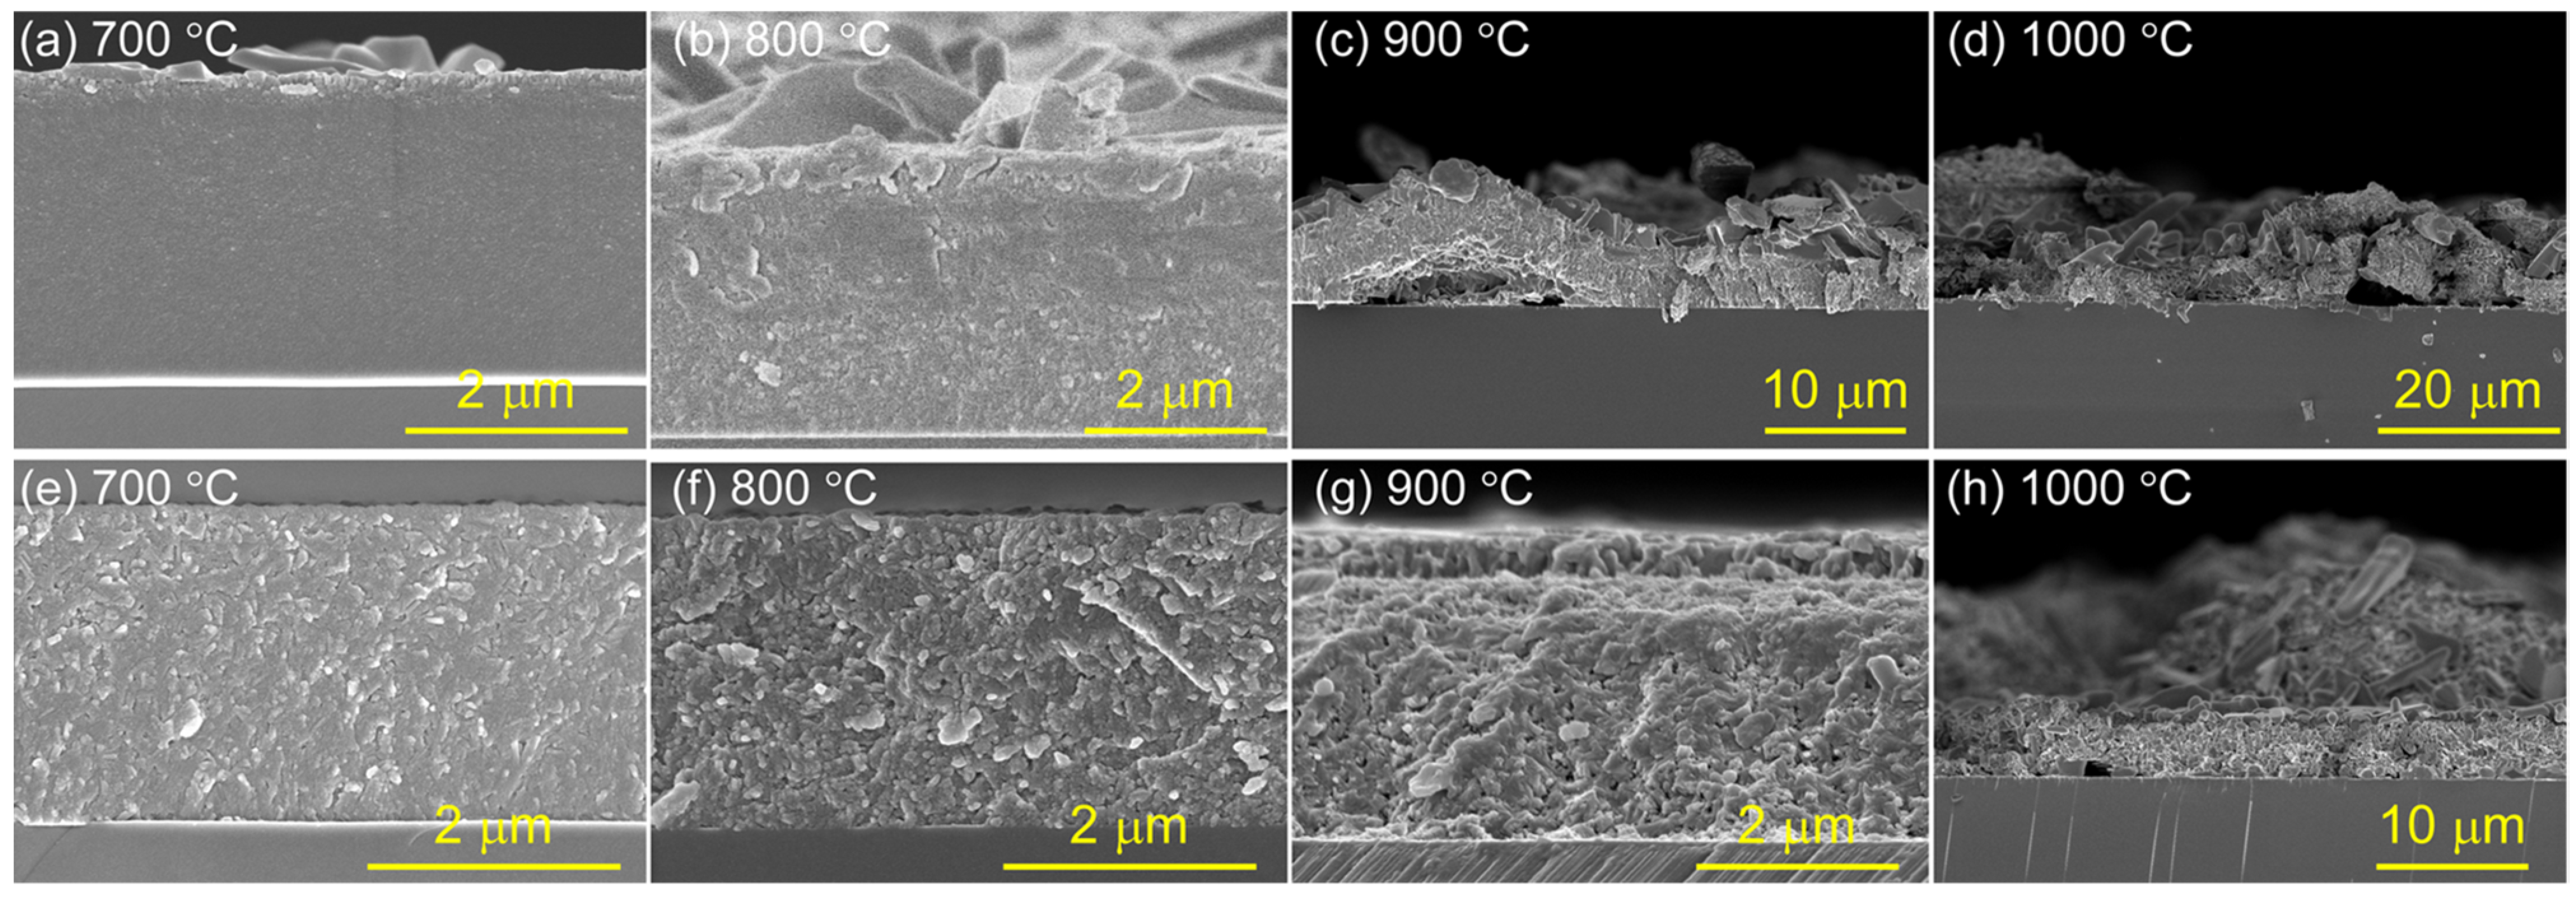
The as-deposited amorphous TiVCrAlC coating and 700 °C annealed (TiVCr)2AlC coating were oxidized in the temperature range of 700–1000 °C. These two types of coatings exhibit distinct behaviors against air oxidation in terms of the onset temperature of oxidation and the oxidation products. In the 700 °C air, the amorphous coating’s surface (Figure 6a) exhibited slight oxidation, whereas the crystalline coating (Figure 6e) remained structurally intact without visible oxidation. After the 800 °C oxidation, the amorphous coating’s surface (Figure 6b) showed gradual roughening by the oxides with dimensions of several micrometers, suggesting the initiation of severe oxidation. In contrast, the structure of the crystalline coating (Figure 6f) remained intact without any signs of oxidation. Upon the oxidation at 900 °C, the amorphous coating (Figure 6c) underwent breakaway oxidation, resulting in extensive damage and spallation over a large area. Conversely, the crystalline coating (Figure 6g) exhibited gradual oxidation at 900 °C, with a continuous oxide scale on its surface. After the 1000 °C oxidation, both coating types underwent complete oxidation.
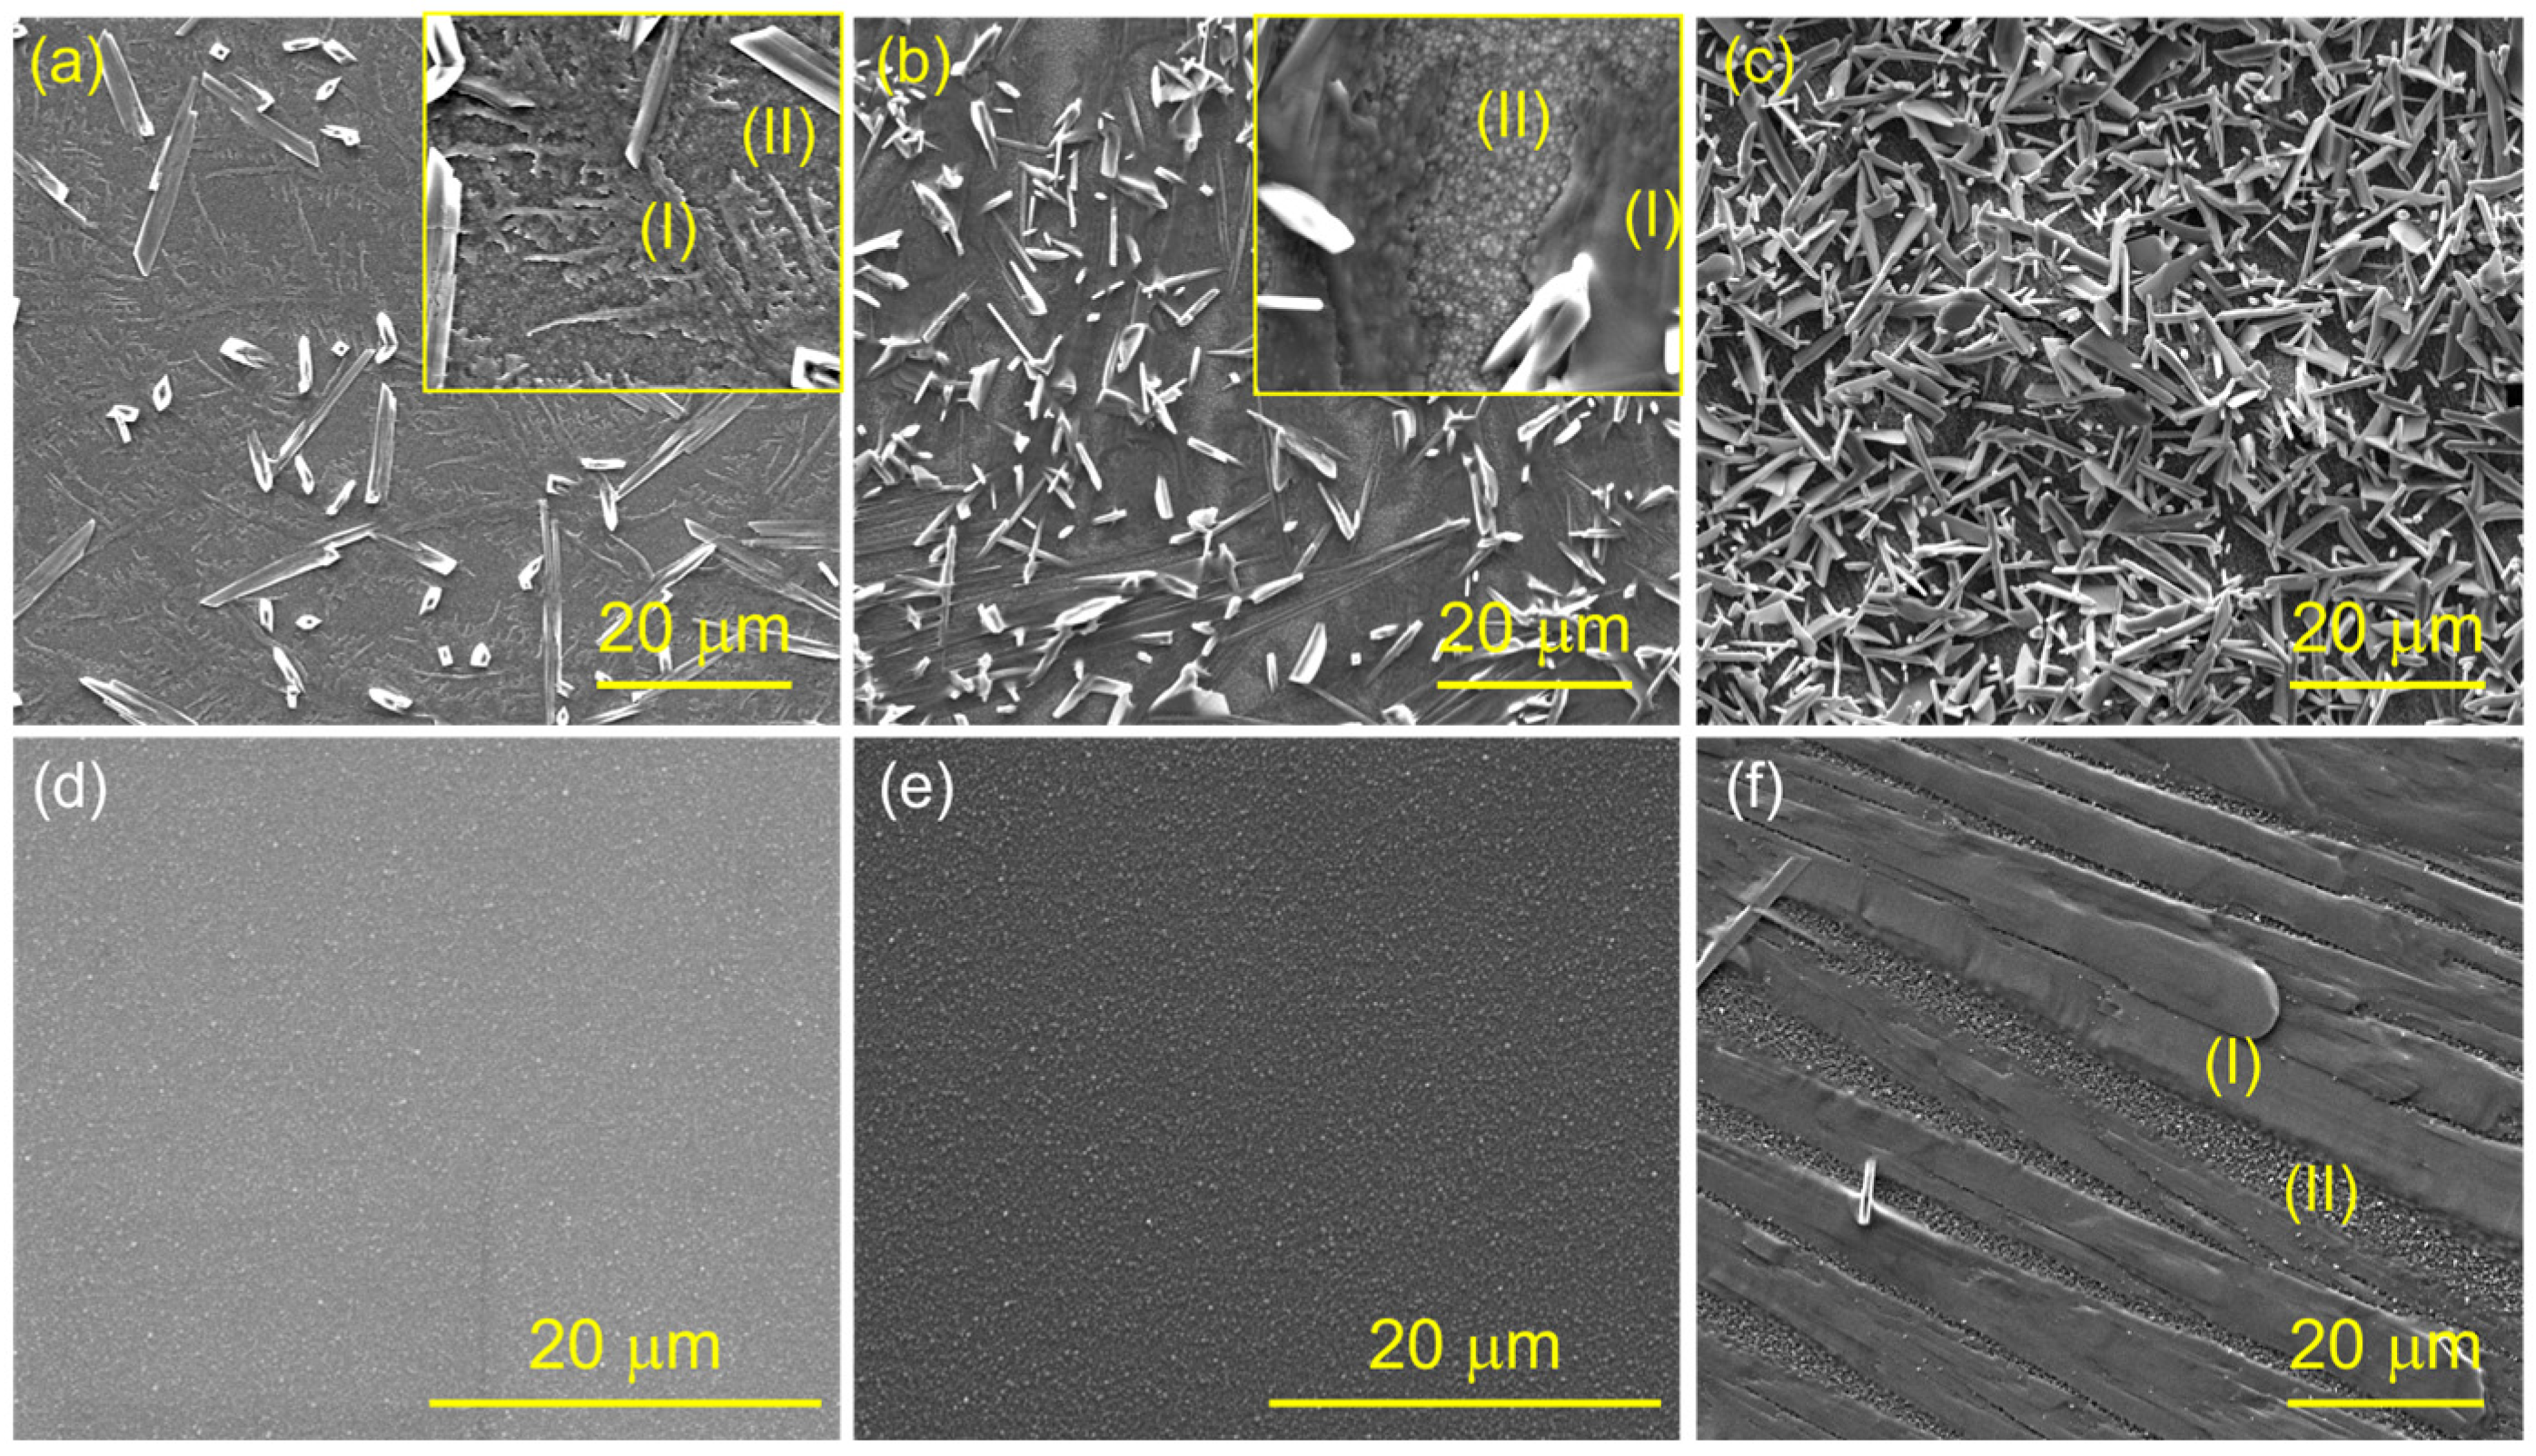
The differences in oxidation resistance between these two coatings were further examined by planar SEM micrographs. After the 700 °C oxidation, amounts of rod-like and dendritic fine-grained products formed on the surface of the amorphous TiVCrAlC coating (Figure 7a). In contrast, there was a highly dense structure on the surface of the (TiVCr)2AlC coating (Figure 7d), and no discontinuous oxides could be identified. After the 800 °C oxidation, the amorphous coating’s surface (Figure 7b) experienced further oxidation, with an increased presence of rod-like crystals. Additionally, two types of oxides with distinct morphologies, which are strip (type I) and granular (type II), emerged on the surface. The surface of the MAX-phase coating (Figure 7d) still exhibited a dense and smooth morphology without the oxidation products of the two shapes mentioned above. As for the 900 °C oxidation, the amorphous coating (Figure 7c) underwent severe oxidation, producing numerous rod-like crystals on its surface, while the MAX-phase coating (Figure 7f) exhibited abundant lath-like textures (I) and fine-grained particles (II). These observations in the cross-sectional and planar SEM micrographs indicate that the MAX-phase coating exhibits a higher onset oxidation temperature and a different oxidation product compared to its amorphous counterpart.
Thus, the phase composition of the oxidation products was characterized by Raman spectra and XRD. Figure 8a displays the Raman results of the amorphous coating oxidized at different temperatures. It should be noted that we can only obtain the structural information at the most superficial tens of nanometers level of thickness from Raman spectra. Recalling the surface morphology (Figure 7), those two shapes of oxides upon oxidation at 700–900 °C have different phases. Specifically, the rod-like and dendritic grains (type I) can be identified as V2O5 [33,34], whereas the uniform fine-grained particles (type II) cannot be characterized as being in any phase, such as Cr2O3 or TiO2, via the Raman method. At 1000 °C, the V2O5 phase disappeared, and no visible Raman peaks could be characterized. Figure 8b presents the Raman test results of the 700 °C annealed MAX-phase coating. After oxidation at 700 °C and 800 °C, only the characteristics corresponding to the 211-MAX phase were observed without the features of the other oxides, such as V2O5, Cr2O3, and TiO2. This observation is consistent with the intact structure in the SEM observations. Upon reaching ≥900 °C, the coating surface was gradually oxidized, resulting in the formation of lath-like V2O5 grains.
The XRD patterns of the amorphous coating after high-temperature oxidation are illustrated in Figure 8c. The oxidation at 700 °C resulted in the presence of the phase composition of V2O5 and TiO2, and no diffraction peaks arising from the MAX phase can be identified, which may be due to the short oxidation time of 15 min. After the 800 °C oxidation, abundant MAX phases formed, accompanied by the appearance of TiO2, Cr2O3, and V2O5 oxides. As the oxidation temperature increased to ≥900 °C, the diffraction peaks from the MAX phase diminished, and all the peaks can be ascribed to the oxides of TiO2, Cr2O3, and V2O5. These results align with the SEM observations. Figure 8d depicts the XRD patterns of the (TiVCr)2AlC coating following the high-temperature oxidation. At 700 °C and 800 °C, all the diffraction peaks come from the MAX phase, and almost no peaks from the oxides are detectable. This finding is consistent with the SEM and Raman results. The oxidation at 900 °C produced two types of oxidation products, i.e., V2O5 and TiO2, and the diffraction peaks arising from the MAX phase remained, indicating the presence of the MAX-phase coating. After the 1000 °C oxidation, all the peaks were ascribed to the oxides of TiO2, Cr2O3, and V2O5, suggesting the complete oxidation of the (TiVCr)2AlC coating.
To obtain further insight into the oxidation processes, TEM studies of the amorphous and crystalline coatings were performed. Figure 9 displays the cross-sectional bright-field (BF) image and the EDS mapping of the corresponding elements of the amorphous TiVCrAlC coating after 15 min of oxidation at 700 °C. Clearly, the original monolithic coating evolved into three distinct yet adherent layers, including (A) an outermost rough oxide scale (~500 nm) and (C) a residual amorphous coating separated by (B) a dense and uniform amorphous oxide scale. All these layers are without large structural defects such as voids, cracks, and wrinkles. These features agree well with the observations in the planar SEM images (Figure 7). The EDS profiles and point analysis (Table 2) provide the chemical compositions of each layer. The outermost scale is Ti/V/O-rich with few other elements, which is consistent with the Raman and XRD results that they are V2O5 and TiO2. Beneath this scale, one amorphous Al/V/Cr/O-rich layer was found, which cannot be identified by either the Raman or XRD methods. The oxygen content drops dramatically to ~9 at.% within the residual coating, suggesting an inhibition of the two scales against the inward diffusion of oxygen to attack the coating. The remaining coating maintains an amorphous structure, as also illustrated by the XRD pattern (Figure 8c).
In contrast, the crystalline (TiVCr)2AlC coating exhibits completely different oxidation behavior. Figure 10 depicts the BF-TEM image and corresponding EDS mapping results of each element for the crystalline coating oxidation at 700 °C for 15 min. By comparing the BF images of the oxidized and annealed (shown in Figure 4a) samples, we can see that no significant changes in the morphology of the coating were detected, which is manifested in distinct grains with MAX-phase characteristics. Combining the low oxygen content within the coating as tabulated in Table 3, this finding suggests that the MAX-phase coating was more oxidation-resistant. The analysis of the EDS mapping results at low magnification confirmed the uniform distribution of the elements within the coating without evidence of enrichment. However, the distribution of oxygen indicates a very thin layer of continuous oxides at the very surface of the coating. The EDS profiles and point analysis (Table 3) provide the chemical compositions of this Al/O-rich layer. High-resolution TEM (HRTEM) images (Figure 10b) show that this scale has a very small grain size (<10 nm) and a thickness of only 30–50 nm. Therefore, the better oxidation resistance of the MAX-phase coating can be attributed to the prevention of oxygen diffusion inwards by this Al/O-rich layer.
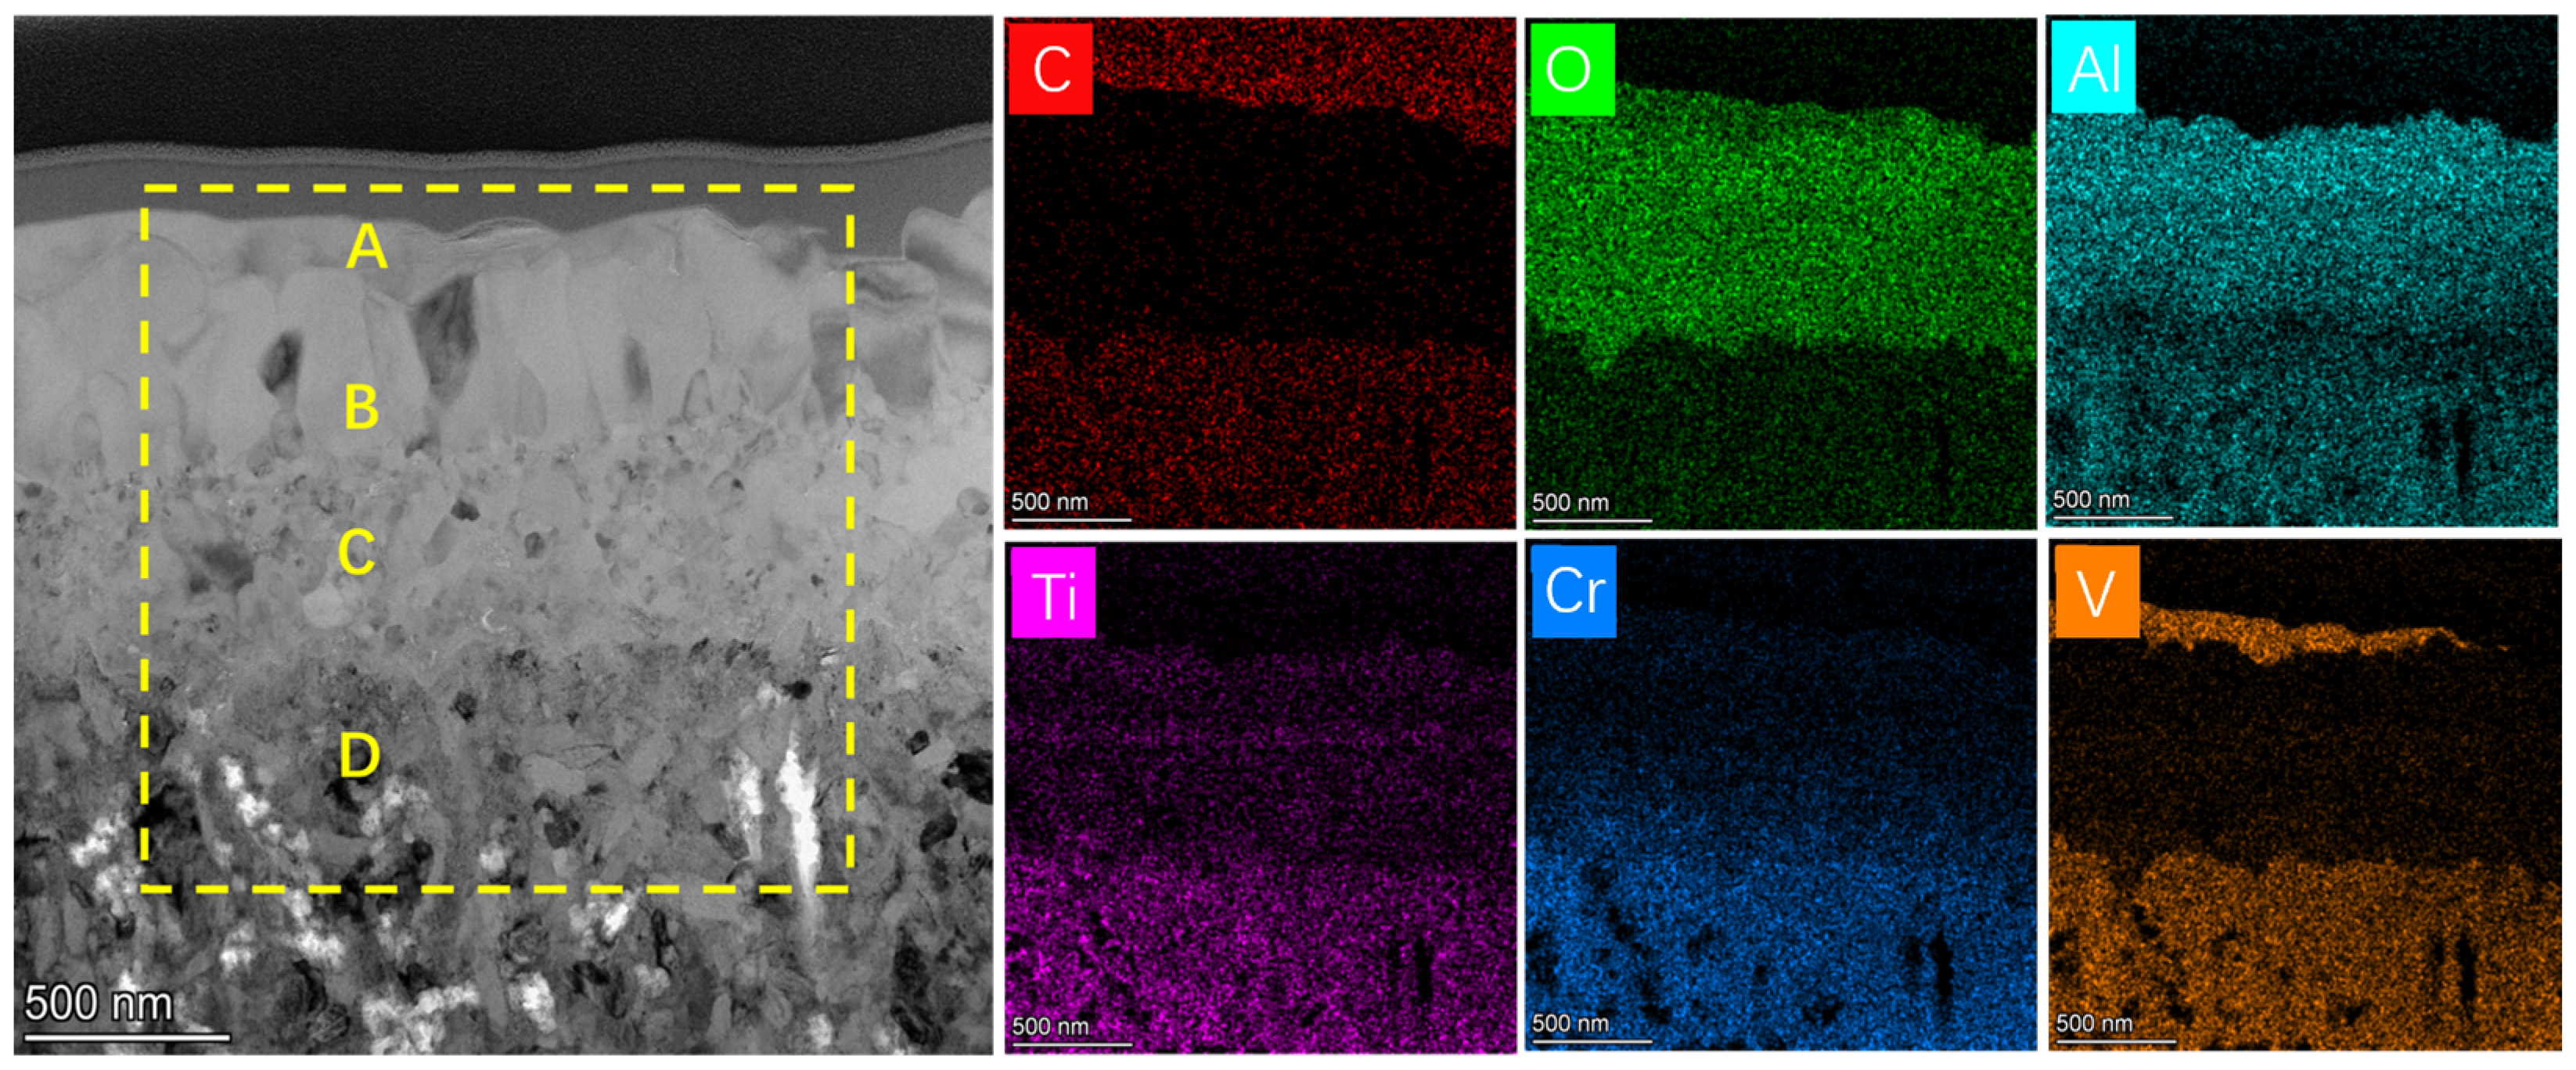
Furthermore, we performed TEM studies on the crystalline (TiVCr)2AlC coatings oxidized at a higher temperature of 900 °C for 15 min. Figure 11 presents the bright-field transmission electron microscopy (BF-TEM) image and corresponding EDS mapping results. Notably, the original coating exhibited a discernible stratification, as evidenced by the distinct layers. By cross-referencing the elemental composition detailed in Table 4, the coating can be categorized into the V/O-rich oxide layer (labeled as A), Al/O-rich oxide layer (labeled as B), Al/Cr/O-rich oxide layer (labeled as C), and the original MAX-phase layer (labeled as D). The variation in the elemental compositions with thickness indicates that the oxidation of the MAX coating occurred and multiple oxides were produced, which is consistent with the observations in Figure 7g. Evident in the EDS mapping diagram is the enrichment of the V element within the A layer and the extensive diffusion of the Al element across the B and C layers. Compared to the oxidation observed at 700 °C, the oxidation at 900 °C results in widespread oxidation across the crystalline coating, exhibiting non-uniform oxidation behavior. The analysis of the test results depicted in Figure 11 confirms the presence of oxidation products, including V2O5, Al2O3, and Cr2O3.
Similar differences in oxidation behavior for the MAX phase with the same chemical compositions but different phase compositions have also been reported for Ti2AlC [35] and Cr2AlC coatings [36], with the differences occurring mainly in the early stages of oxidation. Both of these studies, including ours here, found that mixed oxides such as TiO2-Al2O3, Cr2O3-Al2O3, or V2O5-TiO2-Cr2O3 (high oxygen permeability) were formed on the surface of the amorphous coating, whereas only a dense and continuous Al2O3 scale (low oxygen permeability) was produced on the surface of the crystallized MAX-phase coating. Regarding the mechanism of the discrepancy, Fu et al. [35] studied the dissimilar thermodynamic activity values regarding Al in the amorphous coatings and crystalline MAX-phase films. For the phases of the M2AlC composition, the crystal structure consists of M octahedral sheets with C atoms filling the octahedral sites; these sheets are bound by planar close-packed Al atomic interlayers [32]. In other words, the metallic M-Al bonds are weaker than the covalent M-C bonds, implying that Al diffuses outward from the crystal structure more easily than M atoms. For amorphous M-Al-C coatings, Al and M atoms probably have similar mobility and thus migrated simultaneously to the surface of the coatings to form a mixed oxide layer. In addition, there are a large number of grain boundaries in the crystalline MAX coatings, and these grain boundaries also act as fast channels for the outward diffusion of Al atoms, facilitating the formation of the alumina layer [37].

4. Conclusions

We prepared medium-entropy-alloy TiVCrAlC coatings via the magnetron co-sputter method, and these coatings were further vacuum-annealed. The microstructure and mechanical properties of the coatings were investigated in detail, and their high-temperature oxidation resistance was evaluated. In summary, the following conclusions can be drawn:
  • The M-site medium-entropy (TiVCr)2AlC MAX-phase can be achieved through vacuum annealing the amorphous counterpart at 700 °C, and the crystallinity increased with the temperature. However, higher temperatures of ≥800 °C led to pits emerging on the coating surface.
  • After 700 °C annealing, the crystalline (TiVCr)2AlC medium-entropy-alloy MAX-phase coating exhibited its maximum hardness, reaching 18 GPa, significantly higher than that of the as-deposited coating.
  • Compared to the as-prepared amorphous TiVCrAlC coating, the high-temperature oxidation resistance of the MAX coating was significantly improved; mixed oxides formed on the amorphous sample, while only a dense continuous AlOx-rich oxide formed on the MAX coating. This characteristic ensures that the crystalline (TiVCr)2AlC coating is expected to play a role in practical applications such as aerospace and nuclear power generation.

Author Contributions

Investigation, Resources, Writing—Original draft preparation, Y.Z. (Yufeng Zhu); Resources, Y.Z. (Yueqing Zhen); Supervision, Q.H. and F.M.; Investigation, K.C.; Data curation, Q.H.; Investigation, Resources, Supervision, writing—review and editing, F.M. All authors have read and agreed to the published version of the manuscript.

Funding

This research is supported by National Natural Science Foundation of China (No. U23A2093 and 12375279) and Ten-Thousand Talents Plan of Zhejiang Province (No. 2022R51007).

Institutional Review Board Statement

Not applicable.

Informed Consent Statement

Not applicable.

Data Availability Statement

Data is contained within the article.

Conflicts of Interest

The authors declare no conflicts of interest.

References

  1. Li, Y.; Meng, F.; Ge, F.; Huang, F. Improved oxidation resistance through an in-situ formed diffusion barrier: Oxidation behavior of amorphous multi-component FeCrAlMoSiY-coated Zr in high-temperature steam. Corros. Sci. 2021, 189, 109566. [Google Scholar] [CrossRef]
  2. Du, Q.; Wei, D.; Wang, Y.; Li, B.; Zhou, Y. Microstructure and surface performance of hydroxyapatite-modified multilayer amorphous coating on Ti-rich TiNbZrSn medium entropy alloy: A comparative study. Surf. Interfaces 2023, 41, 103288. [Google Scholar] [CrossRef]
  3. Wang, T.; Zhang, J.; Zhang, Y.; Chen, S.; Luo, Z.; Wu, J.; Zhu, L.; Lei, J. Improving wear and corrosion resistance of LDEDed CrFeNi MEA through addition of B and Si. J. Alloys Compd. 2023, 968, 172223. [Google Scholar] [CrossRef]
  4. Yuan, S.; Wu, S.; Chen, T.; Fu, Q.; Wei, R.; Chen, C.; Wang, T.; Cai, Y.; Li, F. Microstructure and corrosion behavior of Co-free FeCrNiSi0.4 medium entropy alloy coating fabricated by laser cladding. Intermetallics 2023, 162, 108024. [Google Scholar] [CrossRef]
  5. Ma, L.; Zhao, D.; Wang, Y.; Wang, K.; Huang, J.; Jin, X.; Kong, D.; Wang, M.; Yamaguchi, T.; Wang, H. Optimized wear behaviors and related wear mechanisms of medium entropy alloy-based composite coatings. J. Mater. Res. Technol. 2024, 29, 12–27. [Google Scholar] [CrossRef]
  6. Meng, A.; Liang, F.; Mao, Q.; Fan, Y.; Lin, Y.; Chen, X.; Zhao, Y. Tribo-induced microstructural changes and associated wear mechanisms of CoFeNi2 medium entropy alloy at elevated temperatures. Tribol. Int. 2023, 189, 108892. [Google Scholar] [CrossRef]
  7. Yu, Y.; Li, Y.; Tan, N.; Mou, H.; Tong, Y.; Xing, Z.; Cai, Z.; Wang, H. Influence of cBN on the microstructure and tribology properties of (CoCrNi)94Al3Ti3 medium-entropy alloy coating prepared by high-speed laser cladding: The evolution and strengthening mechanism of cBN. Ceram. Int. 2024, 50, 22041–22049. [Google Scholar] [CrossRef]
  8. Hu, Q.; Wang, X.; Miao, J.; Fu, F.; Shen, X. Friction and Wear Performance of CoCrFeMnNiW Medium-Entropy Alloy Coatings by Plasma-Arc Surfacing Welding on Q235 Steel. Coatings 2021, 11, 715. [Google Scholar] [CrossRef]
  9. Zhang, H.; Chen, K.; Wang, Z.; Zhou, H.; Shi, C.; Qin, S.; Liu, J.; Lv, T.; Xu, J. Thermal Deformation Behavior and Processing Map of a Novel CrFeNiSi0.15 Medium Entropy Alloy. Acta Metall. Sin. (Engl. Lett.) 2023, 36, 1870–1882. [Google Scholar] [CrossRef]
  10. Agustianingrum, M.P.; Lee, U.; Park, N. High-temperature oxidation behaviour of CoCrNi medium-entropy alloy. Corros. Sci. 2020, 173, 108755. [Google Scholar] [CrossRef]
  11. Kai, W.; Jiang, Z.Y.; Chen, G.T.; Lee, I.H.; Lin, H.J.; Hsieh, H.H.; Lin, W.T.; Kai, J.J. High-temperature air-oxidation of NiCoCrAlx medium-entropy alloys. Corros. Sci. 2021, 192, 109858. [Google Scholar] [CrossRef]
  12. Lin, S.; Lai, W.; Vogel, F.; Tong, X.; You, D.; Li, W.; Wang, X. Mechanical and corrosion properties of biomedical (TiZr)90-xNbxTa5Mo5 medium entropy alloys. Int. J. Refract. Met. Hard Mater. 2023, 116, 106361. [Google Scholar] [CrossRef]
  13. Azina, C.; Poll, M.; Holzapfel, D.M.; Tailleur, E.; Zuber, A.; Dubois, S.; Eklund, P.; Gonzalez-Julian, J. Microstructural and compositional design of Cr2AlC MAX phases and their impact on oxidation resistance. J. Eur. Ceram. Soc. 2024, 44, 4895–4904. [Google Scholar] [CrossRef]
  14. Dahlqvist, M.; Barsoum, M.W.; Rosen, J. MAX phases–Past, present, and future. Mater. Today 2024, 72, 1–24. [Google Scholar] [CrossRef]
  15. Huang, Q.; Wang, C.; Zhao, S.; Han, M.; Sun, Z.; Zhang, P.; Huang, Z.; Zhang, Y.; Wang, J.; Sun, Z.; et al. Progress in Structural Tailoring and Properties of Ternary Layered Ceramics. J. Inorg. Mater. 2023, 38, 845–884. [Google Scholar] [CrossRef]
  16. Berger, O.; Boucher, R.; Ruhnow, M. Part I. Mechanism of oxidation of Cr2AlC films in temperature range 700–1200 °C. Surf. Eng. 2015, 31, 373–385. [Google Scholar] [CrossRef]
  17. Zhang, W.; Li, S.; Zhang, X.; Chen, X. Research and Development on Cold-Sprayed MAX Phase Coatings. Coatings 2023, 13, 869. [Google Scholar] [CrossRef]
  18. Azina, C.; Mráz, S.; Greczynski, G.; Hans, M.; Primetzhofer, D.; Schneider, J.M.; Eklund, P. Oxidation behaviour of V2AlC MAX phase coatings. J. Eur. Ceram. Soc. 2020, 40, 4436–4444. [Google Scholar] [CrossRef]
  19. Wang, Q.; Garkas, W.; Renteria, A.F.; Leyens, C.; Sun, C.; Kim, K. Oxidation behaviour of a Ti2AlN MAX-phase coating. IOP Conf. Ser. Mater. Sci. Eng. 2011, 18, 082025. [Google Scholar] [CrossRef]
  20. Zhang, Y.; Zhang, A.; Li, Z.; Wang, Z.; Ke, P.; Wang, A. Electrochemical Corrosion Inhibition of Cr2AlC MAX Phase Coatings via Mo Solid Solution: Comprehensive Experimental and Simulation Study. J. Phys. Chem. C 2024, 128, 3916–3923. [Google Scholar] [CrossRef]
  21. Wang, Z.; Wang, C.; Zhang, Y.; Wang, A.; Ke, P. M-site solid solution of vanadium enables the promising mechanical and high-temperature tribological properties of Cr2AlC coating. Mater. Des. 2022, 222, 111060. [Google Scholar] [CrossRef]
  22. Huang, F.; Ge, F.; Zhu, P.; Wang, H.; Meng, F.; Li, S. Superhard V-Si-N coatings (>50 GPa) with the cell-like nanostructure prepared by magnetron sputtering. Surf. Coat. Technol. 2013, 232, 600–605. [Google Scholar] [CrossRef]
  23. Meng, F.; Wang, B.; Ge, F.; Huang, F. Microstructure and mechanical properties of Ni-alloyed SiC coatings. Surf. Coat. Technol. 2012, 213, 77–83. [Google Scholar] [CrossRef]
  24. Tang, C.; Steinbrück, M.; Klimenkov, M.; Jäntsch, U.; Seifert, H.J.; Ulrich, S.; Stüber, M. Textured growth of polycrystalline MAX phase carbide coatings via thermal annealing of M/C/Al multilayers. J. Vac. Sci. Technol. A 2020, 38, 013401. [Google Scholar] [CrossRef]
  25. Walter, C.; Sigumonrong, D.P.; El-Raghy, T.; Schneider, J.M. Towards large area deposition of Cr2AlC on steel. Thin Solid Film. 2006, 515, 389–393. [Google Scholar] [CrossRef]
  26. Leaffer, O.D.; Gupta, S.; Barsoum, M.W.; Spanier, J.E. On Raman scattering from selected M2AC compounds. J. Mater. Res. 2011, 22, 2651–2654. [Google Scholar] [CrossRef]
  27. Spanier, J.E.; Gupta, S.; Amer, M.; Barsoum, M.W. Vibrational behavior of theMn+1AXnphases from first-order Raman scattering(M=Ti,V,Cr,A=Si,X=C,N). Phys. Rev. B 2005, 71, 012103. [Google Scholar] [CrossRef]
  28. Tang, C.; Klimenkov, M.; Jaentsch, U.; Leiste, H.; Rinke, M.; Ulrich, S.; Steinbrück, M.; Seifert, H.J.; Stueber, M. Synthesis and characterization of Ti2AlC coatings by magnetron sputtering from three elemental targets and ex-situ annealing. Surf. Coat. Technol. 2017, 309, 445–455. [Google Scholar] [CrossRef]
  29. Li, W.; Wang, Z.; Shuai, J.; Xu, B.; Wang, A.; Ke, P. A high oxidation resistance Ti2AlC coating on Zirlo substrates for loss-of-coolant accident conditions. Ceram. Int. 2019, 45, 13912–13922. [Google Scholar] [CrossRef]
  30. Liu, J.; Zuo, X.; Wang, Z.; Wang, L.; Wu, X.; Ke, P.; Wang, A. Fabrication and mechanical properties of high purity of Cr2AlC coatings by adjustable Al contents. J. Alloys Compd. 2018, 753, 11–17. [Google Scholar] [CrossRef]
  31. Zhao, G.; Ge, F.; Cheng, X.; Huang, F. Effects of Bombarding Ions Energy on Structure and Mechanical Properties of V2AlC MAX-phase Coatings. China Surface Eng. 2019, 32, 80–87. [Google Scholar] [CrossRef]
  32. He, G.; Zhang, Y.; Yao, P.; Li, X.; Ma, K.; Zuo, J.; Li, M.; Liu, C.; Xu, J. A novel medium-entropy (TiVNb)2AlC MAX phase: Fabrication, microstructure, and properties. J. Mater. Sci. Technol. 2023, 137, 91–99. [Google Scholar] [CrossRef]
  33. Ge, F.; Zhu, P.; Meng, F.; Xue, Q.; Huang, F. Achieving very low wear rates in binary transition-metal nitrides: The case of magnetron sputtered dense and highly oriented VN coatings. Surf. Coat. Technol. 2014, 248, 81–90. [Google Scholar] [CrossRef]
  34. Su, Q.; Liu, X.Q.; Ma, H.L.; Guo, Y.P.; Wang, Y.Y. Raman spectroscopic characterization of the microstructure of V2O5 films. J. Solid State Electrochem. 2008, 12, 919–923. [Google Scholar] [CrossRef]
  35. Fu, J.; Zhang, T.F.; Xia, Q.; Lim, S.-H.; Wan, Z.; Lee, T.-W.; Kim, K.H.; Yun, J.M. Oxidation and Corrosion Behavior of Nanolaminated MAX-Phase Ti2AlC Film Synthesized by High-Power Impulse Magnetron Sputtering and Annealing. J. Nanomater. 2015, 2015, 213128. [Google Scholar] [CrossRef]
  36. Ougier, M.; Michau, A.; Lomello, F.; Schuster, F.; Maskrot, H.; Schlegel, M.L. High-temperature oxidation behavior of HiPIMS as-deposited Cr–Al–C and annealed Cr2AlC coatings on Zr-based alloy. J. Nucl. Mater. 2020, 528, 151855. [Google Scholar] [CrossRef]
  37. Liu, Z.; Gao, W.; Dahm, K.L.; Wang, F. Oxidation behaviour of sputter-deposited Ni–Cr–Al micro-crystalline coatings. Acta Mater. 1998, 46, 1691–1700. [Google Scholar] [CrossRef]
Figure 1. XRD patterns (a,b) and Raman spectra (c,d) of the (TiVCr)2AlC coatings as a function of annealing temperature deposited on sapphire (a,c) and quartz (b,d) substrates, respectively.
Coatings 14 01504 g001
Figure 2. Surface morphologies of the as-deposited (a) and annealed coatings at different temperatures (bd); cross-sectional morphologies of the as-deposited (e) and annealed coatings at different temperatures (fh).
Coatings 14 01504 g002
Figure 3. Cross-sectional TEM images and elemental EDS mapping results of the as-deposited TiVCrAlC coating. (a) Overview images; (b) HRTEM images.
Coatings 14 01504 g003
Figure 4. (a) Cross-sectional TEM image, (b) SAED pattern, and corresponding elemental EDS mapping results of the 700 °C annealed (TiVCr)2AlC coating, HAADF image of A(AlOx-rich phase), B(CrAl-rich phase), C(TiVC-rich phase), D(MAX-phase). (ce) HRTEM images of three representative phases.
Coatings 14 01504 g004
Figure 5. Hardness and indentation modulus of the as-deposited and annealed coatings.
Coatings 14 01504 g005
Figure 6. Cross-sectional SEM micrographs of the amorphous (ad) and crystalline (eh) coatings after oxidation at different temperatures.
Coatings 14 01504 g006
Figure 7. Planar SEM micrographs of the amorphous (ac) and crystalline (df) coatings after oxidation at temperatures of 700–900 °C. Fine-grained products (left) of dendritic (I) and rod-like (II), oxides (middle) of strip (I) and granular (II), MAX-phase coatings (right) of ath-like (I) and fine-grained (II).
Coatings 14 01504 g007
Figure 8. Raman spectra (a,b) and XRD patterns (c,d) of the amorphous (a,c) and crystalline coatings (b,d) after oxidation at 700–1000 °C.
Coatings 14 01504 g008
Figure 9. Cross-sectional TEM image and EDS mapping of the corresponding elements of the amorphous TiVCrAlC coating after oxidation at 700 °C for 15 min. The Ti/O-rich oxide layer (A), Al/O-rich oxide layer (B) and TiVCrAlC coating (C).
Coatings 14 01504 g009
Figure 10. (a) Cross-sectional TEM image, EDS mapping results, and (b) HRTEM image of the most superficial surface of the crystalline (TiVCr)2AlC coating after oxidation at 700 °C for 15 min. The Al/O-rich oxide layer (A), (TiVCr)2AlC coating (B&C).
Coatings 14 01504 g010
Figure 11. BF-TEM image and EDS mapping of the corresponding elements of the crystalline (TiVCr)2AlC coating after oxidation at 900 °C for 15 min. The V/O-rich oxide layer (A), Al/O-rich oxide layer (B), Al/Cr/O-rich oxide layer (C) and (TiVCr)2AlC coating (D).
Coatings 14 01504 g011
Table 1. Chemical compositions (at. %) of the EDS point analysis labeled in HAADF in Figure 4.
PointsOCAlTiVCr
A54.53.041.40.80.10.2
B0.17.330.46.96.049.3
C5.740.810.021.412.89.3
D026.823.88.019.721.8
Table 2. Chemical compositions (at. %) of the points labeled as alphabets in Figure 9.
AreaTiCrVOAlC
A18.93.35.267.51.33.9
B2.45.26.365.318.91.9
C10.718.418.39.023.620.1
Table 3. Chemical compositions (at. %) of the points labeled as alphabets in Figure 10.
AreaTiCrVOAlC
A2.31.62.551.830.711.1
B11.919.818.54.228.517.2
C11.419.718.08.227.215.4
Table 4. Chemical compositions (at. %) of the points labeled as alphabets in Figure 11.
AreaTiCrVOAlC
A0.30.326.466.71.64.8
B3.83.71.865.323.12.3
C3.59.92.966.014.92.8
D11.220.418.29.919.720.5
Disclaimer/Publisher’s Note: The statements, opinions and data contained in all publications are solely those of the individual author(s) and contributor(s) and not of MDPI and/or the editor(s). MDPI and/or the editor(s) disclaim responsibility for any injury to people or property resulting from any ideas, methods, instructions or products referred to in the content.