
The Influence of the Assembly Unit of CO2-Cured Secondary Aluminum Ash and CO2-Cured Iron Tailings on High Performance Concrete’s Properties


Abstract
1. Introduction
2. Materials and Methods
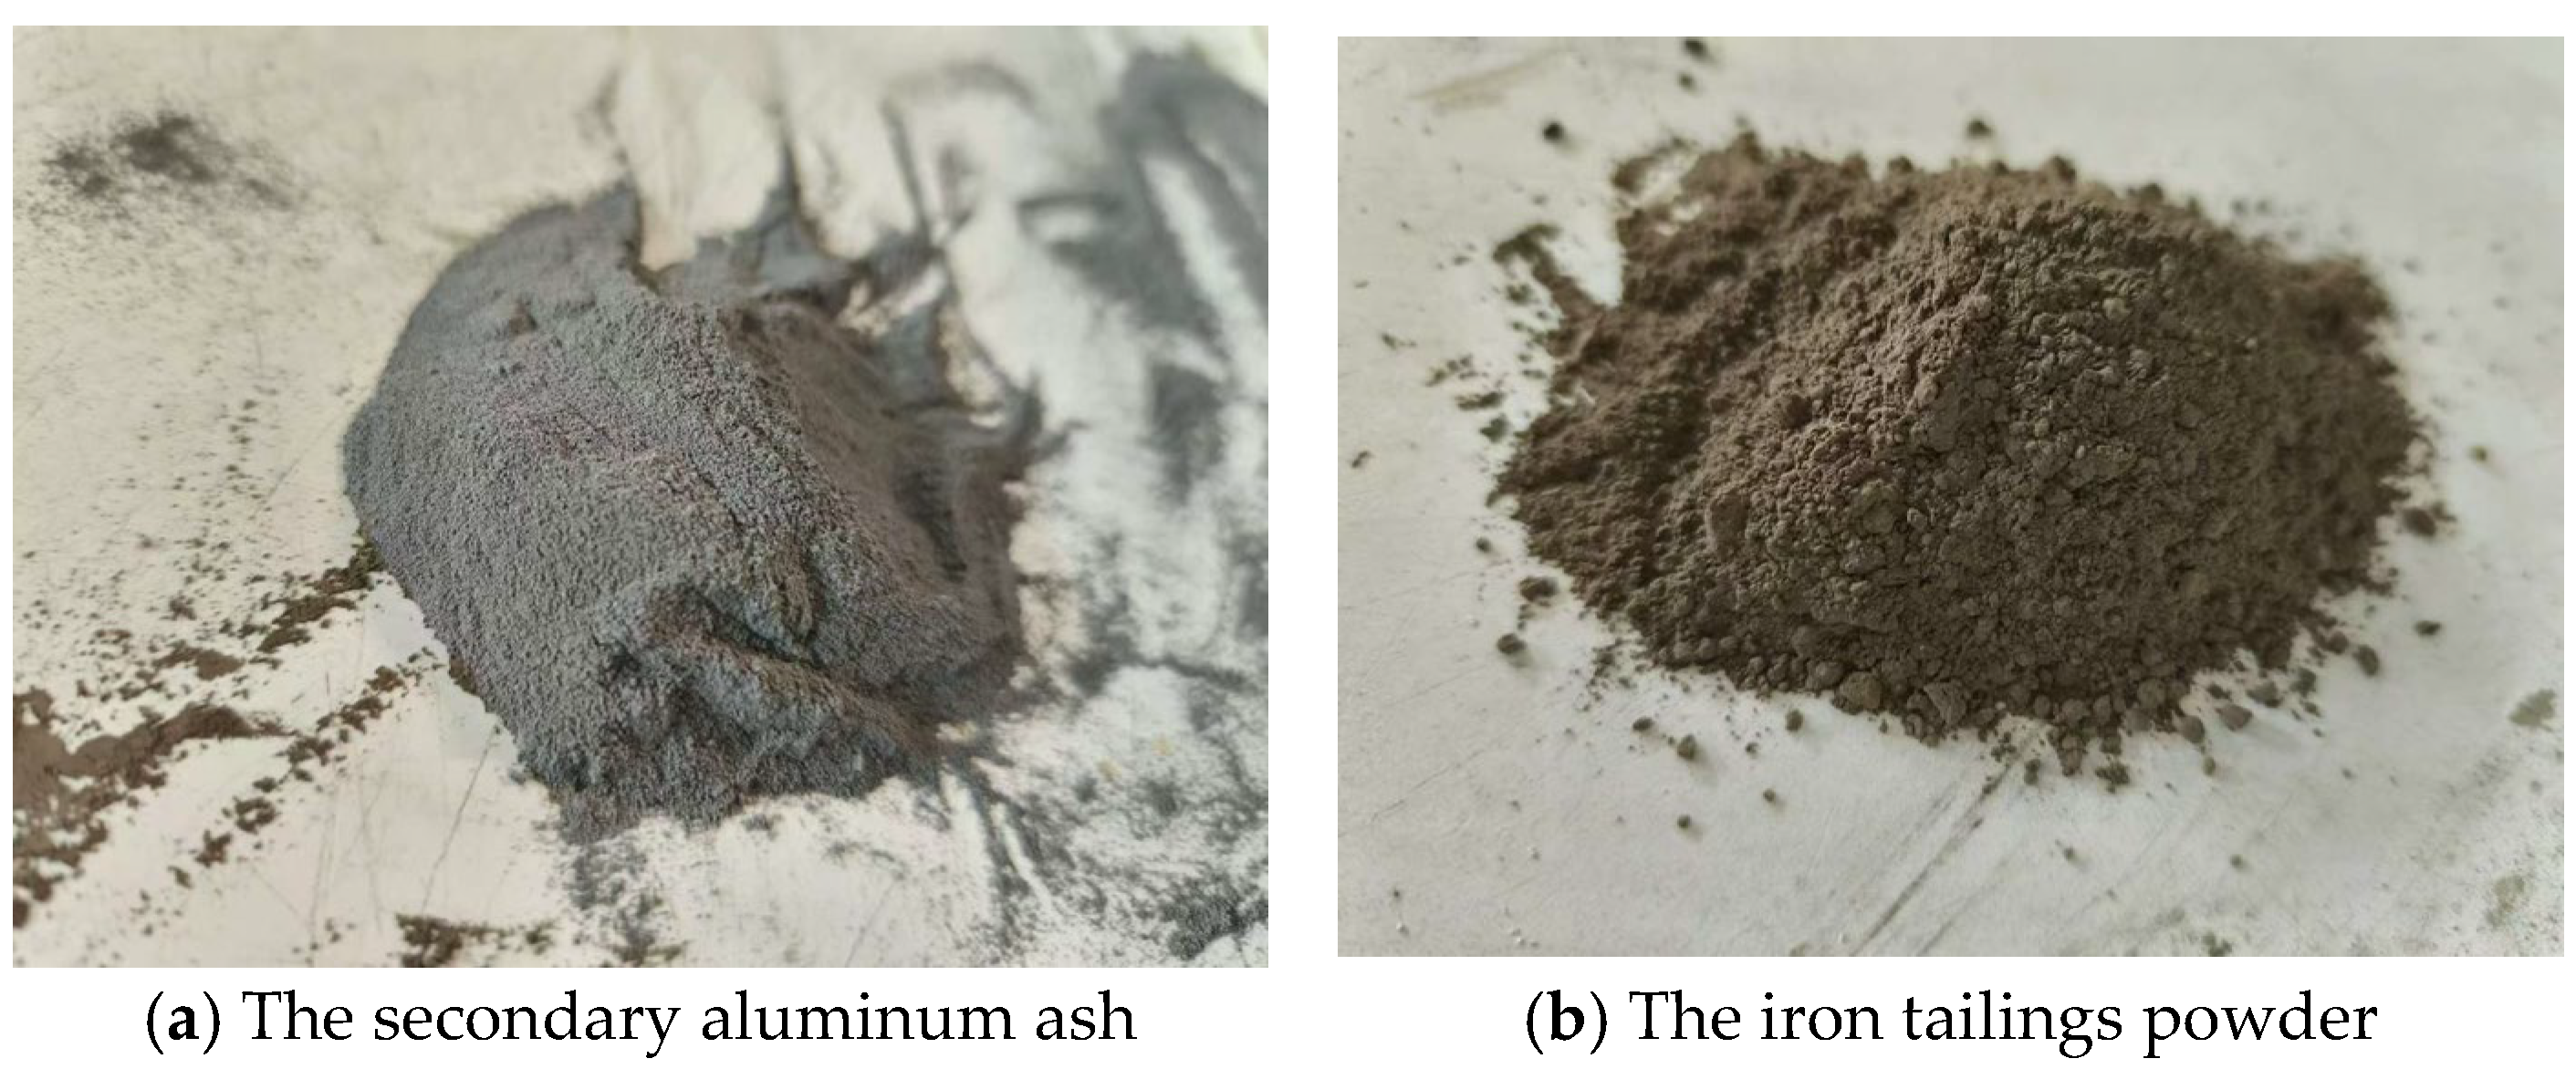
2.1. Raw Materials
2.2. The Manufacturing Process of the Specimens
2.3. Experimental Methodology
2.3.1. The Slump Flow and the Setting Time
2.3.2. The Mechanical Strengths
2.3.3. The Dry Shrinkage Rate
2.3.4. The Measurement of the Toxic Heavy Metals
2.3.5. The Microscopic Experiments
3. Results and Discussions
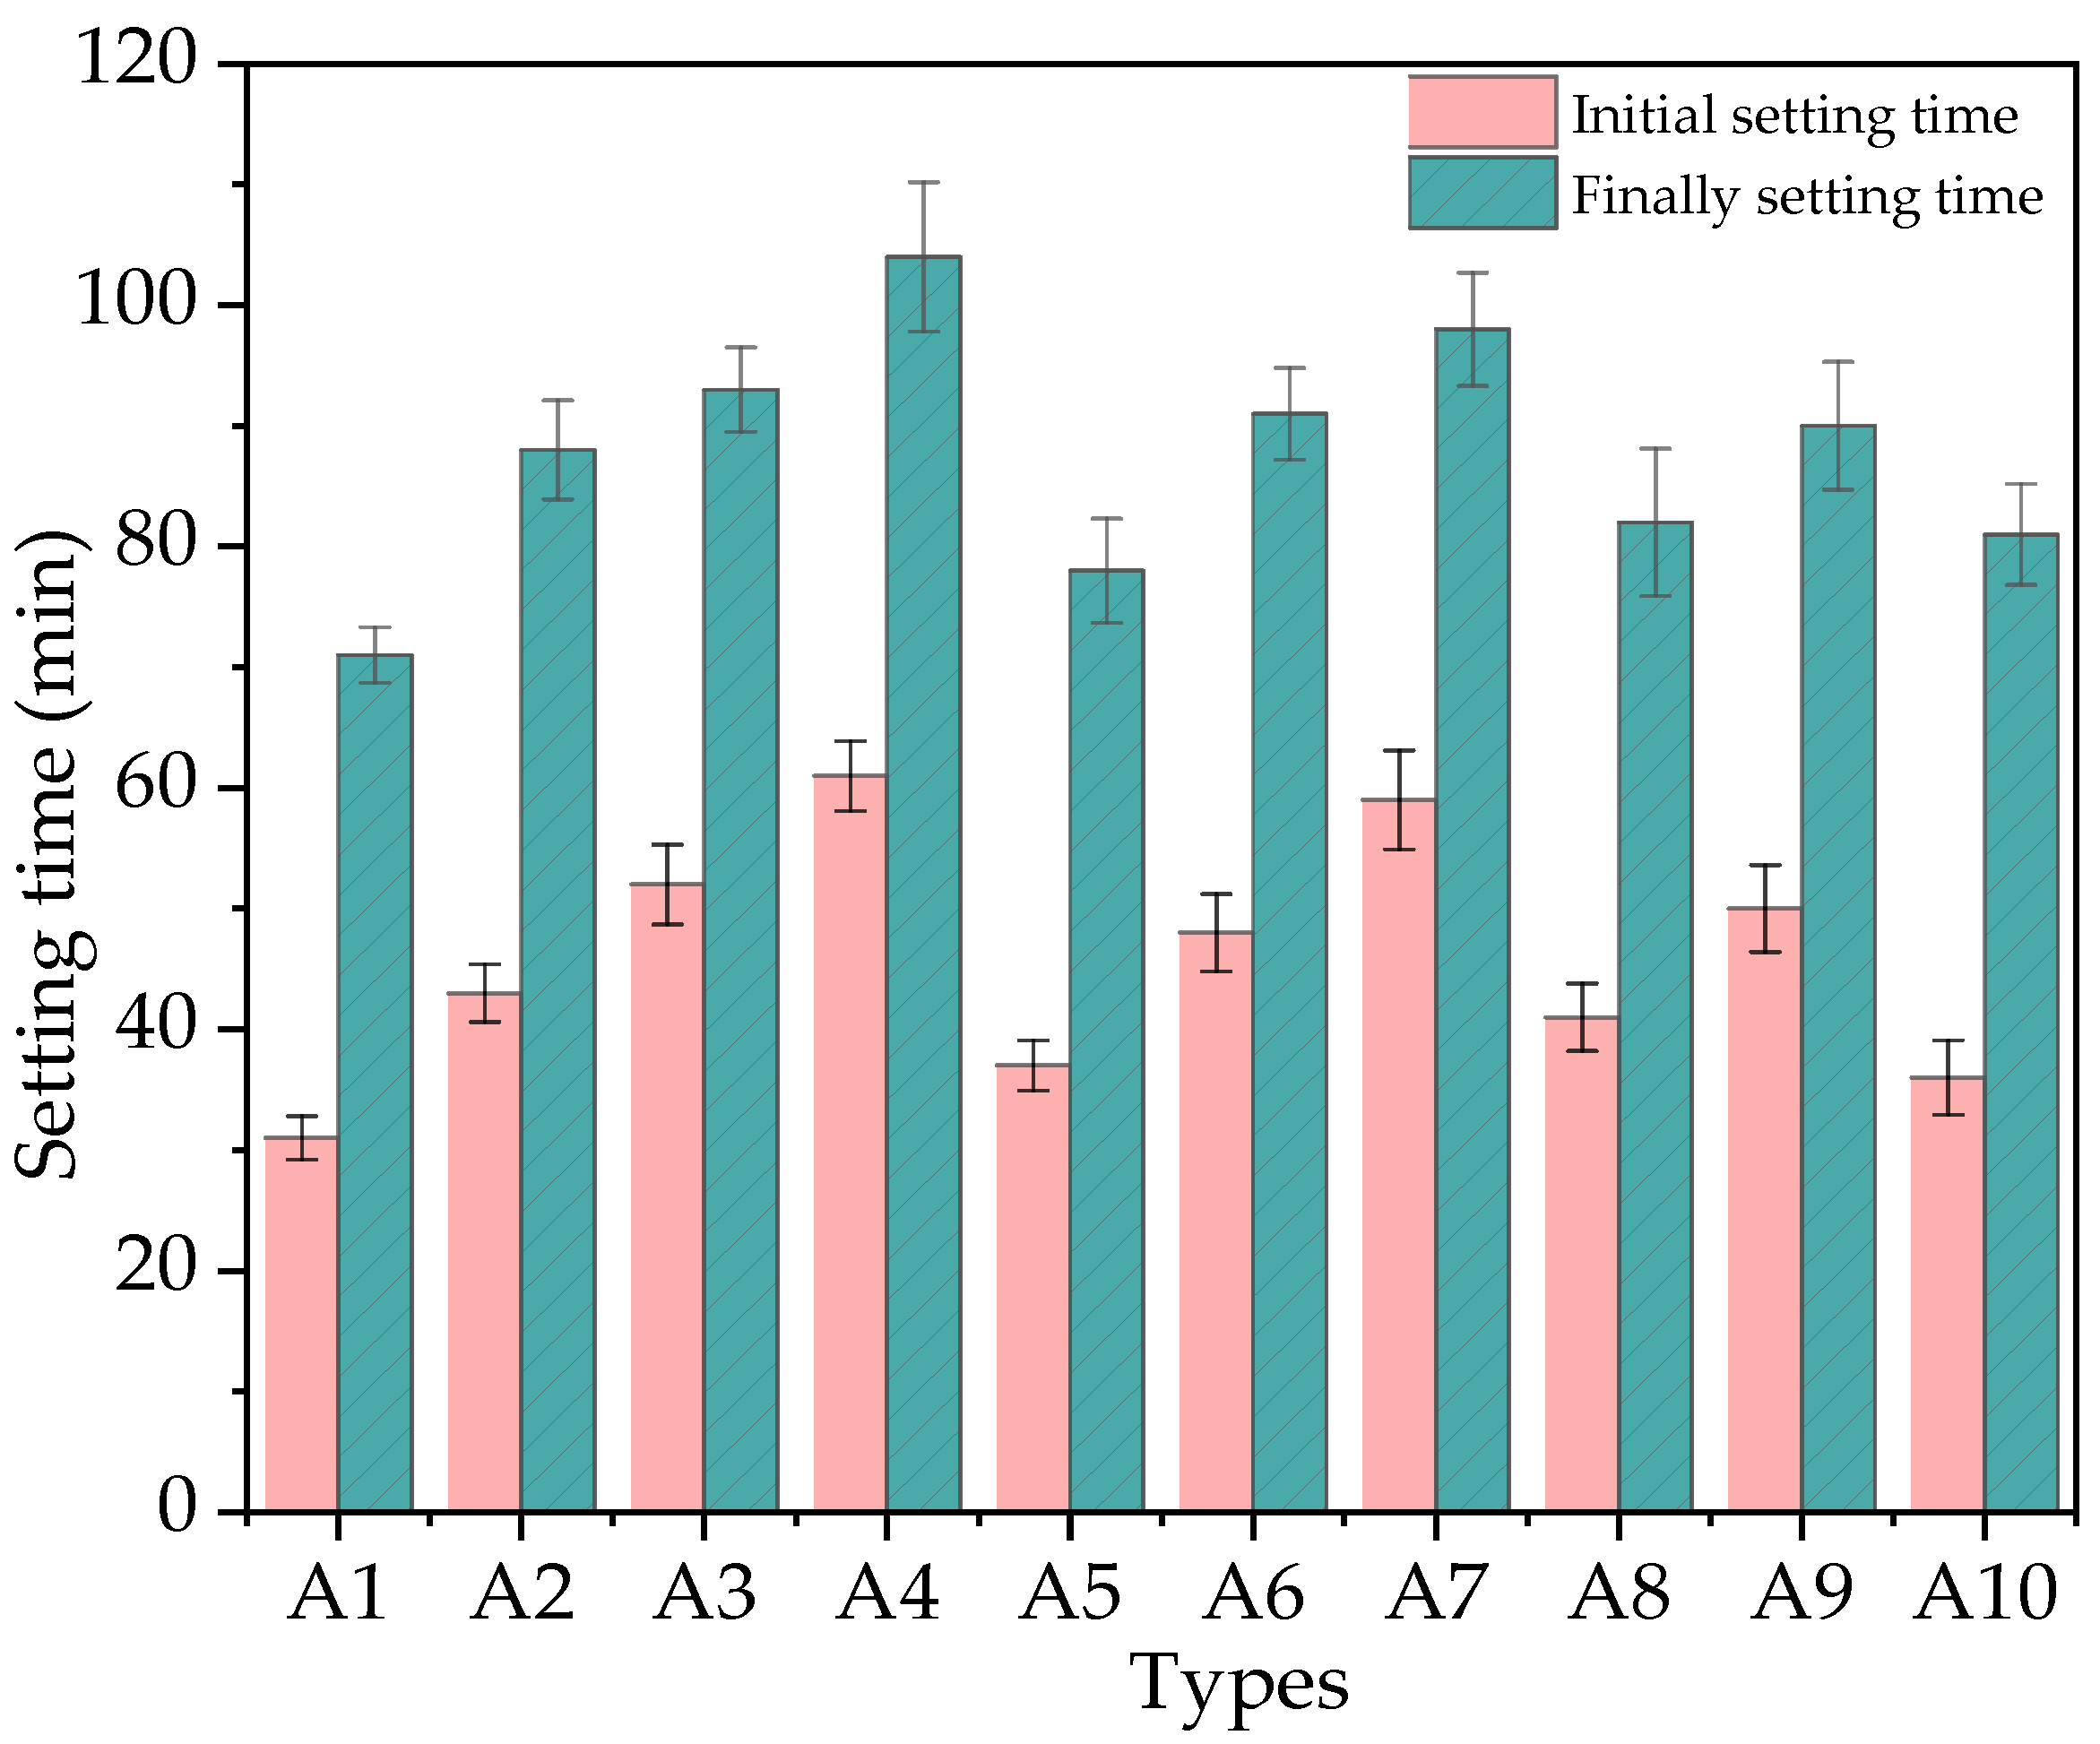
3.1. The Slump Flow and Setting Time
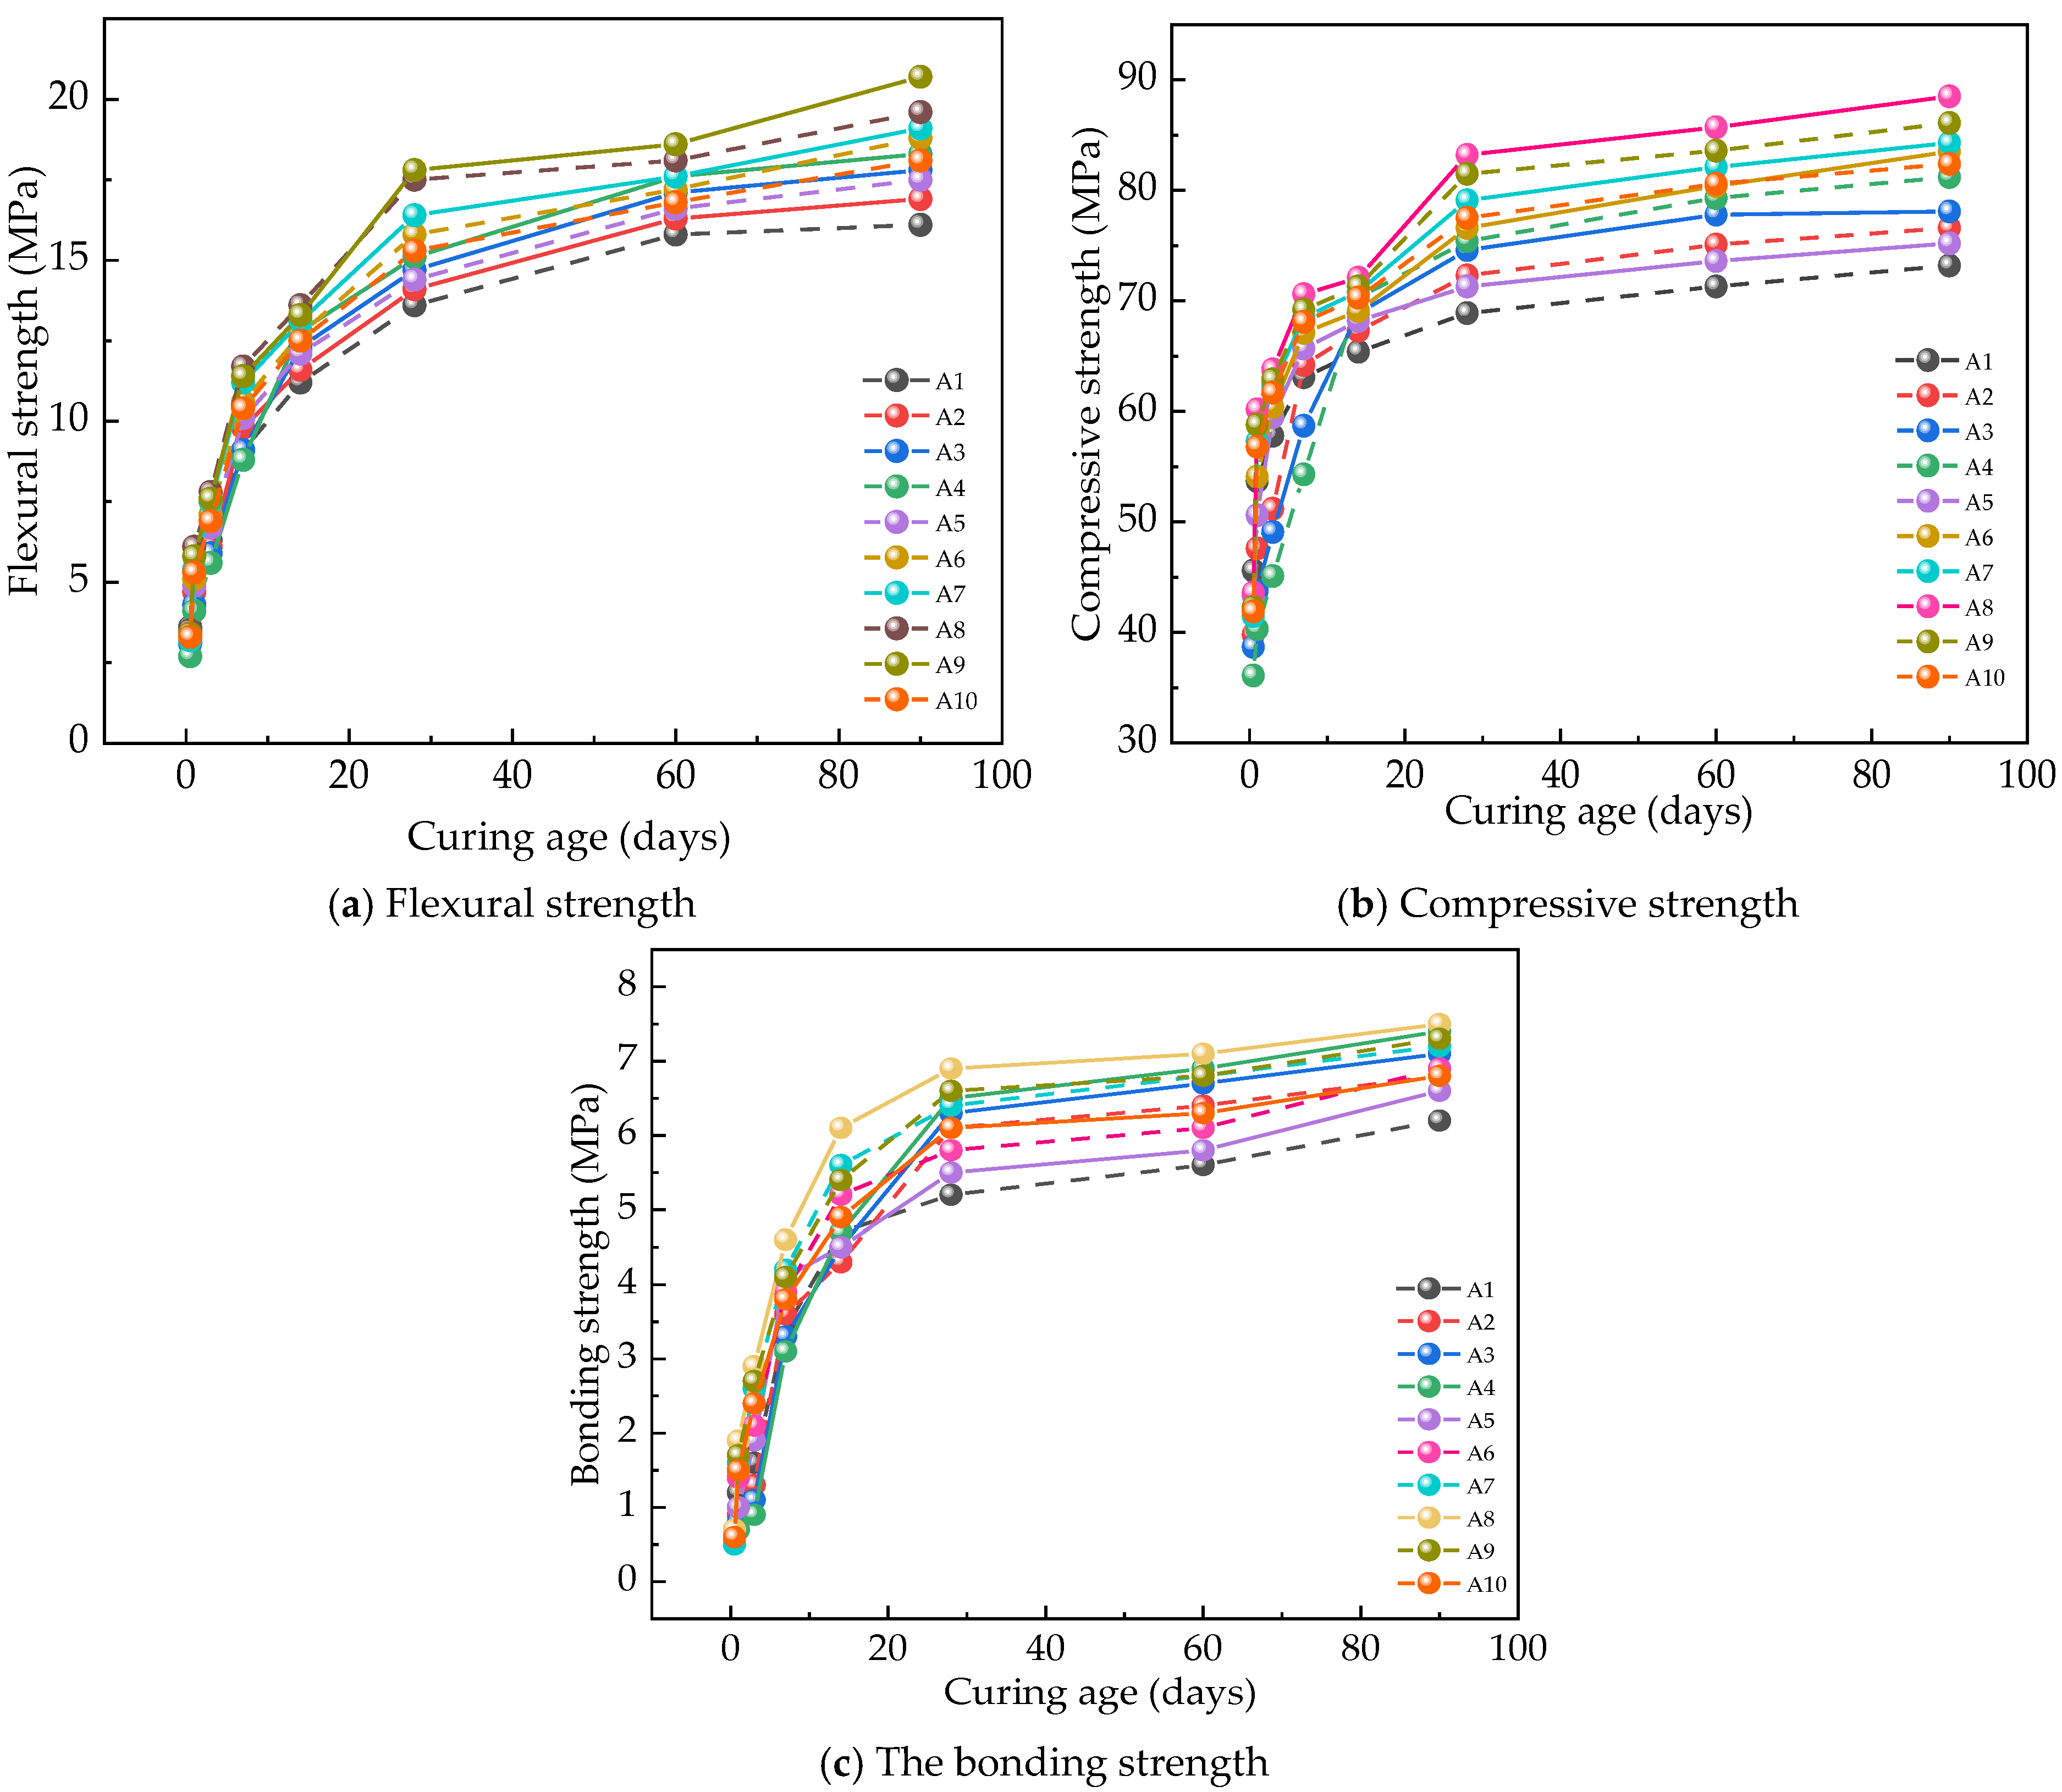
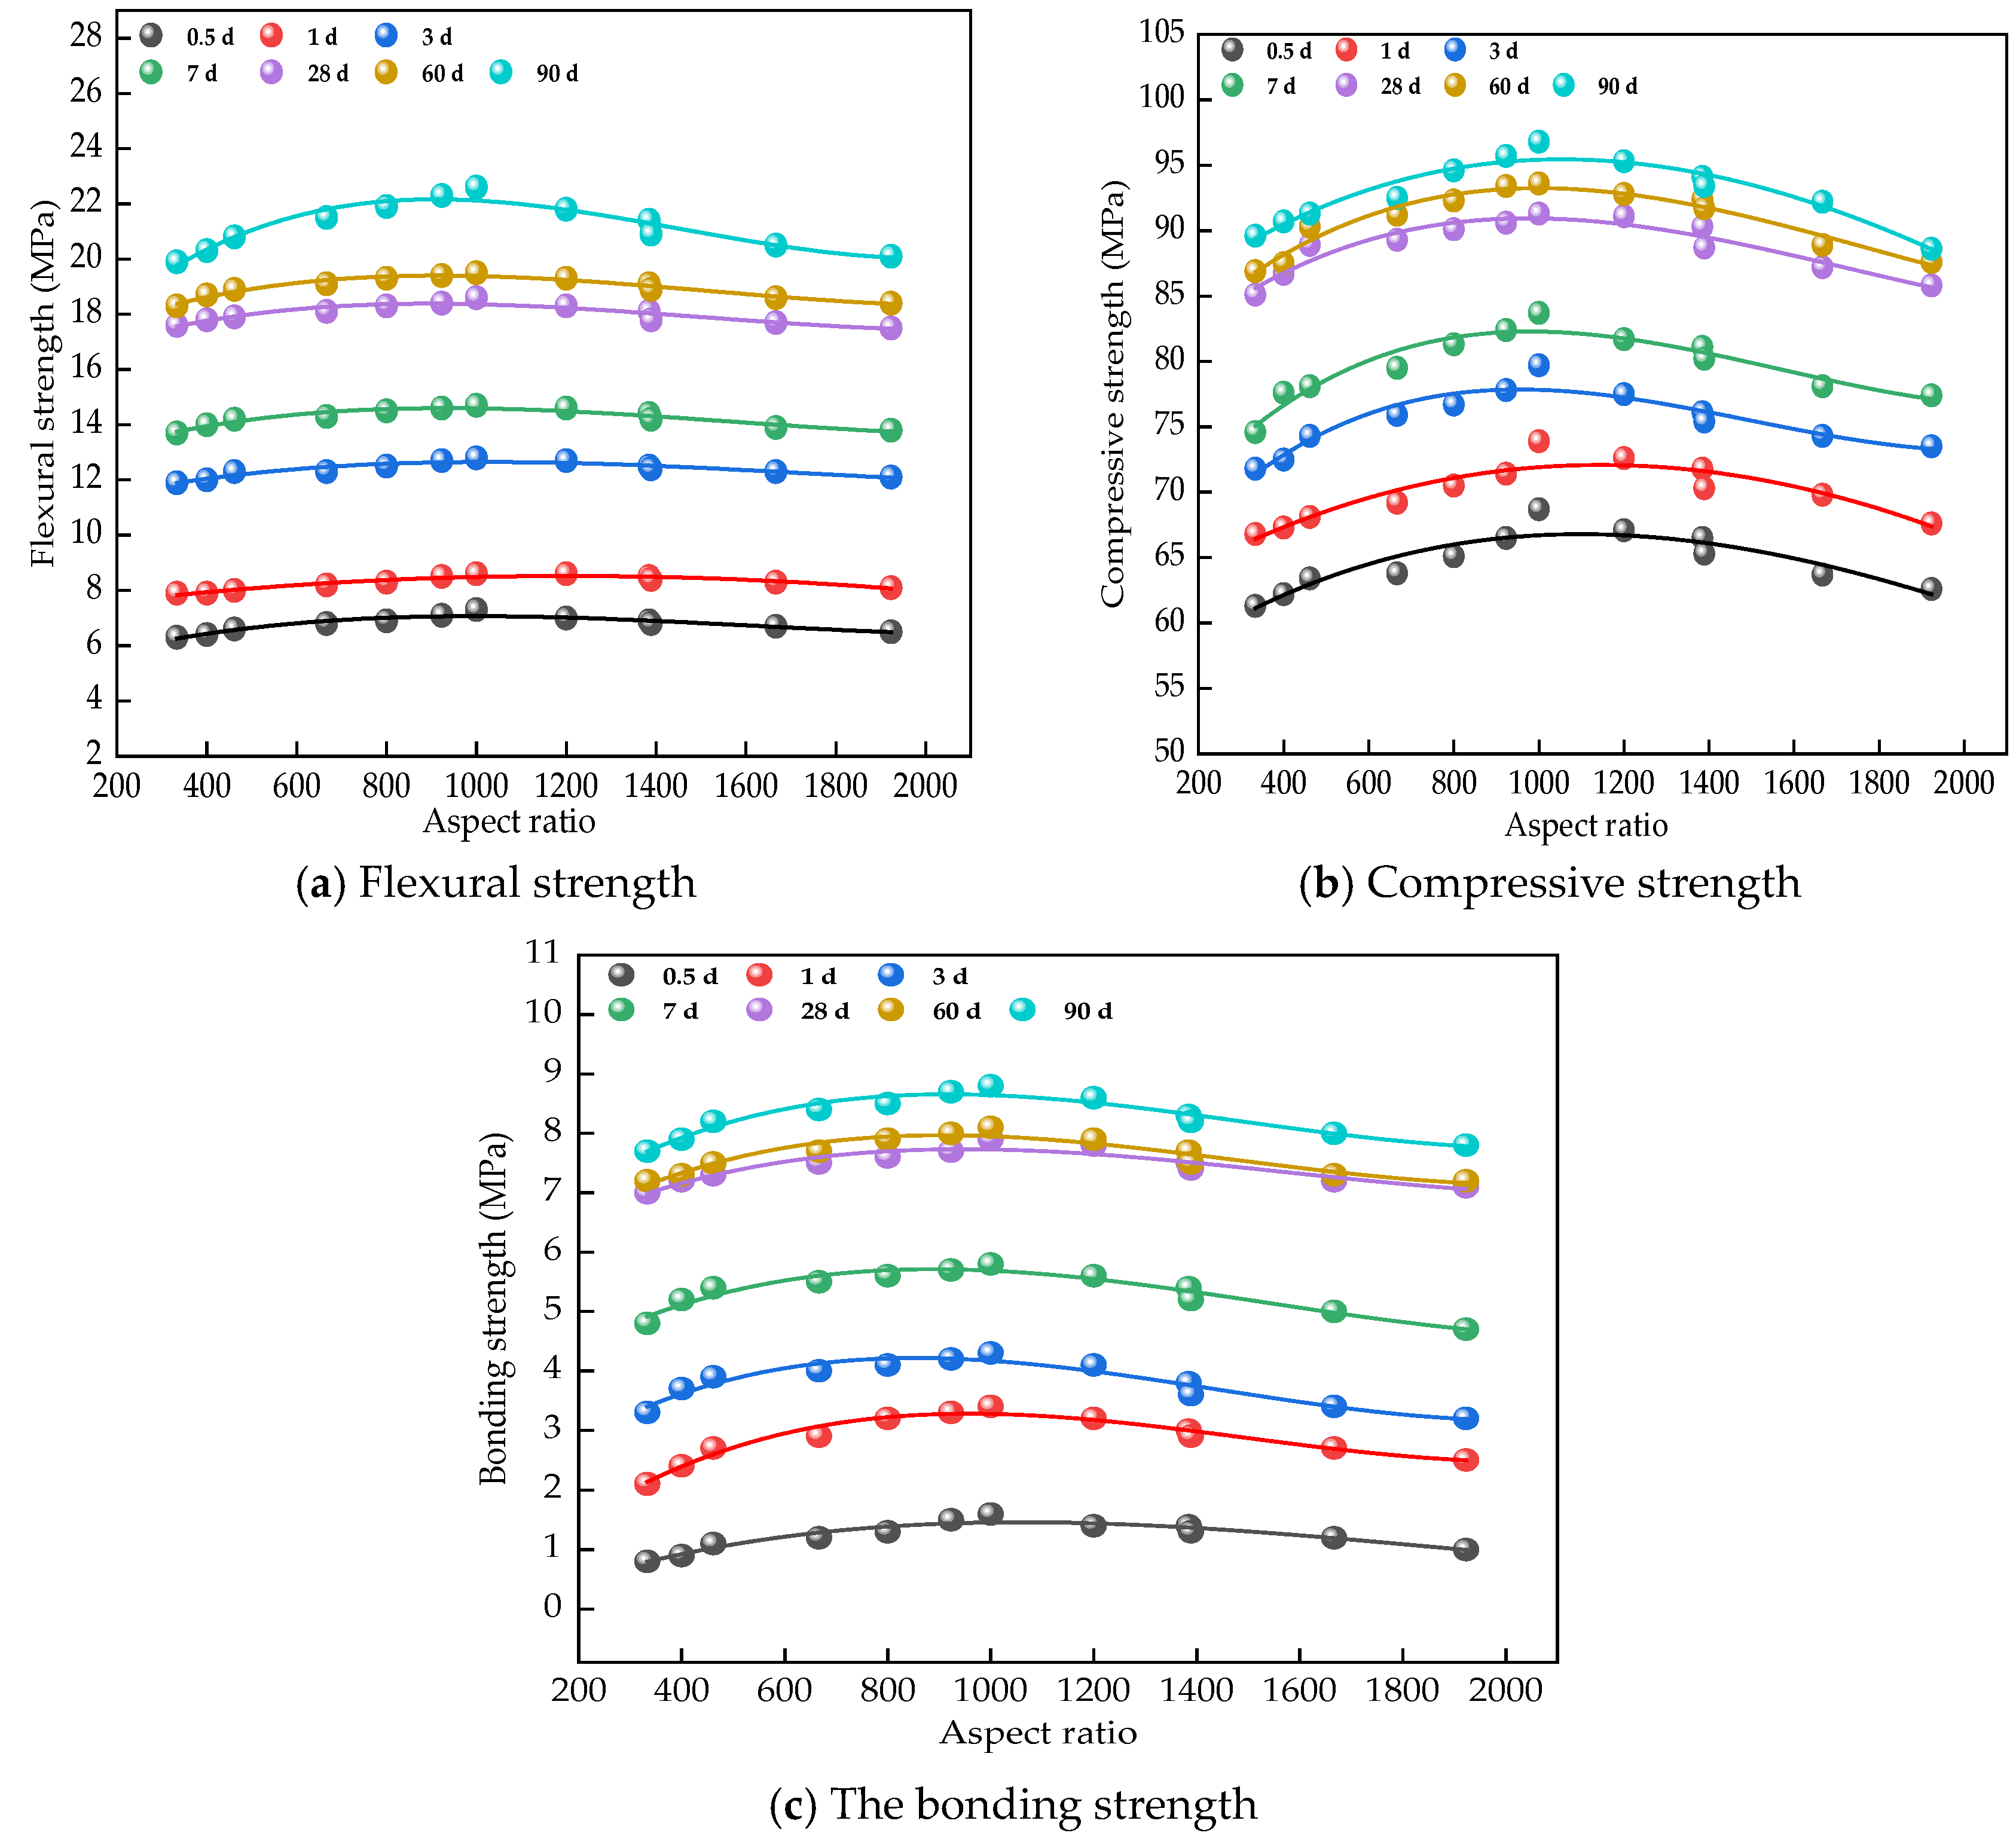
3.2. The Mechanical Strengths
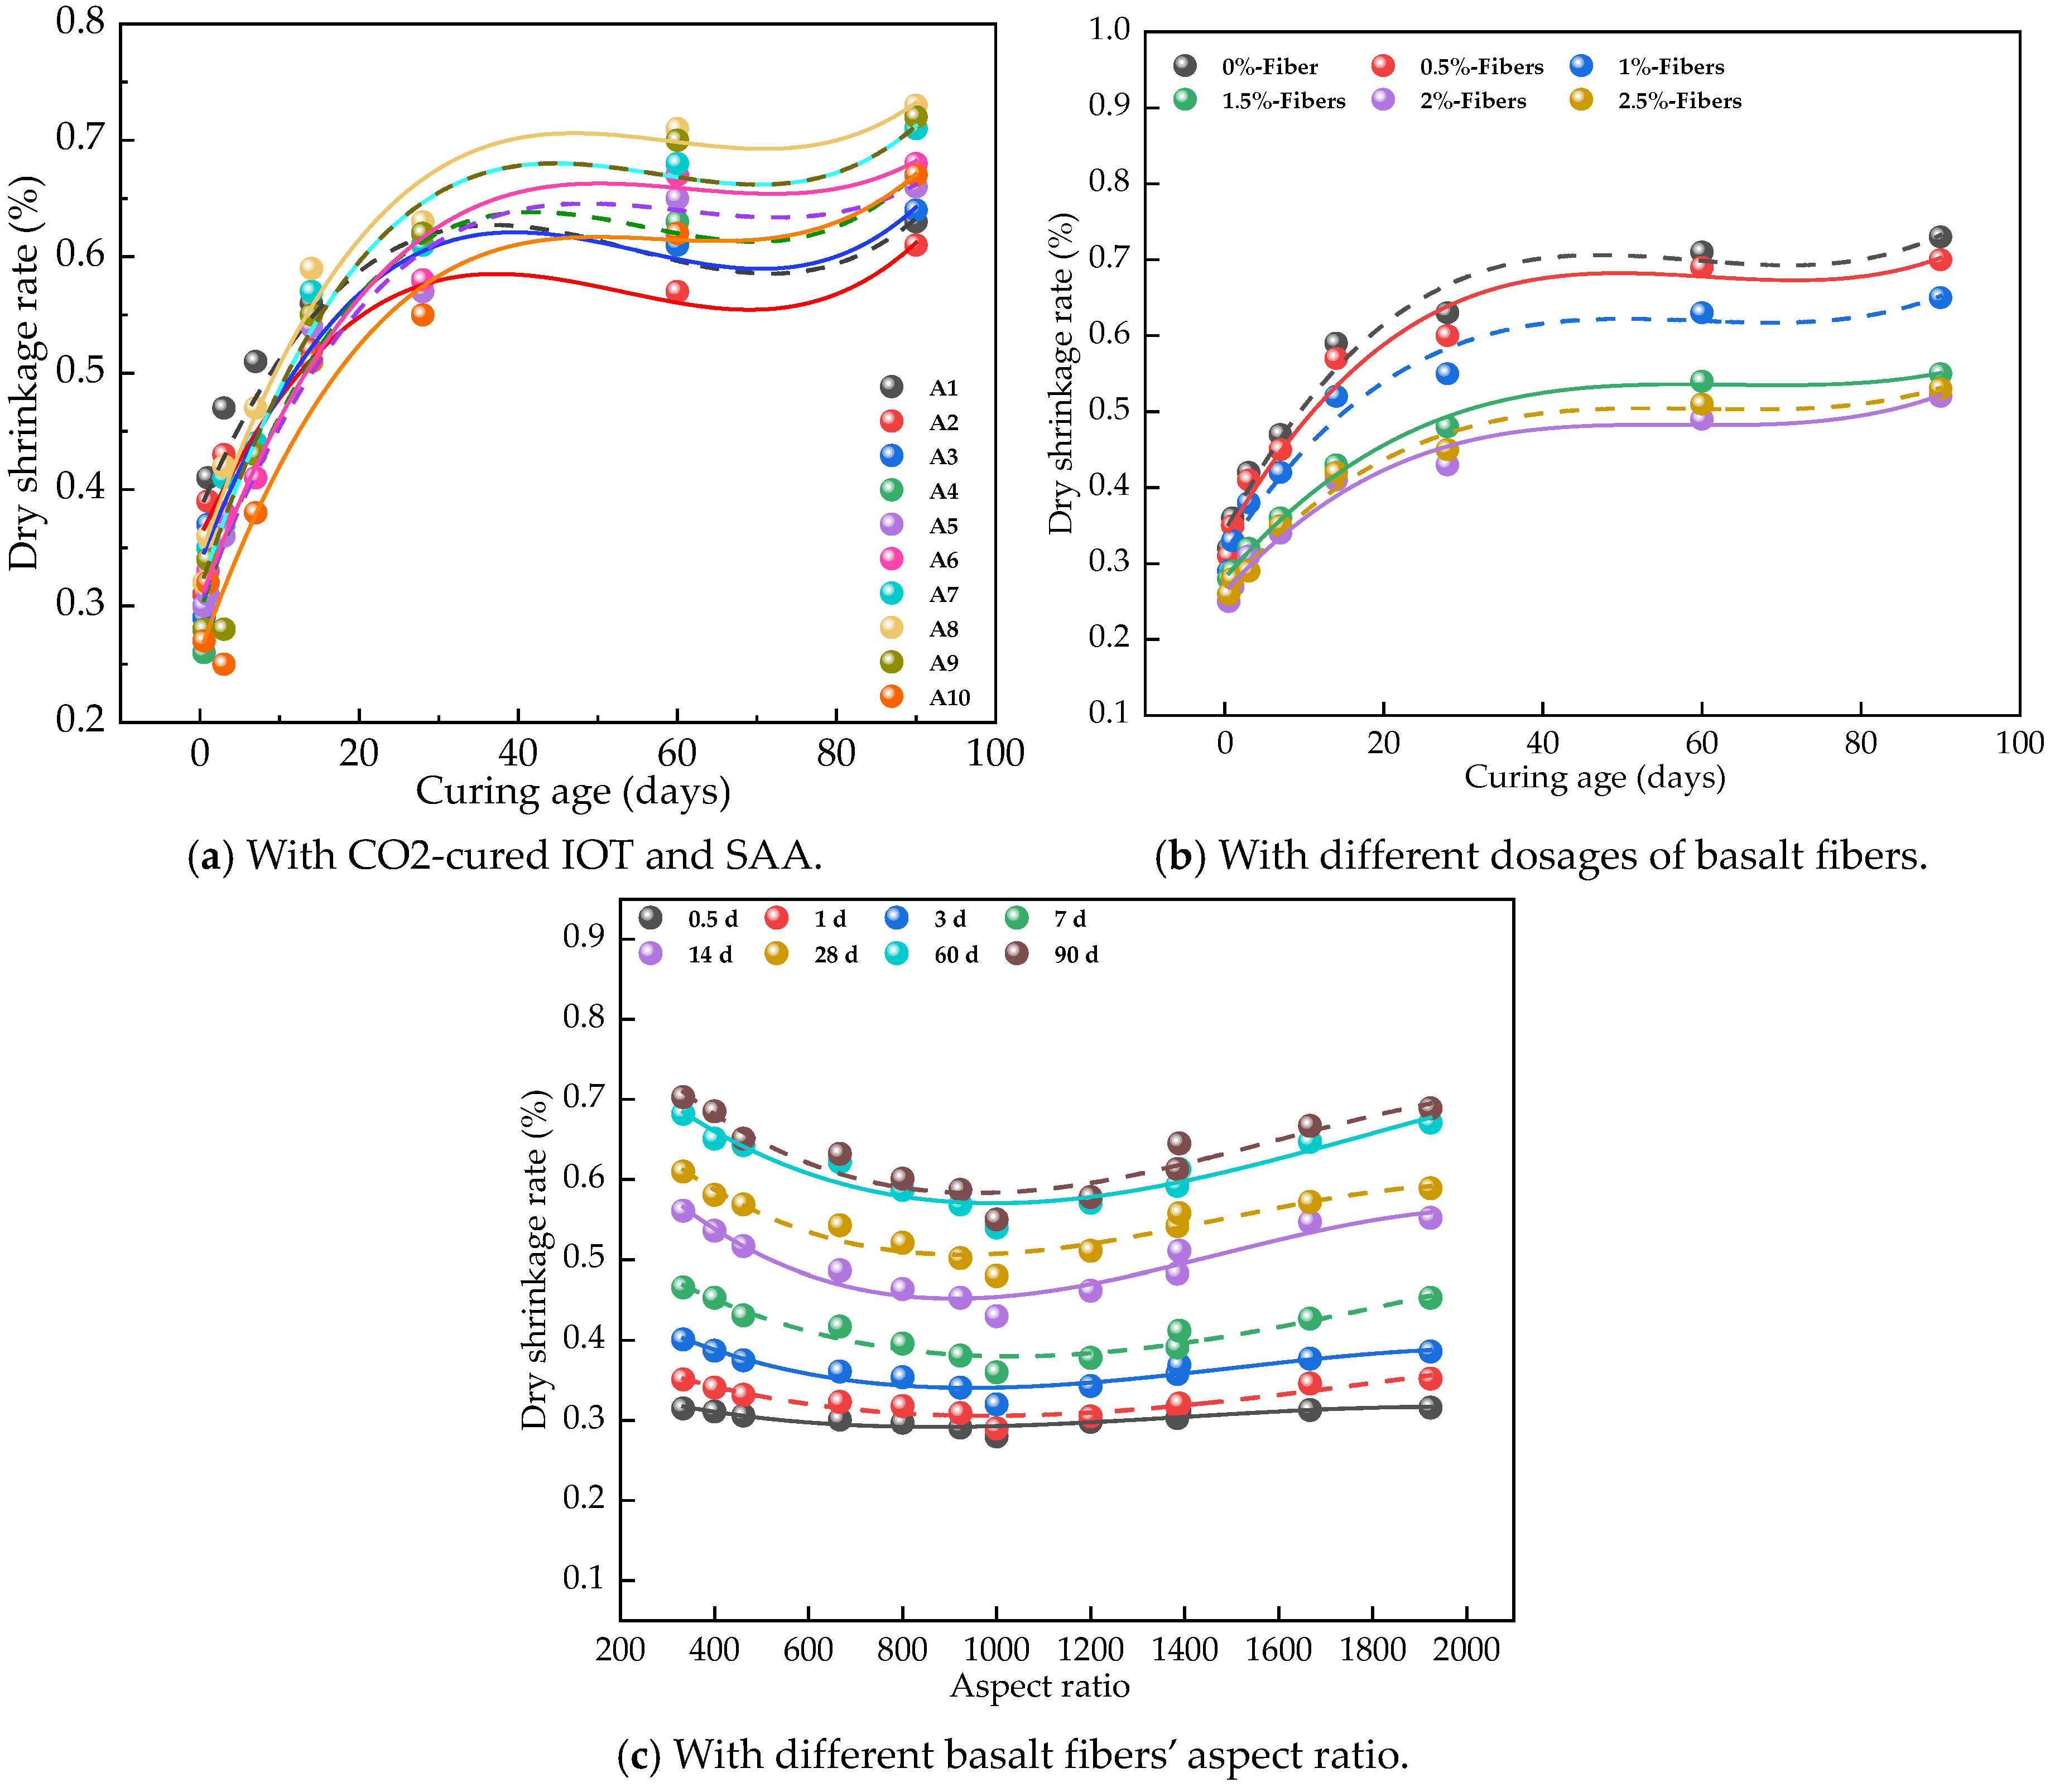
3.3. The Dry Shrinkage Rate
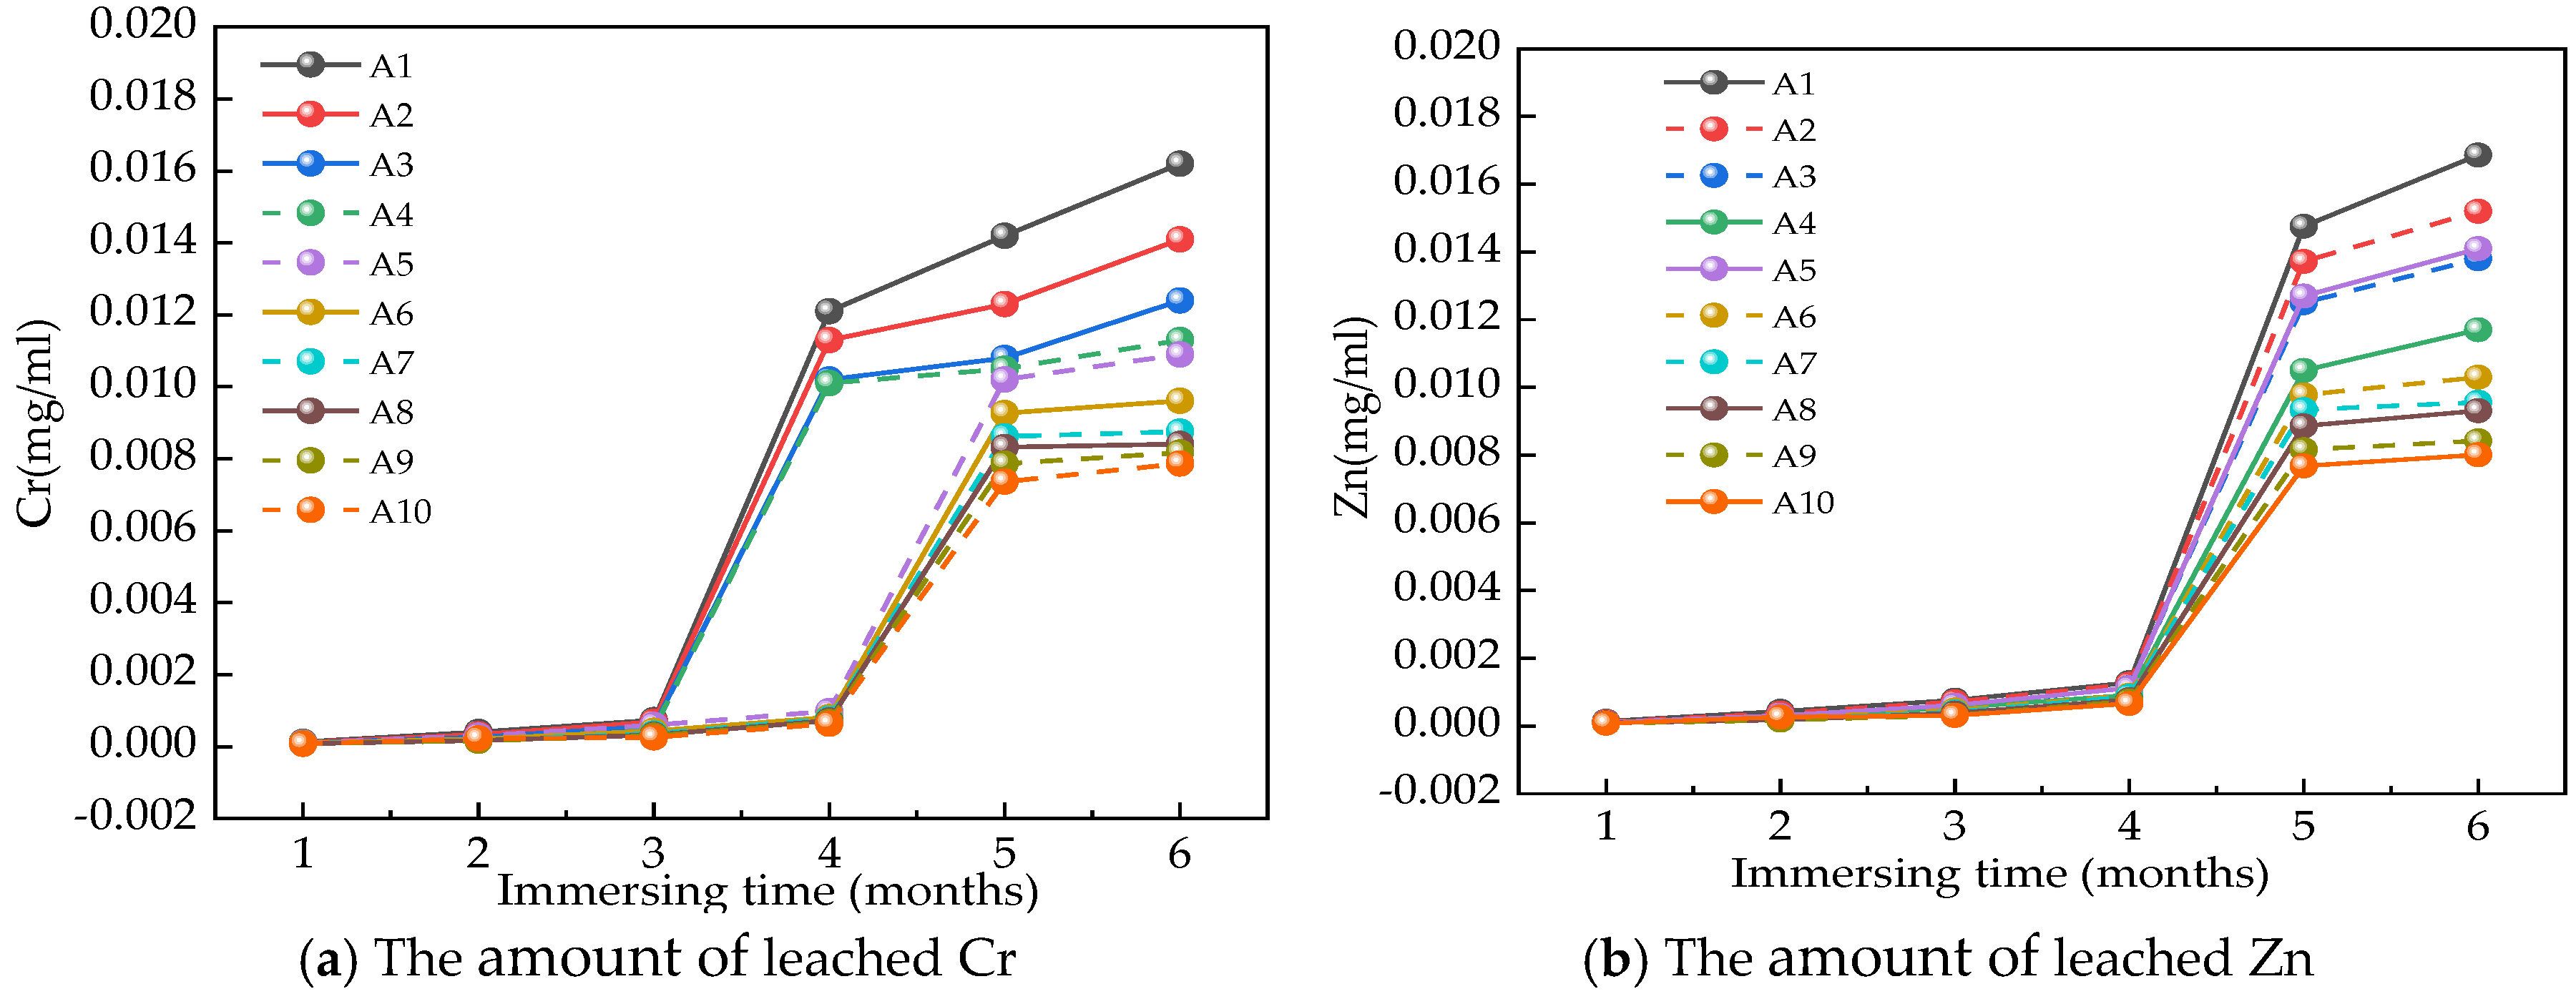
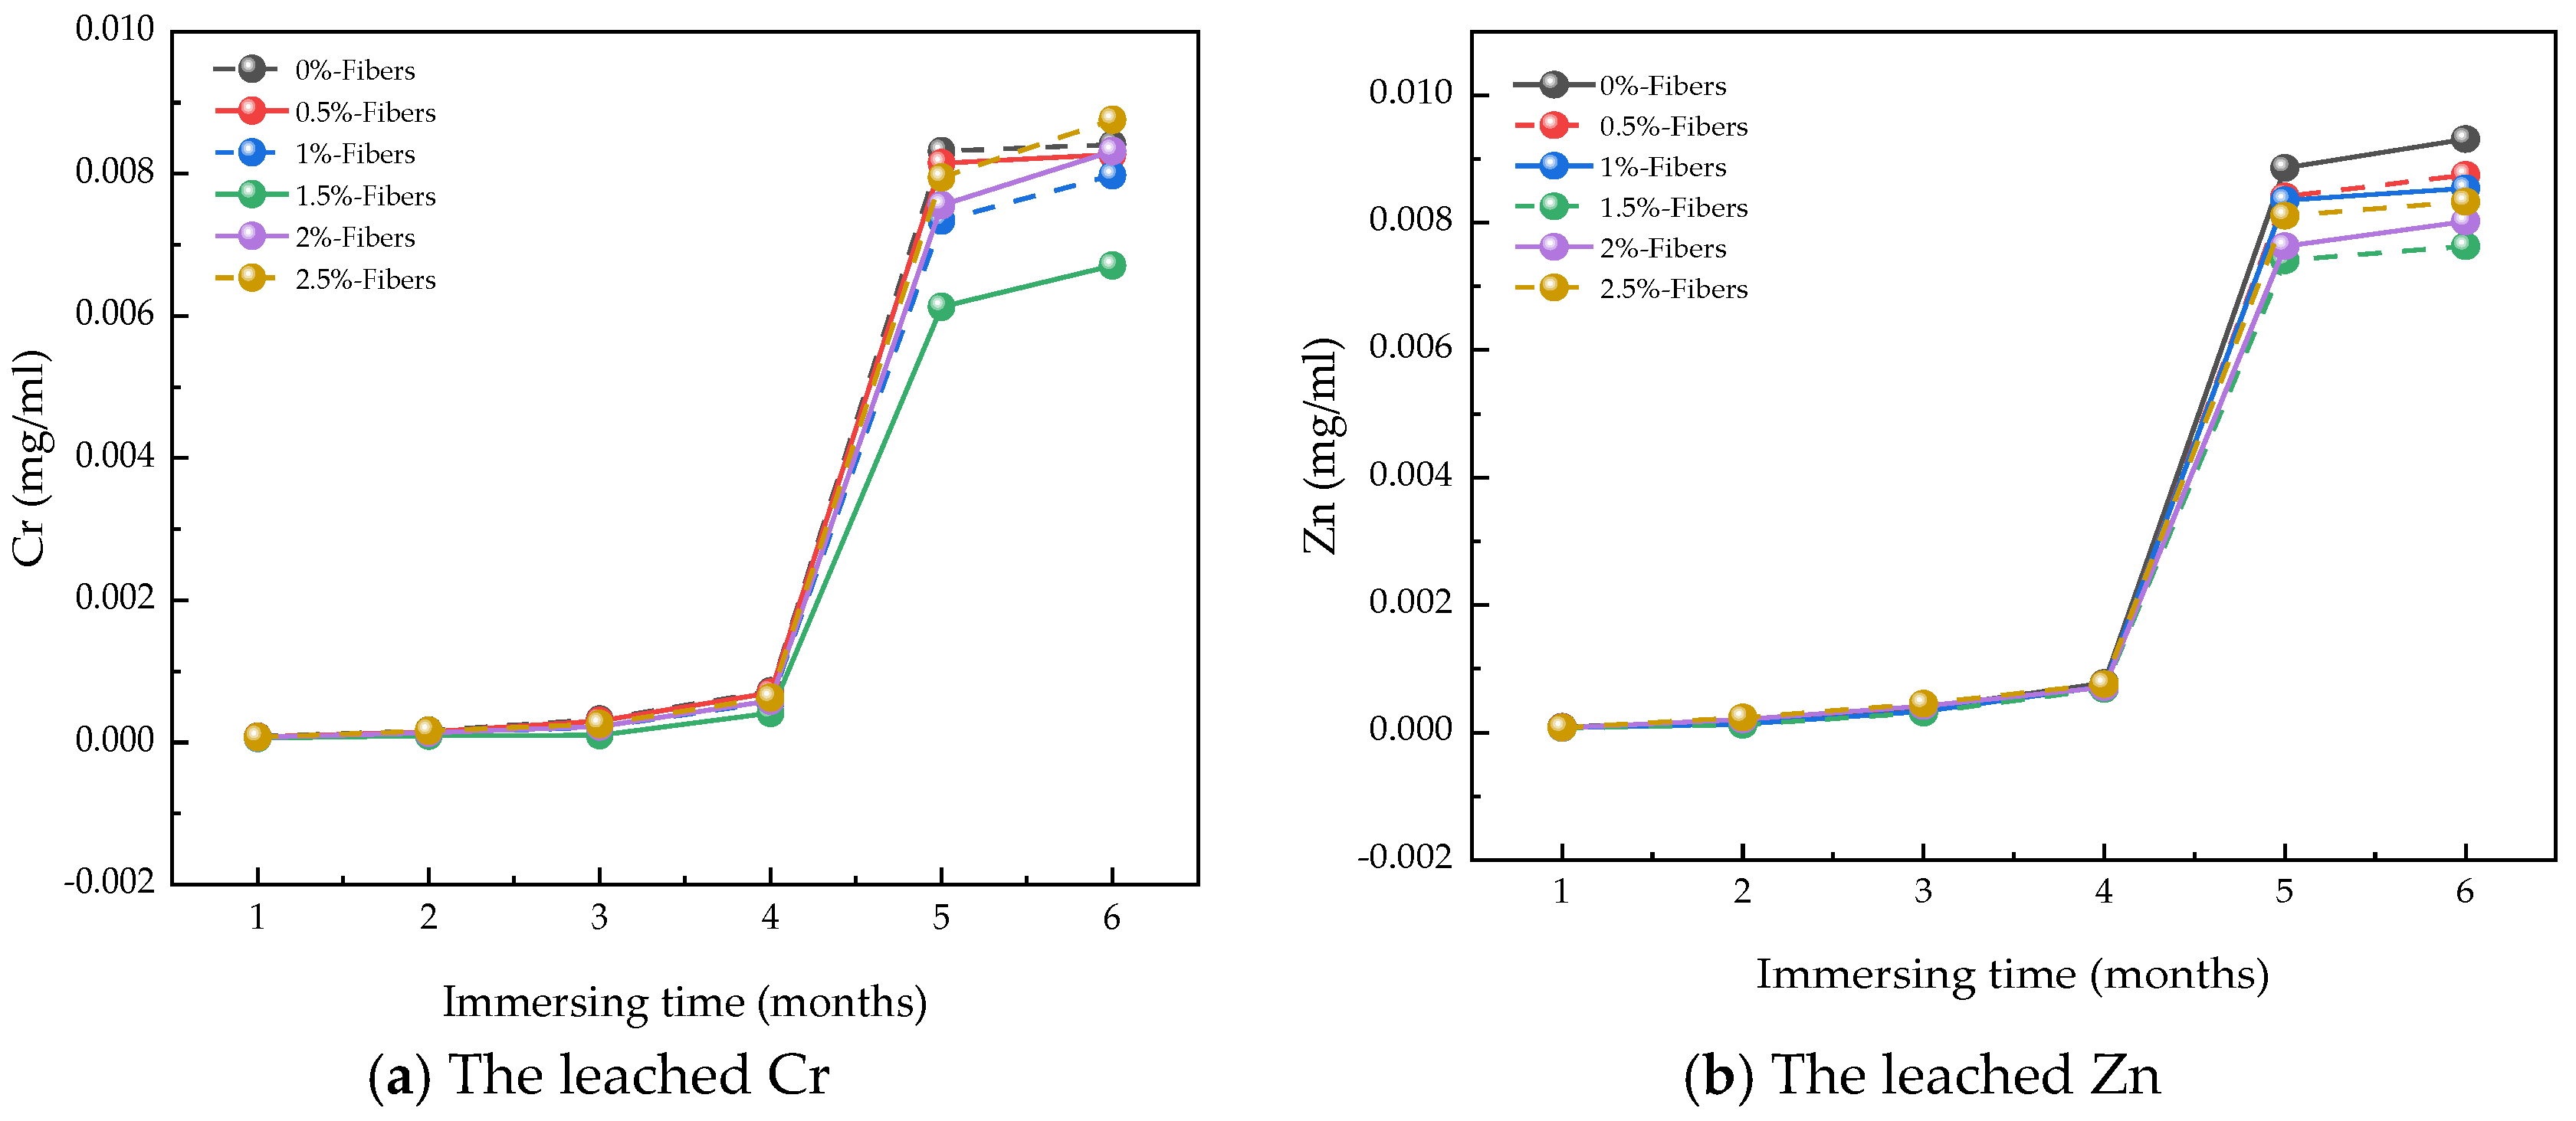
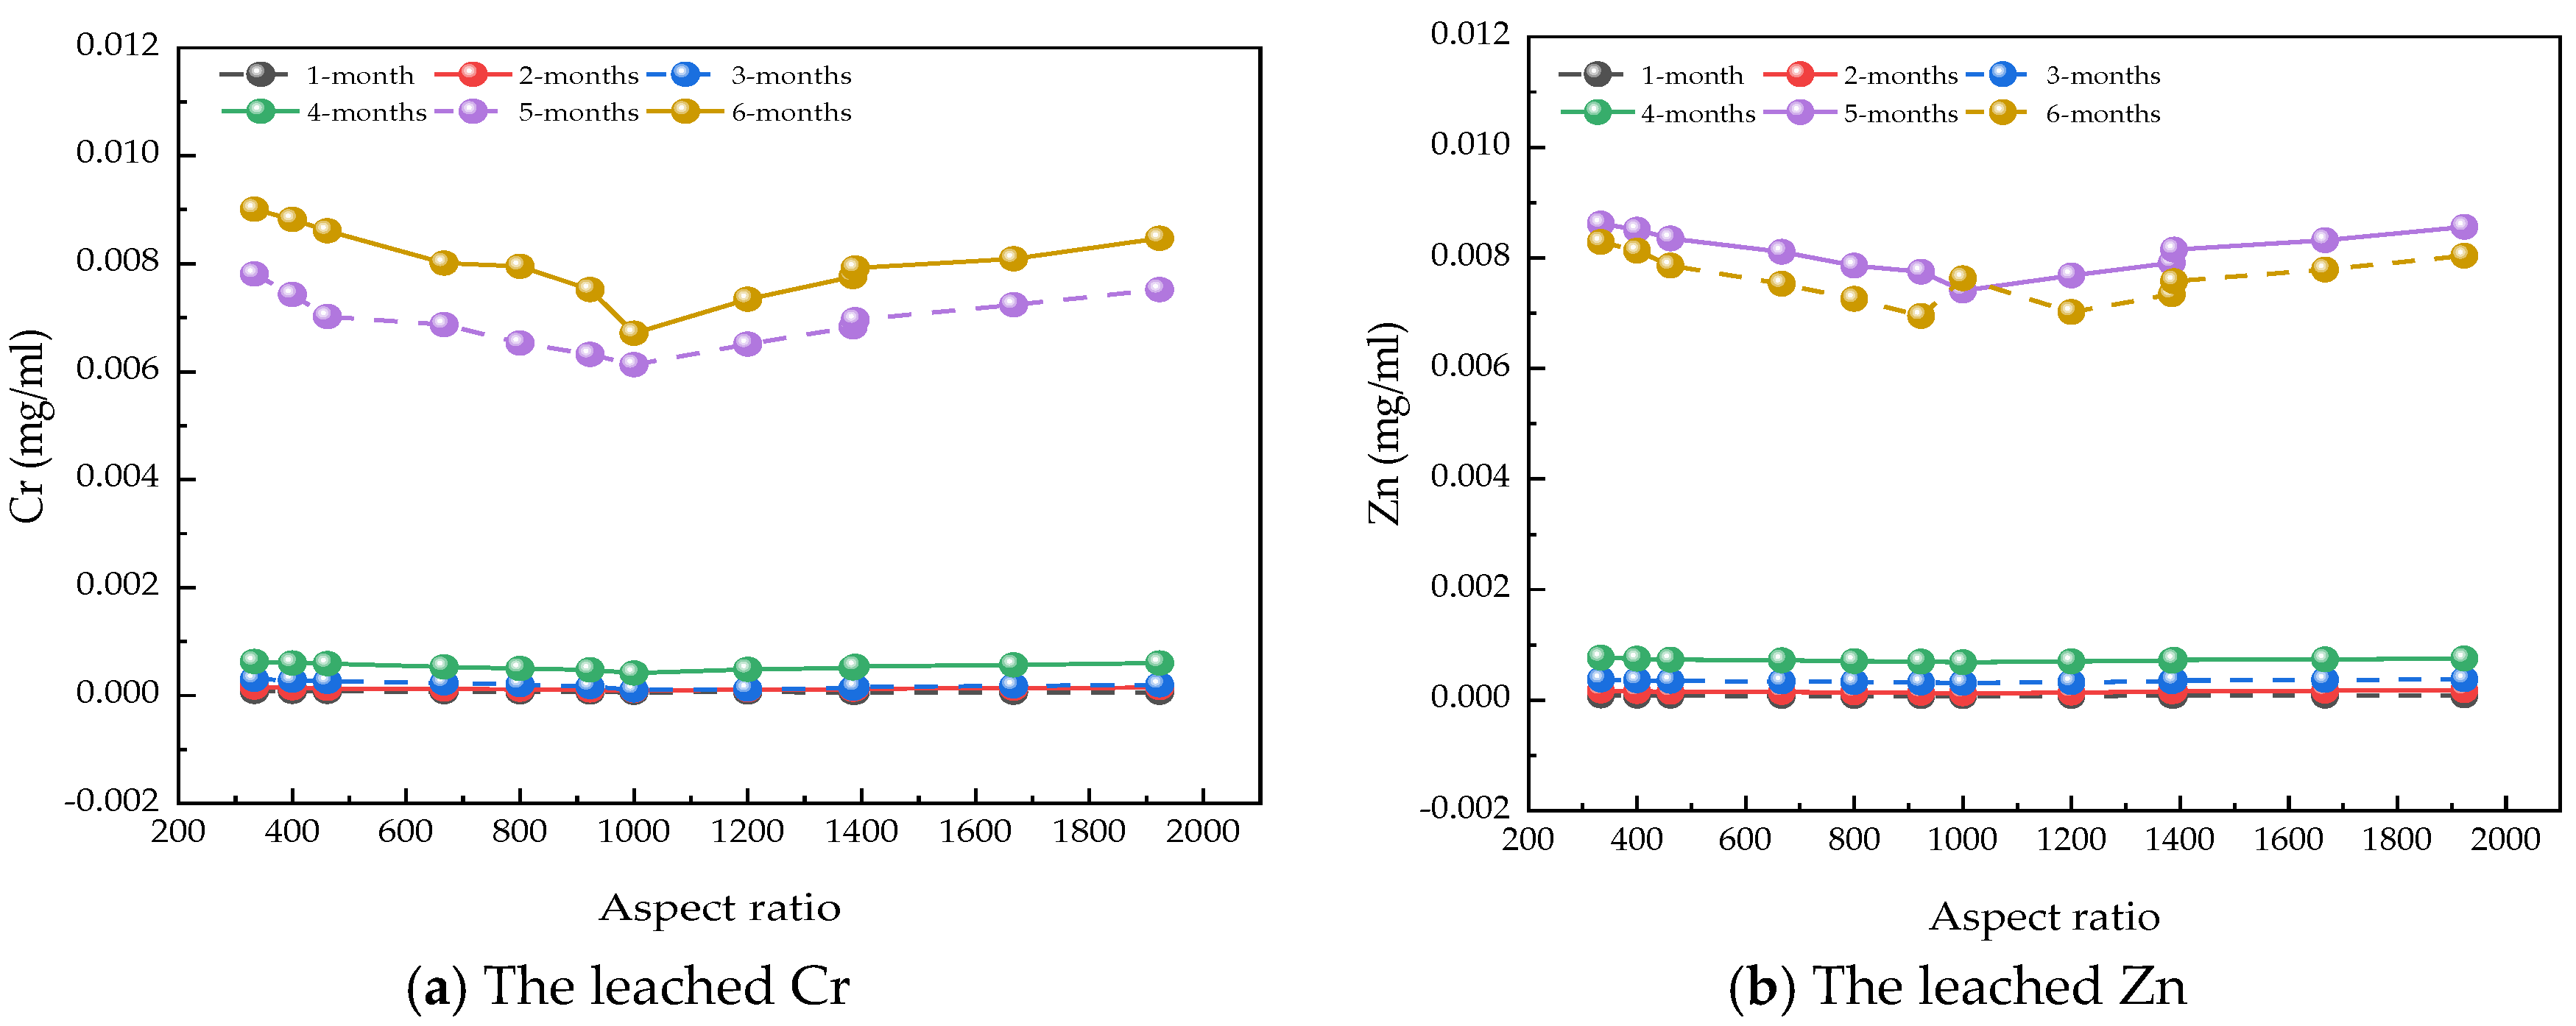
3.4. The Amount of Leached Cr and Zn
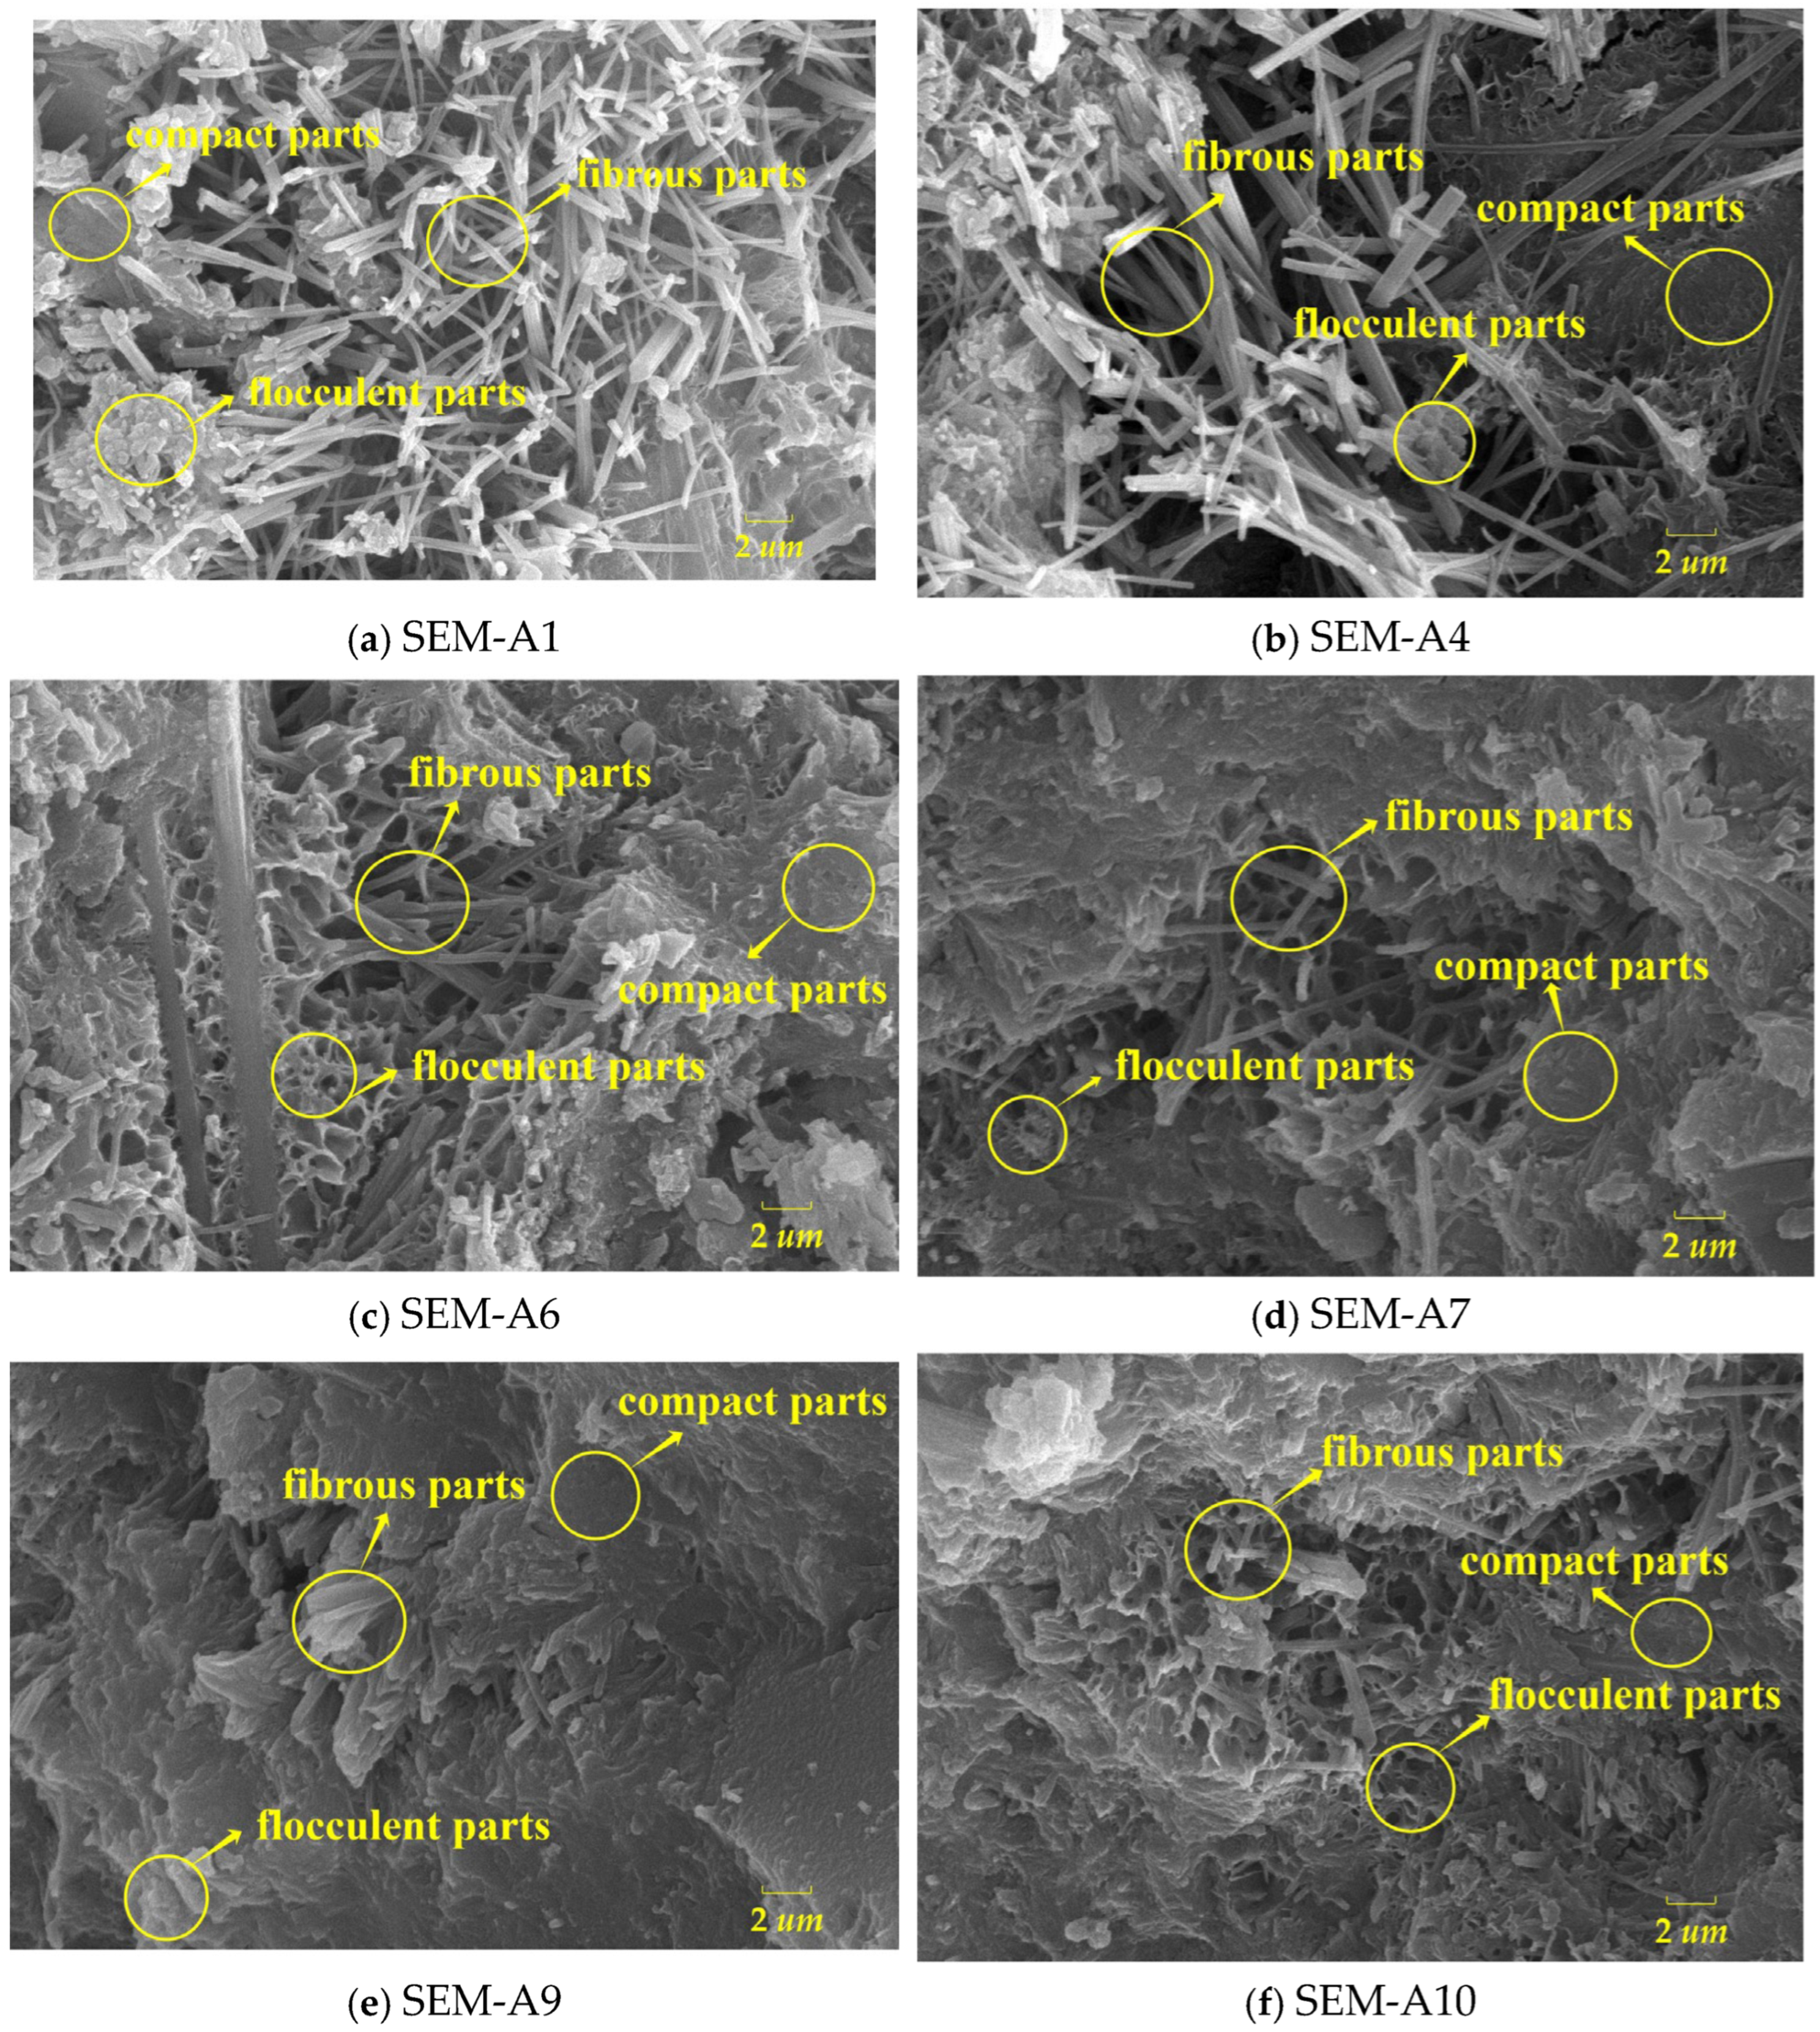
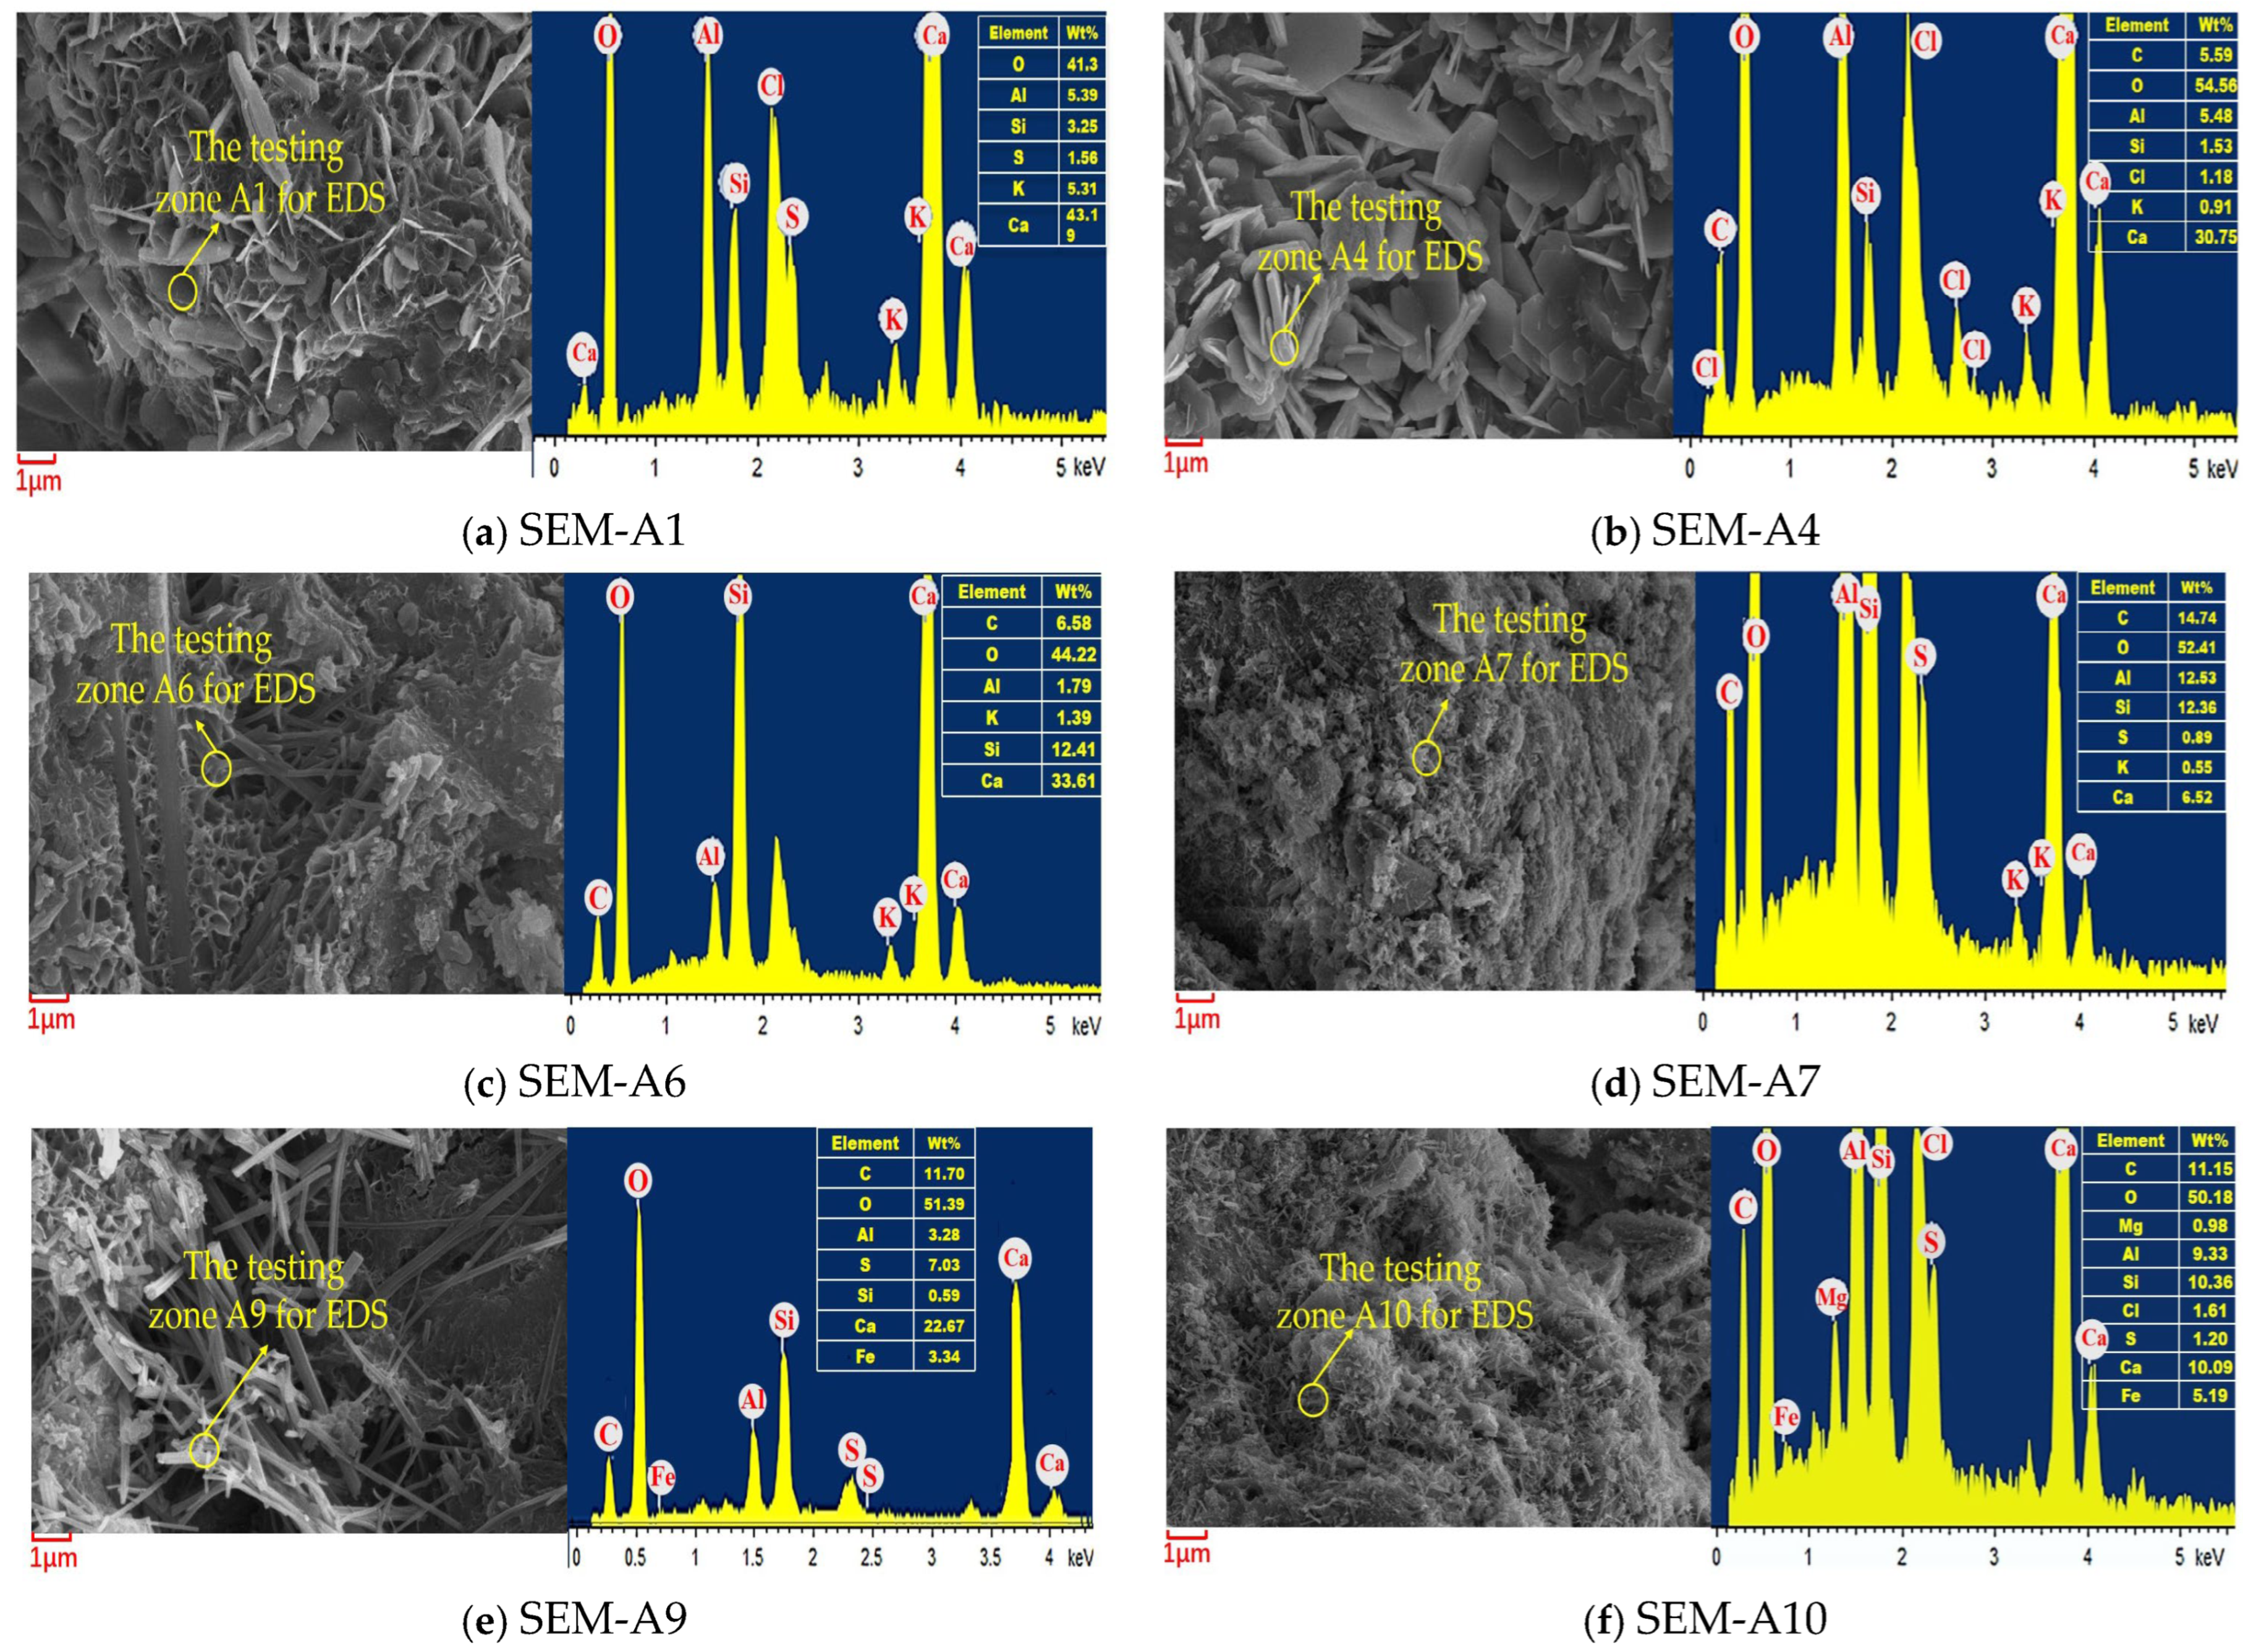
3.5. The Microscopic Analysis
4. Conclusions
Author Contributions
Funding
Institutional Review Board Statement
Informed Consent Statement
Data Availability Statement
Conflicts of Interest
Appendix A

| Maximum flexural strength | 20.7 | Curing age | 90 |
| Maximum compressive strength | 88.5 | Curing age | 90 |
| Maximum bonding strength | 7.5 | Curing age | 90 |
| Maximum flexural strength | 23.1 | Fibers volume ratios | 2 |
| Maximum compressive strength | 97.3 | Fibers volume ratios | 2 |
| Maximum bonding strength | 8.9 | Fibers volume ratios | 2 |
| Maximum flexural strength | 22.6 | aspect ratios | 1000 |
| Maximum compressive strength | 96.8 | aspect ratio | 1000 |
| Maximum bonding strength | 8.8 | aspect ratios | 1000 |
| Diameter (mm) | Length (mm) | Aspect Ratio (%) | Flexural Strength (Mpa) | ||||||
|---|---|---|---|---|---|---|---|---|---|
| 0.5 Days | 1 Days | 3 Days | 7 Days | 28 Days | 60 Days | 90 Days | |||
| 13 | 6000 | 461.54 | 6.6 | 8 | 12.3 | 14.2 | 17.9 | 18.9 | 6.6 |
| 13 | 12,000 | 923.08 | 7.1 | 8.5 | 12.7 | 14.6 | 18.4 | 19.4 | 7.1 |
| 13 | 18,000 | 1384.62 | 6.9 | 8.5 | 12.5 | 14.4 | 18.1 | 19.1 | 6.9 |
| 13 | 25,000 | 1923.08 | 6.5 | 8.1 | 12.1 | 13.8 | 17.5 | 18.4 | 6.5 |
| 15 | 6000 | 400.00 | 6.4 | 7.9 | 12 | 14 | 17.8 | 18.7 | 6.4 |
| 15 | 12,000 | 800.00 | 6.9 | 8.3 | 12.5 | 14.5 | 18.3 | 19.3 | 6.9 |
| 15 | 18,000 | 1200.00 | 7 | 8.6 | 12.7 | 14.6 | 18.3 | 19.3 | 7 |
| 15 | 25,000 | 1666.67 | 6.7 | 8.3 | 12.3 | 13.9 | 17.7 | 18.6 | 6.7 |
| 18 | 6000 | 333.33 | 6.3 | 7.9 | 11.9 | 13.7 | 17.6 | 18.3 | 6.3 |
| 18 | 12,000 | 666.67 | 6.8 | 8.2 | 12.3 | 14.3 | 18.1 | 19.1 | 6.8 |
| 18 | 18,000 | 1000.00 | 7.3 | 8.6 | 12.8 | 14.7 | 18.6 | 19.5 | 7.3 |
| 18 | 25,000 | 1388.89 | 6.8 | 8.4 | 12.4 | 14.2 | 17.8 | 18.9 | 20.9 |
| Diameter (mm) | Length (mm) | Aspect Ratio (%) | Compressive Strength (Mpa) | ||||||
|---|---|---|---|---|---|---|---|---|---|
| 0.5 Days | 1 Days | 3 Days | 7 Days | 28 Days | 60 Days | 90 Days | |||
| 13 | 6000 | 461.54 | 63.4 | 68.1 | 74.3 | 78.1 | 88.9 | 90.3 | 63.4 |
| 13 | 12,000 | 923.08 | 66.5 | 71.4 | 77.8 | 82.4 | 90.6 | 93.4 | 66.5 |
| 13 | 18,000 | 1384.62 | 66.5 | 71.8 | 76.1 | 81.1 | 90.3 | 92.4 | 66.5 |
| 13 | 25,000 | 1923.08 | 62.6 | 67.6 | 73.5 | 77.4 | 85.8 | 87.6 | 88.6 |
| 15 | 6000 | 400.00 | 62.2 | 67.3 | 72.5 | 77.6 | 86.7 | 87.5 | 62.2 |
| 15 | 12,000 | 800.00 | 65.1 | 70.5 | 76.7 | 81.3 | 90.1 | 92.3 | 65.1 |
| 15 | 18,000 | 1200.00 | 67.1 | 72.6 | 77.5 | 81.7 | 91.1 | 92.8 | 67.1 |
| 15 | 25,000 | 1666.67 | 63.7 | 69.8 | 74.3 | 78.1 | 87.2 | 88.9 | 63.7 |
| 18 | 6000 | 333.33 | 61.3 | 66.8 | 71.8 | 74.6 | 85.1 | 86.9 | 61.3 |
| 18 | 12,000 | 666.67 | 63.8 | 69.2 | 75.9 | 79.5 | 89.3 | 91.2 | 63.8 |
| 18 | 18,000 | 1000.00 | 68.7 | 73.9 | 79.7 | 83.7 | 91.3 | 93.6 | 68.7 |
| 18 | 25,000 | 1388.89 | 65.3 | 70.3 | 75.4 | 80.2 | 88.7 | 91.7 | 93.4 |
| Diameter (mm) | Length (mm) | Aspect Ratio (%) | Cr (mg/mL) | |||||
|---|---|---|---|---|---|---|---|---|
| 1-Month | 2-Months | 3-Months | 4-Months | 5-Months | 6-Months | |||
| 13 | 6000 | 461.54 | 0.0000742 | 0.000131 | 0.000261 | 0.000589 | 0.00702 | 0.00861 |
| 13 | 12,000 | 923.08 | 0.0000631 | 0.000103 | 0.000167 | 0.000476 | 0.00632 | 0.00752 |
| 13 | 18,000 | 1384.62 | 0.0000607 | 0.000117 | 0.000136 | 0.000513 | 0.00683 | 0.00776 |
| 13 | 25,000 | 1923.08 | 0.0000607 | 0.000148 | 0.000198 | 0.000601 | 0.00752 | 0.00847 |
| 15 | 6000 | 400.00 | 0.0000751 | 0.000143 | 0.000287 | 0.000601 | 0.00743 | 0.00882 |
| 15 | 12,000 | 800.00 | 0.0000689 | 0.000114 | 0.000203 | 0.000501 | 0.00653 | 0.00795 |
| 15 | 18,000 | 1200.00 | 0.0000658 | 0.000106 | 0.000121 | 0.000482 | 0.00651 | 0.00734 |
| 15 | 25,000 | 1666.67 | 0.0000607 | 0.000134 | 0.000179 | 0.000569 | 0.00724 | 0.00809 |
| 18 | 6000 | 333.33 | 0.0000768 | 0.000157 | 0.000302 | 0.000632 | 0.00781 | 0.00901 |
| 18 | 12,000 | 666.67 | 0.0000721 | 0.000121 | 0.000235 | 0.000532 | 0.00687 | 0.00801 |
| 18 | 18,000 | 1000.00 | 0.0000607 | 0.000095 | 0.000102 | 0.000415 | 0.00613 | 0.00671 |
| 18 | 25,000 | 1388.89 | 0.0000607 | 0.000128 | 0.000158 | 0.000538 | 0.00696 | 0.00792 |
| 13 | 6000 | 461.54 | 0.0000742 | 0.000131 | 0.000261 | 0.000589 | 0.00702 | 0.00861 |
| Diameter (mm) | Length (mm) | Aspect Ratio (%) | Zn (mg/mL) | |||||
|---|---|---|---|---|---|---|---|---|
| 1-Month | 2-Months | 3-Months | 4-Months | 5-Months | 6-Months | |||
| 13 | 6000 | 461.54 | 0.0000782 | 0.000151 | 0.000349 | 0.000732 | 0.00835 | 0.00786 |
| 13 | 12,000 | 923.08 | 0.0000732 | 0.000131 | 0.000319 | 0.000698 | 0.00775 | 0.00695 |
| 13 | 18,000 | 1384.62 | 0.0000779 | 0.000161 | 0.000342 | 0.000714 | 0.00791 | 0.00734 |
| 13 | 25,000 | 1923.08 | 0.0000826 | 0.000178 | 0.000376 | 0.000755 | 0.00856 | 0.00804 |
| 15 | 6000 | 400.00 | 0.0000805 | 0.000163 | 0.000361 | 0.000751 | 0.00851 | 0.00813 |
| 15 | 12,000 | 800.00 | 0.0000745 | 0.000138 | 0.000328 | 0.000706 | 0.00786 | 0.00726 |
| 15 | 18,000 | 1200.00 | 0.0000761 | 0.000136 | 0.000327 | 0.000701 | 0.00768 | 0.00702 |
| 15 | 25,000 | 1666.67 | 0.0000812 | 0.000171 | 0.000366 | 0.000736 | 0.00832 | 0.00779 |
| 18 | 6000 | 333.33 | 0.0000831 | 0.000175 | 0.000372 | 0.000768 | 0.00862 | 0.00829 |
| 18 | 12,000 | 666.67 | 0.0000751 | 0.000149 | 0.000337 | 0.000721 | 0.00811 | 0.00753 |
| 18 | 18,000 | 1000.00 | 0.0000713 | 0.000124 | 0.000312 | 0.000687 | 0.00741 | 0.00763 |
| 18 | 25,000 | 1388.89 | 0.0000793 | 0.000166 | 0.000358 | 0.000728 | 0.00815 | 0.00758 |
References
- Suescum-Morales, D.; Silva, R.V.; Bravo, M.; Jiménez, J.R.; Fernández-Rodríguez, J.M.; Brito, J.D. Effect of incorporating municipal solid waste incinerated bottom ash in alkali-activated fly ash concrete subjected to accelerated CO2 curing. J. Clean. Prod. 2022, 370, 133533. [Google Scholar] [CrossRef]
- Wang, F.; Du, H.; Zheng, Z.; Xu, D.; Wang, Y.; Li, N.; Ni, W.; Ren, C. The Impact of Fly Ash on the Properties of Cementitious Materials Based on Slag-Steel Slag-Gypsum Solid Waste. Materials 2024, 17, 4696. [Google Scholar] [CrossRef] [PubMed]
- Shettima, A.U.; Hussin, M.W.; Ahmad, Y.; Mirza, J. Evaluation of iron ore tailings as replacement for fine aggregate in concrete. Constr. Build. Mater. 2016, 120, 72–79. [Google Scholar] [CrossRef]
- Carmignano, O.R.; Vieira, S.S.; Teixeira, A.P.C.; Lameiras, F.S.; Brandão, P.R.G.; Lago, R.M. Iron Ore Tailings: Characterization and Applications. J. Braz. Chem. Soc. 2021, 32, 1895–1911. [Google Scholar] [CrossRef]
- Pan, H.J.; Zhou, G.H.; Cheng, Z.Z.; Yang, R.; He, L.; Zeng, D.M.; Sun, B.B. Advances in geochemical survey of mine tailings project in China. J. Geochem. Explor. 2014, 139, 193–200. [Google Scholar] [CrossRef]
- Xu, F.; Li, Z.; Li, T.; Wang, S. The Mechanical Properties and Microstructure of Tailing Recycled Aggregate Concrete. Materials 2024, 17, 1058. [Google Scholar] [CrossRef]
- Bessa, S.; Duarte, M.; Lage, G.; Mendonça, I.; Galery, R.; Lago, R.; Texeira, A.P.; Lameiras, F.; Aguilar, M.T. Characterization and Analysis of Iron Ore Tailings Sediments and Their Possible Applications in Earthen Construction. Buildings 2024, 14, 362. [Google Scholar] [CrossRef]
- Zhang, S.; Xue, X.; Liu, X.; Duan, P.; Yang, H.; Jiang, T.; Wang, D.; Liu, R. Current situation and comprehensive utilization of iron ore tailing resources. J. Min. Sci. 2006, 42, 403–408. [Google Scholar] [CrossRef]
- Tian, Z.X.; Zhao, Z.H.; Dai, C.Q.; Liu, S.J. Experimental Study on the Properties of Concrete Mixed with Iron Ore Tailings. Adv. Mater. Sci. Eng. 2016, 2016, 8606505. [Google Scholar] [CrossRef]
- Yoshimura, H.N.; Abreu, A.P.; Molisani, A.L.; Camargo, A.C.; Portela, J.C.S.; Narita, N.E. Evaluation of aluminum dross waste as raw material for refractories. Ceram. Int. 2008, 34, 581–591. [Google Scholar] [CrossRef]
- Socrates, P.M.P.; Juan, M.G.C. Influence of the secondary aluminum chip on the physical and mechanical properties of concrete. Innov. Infrastruct. Solut. 2023, 8, 45. [Google Scholar]
- Liu, B.; Liu, X.; Jia, B.; Yan, Q.; Yang, Z. Study on Mechanical Properties and Safety of Ultra-Thin Reactive Powder Concrete Prefabricated Slabs Applied to I-Beam Joints of Bridges. Buildings 2024, 14, 3456. [Google Scholar] [CrossRef]
- Wang, J.; Li, J.; Gao, Y.; Lu, Z.; Hou, L. Mechanical and Drying Shrinkage Performance Study of Ultra-High-Performance Concrete Prepared from Titanium Slag under Different Curing Conditions. Materials 2024, 17, 4201. [Google Scholar] [CrossRef] [PubMed]
- Du, Y.; Hao, W.; Shi, F.; Wang, H.; Xu, F.; Du, T. Investigations of the Mechanical Properties and Durability of Reactive Powder Concrete Containing Waste Fly Ash. Buildings 2022, 12, 560. [Google Scholar] [CrossRef]
- Chen, Z.; Chen, S.L.; Zhou, Y.W.; Zhang, C.Y.; Meng, T.T.; Jiang, S.S.; Liu, L.W.; Hu, G.Q. The application of iron tailings in cement concrete can effectively increase the mechanical strength of cement concrete. Constr. Build. Mater. 2022, 338, 127584. [Google Scholar] [CrossRef]
- Satish, R.; Neeraja, D. Mechanical and durability aspects of concrete incorporating secondary aluminium slag. Resour.-Effic. Technol. 2016, 2, 225–232. [Google Scholar]
- Peng, L.; Yang, J.; Wang, H.; Jin, X. The Influence of CO2 Curing on the Mechanical Performance and the Corresponding Chloride Ion Resistance of Alkali-Activated Compound Mineral Admixtures. Coatings 2022, 12, 1920. [Google Scholar] [CrossRef]
- Sumitomo, G.S.; Pimentel, L.L.; Jacintho, A.E.P.G.A.; Forti, N.C.S. Study of Ultra-High Performance Concrete Mechanical Behavior under High Temperatures. Materials 2024, 17, 4212. [Google Scholar] [CrossRef]
- Zhang, Y.; Sun, H.; Qian, X.; Wang, J.; Tan, G. Research on the Electrosensitivity and Electrothermal Properties of Intelligent High-Performance Concrete Materials. Materials 2024, 17, 54. [Google Scholar] [CrossRef]
- Hussain, S.; Matthews, J.; Amritphale, S.; Edwards, R.; Matthews, E.; Paul, N.; Kraft, J. Influence of Steel and Poly Vinyl Alcohol Fibers on the Development of High-Strength Geopolymer Concrete. Minerals 2024, 14, 1007. [Google Scholar] [CrossRef]
- Kočí, V.; Vejmelková, E.; Koňáková, D.; Pommer, V.; Grzeszczyk, S.; Matuszek-Chmurowska, A.; Mordak, A.; Černý, R. Basic physical, mechanical, thermal and hygric properties of reactive powder concrete with basalt and polypropylene fibers after high-temperature exposure. Constr. Build. Mater. 2023, 374, 130922. [Google Scholar] [CrossRef]
- Wen, B.; Gao, G.; Huang, D.; Zheng, H. Adhesion and Sliding Constitutive Relationship between Basalt–Polypropylene Hybrid Fiber-Reinforced Concrete and Steel Bars. Appl. Sci. 2023, 13, 12108. [Google Scholar] [CrossRef]
- Li, G.; Zhang, L.; Zhao, F.; Tang, J. Acoustic Emission Characteristics and Damage Mechanisms Investigation of Basalt Fiber Concrete with Recycled Aggregate. Materials 2020, 13, 4009. [Google Scholar] [CrossRef] [PubMed]
- Guo, Y.; Gao, J.; Lv, J. Experimental Study on the Frost Resistance of Basalt Fiber Reinforced Concrete. Materials 2024, 17, 4593. [Google Scholar] [CrossRef]
- GB/T 2419-2005; Test Method for Fluidity of Cement Mortar. National Cement Standardization Technical Committee: Beijing, China, 2005.
- GB/T1346-2001; Test Methods for Water Requirement of Normal Consistency, Setting Time and Soundness of the Portland Cements. National Cement Standardization Technical Committee: Beijing, China, 2001.
- GB/T 17671-2021; Method for Testing the Strength of Cement Mortar. National Cement Standardization Technical Committee: Beijing, China, 2021.
- Sucharda, O.; Gandel, R.; Cmiel, P.; Jerabek, J.; Bilek, V. Utilization of High-Performance Concrete Mixtures for Advanced Manufacturing Technologies. Buildings 2024, 14, 2269. [Google Scholar] [CrossRef]
- Pu, C.A. Study on the Activation Process and Mechanism of Iron Tailings Powder and its Influence on the Performance of Concrete. Doctoral Dissertation, China University of Mining & Technology, Beijing, China, 2018. [Google Scholar]
- Xu, J.; Wang, H.; Wang, W.; Shi, F. The Influence of CO2-Cured Incinerated Waste Fly Ash on the Performance of Reactive Powder Concrete. Coatings 2023, 13, 709. [Google Scholar] [CrossRef]
- Tran, H.; Sorelli, L.; Hisseine, O.A.; Bouchard, D.; Brail, V.; Sanchez, T.; Conciatori, D.; Ouellet-Plamondon, C. Development of sustainable ultra-high performance concrete recycling aluminum production waste. Constr. Build. Mater. 2023, 371, 130212. [Google Scholar] [CrossRef]
- Lv, Y.; Yang, L.; Wang, J.; Zhan, B.; Xi, Z.; Qin, Y.; Liao, D. Performance of ultra-high-performance concrete incorporating municipal solid waste incineration fly ash. Case Stud. Constr. Mater. 2022, 17, e01155. [Google Scholar] [CrossRef]
- Xu, F.; Chang, R.; Zhang, D.; Liang, Z.; Wang, K.; Wang, H. Improvement of CO2-Cured Sludge Ceramsite on the Mechanical Performances and Corrosion Resistance of Cement Concrete. Materials 2022, 15, 5758. [Google Scholar] [CrossRef]
- Bai, L.; Liu, H.; Wang, H. The Influence of CO2-Cured Boiler Cinder on the Mechanical Strength of RPC Exposed to NaCl Erosion. Coatings 2023, 13, 1021. [Google Scholar] [CrossRef]
- Jiang, H.; Wang, W.; Wang, H. The Corrosion Resistance of Reinforced Reactive Powder Concrete with Secondary Aluminum Ash Exposed to NaCl Action. Materials 2023, 16, 5615. [Google Scholar] [CrossRef] [PubMed]
- Kiventerä, J.; Perumal, P.; Yliniemi, J.; Illikainen, M. Mine tailings as a raw material in alkali activation: A review. Int. J. Minerals. Metall. Mater. 2020, 27, 1009–1020. [Google Scholar] [CrossRef]
- Cai, C.; Lou, K.; Qian, F.; Xiao, P. Influence of Basalt Fiber Morphology on the Properties of Asphalt Binders and Mixtures. Materials 2024, 17, 5358. [Google Scholar] [CrossRef]
- Gigante, V.; Cartoni, F.; Dal Pont, B.; Aliotta, L. Extrusion Parameters Optimization and Mechanical Properties of Bio-Polyamide 11-Based Biocomposites Reinforced with Short Basalt Fibers. Polymers 2024, 16, 3092. [Google Scholar] [CrossRef] [PubMed]
- Zhao, C.; Jiang, G.; Guo, J.; Yu, S.; Ma, Z.; Zhuang, C.; Lei, Y.; Liang, Z. Investigating the Mechanical Characteristics and Fracture Morphologies of Basalt Fiber Concrete: Insights from Uniaxial Compression Tests and Meshless Numerical Simulations. Materials 2024, 17, 5258. [Google Scholar] [CrossRef]
- He, Z.; Zhao, X.; Ye, M.; Zuo, W.; Nie, X.; Zhao, J. Study on the Effect of Basalt Fiber Content and Length on Mechanical Properties and Durability of Coal Gangue Concrete. Sustainability 2024, 16, 9310. [Google Scholar] [CrossRef]
- Gong, Y.; Hua, Q.; Wu, Z.; Yu, Y.; Kang, A.; Chen, X.; Dong, H. Effect of Basalt/Steel Individual and Hybrid Fiber on Mechanical Properties and Microstructure of UHPC. Materials 2024, 17, 3299. [Google Scholar] [CrossRef]
- Liang, Z.; Peng, X.; Wang, H. The Influence of Aspect Ratio of Steel Fibers on the Conductive and Mechanical Properties of Compound Cement Reactive Powder Concrete. Coatings 2023, 13, 331. [Google Scholar] [CrossRef]
- Lou, B.J.; Shen, H.L.; Liu, B.; Liu, J.; Zhang, S.G. Recycling secondary aluminum dross to make building materials: A review. Constr. Build. Mater. 2023, 409, 133989. [Google Scholar] [CrossRef]
- Almeida, V.O.; Silvestro, L.; Gleize, P.J.; Kirchheim, A.P.; Schneider, I.A. Application of leached iron ore tailings to produce sustainable cements. Constr. Build. Mater. 2023, 377, 131095. [Google Scholar] [CrossRef]
- Mishra, O.; Singh, S.P. An overview of microstructural and material properties of ultra-high-performance concrete. J. Sustain. Cem.-Based Mater. 2019, 8, 97–143. [Google Scholar] [CrossRef]
- Han, F.; Song, S.; Liu, J.; Huang, S. Properties of steam-cured precast concrete containing iron tailing powder. Powder Technol. 2019, 345, 292–299. [Google Scholar] [CrossRef]
- Rotana, H.; Claudia, P.O. On utilization and mechanisms of waste aluminium in mitigating alkali-silica reaction (ASR) in concrete. J. Clean. Prod. 2019, 212, 864–879. [Google Scholar]
- Kaliyavaradhan, S.K.; Li, L.F.; Ling, T.C. Response surface methodology for the optimization of CO2 uptake using waste concrete powder. Constr. Build. Mater. 2022, 340, 127758. [Google Scholar] [CrossRef]
- Zhu, Y.; He, Y.; Yuan, X.; Gao, J.; Wang, Z. Experimental Study on the Mechanical Properties of Basalt Fiber Geogrids Reinforced with Cement-Stabilized Macadam. Coatings 2024, 14, 1349. [Google Scholar] [CrossRef]
- Ahmed, T.; Bediwy, A.; Azzam, A.; Elhadary, R.; El-Salakawy, E.; Bassuoni, M.T. Utilization of Novel Basalt Fiber Pellets from Micro-to Macro-Scale, and from Basic to Applied Fields: A Review on Recent Contributions. Fibers 2024, 12, 17. [Google Scholar] [CrossRef]
- Zhang, S.Y.; Wang, K.; Li, H.; Zhang, X.Q.; Jiang, Y.L. Novel SCMs produced by the calcination of secondary aluminium dross with dolomite and their potential usage in cemented paste backfill. Constr. Build. Mater. 2023, 365, 130119. [Google Scholar] [CrossRef]
- AL-Ameeri, A.S.; ImranRafifiq, M.; Tsioulou, O.; Rybdylova, O. Impact of climate change on the carbonation in concrete due to carbon dioxide ingress: Experimental investigation and modelling. J. Build. Eng. 2021, 44, 102594. [Google Scholar] [CrossRef]
- Wan, S.; Shu, Z.; Kang, S.; Zhong, W.; Zhang, X.; Wu, H.; Liu, R. Microbial-Induced Calcium Carbonate Precipitation and Basalt Fiber Cloth Reinforcement Used for Sustainable Repair of Tunnel Lining Cracks. Buildings 2024, 14, 3609. [Google Scholar] [CrossRef]
- Qsymah, A.; Ayasrah, M. Finite Element Analysis of Two-Way Reinforced Concrete Slabs Strengthened with FRP Under Flexural Loading. Buildings 2024, 14, 3389. [Google Scholar] [CrossRef]
- Biswas, R.K.; Bin Ahmed, F.; Haque, M.E.; Provasha, A.A.; Hasan, Z.; Hayat, F.; Sen, D. Effects of Steel Fiber Percentage and Aspect Ratios on Fresh and Harden Properties of Ultra-High Performance Fiber Reinforced Concrete. Appl. Mech. 2021, 2, 501–515. [Google Scholar] [CrossRef]
- Bzeni, D.K. Investigating the Influence of Fiber Content and Geometry on the Flexural Response of Fiber-Reinforced Cementitious Composites. J. Compos. Sci. 2024, 8, 347. [Google Scholar] [CrossRef]
- Hoang, L.A.; Fehling, E. Influence of steel fiber content and aspect ratio on the uniaxial tensile and compressive behavior of ultra high performance concrete. Constr. Build. Mater. 2017, 153, 790–806. [Google Scholar] [CrossRef]


| Types | Particle Size/μm | ||||||
|---|---|---|---|---|---|---|---|
| 0.3 | 0.6 | 1 | 4 | 8 | 64 | 360 | |
| ITP | 0.28 | 0.45 | 2.48 | 16.37 | 34.12 | 97.11 | 100 |
| P·O cement | 0.13 | 0.31 | 2.59 | 15.07 | 28.64 | 93.31 | 100 |
| SAA | 0.04 | 0.38 | 0.62 | 1.13 | 3.92 | 25.85 | 100 |
| SF | 31.24 | 58.38 | 82.24 | 99.8 | 99.8 | 99.8 | 100 |
| Quartz sand | 0 | 0 | 0 | 0 | 0.06 | 20.98 | 100 |
| Types | SiO2 | Al2O3 | FexOy | MgO | CaO | SO3 | K2O | Na2O | Ti2O | CdO | Cr2O3 | PbO | CuO | ZnO | Loss on Ignition |
|---|---|---|---|---|---|---|---|---|---|---|---|---|---|---|---|
| ITP | 28.34 | 4.88 | 13.89 | - | 19.56 | 7.54 | 1.02 | 1.46 | 1.01 | 0.07 | 0.09 | 0.09 | 0.09 | 0.5 | 21.46 |
| P·O cement | 21.76 | 6.59 | 4.79 | 2.8 | 61.27 | 2.77 | - | - | - | - | - | - | - | - | 3.12 |
| SAA | 5.55 | 79.51 | 4.86 | 6.64 | 2.49 | - | - | 0.95 | - | - | - | - | - | - | - |
| SF | 90.81 | 0.21 | 0.63 | 0.24 | 0.43 | 0.2 | 7.49 | - | - | - | - | - | - | - | - |
| Quartz sand | 99.6 | - | 0.4 | - | - | - | - | - | - | - | - | - | - | - | - |
| Group | Water | P·O Cement | CO2-Cured Iron Tailings Powder | CO2-Cured Secondary Aluminum Dross | SF | Quartz Sand | Water-Reducer |
|---|---|---|---|---|---|---|---|
| A1 | 243.8 | 1108 | 0 (0%) | 0 (0%) | 111.1 | 1219.1 | 18.1 |
| A2 | 243.8 | 1108 | 0 (0%) | 122.2 (10%) | 111.1 | 1219.1 | 18.1 |
| A3 | 243.8 | 1108 | 0 (0%) | 244.4 (20%) | 111.1 | 1219.1 | 18.1 |
| A4 | 243.8 | 1108 | 0 (0%) | 366.6 (30%) | 111.1 | 1219.1 | 18.1 |
| A5 | 243.8 | 985.8 | 122.2 (10%) | 0 (0%) | 111.1 | 1219.1 | 18.1 |
| A6 | 243.8 | 985.8 | 122.2 (10%) | 122.2 (10%) | 111.1 | 1219.1 | 18.1 |
| A7 | 243.8 | 985.8 | 122.2 (10%) | 244.4 (20%) | 111.1 | 1219.1 | 18.1 |
| A8 | 243.8 | 863.6 | 244.4 (20%) | 0 (0%) | 111.1 | 1219.1 | 18.1 |
| A9 | 243.8 | 863.6 | 244.4 (20%) | 122.2 (10%) | 111.1 | 1219.1 | 18.1 |
| A10 | 243.8 | 863.6 | 366.6 (30%) | 0 (0%) | 111.1 | 1219.1 | 18.1 |
| Equation | Types | a | b | c | d | R2 |
|---|---|---|---|---|---|---|
| A1 | 206.86 | −1.06 | 0.009 | −9.880 × 10⁻⁵ | 0.997 | |
| A2 | 213.97 | −0.53 | 0.001 | −4.94 × 10⁻⁵ | 0.999 | |
| A3 | 223.08 | −0.38 | −0.004 | 4.94 × 10⁻⁵ | 0.995 | |
| A4 | 256.79 | −0.22 | −0.22 | −2.22 × 10⁻⁴ | 0.993 | |
| S = a + bt + ct2+ dt3 | A5 | 220.73 | −0.81 | −0.008 | −7.41 × 10⁻⁵ | 0.975 |
| A6 | 235.84 | −1.08 | 0.009 | −2.47 × 10⁻⁵ | 0.992 | |
| A7 | 248.01 | −0.48 | −0.009 | 7.41 × 10⁻⁵ | 0.999 | |
| A8 | 217.83 | −0.96 | 9.52 | −4.68 × 10⁻¹⁹ | 0.995 | |
| A9 | 221.81 | −0.37 | −0.007 | 2.47 × 10⁻⁵ | 0.992 | |
| A10 | 220.07 | −0.20 | −0.005 | −2.47 × 10⁻⁵ | 0.998 |
| Equation | Types | a | b | c | d | R2 |
|---|---|---|---|---|---|---|
| ft = a + bV + cV2+ dV3 | 0.5 d | 17.55 | −0.33 | 1.24 | −0.35 | 0.959 |
| 1 d | 7.82 | −0.54 | 1.30 | −0.37 | 0.950 | |
| 3 d | 11.70 | −0.04 | 0.95 | −0.29 | 0.999 | |
| 7 d | 13.63 | −0.71 | 1.60 | −0.43 | 0.983 | |
| 28 d | 17.55 | −0.33 | 1.24 | −0.35 | 0.935 | |
| 60 d | 18.14 | −0.75 | 1.83 | −0.52 | 0.932 | |
| 90 d | 19.58 | −0.13 | 2.35 | −0.76 | 0.996 | |
| fcu = a + bV + cV2+ dV3 | 0.5 d | 60.23 | −1.86 | 8.41 | −2.46 | 0.978 |
| 1 d | 63.99 | −4.73 | 12.39 | −3.56 | 0.92 | |
| 3 d | 70.61 | −0.59 | 8.06 | −2.52 | 0.994 | |
| 7 d | 72.00 | −1.02 | 10.10 | −3.12 | 0.969 | |
| 28 d | 83.24 | −0.76 | 6.98 | −2.14 | 0.962 | |
| 60 d | 85.78 | −2.33 | 8.57 | −2.51 | 0.976 | |
| 90 d | 88.62 | −2.99 | 9.34 | −2.78 | 0.908 | |
| fb = a + bV + cV2+ dV3 | 0.5 d | 0.69 | 0.31 | 0.45 | −0.17 | 0.991 |
| 1 d | 1.94 | −0.19 | 1.48 | −0.48 | 0.948 | |
| 3 d | 2.93 | −0.22 | 1.37 | −0.43 | 0.957 | |
| 7 d | 4.62 | 0.06 | 0.74 | −0.20 | 0.967 | |
| 28 d | 6.93 | −0.40 | 1.29 | −0.40 | 0.943 | |
| 60 d | 7.11 | −0.16 | 1.06 | −0.36 | 0.981 | |
| 90 d | 7.52 | −0.08 | 1.29 | −0.45 | 0.983 |
| Equation | Types | a | b | c | d | R2 |
|---|---|---|---|---|---|---|
| ft = a + bAR + cAR2+ dAR3 | 0.5 d | 4.99 | 4.91 × 10⁻³ | −3.48 × 10⁻⁶ | 7.42 × 10⁻¹⁰ | 0.866 |
| 1 d | 7.18 | 2.27 × 10⁻³ | −9.92 × 10⁻⁷ | 2.62 × 10⁻¹¹ | 0.910 | |
| 3 d | 10.78 | 0.01 | −2.95 × 10⁻⁶ | 5.67 × 10⁻¹⁰ | 0.839 | |
| 7 d | 12.25 | 0.01 | −4.51 × 10⁻⁶ | 9.63 × 10⁻¹⁰ | 0.888 | |
| 28 d | 16.01 | 0.01 | −4.93 × 10⁻⁶ | 1.10 × 10⁻⁹ | 0.837 | |
| 60 d | 16.51 | 0.01 | −5.80 × 10⁻⁶ | 1.28 × 10⁻⁹ | 0.933 | |
| 90 d | 15.27 | 0.02 | −1.43 × 10⁻⁵ | 3.29 × 10⁻⁹ | 0.910 | |
| fcu = a + bAR + cAR2+ dAR3 | 0.5 d | 4.99 | 4.91 × 10⁻³ | −3.48 × 10⁻⁶ | 7.42 × 10⁻¹⁰ | 0.866 |
| 1 d | 7.18 | 2.27 × 10⁻³ | −9.92 × 10⁻⁷ | 2.62 × 10⁻¹¹ | 0.910 | |
| 3 d | 10.78 | 0.01 | −2.95 × 10⁻⁶ | 5.67 × 10⁻¹⁰ | 0.839 | |
| 7 d | 12.25 | 0.01 | −4.51 × 10⁻⁶ | 9.63 × 10⁻¹⁰ | 0.888 | |
| 28 d | 16.01 | 0.01 | −4.93 × 10⁻⁶ | 1.10 × 10⁻⁹ | 0.837 | |
| 60 d | 16.51 | 0.01 | −5.80 × 10⁻⁶ | 1.28 × 10⁻⁹ | 0.933 | |
| 90 d | 15.27 | 0.02 | −1.43 × 10⁻⁵ | 3.29 × 10⁻⁹ | 0.910 | |
| fb = a + bAR + cAR2+ dAR3 | 0.5 d | −0.11 | 3.41 × 10⁻³ | −2.25 × 10⁻⁶ | 4.01 × 10⁻¹⁰ | 0.888 |
| 1 d | 0.17 | 0.01 | −5.92 × 10⁻⁶ | 1.32 × 10⁻⁹ | 0.947 | |
| 3 d | 1.70 | 0.01 | −5.73 × 10⁻⁶ | 1.33 × 10⁻⁹ | 0.893 | |
| 7 d | 3.40 | 6.02 × 10⁻³ | −4.76 × 10⁻⁶ | 1.03 × 10⁻⁹ | 0.902 | |
| 28 d | 5.73 | 4.96 × 10⁻³ | −3.75 × 10⁻⁶ | 7.99 × 10⁻¹⁰ | 0.857 | |
| 60 d | 5.57 | 0.01 | −4.94 × 10⁻⁶ | 1.12 × 10⁻⁹ | 0.897 | |
| 90 d | 5.93 | 0.01 | −5.53 × 10⁻⁶ | 1.24 × 10⁻⁹ | 0.917 |
| Equation | Types | a | b | c | d | R2 |
|---|---|---|---|---|---|---|
| A1 | 0.383 | 0.02 | −3.267 | 2.004 × 10⁻⁶ | 0.889 | |
| A2 | 0.359 | 0.015 | −3.054 | 1.915 × 10⁻⁶ | 0.862 | |
| A3 | 0.337 | 0.018 | −3.487 | 2.113 × 10⁻⁶ | 0.898 | |
| A4 | 0.295 | 0.02 | −3.911 | 2.334 × 10⁻⁶ | 0.937 | |
| A5 | 0.300 | 0.018 | −3.148 | 1.733 × 10⁻⁶ | 0.964 | |
| A6 | 0.305 | 0.019 | −3.146 | 1.717 × 10⁻⁶ | 0.948 | |
| A7 | 0.315 | 0.021 | −3.805 | 2.209 × 10⁻⁶ | 0.931 | |
| A8 | 0.342 | 0.02 | −3.515 | 1.987 × 10⁻⁶ | 0.959 | |
| A9 | 0.315 | 0.021 | −3.805 | 2.209 × 10⁻⁶ | 0.931 | |
| A10 | 0.260 | 0.019 | −3.392 | 1.964 × 10⁻⁶ | 0.922 | |
| SR = a + bt + ct2+ dt3 | 0%-Fiber | 0.34 | 0.02 | −3.52 × 10⁻⁴ | 1.99 × 10⁻⁶ | 0.959 |
| 0.5%-Fibers | 0.33 | 0.02 | −3.12 × 10⁻⁴ | 1.72 × 10⁻⁶ | 0.949 | |
| 1%-Fibers | 0.31 | 0.02 | −2.80 × 10⁻⁴ | 1.57 × 10⁻⁶ | 0.952 | |
| 1.5%-Fibers | 0.28 | 0.01 | −1.94 × 10⁻⁴ | 1.02 × 10⁻⁶ | 0.990 | |
| 2%-Fibers | 0.26 | 0.01 | −2.04 × 10⁻⁴ | 1.18 × 10⁻⁶ | 0.958 | |
| 2.5%-Fibers | 0.26 | 0.01 | −2.10 × 10⁻⁴ | 1.71 × 10⁻⁶ | 0.972 | |
| 0.5 d | 0.37 | −2.11 × 10⁻⁴ | 1.76 × 10⁻⁷ | −4.2 × 10⁻¹¹ | 0.896 | |
| 1 d | 0.42 | −2.71 × 10⁻⁴ | 1.89 × 10⁻⁷ | −3.4 × 10⁻¹¹ | 0.820 | |
| 3 d | 0.51 | −4.22 × 10⁻⁴ | 3.26 × 10⁻⁷ | −7.26 × 10⁻¹¹ | 0.810 | |
| 7 d | 0.59 | −4.72 × 10⁻⁴ | 3.13 × 10⁻⁷ | −5.48 × 10⁻¹¹ | 0.881 | |
| 14 d | 0.78 | −8.38 × 10⁻⁴ | 6.66 × 10⁻⁷ | −1.5 × 10⁻¹⁰ | 0.888 | |
| 28 d | 0.80 | −7.55 × 10⁻⁴ | 5.94 × 10⁻⁷ | −1.34 × 10⁻¹⁰ | 0.832 | |
| 60 d | 0.86 | −6.58 × 10⁻⁴ | 4.58 × 10⁻⁷ | −8.54 × 10⁻¹¹ | 0.855 | |
| 90 d | 0.92 | −8.20 × 10⁻⁴ | 6.12 × 10⁻⁷ | −1.28 × 10⁻¹⁰ | 0.832 |
Disclaimer/Publisher’s Note: The statements, opinions and data contained in all publications are solely those of the individual author(s) and contributor(s) and not of MDPI and/or the editor(s). MDPI and/or the editor(s) disclaim responsibility for any injury to people or property resulting from any ideas, methods, instructions or products referred to in the content. |
© 2024 by the authors. Licensee MDPI, Basel, Switzerland. This article is an open access article distributed under the terms and conditions of the Creative Commons Attribution (CC BY) license (https://creativecommons.org/licenses/by/4.0/).
Share and Cite
Yu, H.; Chen, B.; Zhang, Z.; Wang, H. The Influence of the Assembly Unit of CO2-Cured Secondary Aluminum Ash and CO2-Cured Iron Tailings on High Performance Concrete’s Properties. Coatings 2024, 14, 1536. https://doi.org/10.3390/coatings14121536
Yu H, Chen B, Zhang Z, Wang H. The Influence of the Assembly Unit of CO2-Cured Secondary Aluminum Ash and CO2-Cured Iron Tailings on High Performance Concrete’s Properties. Coatings. 2024; 14(12):1536. https://doi.org/10.3390/coatings14121536
Chicago/Turabian StyleYu, Hongrun, Baolong Chen, Zixuan Zhang, and Hui Wang. 2024. "The Influence of the Assembly Unit of CO2-Cured Secondary Aluminum Ash and CO2-Cured Iron Tailings on High Performance Concrete’s Properties" Coatings 14, no. 12: 1536. https://doi.org/10.3390/coatings14121536
APA StyleYu, H., Chen, B., Zhang, Z., & Wang, H. (2024). The Influence of the Assembly Unit of CO2-Cured Secondary Aluminum Ash and CO2-Cured Iron Tailings on High Performance Concrete’s Properties. Coatings, 14(12), 1536. https://doi.org/10.3390/coatings14121536