Article

The Influence of Salt Erosion on the Mechanical Performances of Ultra-High-Performance Concrete with Secondary Aluminum Dross

1
School of Civil Engineering, Yancheng Institute of Technology, Yancheng 224051, China
2
China Construction Infrastructure Co., Ltd., Beijing 100020, China
3
School of Civil Engineering and Geographic Environment, Ningbo University, Ningbo 315000, China
*
Author to whom correspondence should be addressed.
Coatings 2024, 14(2), 189; https://doi.org/10.3390/coatings14020189
Submission received: 20 November 2023 / Revised: 19 December 2023 / Accepted: 27 December 2023 / Published: 1 February 2024

Abstract

:
Secondary aluminum dross containing a large amount of active substance can be used to prepare concrete. The mechanical strengths, the mass loss rate (MR) and the relative dynamic modulus of elasticity (RME) of ultra-high-performance concrete with secondary aluminum dross are researched. The NaCl freeze–thaw cycles (F-Cs) and dry–wet alternation (D-A) effects with NaCl and Na2SO4 are considered. The corresponding permeability of chloride ions and the carbonation depth (Dc) are obtained. The scanning electron microscope (SEM) photos are researched to reveal the variation of the mechanical mechanism. Results show that after specimens’ suffering from the action of 20 NaCl D-As, the MR of ultra-high-performance concrete is the highest. Specimens exposed to 200 NaCl F-Cs show the lowest MR and CMC. The RME of UHPC under salt actions increase in the order of 20 NaCl D-As < 20 Na2SO4 D-As < 200 NaCl F-Cs. After suffering 200 NaCl F-Cs, 20 Na2SO4 D-As and 20 NaCl D-As, the corresponding Dc values are 1.86 mm to 2.31 mm, 1.79 mm to 2.23 mm and 2.11 mm to 2.76 mm. The flexural strength decreases at the rates of 0.99%–25%, 3.92%–27.84% and 1.47%–21.59% respectively. The MR increases and the RME decreases as the cubic function changes with the amount of salt erosion. After the secondary aluminum dross is added, the CMC decreases at the rates of 0% to 11.53%, 0% to 33.17% and 0% to 8.41% during the process of the salt action. The SAD can reduce the Dc with the decreasing rates of 19.48%, 23.55% and 19.73%. The SAD can increase the compactness of ultra-high-performance concrete. Ultra-high-performance concrete suffering from 20 NaCl D-As shows the largest number and the highest width of cracks. However, when the specimens are exposed to 20 Na2SO4 D-As, the number of cracks is the lowest and the width is the narrowest.

1. Introduction

The generation and accumulation of solid waste in today’s society are relatively complex environmental problems that trouble human beings [1]. Considering that the landfill deposits of this material will cause serious pollution to the environment, the solidification technology of solid waste appears to be very necessary [2,3]. The solidification technology of solid waste includes their use in concrete and the solidification effect of CO2 applied for the disposal of the solid waste [4,5].
Secondary aluminum dross (SAD) is a by-product of aluminum production, causing environmental pollution if its treatment is not reasonable. The SAD possesses a large content of active oxide, which is beneficial to cement hydration. The use of SAD in cement-based materials can solidify the SAD to achieve the purpose of reducing its environmental pollution. Several studies have centered on the usage of SAD in cement concrete [6,7,8,9]. Satish found that SAD can increase the flexural and compressive strengths by 28.6% and 21.5%, respectively [10]. Moreover, SAD can decrease the chloride ion migration coefficient by 13.2% to 33.1% [11,12,13,14]. However, the concrete structure is usually exposed to various erosive environments. In a coastal environment, the erosion of NaCl and Na2SO4 accelerates the deterioration of concrete performance. Therefore, cement concrete materials in coastal environments require a high durability. The ultra-high-performance concrete (UHPC) showing excellent strength and durability can be used in salt erosion environments.
The UHPC is composed of continuous graded quartz sand, cement and a large amount of mineral admixtures [15,16]. This material is manufactured through the maximum density theory. Compared with other cement concrete, UHPC has the least pores and excellent mechanical and durable properties. Several researchers have found the positive effect of solid waste ash in UHPC’s strength and durability. The solid waste ash and stove ash can increase the corresponding flexural strengths by the maximum rates of 23.4% and 17.1%, while the compressive strengths are increased by the maximum rates of 14.1% and 16.7% [17,18,19]. Additionally, the corrosion resistance of a reinforced UHPC matrix subjected to NaCl action is also improved by adding SAD [20,21,22]. In coastal environments, the mechanical performance can deteriorate when subjected to salt erosion. However, the SAD–UHPC’s mechanical performance under the environment of salt erosion has not been investigated.
In this study, the flexural and compressive strengths (ft and fcu) of SAD–UHPC are measured. The NaCl F-C, NaCl D-A and Na2SO4 D-A actions on the specimens’ mass loss rates (MRs), relative dynamic moduli of elasticity (RDMEs), carbonation depths and chloride ion permeabilities are studied. The scanning electron microscope (SEM) photos, energy dispersive spectrometer (EDS), thermogravimetric analysis (TG), X-ray diffraction spectrum (XRD) and mercury intrusion porosimetry (MIP) are utilized for the analysis of the mechanical mechanisms after NaCl and Na2SO4 action. This paper will offer theoretical supports for the application of SAD–UHPC in salt erosion environments.

2. Experimental Section

2.1. Raw Materials

Ordinary Portland cement (OPC) with the initial and final setting times of 103.1 min and 413.2 min purchased from the Ningguo cement plant of Anhui Conch Cement Co., Ltd., Ningguo city, China is used. The density of the OPC is 3.03 g/cm3. Zhejiang Yongji Metal Materials Technology Co., Ltd., Jinhua, China offers the SAD for this research. The density of the SAD is 1.21 g/cm3. The contents of AlN, Al4C3, AlP, Al2S3 and Al5O6N of the SAD are 0.03%, 0.01%, 0.02%, 0.025% and 0.013% of the total mass of the SAD. Other chemical compositions are shown in Table 1. Taiyue Mining (Shandong) Co., Ltd., Jinan, China, offers the ultra-fine fly ash (FA) used as the mineral admixture. The FA has a density of 2.45 g/cm3 and particle diameters of 0.005 mm to 0.05 mm. Henan Tengze Environmental Technology Co., Ltd., Zhengzhou, China produces the quartz sand (QS) as aggregate for the UHPC. Efficient polycarboxylic acid water-reducing agent bought from Jilin Zhongxin New Building Materials Co., Ltd., Changchun, China, is used for the adjustment of the fresh UHPC’s fluidity. The aggregates’ particle sizes range from 3.21 to 1.57 mm, 0.83 to 0.33 mm, and 0.31 to 0.21 mm, respectively, with the corresponding mass ratio of 1:1:5:1 applied. Table 1 and Table 2 show the accumulated pass ratios and the chemical compositions.

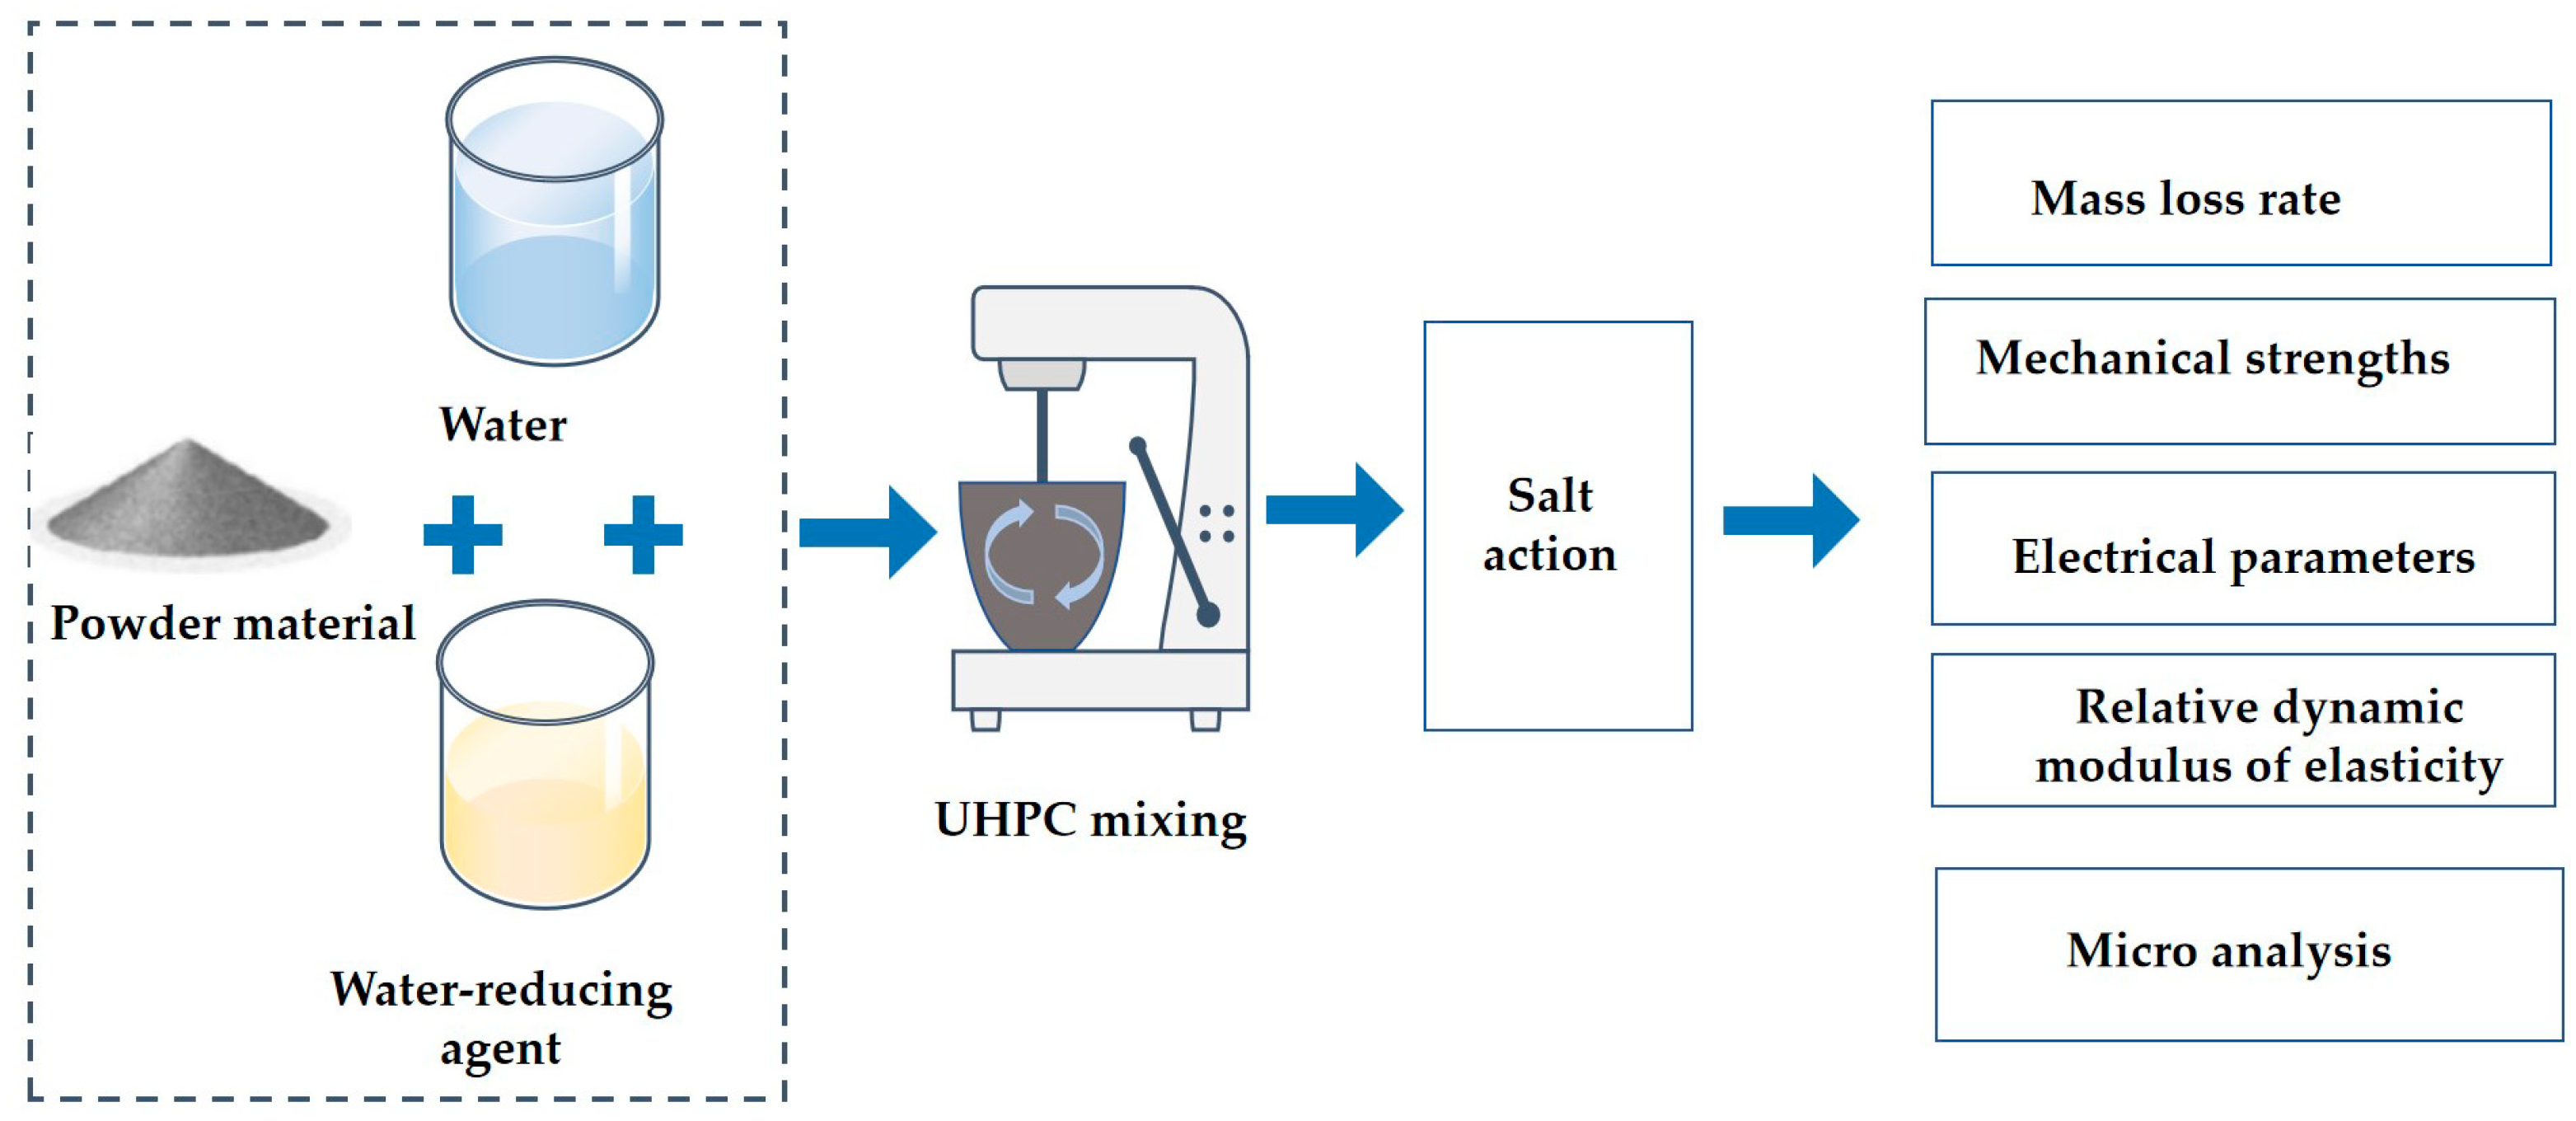
2.2. The Preparing of Specimens

The binder materials (OPC, BFS, SF and SAD) are mixed uniformly in the NJ-160A mixer (Shanghai Meiyu Instrument Technology Co., Ltd., Shanghai, China) with a stirring speed of 60 rpm. After this mixing, the water and water-reducing agent are added to the mixer, stirring at the speed of 80 rpm for another 3 min. Then, the specimens with sizes of 40 × 40 × 160 mm3, Φ100 × 50 mm3 and 100 × 100 × 100 mm3 are manufactured. After curing in the environment (relative humidity of 40% and temperature of 20 ± 2 °C) for 1 day, the specimens are moved to an environment of 20.3 °C and 96.2% relative humidity for 23 days. The mixing proportions are shown in Table 3, which are used for manufacturing UHPC specimens. In this paper, six samples are prepared for each experiment. The average of the measured values is used as the testing result. The coefficient of variation of all experimental test data in this article is less than 0.1, ensuring the accuracy of the study.

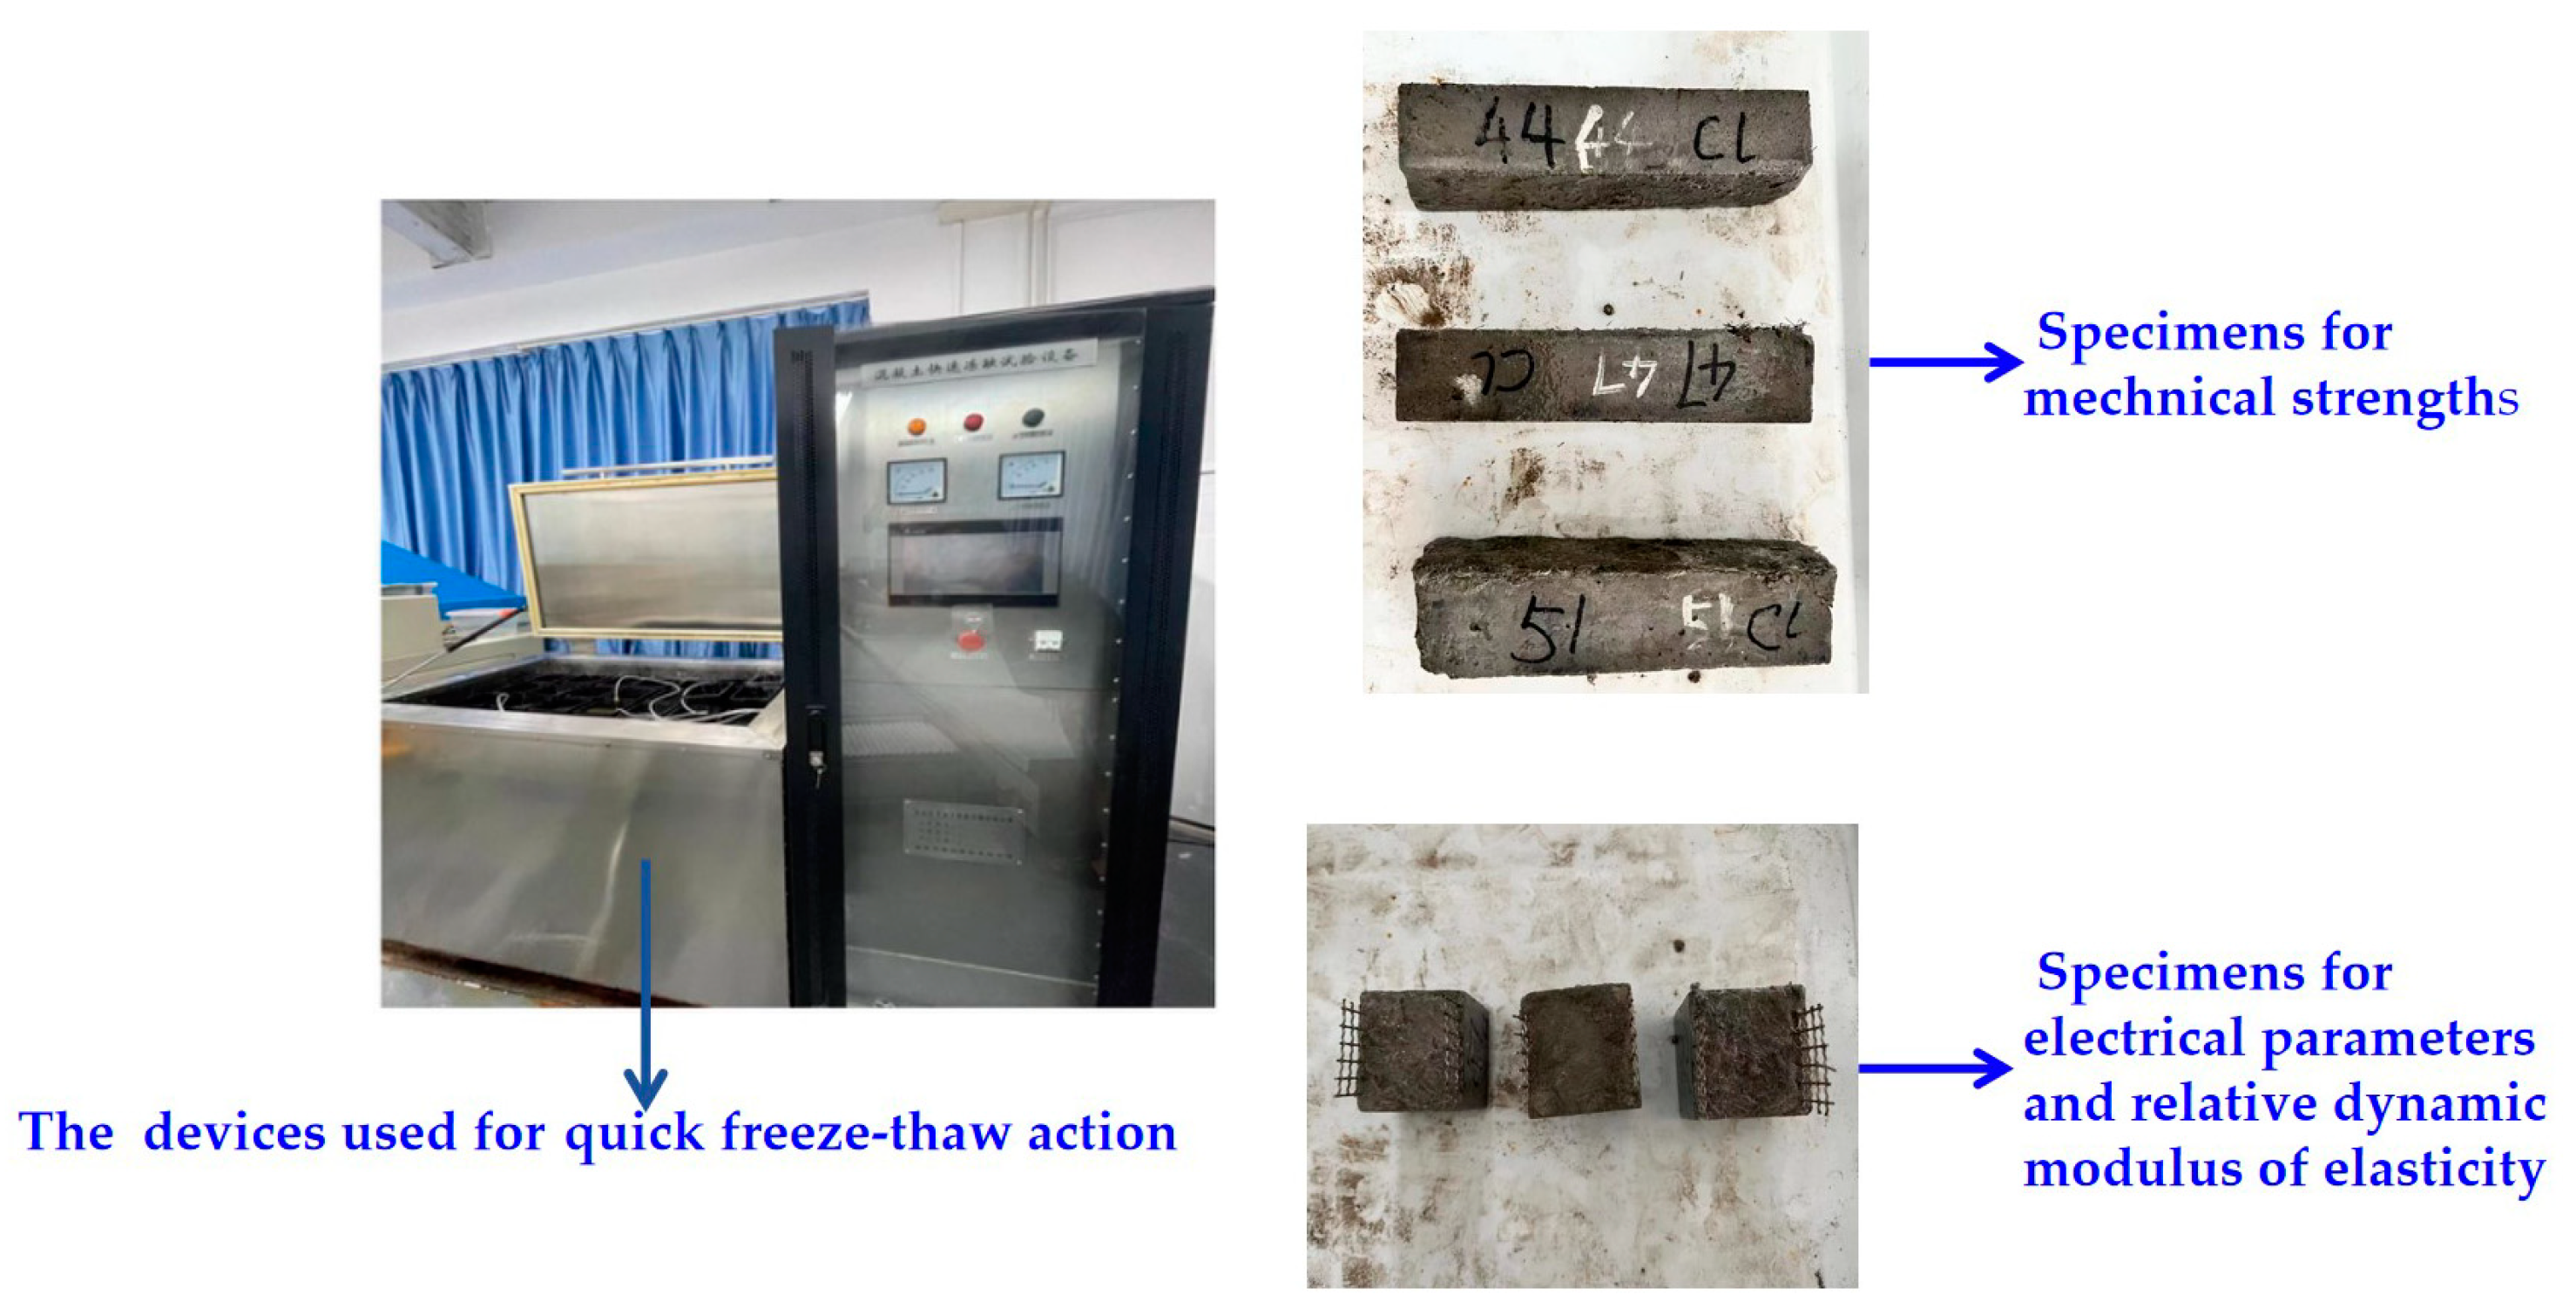
2.3. The NaCl F-C Action

A 3% NaCl solution is used for immersing specimens for 4 days. After the immersion, specimens are moved to the TDS-300 fully automatic rapid freeze–thaw test box provided by Nanjing Annai Testing Equipment Co., Ltd., Nanjing, China, for the experiment. Specimens are moved to the sealed stainless-steel freeze–thaw boxes filled with the NaCl solution at the same concentration. The temperature in the F-C box ranges from −15 °C to 8 °C. The freezing time of each F-C is 2–3 h, while the thawing time of each F-C is 1–2 h. All parameters are determined for each of the 50 NaCl F-Cs. Figure 1 shows the process of the NaCl F-C.

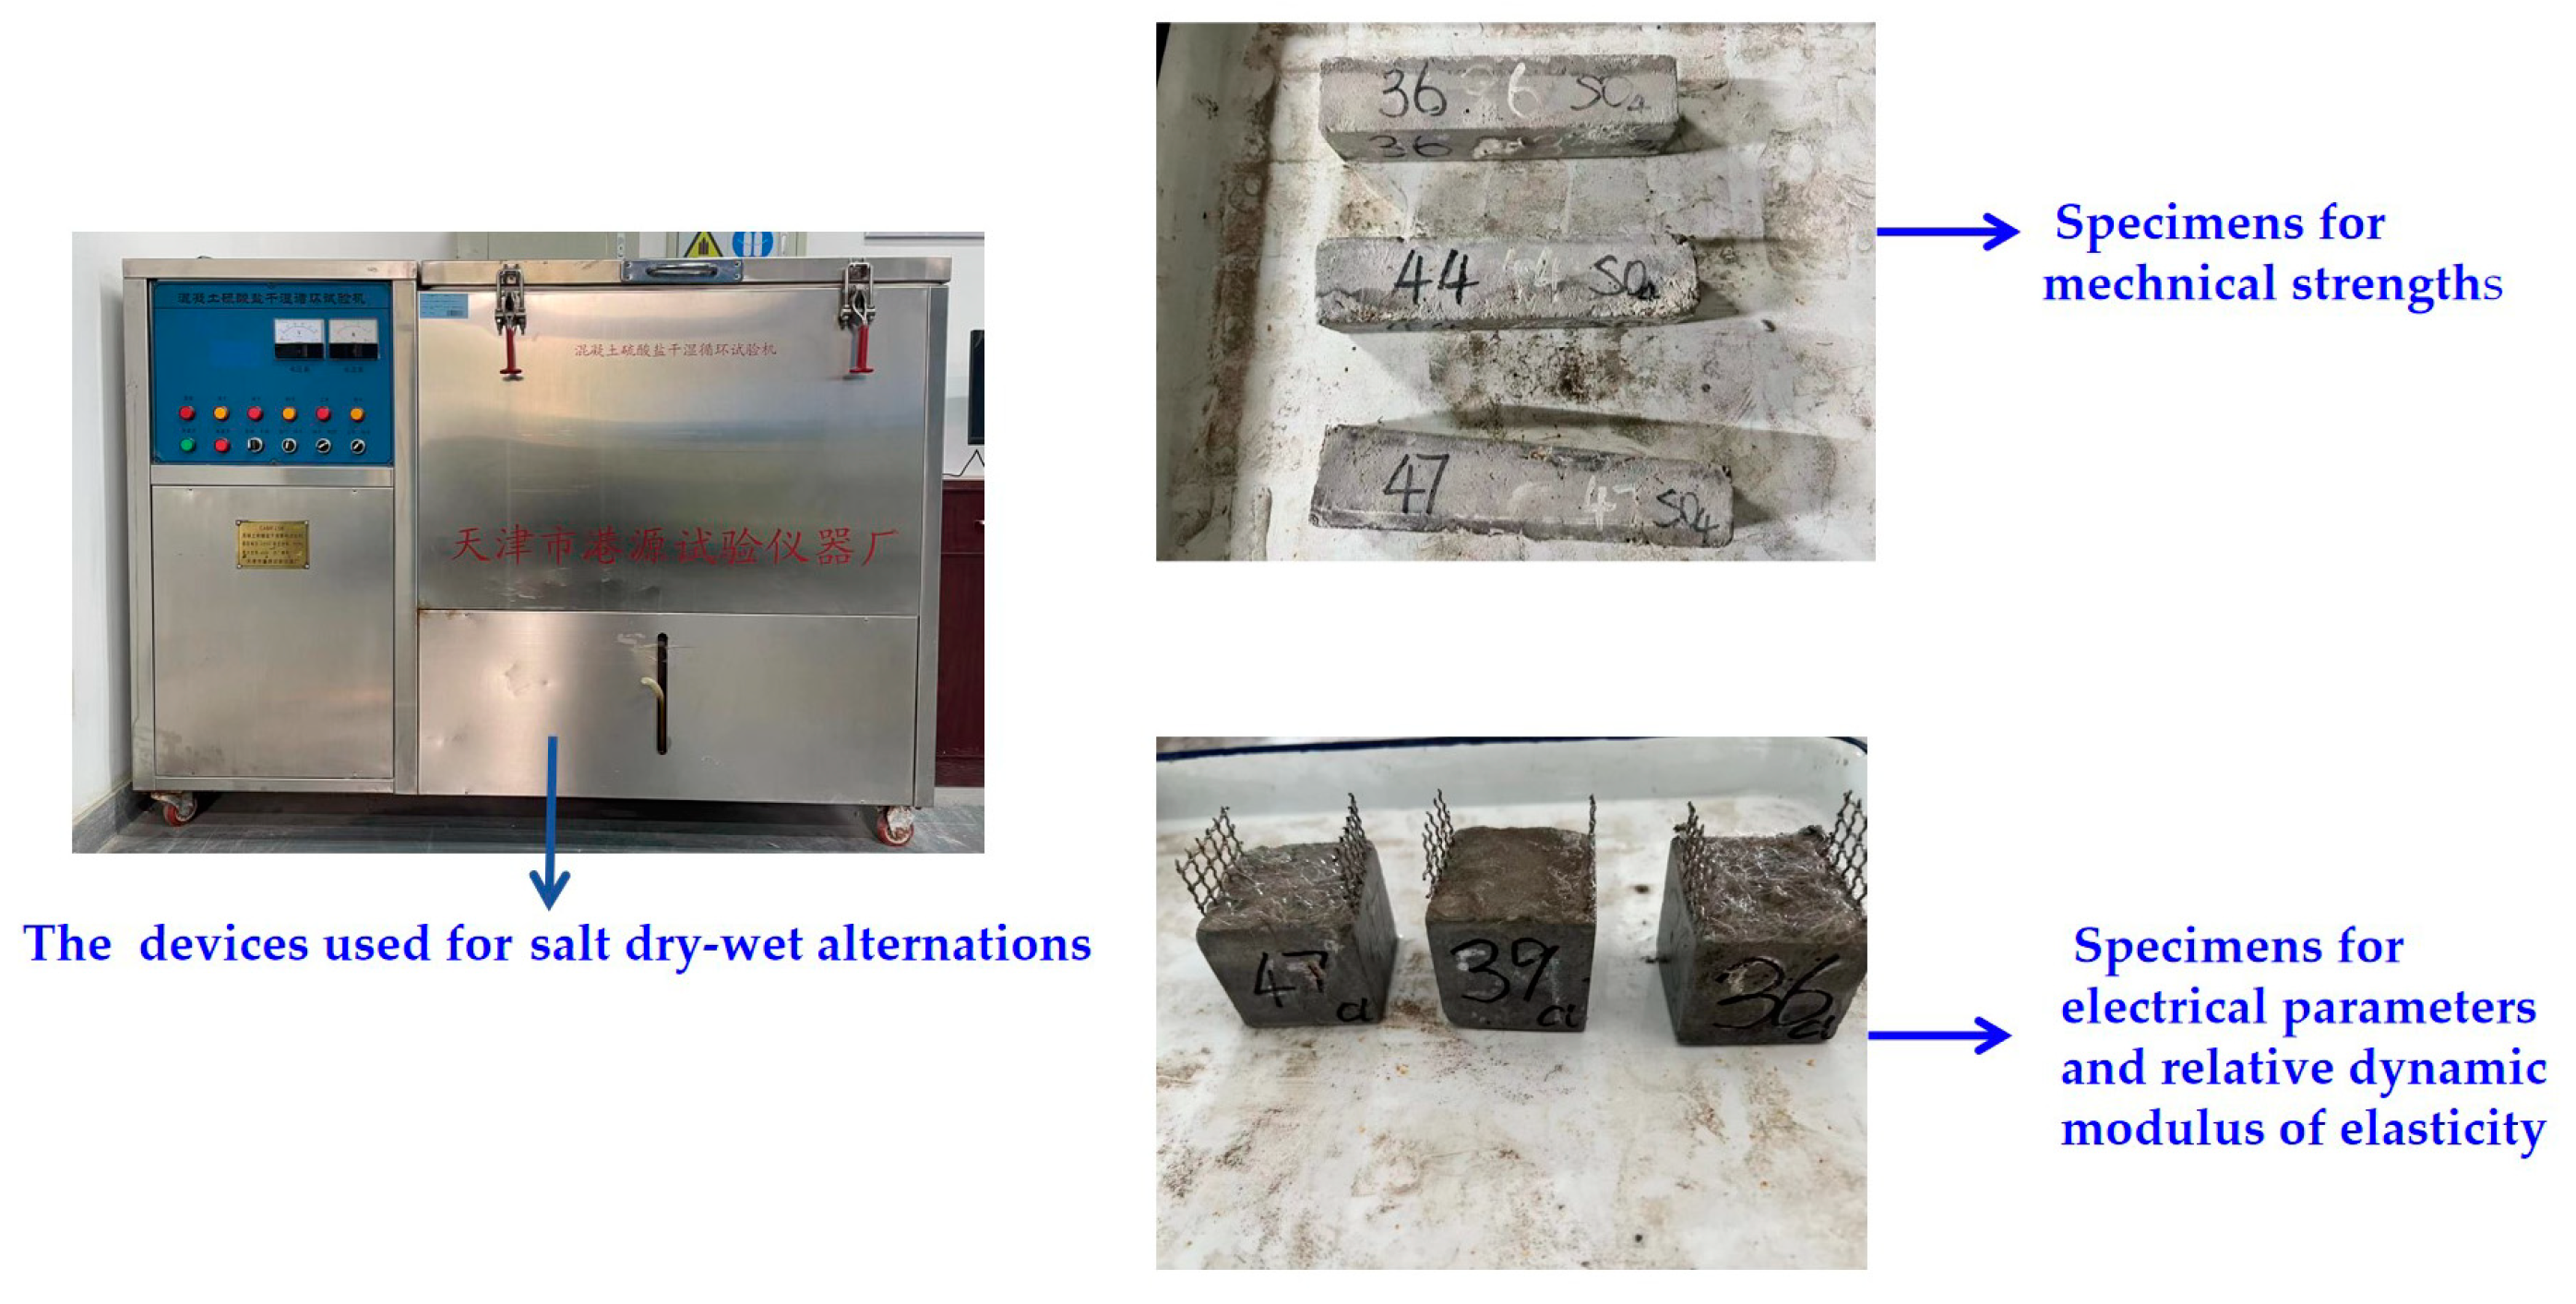
2.4. The NaCl and Na2SO4 D-A Actions

The immersion process of specimens in NaCl is the same as the NaCl F-C action. After the immersion, the specimen are moved to the concrete corrosion-resistant dry–wet cycle testing machine bought from Tianjin Huida Experimental Instrument Co., Ltd., Tianjin, China for the experiment of NaCl D-A. During each D-A, 8 hours of solution immersion in NaCl or Na2SO4 are applied to the specimens; after that, the surfaces of the specimens are dried using a rag. Then, the specimens are dried at a temperature of 80 °C for 36 h. Ultimately, the samples are cooled for 2 h. Figure 2 shows the process of Na2SO4 D-A.

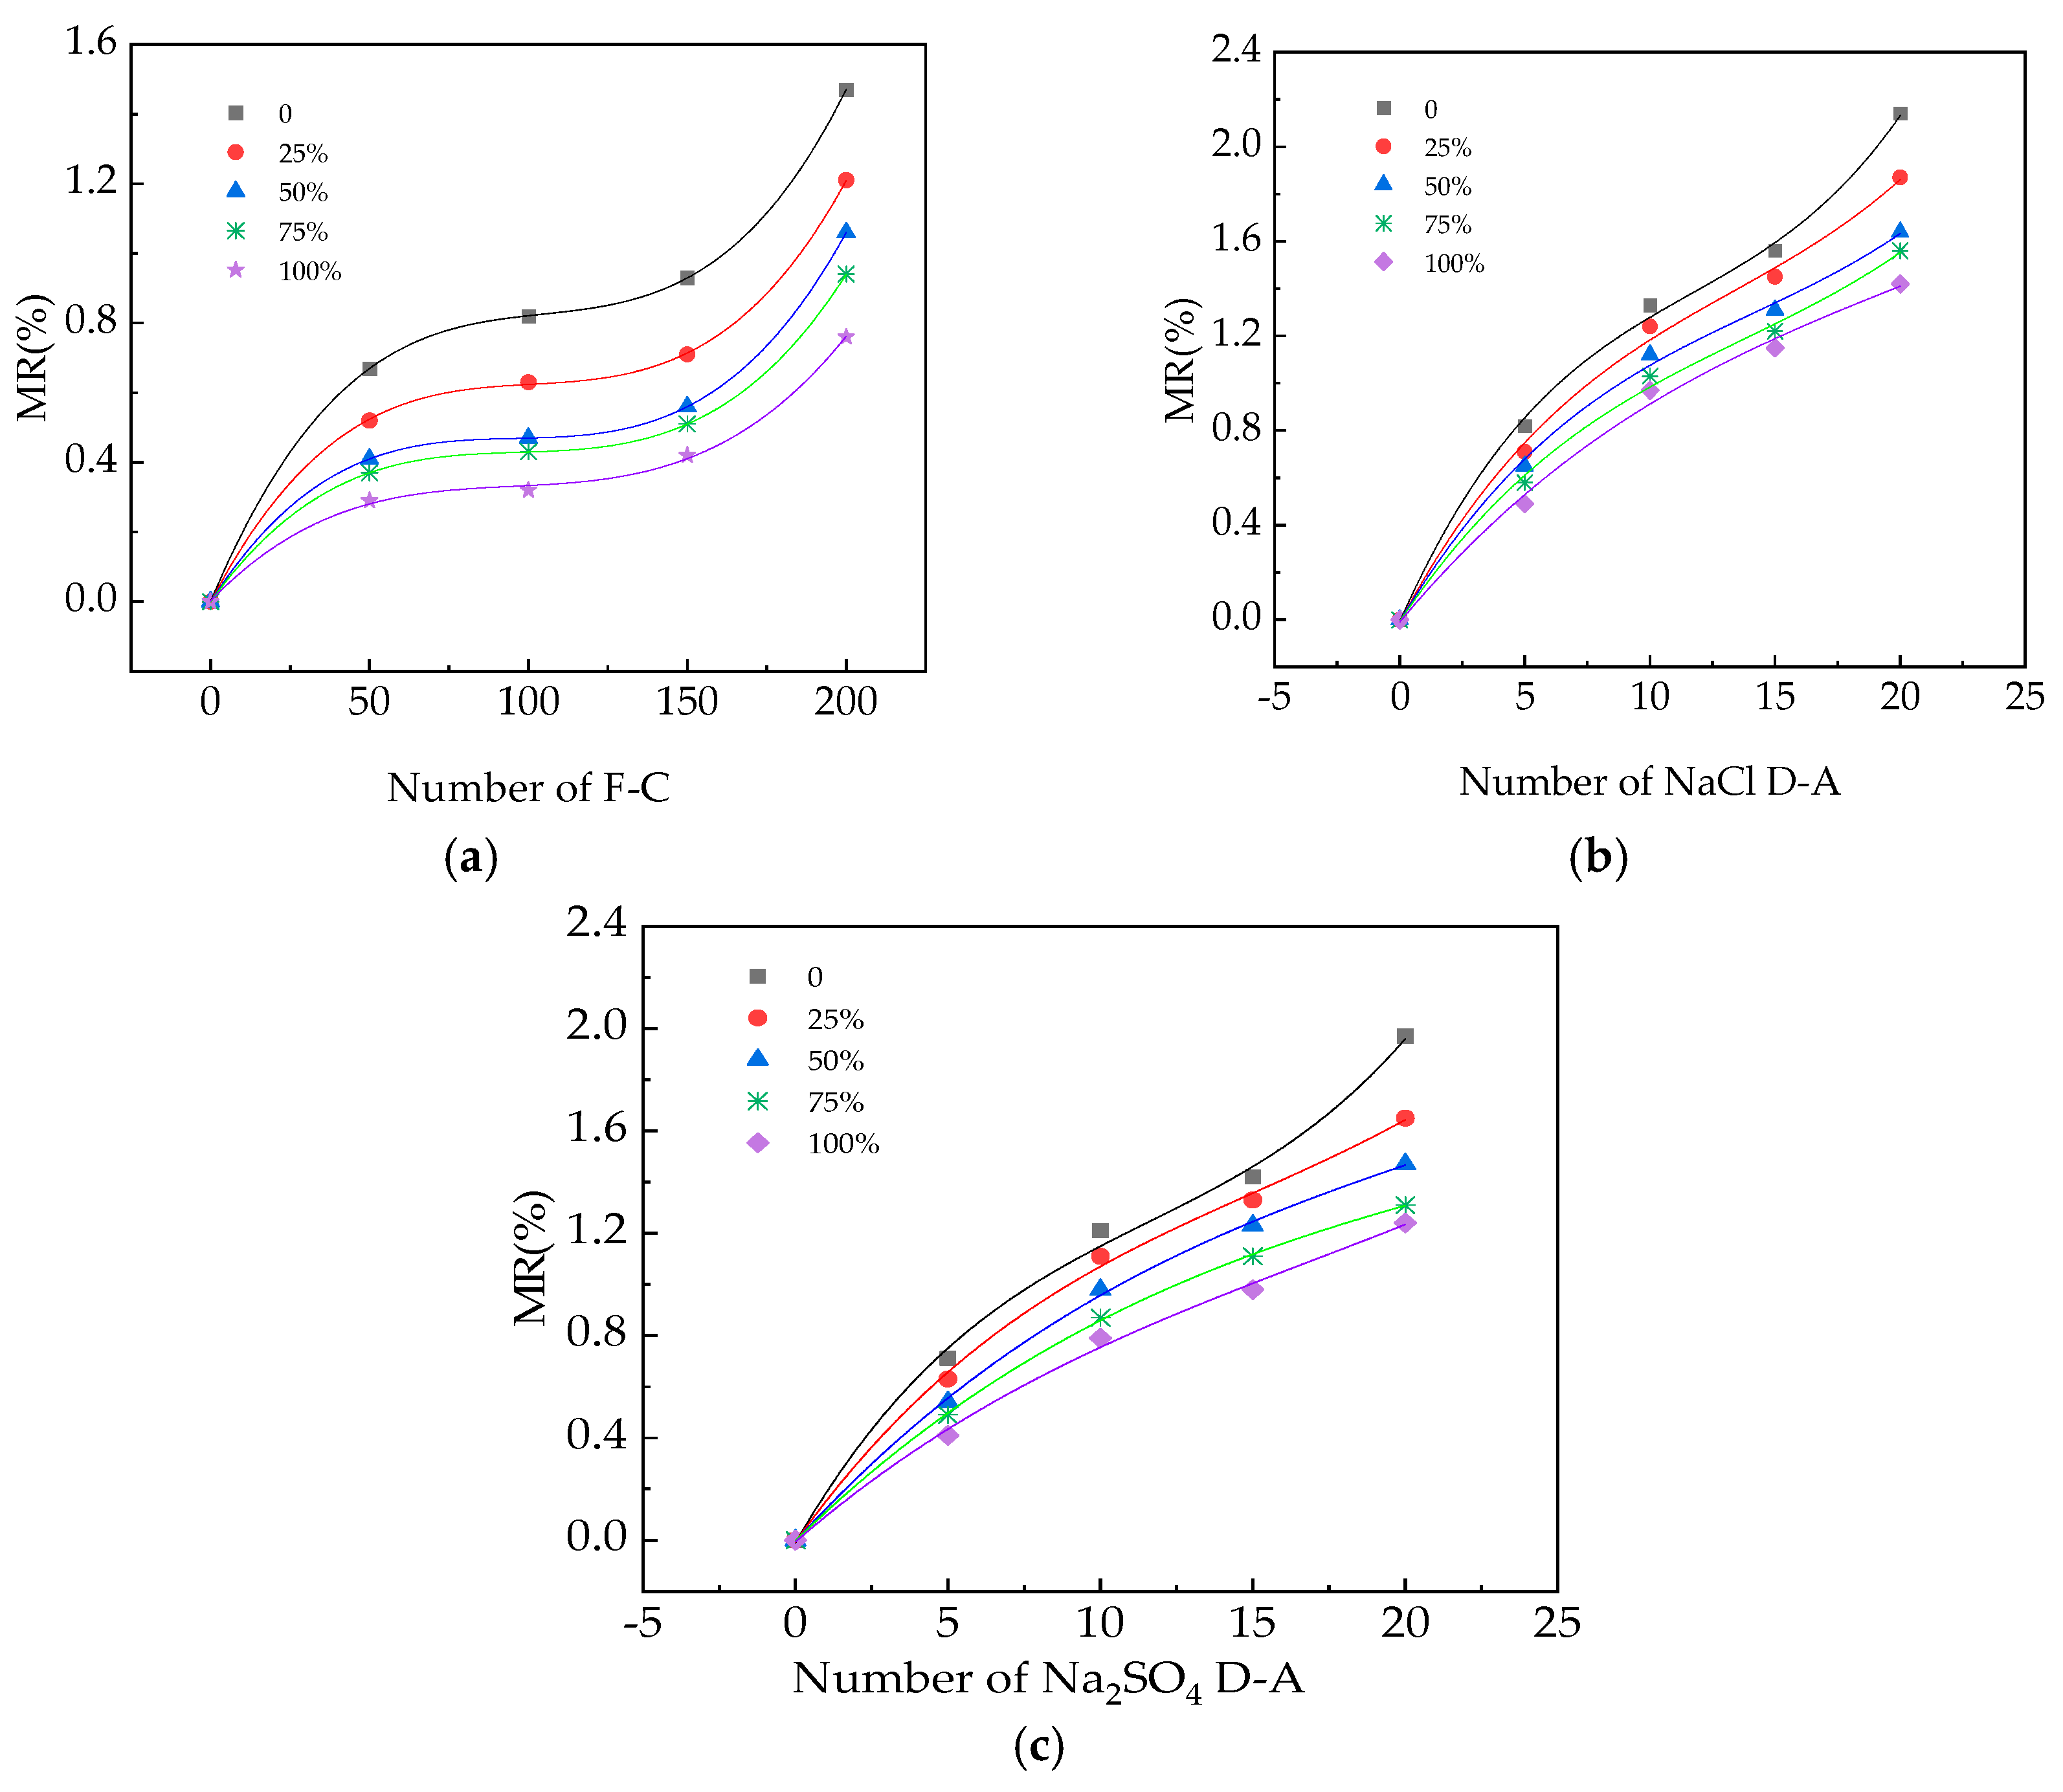
2.5. The Measurement of MR

Specimens’ masses are determined after the specimens are immersed in NaCl for 4 days. After that, the specimens’ surfaces are wiped. Then, the masses of the specimens are determined using the DH-8905 electronic scale manufactured by Dongguan Dingheng Electronics Co., Ltd., Dongguan, China, with the measurement range of 0–3 kg and the minimum accuracy of 0.1 g. The MR can be calculated with Equation (1),
M R = m t m 1 m 1
where m1 is the mass of the specimen after the 4-day immersion in 3% NaCl solution and mt is the mass of the specimen after 50 F-Cs or 10 D-As.

2.6. The Measurement of the Relative Dynamic Modulus of Elasticity

A HS600 digital ultrasonic flaw detector manufactured by Shanxi Gangyan Testing Technology Co., Ltd., Taiyuan, China, is used for the determination of the relative dynamic modulus of elasticity (RDEM). The probes of the receiving and transmitting ends of the ultrasound are tightly adhered to the center positions of the specimens. The baseline is used for the match between the probes and the specimens. The RDEM is calculated by Equation (2),
R D E M = ( v t v 1 ) 2
where v1 and vt are the ultrasonic velocities of the specimens after 4 days of NaCl or Na2SO4 immersion and each 50 NaCl F-Cs, 10 NaCl D-As or 10 Na2SO4 D-As. Specimens with sizes of 100 × 100 × 100 mm3 are used for the measurements of MR and RDEM. The flowchart of the experimental process is shown in Figure 3.

2.7. The Measurement of Mechanical Strengths

The flexural strength (ft) and compressive strength (fcu) are determined with the fully automatic bending and integrated testing machine (Shanghai Qunhong Instrument Equipment Co., Ltd., Shanghai, China) with the loading rates of 0.05 kN/s and 2.4 kN/s, respectively. The mechanical strength measurements are carried out with specimens of the size 40 × 40 × 160 mm3.

2.8. The Chloride Ion Migration Coefficient

The CMC of the UHPC is measured with the RCM-6 concrete chloride ion diffusion coefficient tester manufactured by Shanghai Shengshi Huike Testing Equipment Co., Ltd., Shanghai, China. All specimens are firstly processed with the vacuum saturation treatment and then moved to the measurement of the CMC. The vacuum saturation machine (Shanghai Shengshi Huike Testing Equipment Co., Ltd., Shanghai, China) with a vacuum volume of 18 L and accuracy of 0.1% is used for the vacuum saturation. A concrete chloride ion diffusion coefficient tester (Cangzhou Taiding Hengye Testing Instrument Co., Ltd., Cangzhou, China) with the measuring voltages of 10 V to 60 V and a voltage accuracy of 0.1 V is used for measuring the CMC.

2.9. The Carbonation Depth

The carbonation depth (Dc) of UHPC is determined after treatment in the TH-2 concrete carbonization test box (Hebei Zhongyi Weichuang Test Instrument Co., Ltd., Cangzhou, China). The detailed testing process can be described as follows:
The UHPC specimens are placed into the carbonization box. The concentration of the CO2 in the carbonization box is 20 ± 3%. The temperature and the humidity in the carbonization box are 20 ± 5 °C and 70 ± 5%. After the specimens are cured in the carbonization box for 28 days, the specimens are taken out and broken to determine their carbonization depth. The specimens are cut off by half of their width. The remaining powder on the section of the cut specimen is scraped off, and then a 1% concentration of phenolphthalein alcohol solution (containing 20% evaporated water) is sprayed. After 30 s, the carbonization depth of each point on both sides at every 10 mm marked previously is measured in a carbonization depth test box. In this paper, the variation coefficients of all macroscopic performance experimental results are lower than 0.1.

2.10. The SEM Experiment

The samples’ inner UHPC with the diameter of 0.5 mm to 1 mm is used for the experiment of SEM. All samples are dried in the vacuum oven at 105 °C for 2 days. The samples are coated with gold until dry. Finally, the samples coated with gold are moved to the SEM to obtain the photos magnified 10,000 times.

3. Results and Discussions

3.1. The MR of UHPC

In this paper, the N of all fitting equations presents the amount of salt action. a, b, c and d represent the MR of specimens with the increasing numbers of NaCl F-Cs, NaCl D-As and Na2SO4. Figure 4 displays the MR of the UHPC exposed to erosion action. The MR of specimens increases with the increasing number of NaCl F-Cs, NaCl D-As and Na2SO4 D-As. The NaCl F-Cs can increase the frost-heaving stress and crystallization stress inside the UHPC [23,24], thus, accelerating the surface peeling on UHPC. Therefore, the MR increases with the NaCl F-C action. The NaCl D-A can increase the crystalline stress of the UHPC; hence, the surface peeling on the UHPC is exacerbated, resulting in the increased MR of UHPC [25]. Additionally, the chloride accelerates the alkali aggregate reaction of UHPC, which increases the mass loss of the UHPC. Meanwhile, the dry–wet cycling of sulfate acts on the UHPC, the internal cementitious material undergoes a chemical reaction with sulfate and decomposes to form an erosion product, ettringite, which appears inside the UHPC. While the quantity of SAD increases, the MR of UHPC decreases. This can be ascribed to the reason that the SAD can form an aluminum hydroxide gel with cement, thus making UHPC more compact; therefore, the resistance to salt erosion is enhanced [26,27,28,29]. The MR of UHPC is the highest after suffering NaCl D-As, while the UHPC after suffering the NaCl F-Cs shows the lowest MR. The relationships between the number of NaCl F-C, NaCl D-A and Na2SO4 actions and the MR fit with the function of Equation (3). Table 4 shows the fitting equations of the relationships between the amount of erosion action and the MR. The R-squared is higher than 0.98, which ensures the rationality of fitting equations. After 200 NaCl F-Cs, 20 Na2SO4 and 20 NaCl D-As, the MR of UHPC are 0.76% to 1.47%, 1.24% to 1.97% and 1.42% to 2.14%, while the MR are decreased at the decreasing rates of 0% to 48.2%, 0% to 33.6% and 0% to 37.1% by adding the SAD.
M R = a N 3 + b N 2 + c N + d

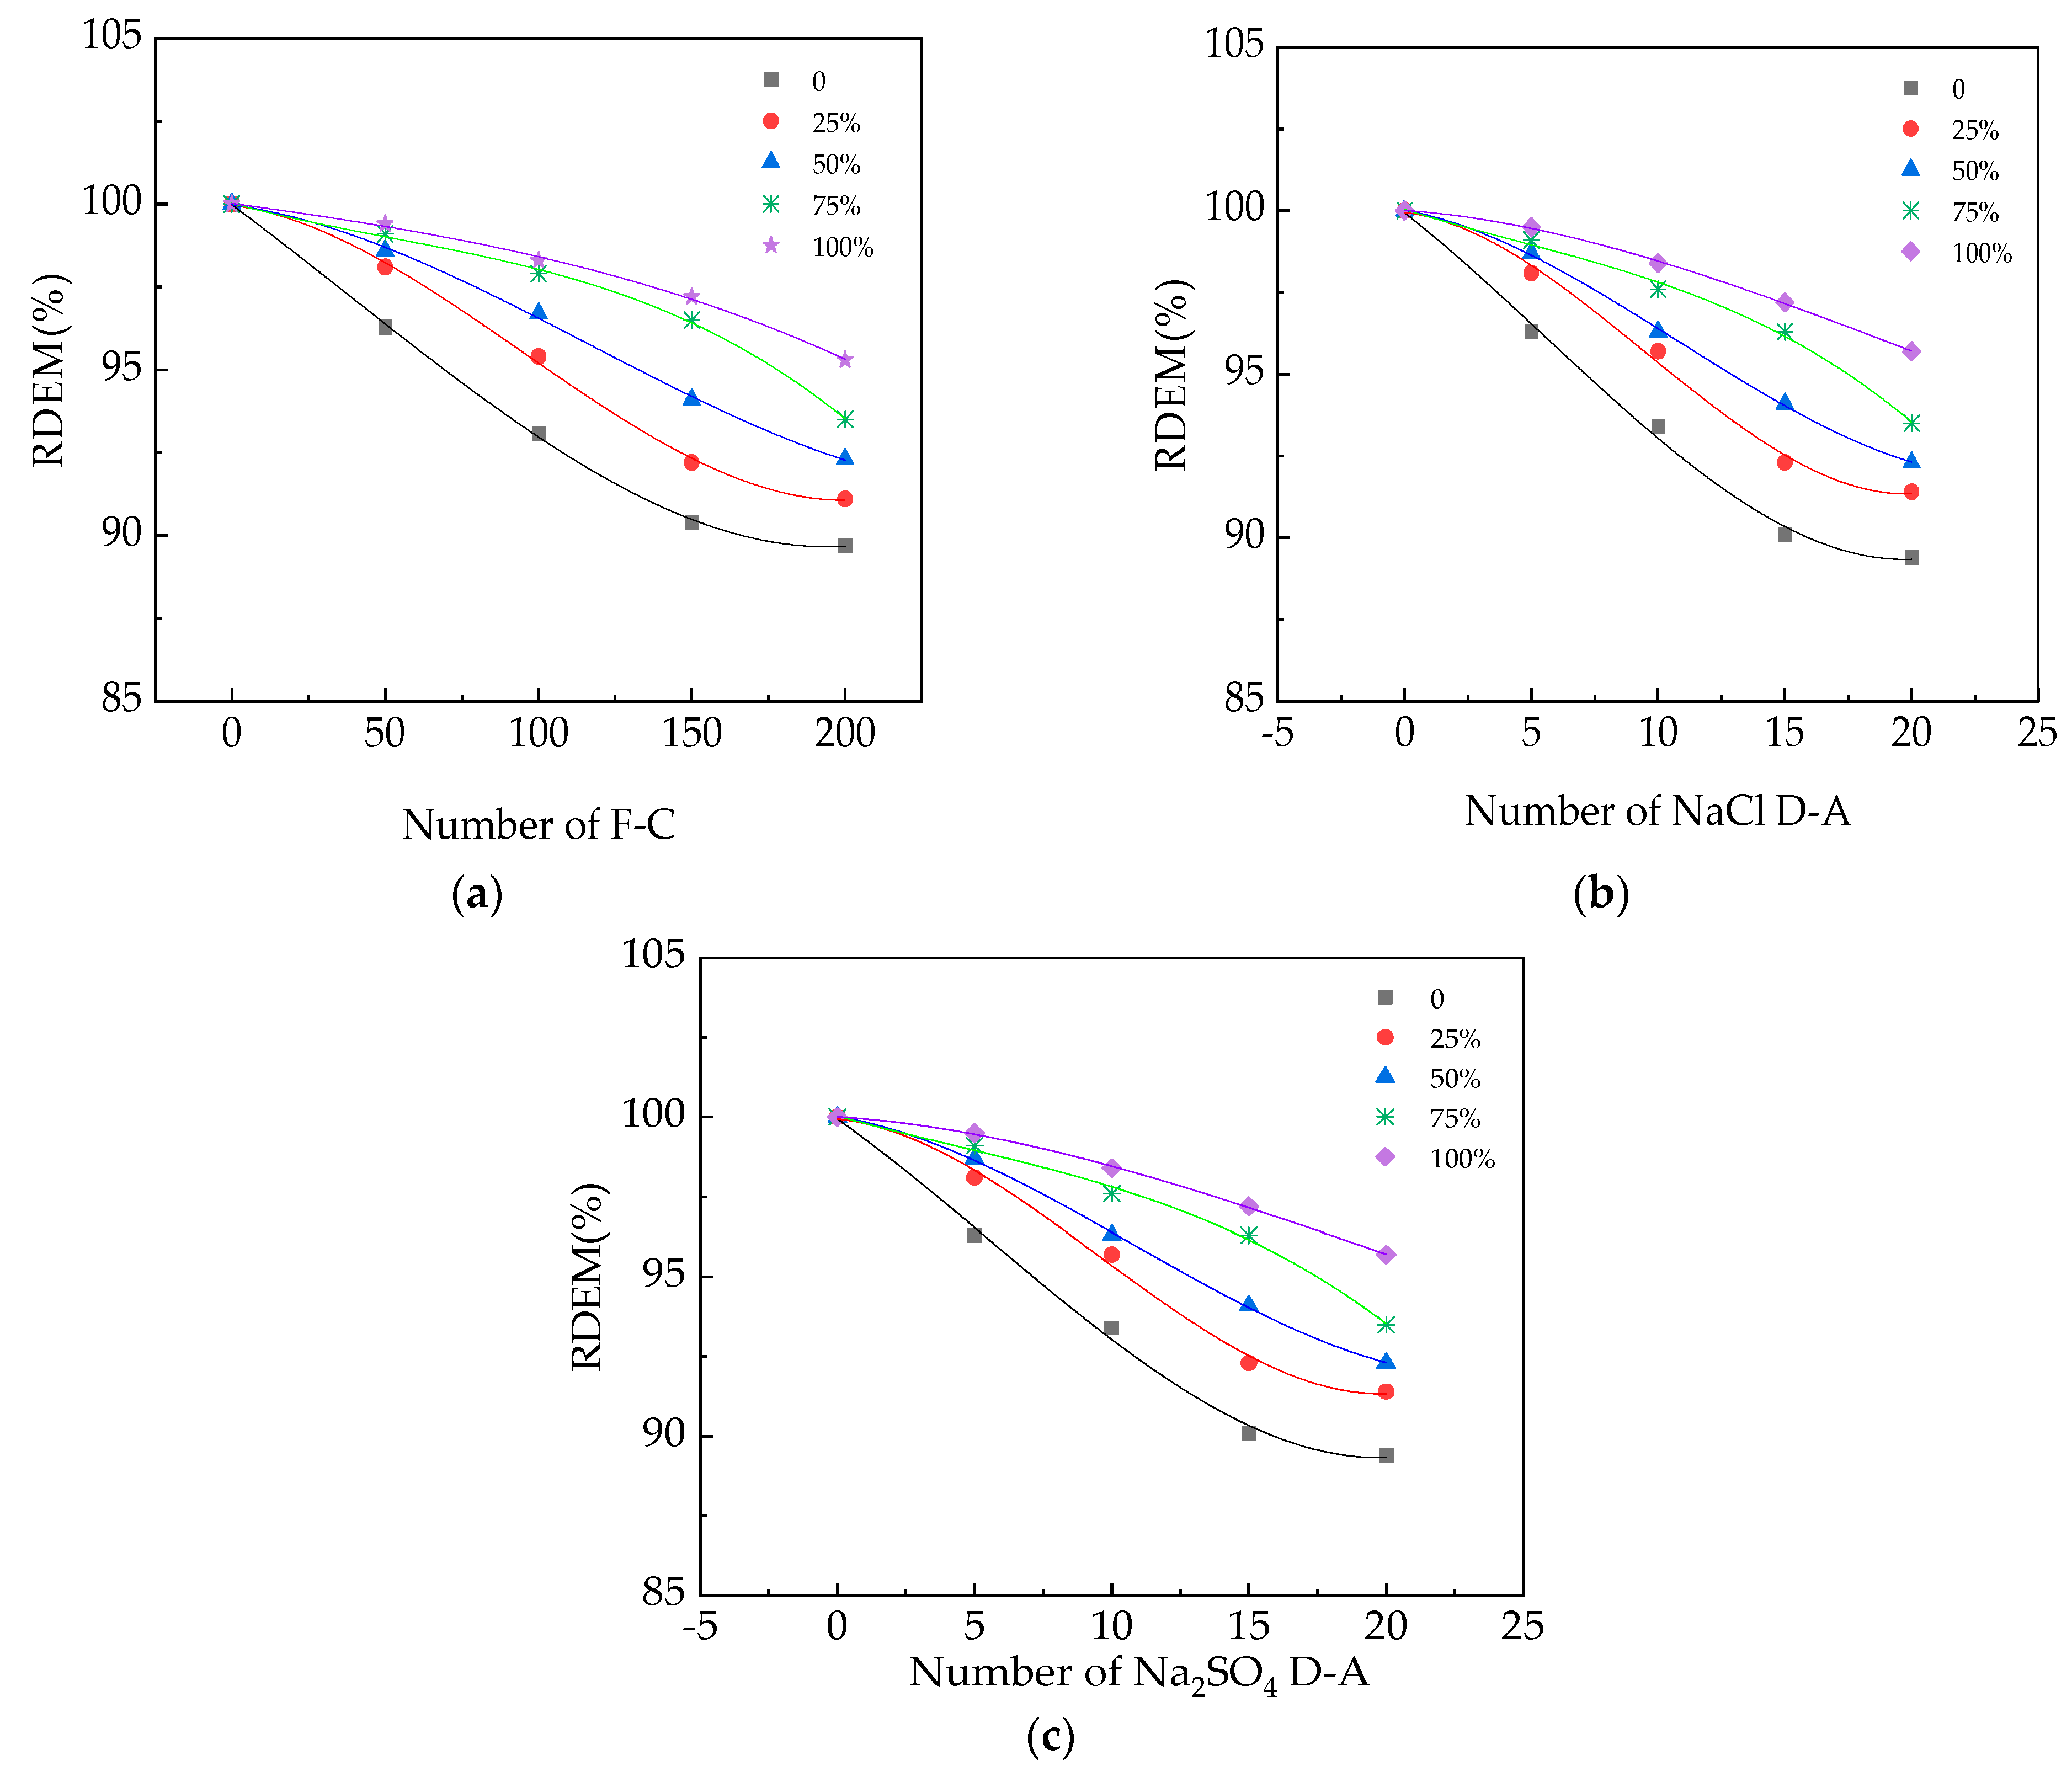
3.2. The RDME of UHPC

Figure 5 shows the RDME of UHPC after suffering different numbers of NaCl F-C, NaCl D-A and Na2SO4 D-A actions. The RME of UHPC decreases with increased NaCl F-C, NaCl D-A and Na2SO4 D-A numbers. The frost heaving-stress stemming from NaCl F-Cs and the crystalline stress generated by NaCl F-Cs and NaCl D-As can facilitate the development and number of cracks inside the UHPC. The cracks obstruct the propagation of ultrasounds, resulting in a decrease in the RDEM [30,31]. When the UHPC undergoes the Na2SO4 erosion, the internal UHPC is exposed to a chemical reaction with sulfate and decomposes to form an erosion product, ettringite, leading to more cracks in the specimens. The erosion product expands, and the voids are irregularly distributed in the mortar. The presence of these voids will gradually deteriorate the RDEM of the mortar. The amount of salt erosion shows the cubic function with the RME, which is shown in Equation (4). Table 5 shows the fitting equations of the relationships between the amount of erosion action and the RDEM. The R-squared of the fitting curves are higher than 0.98. However, the RME is increased by adding SAD. Due to the improved compactness and decreased inner cracks, the ultrasound’s speed is increased [32,33]. Therefore, the addition of SAD increases the RME. Meanwhile, the RME of UHPC is the highest after 200 NaCl F-Cs. The UHPC shows the lowest RDEM after suffering 20 NaCl D-As, due to the most serious erosion action of NaCl D-As on the UHPC. After 200 NaCl F-Cs, 20 Na2SO4 and 20 NaCl D-As, the RMEs of UHPC are 89.7% to 95.3%, 89.4% to 95.7% and 86.3% to 94.8%. Additionally, the SAD can increase the RDEM with the increasing rates of 5.88%, 8.97% and 6.58%.
R D E M = a N 3 + b N 2 + c N + d

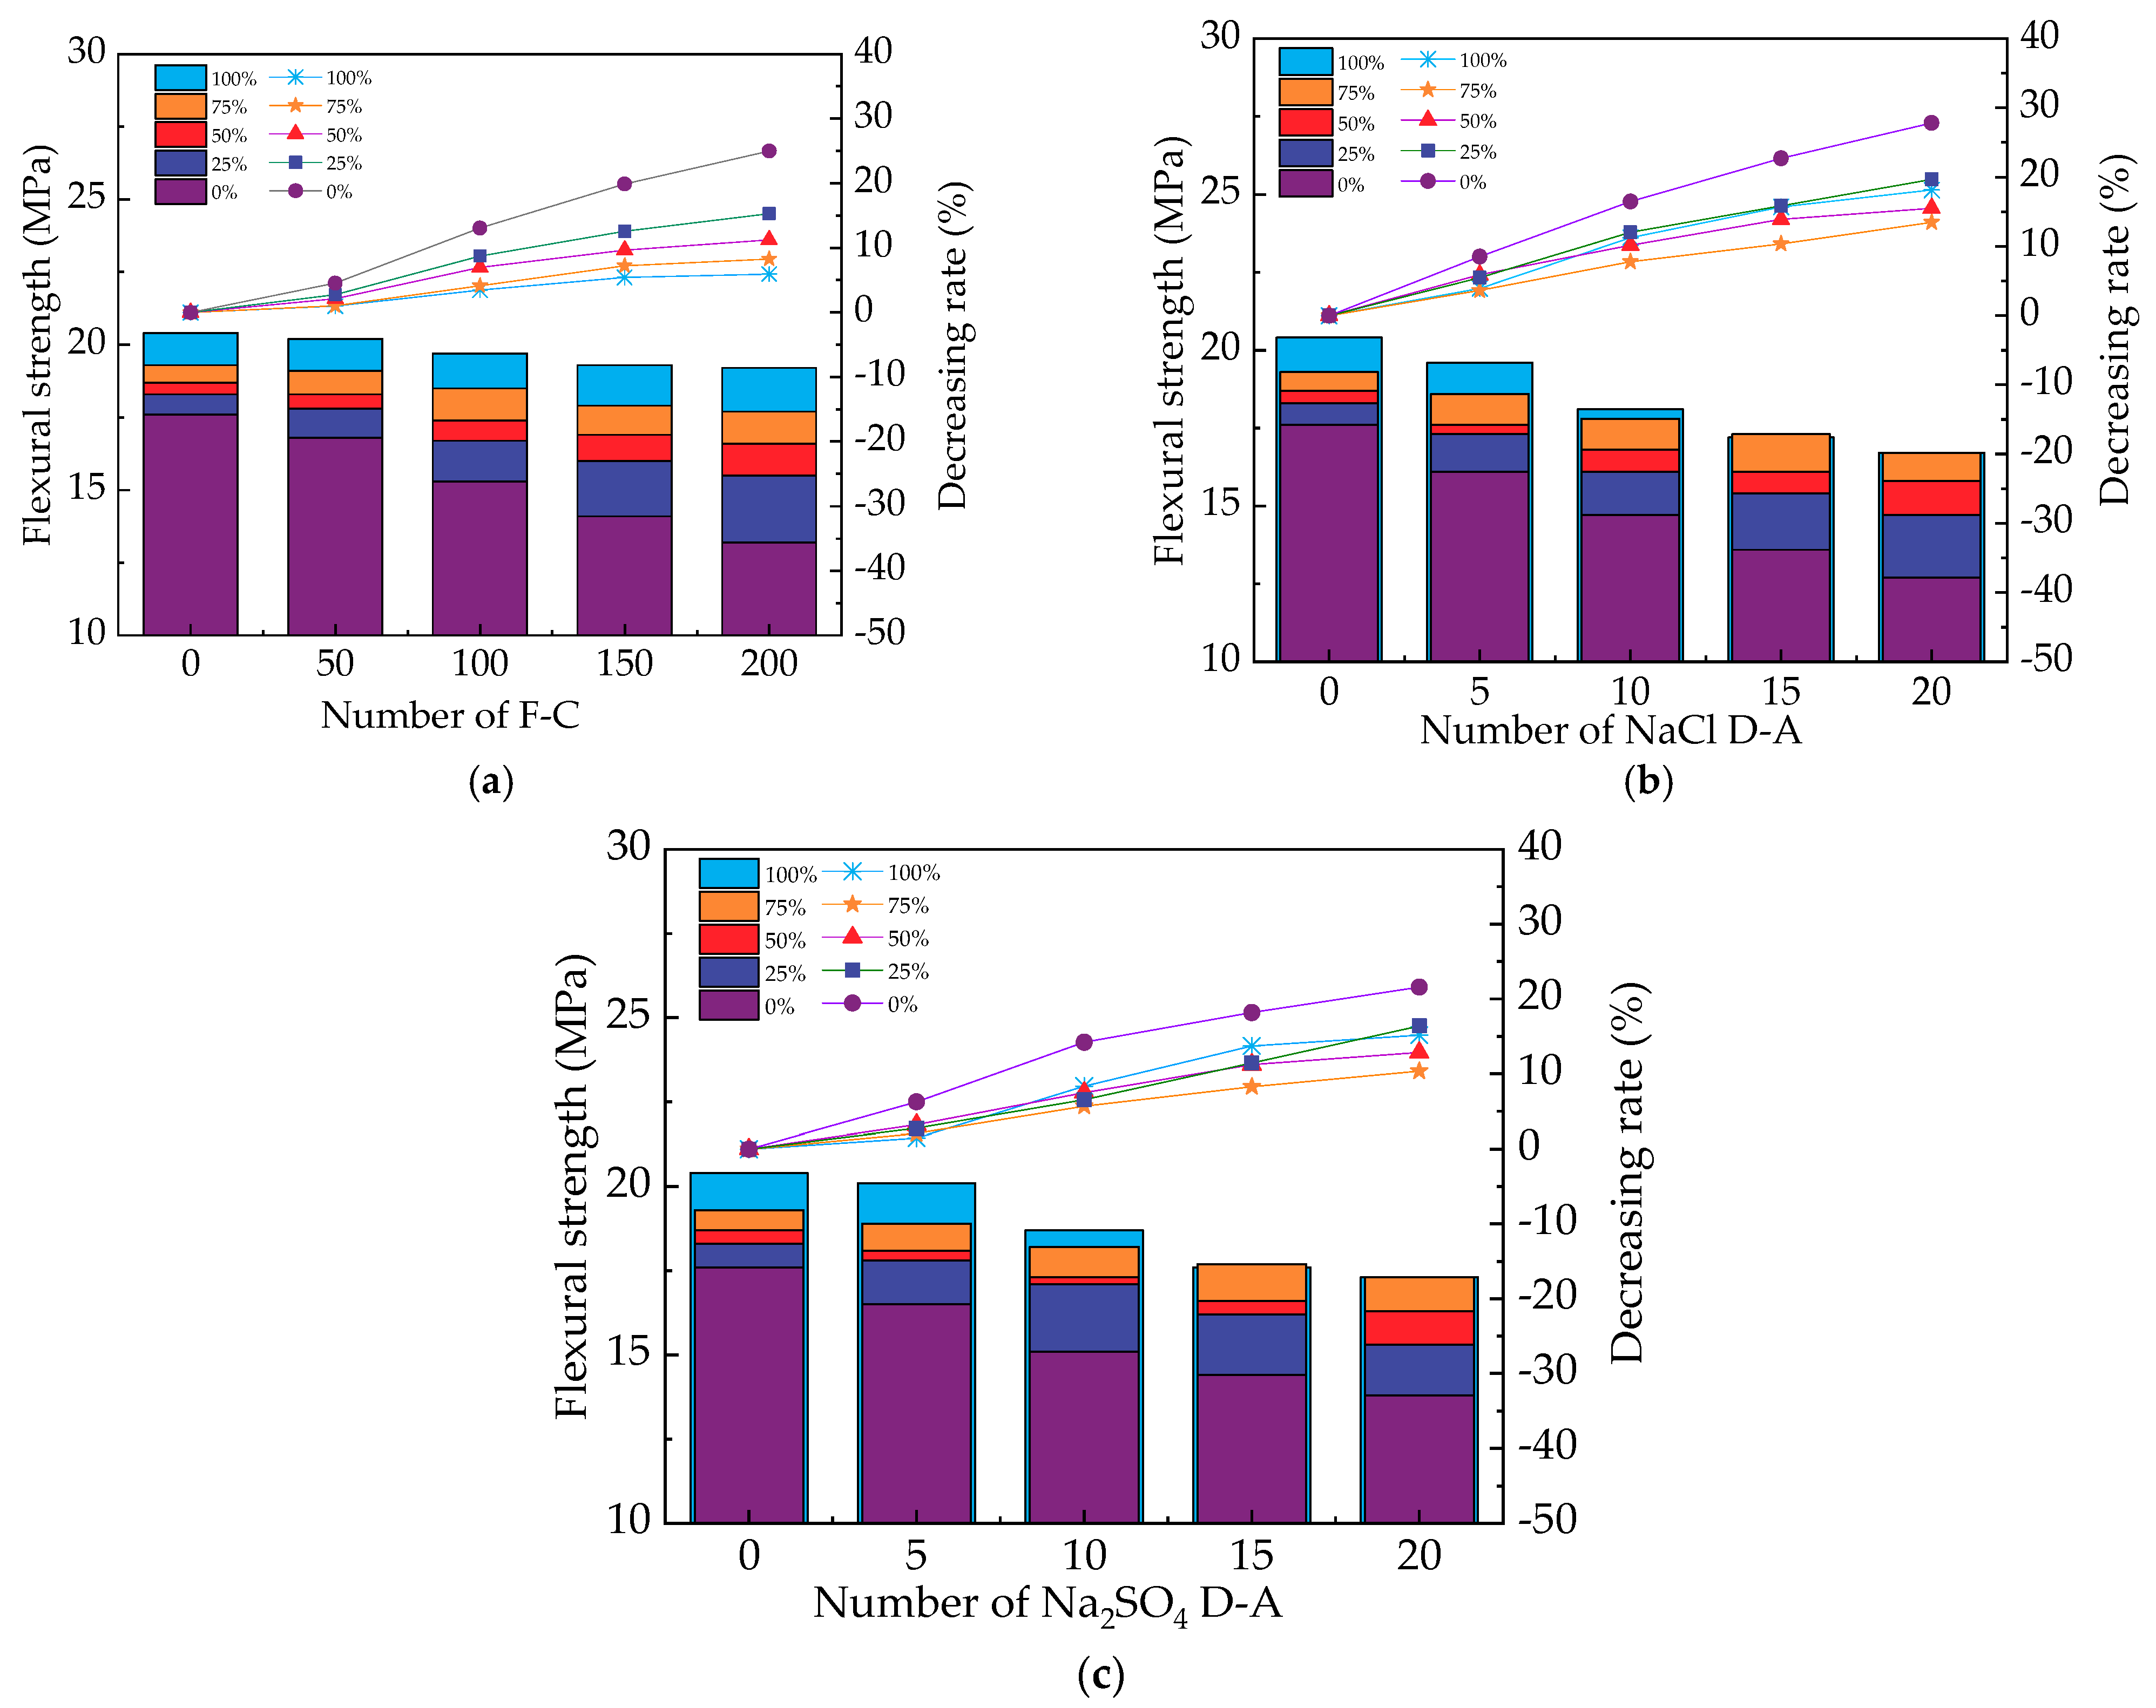
3.3. The Mechanical Strengths of UHPC

The ft of UHPC after suffering from different types of salt erosion are shown in Figure 6. The ft of UHPC decreases with the number of NaCl F-Cs, NaCl D-As and Na2SO4 D-As, due to the reason that the salt erosion can increase the number and widen the size of cracks in UHPC, decreasing the ft. As found in Figure 6, the UHPC after NaCl D-A action shows the lowest ft. However, when the mixed content of SAD is increased, the ft of the UHPC is increased. The SAD can increase the amount of aluminum hydroxide, which makes the hydration products more compact [34,35]. Hence, the ft is improved by adding SAD. The ft of UHPC after NaCl F-C action is the highest, while the ft of UHPC is the lowest after suffering from NaCl D-A erosion. After 200 NaCl F-Cs, 20 Na2SO4 and 20 NaCl D-As, the ft of UHPC decreases with the decreasing rates of 0.99%–25%, 3.92%–27.84% and 1.47%–21.59%. The SAD can increase the ft by 0%–23.4%, 0%–25.1% and 0%–13.4%.
Figure 7 shows the fcu of UHPC after suffering from different types of salt erosion. It can seen in Figure 7 that similar varying levels of fcu and ft occur. The fcu shows an increasing trend with the increasing quantity of SAD and a decreasing trend with the number of NaCl F-Cs, NaCl D-As and Na2SO4 D-As. The reasons for these results are the same with the ft’s results [36,37]. The relationship between the number of NaCl F-Cs, NaCl D-As and Na2SO4 D-As and the fcu coincides with the cubic function. The UHPC demonstrates the highest compressive strength when exposed to the NaCl F-C environment. However, the fcu of UHPC is the lowest after suffering 20 NaCl D-As. After 200 NaCl F-Cs, 20 Na2SO4 and 20 NaCl D-As, the fcu of UHPC decreases with the decreasing rates of 1.59%–10.31%, 3.09%–11.45% and 1.63%–9.62%. After the SAD is added, the fcu of UHPC increases to 4.13%–21.16%, 5.41%–22.76% and 5.53%–21.41%.

3.4. The CMC of UHPC

The CMC curves of the UHPC after suffering from different NaCl F-Cs, Na2SO4 and NaCl D-As are shown in Figure 8. The CMC of UHPC increases with the increased numbers of NaCl F-Cs and Na2SO4 and NaCl D-As, which is attributed to the cracking number and width [38,39]. The chloride ions migrate along the cracks, thereby increasing the CMC. The increasing quantity of SAD decreases the CMC of the UHPC, due to the improved compactness with the addition of SAD, which prevents the chloride ions from migrating along the cracks, thereby reducing the CMC. The relationships between the amount of salt erosion activity and the CMC fit the model of the cubic function shown in Equation (5). Table 6 shows the fitting equations of the relationships between the amount of erosion activity and the CMC. The R-squared of the fitting equations is higher than 0.91. After suffering 200 NaCl F-Cs and 20 Na2SO4 and 20 NaCl D-As, the CMCs are 3.68 × 10⁻¹² m2/s to 4.16 × 10⁻¹² m2/s, 3.59 × 10⁻¹² m2/s to 3.92 × 10⁻¹² m2/s and 4.03 × 10⁻¹² m2/s to 6.03 × 10⁻¹² m2/s. As established by the results, the CMC is the highest after treatment with 20 NaCl D-As. However, the CMC is the lowest after being exposed to 20 Na2SO4 D-As. The NaCl D-As can cause UHPC cracking the most seriously, simultaneously increasing the concentration of chloride ions in the UHPC pore solution. Therefore, the CMC of UHPC is the highest after the action of 20 NaCl D-As. However, the Na2SO4 D-A action induces the lowest number and width of cracks and cannot introduce chloride ions. Hence, the CMC of UHPC with 20 Na2SO4 D-As is the lowest. After the salt action, the CMC are decreased, with rates of 0% to 11.53%, 0% to 33.17% and 0% to 8.41% by adding SAD. As observed in Section 3.1, Section 3.2, Section 3.3 and Section 3.4, when the addition of MS is 100% (30% of the total binder materials), the resistance of the NaCl and Na2SO4 dry–wet alternations are the highest, which is ascribed to the pozzolanic effect.
C M C = a N 3 + b N 2 + c N + d

3.5. The Carbonation Depth of UHPC

Figure 9 exhibits the carbonation depth (Dc) of UHPC. The Dc shows the increasing trend with more occurrences of NaCl F-Cs and Na2SO4 and NaCl D-As, due to the increased cracks by the salt action [40]. The CO2 can infiltrate into the interior of the UHPC along the crack, leading to an accelerated carbonation reaction, thereby increasing the depth of carbonation. The relationships between the amount of salt erosion action and Dc fit the model of the cubic function shown in Equation (6). Table 7 shows the fitting equations of the relationships between the amount of erosion action and the CMC. The R-squared of the fitting equations is higher than 0.91. After suffering from 200 NaCl F-Cs, 20 Na2SO4 and 20 NaCl D-As, the Dc values are 1.86 mm to 2.31 mm, 1.79 mm to 2.23 mm and 2.11 mm to 2.76 mm. The Dc is the highest after being treated with 20 NaCl D-As. This is ascribed to the most serious cracking by the NaCl D-As, which increases the Dc. However, the crack width and number induced by the Na2SO4 D-A action is the lowest, resulting in the lowest Dc. The addition of SAD can decrease the Dc, with the decreasing rates of 19.48%, 23.55% and 19.73%. It can be determined from Figure 9, that a UHPC with 100% MS (30% of the total binder materials) shows the optimum anti-carbonation and penetration performance.
D c = a N 3 + b N 2 + c N + d

3.6. The SEM Photos of UHPC

The SEM pictures of the UHPC with 0%, 50% and 100% SAD are provided in Figure 10a–c. Moreover, the UHPC with 50% SAD exposed to 200 NaCl F-Cs, 20 Na2SO4 and 20 NaCl D-As are shown in Figure 10d–f. It can be observed in the photos that the rhombic hydration products decrease with the addition of SAD. With the increasing quantity of SAD, the hydration products become more compact. Some cracks are found in the SEM photos. The UHPC shows a higher number and wider cracks after 20 NaCl D-As. Meanwhile, the cracks are the lowest when the UHPC suffers from 20 Na2SO4 D-As.

4. Conclusions

The paper aims to investigate the attenuation of mechanical properties after suffering salt erosion. The conclusions are as described below.
The MR of UHPC increases in the cubic function with NaCl F-C, NaCl D-A and Na2SO4 D-A numbers. After 200 NaCl F-Cs, 20 Na2SO4 and 20 NaCl D-As, the MR are 0.76% to 1.47%, 1.24% to 1.97% and 1.42% to 2.14%.
The UHPC’s RME decreases in the cubic function with more rounds of NaCl F-Cs, NaCl D-As and Na2SO4 D-As. After suffering from 200 NaCl F-Cs, 20 Na2SO4 and 20 NaCl D-As, the RMEs of UHPC are 89.7% to 95.3%, 89.4% to 95.7% and 86.3% to 94.8%.
The relationship between the CMC and Dc and the amount of salt action shows the cubic function. When 200 NaCl F-Cs, 20 Na2SO4 and 20 NaCl D-As are finished, the CMCs are 3.68 × 10⁻¹² m2/s to 4.16 × 10⁻¹² m2/s, 3.59 × 10⁻¹² m2/s to 3.92 × 10⁻¹² m2/s and 4.03 × 10⁻¹² m2/s to 6.03 × 10⁻¹² m2/s, while the corresponding Dc values are 1.86 mm to 2.31 mm, 1.79 mm to 2.23 mm and 2.11 mm to 2.76 mm.
The ft and fcu demonstrate decreasing trends with the NaCl F-C, NaCl D-A and Na2SO4 D-A actions. After 200 NaCl F-Cs, 20 Na2SO4 and 20 NaCl D-As, the flexural strengths of UHPC decrease with the decreasing rates of 0.99%–25%, 3.92%–27.84% and 1.47%–21.59%, while the fcu of UHPC decreases with the decreasing rates of 1.59%–10.31%, 3.09%–11.45% and 1.63%–9.62%. The CMCs are decreased with the rates of 0% to 11.53%, 0% to 33.17% and 0% to 8.41% by adding SAD, after the salt action. The SAD can reduce the Dc with the decreasing rates of 19.48%, 23.55% and 19.73%.
UHPC with SAD shows an improved compact structure. After exposure to salt action, the UHPC that suffered from 20 NaCl D-As shows the largest number and highest width of cracks. However, when specimens are exposed to 20 Na2SO4 D-As, the number of cracks is the lowest and the width is the narrowest. When the mass ratio of SAD is 100% (30% of the total binder materials), the resistances of the UHPC’s CO2 penetration and NaCl and Na2SO4 dry–wet alternations are the best.

Author Contributions

Methodology, W.S., F.S., H.S. and H.W.; Software, H.S., F.S. and L.M.; Validation, H.S. and H.W.; Formal analysis, W.S.; Investigation, H.S. and F.S.; Resources, H.S.; Writing—original draft, H.S.; Writing—review & editing, H.W.; Project administration, H.W. All authors have read and agreed to the published version of the manuscript.

Funding

This research was funded by the Project of Science and Technology for Public Welfare of Ningbo City (Grant no. 2023J086), Zhejiang Provincial Natural Science Foundation [LY22E080005], Science and Technology Project of Jiangxi Province (20224BAB204074), and Horizontal Project Contract, grant number [No. YG20211111205].

Institutional Review Board Statement

Not applicable.

Informed Consent Statement

Not applicable.

Data Availability Statement

Data are contained within the article.

Conflicts of Interest

Authors Weixiang Sun and Lu Miao were employed by the company China Construction Infrastructure Co., Ltd. The remaining authors declare that the research was conducted in the absence of any commercial or financial relationships that could be construed as a potential conflict of interest.

References

  1. Cabrera Luna, K.; Maldonado Bandala, E.E.; Nieves Mendoza, D. Supersulfated binders based on volcanic raw material: Optimization, microstructure and reaction products. Constr. Build. Mater. 2018, 176, 145–155. [Google Scholar] [CrossRef]
  2. Han, F.; Song, S.; Liu, J.; Huang, S. Properties of steam-cured precast concrete containing iron tailing powder. Powder Technol. 2019, 345, 292–299. [Google Scholar] [CrossRef]
  3. Ince, C.; Derogar, S.; Gürkaya, K.; James Ball, R. Properties, durability and cost efficiency of cement and hydrated lime mortars reusing copper mine tailings of Lefke-Xeros in Cyprus. Constr. Build. Mater. 2021, 268, 121070. [Google Scholar] [CrossRef]
  4. Oschatz, M.; Antonietti, M. A search for selectivity to enable CO2 capture with porous adsorbents. Energy Environ. Sci. 2018, 11, 57–70. [Google Scholar] [CrossRef]
  5. Plaza, M.G.; Gonazlez, A.S.; Rubiera, F.; Pevida, C. Water vapour adsorption by a coffee-based microporous carbon: Effect on CO2 capture. J. Chem. Technol. Biotechnol. 2015, 90, 1592–1600. [Google Scholar] [CrossRef]
  6. Meor Yusoff, M.S.; Muslimin, M.; Paulus, W. Effect of fractional precipitation on quality of nanostructured alumina produced from black aluminium dross waste. Adv. Mater. Res. 2011, 173, 24–28. [Google Scholar] [CrossRef]
  7. Tsakiridis, P.E.; Oustadakis, P.; Agatzini-Leonardou, S. Aluminium recovery during black dross hydrothermal treatment. J. Environ. Chem. Eng. 2013, 1, 23–32. [Google Scholar] [CrossRef]
  8. Lou, B.J.; Shen, H.L.; Liu, B.; Liu, J.; Zhang, S.G. Recycling secondary aluminum dross to make building materials: A review. Constr. Build. Mater. 2023, 409, 133989. [Google Scholar] [CrossRef]
  9. Zhang, S.Y.; Wang, K.; Li, H.; Zhang, X.Q.; Jiang, Y.L. Novel SCMs produced by the calcination of secondary aluminium dross with dolomite and their potential usage in cemented paste backfill. Constr. Build. Mater. 2023, 365, 130119. [Google Scholar] [CrossRef]
  10. Satish, R.; Neeraja, D. Mechanical and durability aspects of concrete incorporating secondary aluminium slag. Resour. Effic. Technol. 2016, 2, 225–232. [Google Scholar]
  11. Yoshimura, H.N.; Abreu, A.P.; Molisani, A.L.; Camargo, A.C.; Portela, J.C.S.; Narita, N.E. Evaluation of aluminum dross waste as raw material for refractories. Ceram. Int. 2008, 34, 581–591. [Google Scholar] [CrossRef]
  12. Zawrah, M.F.; Ghanaym, E.E.; Sadek, H.E.H.; El Defrawy, S.A.; Ali, O.A.M. Synthesis, characterization and sinterability of pure and Ni-doped nano layered double hydroxides from aluminum dross. Ceram. Int. 2019, 45, 17598–17610. [Google Scholar] [CrossRef]
  13. Rotana, H.; Claudia, P.O. On utilization and mechanisms of waste aluminium in mitigating alkali-silica reaction (ASR) in concrete. J. Clean. Prod. 2019, 212, 864–879. [Google Scholar]
  14. Socrates, P.M.P.; Juan, M.G.C. Influence of the secondary aluminum chip on the physical and mechanical properties of concrete. Innov. Infrastruct. Solut. 2023, 8, 45. [Google Scholar]
  15. Kočí, V.; Vejmelková, E.; Koňáková, D.; Pommer, V.; Grzeszczyk, S.; Matuszek-Chmurowska, A.; Mordak, A.; Černý, R. Basic physical, mechanical, thermal and hygric properties of reactive powder concrete with basalt and polypropylene fibers after high-temperature exposure. Constr. Build. Mater. 2023, 374, 130922. [Google Scholar] [CrossRef]
  16. Hong, X.; Wang, H.; Shi, F. Influence of NaCl freeze thaw cycles and cyclic loading on the mechanical performance and permeability of sulphoaluminate cement reactive powder concrete. Coatings 2020, 10, 1227. [Google Scholar] [CrossRef]
  17. Suescum-Morales, D.; Silva, R.V.; Bravo, M.; Jiménez, J.R.; Fernández-Rodríguez, J.M.; Brito, J.D. Effect of incorporating municipal solid waste incinerated bottom ash in alkali-activated fly ash concrete subjected to accelerated CO2 curing. J. Clean. Prod. 2022, 370, 133533. [Google Scholar] [CrossRef]
  18. Kaliyavaradhan, S.K.; Li, L.F.; Ling, T.C. Response surface methodology for the optimization of CO2 uptake using waste concrete powder. Constr. Build. Mater. 2022, 340, 127758. [Google Scholar] [CrossRef]
  19. Boulahbal, A.I.; Santamaría, L.; Azizi, A.; Boutahala, M.; Korili, S.A.; Gil, A. Synthesis of Cu-Al layered double hydroxides from aluminum saline slags. Miner. Eng. 2023, 204, 108413. [Google Scholar] [CrossRef]
  20. Bai, L.; Liu, H.; Wang, H. The Influence of CO2-Cured Boiler Cinder on the Mechanical Strength of RPC Exposed to NaCl Erosion. Coatings 2023, 13, 1021. [Google Scholar] [CrossRef]
  21. Alderete, N.M.; Joseph, A.M.; Van den Heede, P.; Matthys, S.; De Belie, N. Effective and sustainable use of municipal solid waste incineration bottom ash in concrete regarding strength and durability. Resour. Conserv. Recycl. 2021, 167, 105356. [Google Scholar] [CrossRef]
  22. Jiang, H.; Wang, W.; Wang, H. The Corrosion Resistance of Reinforced Reactive Powder Concrete with Secondary Aluminum Ash Exposed to NaCl Action. Materials 2023, 16, 5615. [Google Scholar] [CrossRef] [PubMed]
  23. Gursel, A.P.; Maryman, H.; Ostertag, C. A life-cycle approach to environmental, mechanical, and durability properties of “green” concrete mixes with rice husk ash. J. Clean. Prod. 2016, 112, 823–836. [Google Scholar] [CrossRef]
  24. Tarangini, D.; Sravana, P.; Srinivasa Rao, P. Effect of nano silica on frost resistance of pervious concrete. Mater. Today Proc. 2022, 51, 2185–2189. [Google Scholar] [CrossRef]
  25. Meshram, A.; Gautam, D.; Singh, K. Recycling of white aluminium dross: Production of potash alum. Trans. Indian. Inst. Met. 2020, 73, 1239–1248. [Google Scholar] [CrossRef]
  26. Ismail, I.; Bernal, S.A.; Provis, J.L.; San Nicolas, R.; Brice, D.G.; Kilcullen, A.R.; Hamdan, S.; Deventer, J.S. Influence of fly ash on the water and chloride permeability of alkali-activated slag mortars and concretes. Constr. Build. Mater. 2013, 48, 1187–1201. [Google Scholar] [CrossRef]
  27. Mahinroosta, M.; Allahverdi, A. A promising green process for synthesis of high purity activated-alumina nanopowder from secondary aluminum dross. J. Clean. Prod. 2018, 179, 93–102. [Google Scholar] [CrossRef]
  28. Sarikaya, Y.; Sevinç, I.; Akinç, M. The effect of calcinations temperature on some of the adsorptive properties of fine alumina powders obtained by emulsion evaporation technique. Powder Technol. 2001, 116, 109–114. [Google Scholar] [CrossRef]
  29. Serelis, E.; Vaitkevicius, V. Effect of waste glass powder and liquid glass on the Physico-Chemistry of Aluminum-Based Ultra-Lightweight concrete. Constr. Build. Mater. 2023, 390, 131615. [Google Scholar] [CrossRef]
  30. Song, Y.; Li, B.; Yang, E.-H.; Liu, Y.; Ding, T. Feasibility Study on Utilization of Municipal Solid Waste Incineration Bottom Ash as Aerating Agent for the Production of Autoclaved Aerated concrete. Cem. Concr. Compos. 2015, 56, 51–58. [Google Scholar] [CrossRef]
  31. Almeida, V.O.; Silvestro, L.; Gleize, P.J.; Kirchheim, A.P.; Schneider, I.A. Application of leached iron ore tailings to produce sustainable cements. Constr. Build. Mater. 2023, 377, 131095. [Google Scholar] [CrossRef]
  32. Miguel, F.; Brito, J.D.; Silva, R.V. Durability-related performance of recycled aggregate concrete containing alkali-activated municipal solid waste incinerator bottom ash. Const. Build. Mater. 2023, 397, 132415. [Google Scholar] [CrossRef]
  33. IV, G.M.; Sinnan, R.; Young, M. Evaluation of reclaimed municipal solid waste incinerator sands in concrete. J. Clean. Prod. 2019, 229, 838–849. [Google Scholar]
  34. Feng, H.G.; Wang, L.; Li, G.; Jin, Q. Removal of impurities for the synthesis of high-property alumina-spinel ceramic from secondary aluminum dross. Ceram. Int. 2023, 49, 34616–34626. [Google Scholar] [CrossRef]
  35. Xu, L.; Li, X.B.; Liu, Y.; Chen, M.; Wang, N. Recovery of low phosphorus iron from steel slag using secondary aluminum dross as the reductant. J. Environ. Chem. Eng. 2023, 11, 110973. [Google Scholar] [CrossRef]
  36. Tran, H.; Sorelli, L.; Hisseine, O.A.; Bouchard, D.; Brail, V.; Sanchez, T.; Conciatori, D.; Ouellet-Plamondon, C. Development of sustainable ultra-high performance concrete recycling aluminum production waste. Constr. Build. Mater. 2023, 371, 130212. [Google Scholar] [CrossRef]
  37. Aninda, S.S.; Islam, M.S. Effectiveness of waste concrete powder in fabricating compressed stabilized earth blocks: Strength, durability and thermal assessment. J. Build. Eng. 2023, 80, 107989. [Google Scholar] [CrossRef]
  38. Liu, Q.; Zhang, Z.; Zhang, S.G.; Li, X.L.; Long, H.C.; Meng, X.X.; Melnikov, A.; Gagarin, L. The influence of particle morphology on the long-term strength of sandy soil under freeze-thaw cycles. Case. Stud. Constr. Mater. 2023, 18, e02196. [Google Scholar] [CrossRef]
  39. Beltrame, N.A.M.; Dias, R.L.; Witzke, F.B.; Medeiros-Junior, R.A. Effect of carbonation curing on the physical, mechanical, and microstructural properties of metakaolin-based geopolymer concrete. Constr. Build. Mater. 2023, 406, 133403. [Google Scholar] [CrossRef]
  40. Esmeryan, K.D.; Fedchenko, Y.I. Superhydrophobic soot as a mechanically robust, heat insulating and anti-corrosion protective coating for concrete surfaces. Colloids Surf. A 2023, 672, 131723. [Google Scholar] [CrossRef]
Figure 1. The experiment of quick freeze–thaw action.
Coatings 14 00189 g001
Figure 2. The experiment of Na2SO4 D-A action.
Coatings 14 00189 g002
Figure 3. The flowchart of the experimental process.
Coatings 14 00189 g003
Figure 4. The MR of UHPC exposed to erosion action. (a) NaCl F-C action. (b) NaCl D-A action. (c) Na2SO4 D-A action.
Coatings 14 00189 g004
Figure 5. The RDEM of UHPC exposed to erosion action. (a) NaCl F-C action. (b) NaCl D-A action. (c) Na2SO4 D-A action.
Coatings 14 00189 g005
Figure 6. The flexural strengths of UHPC under erosion action. (a) NaCl F-C action. (b) NaCl D-A action. (c) Na2SO4 D-A action.
Coatings 14 00189 g006
Figure 7. The compressive strength of UHPC exposed to erosion action. (a) NaCl F-C action. (b) NaCl D-A action. (c) Na2SO4 D-A action.
Coatings 14 00189 g007
Figure 8. The CMC of UHPC exposed to erosion action. (a) NaCl F-C action. (b) NaCl D-A action. (c) Na2SO4 D-A action.
Coatings 14 00189 g008
Figure 9. The Dc of UHPC exposed to erosion action. (a) NaCl F-C action. (b) NaCl D-A action. (c) Na2SO4 D-A action.
Coatings 14 00189 g009
Figure 10. The SEM photos of UHPC exposed to erosion action. (a) UHPC with 0% SAD. (b) UHPC with 50% SAD. (c) UHPC with 100% SAD. (d) UHPC with 50% SAD after NaCl F-C. (e) UHPC with 50% SAD after NaCl D-A. (f) UHPC with 50% SAD after Na2SO4 D-A.
Coatings 14 00189 g010aCoatings 14 00189 g010b
Table 1. Chemical composition (%).
TypesSiO2Al2O3FexOyMgOCaOSO3K2ONa2OTi2OLoss on
Ignition
OPC20.35.83.91.962.22.8---3.1
FA90.400.330.620.350.420.217.49---
QS98.7-1.3-------
SAD4.779.24.35.21.6--0.9-3.8
Table 2. The accumulated pass rate (%).
TypesParticle Size/μm
0.30.614864360
OPC0.130.363.114.829.292.8100
FA32.1159.1283.16100100100100
QS00000.03524100
SAD0.040.310.551.113.9525.488.13
Table 3. The mixing proportions of UHPC (kg/m3).
SamplesWaterOPCSADFAQS WR
SAD-0%241.2843.30365.5965.416.1
SAD-25%241.2843.391.4274.1965.416.1
SAD-50%241.2843.3182.8182.8965.416.1
SAD-75%241.2843.3274.191.4965.416.1
SAD-100%241.2843.3365.50965.416.1
Table 4. The fitting equations of the relationship between the amount of erosion action and the MR.
Equation TypesSAD ContentabcdR2
NaCl F-C0%6.33 × 10⁻⁷−1.96 × 10−42.17 × 10−21.42857 × 10−40.99
25%5.58 × 10⁻⁷−1.75 × 10−41.75 × 10−2−1 × 10−30.99
50%5.12 × 10⁻⁷−1.51 × 10−41.42 × 10−2−1.99 × 10−161.00
75%4.44 × 10⁻⁷−1.28 × 10−41.27 × 10−2−5.96 × 10−161.00
100%3.33 × 10⁻⁷−9.51 × 10−59.5 × 10−32.29 × 10−30.98
NaCl D-A0%4.40 × 10⁻⁴−1.54 × 10−22.38 × 10−1−8.57 × 10−30.99
25%2.60 × 10⁻⁴−1.04 × 10−21.97 × 10−1−9.57 × 10−30.98
50%2.13 × 10⁻⁴−9.03 × 10−31.77 × 10−1−7.43 × 10−30.99
75%1.87 × 10⁻⁴−7.71 × 10−31.58 × 10−1−7.71 × 10−30.99
100%6.67 × 10⁻⁵−4.11 × 10−31.27 × 10−1−9.71 × 10−30.98
Na2SO4 D-A0%3.67 × 10⁻⁴−1.27 × 10−30.21−1.01 × 10−20.99
25%1.67 × 10⁻⁴−7.51 × 10−30.17−6.71 × 10−30.99
50%6.00 × 10⁻⁵−4.06 × 10−30.13−3.86 × 10−30.99
75%4.67 × 10⁻⁵−3.46 × 10−30.12−1.86 × 10−30.99
100%6.67 × 10⁻⁵−3.40 × 10−30.10−6 × 10−30.98
Table 5. The fitting equations of the relationships between the amount of erosion action and the RDEM.
Equation TypesSAD ContentabcdR2
NaCl F-C0%1.00 × 10⁻⁶−1.14 × 10⁻⁴−6.86 × 10−299.980.99
25%1.93 × 10⁻⁶−5.49 × 10⁻⁴−1.21 × 10−299.970.99
50%8.67 × 10⁻⁷−3.03 × 10⁻⁴−1.26 × 10−299.980.99
75%−8.67 × 10−71.34 × 10−4−2.47 × 10−2100.020.99
100%−2 × 10⁻⁷−1.43 × 10⁻⁵−1.26 × 10−2100.020.99
NaCl D-A0%−4.67 × 10⁻⁴−2.69 × 10⁻²−1.0499.980.99
25%1.73 × 10⁻³−4.43 × 10⁻²−0.3399.970.99
50%6.00 × 10⁻⁴−1.77 × 10⁻²−0.33100.020.99
75%−1.13 × 10−32.49 × 10−3−0.41100.030.99
100%1.33 × 10⁻⁴−8.29 × 10⁻³−0.15100.010.99
Na2SO4 D-A0%1.20 × 10⁻³−0.02−0.6199.940.99
25%2 × 10⁻³−0.06−0.0999.940.99
50%1 × 10⁻³−0.03−0.14100.020.99
75%−6 × 10−40.01−0.24100.040.98
100%2 × 10⁻⁴−0.01−0.06100.010.99
Table 6. The fitting equations of the relationship between the amount of erosion action and the CMC.
Equation TypesSAD ContentabcdR2
NaCl F-C0%1.4 × 10⁻⁷−3.49 × 10−51.21 × 10−21.990.96
25%2.67 × 10−83.06 × 10−53.12 × 10−31.940.98
50%2.53 × 10⁻⁷−2.63 × 10−55.62 × 10−31.840.98
75%3.73 × 10⁻⁷−5.8 × 10−57.17 × 10−31.700.97
100%3.2 × 10⁻⁷−4.34 × 10−56.09 × 10−31.620.94
NaCl D-A0%1.63 × 10⁻³−0.060.802.060.94
25%1.55 × 10⁻³−0.060.741.990.97
50%1.03 × 10⁻³−0.040.581.890.93
75%1.29 × 10⁻³−0.050.611.750.95
100%8.73 × 10⁻⁴−0.030.351.660.97
Na2SO4 D-A0%−6.00 × 10−52.6 × 10−30.07−1.980.91
25%−6.67 × 10−56.11 × 10−3−2.62 × 10−31.950.98
50%2.27 × 10⁻⁴−1.63 × 10−33.59 × 10−21.840.98
75%3.87 × 10⁻⁴−5.51 × 10−30.051.710.98
100%3.8 × 10⁻⁴−4.46 × 10−30.031.630.99
Table 7. The fitting equations of the relationships between the amount of erosion action and the Dc.
Equation TypesSAD ContentabcdR2
NaCl F-C0%1.8 × 10⁻⁷−5.89 × 10−59.42 × 10−31.340.99
25%8 × 10⁻⁸−2.86 × 10−57.31 × 10−31.210.99
50%−9.33 × 10−82.49 × 10−53.16 × 10−31.150.95
75%−6.67 × 10−98.57 × 10−74.45 × 10−31.070.97
100%−8.67 × 10−82.91 × 10−51.89 × 10−31.000.98
NaCl D-A0%1.2 × 10⁻⁴−5.94 × 10−30.141.350.98
25%−6.67 × 10−54 × 10−40.081.240.96
50%−1.8 × 10−44.77 × 10−30.041.180.91
75%−1 × 10⁻⁴−2 × 10−30.061.100.93
100%−1.87 × 10−44.89 × 10−30.031.020.95
Na2SO4 D-A0%6.67 × 10⁻⁶−2.86 × 10−50.041.330.96
25%−2 × 10−52.86 × 10−50.051.200.97
50%−6 × 10−52.11 × 10−30.021.150.97
75%−6 × 10−45.37 × 10−3−6.6 × 10−31.080.99
100%−1.47 × 10−46.17 × 10−3−0.031.010.99
Disclaimer/Publisher’s Note: The statements, opinions and data contained in all publications are solely those of the individual author(s) and contributor(s) and not of MDPI and/or the editor(s). MDPI and/or the editor(s) disclaim responsibility for any injury to people or property resulting from any ideas, methods, instructions or products referred to in the content.

