Article

Constructing a Mathematical Model of Product Color Design Based on Data Mining: Case Study of a Thermos Cup

1
College of Furnishing and Industrial Design, Nanjing Forestry University, Nanjing 210037, China
2
Co-Innovation Center of Efficient Processing and Utilization of Forest Resources, Nanjing Forestry University, Nanjing 210037, China
*
Author to whom correspondence should be addressed.
Coatings 2024, 14(2), 209; https://doi.org/10.3390/coatings14020209
Submission received: 4 January 2024 / Revised: 31 January 2024 / Accepted: 3 February 2024 / Published: 6 February 2024
(This article belongs to the Special Issue Advances in Protective, Decorative, or Functional Metal Oxide Layers)

Abstract

:
In product design, color is the first element that acts on the human visual senses and significantly influences consumer decisions. This study aimed to analyze consumers’ color preferences for products and explore the mathematical patterns of product color design. Firstly, sales data and images of popular thermos cups from Tmall and Jingdong (JD), two prominent e-commerce platforms in China, were obtained through data mining. Subsequently, this research focused on single-color thermos cups with high sales as the research subject, extracting the hue (H), saturation (S), and value (V) for each cup from the product images. Furthermore, a 3D scatter plot of HSV values was generated using Origin Pro, visually representing the consumers’ color preferences. Finally, this study examined the relationships among HSV values of the popular product colors through multiple regression analysis and constructed a mathematical model for HSV. This method enables manufacturers to gain valuable insights into consumer color preferences, facilitating digital color design and enhancing design efficiency and accuracy.

1. Introduction

Manufacturers often design multiple colors when creating color schemes to meet consumers’ personalized needs while achieving product diversification and serialization at a lower cost [1,2]. Understanding consumer color preferences accurately and promoting product sales has long been a concern for researchers.
In the past, color design relied heavily on the intuition and experience of designers [3]. With the advancement of technology, computer-aided design can provide more assistance in product color design and satisfy consumer preferences. For example, Tian et al. [4] developed a computer-aided custom sofa color system, which can improve the efficiency and quality of consumer color selection and customer satisfaction with customized sofas. Hsiao et al. [5] built a color design/selection system for designing colors and helping consumers choose suitable clothing colors based on their skin color. Whether relying on the abilities of designers or utilizing computer algorithms, one of the critical tasks in the early stages of the design is to investigate users’ aesthetic preferences. Currently, research for this purpose mainly focuses on existing products and employs small sample statistics. However, the widespread use of big data technology offers the possibility of extensive user research and market trend analysis. Data mining can rapidly acquire a large amount of user behavioral data, from which numerous diverse and fragmented types of information can be obtained.
This article aimed to extract valuable information from big data and apply this method to rapidly collect user behavior data for color preference analysis and quantitative color research. This research approach has broader applications and provides more accurate results. It offers manufacturers a more scientific, accurate, and efficient way to understand consumer color preferences and consumption behavior. The present research not only focuses on consumers’ choices and purchasing behavior in product colors but also establishes a quantitative relationship among the HSV attributes of color models of popular products using mathematical models. This quantitative color research can assist manufacturers in gaining a more accurate understanding of consumer demands and optimizing product color designs.

2. Literature Review

The research on color is extensive, among which studies on individual color preference are the most concentrated. These studies covered external factors influencing color preferences (such as gender, age, educational background, et al. [6]) and the reasons behind color preference formation [7]. Internal factors like RGB and HSV also impact color preference. For example, Gou et al. [8] studied residents’ preferences for the color of urban buildings and found that several factors influence citizens’ hue preferences, including gender, age, occupation, monthly income, and cultural background, such as men engaged in business management or professional occupations tending to prefer red–blue, blue, blue–green, green, and neutral colors. On the other hand, women who are teachers or white-collar workers tend to prefer warmer and more vibrant colors like yellow, red, and red–yellow. The younger population, below 30, tends to lean toward green, red–yellow, and red–blue colors. Additionally, individuals with a monthly income above 10,000 yuan prefer green and green–yellow colors. In another study, Zhang et al. [9] examined the influence of age and gender on color preferences among Chinese adults. Their study found that Chinese women prefer cyan, white, pink, and light colors more than men, while they have a lower preference for red, orange, and dark colors. Additionally, preferences for blue, purple, yellow, white, black, and light colors gradually decrease with age.
However, personal color preferences are not the sole criterion for purchasing decisions in specific consuming behaviors. Jiang et al. [10] found that color preference has some influence on teenagers’ furniture selection, but the extent varies according to functional spaces and furniture categories. Yu et al. [11] found that consumers tend to buy their favorite colors. However, personal color preferences are secondary factors, and the impacts of color functionality and product category on purchasing decisions are critical. That means people’s color preferences are diverse and will be affected by the functions and categories of products, showing different color preferences for different products. Therefore, many studies have focused on consumers’ color preferences for different types of products.
In previous studies, researchers typically used questionnaire surveys and interviews to obtain information about consumers’ color preferences. For example, Yu et al. [12] used interviews to understand why people choose a particular color of a product when shopping, inferring the relationship between personal color associations and product purchasing decisions. Bakker et al. [6] used questionnaire surveys to research the relationship between color preferences and personal characteristics of different topics.
Although questionnaire surveys and interviews are widely used, they also have limitations. First, due to the influence of individual differences and subjective feelings, the conclusions obtained are essentially a subjective evaluation and may not have universal adaptability. Second, the information provided about colors in the questions is mainly verbal (such as the names of colors like “blue” and “red”) or images that express colors more intuitively (such as products being modified in Adobe Photoshop to become different colors). Sometimes, this limits the accuracy of the subjects’ color selection, which may lead to a lack of authenticity in the results. In addition, the sample size of questionnaire surveys and interviews is usually between 50–200 people. If the sample size is insufficient, it may affect the research results on color preferences. Therefore, it is necessary to use objective and quantitative color data in the experimental design and ensure that the sample size is sufficient to make the study of product color preference more scientific and reliable.
Currently, more and more methods and tools are available to obtain consumers’ preferences for product colors objectively. For example, Yu et al. [13] used eye-tracking movement technology to research consumers’ preferences for red sandalwood and wenge wood furniture with different hue (H) and lightness (L) values, providing a more reliable research method for studying color preferences through quantitative analysis of physiological data. Some tools can obtain specific color data. Li et al. [14] obtained the hue (H), saturation (S), and value (V) of ancient Chinese clothing with a Datacolor650 spectrophotometer. Zheng [15] et al. used Adobe Clour CC to obtain HSV values from interior photographs. Many scholars have proposed methods for transforming color features into numerical values for quantitative research, laying the foundation for building a regularity or prediction model. Zhou et al. [16] used a CHN Spec color picker to extract the hue (H), value (V), and chroma (C) values of wardrobe furniture, analyzed the data characteristics, and established a color selection system for wardrobe furniture based on the Munsell color system, the Mont-Spencer principle of color harmony, and the Birkhoff beauty rating system. It was used to help the company re-plan the color scheme of its wardrobe products. Zhao et al. [17] utilized the K-Means clustering method to analyze the objective law of Yi costume colors. Based on the features of Yi costume’s primary colors in the HSV color space, they proposed objective evaluation indicators to evaluate the color scheme and help improve it. After data processing and mathematical modeling, these studies showed that quantified color features can be applied in specific fields and assist product color design.
We found that the HSV, HVC, and HSL color spaces are commonly used in color extraction. These color spaces are based on human visual perception characteristics and provide a more direct description of color appearance, including brightness and saturation, which align with our everyday description of color. Additionally, they can better overcome issues such as uneven surface colors caused by intense light, shadow, occlusion, or texture [18,19]. This paper employed the HSV color model for our research. Compared to other models, HSV offers more advantages in computer graphics processing, ensuring accurate color information extraction on computer screens.
Based on the above content, this research used data mining to obtain sales data and pictures of thermos cups to solve the problems of limited sample size and color information in questionnaire surveys and interviews. Due to user privacy, this study does not delve into potential factors influencing color preferences. However, the objectivity of consumer data reflects their actual color selection behavior. By utilizing Adobe Color, we extracted the HSV values of product images to analyze consumers’ preferences for thermos cup color quantitatively. According to these numerical values, we explored whether there was a mathematical law in the color of hot-selling products and built a mathematical model.

3. Methods

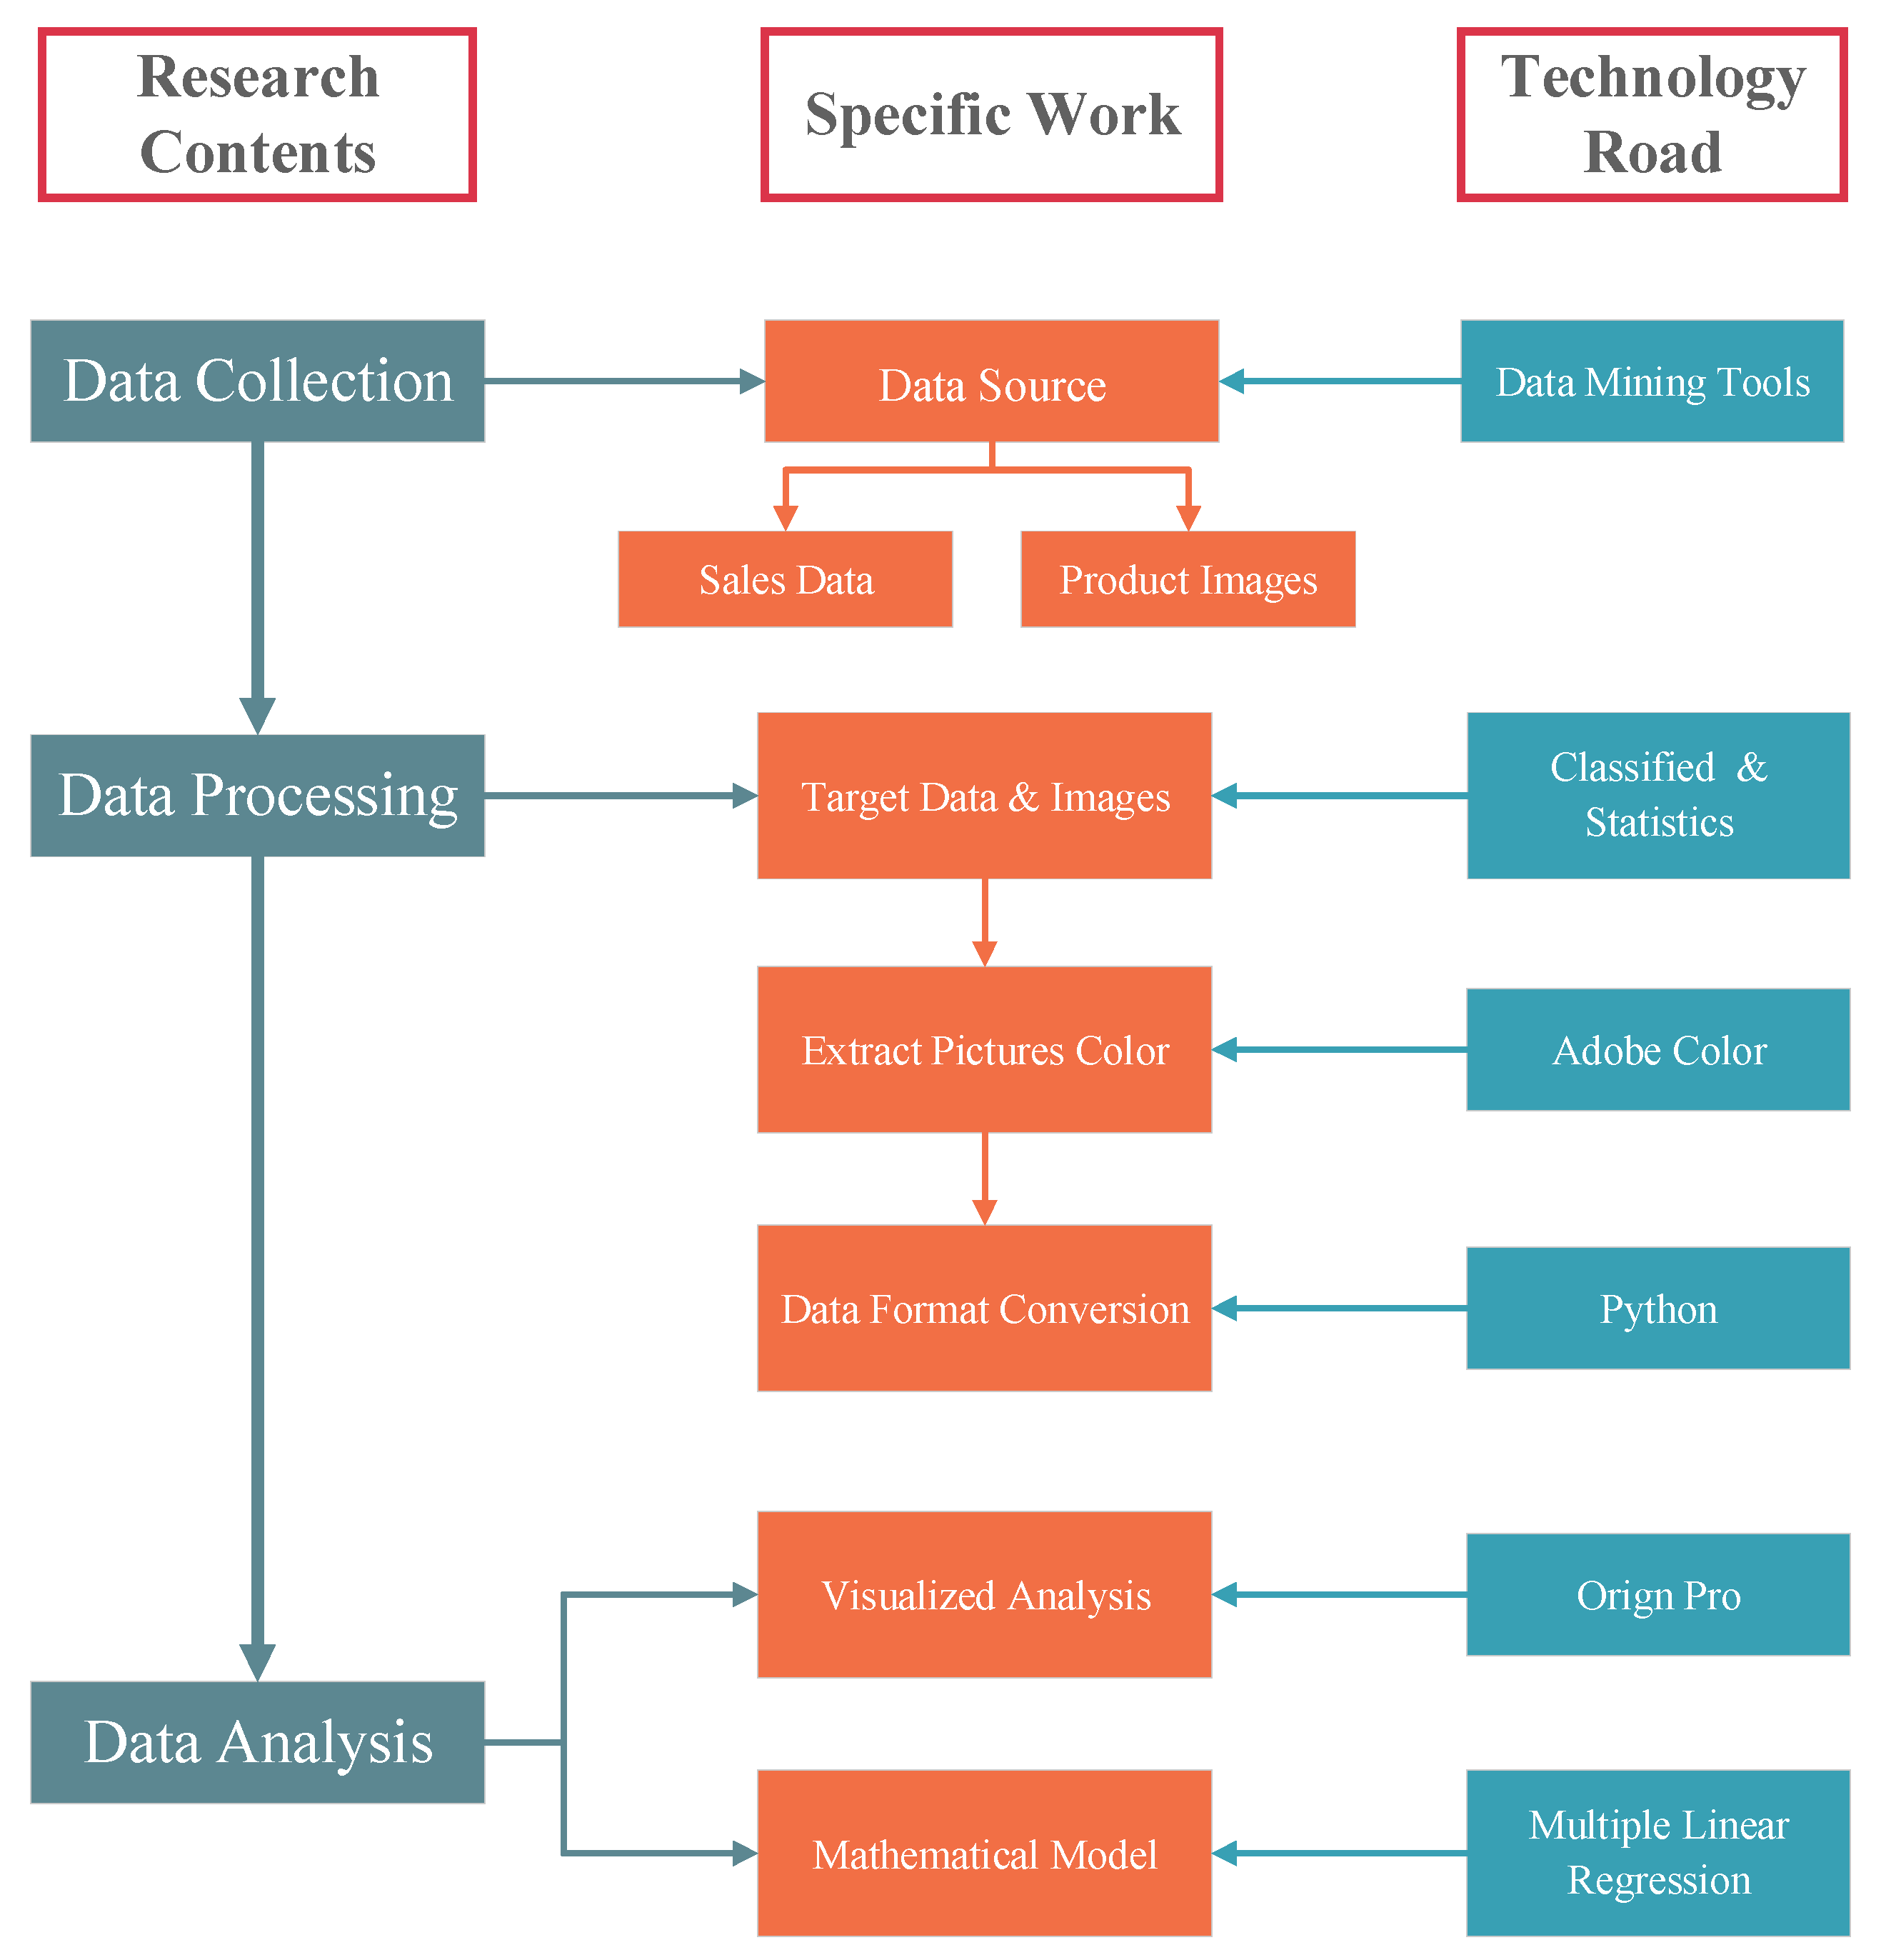
Based on the guidance of data mining, this paper explored and researched the data set. Data mining (DM) analyzes observed data sets and discovers unknown relationships through six stages: problem definition, creating target data sets, data processing, data visualization, building a mathematical model, and problem-solving, thus allowing data owners to understand data relationships and summarize their data [20,21]. The details are as follows.

3.1. Step 1: Problem Definition

First, determine the problem being attempted to solve and determine the goal of data mining. A data mining plan is then devised based on this goal. Generally, data mining tasks can be divided into two main categories: descriptive tasks and predictive tasks. Descriptive tasks identify patterns and relationships in the data, whereas predictive tasks use existing data to make predictions [22]. This study aimed to explore the possible patterns in the HSV values of popular products and establish a mathematical model using data mining, which falls under the definition of a descriptive task. The research framework is shown in Figure 1.

3.2. Step 2: Creating Target Data Sets

Based on the first stage’s questions, the necessary dataset for the study needs to be determined. Simple investigations are needed in this process to ensure high-quality data can be obtained. In this step, we need to get information, such as online shopping platforms, product sales rankings, and product pictures. These data are available from Jingcanmou, a professional e-commerce data analysis online platform that provides free access to sales data from JD and Tmall (two popular online shopping platforms in China) from February to April 2022. Sales data can be obtained for the top 200 items on JD and the top 100 on Tmall. All images of products with the same name could be collected (Table 1). The samples were selected from different styles of thermos cups under the brand FUGUA, as indicated by the intersection in Figure 2. JD.com and Tmall are the two largest e-commerce shopping platforms in China, with the majority of their user base consisting of urban residents spanning a wide age range, typically between 20 and 50 years old. This diversity allows these two e-commerce platforms to attract and serve consumers from different age groups and regions, providing a rich and diverse selection of goods to meet users’ personalized needs.

3.3. Step 3: Data Processing

Data acquisition can obtain massive amounts of data, but not all are suitable for follow-up research. Therefore, this step needs to select the data from the collected data, eliminate irrelevant data, and convert the data into a unified format suitable for data modeling.
In this study, the classification defined the research scope first. Classification can improve information processing efficiency and cognitive stability, allowing us to identify new projects or events and observe consumers’ preferences [23]. We mainly focused on categorizing the capacity and colors of thermos cups. The most popular objects proceeded to the following research stage.
After selecting the research objects, Adobe Color was used to extract the dominant colors of the images. Adobe Color is a web application that establishes and edits various color themes. When pixelated, it can recognize five characteristic colors and obtain colors from images [24].
Due to individual differences in color perception, this study invited three experts with color research experience to extract the colors. We randomly selected five samples and prepared two devices, Device 1 and 2, which had undergone color calibration, and Device 3, which had not undergone color calibration. The experimental design was as follows:
1.
Experiment 1: The screen brightness of Device 1 was set to 50%, and the experts first extracted colors from the sample on Device 1. After extraction, we calculated the average values of H, S, and V to present as the final data.
It should be noted that ambient light may affect visual perception, and consumers usually use mobile phones for shopping. The screen brightness will automatically adjust with the intensity of the ambient light. Therefore, we conducted Experiment 2 by changing the screen brightness of the device to simulate changes in the ambient light:
2.
Experiment 2: The screen brightness of Device 2 was set to 0% and 100% for two separate experiments. Experts observed the sample on Device 2 for 5 s before selecting the color on Device 1.
However, in practical applications, there are differences in screen calibration among consumers’ mobile phones. Therefore, we conducted Experiment 3:
3.
Experiment 3: The screen brightness of Device 3 was set to 50%, and we repeated Experiment 1.
The results are shown in Table 2.
The experimenters found that when the screen brightness was set to 0%, we observed a deviation of approximately 10% in V value, while hue and saturation remained relatively unchanged. This finding indicates a stable characteristic of human color perception. This conclusion is supported by related studies, such as the research conducted by Emery and Webster [25], which also pointed out similar color perception stability phenomena. According to Smithson [26], perceptual constancy refers to the phenomenon in which the color of an object appears unchanged despite changes in the conditions of observation. Therefore, color extraction for other samples can be continued as in Experiment 1.
It is worth noting that our results demonstrated that changes in brightness have a negligible impact on hue and saturation perception. However, as the brightness decreases to a certain extent, color discrimination abilities are affected, showing a gradual decline. This finding is consistent with the research results of Brown et al. [27]. In subsequent studies, the factor of value can be reduced in consideration of these results.

3.4. Step 4: Data Analysis and Visualization

The results of data mining are intuitively displayed through charts and graphs. Information visualization is the process of linking abstract information with visual forms. If the visualization format matches the message, it can help with understanding and leave a more profound impression on the audience.
In the HSV color model, the hue (H) ranges from 0°~360°. The warm color range is from 0° to 90° and 330° to 360°; the warm-to-cold neutral range is from 90° to 150°; the cool color range is from 150° to 270°; and the cold-to-warm neutral range is from 270°~330°. Saturation (S) represents the proportion of colored parts as a percentage from a minimum of 0% to a maximum of 100%. The low saturation range is 0% to 30%; the medium saturation range is 31%~69%; and the high saturation range is 70%~100%. Value (V), the percentage of black 0% to white 100% indicates the color’s value, with 0% to 30% being the low-value area; 31%~69% the medium-value area; and 70%~100% the high-value area. These measures can objectively describe consumer color preferences during data analysis.
The primary purpose of the visualization was to display the distribution characteristics of HSV values in the data and analyze consumer color preferences. The process was illustrated through 3D scatter plots in Origin Pro 2022. The scatter size can also reflect the influence of other variables on the scatter points.
Visualization charts were also applied to the results of data classification in the earlier stage, and this part used other statistical charts to represent the differences in quantity.

3.5. Step 5: Building a Mathematical Model

Next, select a data analysis method for the data and output of the model. There are two commonly used quantitative methods for data analysis: Bayesian analysis and regression analysis [28]. Many constraints, such as economics and cultural customs, must be considered when applying Bayesian analysis. These factors can critically impact consumers’ demand and color choices and are challenging to define. Regression methods have fewer constraints and are applicable in more fields.
Regression methods include linear regression, non-linear regression, logistic regression, and so on. This paper aimed to study the relationship between the dependent and multiple independent variables. In Section 4.4, we used two regression methods for pre-experiments. By comparing the performance of the two models, we evaluated their advantages and disadvantages and selected a more adaptable model.

3.6. Step 6: Problem Solution

Finally, evaluate whether the output model can answer the questions raised in Step 1 and clarify the model’s limitations. This part is explained in the Discussion.

4. Results

4.1. Data Acquisition

4.1.1. Data Source

To ensure data diversity, we collected sales data for thermos cups from two online shopping platforms, JD.com and Tmall, from Jingcanmou. Figure 2 shows the brand distribution of thermos cups on JD.com and Tmall. The circle size represents the number of popular thermos cup styles within that brand. Figure 2 shows over 100 famous brands on JD and Tmall, of which only ten are duplicates. There are significant differences in brand distribution between the two platforms. There are fewer hot brands on JD.com, but each has an average of three popular thermos cup styles. Tmall, on the other hand, has more popular brands, but each brand only has one popular style. Collecting data from both platforms did not result in many duplicates.

4.1.2. Determine the Target Data

To ensure the data’s validity and relevance, we first needed to select the relevant information from the product details, such as the product names, capacity, and price. We removed thermos cup accessories and cheap products (under 10 yuan or USD). Then, we calculated consumers’ capacity to explore the popular thermos cup volume range (Figure 3). Since no thermos cups were below 200 mL among the hot products, the analysis started from 200 mL. According to Figure 3, most thermos cups have a capacity between 500–800 mL, followed by 200–500 mL, and those above 800 mL only account for 2%. Therefore, we chose 200–800 mL thermos cups for further research and defined them as portable thermos cups, while thermos cups above 800 mL were defined as car or home-use thermal pots. We collected images of thermos cups containing all colors with the same name, resulting in 769 product images. Subsequently, the product images were organized, and the duplicates of the same thermos cups, which were sold on both platforms, were processed, and only one copy was retained. Finally, we obtained 733 product images.
The product pictures were categorized into four categories: single-color, two-color, gradient, and patterned. The number of images for each category is 307, 161, 4, and 261, respectively (Figure 4). The purpose of categorization is to quickly understand the consumers’ preferences for thermos cups with specific features. The more images in a category, the more consumers prefer thermos cups with that particular feature. In Figure 4, the category with the most images is single-color, indicating consumers prefer single-color thermos cups. Therefore, the single-color thermos cup with the most images was selected for further study.
Although patterned thermos cups also account for a considerable proportion, the primary body color of most thermos cups is closely related to the pattern, usually being adjacent colors (Table 3 provides typical examples).

4.2. Data Processing and Transformation

Removing the irrelevant elements from the sample was necessary to facilitate the extraction of image colors. Adobe Photoshop’s 2021 Image Batch command removed any extraneous elements from the images.
The images were imported into Adobe Color, appropriate colors were selected, and the color data were obtained. The color data were then converted into the HSV color model. Table 3 shows the colors and HSV values of some thermos cups.

4.3. Data Visualization Analysis

The products’ HSV values and sales data were separately imported into Origin. A 3D scatter plot was chosen to visualize the HSV values and sales (Figure 5 and Figure 6). H corresponds to the Z-axis in the space coordinates system, S to the Y-axis, and V to the X-axis. The scatter plot colors were mapped to a uniform color, and the size of the scatter points was positively correlated with sales volume, with larger volumes indicating higher sales. Meanwhile, considering that a color may appear multiple times, resulting in numerous overlapping points at the same location, the transparency of all bubbles was adjusted to 20% to indicate the depth of color in areas with more overlapping bubbles.
As shown in Figure 5, the colors repeated the most where H = 0, S = 0%–10%, and V = 0%–30% is represented by black in the sample. Moreover, the size of the scatter was also the largest in the plot. The hue values were distributed almost evenly, indicating that consumers purchase thermos cups regardless of the hue. The saturation values showed 0%–20%, while the V values were concentrated between 80% and 100%. This suggests that most people prefer thermos cups with low saturation and high value. Furthermore, there was a significant concentration of points in the warm color range of 0° to 60° on the H axis, mainly white, light pink, or pale yellow. In the cool color range of 180° to 240° on the H axis, there was a uniform distribution of scatter points in both the H-S and H-V quadrants. This demonstrates consumers’ preferences as long as S and V are coordinated within that hue range.
We observed some independent bubbles outside the concentrated bubbles with colors ranging between H = 0° or 340°–350°, S = 60%–80%, and V = 60%–80%. In these samples, this color range usually appears as red, and this feature is related to the regional culture. This can be explained by the fact that red has crucial symbolic significance in Chinese culture. In traditional Chinese culture, red has positive connotations and is regarded as a symbol of luck and prosperity. Therefore, this regional cultural factor impacts the formation of Chinese consumers’ color preferences.
Given that consumers’ preferences may be related to Pantone’s “Color of the Year,” we noticed that in 2021, Pantone announced Ultimate Gray (H = 210, S = 3, V = 59) and Illuminating (H = 52, S = 69, V = 96) as the “Color of the Year,” and in 2022, Pantone’s “Color of the Year” was Very Peri (H = 239, S = 39%, V = 67%). However, the scatter around these colors is not concentrated, indicating that Chinese consumers are less influenced by Pantone’s Color of the Year regarding color preferences.

4.4. Mathematical Model Construction

4.4.1. Model Selection

This study aimed to investigate the relationship between the dependent variable and one or more independent variables. We chose regression methods for our research based on the characteristics of our data and the application. We compared multiple linear regression and random forest regression models to select a more suitable model for our data.
Multiple linear regression is a common method for studying the relationship between dependent and independent variables. It provides a relatively simple and intuitive model structure, which assumes a linear relationship between dependent and independent variables, and most of the data can be explained by linear regression.
However, multiple linear regression may not explain sufficiently when the data show non-linear or more complex relationships. In this case, random forest regression can better adapt to this situation. Compared with multiple linear regression, random forest regression does not make specific assumptions about the relationship between the independent and dependent variables and has flexibility. It generates the final regression result by combining the prediction results of multiple decision trees to create optimal regression results that effectively obtain complex relationships such as non-linear relationships.
We conducted a pre-experiment to select the most suitable model for our data. In this part, we randomly selected 100 data sets and imported them into SPSSAU for analysis. By examining the evaluation index of this model, we can ensure that the chosen model has good explanatory and predictive ability.
In the pre-experiment, we compared the performance of multiple linear regression and random forest regression models on the evaluation index. Common evaluation metrics include the mean squared error (MSE), which can measure the model’s prediction error size. In addition, we can also calculate the coefficient of determination (R2) to evaluate the model’s ability to explain the variables.
By comparing the performance of these two regression models, we can gain a deeper understanding of the relationship between the dependent and independent variables. An optimal model should have a better explanatory and predictive ability to provide strong support for our research and a basis for the interpretation of the results.

4.4.2. Linear Regression Pre-Experiment

Firstly, the correlation of the data was analyzed to test whether there was a relationship between the analysis items and the closeness of correlation. We imported 100 sets of data into SPSSAU to study the correlations between H-S and H-V, using correlation analysis and the Pearson product-moment correlation coefficient to represent the strength of the correlation (Table 4).
According to Table 4, the correlation coefficient between H and S is 0.388, with a significance level of 0.01. This indicates a significant positive correlation between H and S. The correlation coefficient between H and V is −0.122, close to 0, and the p-value is 0.225 > 0.05, indicating no correlation between H and V.
However, correlation does not necessarily indicate a regression relationship. Therefore, the same 100 data sets were imported into SPSSAU, with H as the dependent variable and S and V as independent variables for regression analysis (Table 5 and Table 6). The formula is as follows:
H = β0 + β1S + β2V
According to Table 6, the formula of the model is:
H = 105.78+ 2.25S + 0.12V
The model’s R2 value is 0.151, which means that S and V can explain 15.1% of the variation of H. This model passes the F-test (F = 8.623, p = 0.000 < 0.05), meaning that at least one of the variables, S or V, significantly impacts H. In addition, a test for multicollinearity revealed that all VIF values in the model are below five, indicating the absence of multicollinearity issues. Moreover, the Durbin–Watson (D-W) statistic is near the value of two, suggesting no autocorrelation and that the model performs well.
The final analysis showed that the regression coefficient for S is 2.253 (t = 3.941, p = 0.000 < 0.01), which means a significant positive impact of S on H. On the other hand, the regression coefficient for V is 0.121 (t = 0.160, p = 0.874 > 0.05), suggesting that V does not influence H. This is consistent with the results of the correlation analysis.

4.4.3. Pre-Experiment of Random Forest Regression

Random forest regression is an ensemble learning algorithm that achieves regression tasks by combining multiple decision trees, thereby constructing a regression model. In this process, the feature weights for S and V were calculated using the 100 data sets mentioned above to show the importance of each feature’s contribution to the model (Figure 7). Specifically, S accounts for 61.22% of the weight, indicating its highest significance in model construction, while B accounts for 38.78% of the weight, signifying its secondary importance in model building.
Subsequently, the data set was shredded, with 20% used as the testing set and 80% as the training set. The analysis was conducted by varying the number of trees (10, 100, or 1000) to observe the performance of the random forest model under different tree quantities. Increasing the number of trees will enhance the model’s performance but may also lead to overfitting. The potential results are as follows:
  • When the number of trees is small (e.g., 10), underfitting may occur because the model might not fully capture the complex relationships within the data, resulting in poor matching between the predicted and actual test values;
  • With a moderate number of trees (e.g., 100), better performance may be achieved as the model can relatively well capture patterns within the data, thus yielding more accurate predictions;
  • However, overfitting may arise with numerous trees (e.g., 1000 or 10,000) as the model becomes overly complex, attempting to learn noise in the training data. Although predictions on the training data may be very accurate, the generalization performance on new data may be poor.
The evaluation factors of random forest regression are usually described by mean square error MSE and R2. The results of calculating the mean square error MSE and R2 values of the training set are shown in Table 7.
In the results, the MSE for different numbers of decision trees was greater than 0 and significantly higher, indicating a poor fit of the model to the training data. Although the R2 falls within the normal range, their tiny data suggests a weak explanatory power of the model for the target variable.

4.4.4. Regression Training

Based on the pre-experiment, a correlation was evident among the data, thus enabling the establishment of a regression model. Upon comparing the performance of the linear regression and random forest regression models, it was observed that the linear regression model performed better, while the random forest regression model had a relatively poor evaluation. Therefore, we decided to use a multiple linear regression model to construct our data model.
Using Python 2022.3.1 to write the code, all of the data were subjected to regression training, creating a model. The training model involved extracting 80% from 307 data samples as the training set and utilizing it to build the predictive model, while the remaining 20% constituted the testing set. In order to match the testing and predictive models, we employed a power of 0.5 on the S value. The linear fitting results are presented below, with the corresponding graphical depiction in Figure 8. The max, min, median, mean, and other statistical data for the test and prediction sets are shown in Figure 9.
H = 10.3 + 26.92S(1/2) + 0.21V

5. Discussion

According to the established color mathematical model, this study explained the mathematical pattern of the hot-selling single-color thermos cup. Initially, we randomly selected 100 data sets for the pre-experiment. We found a significant positive correlation between H and S. In the subsequent regression training model, we also prioritized the influence of S on the fitting result. Adjusting the power of S was optimal at 0.5 for fitting. The coefficient for S was 26.91, the coefficient for V was 0.06, and the intercept was 21.8, indicating that S has a more significant influence on H, consistent with the pre-experiment findings.
The visualized results showed that low saturation and high-value scatter plots were more concentrated, which was consistent with the research conclusion of Beneke J et al. [29]: consumers generally prefer neutral colors. The hue values were particularly noticeable within the range of 0–60. Upon examining the original images, we found that most scatter points in the light yellow color range corresponded to gold. The white and light pink data points constituted a significant portion of the original data set. There were also a few silver and rose gold data points exhibiting characteristics of high brightness. Since the data were artificially extracted, similar colors had slight numerical changes during color extraction, resulting in data points not overlapping but densely distributed in a specific area in the chart. In addition, the HSV values in the graph were notably broad, which can be attributed to factors such as color functionality and usage scenarios [30]. Individuals typically use thermos cups in various scenarios. Different types of products exhibit different color styles. For instance, air purifiers commonly utilize white color schemes. This indicates that color schemes for different products are entirely different, and appropriate color schemes help establish a powerful brand image [11].
Although we had obtained a large amount of data through data mining, many steps still required manual input. For example, for color extraction, we attempted to utilize K-means clustering to obtain product colors efficiently and quickly. However, the color acquired through this method did not meet our expectations. Furthermore, during the initial stages of data selection, we discovered that retailers injected numerous keywords into their product names, which may ensure that consumers find their products as easily as possible to increase the exposure and clicks on the goods. Therefore, data cannot be batch-selected.
Furthermore, it is essential to note that the color of the actual product may be different from the images provided by the manufacturers due to processes such as photography and color adjustments. Additionally, owing to individual differences and technological constraints, it is hard to eliminate perceptual errors in color. Therefore, the method of color extraction cannot guarantee scientific accuracy. Despite our efforts to enhance the precision of the color data, limitations persist. Consequently, when interpreting these research findings, caution is warranted regarding the accuracy of the color data.
Although the volume of data obtained through data mining is substantial, due to consumers’ privacy, we cannot consider consumers’ color preferences from factors such as gender, age, cultural background, and educational background. As a result, our research findings tend to lean toward a general conclusion—that most consumers favor colors with low saturation and lightness. Nevertheless, our study retains validity. Through the analysis of data, a universal trend in color preference can be observed. This discovery may be associated with consumers’ pursuit of soft, warm, and tranquil sensations. However, it is essential to note that this trend is merely a general inclination and does not represent the preferences of every consumer. Future studies can improve this study from the perspective of influencing factors.
This paper conducted preliminary experiments to compare linear regression with random forest regression models. Based on the evaluation of model performance using metrics such as R2 and MSE, it was determined that the linear regression model showed better performance, leading to the successful establishment of a multiple linear regression model. Subsequently, we statistically tested the test and prediction sets’ max, min, and mean values. The results revealed that only the average values of the two sets are close to each other, while the other values have large differences. These differences may be related to the characteristics of our data, but the predictive results can elucidate the current patterns. After successfully establishing the linear regression model, this study did not test the model’s applicability. Tens of thousands of samples are required to establish a good prediction model. However, due to the focus on best-selling products as the research subject, collecting excessive samples would deviate from the central theme. Given the constraints of the research subject, this model is limited to descriptive tasks, which is the same as the first step in data mining tasks.

6. Conclusions

This study acquired a significant amount of sales data through data mining. Through classification, this study focused on single-color thermos cups as the research object. The colors of the thermos cups were extracted and converted into an HSV color model. By using visualized charts, this paper demonstrated consumers’ color preferences and found that consumers tend to purchase thermos cups with neutral colors. A mathematical model was established using linear regression to explore the relationships among HSV values. It was discovered that there is a significant correlation between S and H values in the popular single-color thermos cups within the HSV color model. However, a predictive model was not established due to the limitations of the regression model methodology and research object. Therefore, the determination of the accuracy and generalizability of this model will remain for future research.
This paper presents a novel approach to color design practice, utilizing information technology to assist color designers in collecting a vast amount of user demand information and sales data. This method challenges the traditional approach of relying solely on talent or intuition to design color schemes. Furthermore, it effectively simplifies the color design process. Moreover, the proposed method can also be applied to color design research across diverse products, enabling products to meet various service demands better.
In summary, this study’s research methods and findings make significant academic contributions as follows:
  • Methodological Innovation: This paper introduces a novel color design practice that utilizes information technology to assist color designers in gathering extensive user demand information and sales data. This approach departs from the traditional reliance on “talent” or “intuition” for color scheme design by designers, effectively streamlining the color design process and offering new perspectives and methods to the field of color design;
  • Knowledge Contribution: Through analyzing the colors of thermos cups and establishing mathematical models, this paper reveals consumer preferences for neutral-colored thermos cups and uncovers mathematical relationships within the HSV color model of popular products. These findings enrich the research domain of color preferences and color correlations.
Furthermore, the research in this paper can be applied to the following practices:
  • Optimized Color Design: The proposed method can be applied to color design research for different products, enabling designers to gain a more accurate understanding of consumer preferences for product colors and optimize product design to meet various service needs better;
  • Cross-Industry Application: The method proposed in this paper applies not only to color design research for thermos cups but also to color design research for other products. Gathering user demand information and sales data can help companies adapt products to meet diverse needs.

Author Contributions

Conceptualization, J.L., H.R. and Z.Z.; methodology, J.L. and W.L.; software, J.L.; validation, J.L.; formal analysis, J.L.; investigation, J.L., H.R. and Z.Z.; resources, J.L., H.R. and Z.Z.; data curation, J.L., H.R. and Z.Z.; writing—original draft preparation, J.L. and W.L.; writing—review and editing, W.L.; visualization, J.L. All authors have read and agreed to the published version of the manuscript.

Funding

This research was funded by the National Nature Science Foundation of China, grant number 72201128, and the China Postdoctoral Science Foundation, grant number 2023M730483.

Institutional Review Board Statement

Not applicable.

Informed Consent Statement

Not applicable.

Data Availability Statement

Data were obtained from [Jingcanmou], [JD], and [Tmall], and are available from [https://jingcanmou.com/], [https://www.jd.com/], and [https://www.tmall.com/].

Conflicts of Interest

The authors declare no conflicts of interest.

References

  1. Ma, M.-Y.; Chen, C.-Y.; Wu, F.-G. A design decision-making support model for customized product color combination. Comput. Ind. 2007, 58, 504–518. [Google Scholar] [CrossRef]
  2. Choi, P.; Orsborn, S.; Boatwright, P. Bayesian analysis of color preferences: An application for product and product line design. Color Res. Appl. 2016, 41, 445–456. [Google Scholar] [CrossRef]
  3. Jiang, C.; Gao, C. Product designing and big data. J. Ningbo Inst. Technol. 2016, 28, 6. [Google Scholar] [CrossRef]
  4. Tian, Z.; Guan, H.; Huang, Q. Development of computer aided color customization system for sofa. Furnit. Inter. Des. 2018, 8, 24–26. [Google Scholar] [CrossRef]
  5. Hsiao, S.-W.; Chiu, F.-Y.; Hsu, H.-Y. A computer-assisted colour selection system based on aesthetic measure for colour harmony and fuzzy logic theory. Color Res. Appl. 2008, 33, 411–423. [Google Scholar] [CrossRef]
  6. Bakker, I.; van der Voordt, T.; Vink, P.; de Boon, J.; Bazley, C. Color preferences for different topics in connection to personal characteristics. Color Res. Appl. 2015, 40, 62–71. [Google Scholar] [CrossRef]
  7. Schloss, K.B.; Palmer, S.E. An ecological framework for temporal and individual differences in color preferences. Vis. Res. 2017, 141, 95–108. [Google Scholar] [CrossRef]
  8. Gou, A.; Shi, B.; Wang, J.; Wang, H. Color preference and contributing factors of urban architecture based on the selection of color samples—Case study: Shanghai. Color Res. Appl. 2021, 47, 454–474. [Google Scholar] [CrossRef]
  9. Zhang, Y.; Liu, P.; Han, B.; Xiang, Y.; Li, L. Hue, chroma, and lightness preference in chinese adults: Age and gender differences. Color Res. Appl. 2019, 44, 967–980. [Google Scholar] [CrossRef]
  10. Jiang, L.; Cheung, V.; Westland, S.; Rhodes, P.A.; Shen, L.; Xu, L. The impact of color preference on adolescent children’s choice of furniture. Color Res. Appl. 2020, 45, 754–767. [Google Scholar] [CrossRef]
  11. Yu, L.; Westland, S.; Li, Z.; Pan, Q.; Shin, M.J.; Won, S. The role of individual colour preferences in consumer purchase decisions. Color Res. Appl. 2017, 43, 258–267. [Google Scholar] [CrossRef]
  12. Yu, L.; Westland, S.; Chen, Y.; Li, Z. Colour associations and consumer product-colour purchase decisions. Color Res. Appl. 2021, 46, 1119–1127. [Google Scholar] [CrossRef]
  13. Yu, N.; Wang, J.; Hong, L.; Tao, B.; Zhang, C. Evaluation of the color aesthetics of fine wood based on perceptual cognition. Bioresources 2021, 16, 4126–4148. [Google Scholar] [CrossRef]
  14. Li, Y.; Liang, H.; Shen, T. A study of colors of court robes of the eldest direct descendants of Confucius in the Ming and Qing dynasty based on HSV color model. J. Silk 2019, 56, 8. [Google Scholar] [CrossRef]
  15. Zheng, Q.; Pan, R.; Fu, G.; Zheng, T. An exploration of color preference in modern interior design. Furnit. Inter. Des. 2019, 4, 74–75. [Google Scholar] [CrossRef]
  16. Zhou, C.; Li, Z.; Kaner, J.; Leng, C. Development of a selection system for the colour of wardrobe furniture. BioResources 2022, 17, 3912–3928. [Google Scholar] [CrossRef]
  17. Zhao, L.; Wang, Z.; Zuo, Y.; Hu, D. Comprehensive evaluation method of ethnic costume color based on K-Means clustering method. Symmetry 2021, 13, 1822. [Google Scholar] [CrossRef]
  18. Shi, M.; Shen, L.; Long, S.; Hu, X. The revision of conversion for mulafrom RGB color space to HSV color space. Basic Sci. J. Text. Univ. 2008, 21, 351–356. [Google Scholar] [CrossRef]
  19. Ma, L.; Zhang, X. Relationship between Saturation and Brightness Value in HSV Color Spac. J. Comput.-Aided Des. Comput. Graph. 2014, 26, 7. [Google Scholar]
  20. Hand, D.; Mannila, H.; Smyth, P. Principles of Data Mining; The Mit Press: Cambridge, UK, 2001; pp. 7–8. ISBN 026208290x. [Google Scholar]
  21. Squire, M. Mastering Data Mining with Python; Packt Publishing: Birmingham, UK, 2016; p. 6. ISBN 9781785889950. [Google Scholar]
  22. Jiang, S.; Li, X.; Zheng, Q. Principle and Practice of Data Mining; Publishing House of Electronics Industry: Beijing, China, 2011; p. 8. ISBN 9787121140501. [Google Scholar]
  23. Schoormans, J.P.L.; Robben, H.S.J. The effect of new package design on product attention, categorization and evaluation. J. Econ. Psychol. 1997, 18, 271–287. [Google Scholar] [CrossRef]
  24. Zhang, X.; Xu, J. The pedigree study on the color of industrial design product:a case study of radio in shanghai. Art Des. Theor. 2018, 2.06, 112–114. [Google Scholar] [CrossRef]
  25. Emery, K.J.; Webster, M.A. Individual differences and their implications for color perception. Curr. Opin. Behav. Sci. 2019, 30, 28–33. [Google Scholar] [CrossRef]
  26. Smithson, H.E. Sensory, computational and cognitive components of human colour constancy. Philos. Trans. R. Soc. Lond. Ser. B Biol. Sci. 2005, 360, 1329–1346. [Google Scholar] [CrossRef]
  27. Brown, W.R.J. The Influence of Luminance Level on Visual Sensitivity to Color Differences. J. Opt. Soc. Am. 1951, 41, 684–688. [Google Scholar] [CrossRef] [PubMed]
  28. Berthold, M.R.; Borgelt, C.; Höppner Frank Klawonn, F. Intelligent Data Analysis; Springer: Berlin/Heidelberg, Germany, 2023; pp. 69–167. [Google Scholar] [CrossRef]
  29. Beneke, J.; Mathews, O.; Munthree, T.; Pillay, K. The role of package colour in influencing purchase intent of bottled water. J. Res. Mark. Entrep. 2015, 17, 165–192. [Google Scholar] [CrossRef]
  30. Liu, B.; Zhang, R.; Chen, X.; Zhou, X.; Zhang, M.; Li, S. Product color design based on big data. Packag. Eng. 2019, 40, 228–235. [Google Scholar] [CrossRef]
Figure 1. Research process.
Coatings 14 00209 g001
Figure 2. A comparison of brands between JD and Tmall.
Coatings 14 00209 g002
Figure 3. Capacity statistics chart.
Coatings 14 00209 g003
Figure 4. Image classification statistics chart.
Coatings 14 00209 g004
Figure 5. 3D scatter plots.
Coatings 14 00209 g005
Figure 6. (a) The projection of the scatter plot on the HS coordinates; (b) the projection of the scatter plot on the HV coordinates; (c) the projection of the scatter plot on the VS coordinates.
Coatings 14 00209 g006
Figure 7. The feature weights of S and B.
Coatings 14 00209 g007
Figure 8. (a) The linear fitting line graph; (b) the linear fitting scattered graph.
Coatings 14 00209 g008
Figure 9. Box diagram of the test data and prediction data.
Coatings 14 00209 g009
Table 1. Product name and product image examples.
Product NameProduct Images of the Same Name
A 316 stainless steel insulated cup for men, with a portable flip-top lid, suitable for use in cars, and customizable for female students with a large capacity.Coatings 14 00209 i001Coatings 14 00209 i002Coatings 14 00209 i003Coatings 14 00209 i004
A customized water cup for men, with a large capacity, made of 304 stainless steel, engraved with words, and suitable for students to carry and use for tea.Coatings 14 00209 i005Coatings 14 00209 i006Coatings 14 00209 i007Coatings 14 00209 i008
A high-value and portable 316 stainless steel insulated cup for women, with a small size suitable for use in cars, and a new design suitable for both male and female students.Coatings 14 00209 i009Coatings 14 00209 i010Coatings 14 00209 i011Coatings 14 00209 i012
Table 2. Average values of color extraction results.
SamplesHSVScreen Luminance 0%Screen Luminance 50%Screen Luminance 100%Not Calibrated
Coatings 14 00209 i013H348351351348
S29343036
V86979696
Coatings 14 00209 i014H199200201202
S21201922
V85999998
Coatings 14 00209 i015H179180181182
S47514651
V34283127
Coatings 14 00209 i016H257255257259
S15161718
V73818177
Coatings 14 00209 i017H47464745
S15161230
V85939584
Table 3. Typical cases of thermos cups with patterns.
Product ImagePattern ColorThe Main Color of the Thermos Cup’s Body
Coatings 14 00209 i018Coatings 14 00209 i019Coatings 14 00209 i020
Coatings 14 00209 i021Coatings 14 00209 i022Coatings 14 00209 i023
Coatings 14 00209 i024Coatings 14 00209 i025Coatings 14 00209 i026
Coatings 14 00209 i027Coatings 14 00209 i028Coatings 14 00209 i029
Table 4. The color of the thermos cup and its HSV values as examples.
Thermos Cup’s ColorH ValueS ValueV Value
Coatings 14 00209 i0300025
Coatings 14 00209 i0313312375
Coatings 14 00209 i0323448655
Coatings 14 00209 i03320020100
Coatings 14 00209 i0341912295
Coatings 14 00209 i0353281195
Coatings 14 00209 i036300195
Table 5. Analysis of the correlation between H and S, V.
H
SCorrelation coefficient0.388 **
p-value0.000
VCorrelation coefficient−0.122
p-value0.225
** p < 0.01.
Table 6. Results of linear regression analysis (n = 100).
Nonnormalized CoefficientStandardization CoefficienttpCollinearity Diagnosis
Regression coefficientStandard errorBeta VIFTolerance
Constant105.76568.400-1.5460.125--
S2.2530.5720.3943.9410.000 **1.1410.877
V0.1210.7580.0160.1600.8741.1410.877
R20.151
Adjusted R20.133
FF (2,97) = 8.623, p = 0.000
D-W value1.985
** p < 0.01.
Table 7. Model evaluation result.
IndexDescriptionNumber of Decision Trees
101001000
R2The degree of fit index between 0 and 1, where larger is better.0.070.080.08
MSEThe average of the squared errors, with values closer to 0 indicating better performance.14,093.7478.5978.51
Disclaimer/Publisher’s Note: The statements, opinions and data contained in all publications are solely those of the individual author(s) and contributor(s) and not of MDPI and/or the editor(s). MDPI and/or the editor(s) disclaim responsibility for any injury to people or property resulting from any ideas, methods, instructions or products referred to in the content.

