Article

Modified Graphene Micropillar Array Superhydrophobic Coating with Strong Anti-Icing Properties and Corrosion Resistance

1
Key Laboratory of Nuclear Materials and Safety Assessment, Institute of Metal Research, Chinese Academy of Sciences, Shenyang 110016, China
2
School of Materials Science and Engineering, University of Science and Technology of China, Shenyang 110016, China
3
Institute of Corrosion Science and Technology, Guangzhou 510530, China
*
Author to whom correspondence should be addressed.
Coatings 2024, 14(3), 247; https://doi.org/10.3390/coatings14030247
Submission received: 8 January 2024 / Revised: 31 January 2024 / Accepted: 2 February 2024 / Published: 20 February 2024
(This article belongs to the Special Issue Mechanisms and Applications of Superhydrophobic Surfaces)

Abstract

:
Ice accumulation on outdoor surfaces tends to cause a series of serious accidents in extreme climates. In recent years, superhydrophobic coatings have garnered significant interest in the passive anti-icing field owing to their exceptional ability to repel water. However, these superhydrophobic coatings displayed inadequate anti-icing properties in conditions of low temperature and high humidity, as well as poor corrosion resistance after prolonged immersion. Herein, we prepared a series of modified graphene micropillar array superhydrophobic coatings that have various micropillar widths based on simple physical embossing and spraying techniques. These coatings combined the graphene nanosheets modified by perfluorodecyl triethoxysilane (AC-FAS) and the fluorocarbon varnish coating with a micropillar array structure to gain great superhydrophobicity and anti-icing properties. Among these, the average freezing delay time of the Q200G coating increased over 500 times relative to the unmodified Al surface (about 10 s), and its average deicing shear force was as low as 0.1 N. Meanwhile, the corrosion resistance increased steadily as the micropillar width decreased, based on the electrochemical impedance spectroscopy test results. More importantly, such facile fabrication methods and multi-functionality make superhydrophobic coatings hold great application prospects.

1. Introduction

Ice accumulation poses a series of serious safety, economic, and energy problems for aircraft, ships, and power grids [1]. Consequently, the material surface anti-icing capability is one of the necessary functions for the reliable operation of apparatus in frigid conditions [2,3,4]. At present, anti-icing strategies are classified into active and passive categories. Among them, passive anti-icing methods have attracted widespread attention owing to their cost-effectiveness, low energy consumption, and eco-friendliness [5,6]. In the study of passive anti-icing methods, superhydrophobic surfaces (SHS) with adequate water repellency are believed to have excellent anti-icing potential, including postponing the icing of condensing water and weakening the ice adhesive strengths [7]. For example, Xie et al. [8] fabricated the superhydrophobic surface on carbon cloth, and its freezing delay time could reach more than 3600 s. Pan et al. [9] prepared the superhydrophobic surface on a copper plate, and its ice adhesive strength was below 1.7 kPa.
In addition, the superhydrophobic surface also contains certain applications in corrosion resistance [10,11]. Typically, micro- and nanostructures on the superhydrophobic surface have the ability to trap a large amount of air, which reduces the solid–liquid contact area and inhibits the corrosive medium from penetrating into the interior of the material [12,13]. Up to now, many efforts have been committed to the corrosion resistance of the superhydrophobic surfaces prepared by organic coatings. Lou et al. [14] reported the anti-corrosion ability of the epoxy/polybenzoxazine-based superhydrophobic coating (PEBS) fabricated by spraying. The electrochemical impedance spectroscopy (EIS) results suggested that the impedance of the PEBS coating was still above 1010 Ω·cm2 after immersion in a 3.5 wt% NaCl solution for 30 days. Han et al. [15] investigated the corrosion resistance of the EP-FEVE@G/ZnO superhydrophobic coating. The EIS revealed that the impedance value of this superhydrophobic coating was 11 orders of magnitude higher than that of the bare copper sheet.
It is well known that nanomaterials are commonly selected for preparing micro- and nanoscale structures on superhydrophobic surfaces [16]. As the first two-dimensional material, graphene materials with a large specific surface area have an advantage in the preparation of the micro–nanostructure. Recently, graphene has been widely used to prepare superhydrophobic coatings with anti-icing or corrosion resistance properties [17,18]. In terms of anti-icing, Chu et al. [19] manufactured a superhydrophobic surface using graphene oxide, and its freezing delay time was 498 s when the sample surface temperature was −10 °C. Bai et al. [20] prepared a fluorine-based graphene oxide superhydrophobic composite coating. They found that the freezing delay time of the superhydrophobic composite coating surface was about 2760 s at a −10 °C temperature. Although these graphene superhydrophobic surfaces exhibit good delay freezing capacity, these anti-icing experiments often only consider the ideal environment and ignore the harsh actual environment, such as low temperature and high relative humidity. Therefore, it is necessary to develop a graphene superhydrophobic surface with good anti-icing properties in a low-temperature and high-relative-humidity environment. In terms of corrosion resistance, graphene has molecular impermeability, which can enhance the corrosion resistance of the coating in theory [21]. However, the corrosion resistance of graphene superhydrophobic coatings is not ideal for long-term immersion. Paul et al. [22] fabricated a modified graphene superhydrophobic coating. The EIS revealed that the impedance value of the superhydrophobic coating was only above 8.23 × 10² Ω·cm2 after immersion for 240 h. Du et al. [23] prepared a superhydrophobic silane/graphene oxide coating. The EIS results indicated that the impedance value of the coating was below 2.5 × 10⁴ Ω·cm2 after immersion for 240 h. Thus, it is essential to improve the corrosion resistance of graphene superhydrophobic coatings under long-term immersion as well.
For this study, the modification of graphene nanosheets with perfluorodecyl triethoxysilane (AC-FAS) was carried out first. After that, the modified graphene superhydrophobic slurry was made by mixing the modified graphene nanosheets with fluorocarbon resin. Meanwhile, a polyethylene terephthalate (PET) net was embossed to create micropillar array structures with distinct micropillar widths on the surfaces of fluorocarbon varnish coatings. Finally, the modified graphene micropillar array superhydrophobic coatings were prepared by spraying the modified graphene superhydrophobic slurry on the fluorocarbon varnish coatings with micropillar array structures. The anti-icing and anticorrosion properties of these coatings were studied in detail. The test results show that all these coatings exhibit superhydrophobicity. Especially, the modified graphene micropillar array superhydrophobic coating prepared with 200 mesh PET net has excellent anti-icing properties. Its freezing delay time reached 5360 s in a −10 °C and 60% relative humidity environment. Furthermore, the EIS results suggested that the impedance value of the coating was still above 1 × 10⁶ Ω·cm2 after immersion for 16 days.

2. Experiment

2.1. Materials

The Sanuo Silk Net Trade Co., Ltd., Shijiazhuang, China, provided the PET nets with different mesh numbers. The parameters of these commercial PET nets have been summarized in Table S1. We bought solvents comprising xylene, acetic acid, absolute ethanol, acetone, and butyl ester from Sinopharm Chemical Reagent Co., Ltd. in Shanghai, China. Commercially available 2024 aluminum alloy (AA 2024-T3) and F301 fluorocarbon resin were provided by the Institute of Corrosion Science and Technology, Guangzhou, China. Bayer Material Science Co., Ltd., Leverkusen, Germany, a German company, produced the hardener (N3390). Ark (Fogang) Chemical Material Co., Ltd., Qingyuan, China, supplied the AC-FAS. We bought BYK306 and BYK065 from BYK Chemie Co., Ltd., Wesel, Germany. Graphene nanosheets were obtained from Suiheng Technology (Shenzhen) Co., Ltd., Shenzhen, China. Water purification equipment in the lab was used to produce deionized (DI) water.

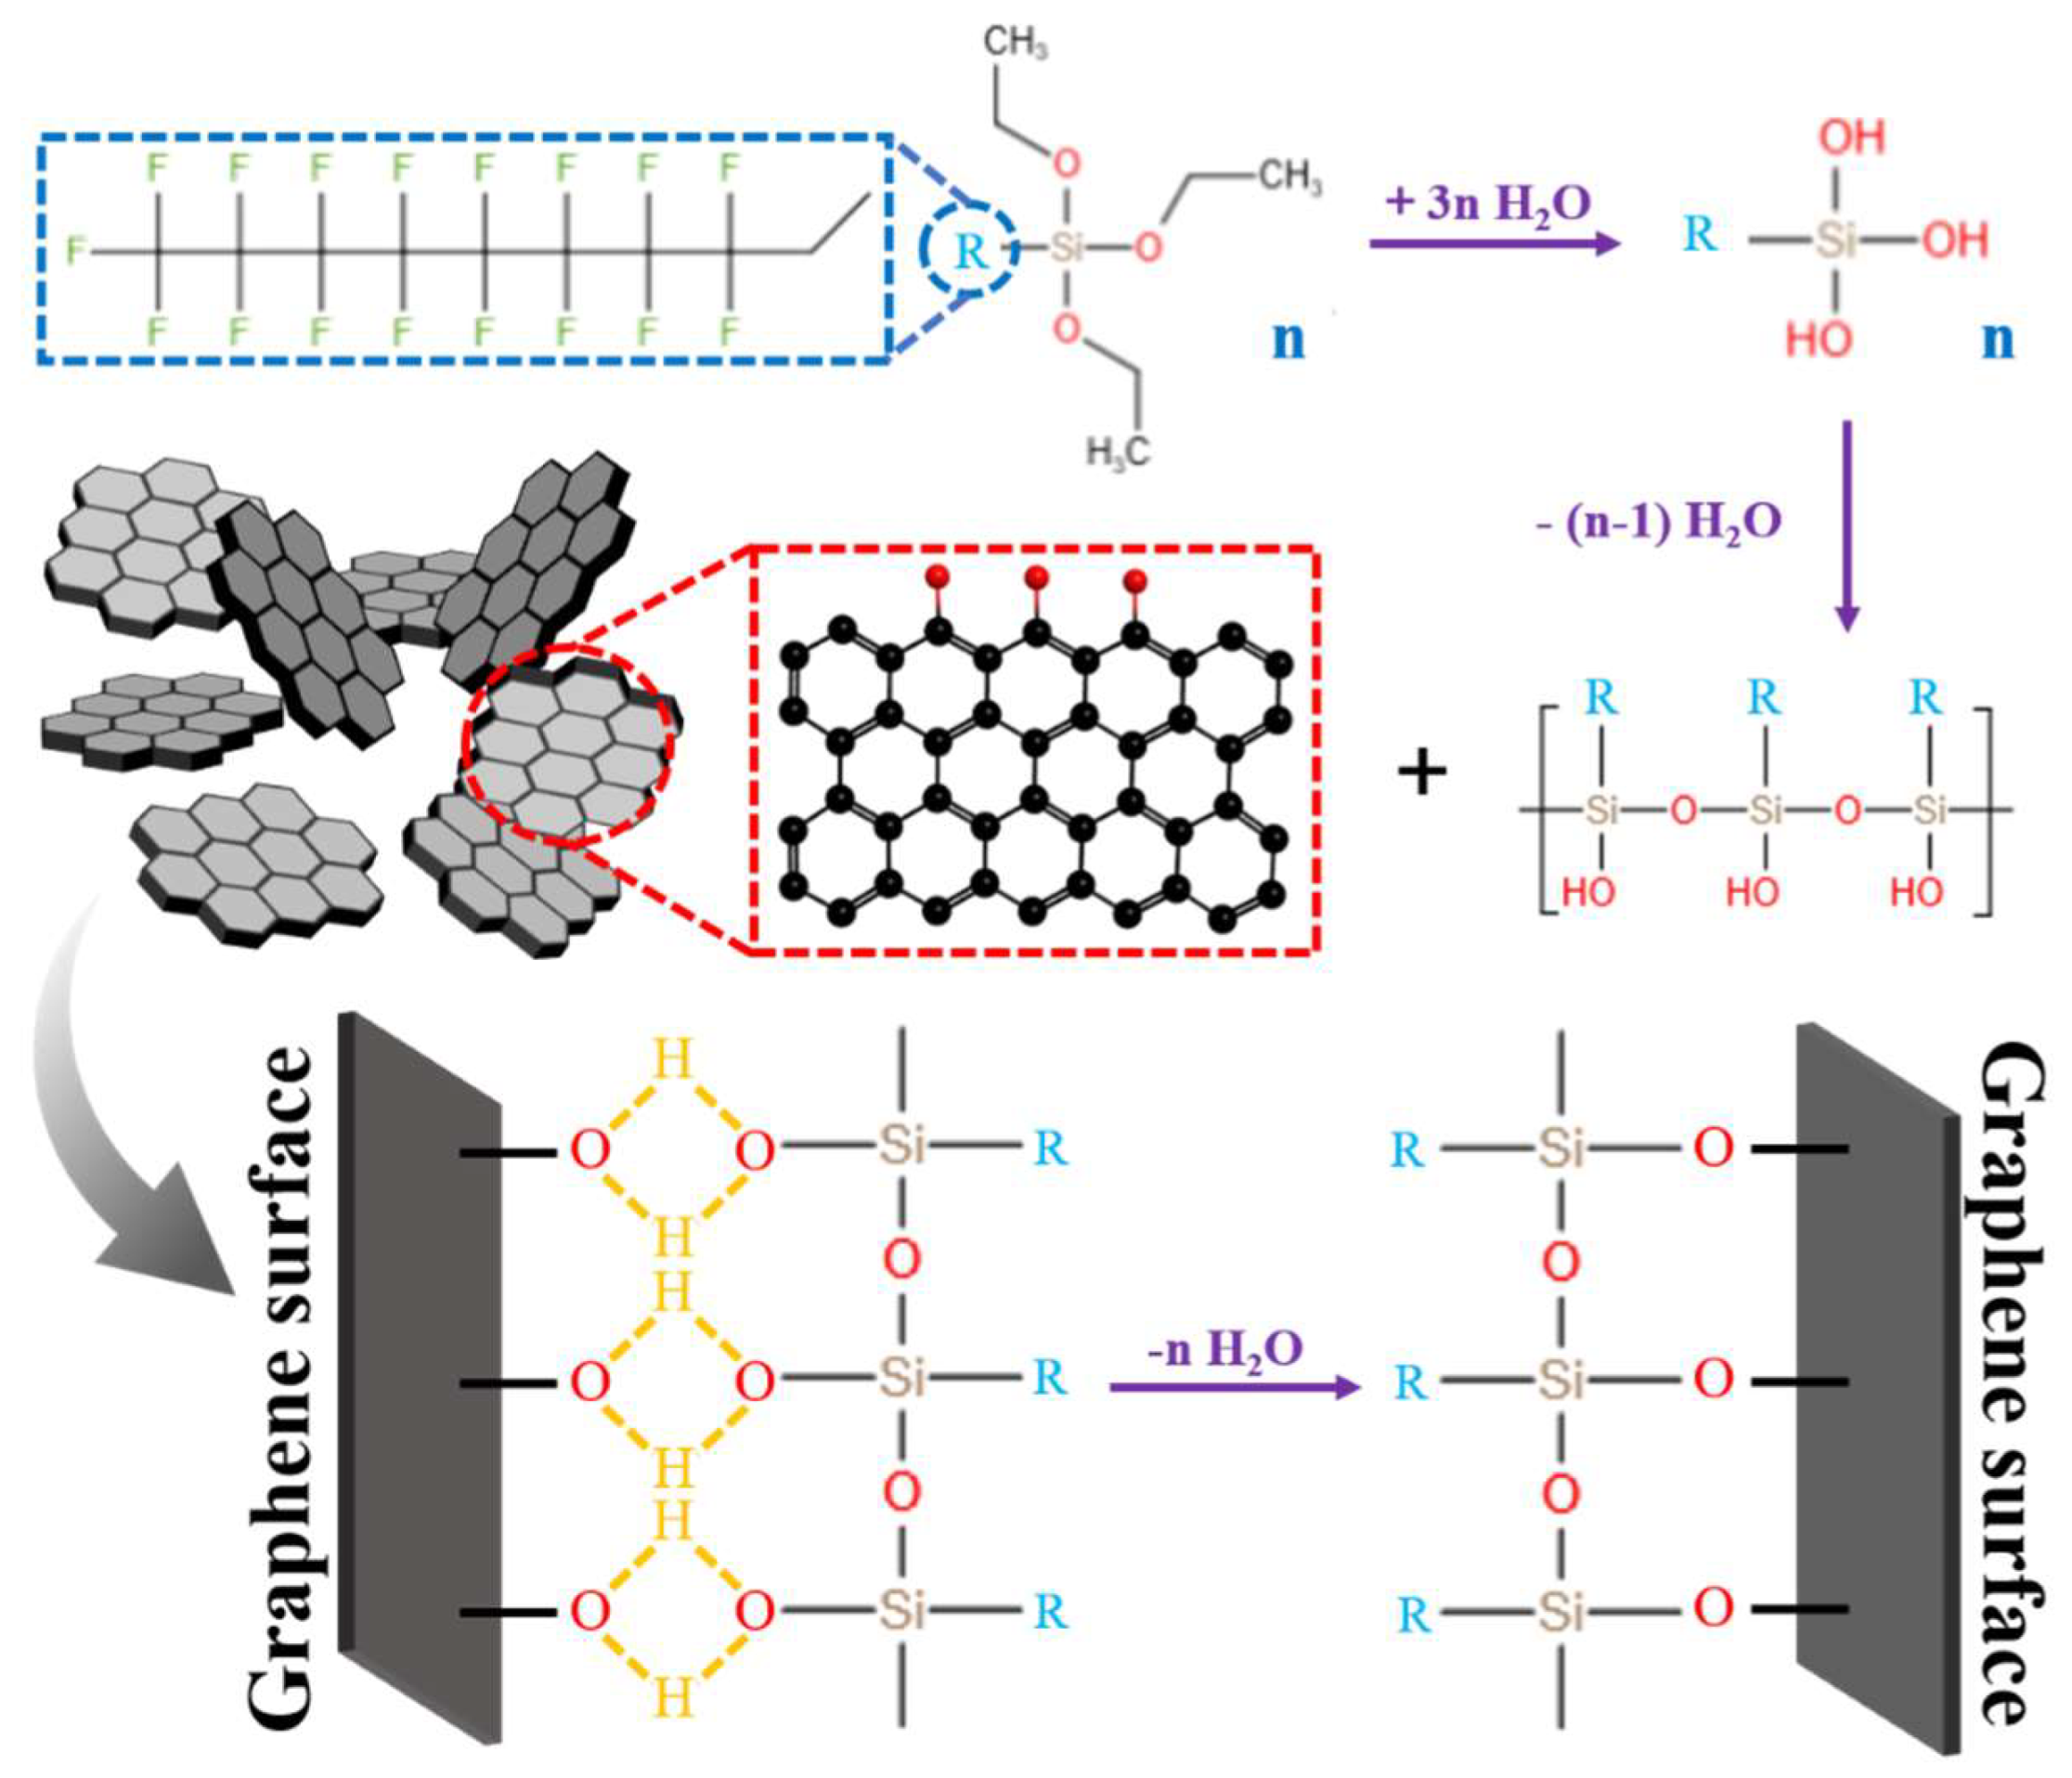
2.2. Preparation of AC-FAS Modified Graphene Nanosheets

The modification principle of graphene nanosheets is shown in Scheme 1. First, 400 mL of ethanol and 600 mL of DI water were poured into the beaker. Then, 5 g of graphene nanosheets was added to the beaker, and the mixture was continuously stirred at 500 rpm for 10 min to obtain a dispersion solution. The obtained dispersion solution was placed in the ultrasonic cell crusher for 30 min to reduce the size of the graphene nanosheets and disperse more evenly. After ultrasonification, perfluorodecyl triethoxysilane (2 wt% ethanol) and 3 droplets of acetic acid were added to the above dispersion solution, and the reaction was carried out in a magnetic stirring oil bath at 60 °C and 1000 rpm for 4 h. After the reaction, the dispersion liquid was allowed to cool to room temperature and then filtered. Modified graphene nanosheets (AC-FAS-GP) were produced by drying the resulting filtered cake for 8 h at 100 °C in a vacuum drying oven after it had been cleaned in a mass ratio of 1:1 ethanol/water solution. The AC-FAS-GP was ground for use.

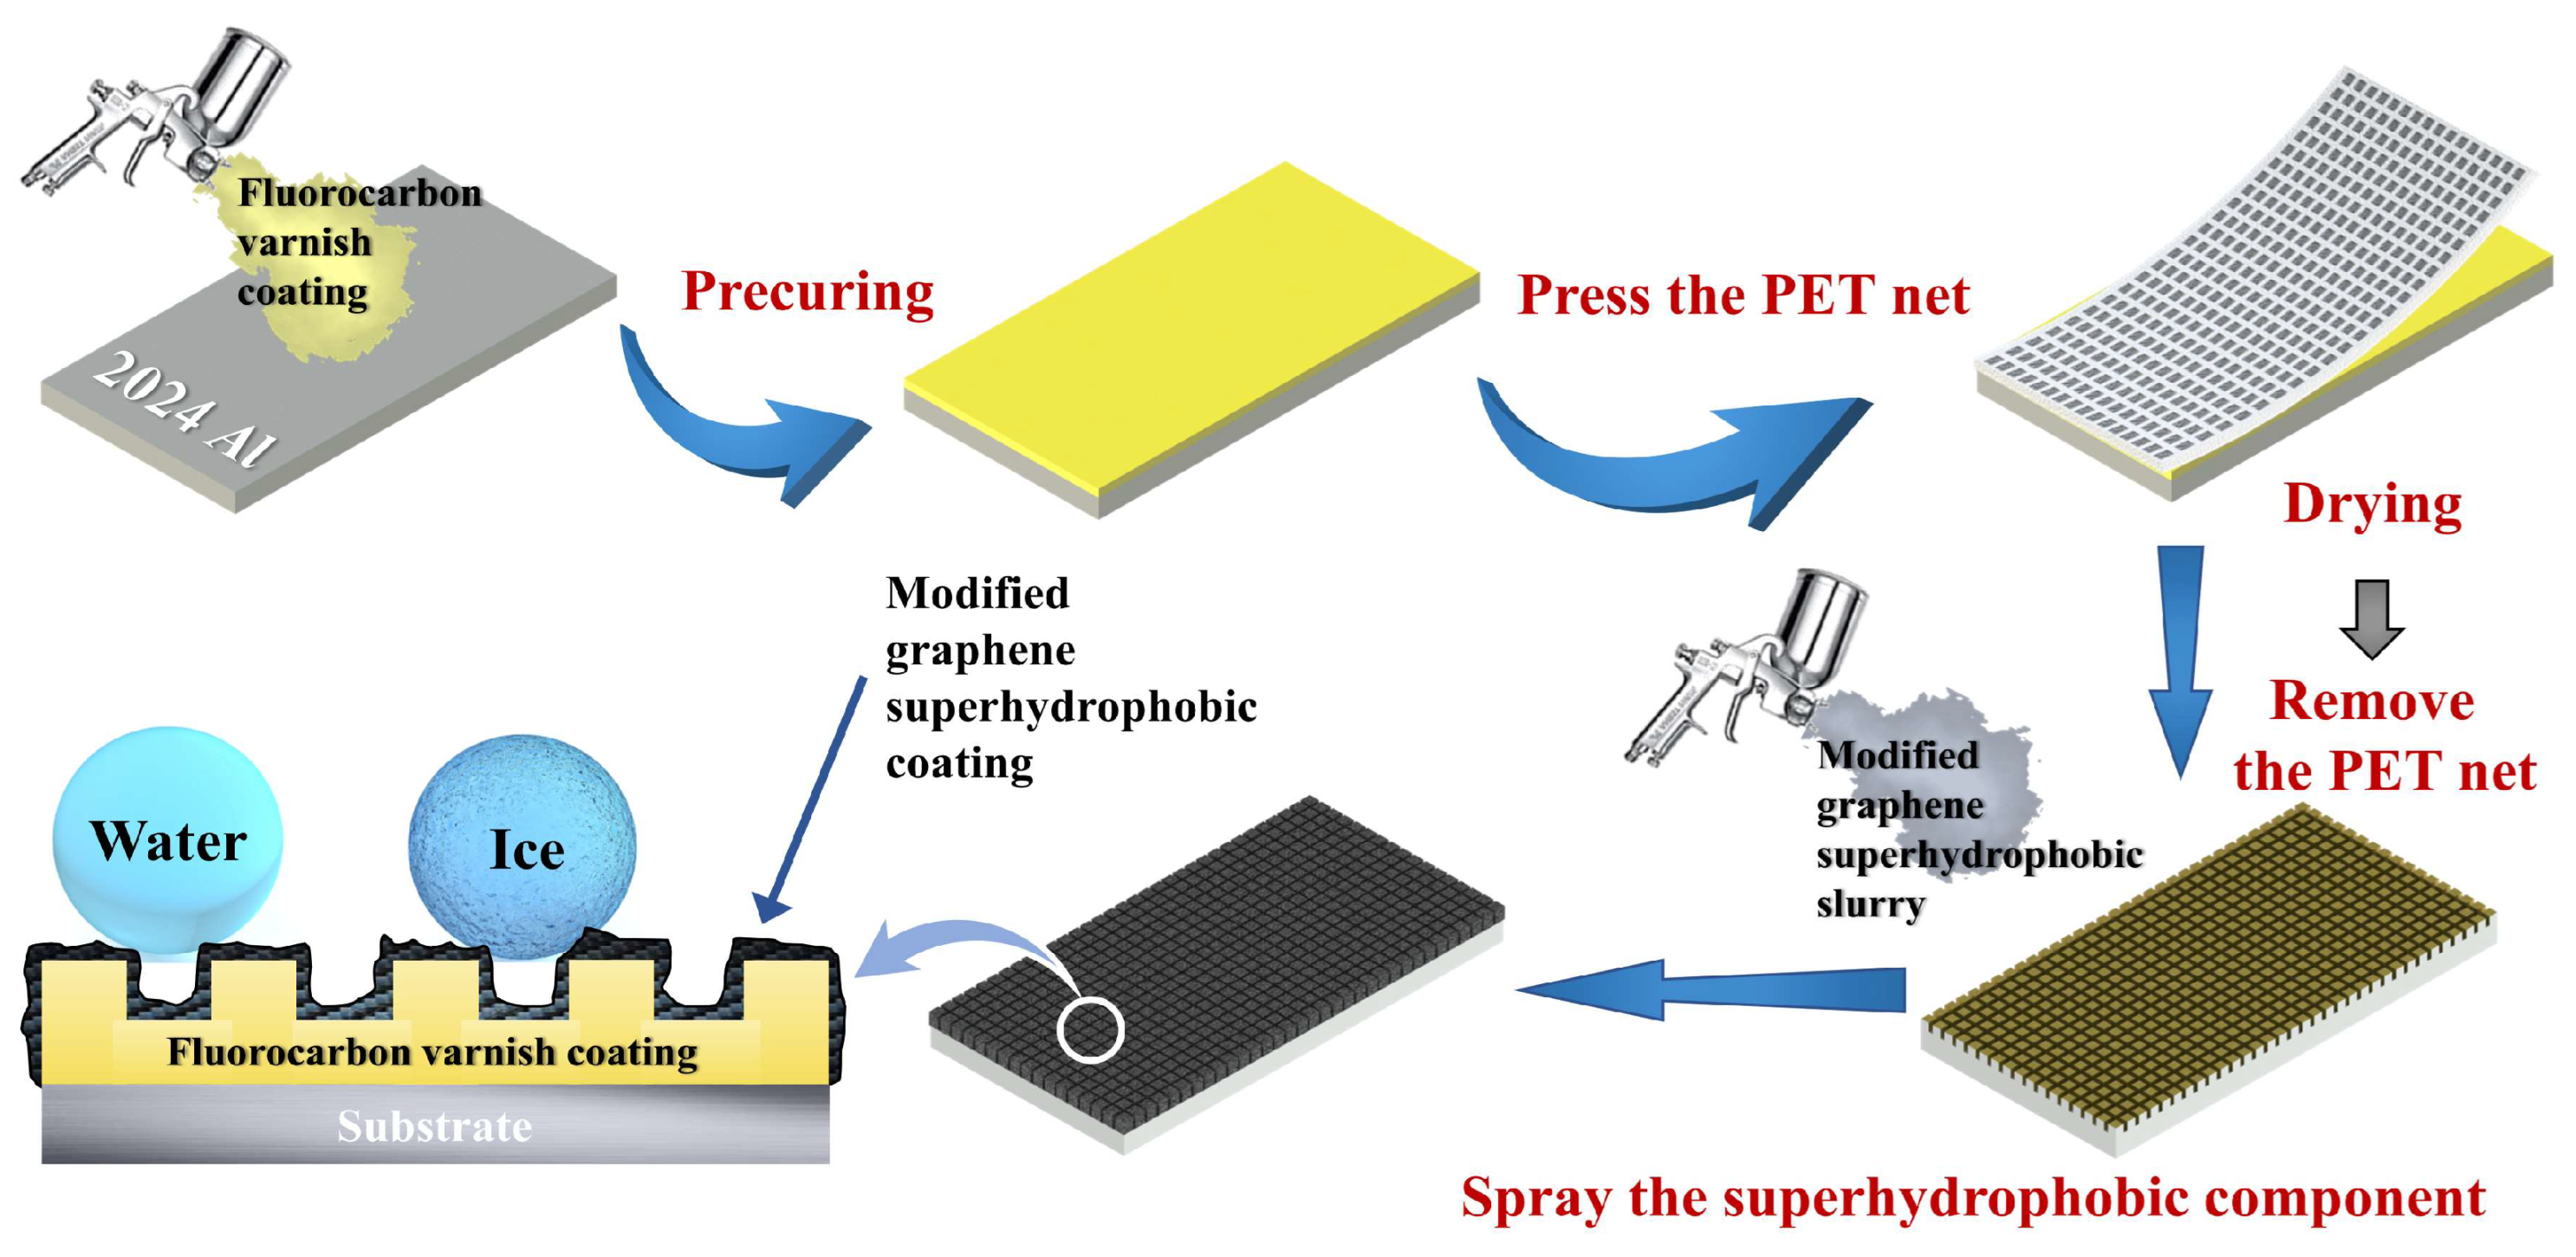
2.3. Preparation of Modified Graphene Micropillar Array Superhydrophobic Coating

Firstly, the modified graphene superhydrophobic slurry was produced. Then, 0.53 g of modified graphene nanosheets were added to 40 g of xylene solvent and dispersed at 1000 rpm for 10 min to create a dispersion solution. After that, the dispersion solution was treated in an ultrasonic cell crusher for 30 min, and then 3 g of fluorocarbon resin was added to the above dispersion solution and dispersed at 1000 rpm for 30 min to form the modified graphene superhydrophobic slurry.
The fabrication of the micropillar array varnish coatings was the second step. The materials were evenly mixed according to the formulation in Table S2 to obtain the main agent of the fluorocarbon varnish coating. Then, the main agent and hardener (N3390) were fully mixed according to a mass ratio of 10:1, and then stood for 10 min. Subsequently, the mixture was sprayed within the pressure range of 0.6 MPa~0.8 MPa onto the AA 2024-T3 aluminum alloy substrates. The distance from the spray gun muzzle to the substrate surface was about 15 cm. After spraying, these coated samples were put in an oven at 30 °C for pre-curing, after which the PET nets with different mesh numbers were pressed into the pre-cured fluorocarbon varnish coating. After the coatings were dried for 24 h at 80 °C, the PET nets were removed to achieve the micropillar array varnish coatings with various pillar widths (Q80, Q100, Q120, Q160, and Q200).
The modified graphene micropillar array superhydrophobic coatings (Q80G, Q100G, Q120G, Q160G, and Q200G) were obtained by spraying slurry onto the surface of micropillar array varnish coatings. After spraying slurry, these coatings were allowed to dry for a full day at room temperature. Scheme 2 shows the steps involved in creating the modified graphene micropillar array superhydrophobic coating. Furthermore, the cured varnish coating was sprayed with slurry to create the modified graphene planar superhydrophobic coating (QG) without a micropillar array structure for comparative analysis.

2.4. Characterization

The chemical composition of the AC-FAS-GP was measured on a Fourier transform infrared (FT-IR) spectrometer (Nicolet iS20, Thermo Scientific, Waltham, MA, USA), and the wavelength range of 400–4000 cm−1 was used for observation. X-ray photoelectron spectroscopy (XPS) (Escalab250, Thermo Scientific, Waltham, MA, USA) was employed to examine the elemental constitution and chemical bond information of AC-FAS-GP. XPSPEAK41 software was used to fit and optimize the XPS data, with C1s (284.8 eV) acting as the standard reference. The Raman spectrophotometer (LabRAM HR Evolution, Horiba, Japan) was used to record the Raman spectra. The micromorphologies of these coatings were observed using scanning electron microscopy (SEM) (XL30FEG, Philips, Hillsboro, MO, USA), and each sample was treated with gold spray before observation. A laser confocal microscope (LSM700, Carl Zeiss AG, Jena, Germany) with a wavelength of 4.5 nm and an intensity of 1 AU was used to quantify surface roughness (Rsa).
Static water contact angles (WCA) and sliding angles (SA) were measured using a water contact angle goniometer (JC2000D, Shanghai Zhongchen Digital Technology Co., Ltd., Shanghai, China) with a droplet size of 10 μL. Two samples from every coating were selected for analysis in the test. For every sample, at least three separate locations were measured, and the results were averaged.
Freezing delay time and deicing shear force were used to assess the coating’s anti-icing performance. Prior to analysis, the sample was positioned on a metal platform within a mostly closed cold chamber that was kept at a temperature of −10 ± 1 °C and a relative humidity of 60 ± 1%. After around 10 min, the surface temperature of the sample was maintained at −10 °C, and then 10 μL of deionized water at 0 ± 1 °C was placed on the sample’s surface. Using a high-speed CMOS camera (MV-CH050-10UC, Dalian Deshi Testing Technology Co., Ltd., Dalian, China), the complete freezing process was recorded. The freezing delay time was measured by changes in the transparency and shape of the water droplet. The deicing shear force was measured under the same conditions using a digital thrust meter with an ice shovel (SJH-500, Shandu Technology Co., Ltd., Wenzhou, China). The material of the ice shovel was aluminum alloy. The digital thrust meter moved at a constant speed of 3 cm/s to remove the ice from the sample surface, and then the maximum thrust was recorded.
By employing a workstation (PARSTAT 4000A Princeton, NJa, Jenkintown, PA, USA), electrochemical impedance spectroscopy (EIS) experiments were carried out in a 3.5 wt% NaCl solution. In the test, platinum sheet was utilized as the auxiliary electrode, and the saturated calomel electrode (SCE) was employed as the reference electrode. The test area for the working electrode (sample) is 12.56 cm2. The sinusoidal disturbance signal amplitude is 25 mV, and the scan frequency ranges from 105 to 10−2 Hz. At the end, the experimental data was fitted using the ZSimDemo3.30d software.

3. Results and Discussion

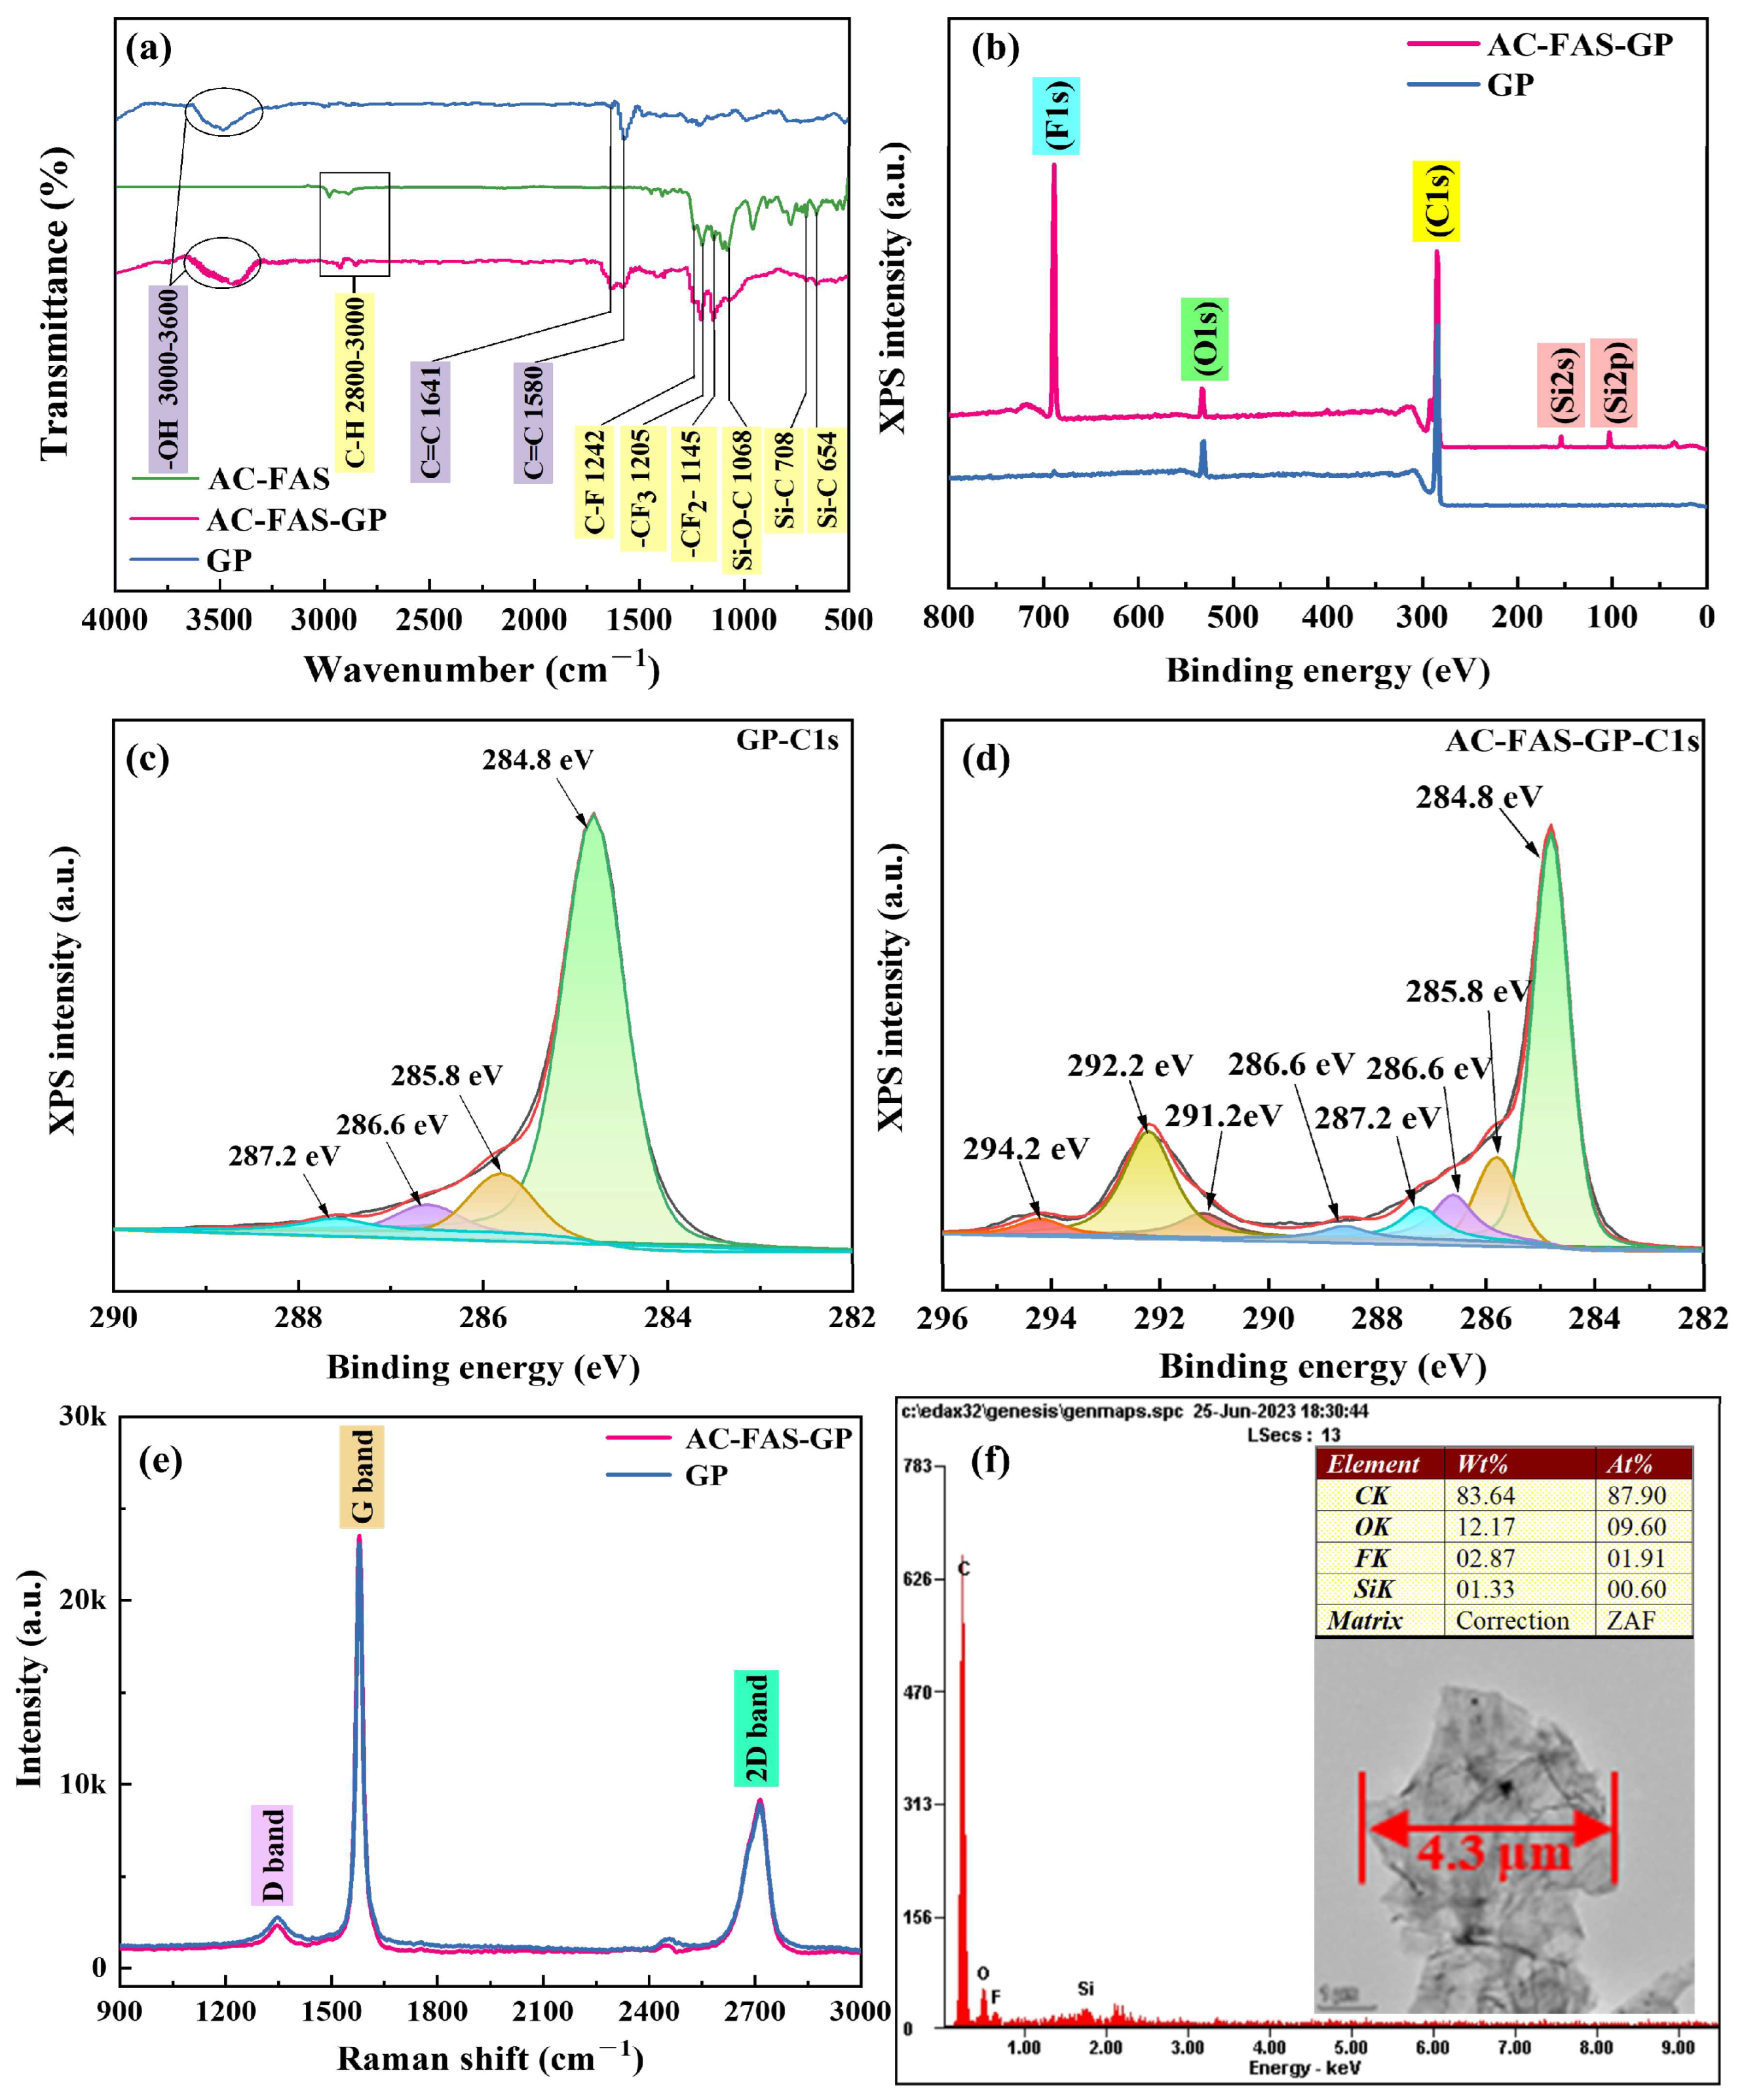
3.1. Characterization of AC-FAS-GP

In order to determine the composition of AC-FAS-GP, the functional groups of graphene nanosheets (GP) and AC-FAS-GP were identified by infrared spectroscopy. Their infrared spectra are shown in Figure 1a. Firstly, an intense absorption signal at 3000–3600 cm−1 was seen in both GP and AC-FAS-GP, which was related to the stretching vibration of -OH [24]. Meanwhile, two distinctive graphene absorption signals at 1641 cm−1 and 1580 cm−1 were observed in both GP and AC-FAS-GP, which were ascribed to the in-plane stretching vibration of graphene sp2-C [25]. In addition, AC-FAS-GP displayed a series of new absorption peaks: C-H (2800–3000 cm−1), C-F (1242 cm−1), -CF3 (1205 cm−1), -CF2- (1145 cm−1) [26], Si-O-C (1068 cm−1), and Si-C (708 cm−1 and 654 cm−1) [27]. These new absorption peaks were all derived from AC-FAS, which confirmed that GP were successfully modified by AC-FAS.
The Raman spectra of GP and AC-FAS-GP are shown in Figure 1b. The D, G, and 2D bands of GP were located at 1347 cm−1, 1578 cm−1, and 2714 cm−1, while the D, G and 2D bands of AC-FAS-GP were located at 1342 cm−1, 1576 cm−1, and 2712 cm−1, respectively. Generally, the D band, G band, and 2D band are regarded as the structural defects of graphene, the in-plane vibration of sp2-C, and the stacking mode of C, respectively [28]. The graphene defect density has been defined as the proportion of the D band strength to the G band strength (ID/IG). The ID/IG of GP and AC-FAS-GP were 0.123 and 0.098, respectively. It suggested that the defects of the graphene nanosheets were reduced after modification. Furthermore, the ratio of 2D band strength to G band strength (I2D/IG) is used to estimate the number of stacking layers of graphene. The I2D/IG values of both GP and AC-FAS-GP were about 0.39, which indicated that graphene nanosheets are multilayer [29].
To further investigate the elemental composition and chemical bonding details of AC-FAS-GP, XPS analysis was performed. As shown in Figure 1c, the XPS wide-scan spectrum of GP showed the binding energy peaks of C and O at 284.8 eV and 531 eV, respectively. Among them, the O elemental content of GP was about 8.2% in Table S3 (Supporting Information), which indicated that a small amount of functional groups that contained oxygen existed on the graphene’s surface. In contrast, the XPS wide-scan spectra of AC-FAS-GP showed binding energy peaks of Si and F at 102 eV, 154 eV, and 689 eV, respectively. Especially, the F elemental content of AC-FAS-GP was about 22.7% in Table S2, which confirmed that the graphene nanosheets were successfully modified by AC-FAS.
The high-resolution C1s XPS spectra of GP and AC-FAS-GP were displayed in Figure 1d,e. The C1s spectrum of GP was comprised of four overlapping peaks: 284.8 eV (sp3 C-C), 285.8 eV (G-C=C) [30], 286.6 eV (C-OH) [31], and 287.2 eV (C=O) [32]. The C1s spectrum of AC-FAS-GP was comprised of eight overlapping peaks. Among them, four new overlapping peaks were located at 288.6 eV (O-C=O), 291.2 eV (C-F), 292.2 eV (-CF2-), and 294.2 eV (-CF3), respectively [33]. These new peaks were associated with AC-FAS, which further demonstrated that the GP surface has been successfully modified. In addition, the AC-FAS-GP had higher transparency and crumpled morphology, implying that it was a material composed of fewer layers [34]. Its size was relatively large, which signified that it needed further ultrasonic crushing before use. The surface energy spectrum and TEM image of AC-FAS-GP is shown in Figure 1f. It can be found that the F and Si appeared on the surface of AC-FAS-GP.

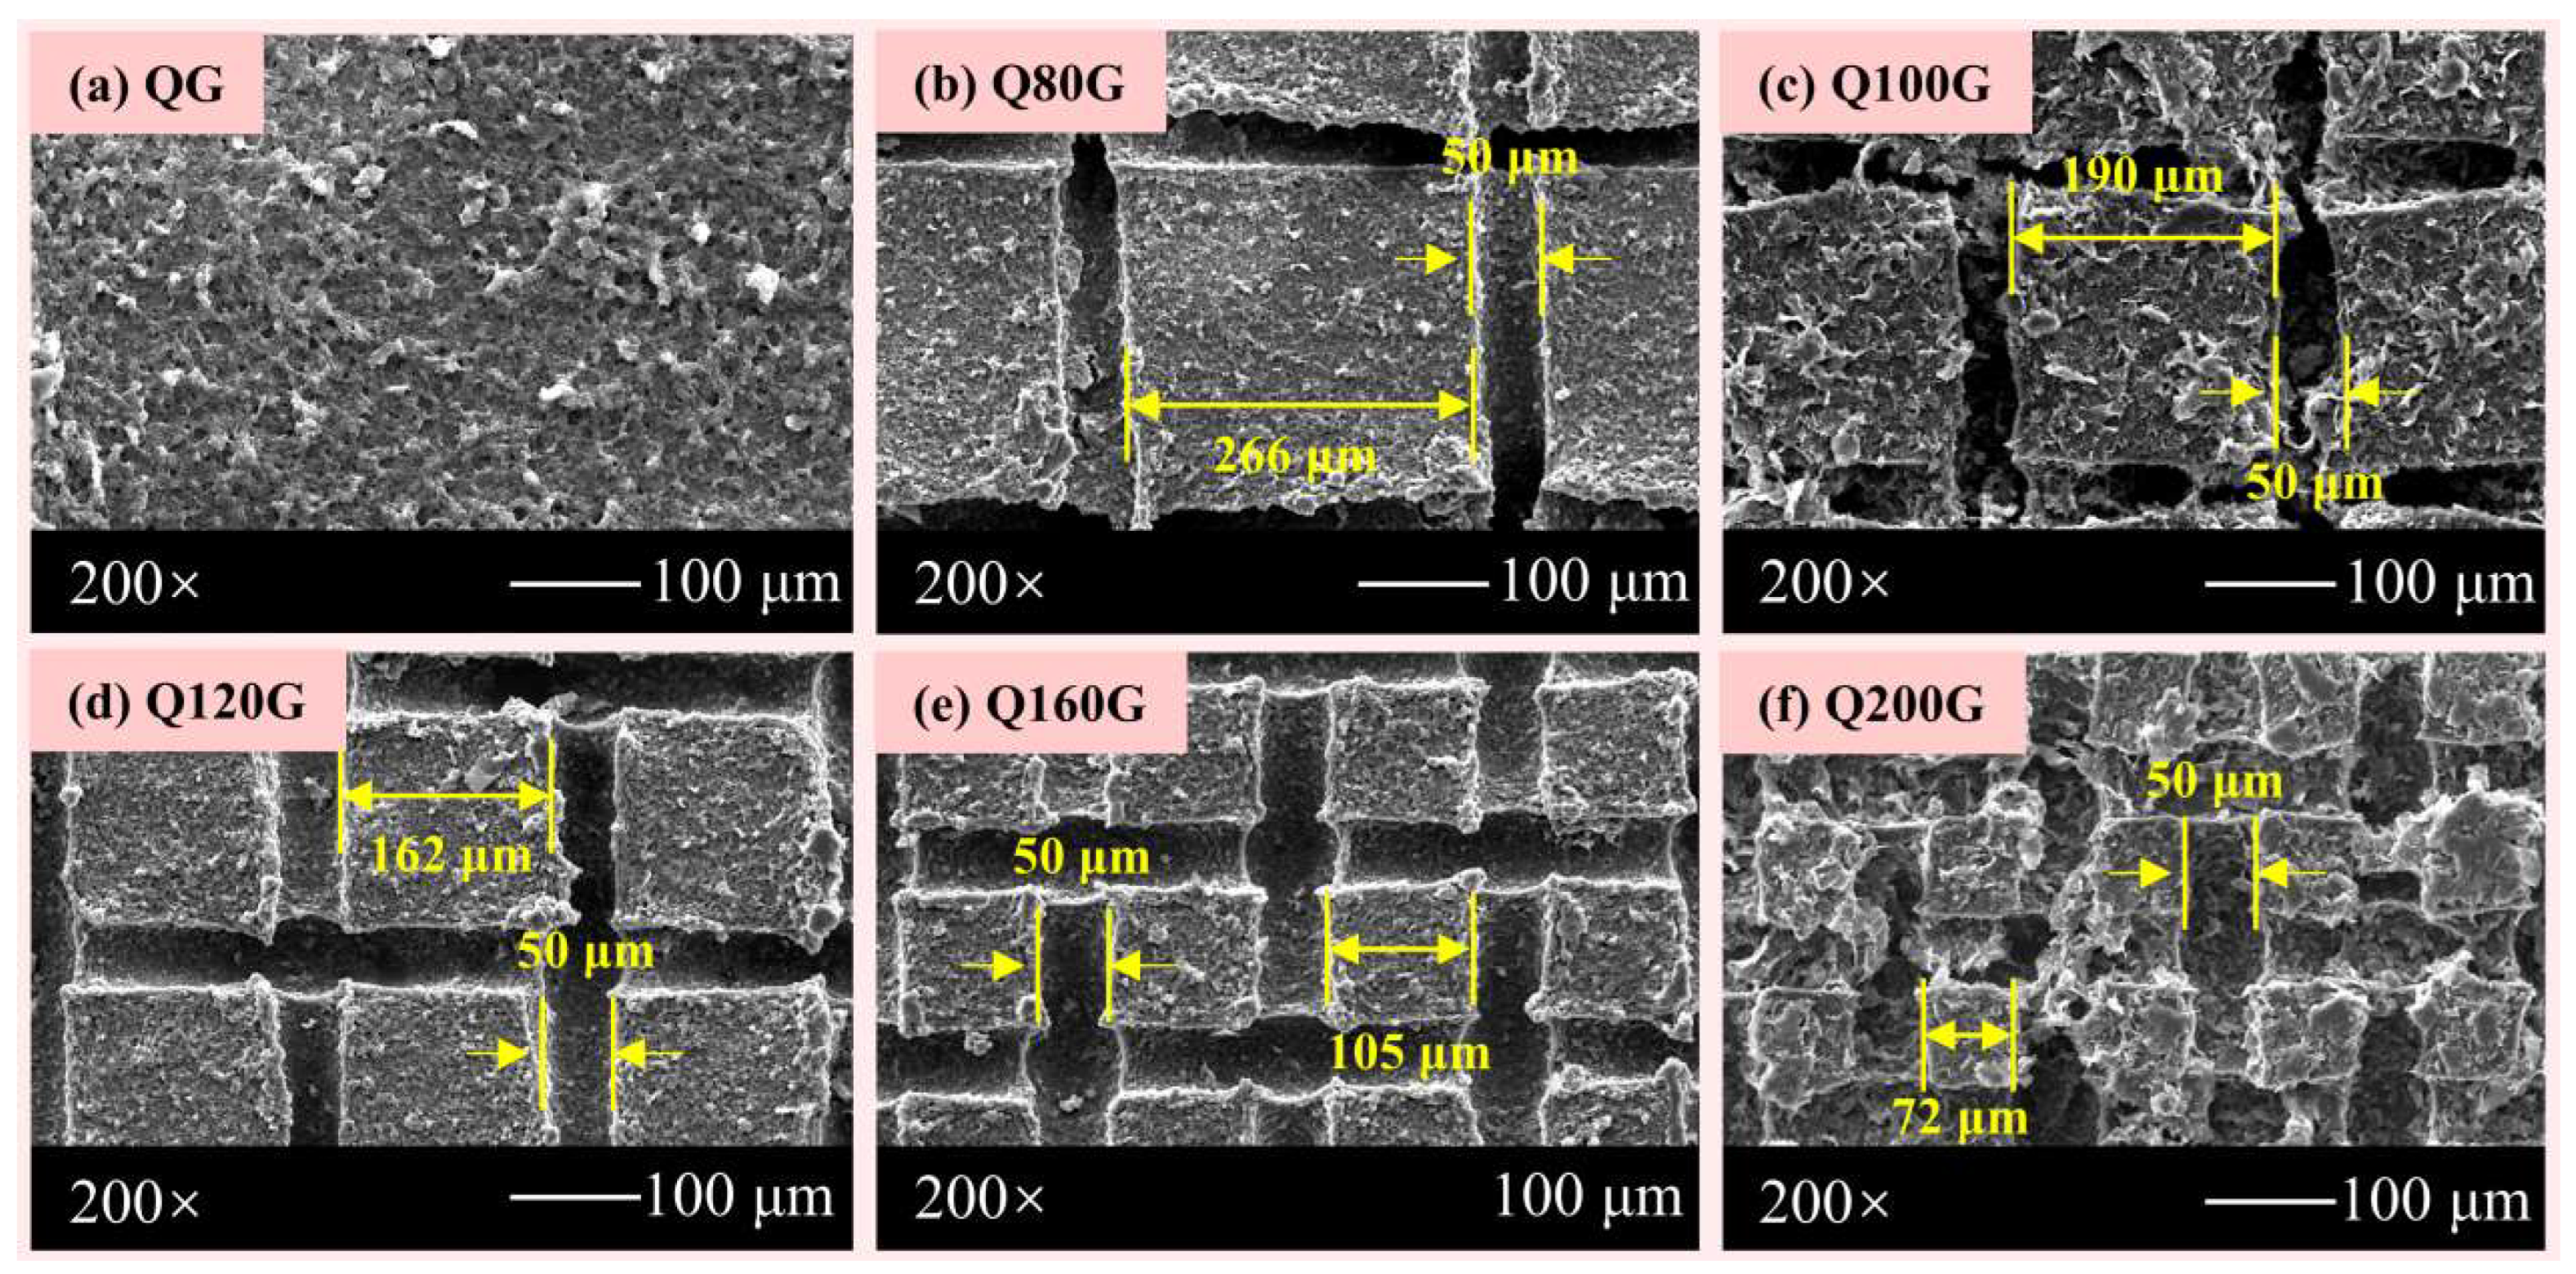
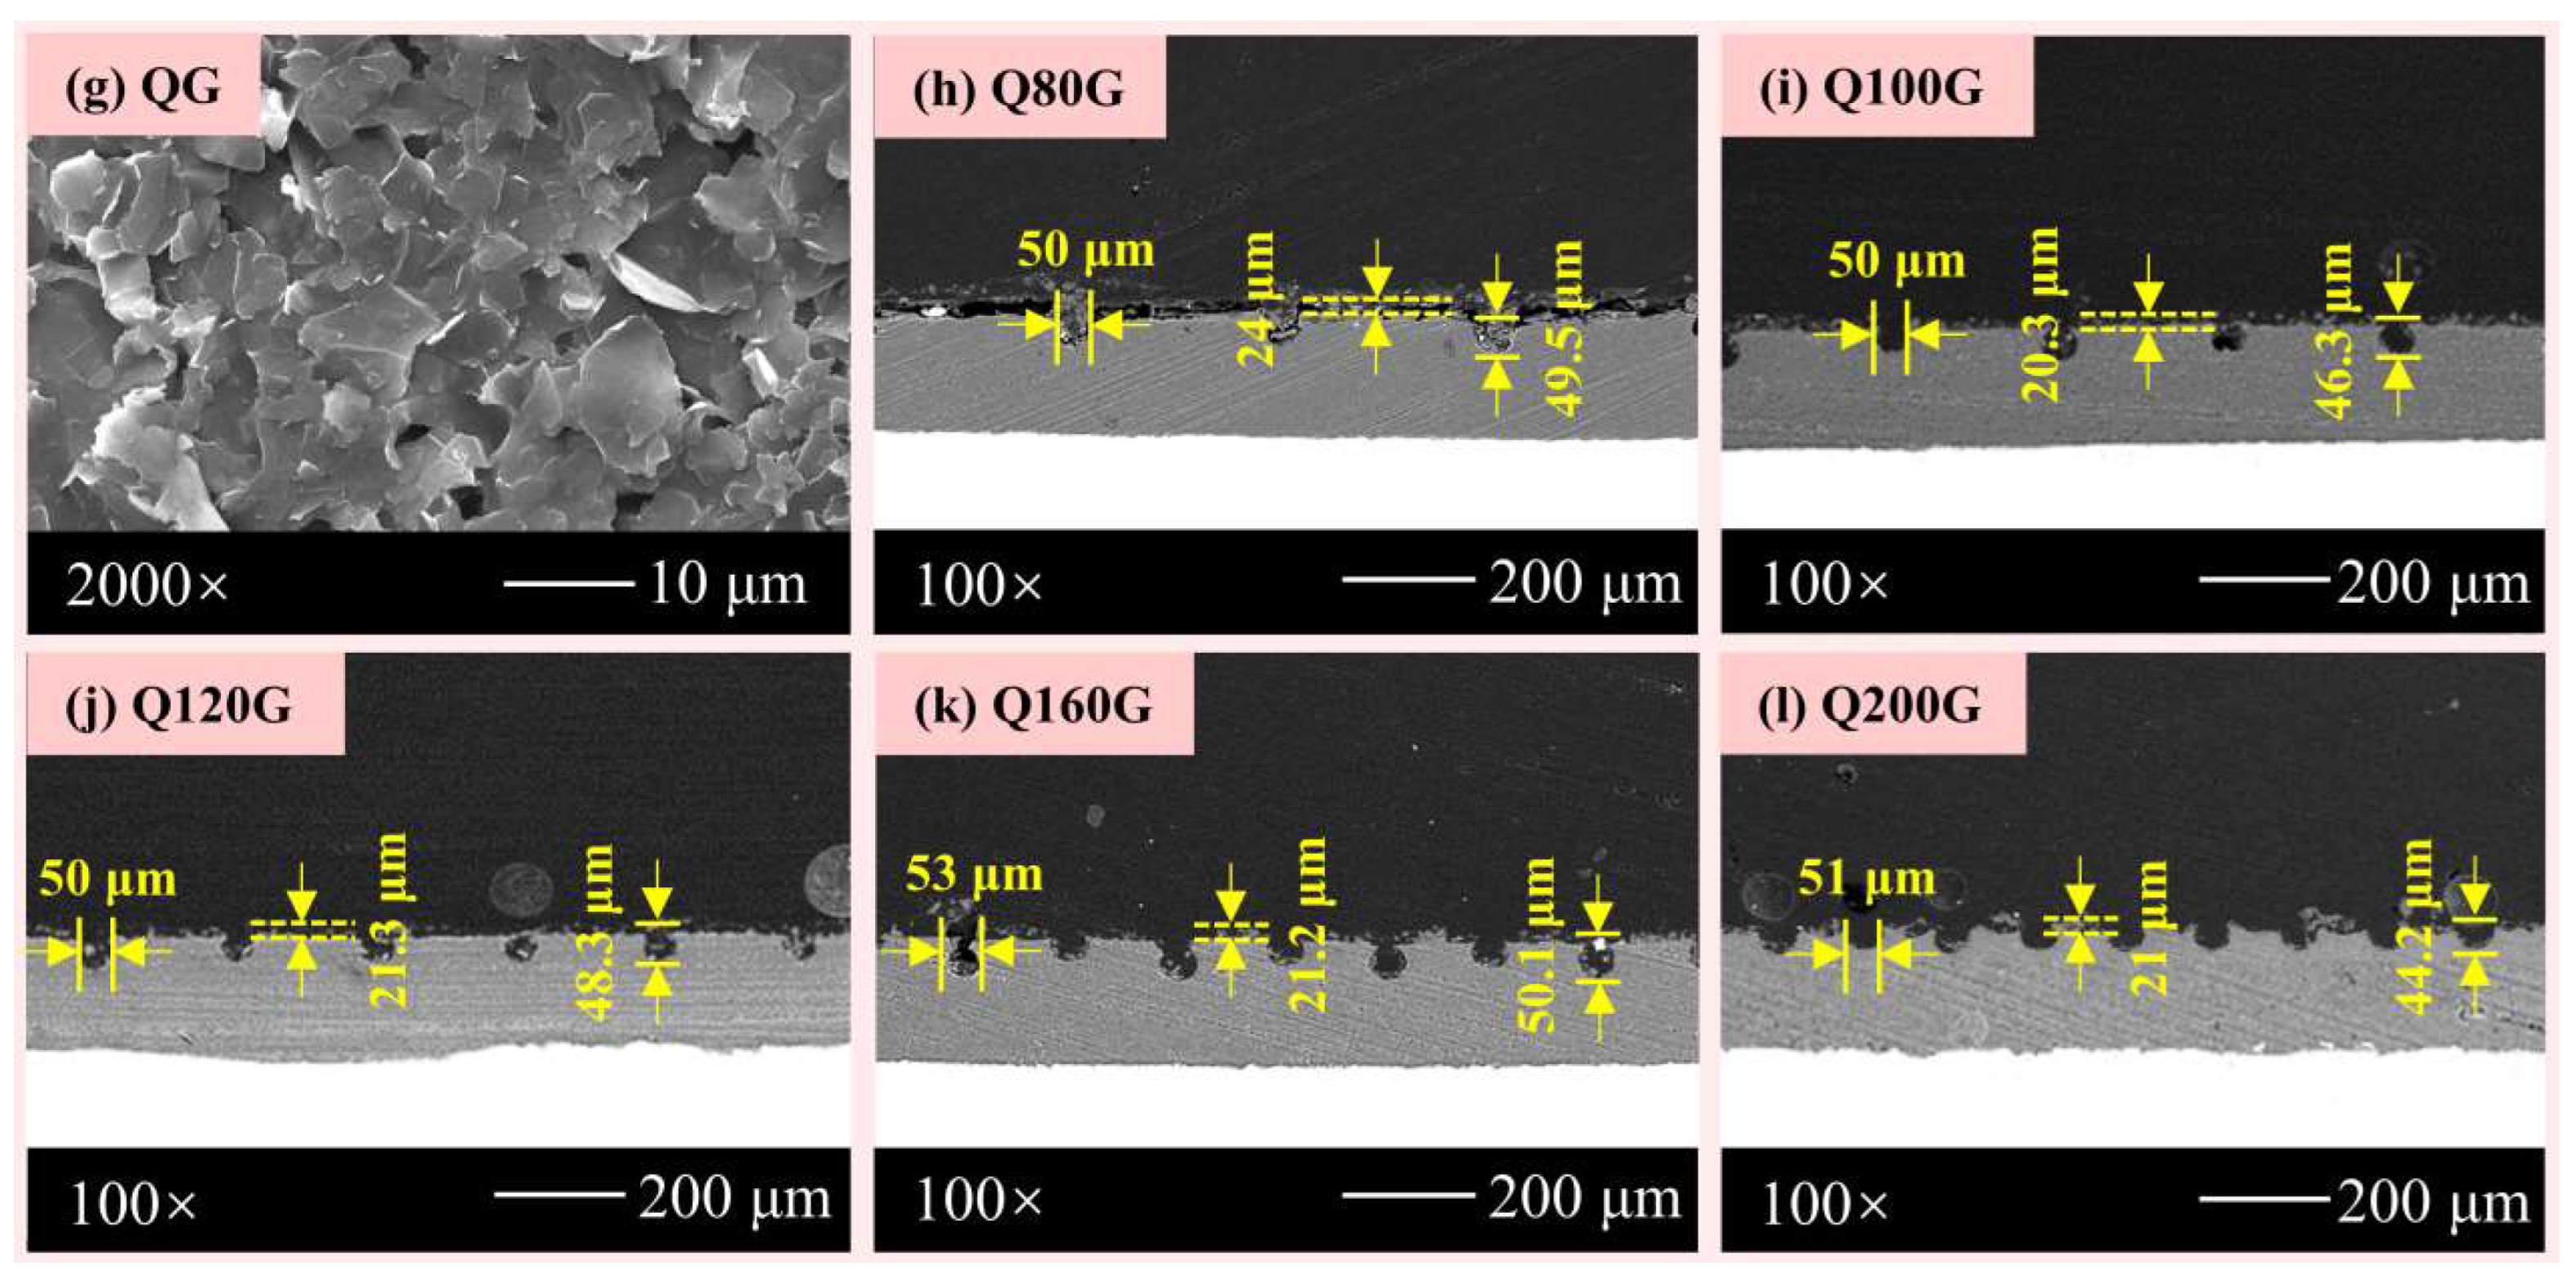
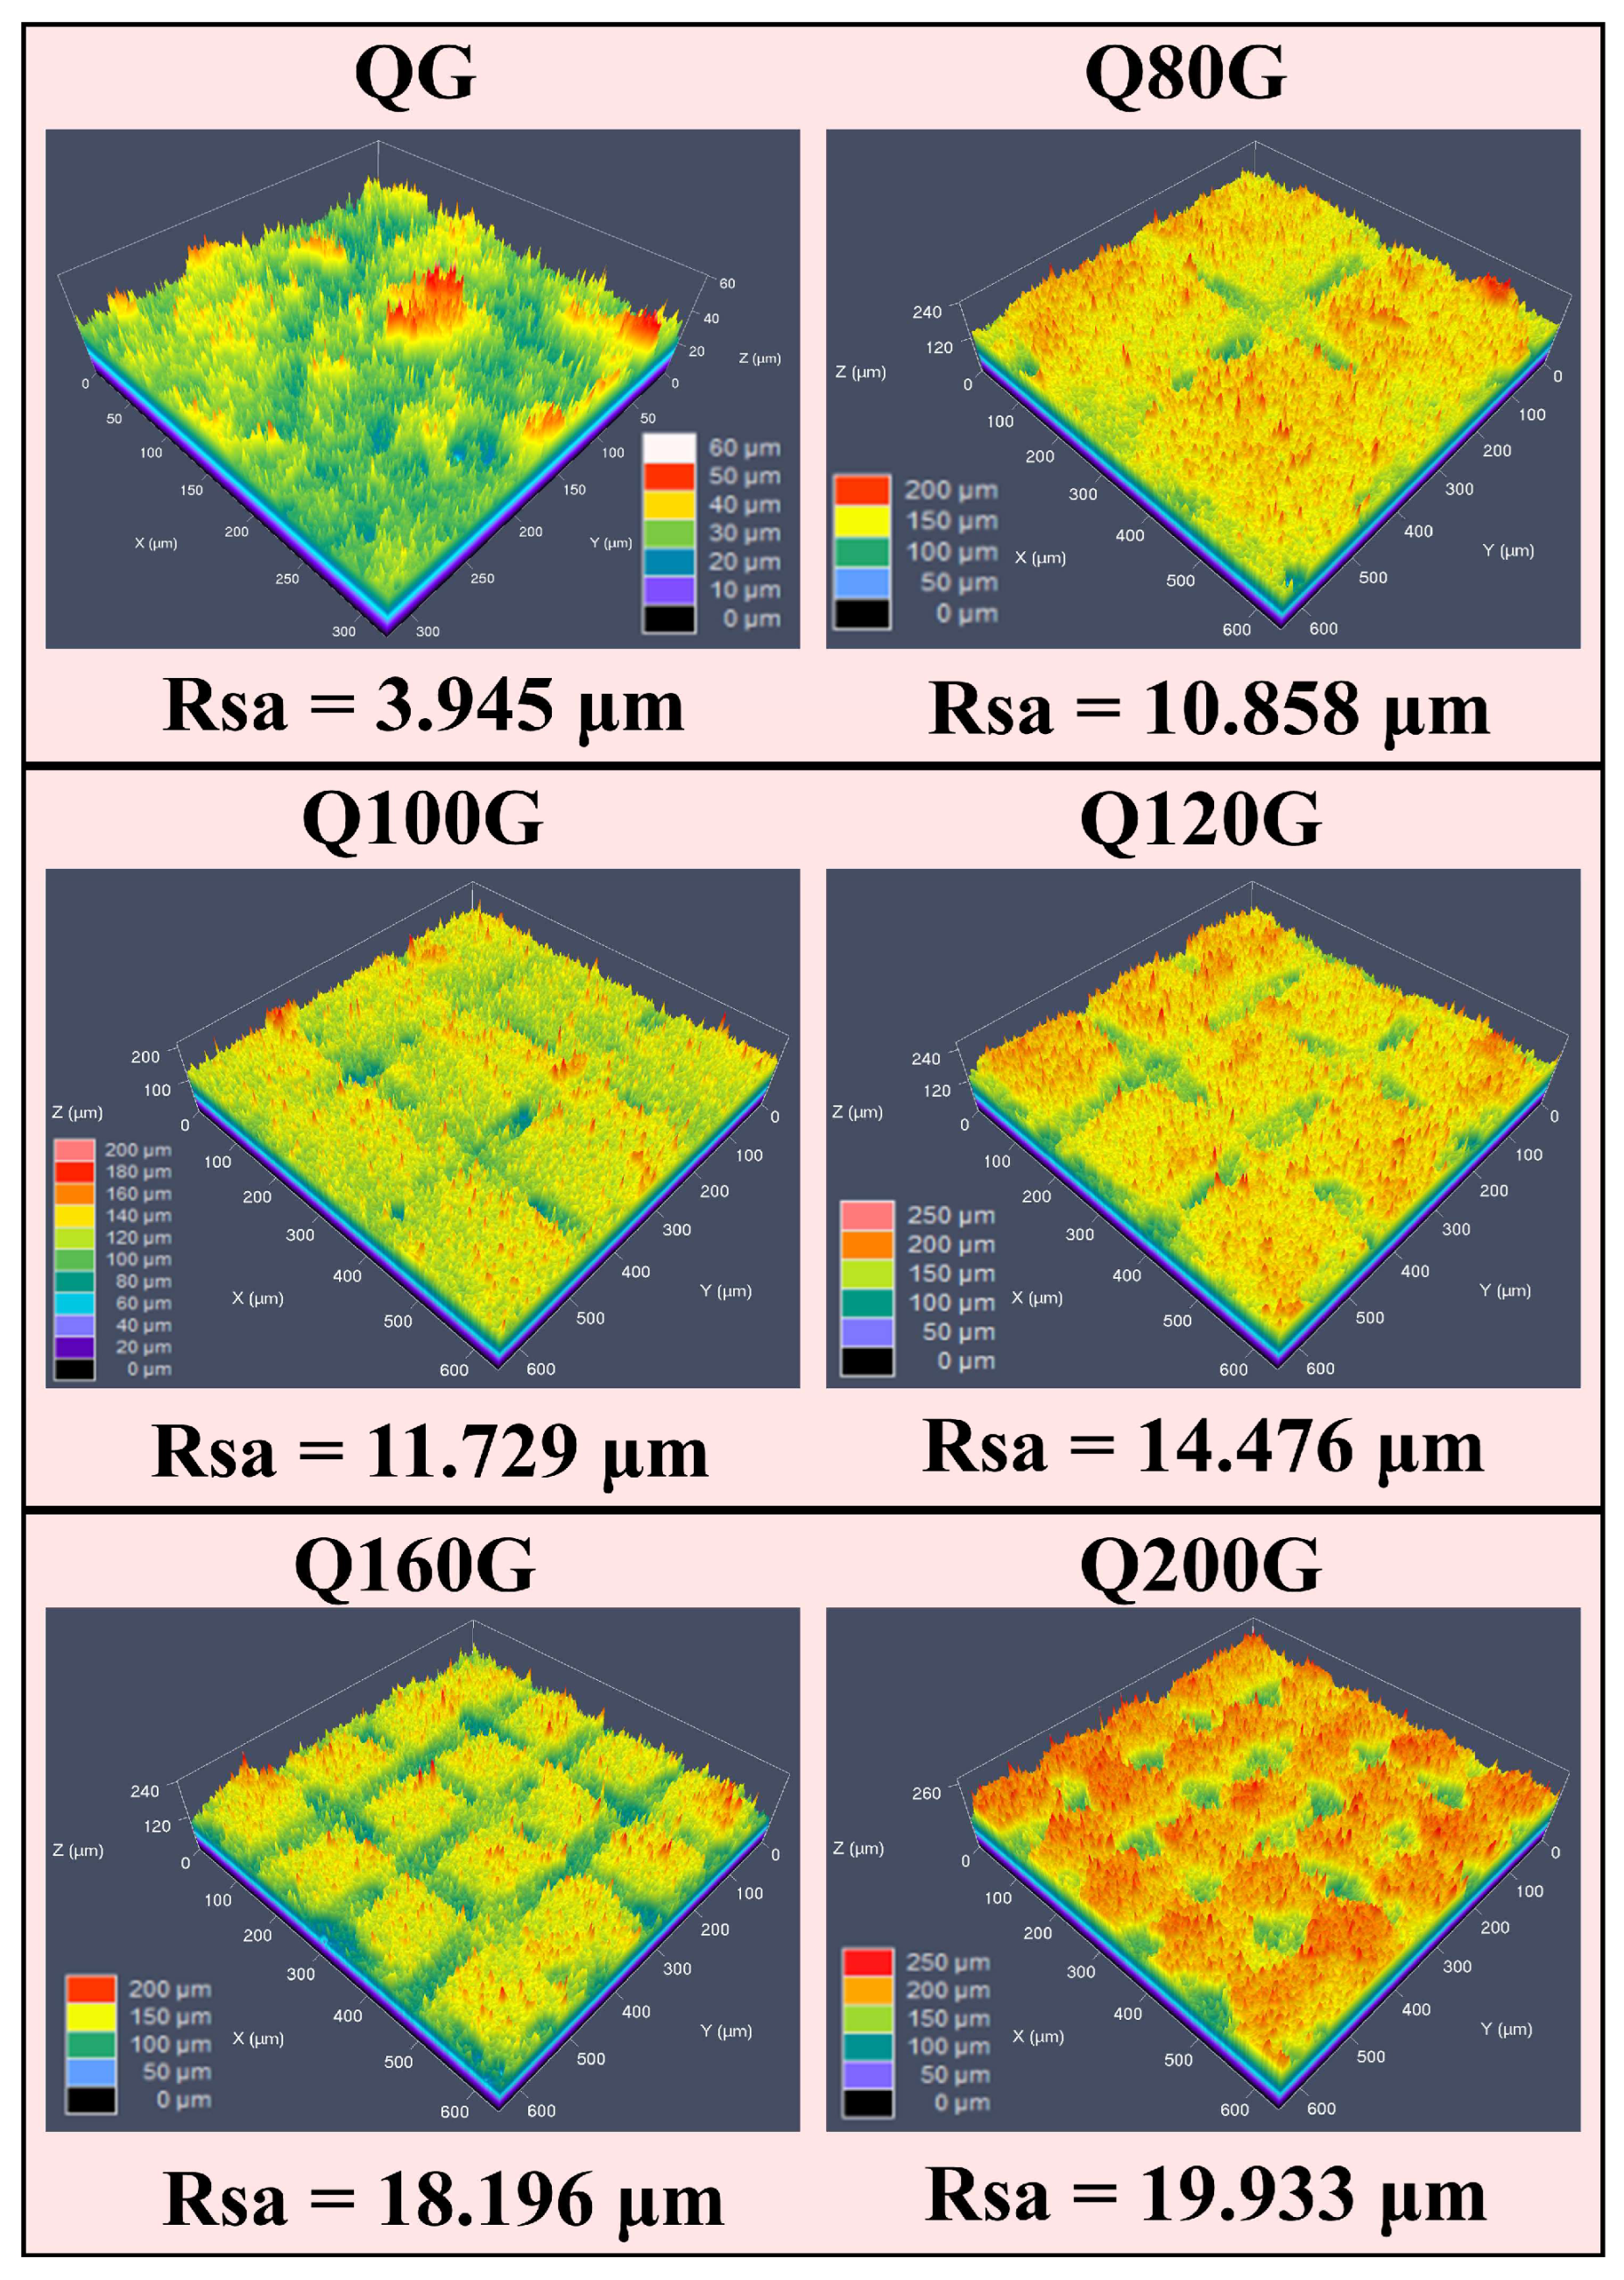
3.2. Morphologies of the Coatings

The micromorphologies of these coatings were characterized by SEM. As displayed in Figure 2a, the magnified image of the modified graphene superhydrophobic coating exhibits a micro–nanostructure formed by stacking modified graphene nanosheets. The surface and cross-sectional morphologies of the modified graphene micropillar array superhydrophobic coatings are presented in Figure 2b–f,h–l. Uniform micropillar array structures could be observed. The micropillar widths of Q80G–Q200G coatings are approximately 266, 190, 162, 105, and 72 μm, respectively. The microgroove average width and average depth of Q80G–Q200G coatings are about 50 μm and 47 μm, respectively. The surface of the micropillar top and the interior of the microgrooves were uniformly covered with the modified graphene superhydrophobic coating. In addition, the groove density per unit area (Φg) can be calculated according to the parameters measured by SEM. The Φg can be given by Formula (1):
Φg = [wg2/(wg + wp)2] × 100%
where wg and wp refer to the average microgroove width and the average micropillar width, respectively. The calculation results of the Φg were placed in Table 1.

3.3. Water Contact Angles and Sliding Angles

The WCA and SA tests were utilized to assess the surface wettability of modified graphene micropillar array superhydrophobic coatings. Figure 3a–f describe the variation of WCA and SA with the micropillar width. Primarily, all coatings exhibited superhydrophobicity (WCA > 150° and SA < 10°). The AC-FAS-GP not only supplied low surface energy but also manufactured micro-nanostructure, which endowed the coating surface with a strong ability to trap air. The water droplets appeared in Cassie state on these coating surfaces. Simultaneously, the WCA of each coating differs very little in comparison, which implied that the WCA was less affected by the micropillar width. Nevertheless, the SA gradually decreased as the width of the micropillar decreased. Particularly, the SA of the Q200G coatings was less than 5°. This result can be attributed to the following two aspects. On one hand, the actual region of contact between the coated surface and the water droplet was decreased due to the smaller micropillar width. Therefore, the water droplet generated a weaker adhesion to the coating surface. On the other hand, the reduction of the micropillar width increased the air content trapped by the coating surface, leading to a stronger air cushion effect.

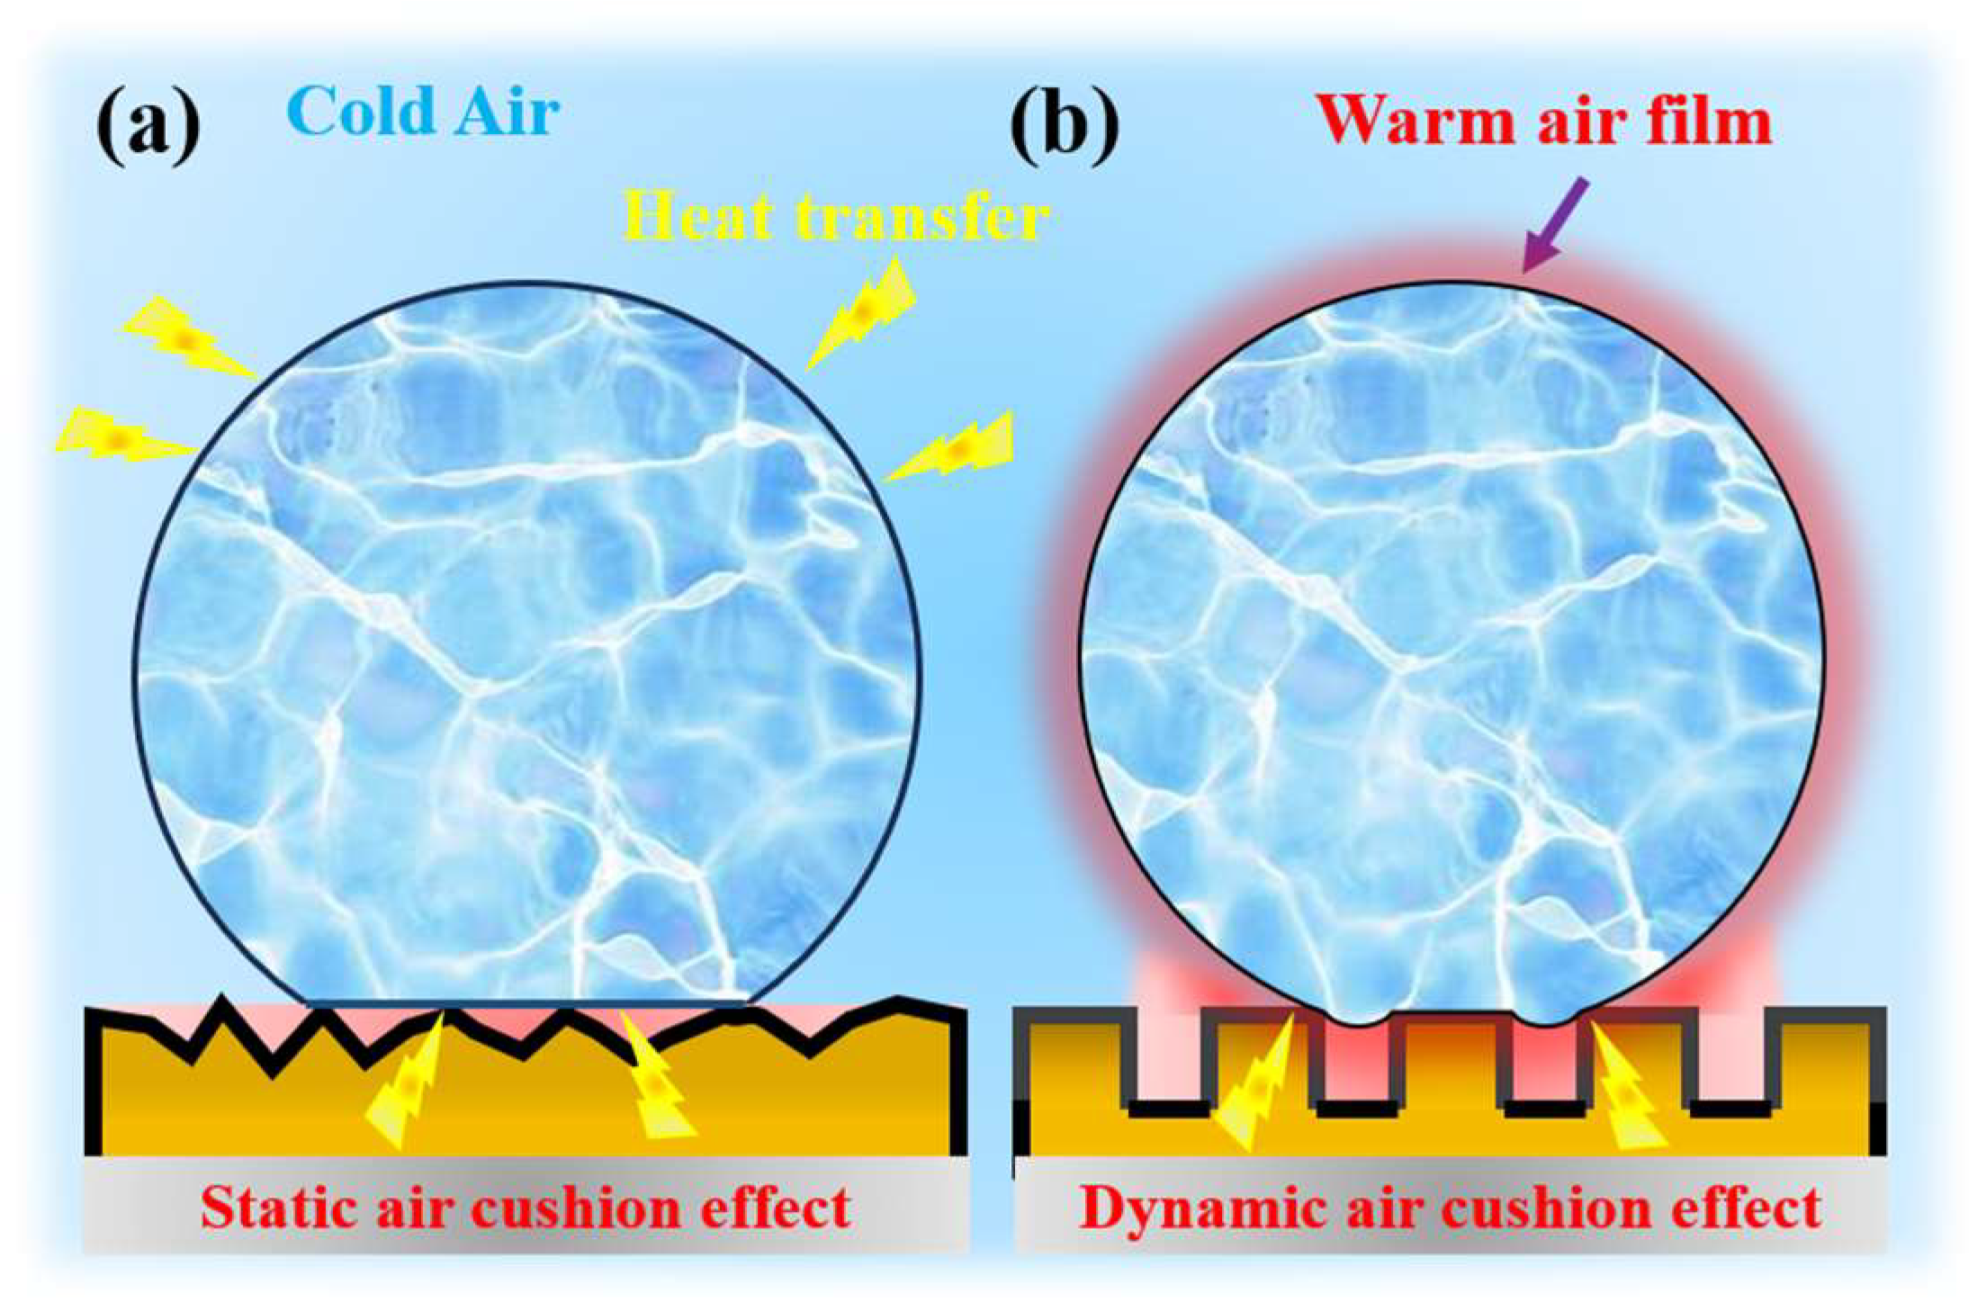
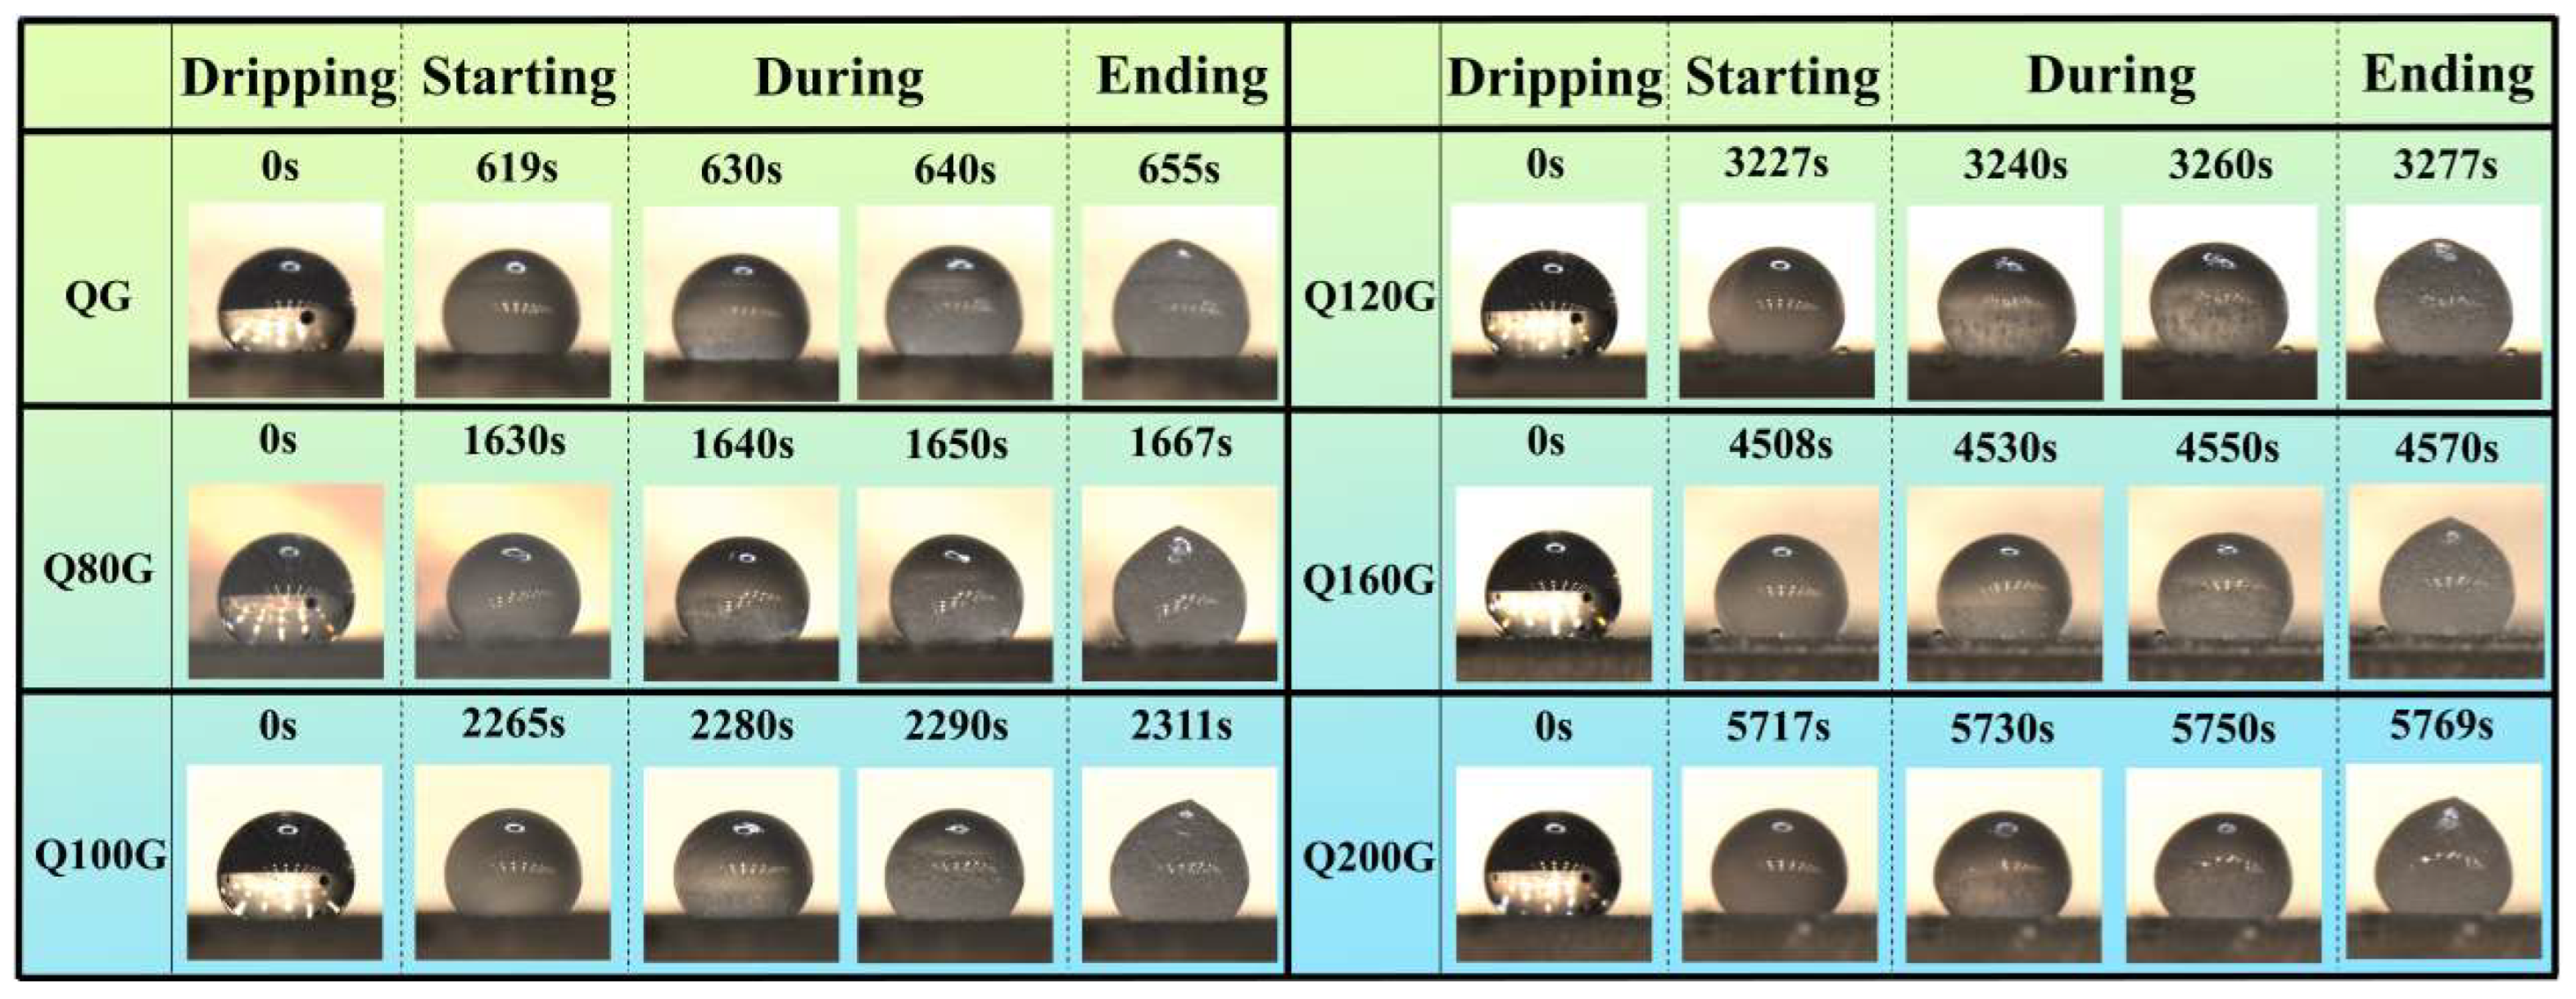
3.4. Anti-Icing Properties

Coatings with excellent anti-icing functions can significantly reduce the cost of maintaining equipment operating at low temperatures. Generally, the freezing delay time is a significant indicator to assess the anti-icing ability. Herein, we recorded and compared the freezing delay time of these coatings. Figure 4 shows the average freezing delay time of the untreated Al substrate, modified graphene planar superhydrophobic coating (QG), and a series of modified graphene micropillar array superhydrophobic coatings, respectively. On the surface of the untreated Al substrate, it was discovered that the water droplet’s average freezing delay time was only about 10 s. In contrast, the average freezing delay time of the QG coating was extended to about 668 s, which demonstrated that the modified graphene superhydrophobic coating has extraordinarily delayed freezing performance. Moreover, it was noteworthy that the modified graphene micropillar array superhydrophobic coatings further extended the average freezing delay time of the water droplets. In particular, the average freezing delay time of the Q200G coating can reach about 5360 s, which is approximately eight times that of the QG coatings. The above result illustrated that the delayed freezing performance of the modified graphene superhydrophobic coating could be further enhanced by combining it with the micropillar array structures.
Figure 3. (af) Macroscopic photos of 50 μL dyed water droplets on QG, Q80G, Q100G, Q120G, Q160G, and Q200G coatings, and the WCA and SA images of these superhydrophobic coatings.
Coatings 14 00247 g003
The reasons behind the delayed freezing of water droplets on these coatings can be rationally analyzed by the heat transfer rate (q). Generally, when q decreased, the freezing delay time increased. The q could be calculated using Formula (2):
q = KAΔT
where K, A, and ΔT denote the thermal conductivity of the coating surface, the heat transfer area, and the temperature difference between the water droplet and the coating surface, respectively. For the experiments conducted here, ΔT is held constant, and thus, q is proportional to the product of K and A. Among them, K reduced with the increase in air quantity trapped by the coating surface because of the extremely low thermal conductivity of the air. Likewise, A decreased as a result of the decrease in the actual contact area between the water droplet and the coating surface [35]. As shown in Figure 5a, the micro–nanostructure of QG coating could trap a certain quantity of air to produce a “static air cushion effect”, and decrease the actual area of contact between the coated surface and the water droplet, thus delaying the heat transfer to a certain extent. The QG coating is less successful than the modified graphene micropillar array superhydrophobic coatings at capturing air and creating a more robust “static air cushion effect”. This is because the water droplets cannot enter the microgrooves, as shown in Figure S1. This further reduces the actual contact area between the coated surface and the water droplet, slowing down the heat transfer [36]. In addition, the microgrooves also generated the “dynamic air cushion convection effect”. As depicted in Figure 5b, the air temperature inside the microgrooves was gradually greater than the ambient air temperature as the water droplet transferred heat. Subsequently, the warm air emerged from the microgrooves along the lower surface of the water droplet and convected with the cold air in the environment to form a turbulent film, which allowed the warm air to flow upward along the gas-liquid interface. Eventually, a warm air film formed on the water droplet surface, which acted as insulation and greatly prolonged the freezing time [37].
Notably, the average freezing delay time of the Q80G–Q200G coating showed an increasing trend. The variation mainly depended on Φg. With the increase in Φg, the area of actual contact between the droplet of water and the coating surface decreased, and the air cushion effect generated by the coating surface intensified. According to Table 1, it can be found that the Φg of the Q80G–Q200G coatings increased gradually, which indicated that K and A gradually decreased. Therefore, the freezing delay ability of the Q80G–Q200G coatings was enhanced gradually. The entire freezing action of water droplets on the various coating surfaces was captured by the high-speed CMOS camera. The freezing process can be well described as four stages, including pre-cooling, ice nucleation, ice nuclei growth, and complete freezing [38]. According to time points recorded in Figure 6, these modified graphene superhydrophobic coatings primarily prolonged the pre-cooling time of the water droplets. Furthermore, peach-shaped ice can be discovered after the water droplets have completely frozen. The formation of peach-shaped ice could be reasonably explained. First, the nucleation of ice occurred on the coating surface. Then, the water droplets began to freeze upward from the coating surface. Since the ice-water interface is always perpendicular to the surface of the water drop, the ice-water interface became concave when freezing progressed to the upper part of the water drop. Eventually, the ice tip forms [39].
Ice accumulation on the superhydrophobic coating surface was inevitable due to the long-term service in a frozen environment. Hence, the deicing shear force is considered another vital parameter for estimating the anti-icing performance. Here, the deicing shear forces for these coatings were measured, as depicted in Figure 7. The average deicing shear force obviously decreased with the reduction in micropillar width. Especially, ice was very weakly attached to the Q200G coating surface with an extremely low average deicing shear force of nearly 0.1 N, which was 1/10 of the QG coating. The visible reduction in the deicing shear force was ascribed to a smaller actual contact area between the ice and the coating surface due to the large Φg. More importantly, the rough surface could form more stress concentration points to decrease ice adhesion [40]. As displayed in Figure 8, the surface roughness of these coatings increased gradually as the micropillar width decreased, and the Q200G coating could reach 19.99 μm. Therefore, the micropillar array structure can greatly improve the deicing property of the modified graphene superhydrophobic coating.

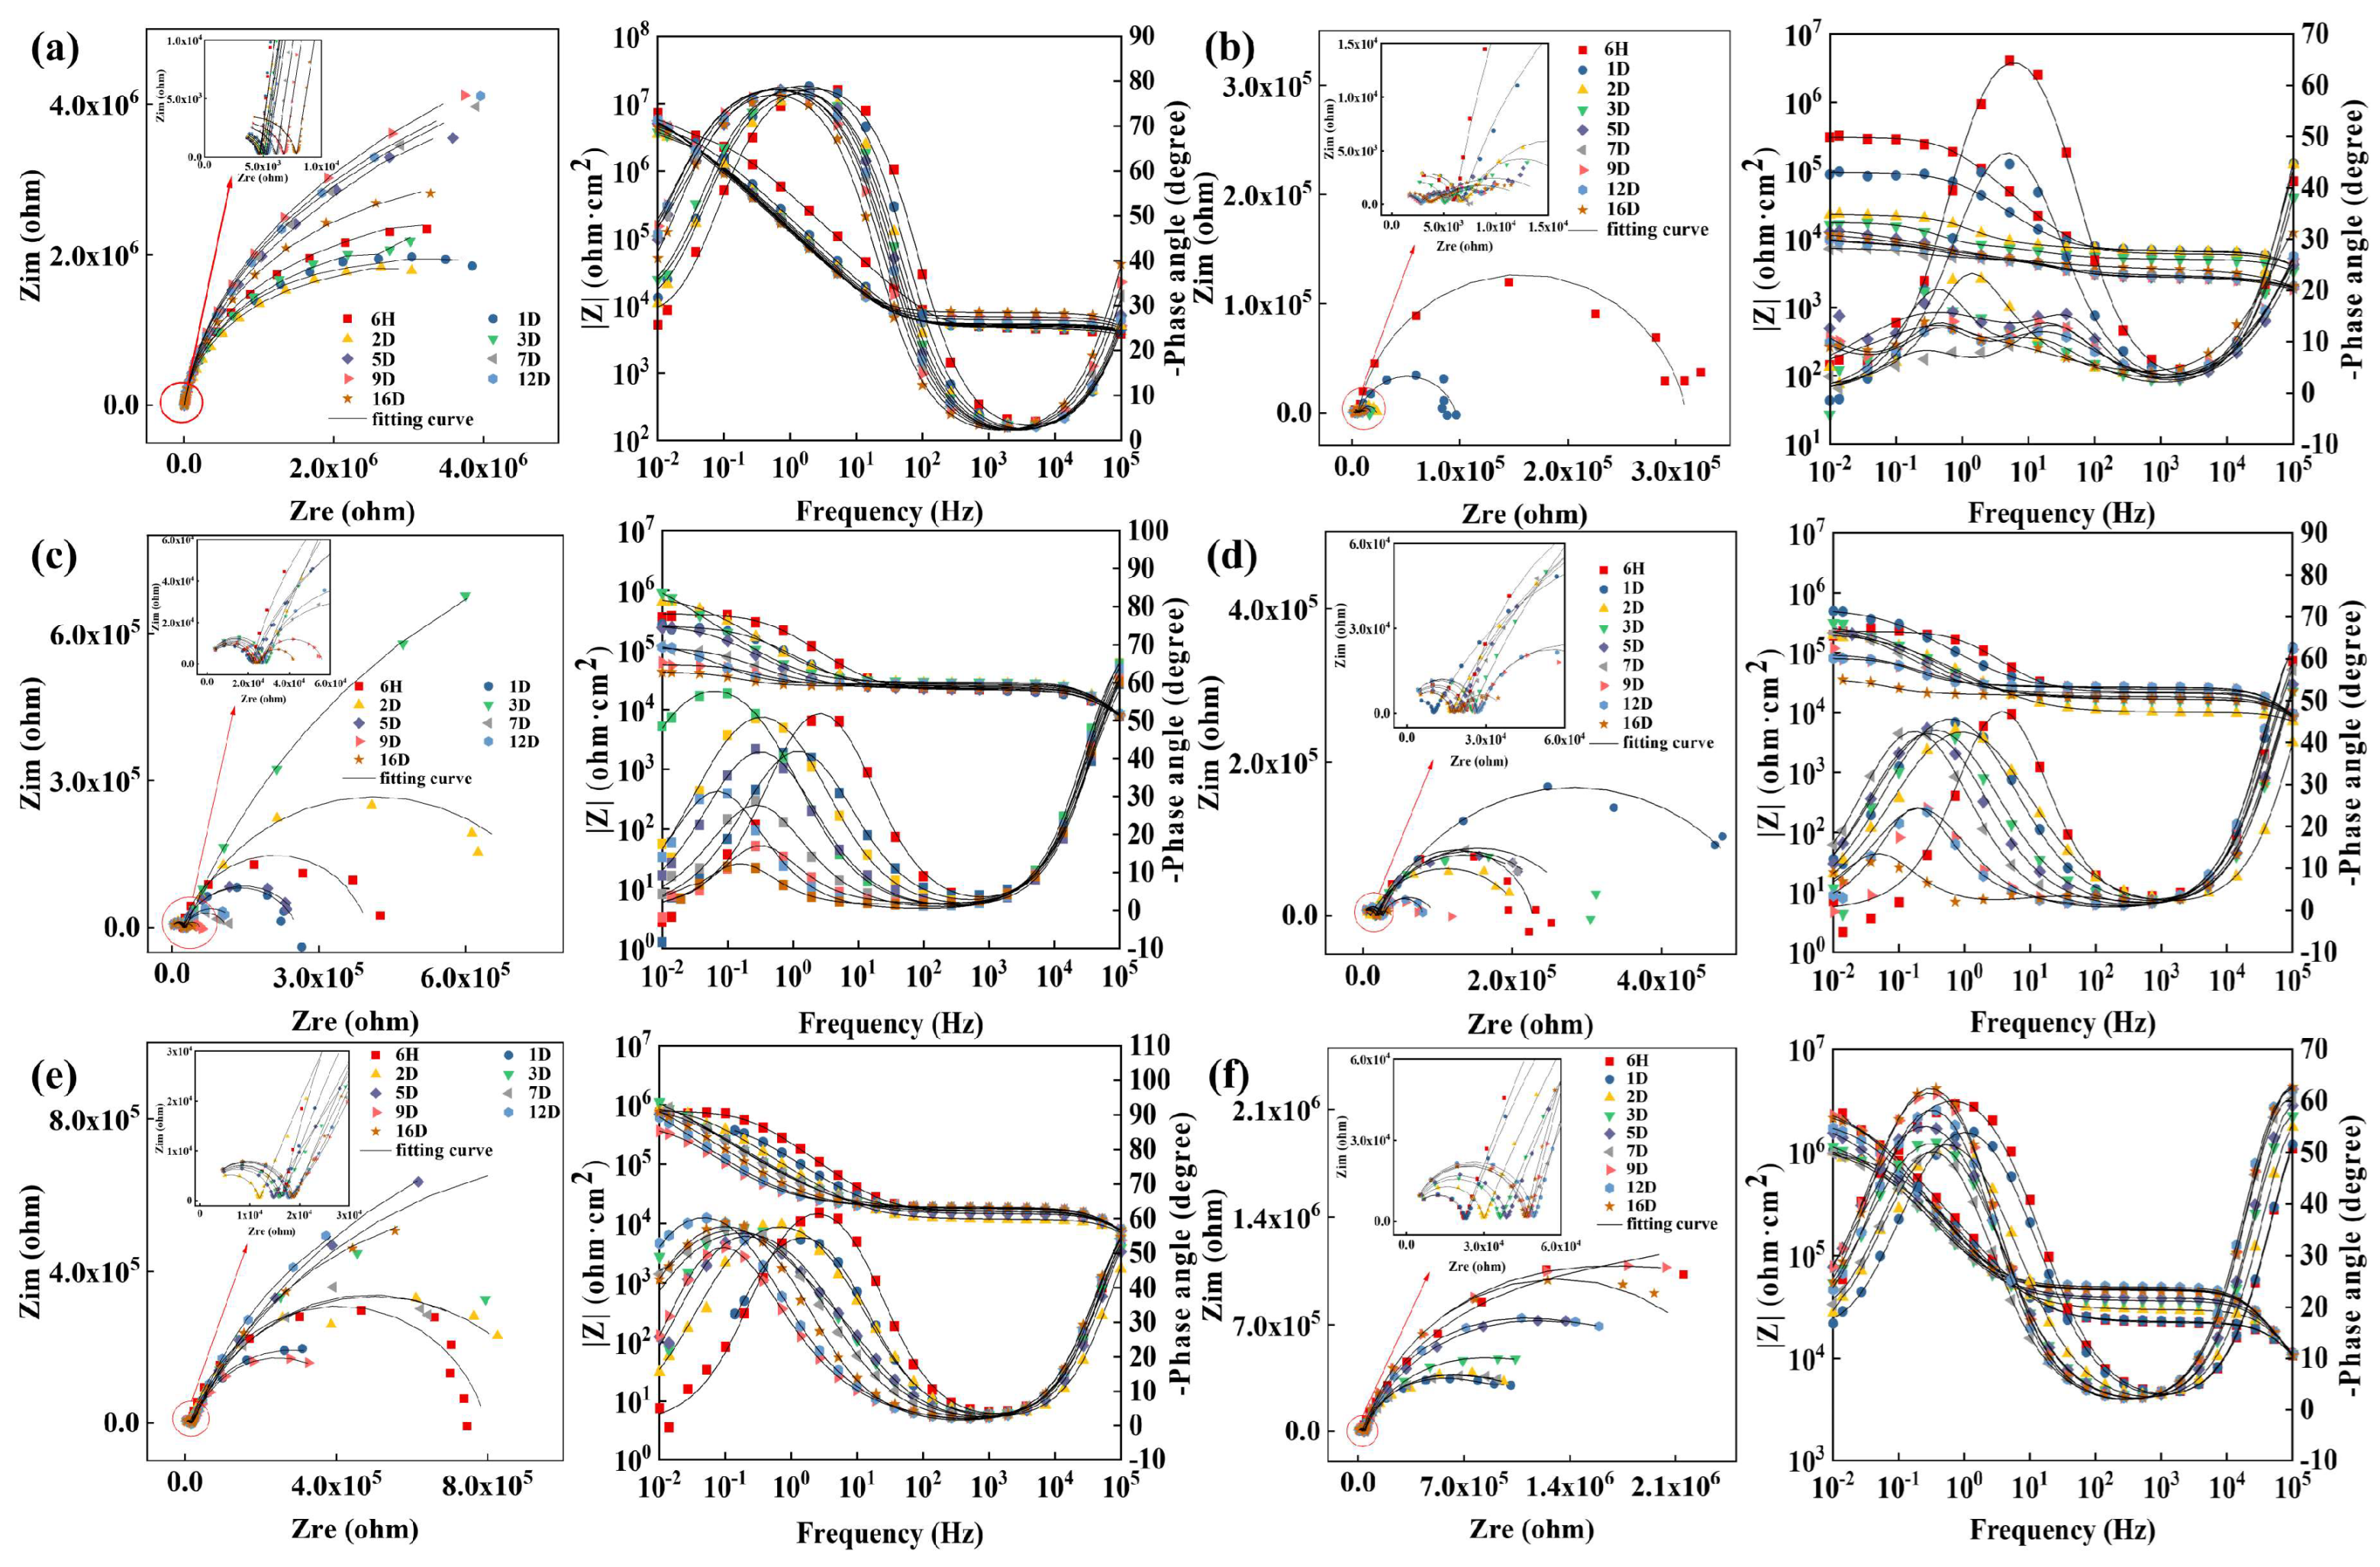
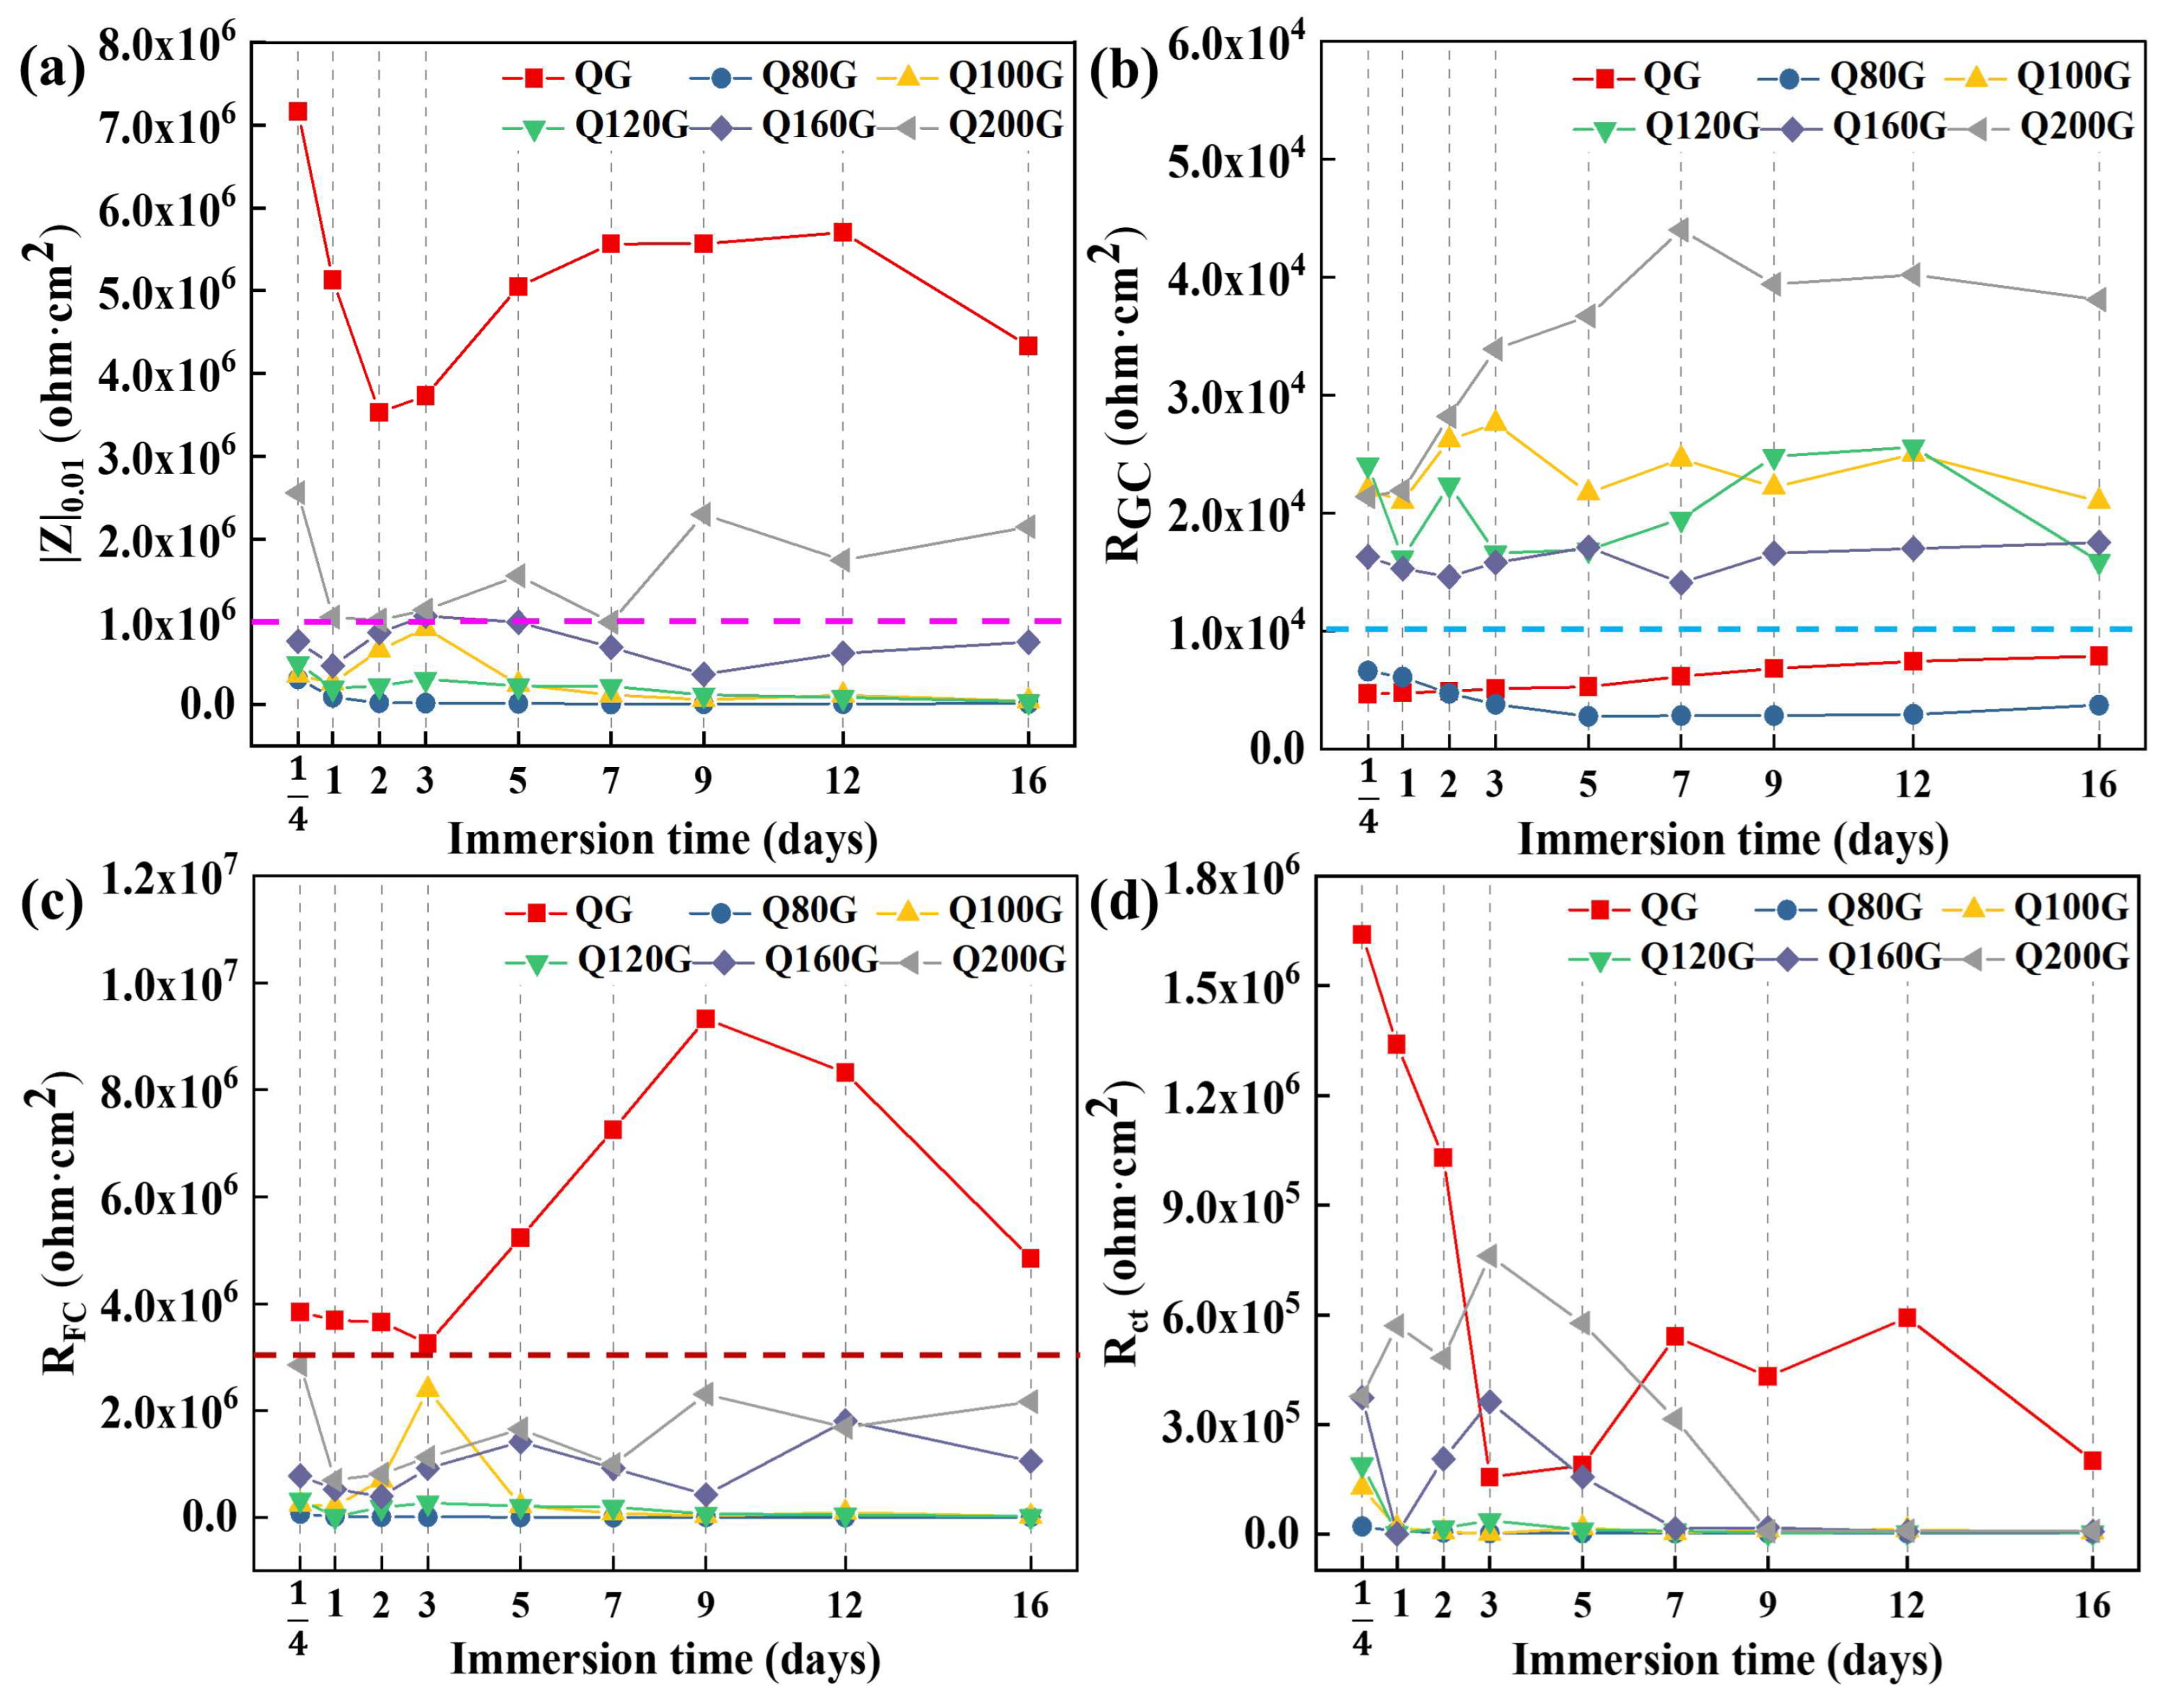
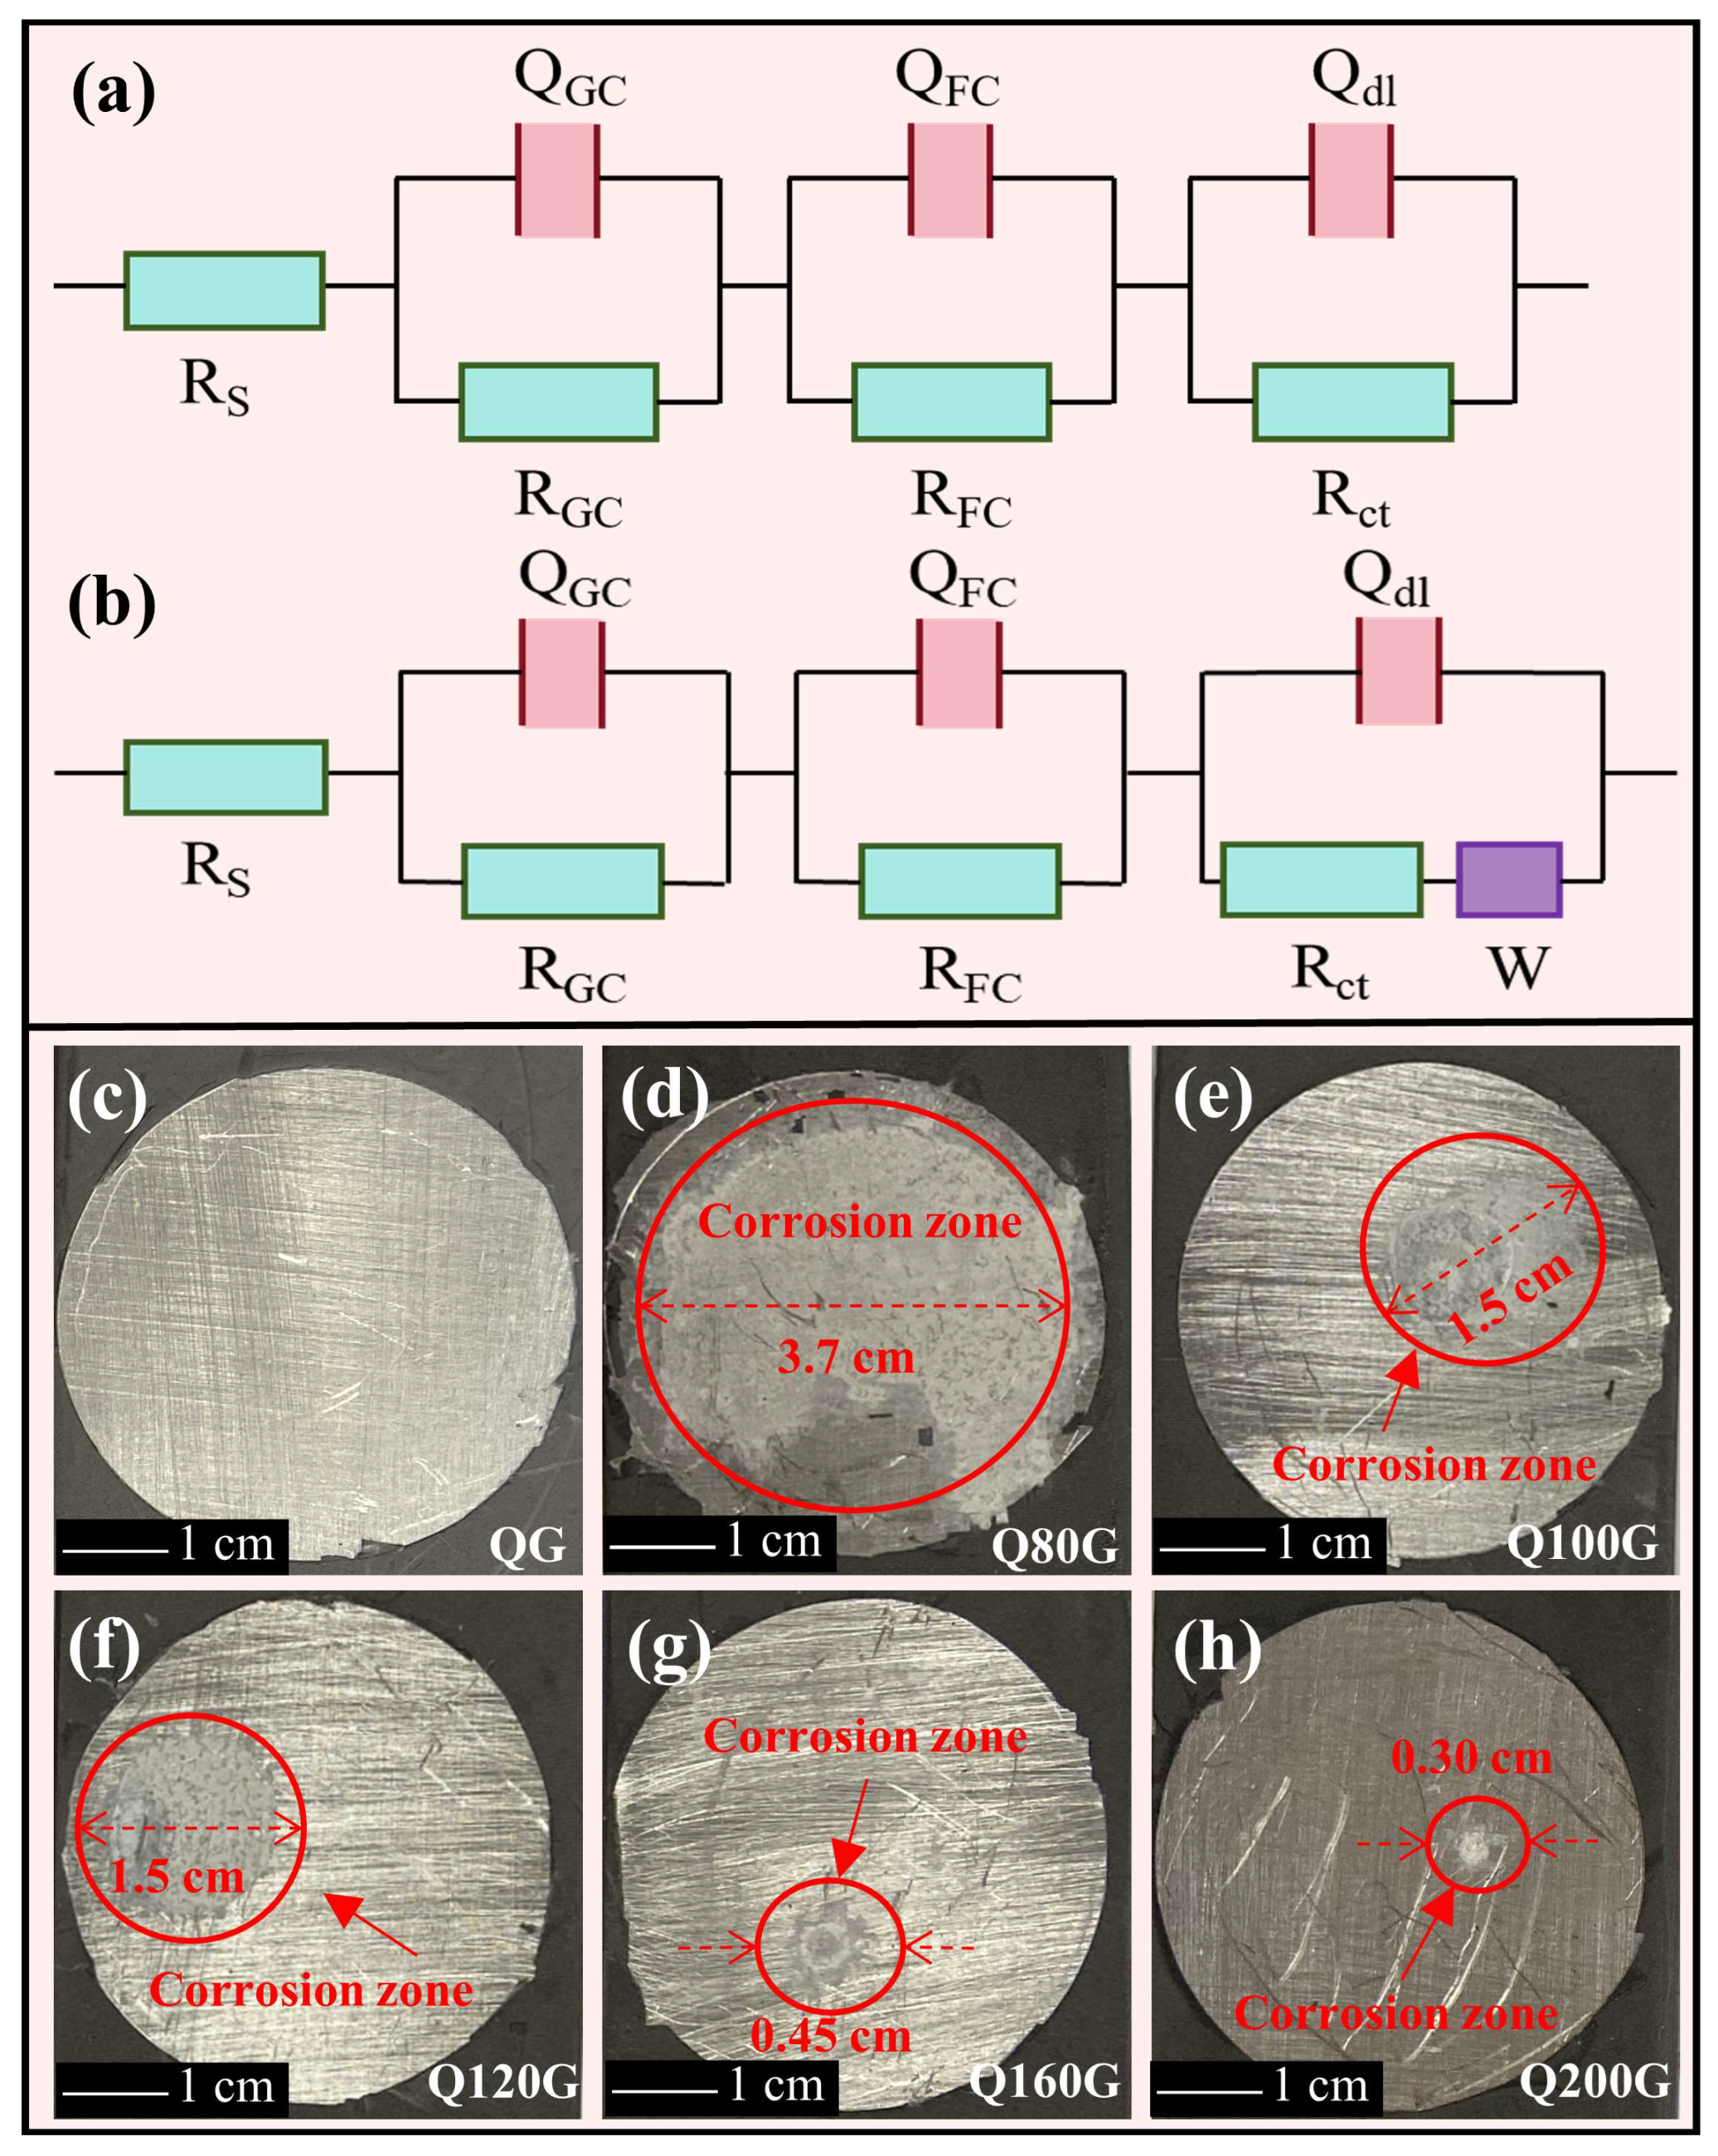
3.5. Corrosion Resistance

Electrochemical impedance spectra (EIS) were employed to explore the corrosion mechanism and effectively evaluate the barrier performance of these coatings. Figure 9 shows the Nyquist and Bode plots of these coatings. Among them, the Nyquist diagrams and Bode phase angle plots of these coatings all exhibited distinctly two-time constants after immersion for 6 h, indicating that the electrolyte permeated the interface between the coating and the substrate at the beginning of soaking. At the same time, the Bode phase angle curves of these coatings moved to the low-frequency area with the extension of soaking time, which was mainly correlated to the destruction of Al substrate oxide film and the formation of corrosion products. Furthermore, the impedance modulus value at 0.01 Hz (|Z|0.01) in the Bode impedance modulus plot is frequently employed to judge the corrosion resistance ability of the coating [41]. Figure 10a shows the |Z|0.01 value variation of these coatings in the soaking process. It was clear to see that the |Z|0.01 values of QG coating remained over 3 × 10⁶ Ω·cm2 and were higher than those of Q80G–Q200G coatings during the soaking process for 16 days, which suggested that QG coating had a good barrier performance. For the Q80G–Q200G coatings, it can be found that the |Z|0.01 values increased as the micropillar width decreased, indicating that a higher Φg results in stronger barrier performance. Notably, the |Z|0.01 values of the Q200G coating stayed above 1 × 10⁶ Ω·cm2 after the immersion for 16 days.
In order to examine the coating corrosion process further, equivalent circuits were employed to fit the EIS data. Two equivalent circuits, R(QR)(QR)(QR) and R(QR)(QR)(Q(RW)), containing three-time constants as shown in Figure 11a,b were selected for fitting the EIS of these coatings given that they belong to the double-layer system. The equivalent circuits consist of various components. RS stands for solution resistance; QGC and RGC represent the constant phase angle element and the resistance of the modified graphene superhydrophobic coating, respectively. QFC and RFC represent the constant phase angle element and the resistance of the fluorocarbon varnish coating, respectively. Qdl and Rct represent the double electric layer constant phase angle element and charge transfer resistance of the interface between the coating and the substrate, respectively. Lastly, W represents a finite diffusion impedance. Although the air layer of the superhydrophobic surface can postpone the penetration of electrolytes into the coating, it is usually not treated as a separate time constant [42].
Table 2 displays the QG coating fitting results. Initially, the equivalent circuit R(QR)(QR)(QR), as seen in Figure 11a, was chosen to fit the EIS data for the first two days of the immersion. The fitting results showed that the Rct remained above 106 Ω·cm2, implying that although the electrolyte had penetrated locally into the coating-substrate interface through the tiny pores of the fluorocarbon varnish coating, the oxidation film of the Al substrate was playing a protective role. On the third day of immersion, the equivalent circuit R(QR)(QR)(Q(RW)) as seen in Figure 11b was chosen to fit the EIS data. At this time, Rct was reduced by an order of magnitude, indicating that a corrosion reaction occurred on the Al substrate. Meanwhile, a diffusion process was initiated by the accumulation of corrosion products on the Al substrate. From 5 to 16 days, the equivalent circuit R(QR)(QR)(QR) was chosen to describe the diffusion process. Among them, the RFC gradually increased during the soaking time from 5 to 9 days, which is ascribed to the corrosion products that clog the tiny pores in the fluorocarbon varnish coating and impede the penetration of the electrolyte. Subsequently, the RFC decreased during a soaking time of 12 to 16 days, indicating that the electrolyte penetrated further into the fluorocarbon varnish coating. In addition, the Rct remained above 105 Ω·cm2 during the soaking time from 5 to 16 days, suggesting that the good adhesion of the coating to the Al substrate effectively inhibited the further development of the corrosion reaction so that the corrosion reaction occurred only in tiny areas. As shown in Figure 11c, the Al substrate under the QG coating still had a metallic luster without obvious corrosion after soaking for 16 days.
Similar equivalent circuits R(QR)(QR)(QR) and R(QR)(QR)(Q(RW)) were used to fit the EIS of Q80G–Q200G coatings at different immersion times. The results of fitting the EIS data of Q80G–Q200G coatings are presented in Tables S4–S8. For the Q80G coating, RFC gradually decreased from above 104 Ω·cm2 to above 103 Ω·cm2 during the immersion for the first two days, which indicated that more defects and pores existed in the fluorocarbon varnish coating so that the electrolyte could easily penetrate into it. Furthermore, Rct only remained an order of 103 Ω·cm2 during the soaking time from 3 to 16 days, illustrating that the Al substrate had suffered serious corrosion. As shown in Figure 11d, the Al substrate under the Q80G coating presented a large corrosion zone area after soaking for 16 days. For the Q100G and Q120G coatings, their RFC all showed a trend of first decreasing and then increasing during the immersion for the first three days, which is ascribed to the corrosion products filling the tiny pores in the fluorocarbon varnish coatings. Afterwards, the corrosion products expanded due to water absorption, which separated the coating from the Al substrate, and further increased the area of the corrosion zone. Therefore, during the soaking time of 5 to 16 days, their RFC and Rct all decreased to no more than 2 × 10⁴ Ω·cm2 and 6 × 10³ Ω·cm2, respectively. As shown in Figure 11e,f, corrosion zones of approximately 1.5 mm in diameter were presented on the Al substrates under the Q100G and Q120G coatings after soaking for 16 days, respectively. For the Q160G and Q200G coatings, their variations during the immersion for the whole immersion process were consistent with those of Q100G and Q120G coatings. Diversely, their RFC remained all above 1 × 10⁶ Ω·cm2 after the soaking for 16 days, which implied that the fluorocarbon varnish coatings have good compactness and adhesion to continue resisting the penetration of electrolyte and corrosion area expansion. As shown in Figure 11g,h, after soaking for 16 days, corrosion zones of less than 0.5 mm in diameter occurred on the Al substrates below the Q160G and Q200G coatings, respectively.
The resistance value variation of each layer for these coatings during the soaking process was described in Figure 10b–d to further investigate their anti-corrosion mechanism. From Figure 10b, the RGC values of Q100G–Q200G coatings reached above 1 × 10⁴ Ω·cm2, which were an order of magnitude higher than those of QG and Q80G coatings. Especially, Figure 12 shows that Q160G and Q200G coatings still exhibited a “silver mirror effect” in the microgrooves after 16 days of immersion. This is due to the fact that a smaller micropillar top area reduced the defects of the modified graphene superhydrophobic coating, which improved the barrier property of the superhydrophobic coating. Furthermore, the larger Φg was, the more air was trapped by the coating surface, thus increasing the escape time of air. From Figure 10c, the RFC values of Q80G–Q200G coatings remained below 3 × 10⁶ Ω·cm2, which were significantly lower than those of QG coating. The preparation of the micropillar array structure leads to more holes and defects in the fluorocarbon varnish coating. Comparing Figure 10a with Figure 10c, it can be found that the variation trend of |Z|0.01 was basically the same as that of RFC, which indicated that the corrosion resistance of these coatings mainly depended on the compactness of the fluorocarbon varnish coating.
Table 3 compares the results of the freezing delay time and impedance value of the Q200G coating in this study with those of experiments conducted in similar works in recent years. Evidently, the freezing delay time and impedance value of the Q200G coating are better than some works. Meanwhile, the impedance value of Q200G was increased by four orders of magnitude compared to the untreated Al substrate, indicating that Q200G has a good protection effect on the Al substrate.

4. Conclusions

In summary, micropillar array structures have been prepared on the surface of the fluorocarbon varnish coating by a simple physical embossing method. Then, the AC-FASmodified graphene superhydrophobic slurry was sprayed on the surface of fluorocarbon varnish coatings with a micropillar array structure to get a series of modified graphene micropillar array superhydrophobic coatings. All these coatings exhibited good water repellency (WCA > 150° and SA < 10°). The anti-icing performance test results show that the freezing delay time increased and the deicing shear force decreased gradually with the decrease in the micropillar width. Among them, the freezing delay time of the Q200G coating could reach above 5000 s under −10 °C and 60% relative humidity conditions, and its deicing shear force was as low as 0.1 N. The EIS test results suggested that the larger microgroove density could prolong the escape time of the air trapped by the coating surface under water pressure, which effectively enhanced the barrier performance of the coating. Especially, the impedance value of the Q200G coating was still above 1 × 10⁶ Ω·cm2 after immersion for 16 days. If the barrier properties of fluorocarbon varnish coatings with micropillar arrays can be improved, then the impedance values of the modified graphene micropillar array superhydrophobic coatings will be greatly increased.

Supplementary Materials

The following supporting information can be downloaded at: https://www.mdpi.com/article/10.3390/coatings14030247/s1, Table S1. The parameters of the commercial PET nets; Table S2. The component A of varnish coating; Table S3. The element content of GP and AC-FAS-GP; Table S4. The electrochemical parameters of the Q80G coating obtained through the equivalent circuit fitting; Table S5. The electro-chemical parameters of the Q100G coating obtained through the equivalent circuit fitting; Table S6. The electrochemical parameters of the Q120G coating obtained through the equivalent circuit fitting; Table S7. The electrochemical parameters of the Q160G coating obtained through the equivalent circuit fitting; Table S8. The electrochemical parameters of the Q200G coating obtained through the equivalent circuit fitting; Figure S1. Silver mirror effect of Q80G, Q100G, Q120G, Q160G, and Q200G coatings at room temperature and at conditions of −10 °C and 60% relative humidity, re-spectively; Video S1 The longest freezing delay time of a 10 μL water droplet on the QG surface was about 615 s, https://v.afbcs.cn/c4RqR9; Video S2 The longest freezing delay time of a 10 μL water droplet on the Q80G surface was about 1620 s, https://v.afbcs.cn/UCKUQg; Video S3 The longest freezing delay time of a 10 μL water droplet on the Q100G surface was about 2260 s, https://v.afbcs.cn/ithQYn; Video S4 The longest freezing delay time of a 10 μL water droplet on the Q120G surface was about 3275 s, https://v.afbcs.cn/ALNpAX; Video S5 The long-est freezing delay time of a 10 μL water droplet on the Q160G surface was about 4345 s, https://v.afbcs.cn/WcRwCr; Video S6 The longest freezing delay time of a 10 μL water droplet on the Q200G surface was about 5715 s, https://v.afbcs.cn/fsFJag all accessed on 17 January 2024.

Author Contributions

W.Z.: conceptualization, data curation, formal analysis, writing—original draft, writing—review and editing. Y.L.: writing—review. T.C.: writing—review. I.K.N.: writing—review. S.A.: writing—review. E.-H.H.: writing—review. F.L.: conceptualization, supervision, funding acquisition. All authors have read and agreed to the published version of the manuscript.

Funding

This research was funded by the LingChuang Research Project of the China National Nuclear Corporation (E041F212Z1).

Institutional Review Board Statement

Not applicable.

Informed Consent Statement

Not applicable.

Data Availability Statement

Data are contained within the article and Supplementary materials.

Conflicts of Interest

The authors declare that they have no know competing financial interests or personal relationships that could have appeared to influence the work reported in this paper.

References

  1. Shen, Y.; Wu, X.; Tao, J.; Zhu, C.; Lai, Y.; Chen, Z. Icephobic materials: Fundamentals, performance evaluation, and applications. Prog. Mater. Sci. 2019, 103, 509–557. [Google Scholar] [CrossRef]
  2. Quaia, S.; Marchesin, A.; Rampazzo, D.; Mancuso, C. Anti-icing measures in the Italian power system. IET Gener. Transm. Distrib. 2019, 13, 5577–5585. [Google Scholar] [CrossRef]
  3. Zeng, D.; Li, Y.; Liu, H.; Yang, Y.; Peng, L.; Zhu, C.; Zhao, N. Superhydrophobic coating induced anti-icing and deicing characteristics of an airfoil. Colloids Surfaces A Physicochem. Eng. Asp. 2023, 660, 130824. [Google Scholar] [CrossRef]
  4. Zhou, L.; Liu, R.; Yi, X. Research and development of anti-icing/deicing techniques for vessels: Review. Ocean Eng. 2022, 260, 112008. [Google Scholar] [CrossRef]
  5. Li, N.; Jiang, J.; Yang, M.; Wang, H.; Ma, Y.; Li, Z.; Tang, G. Anti-icing mechanism of combined active ethanol spraying and passive surface wettability. Appl. Therm. Eng. 2023, 220, 119805. [Google Scholar] [CrossRef]
  6. Zhao, W.; Xiao, L.; He, X.; Cui, Z.; Fang, J.; Zhang, C.; Li, X.; Li, G.; Zhong, L.; Zhang, Y. Moth-eye-inspired texturing surfaces enabled self-cleaning aluminum to achieve photothermal anti-icing. Opt. Laser Technol. 2021, 141, 107115. [Google Scholar] [CrossRef]
  7. Zhang, K.; Li, J.; Wang, Y.; Lin, C.; Zhao, J.; Liu, Y.; Chen, S. Anti-icing of solid surfaces based on droplet dynamics. Mod. Phys. Lett. B 2023, 37, 2330002. [Google Scholar] [CrossRef]
  8. Xie, Z.; Wang, H.; Geng, Y.; Li, M.; Deng, Q.; Tian, Y.; Chen, R.; Zhu, X.; Liao, Q. Carbon-based photothermal superhydrophobic materials with hierarchical structure enhances the anti-icing and photothermal deicing properties. ACS Appl. Mater. Interfaces 2021, 13, 48308–48321. [Google Scholar] [CrossRef]
  9. Pan, R.; Zhang, H.; Zhong, M. Triple-scale superhydrophobic surface with excellent anti-icing and icephobic performance via ultrafast laser hybrid fabrication. ACS Appl. Mater. Interfaces 2021, 13, 1743–1753. [Google Scholar] [CrossRef]
  10. He, Y.; Wang, L.; Wu, T.; Wu, Z.; Chen, Y.; Yin, K. Facile fabrication of hierarchical textures for substrate-independent and durable superhydrophobic surfaces. Nanoscale 2022, 14, 9392–9400. [Google Scholar] [CrossRef]
  11. Zeng, Q.; Zhou, H.; Huang, J.; Guo, Z. Review on the recent development of durable superhydrophobic materials for practical applications. Nanoscale 2021, 13, 11734–11764. [Google Scholar] [CrossRef] [PubMed]
  12. Chen, H.; Wang, F.; Fan, H.; Hong, R.; Li, W. Construction of MOF-based superhydrophobic composite coating with excellent abrasion resistance and durability for self-cleaning, corrosion resistance, anti-icing, and loading-increasing research. Chem. Eng. J. 2021, 408, 127343. [Google Scholar] [CrossRef]
  13. Li, X.; Yan, J.; Yu, T.; Zhang, B. Versatile nonfluorinated superhydrophobic coating with self-cleaning, anti-fouling, anti-corrosion and mechanical stability. Colloids Surfaces A Physicochem. Eng. Asp. 2022, 642, 128701. [Google Scholar] [CrossRef]
  14. Lou, C.; Zhang, R.; Lu, X.; Zhou, C.; Xin, Z. Facile fabrication of epoxy/polybenzoxazine based superhydrophobic coating with enhanced corrosion resistance and high thermal stability. Colloids Surfaces A Physicochem. Eng. Asp. 2019, 562, 8–15. [Google Scholar] [CrossRef]
  15. Han, X.; Ren, L.; Ma, Y.; Gong, X.; Wang, H. A mussel-inspired self-repairing superhydrophobic coating with good anti-corrosion and photothermal properties. Carbon 2022, 197, 27–39. [Google Scholar] [CrossRef]
  16. Ye, Z.; Li, S.; Zhao, S.; Deng, L.; Zhang, J.; Dong, A. Textile coatings configured by double-nanoparticles to optimally couple superhydrophobic and antibacterial properties. Chem. Eng. J. 2021, 420, 127680. [Google Scholar] [CrossRef]
  17. Yu, H.; Wu, M.; Duan, G.; Gong, X. One-step fabrication of eco-friendly superhydrophobic fabrics for high-efficiency oil/water separation and oil spill cleanup. Nanoscale 2022, 14, 1296–1309. [Google Scholar] [CrossRef]
  18. Nyholm, N.; Espallargas, N. Functionalized carbon nanostructures as lubricant additives—A review. Carbon 2023, 201, 1200–1228. [Google Scholar] [CrossRef]
  19. Chu, Z.; Jiao, W.; Huang, Y.; Yan, M.; Zheng, Y.; Wang, R.; He, X. Smart superhydrophobic films with self-sensing and anti-icing properties based on silica nanoparticles and graphene. Adv. Mater. Interfaces 2020, 7, 2000492. [Google Scholar] [CrossRef]
  20. Bai, Z.-G.; Zhang, B. Fabrication of a mechanically-stable anti-icing graphene oxide-diatomaceous earth/epoxy coating. Mater. Res. Express 2019, 6, 085090. [Google Scholar] [CrossRef]
  21. Zheng, Z.; Liao, C.; Xia, Y.; Chai, W.; Xie, C.; Zhang, W.; Liu, Y. Facile fabrication of robust, biomimetic and superhydrophobic polymer/graphene-based coatings with self-cleaning, oil-water separation, anti-icing and corrosion resistance properties. Colloids Surfaces A Physicochem. Eng. Asp. 2021, 627, 127164. [Google Scholar] [CrossRef]
  22. Uzoma, P.C.; Liu, F.; Xu, L.; Zhang, Z.; Han, E.-H.; Ke, W.; Arukalam, I. Superhydrophobicity, conductivity and anticorrosion of robust siloxane-acrylic coatings modified with graphene nanosheets. Prog. Org. Coatings 2019, 127, 239–251. [Google Scholar] [CrossRef]
  23. Du, X.Q.; Liu, Y.W.; Chen, Y. Enhancing the corrosion resistance of aluminum by superhydrophobic silane/graphene oxide coating. Appl. Phys. A 2021, 127, 580. [Google Scholar] [CrossRef]
  24. Wu, X.H.; Liew, Y.K.; Lim, W.M.; Mai, C.; Then, Y.Y. Blood compatible and noncytotoxic superhydrophobic graphene/titanium dioxide coating with antibacterial and antibiofilm properties. J. Appl. Polym. Sci. 2023, 140, e53629. [Google Scholar] [CrossRef]
  25. Li, C.; Chen, H.; Fan, Y.; Fu, K.; Liu, C.; Ren, X.; Yang, H.; Lin, S. Functionalized graphene modified styrene-divinylbenzene copolymer as a superhydrophobic catalyst carrier for hydrogen-water liquid phase catalytic exchange. Int. J. Hydrogen Energy 2023, 48, 3520–3533. [Google Scholar] [CrossRef]
  26. Li, Z.-T.; Wu, H.-T.; Chen, W.-Y.; He, F.-A.; Li, D.-H. Preparation of magnetic superhydrophobic melamine sponges for effective oil-water separation. Sep. Purif. Technol. 2019, 212, 40–50. [Google Scholar] [CrossRef]
  27. Choi, Y.S.; Lee, J.S.; Jin, S.B.; Han, J.G. Super-hydrophobic coatings with nano-size roughness prepared with simple PECVD method. J. Phys. D Appl. Phys. 2013, 46, 315501. [Google Scholar] [CrossRef]
  28. Hu, L.; Deng, J.; Xie, Y.; Qian, F.; Dong, Y.; Xu, C. In situ growth of graphene on polyimide for high-responsivity flexible PbS–graphene photodetectors. Nanomaterials 2023, 13, 1339. [Google Scholar] [CrossRef]
  29. Teng, T.-P.; Chang, S.-C.; Chen, Z.-Y.; Huang, C.-K.; Tseng, S.-F.; Yang, C.-R. High-yield production of graphene flakes using a novel electrochemical/mechanical hybrid exfoliation. Int. J. Adv. Manuf. Technol. 2019, 104, 2751–2760. [Google Scholar] [CrossRef]
  30. Nguyen, V.T.; Le, H.D.; Ngo, T.T.T.; Le, D.Q.; Nguyen, X.N.; Phan, N.M. Synthesis of multi-layer graphene films on copper tape by atmospheric pressure chemical vapor deposition method. Adv. Nat. Sci. Nanosci. Nanotechnol. 2013, 4, 035012. [Google Scholar] [CrossRef]
  31. Yan, Q.; Zhou, S.; Ma, L.; Wan, S.; Zhu, X. Approach to excellent superhydrophobicity and corrosion resistance of carbon-based films by graphene and cobalt synergism. Surf. Interface Anal. 2018, 51, 152–163. [Google Scholar] [CrossRef]
  32. Li, R.; Chen, C.; Li, J.; Xu, L.; Xiao, G.; Yan, D. A facile approach to superhydrophobic and superoleophilic graphene/polymer aerogels. J. Mater. Chem. A 2014, 2, 3057. [Google Scholar] [CrossRef]
  33. Vanithakumari, S.; Jena, G.; Sofia, S.; Thinaharan, C.; George, R.; Philip, J. Fabrication of superhydrophobic titanium surfaces with superior antibacterial properties using graphene oxide and silanized silica nanoparticles. Surf. Coatings Technol. 2020, 400, 126074. [Google Scholar] [CrossRef]
  34. Li, D.; Lu, Y.; Zhang, C. Superhydrophobic and electrochemical performance of CF2-modified g-C3N4/graphene composite film deposited by PECVD. Nanomaterials 2022, 12, 4387. [Google Scholar] [CrossRef]
  35. Wilczewski, S.; Skórczewska, K.; Tomaszewska, J.; Osial, M.; Dąbrowska, A.; Nikiforow, K.; Jenczyk, P.; Grzywacz, H. Graphene modification by curcuminoids as an effective method to improve the dispersion and stability of PVC/graphene nanocomposites. Molecules 2023, 28, 3383. [Google Scholar] [CrossRef]
  36. Guo, C.; Liu, K.; Zhang, T.; Sun, P.; Liang, L. Development of flexible photothermal superhydrophobic microarray by photolithography technology for anti-icing and deicing. Prog. Org. Coat. 2023, 182, 107675. [Google Scholar] [CrossRef]
  37. Xiao, X.; Wei, X.; Wei, J.; Wang, J. Multifunctional Fe3O4-based photothermal superhydrophobic composite coating for efficient anti-icing/deicing. Sol. Energy Mater. Sol. Cells 2023, 256, 112313. [Google Scholar] [CrossRef]
  38. Oberli, L.; Caruso, D.; Hall, C.; Fabretto, M.; Murphy, P.I.; Evans, D. Condensation and freezing of droplets on superhydrophobic surfaces. Adv. Colloid Interf. Sci. 2014, 210, 47–57. [Google Scholar] [CrossRef] [PubMed]
  39. Li, Q.; Guo, Z. Fundamentals of icing and common strategies for designing biomimetic anti-icing surfaces. J. Mater. Chem. A 2018, 6, 13549–13581. [Google Scholar] [CrossRef]
  40. Wu, Y.; Shu, X.; Yang, Y.; She, W.; Dong, L.; Ran, Q. Fabrication of robust and room-temperature curable superhydrophobic composite coatings with breathable and anti-icing performance. Chem. Eng. J. 2023, 463, 142444. [Google Scholar] [CrossRef]
  41. Yin, X.; Mu, P.; Wang, Q.; Li, J. Superhydrophobic ZIF-8-based dual-layer coating for enhanced corrosion protection of Mg alloy. ACS Appl. Mater. Interfaces 2020, 12, 35453–35463. [Google Scholar] [CrossRef] [PubMed]
  42. Shen, X.; Mao, T.; Li, C.; Mao, F.; Xue, Z.; Xu, G.; Amirfazli, A. Durable superhydrophobic coatings based on CNTs-SiO2gel hybrids for anti-corrosion and thermal insulation. Prog. Org. Coat. 2023, 181, 107602. [Google Scholar] [CrossRef]
  43. Pei, Y.; Xing, Q.; Chen, A.; Xu, J.; Zhang, Y.; Huang, H.; Lei, C. Enhanced solar photothermal anti-/de-icing performance of microstructured polypropylene/graphene composite surfaces with diameter- and density-optimized nanopillars. Chem. Eng. Sci. 2023, 282, 119330. [Google Scholar] [CrossRef]
  44. Chen, Y.; Liu, Y.; Xie, Y.; Zhang, H.; Du, X.; Zhang, Z. Preparation of hydrophobic silane/graphene oxide composite coating implanted with benzotriazole to improve the anti-corrosion performance of copper. J. Alloys Compd. 2022, 893, 162305. [Google Scholar] [CrossRef]
Scheme 1. The surface modification mechanism of graphene nanosheets.
Coatings 14 00247 sch001
Scheme 2. The preparation process diagram of modified graphene micropillar array superhydrophobic coatings.
Coatings 14 00247 sch002
Figure 1. (a) FTIR spectra of AC-FAS, GP, and the AC-FAS-GP; (b,c) Raman spectra and XPS wide-scan spectra of the GP and the AC-FAS-GP; (d,e) XPS high-energy resolution spectra about C1s of the GP and AC-FAS-GP; (f) the surface energy spectrum and TEM image of the AC-FAS-GP.
Coatings 14 00247 g001
Figure 2. The surface and cross-section morphologies of QG, Q80G, Q100G, Q120G, Q160G, and Q200G coatings.
Coatings 14 00247 g002aCoatings 14 00247 g002b
Figure 4. The average freezing delay time of QG, Q80G, Q100G, Q120G, Q160G, and Q200G coatings on the untreated aluminium alloy substrates.
Coatings 14 00247 g004
Figure 5. The freezing delay mechanism of (a) QG coating and (b) Q80G, Q100G, Q120G, Q160G, and Q200G coatings.
Coatings 14 00247 g005
Figure 6. Freezing action of water droplets on QG, Q80G, Q100G, Q120G, Q160G, and Q200G coatings.
Coatings 14 00247 g006
Figure 7. The average de-icing shear force of QG, Q80G, Q100G, Q120G, Q160G, and Q200G coatings.
Coatings 14 00247 g007
Figure 8. The surface roughness of QG, Q80G, Q100G, Q120G, Q160G, and Q200G coatings.
Coatings 14 00247 g008
Figure 9. Nyquist and Bode diagrams of coatings for varying immersion periods in 3.5 wt% NaCl solution: (a) QG, (b) Q80G, (c) Q100G, (d) Q120G, (e) Q160G, and (f) Q200G.
Coatings 14 00247 g009
Figure 10. The change of low-frequency impedance modulus (a), the change of the modified graphene superhydrophobic layer resistance (b), the change of fluorocarbon varnish layer resistance (c), and the change of charge transfer resistance (d) for QG, Q80G, Q100G, Q120G, Q160G, and Q200G coatings for varying immersion periods in 3.5 wt% NaCl solution.
Coatings 14 00247 g010
Figure 11. The equivalent circuits (a) R(QR)(QR)(QR) and (b) R(QR)(QR)(Q(RW)). (ch) Macroscopic images of substrate corrosion below coatings in the soaking area.
Coatings 14 00247 g011
Figure 12. The surface variations of QG, Q80G, Q100G, Q120G, Q160G, and Q200G coatings in 3.5 wt% NaCl solution for different immersion times.
Coatings 14 00247 g012
Table 1. The calculation values of the Φg about Q80G, Q100G, Q120G, Q160G, and Q200G coatings.
Q80GQ100GQ120GQ160GQ200G
wg (μm)5050505050
wp (μm)26619816511272
Φg (%)2.474.065.419.5316.80
Table 2. The electrochemical parameters of the QG coating obtained through the equivalent circuit fitting.
Time
(Days)
Rs
(Ω·cm2)
QGC
(10−10S·sα/cm2)
nGCRGC
(Ω·cm2)
QFC
(10−6S·sα/cm2)
nFCRFC
(MΩ·cm2)
Qdl
(10−6S·sα/cm2)
ndlRct
(MΩ·cm2)
W
(10−6S·sα/cm2)
CGC
(10−11F·cm2)
CFC
(10−7F·cm2)
Cdl
(10−7F·cm2)
0.250.040128.070.88346762.230.9243.850.980.9181.64——3.35.92.1
10.017196.330.89947482.600.9233.691.360.9251.34——3.76.33.2
20.010026.410.90248972.770.9243.661.930.9101.03——3.96.63.3
30.011967.040.89351061.480.9543.264.880.8780.162.13.36.24.8
50.032057.040.89452801.600.9505.245.360.8780.19——3.86.66.2
70.044756.750.90061602.170.9317.263.380.9050.54——4.66.66.5
90.028496.360.90668311.890.9399.335.040.8910.43——4.96.47.3
120.010005.920.90274442.200.9548.323.860.8910.59——3.69.34.8
160.057255.810.91478811.890.9504.856.370.8440.20——6.08.14.1
Table 3. The comparison of the freezing delay time and impedance value of the Q200G coating with those of experiments conducted in similar works.
CoatingsFreezing Delay Time (s)Impedance Value (Ω·cm2)Research
Untreated Al substrate106.2 × 102This work
MSODNS214/Pei [43]
MN-FSGF498/Chu [19]
GO-DE/EP2760/Bai [20]
G-645953.0 × 105Zheng [21]
G25/1.1 × 104Paul [22]
silane/GO/2.6 × 104Du [23]
BTAH-silane/GO/5.7 × 106Chen [44]
Q200G53602.5 × 106This work
Disclaimer/Publisher’s Note: The statements, opinions and data contained in all publications are solely those of the individual author(s) and contributor(s) and not of MDPI and/or the editor(s). MDPI and/or the editor(s) disclaim responsibility for any injury to people or property resulting from any ideas, methods, instructions or products referred to in the content.

