1. Introduction
Corrosion is defined as an electrochemical process in which a chemical reaction between material and components of the environment occurs, causing deterioration [
1]. This electrochemical process is considered to be a problem worldwide. According to NACE International (National Association of Corrosion Engineers), it is estimated that corrosive processes and their consequences cost developed nations about 3%–5% of GDP or GNP [
2].
In this context, carbon steel is a metal widely used in construction and industrial projects, such as marine engineering [
3], due to its great chemical and mechanical properties and low price; however, despite its applicability, its fragility to corrosion is a major obstacle [
4]. Its application in saline environments presents difficulty, as carbon steel has as its main cause of corrosion (specifically pitting corrosion), its fragility to contact with chloride ions [
5,
6] due to its aggressive character, which is attributed to its small ionic radius (which allows greater diffusion between the monolayers formed on the metal surface [
6,
7]).
Some techniques are used for corrosion prevention, such as the use of corrosion-resistant alloys, corrosion-resistant coatings, cathodic protection, corrosion inhibitors, salt scavengers, cathodic passivation, and regular washing [
8].
The organic coatings industry has played a crucial role in protecting metal surfaces from corrosion. In this context, organic coating films are applied as a protective barrier, preventing the direct exposure of carbon steel to the corrosive environment [
9]. Corrosion protection using coatings is captivating because, beyond being cost-effective, it is one of the most flexible, efficient, and direct strategies available [
8].
The composition of a coating varies according to the function it has to perform; however, one can generalize that a coating formulation should present a vehicle (resins and solvents), pigments and additives. The resins are responsible for forming the paint film, and the most widely used are epoxy resin, polyurethane, phenolic resin, furan resin and polyurea coatings, with epoxy being the most widely applied coating due to its distinct advantages (excellent adhesion, acid-base resistance, resistance to penetration and low shrinkage) [
10]. In addition to the creation of barriers with the corrosive environment, organic coatings have mechanisms of cathodic protection (sacrifice) and inhibition (passive protection) [
11].
Electrochemical techniques have been widely applied to evaluate the corrosion protection performance of polymer composite coatings, mainly using open circuit potential (OCP) measurements and electrochemical impedance spectroscopy (EIS) [
12]. EIS has been used for the investigation of organic coatings for several reasons, such as to understand the protection mechanism of an organic coating, to predict the lifetime of the coating, and to detect changes in coating performance after exposure time [
13,
14,
15]. In addition to the qualitative results, by modeling the spectra with a suitable equivalent circuit, the EIS is able to provide quantitative data on the electrical parameters of the coatings and their changes over time due to exposure to corrosive media, such as the coating capacitance (C
c), which is associated with the amount of water absorbed during the initial stages of exposure to the electrolyte; the coating resistance (R
C), which is related to the state of the coating, its additives or pigments, porosity and type of resin; the double layer capacitance (C
dl), associated with the delaminated area of the coating; and the load transfer resistance (R
ct), related to the susceptibility to corrosion of the substrate [
13,
16,
17].
According to Shin and Shon (2010) [
18], whose research focused on the effects of varying the thickness of an epoxy coating on the corrosion protection of carbon steel, there is an intrinsic relationship between the corrosion protection of the epoxy coating and its thickness, indicating that thicker coatings provide greater corrosion resistance compared to relatively thin coatings. In contrast, the conclusions of Zhang et al. (2021) [
19], who investigated the influence of combining different paint film thicknesses on the corrosion resistance of steel sheets, suggest that increasing coating thickness can improve anticorrosive performance; however, this improvement is conditional on maintaining a certain primer thickness, as excessively thick coatings generally lead to greater internal stresses, resulting in cracks during use, which compromises anticorrosive performance.
Therefore, it is clear that the relationship between the thickness of the coating and its protective properties its not straightforward. The few previous studies that addressed the influence of coating thickness on corrosion protection present divergences, highlighting the pressing need for additional research in this area. Regarding this scenario, the present work aims to evaluate a coating system at different thicknesses, investigating the influence of this parameter on the electrochemical impedance spectroscopy response.
3. Results and Discussion
The experimental thickness data for each coating are presented in
Table 1. The table contains average and standard deviation, and coefficient of variation data for the thickness of each coating, performed in triplicate (C50, C80, and C100). The values 50, 80, and 100 represent the height of the coating layer in micrometers, which were defined as the study objective.
The decision to adopt extenders for the application of the coatings took into consideration the coating itself, which has a high solids content, resulting in minimal thickness loss compared to the wet film, and aimed to achieve a uniform thickness across the entire plate. Proper application of a coating results in a defect-free film, good appearance, and an extended service life for corrosion protection.
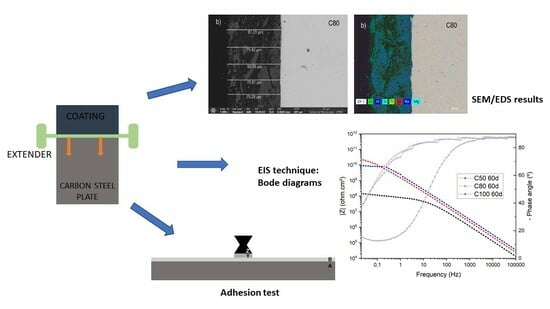
The coatings applied during this study were found to be homogeneous in terms of thickness and free of visible defects. The application using extenders has a peculiarity compared to other application methods, as it occurs in a single layer. This means that the presence of defects, such as high porosity, becomes more likely and can affect the impedance results obtained. In
Figure 3, it is possible to observe the secondary electron images using Scanning Electron Microscopy (SEM)—FEI Company (Hillsboro, OR, USA) of the surface of the produced materials. As mentioned earlier, the presence of porosity on the material’s surface is evident. It was noticeable that, as the thickness decreased, the porosity increased, as can be observed in
Figure 3a,d.
Figure 3c,d represent a thickness of 100 μm at different magnitudes (500× and 500×, respectively), and through them it is possible to verify that the number of pores is smaller when compared to
Figure 3a,b, which represent thicknesses C50 and C80, respectively.
Other discontinuities such as cracks and deformations were not visualized, and also not detected in SEM images, which can indicate that the coating pores are the more prominent defect found in the painting system.
Upon analyzing
Figure 4, one can observe the thicknesses achieved through the application with the extender. It is evident that the thinner the thickness, the greater the challenges in achieving uniform paint application, directly impacting the obtained thicknesses, as can be seen through SEM. In
Figure 5, it is possible to observe the chemical map of the paint applied to the metal surface.
In the
Supplementary Material,
Figure 5,
Figures S1 and S2 show the maps of the separate chemical compounds found in the commercial epoxy coating, which are aluminum (Al), magnesium (Mg), oxygen (O), silicon (Si), and titanium (Ti). The sodium (Na) and chlorine (Cl) appeared in
Figure 5 because the samples were immersed in the NaCl solution and the EDS was then realized.
Electrochemical Impedance Spectroscopy (EIS) was performed after different immersion time intervals of materials with the specified thicknesses in
Table 1 in a 3.5% NaCl medium: 48 h, 7 days, 15 days, 30 days, and 60 days.
Figure 6 demonstrates the behavior of the studied coatings at the described immersion times through Bode diagrams.
Analyzing first the thickness of 50 µm (C50), it was observed that its resistance decreased significantly over the immersion time in the NaCl medium, showing a sharp decline, particularly when comparing the 48 h and 30 d periods, represented by
Figure 6a,d. However, after a period of 60 days, as evidenced in
Figure 6d, there was a slight increase in resistance.
After analyzing more than 300 paint systems, Bacon et al. (1948) [
21] identified a direct correlation between the resistance of coatings and their ability to protect steel against corrosion. According to the authors, coatings that maintain a resistance above 10
8 ohm·cm
2 provide good corrosion protection. In the range between 10
6 and 10
8 ohm·cm
2, the behavior of the coatings varies, while values below 10
6 ohm·cm
2 indicate low corrosion protection.
Therefore, the thickness of 50 µm after 60 days of immersion can still be considered a viable option, as it is slightly above the 10
8 ohm·cm
2 threshold specified by Bacon et al. (1948) [
21].
The thickness of 80 µm, on the other hand, exhibits lower impedance than the 100 µm thickness in the first 48 h and 7 days of immersion. However, after 15 days, the resistance of the 80 µm thickness starts to exceed that of the 100 µm thickness, and after 30 days, a significant overtaking occurs.
Finally, the 100 µm thickness initially exhibits higher resistance than the other thicknesses in the first 48 h. However, this resistance gradually declines after 7 days and is ultimately surpassed by the 80 µm thickness after 15 days of immersion.
According to Bacon et al. (1948) [
21], some coatings may initially show a decrease in resistance followed by a sudden increase. Generally, after this increase, the value of log R may remain unchanged, increase, or decrease in the high resistance region, as is the case here. The authors describe this trend as a “repair trend”. However, to some extent, these variations in coating resistance can be attributed to processes occurring at the metal
–coating interface. These processes begin with an initial decrease in resistance due to water permeation and the transport of conductive constituents within the coating. As a result, corrosion product barriers are formed at the metal
–coating interface and possibly in the pores and interstices near this interface. These barriers prevent the passage of conductive particles to the metal surface, which leads to an increase in resistance. While this phenomenon is most pronounced in the 80 µm thickness, it is also noticeable in the 100 µm thicknesses, particularly when examining initial immersion times (from 48 h to 7 d and after, to 15 d). These cases reveal a subtle rise in resistance, as illustrated in
Figure 7. Analyzing the image, it is possible to visualize that, at the beginning, the |Z| modulus increased to the sample C80 and C100, proving the phenomenon of “repair trend”.
In
Figure 7 we observe the variation of impedance (at a frequency of 30 mHz) in the coating samples with different thicknesses (C50, C80, and C100) during the 60 days of immersion in a NaCl medium.
As can be observed, although at shorter immersion times there is a higher corrosion resistance in the material with greater thickness (C100), for longer times, above 10 days, the 80 µm thickness exhibits higher resistance. Additionally, by the slope of the curves, it can be seen that the corrosion resistances of the C80 and C100 materials increase with longer immersion times.
This behavior can be explained by the fact that thicker coatings typically allow electrolyte penetration due to the stresses generated during coating deposition and the formation of cracks between different layers, whereas thinner coating samples allow electrolyte penetration through the coating because it is not thick enough to properly protect the base steel [
22]. Thus, the correlation between coating thickness and corrosion resistance is directly proportional, and it is necessary to identify the optimal thickness for each coating.
Evaluating the efficiency of the coatings, all samples showed adequate performance for immersion times of up to 60 days in a medium with 3.5% NaCl. The impedance modules for samples C80 and C100 showed magnitude in the order of |Z|0.03Hz—109 ohm·cm2, a value above 108 ohm·cm2, which indicates good anticorrosive activity for an organic coating. The C50 sample, on the other hand, presented impedance modulus values in the order of |Z|0.03Hz—108 ohm·cm2, and thus presents a lower performance for anticorrosive protection when compared to the other samples.
The pull-off strength results obtained from the test in non-immersed and immersed in NaCl 3.5% solution area are presented in
Figure 8 for thickness conditions of 50 µm, 80 µm, and 100 µm.
By the average pull-off strength values, we can affirm that the coating with an 80 µm thickness exhibited the best adhesion properties, followed by the 50 µm and 100 µm samples. The strength values are closely linked to the surface preparation of metal plates, ensuring the presence of an adequate roughness profile to facilitate coating adhesion.
In addition to the strength values, the pull-off test provides a qualitative result regarding the type of failure observed during coating detachment. The characterization of the obtained failure is determined based on the occurrence of adhesive failures, which take place between different layers, and cohesive failures, which occur within the same layer. The types of failures observed in the samples with varying thicknesses are shown in
Figure 9.
The coatings were applied in a single layer, and the samples predominantly exhibited cohesive paint failure. This result indicates the strong adhesion of the coating to the metallic substrate.
4. Conclusions
(1) The electrochemical impedance spectroscopy tests showed that C80 was the material with the epoxy coating thickness with the highest corrosion resistance in NaCl electrolyte after sixty days of immersion. We observed that, in the 24 h of immersion, the impedance values in the low frequency region present a correlation with the thickness of the applied coating in order to increase the modulus value for the thicker samples. After 10 days of immersion, this behavior changed so that sample C80 presented higher modulus values followed by sample C100 and finally C50. Thin coatings facilitate the penetration of the electrolyte and, consequently, its contact with the metal surface, while thick coatings may present deformations or cracks during their preparation that also act by exposing the base metal to the electrolyte (it is necessary for these cases to have efficient quality control during the application step).
(2) Regarding SEM/EDS technique, the thickness of the samples C50, C80 and C100 was also confirmed by secondary electron (SE) images. The chemical element maps of the coating were showed by EDS analysis, obtaining the main compounds of the commercial epoxy coating
(3) The pull-off adhesion test proved that the sample C80 exhibited the highest tensile stretch value, indicating a strong correlation between adhesion and the performance in the EIS tests
Finally, the electrochemical impedance spectroscopy technique proved to be a suitable tool to differentiate the |Z| values, and also the corrosion development, of carbon steel sheets painted with different organic coating thickness. A clear correlation between the impedance modulus value and the porosity/thickness of the coating was proven.
Also, the SEM technique confirmed the achievement of the desired thicknesses. The pull-off test confirmed the good adhesion of the coating to the metallic substrate in samples with varying thicknesses, with the highest pull-off strength being recorded in the 80 µm thick sample.


 ,
, 


