Article

Effect of Temperature, Vacuum Condition and Surface Roughness on Oxygen Boost Diffusion of Ti–6Al–4V Alloy

1
School of Mechanical and Power Engineering, Nanjing TECH University, No.30 Puzhu South Road, Nanjing 211816, China
2
Department of Mechanical Engineering, McGill University, Montreal, QC H3A 0C3, Canada
*
Author to whom correspondence should be addressed.
Coatings 2024, 14(3), 314; https://doi.org/10.3390/coatings14030314
Submission received: 5 February 2024 / Revised: 29 February 2024 / Accepted: 2 March 2024 / Published: 5 March 2024

Abstract

:
Oxygen boost diffusion (OBD) is an effective technology for improving the surface hardness of titanium and its alloys. In this present paper, the effect of temperature, vacuum condition and surface roughness on oxygen boost diffusion of Ti–6Al–4V alloy are studied. Test results show that OBD processing can be achieved at a low temperature and over long times, as well as at a high temperature and over short times. By comparing processing efficiency and mechanical properties, high temperatures and short times are preferred for OBD treatment. The influence of vacuum conditions on oxygen vacuum diffusion is significant. Under low vacuum degree conditions, relatively high oxygen content not only corrodes the OBD layer but also leads to spalling of the outmost surface of the OBD layer and the remaining oxide layer. High surface roughness can induce cracking not only in the oxide layer during the oxidation process but also in the outmost surface of the OBD layer during the vacuum diffusion process.

1. Introduction

Titanium and its alloys are widely used in aerospace, automotive, petroleum, chemical and biomedical industries because of their high strength, low density and perfect corrosion resistance [1,2,3,4]. However, titanium and its alloys have poor surface wear resistance. To improve wear resistance, surface hardening technology has been extensively studied [5,6,7,8,9,10,11,12,13,14,15,16,17]. Because of its chemical activity, titanium can form a continuous range of solutions with oxygen. One of the ways to improve the surface and performance characteristics of titanium and its alloys is oxygen boost diffusion (OBD) technology, which was developed by Dong [14,18] around the year 2000. OBD treatments essentially consist of two steps: (1) thermal oxidation. In this step, an adherent oxide layer with appropriate thickness is obtained, which provides oxygen atoms in the following vacuum diffusion step. (2) Vacuum diffusion. After thermal oxidation, the pre-oxidized specimens are treated under vacuum conditions. An oxygen atom released from the oxide layer is diffused in the substrate and forms an OBD layer. Since then, scholars have focused on the properties of the OBD layer, such as friction resistance [14,19,20] and fatigue resistance [21,22,23]. However, there is limited research on the factors affecting oxygen diffusion [24].
In this present study, the effects of factors such as temperature, vacuum condition and surface roughness on OBD treatment were investigated using experimental test methods. In addition, the effect of the OBD process on the mechanical properties of the substrate was also studied.

2. Experimental Procedure

The material used in the experiment is a Ti–6Al–4V (Al 6.32, V 3.7, Fe 0.129, O 0.13, Si 0.08, C 0.02, N 0.009, H 0.005 and balance Ti (wt %)) alloy plate of 12 mm thickness. The oxygen boost diffusion specimens are all rectangular prisms of 10 mm × 10 mm × 5 mm, cut from the plate.
In the study of the effect of temperature on OBD treatment, specimens were progressively ground on SiC sandpaper up to 800 grit and oxidized in a muffle furnace at temperatures from 600 to 850 °C for different time durations until cracking of the oxide layer was observed. The increase in the weights of specimens at different time durations was measured using a high precision scale (0.0001 g). Subsequently, a scanning electron microscope (SEM, Phenom Pro-X, Eindhoven, The Netherlands) was used to measure the thickness of the oxide layer of the specimen. Oxygen vacuum diffusion of these specimens was performed at the same temperature as the respective pre-oxidation under vacuum conditions of 1 × 10⁻⁴ Pa. An optical microscope (OM, ZEISS AXIO Imager A1m, Göttingen, Germany) and Vickers hardness tester were used to measure the thickness and hardness distribution of the OBD layer. In order to investigate the effect of the treatment process on the mechanical properties of the substrate, the as-received Ti–6Al–4V alloy plate was heat-treated at the corresponding temperatures and time durations. After heat treatment, flat uniaxial tension test specimens 3 mm thick and 10 mm wide were machined along the rolling direction. All uniaxial tension tests were performed on an electromechanical machine (INSTRON5869, Darmstadt, Germany) under total strain rate control mode, with a constant strain rate of 2 × 10⁻⁴ s−1.
In the study of the effect of vacuum condition on the OBD treatment, specimens were progressively ground on SiC sandpaper up to 800 grit. They were then oxidized in a muffle furnace at 850 °C for 0.33 h and put into the vacuum furnace to diffuse at 850 °C for 20 h under four vacuum conditions of 1 × 10⁻¹ Pa, 1 × 10⁻² Pa, 1 × 10⁻³ Pa and 1 × 10⁻⁴ Pa. OM and SEM were used to characterize the oxide layer and the OBD layer.
In the study of the effect of surface roughness on the OBD treatment, specimens’ surfaces were ground on SiC sandpapers of 80, 400, 800, 1200, 1500 and 2000 grits. The surface characteristic was determined using AFM (atomic force microscope, Bruker Dimension Icon, Madison, WI, USA). In order to reduce the error, three positions were selected randomly on each specimen, and their average value was taken as the final test result. After surface analysis, all specimens were oxidized at 850 °C for 0.33 h in a muffle furnace and diffused in the vacuum furnace at 850 °C for 20 h under a 1 × 10⁻⁴ Pa vacuum condition. OM was used to observe the characteristics of the OBD layer.
Metallography specimens were ground progressively up to 2000 grit with emery papers, and then polished with 3.5 μm synthetic diamond grinding paste and etched with Kroll reagent (2% HF + 98% H2O).
Oxygen content distribution along the cross-section of the OBD layer was analyzed using electron probe microanalysis (EPMA, SHIMADZU EPMA-1610, Kyoto, Japan) on the cross-sectional surface because titanium is easily oxidized during the mechanical grinding and polishing process, leading to wrong results. In order to remove the oxide layer produced during sample preparation, the surface was plasma-polished using a Fischione model 1060 SEM Mill system (Cleveland, OH, USA) after mechanical polishing.

3. Results and Discussion

3.1. Effect of Temperature on the OBD Treatment Process

3.1.1. Effect of Temperature on the Oxidation and Diffusion Progress

Figure 1 gives the relationship between normalized weight gain (mg/cm2) data and oxidation time (h). Macro pictures of corresponding specimens are also shown in the figure. It is clear that high temperature accelerates the oxidation of specimens. The relationship between weight gain and time follows the parabolic oxidation kinetics at 600 °C. When temperature is raised to 700–850 °C, the relationships are linear [25]. Test results also show that with the extension of oxidation time, the surface oxide layer cracks or spalls after removing the specimen from the muffle furnace (for example, 12 h at 700 °C, 8 h at 750 °C, 2 h at 800 °C, and 0.5 h at 850 °C). Because the oxide layer provides oxygen atoms in the subsequent vacuum diffusion process, the integrity and thickness of the oxide layer, as well as the tightness of bonding with the substrate affects the diffusion effect. Therefore, the thickness and morphology of the oxide layer on the specimens oxidized at 700 °C for 8 h, 750 °C for 6 h, 800 °C for 2 h and 850 °C for 0.33 h without obvious macroscopic spalling were observed, as shown in Figure 2. It shows that there are no obvious cracks in these oxidized layers, and their thicknesses are about 5–8 μm.
Most studies show that thermal expansion mismatch stresses are of major importance in the oxide spalling process [26,27,28]. A frequently referenced expression for this stress is described as follows [27]:
σ O X = E O X Δ T ( C T E O X C T E M ) 1 + 2 E O X E M t O X t M
where σOX is the stress in the oxide, EOX is the elastic modulus of the oxide, ΔT is the difference between the oxidizing temperature and the temperature to which the specimen is cooled, CTEOX and CTEM are the coefficients of thermal expansion of the oxide and the metal over ΔT, EM is the elastic modulus of the metal, and tOX and tM are thicknesses of the oxide and the metal.
Based on our results, tOX << tM, and the expression is reduced to:
σ O X = E O X Δ T ( C T E O X C T E M )
Average Eox = 259 GPa, CTEOX = 10.1 × 10⁻⁶/°C for TiO2 [29], CTEM = 11 × 10−6/°C for Ti–6Al–4V [30]. The stresses in the oxide layer after cooling from 700 °C, 750 °C, 800 °C, and 850 °C to room temperature are about 157 MPa, 169 MPa, 181 MPa, and 192 MPa, which are all significantly smaller than the tensile strength of TiO2 (333.3–367.5 MPa) [29]. This seems to indicate that if only temperature mismatch stress is considered, then no matter how thick the oxide layer is, it will not crack during cooling. This is obviously inconsistent with test results. In fact, the cracking of the oxide layer is closely associated with its thickness. Robertson et al. [26] found that it was strains that caused oxide scales to fracture, and the critical fracture strain was:
ε = ( 2 γ F 2 f π E h ) 1 / 2
where γ is the fracture surface energy of the oxide, F is a numerical factor depending on the shape and disposition of the flaw that can take the values F = 2/π, 1 and 1.12, f is a constant, E is Young’s modulus and h is the scale thickness of the oxide. It is clear that the critical fracture strain decreases with the increase in the scale of the oxide’s thickness. This is why cracking occurs in thick oxide layers. In the study of the adhesion strength of the oxide layers formed on titanium, Coddet et al. [31] found that the adhesion strength decreased significantly as the oxidation thickness increased. They also found that at 650 °C, the reduction in adhesion strength only becomes significant beyond a thickness of 5–7 μm, which is very close to our research results (about 5–8 μm).
Figure 3 shows the cross-sectional metallography of specimens after oxidation and vacuum diffusion (1 × 10⁻⁴ Pa) at different temperatures. These results indicate that temperature and treatment times can affect the diffusion results significantly. For example, even after diffusing at 700 °C for 100 h, the thickness of the OBD layer is only about 40 μm (Figure 3a). When the temperature rises to 750 °C and 800 °C, the thickness of the OBD layer reaches ≈ 80 μm and ≈150 μm only at 80 h (Figure 3b,f). Figure 3 also shows that extending the heat treatment time can also increase the thickness of the OBD layer (Figure 3d–i). Comparing the effect of temperature and diffusion time shows that increasing diffusion temperature can achieve diffusion more efficiently than prolonging time. Dong et al. [24] also found that the effect of temperature is significant in the oxygen boost diffusion process.
Surface hardness is very important for improving the wear resistance of material. Therefore, the hardness distribution of the specimens after oxygen diffusion was measured as shown in Figure 4a. It is clear that for specimens treated at 750 °C for 150 h, 800 °C for 80 h and 850 °C for 20 h, the surface hardness (HV0.2) is ≈900, ≈1007 and ≈909, and the hardened layer thickness is ≈150 μm, ≈180 μm and ≈150 μm, respectively. The surface oxygen concentration of specimens diffused at 750 °C for 150 h, 800 °C for 80 h and 850 °C for 20 h are approximately ≈10 at. % and the depths of the OBD layers are ≈160, 180 and 160 μm, respectively.
Test results also indicate that the thickness of the OBD layer determined using the EPMA method and the hardness measurement method is the same or a little larger than the results measured using the metallographic method (Figure 3e,f,i). This is mainly because in the metallographic method, the OBD layer thickness is determined by observing the color changes on the cross-sectional surface after etching. The severe and slight erosion of the sample displays different color shades, which in turn affects the accuracy of thickness judgment.
The specimen diffused at 800 °C for 80 h has the highest surface hardness and the thickest OBD layer. However, some microcracks were observed near the surface (as shown in Figure 5a). The study by Dong et al. [24] also found some cracks in the outmost surface of some specimens, but they did not provide an explanation. We believe that these cracks are caused by grinding during the preparation of metallographic specimens. To verify our hypothesis, the surface morphology of the specimen was observed after OBD treatment using SEM. Figure 5b displays the surface characteristics of the specimen following OBD treatment at 800 °C for 80 h. Evidently, no cracks were found, indicating that the specimen’s surface remained intact following the OBD treatment. Hence, the surface cracks observed in the metallographic specimen arose during the preparation of the metallography specimens.
In theory, after oxygen atoms are dissolved in the metal lattice, the lattice will inevitably expand. However, the internal matrix will constrain its expansion, which will generate significant surface compressive residual stress. The surface residual stress of these OBD-treated specimens (750 °C for 150 h, 800 °C for 80 h and 850 °C for 20 h) was measured using an X-ray residual stress measurement instrument (PROTO-iXRD, PROTO, Universal Drive Taylor, MI, USA) using the sin2Ψ method [32] with 20 kV, 4.0 mA and Cu Kα X-ray (λ = 0.1541838 nm). The measurement results show that the surface residual stress is compressive, but the value is very small (≈−20 ± 11 MPa). This is due to the annealing effect induced by the high temperature of the OBD treatment process, which leads to the release of residual stress [33].

3.1.2. Effect of Temperature on Mechanical Properties of the Substrate

The temperature at which Ti–6Al–4V can be used for a long time is generally not more than 500 °C. However, the OBD treatment temperatures exceed 500 °C, which may have an adverse effect on the properties of the substrate. Therefore, the effect of the OBD treatment process on the properties of the Ti–6Al–4V substrate was subsequently studied. Figure 6 gives the tensile strength strain curves of Ti–6Al–4V specimens after different heat treatments. Test results reveal a decrease in the mechanical properties of all heat-treated specimens compared to the as-received material. Particularly, specimens treated at a lower temperature for an extended duration exhibit the most significant decrease in mechanical properties. For example, after heating at 700 °C for 100 h and 750 °C for 80 h, tensile strength and fracture elongation decreased by ≈8% and ≈31%, respectively. Conversely, specimens exposed to higher temperatures for shorter durations (850 °C for 20 h) exhibited a decrease of approximately 6% and 10% in tensile strength and fracture elongation, respectively. The results suggest that high temperatures and short durations are preferred during the OBD treatment process.

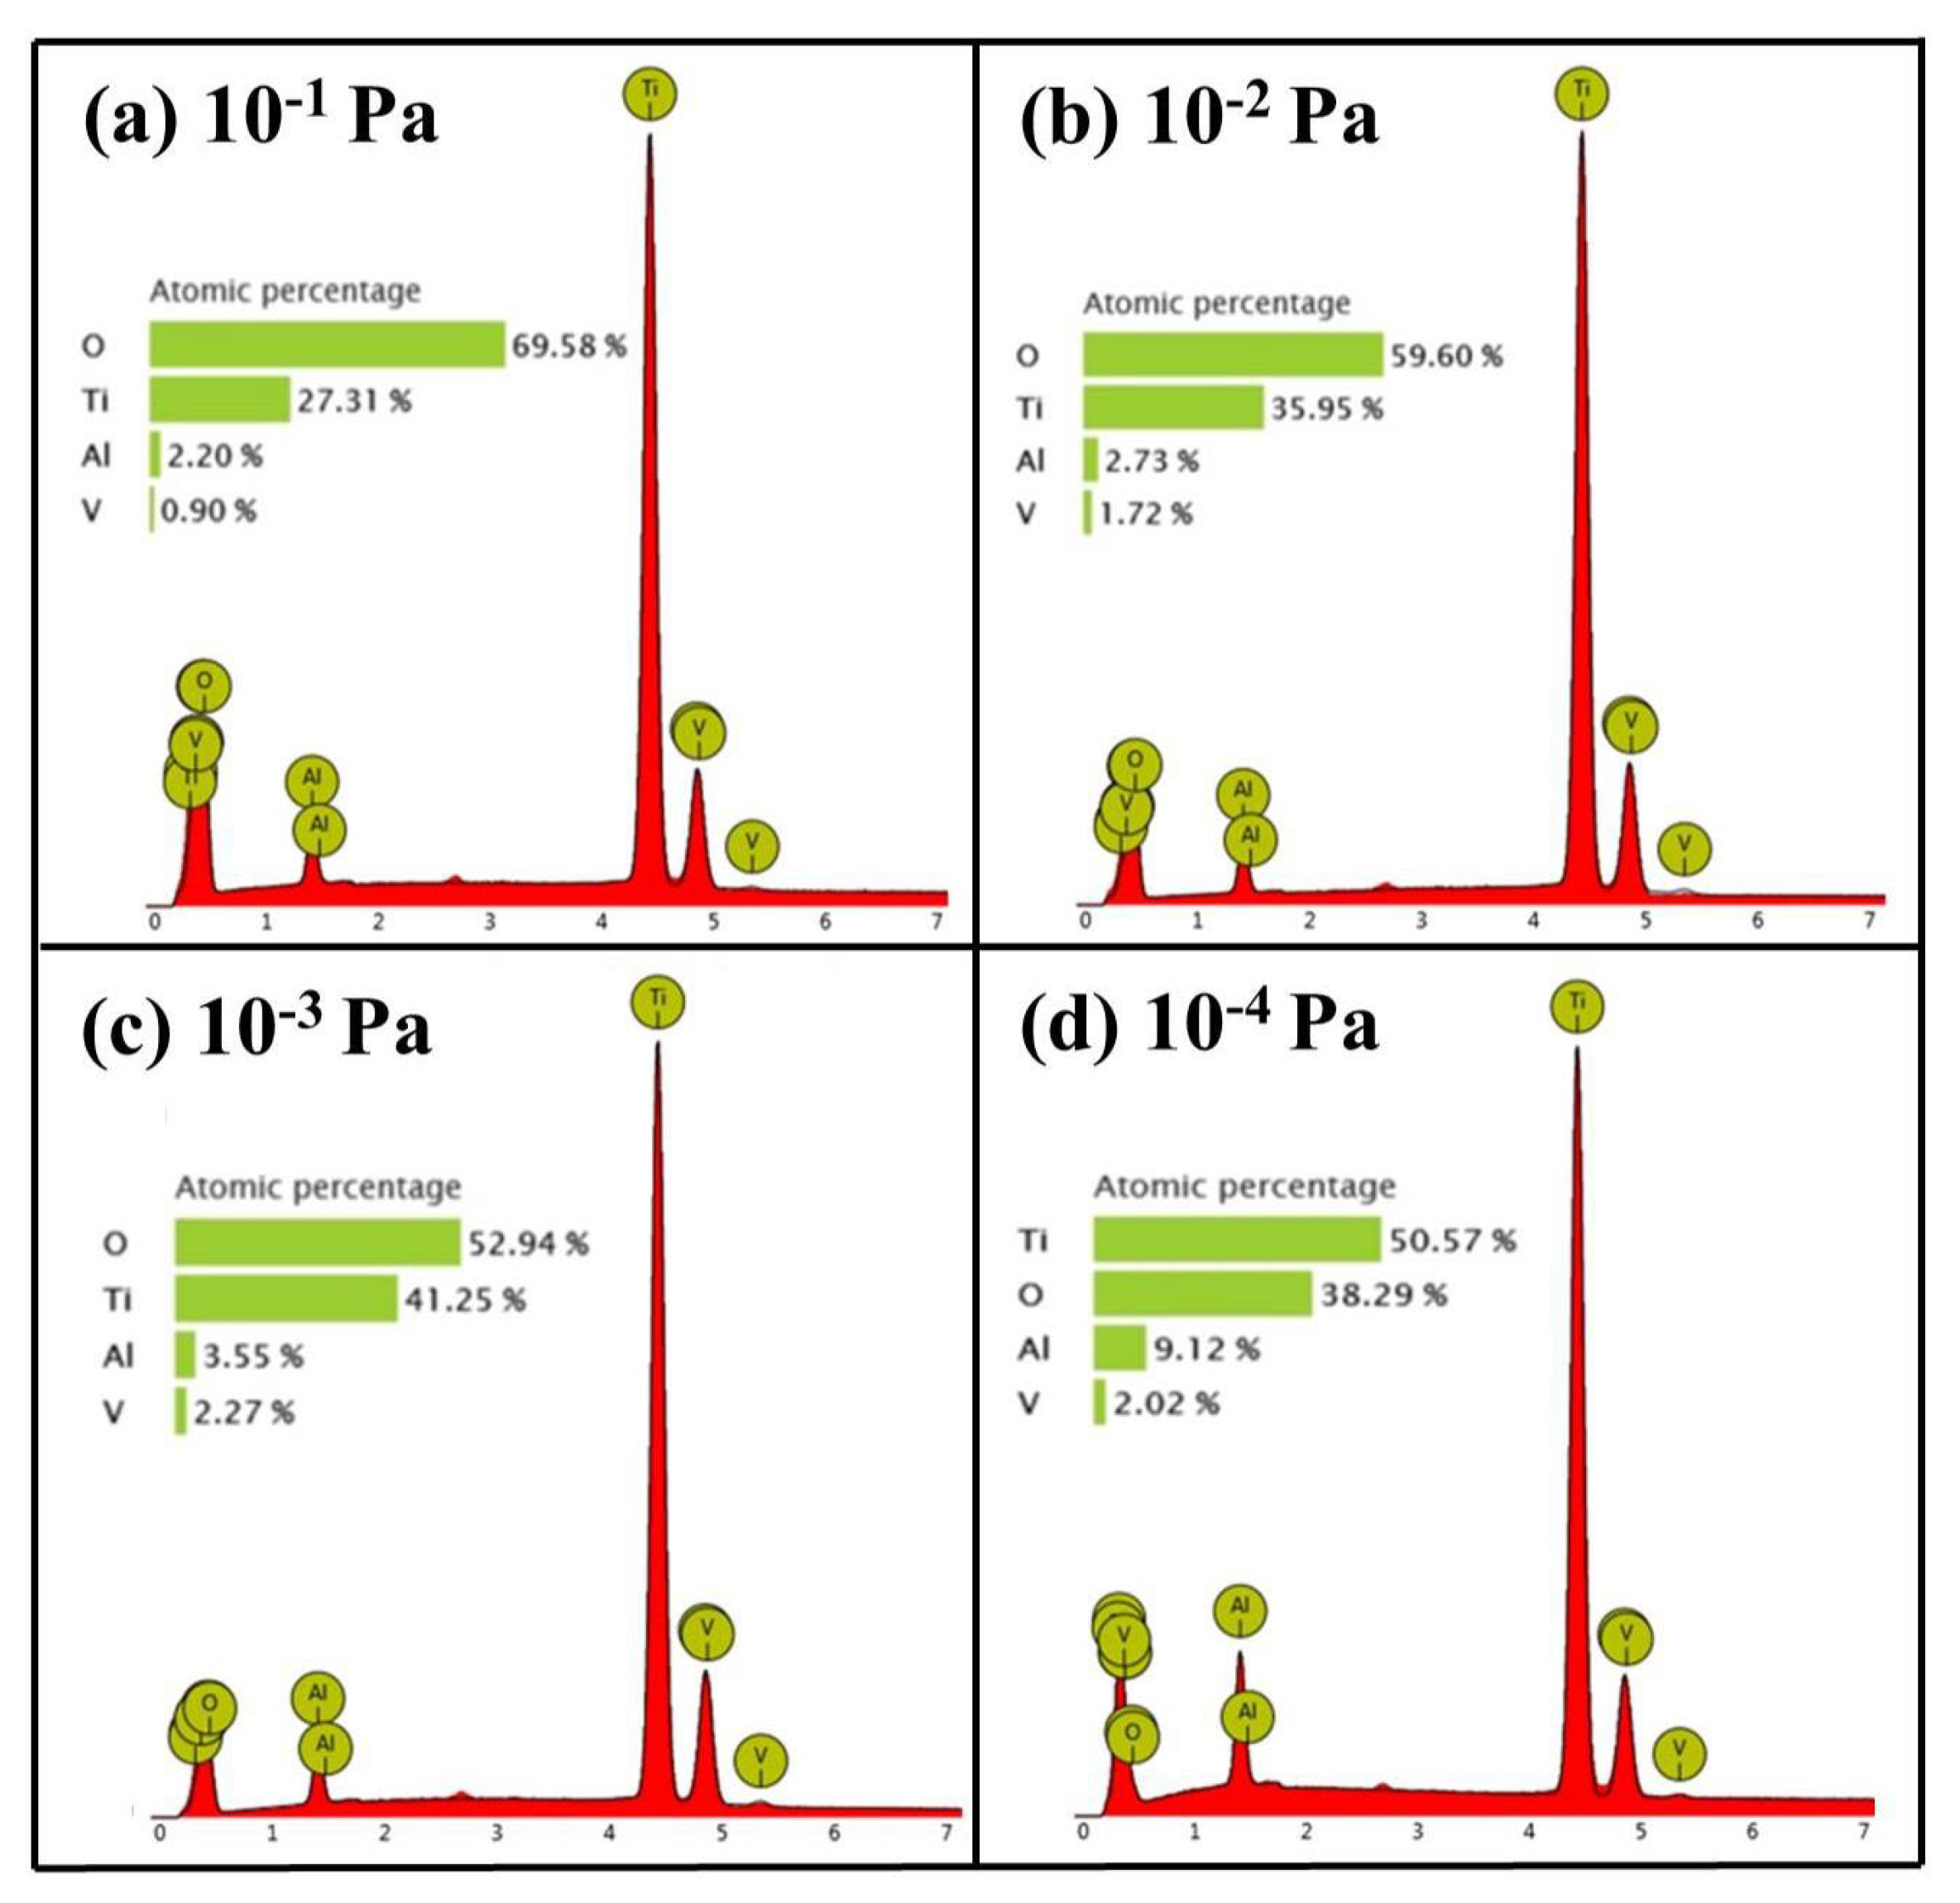
3.2. Effect of Vacuum Degree on OBD Treatment

Figure 7 shows the cross-sectional metallographic and macroscopic pictures of specimens diffused under different vacuum conditions at 850 °C for 20 h. Under low vacuum conditions (1 × 10⁻¹ Pa), a significant surface oxide layer can be observed with the naked eye, and the oxide layer warps and detaches (Figure 7a). The metallographic photo illustrates that the thickness of the OBD layer measures ≈ 150 μm. Oxidation causes unevenness on the specimen’s surface. Under vacuum conditions of 1 × 10⁻² and 1 × 10⁻³ Pa, noticeable, blue-colored oxide layers remain visible on the specimen’s surface. Nevertheless, no evident cracking or warping is observed in the oxide layer. OBD layers of ≈160 μm and ≈180 μm can be observed on metallographic photos. The surfaces of the specimens are still uneven due to oxidation, and obvious oxide layers can be observed. Under a vacuum of 1 × 10⁻⁴ Pa, the macro specimen’s surface exhibits a silver-grey color with a metallic luster. The metallographic photo illustrates a smooth specimen surface with an OBD layer that is ≈150 μm thick.
Hardness and oxygen content distribution along the depth are shown in Figure 8. It shows that the specimen that is diffused in 1 × 10⁻³ Pa has the highest hardness and oxygen content and the thickest OBD layer. The specimens diffused in 1 × 10⁻¹ Pa and 1 × 10⁻⁴ Pa have the lowest hardness and oxygen content and the thinnest OBD layers. Generally speaking, in the vacuum diffusing step, pre-oxidized TiO2 dissociated and oxygen atoms diffused into the substrate, leading to a decrease in oxygen potential at the interface between the oxide layer and the metal. This is not conducive to oxygen diffusion. If there is more oxygen in the environment during the diffusion process, a new oxide layer will form, and oxygen potential will be increased to accelerate the occurrence of diffusion to obtain a thicker OBD layer. However, according to our experimental results, the vacuum condition for obtaining the thickest OBD layer is not 1 × 10⁻¹ Pa, but 1 × 10⁻³ Pa. This is an unusual phenomenon. We believe it is due to the large amount of oxygen in the low vacuum environment, which depletes the OBD layer via oxidation. Under a low vacuum condition (1 × 10⁻¹ Pa), the high oxygen concentration in the environment is conducive to diffusion, but it also leads to severe oxidation of the surface OBD layer and induces the thinning of the OBD layer. Therefore, the final remaining thickness of the OBD layer is not the thickest. Under a vacuum condition of 1 × 10⁻³ Pa, the oxidation thinning effect of oxygen on the OBD layer is weaker than its promoting effect on the thickening of the OBD layer, thus the thickness of the layer reaches the maximum value (≈180 μm). As the vacuum degree increases to 1 × 10⁻⁴ Pa, the thinning of the surface OBD layer caused by oxidation can be ignored due to the low oxygen concentration in the environment; however, the low oxygen concentration is not conducive to oxygen diffusion. Consequently, the thickness of the OBD layer decreases to ≈150 μm.
We also noticed that the outmost surface oxygen content of OBD layers formed under 1 × 10⁻¹ Pa, 1 × 10⁻² Pa, and 1 × 10⁻³ Pa vacuum conditions increases suddenly (Figure 8b), which is consistent with the observation of a residual oxide layer on the surface using metallography.
The surface characteristics of specimens and the cross-sectional features of the OBD layer in metallographic specimens were observed using SEM after OBD treatment under various vacuum conditions, as depicted in Figure 9. Figure 9a–d illustrates the surface characteristics. It is clear that under a low vacuum condition of 1 × 10⁻¹ Pa, the surface oxide is thick and the particle size is large. As the vacuum conditions increase to 1 × 10⁻² Pa and 1 × 10⁻³ Pa, the sizes of surface oxide particles decrease. When the vacuum condition increases to 1 × 10⁻⁴ Pa, there are no obvious oxide particles on the surface and some grinding marks formed during original specimen processing can be observed.
Figure 9e–h shows the cross-sectional characteristics of specimens after OBD treatment under different vacuum conditions. It is clear that under a vacuum condition of 1 × 10⁻¹ Pa, the surface oxide layer is thickest at ≈20 μm (considering the detachment of the oxide layer, the actual thickness should be larger). The oxide layer thickness of specimens before vacuum diffusion is only about 5–8 μm (Figure 2d). However, after vacuum diffusion treatment, the oxide layer thickness increases to 20 μm. Such a thick oxide layer must be formed under low vacuum conditions. This observation verifies our inference that the large amount of oxygen in the low vacuum environment will deplete the OBD layer through oxidation. When the vacuum degree changes to 1 × 10⁻¹ Pa and 1 × 10⁻³ Pa, the thickness of the surface oxide layer reduces remarkably. No obvious oxide layer can be observed on the surface under a vacuum of 1 × 10⁻⁴ Pa, consistent with surface features.
Figure 10 illustrates the results of surface elemental EDX analysis, revealing that the surface contains predominantly oxygen (O) and the substrate metal elements Ti, Al and V. Through calculation, the atomic ratios of oxygen to metal elements (O:M) in the surface layer under different vacuum degrees are ≈2.3 (1 × 10⁻¹ Pa), ≈1.5 (1 × 10⁻² Pa), ≈1.1 (1 × 10⁻³ Pa) and ≈1 (1 × 10⁻⁴ Pa). Clearly, as the vacuum level decreases, the oxygen content in the environment diminishes, leading to a weakening of the oxidation effect. Simultaneously, the decomposition of the formed oxides intensifies, resulting in a gradual decrease in the proportion of oxygen atom content.
Another noteworthy phenomenon is that an outmost cracked layer appeared on the surface at lower vacuum degrees (1 × 10⁻¹ Pa and 1 × 10⁻² Pa) (Figure 9e,f), which is harmful to the performance of the material.
From the test results above, we found that high oxygen concentrations in the environment lead to severe oxidation of the surface OBD layer. The OBD layer obtained under the 1 × 10⁻³ Pa vacuum condition has the highest thickness and hardness, but it also has a remaining oxide layer. The OBD layer obtained under the 1 × 10⁻⁴ Pa vacuum condition has moderate hardness and thickness without any remaining oxide layer. These results indicate that to achieve the thickest OBD layer, the treatment vacuum condition should be 1 × 10⁻³ Pa, while if a surface with a metallic luster is required, the vacuum condition should not be lower than 1 × 10⁻⁴ Pa.

3.3. Effect of Surface Roughness on OBD Treatment

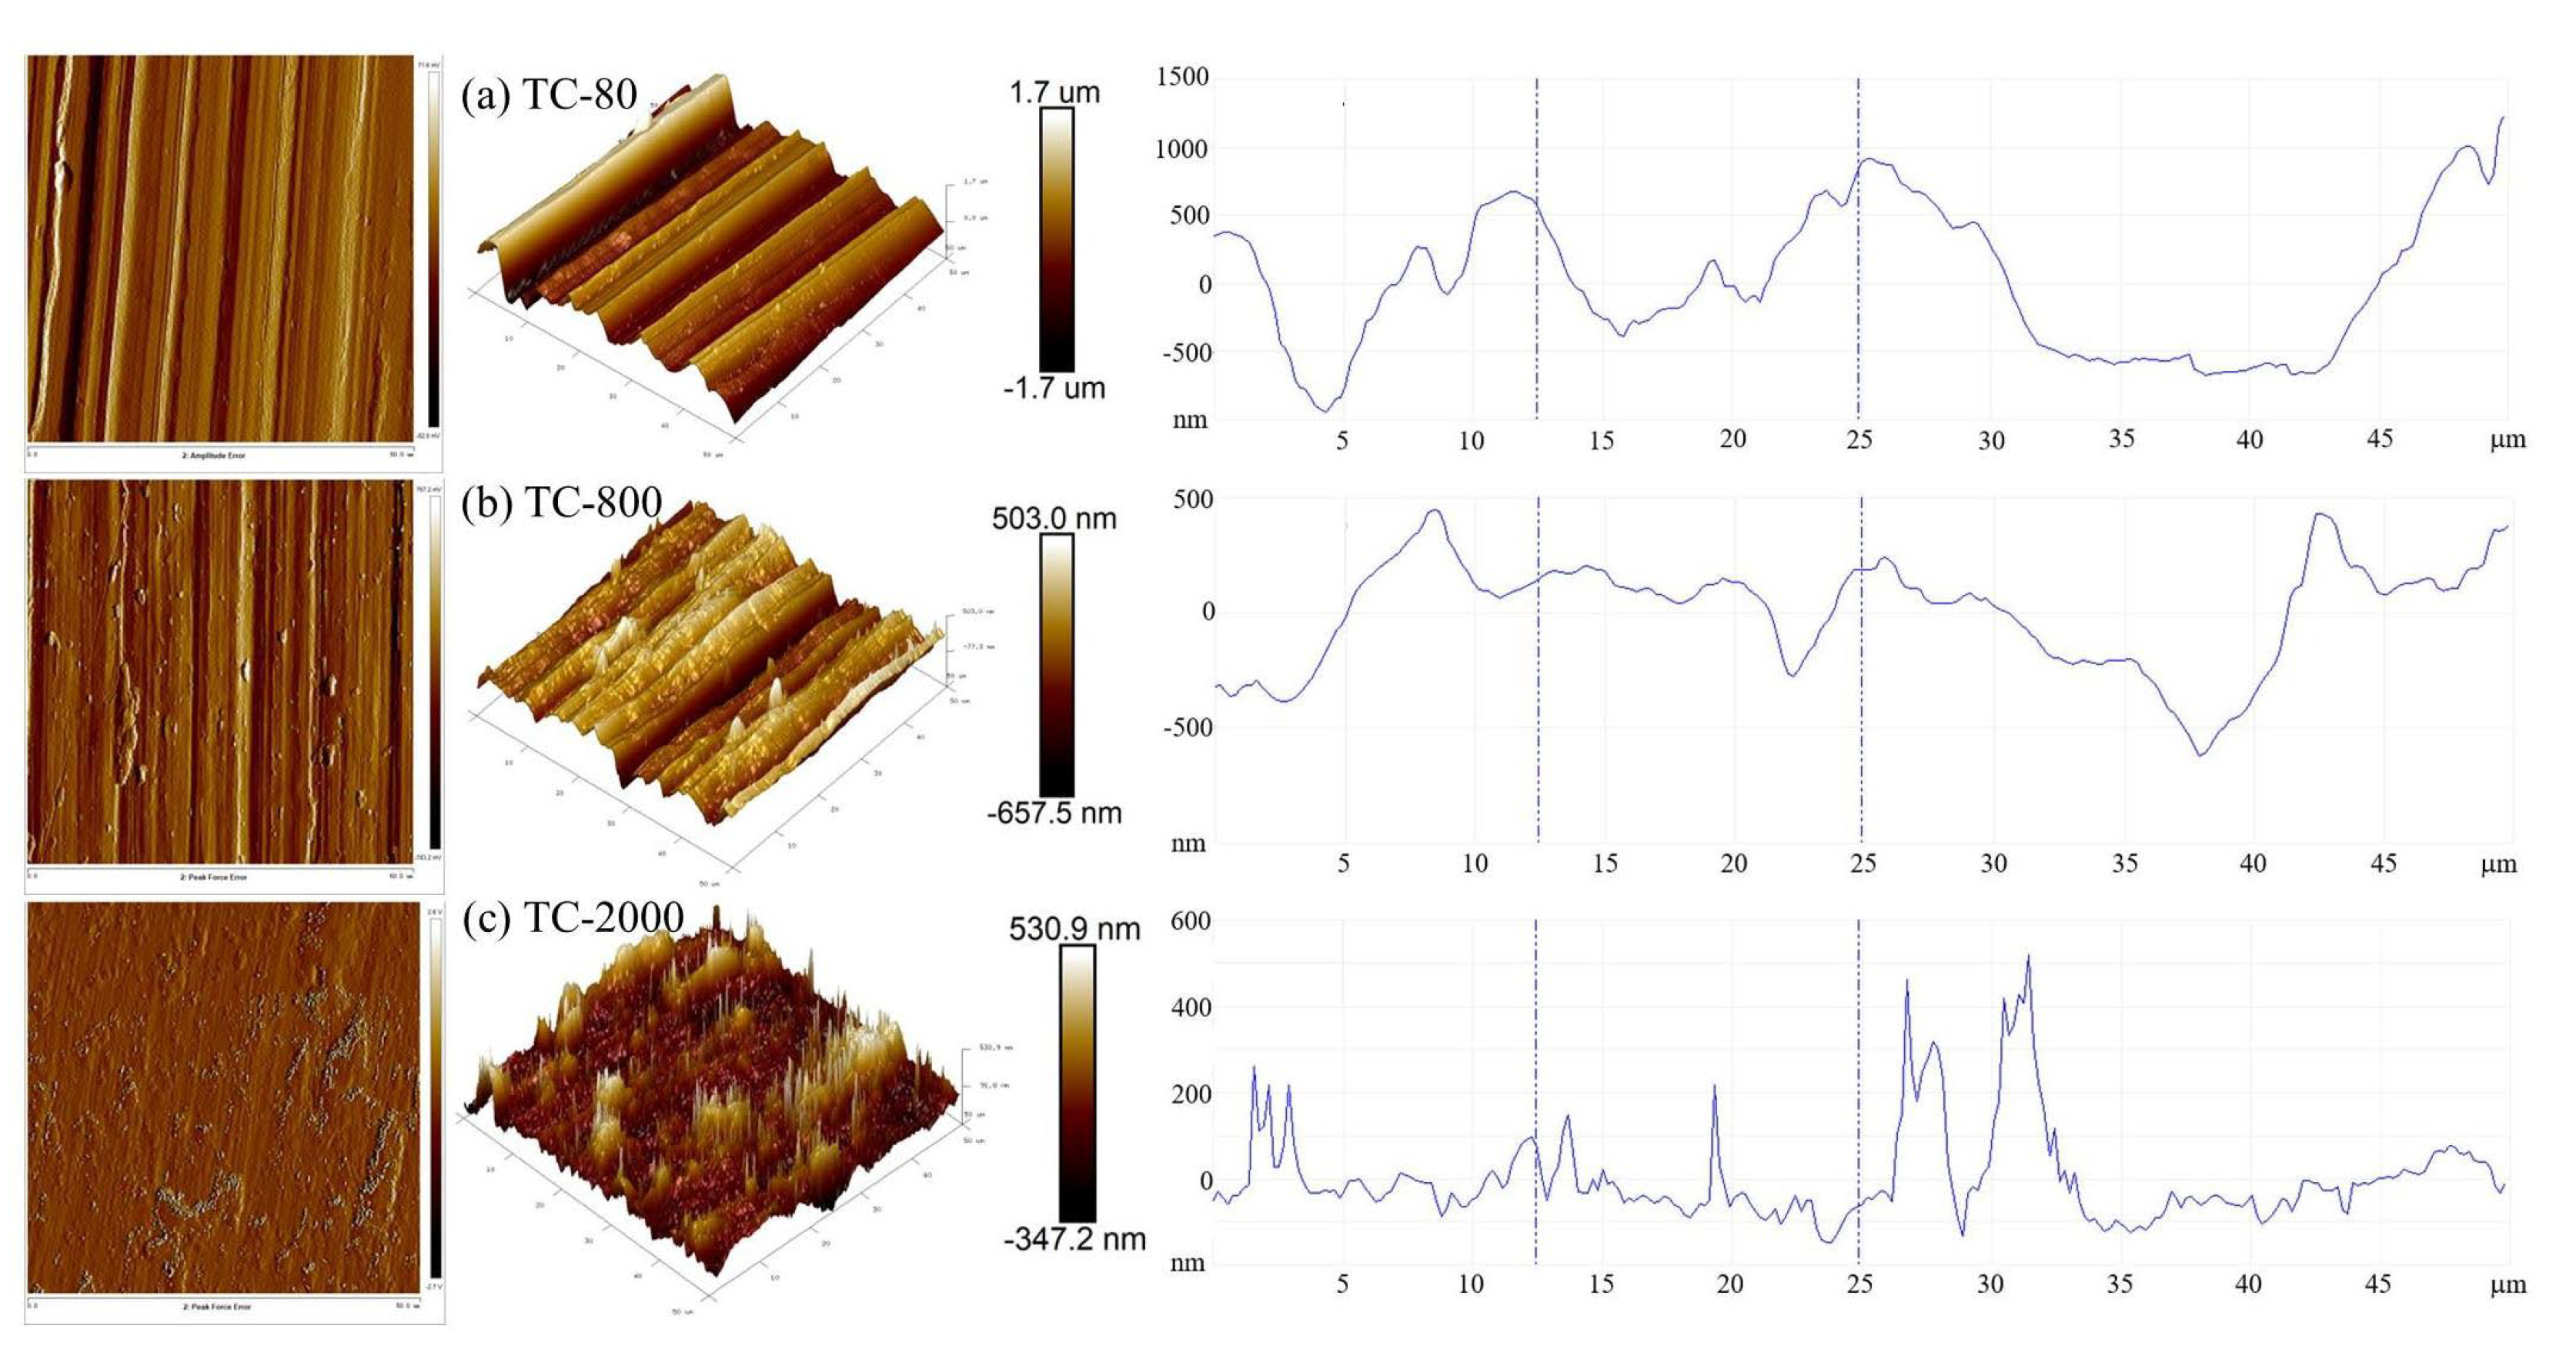
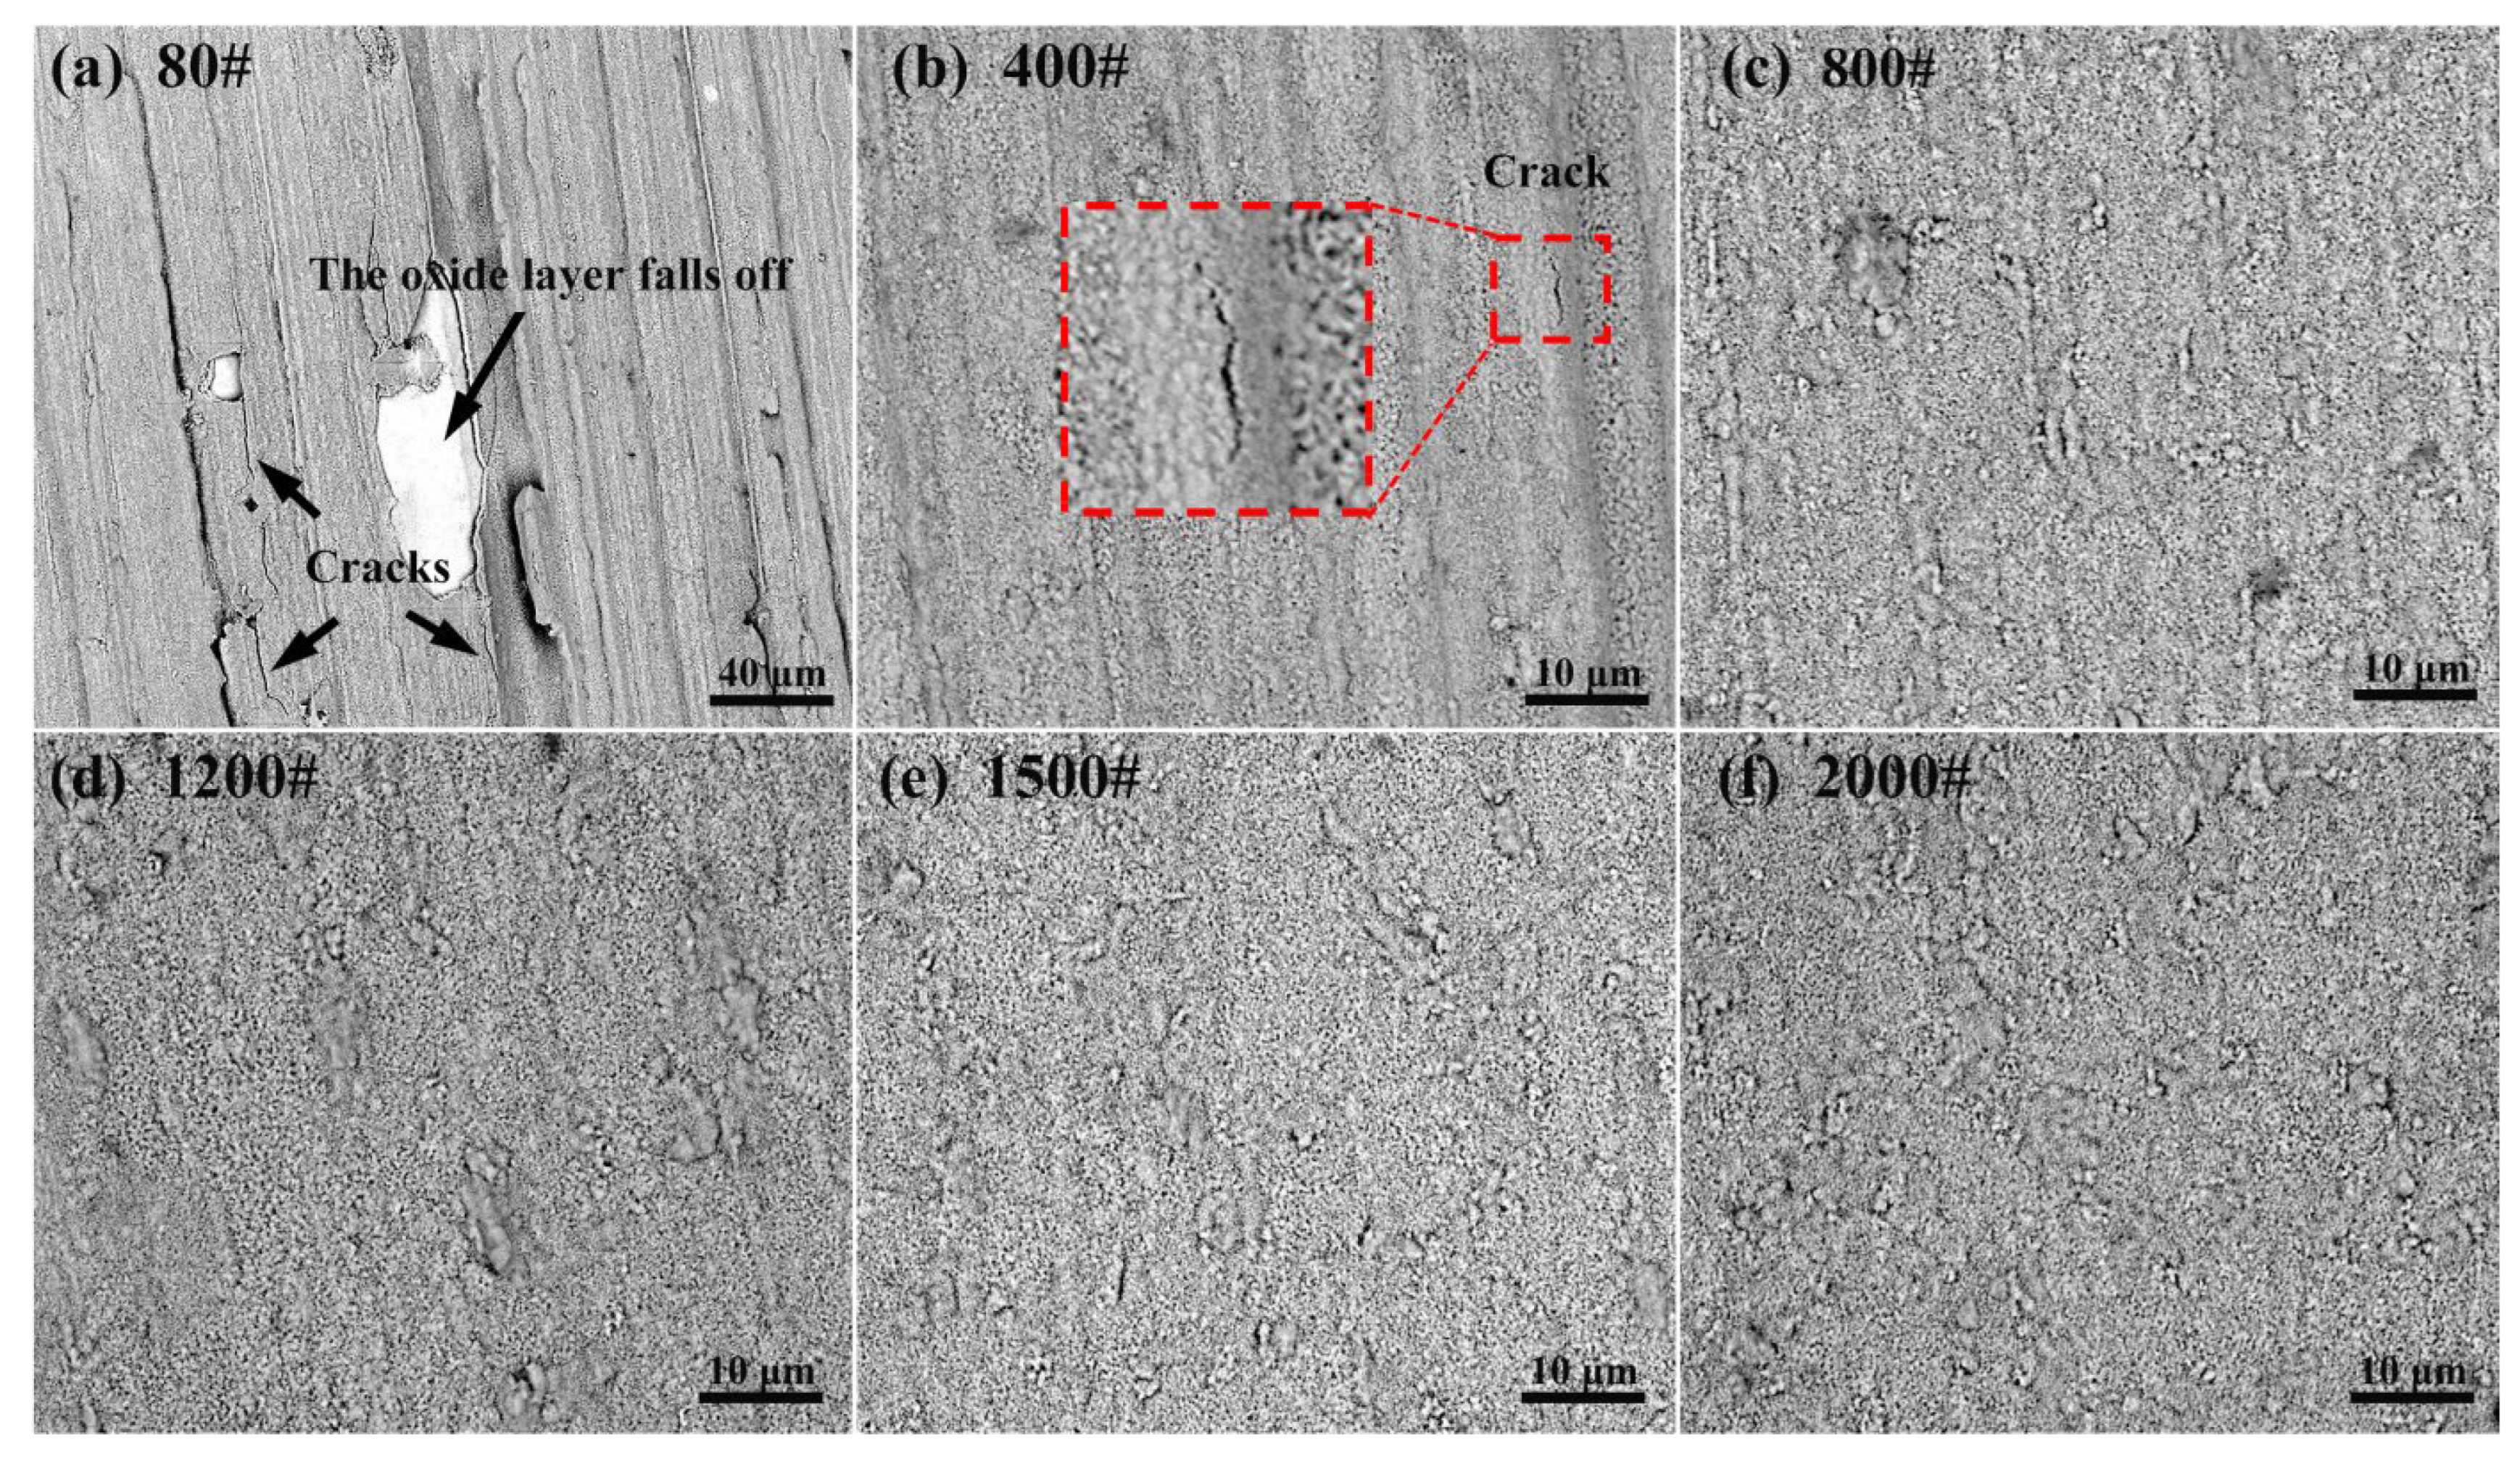
3.3.1. Surface Morphology

AFM 3D surface images and 2D surface topography curves of specimens after grinding using SiC papers are shown in Figure 11. The wear traces of these abraded specimens along the grinding direction are approximately parallel to each other. The scratches of the specimen ground with 80 grit are the widest and the deepest. As the grit number increases from 80 to 2000, the grinding marks become shallower, and except for a few bumps, most wear traces of the specimen ground with 2000 grit paper are indistinct. Deep wear traces will increase the actual surface area of the material. Based on the coordinates of each point on the 2D surface topographies curves, the surface roughness Ra (arithmetical mean deviation of the profile) R a = 1 L 0 L | y x | d x ) can be obtained. If all scratches on the specimen are assumed to be parallel to each other, the actual surface area Areal can be calculated. By comparing with the measuring zone (50 μm × 50 μm), the percentage of increased surface area Ain can also be given. The values of Ra, Areal and Ain are all listed in Table 1.

3.3.2. Effect of Surface Roughness on Thermal Oxidation

In order to study the effect of surface roughness on thermal oxidation, specimens were heated at 850 °C for 0.33 h in a muffle furnace after analysis of surface characteristics. Figure 12 shows the characteristics of the surface oxide layer. After thermal oxidation, the surface oxide layer on the specimen ground with 80# sandpaper shows obvious cracking or even detachment (Figure 12a). On the surface of the specimen ground with 400# sandpaper, only small cracks can be observed at some locations (Figure 12b). The surface oxide layers of the specimens ground with sandpapers with higher grit are intact. The experimental results indicate that a rough surface is conducive to the cracking of the oxide layer. Study [34] demonstrates that specimens with higher surface roughness possess a larger actual surface area than those with lower surface roughness. This increased surface area allows for more oxygen atoms to interact with the metal, thereby accelerating the oxidation rate. Specimens polished with coarse SiC paper have many protrusions and indentations on their surfaces. In particular, the deeper indentations can serve as channels for oxygen atoms to diffuse into the alloy or as an easy path for the formation of the oxide scale [35,36]. Therefore, theoretically, the higher the surface roughness, the thicker the oxide layer should be. Because the oxide has a much larger volume than the Ti metal, the formation of the oxide leads to a large volume expansion, which results in mutual compression in the oxide layer. With the thickening of the oxide layer, the expansion of the volume of the oxide layer becomes more severe until flaking of the oxide layer occurs. Thus, the cracked surface oxide layer of specimens ground with 80# and 400# sandpaper must be thicker. However, measuring the thickness of the oxide layer showed that the thickness of the oxide layer on all specimens is ≈4–5 μm, as shown in Figure 13. Therefore, the cracking of the oxide layer is not caused only by the thickening of the oxide layer. We believe that another important factor that induces cracking is the mutual compression of the oxide layer at sharp locations. In the initial stage of oxidation when the oxide layer uniformly covers the sample surface despite the compression stress caused by volume expansion, the relatively thin oxide layer exerts minimal compression stress and is insufficient to cause cracking. As oxidation intensifies, the oxide layer thickens and the compressive stress increases. Oxide layers on both sides of the sharp corner push against each other so that the oxide layer is subjected to both compressive and bending stresses at the sharp corner, which makes it easy to crack or even fall off at that location. From Figure 12a,b, we can see that cracks and flaking are located on the corners of polishing scratches, which proves our supposition. A schematic diagram of the causes of cracking or detachment is shown in Figure 14. Due to the large size of silicon carbide particles on the 80# sandpaper, the specimen surface obtained after grinding has high and sloping peaks caused by cutting and squeezing. The oxide layers grow from both sides of the peaks and push each other at the peak position. When the force of mutual pushing is large enough, cracking and even detachment of the oxide layer occurs. Meanwhile, the wave peaks on the surface are lower and the spacing is smaller on surfaces with lower roughness. A thin oxide layer can greatly reduce the height difference on the surface, preventing a significant extrusion force from forming at these small peaks.

3.3.3. Effect of Surface Roughness on Oxygen Diffusion

After thermal oxidation, specimens were vacuum-diffused at 850 °C for 20 h in a vacuum furnace (1 × 10⁻⁴ Pa). After that, cross-sectional specimens were prepared for metallography; their microstructures are shown in Figure 15 and Figure 16.
Figure 15 shows that the thicknesses of the surface OBD layers of specimens with different surface roughness (Ra) were almost the same (≈150 μm); however, cracking occurred on the outmost surfaces of specimens grounded using 80# and 400# abrasive paper, as shown in Figure 16. It seems that surface roughness affects the surface quality rather than the thickness of the diffusion layer.

4. Conclusions

This study investigated the effect of OBD treatment on Ti–6Al–4V using different methods; some major conclusions are summarized as follows:
(1)
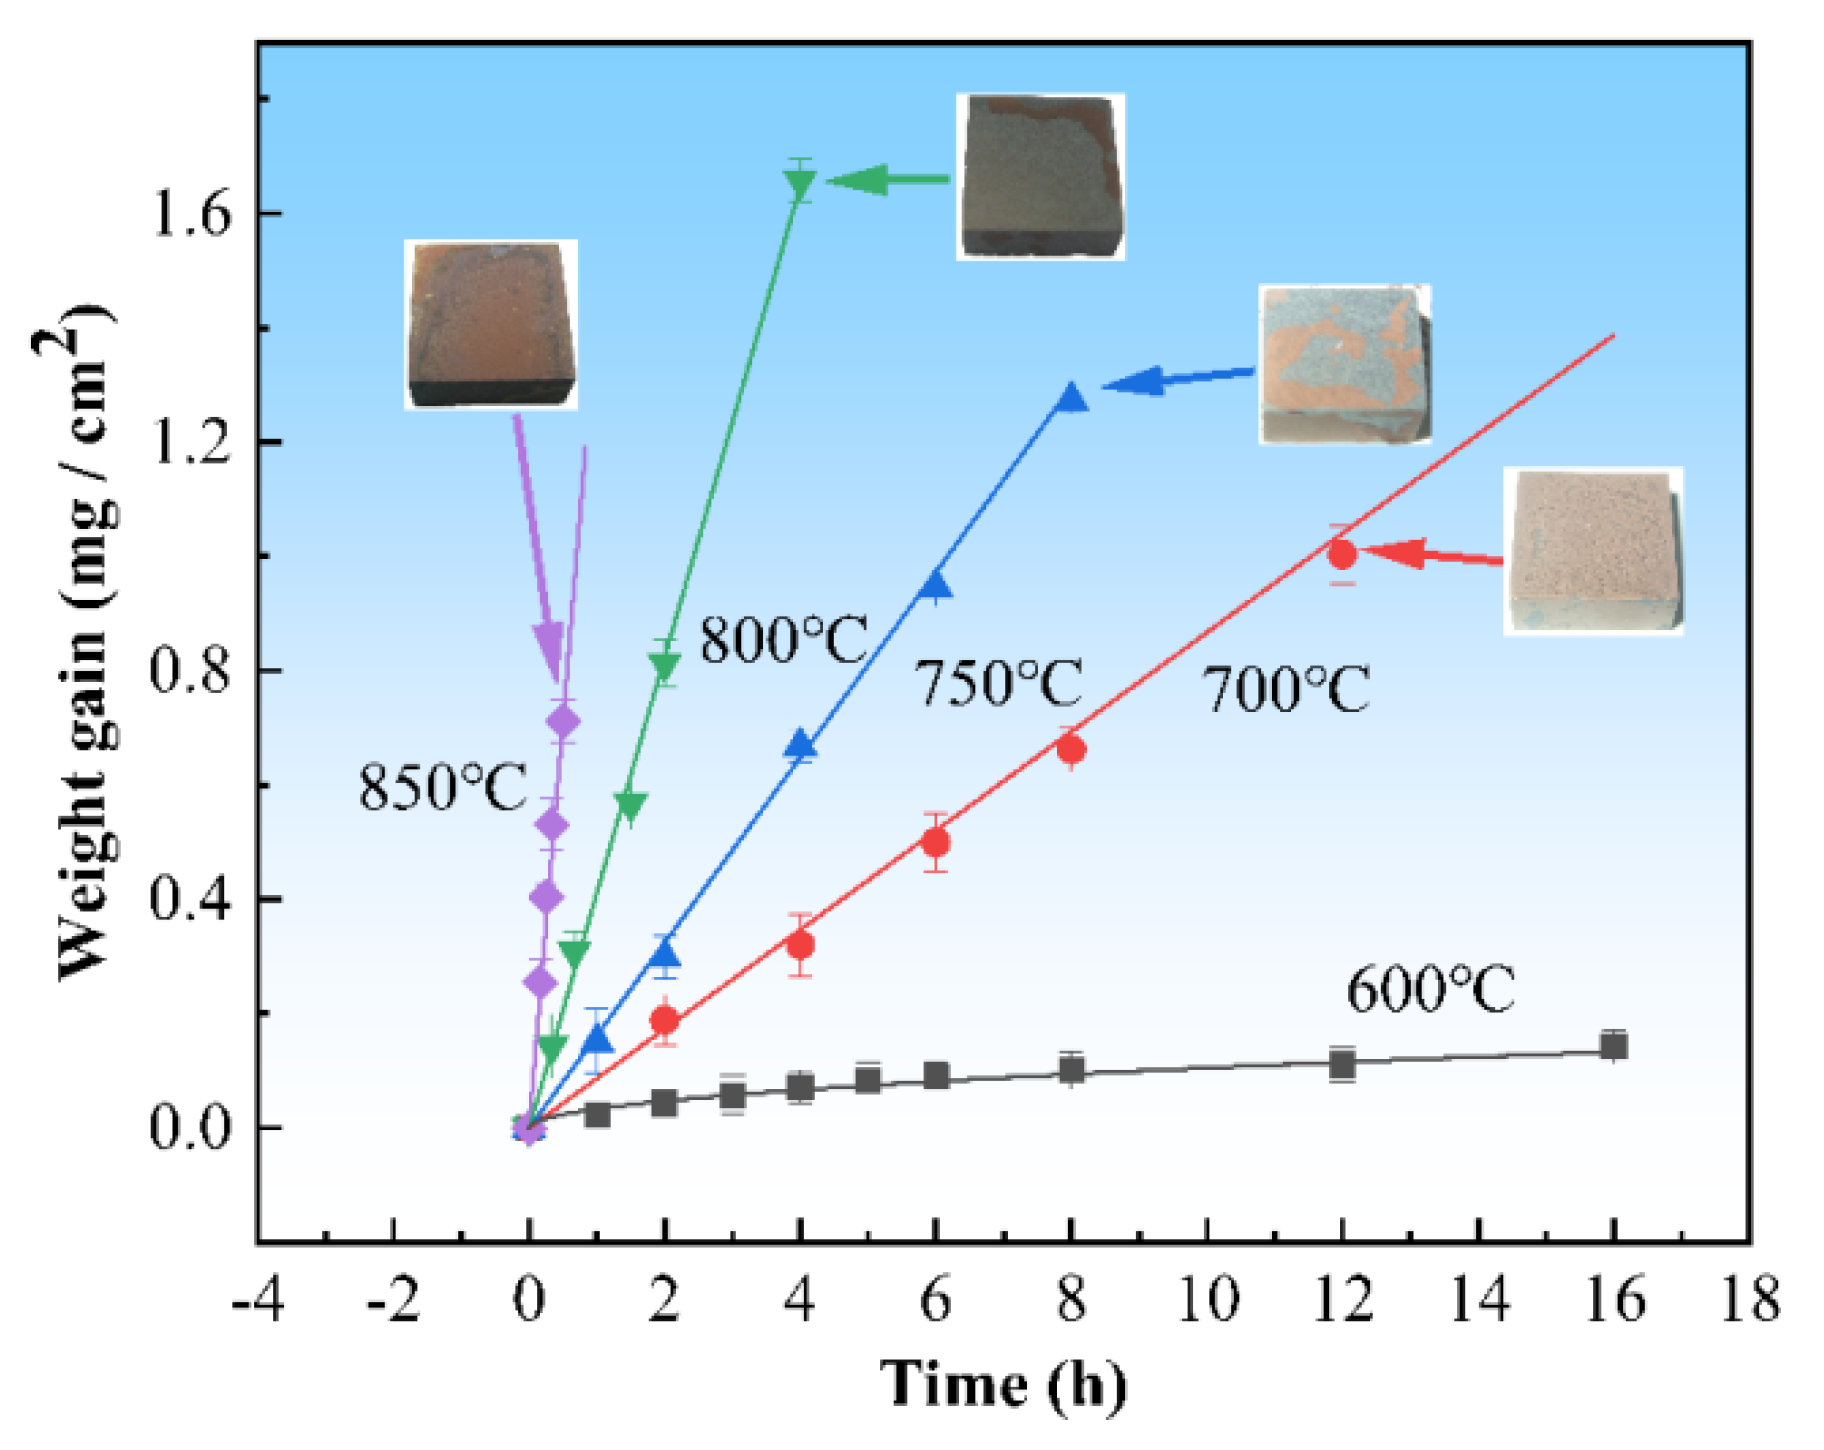
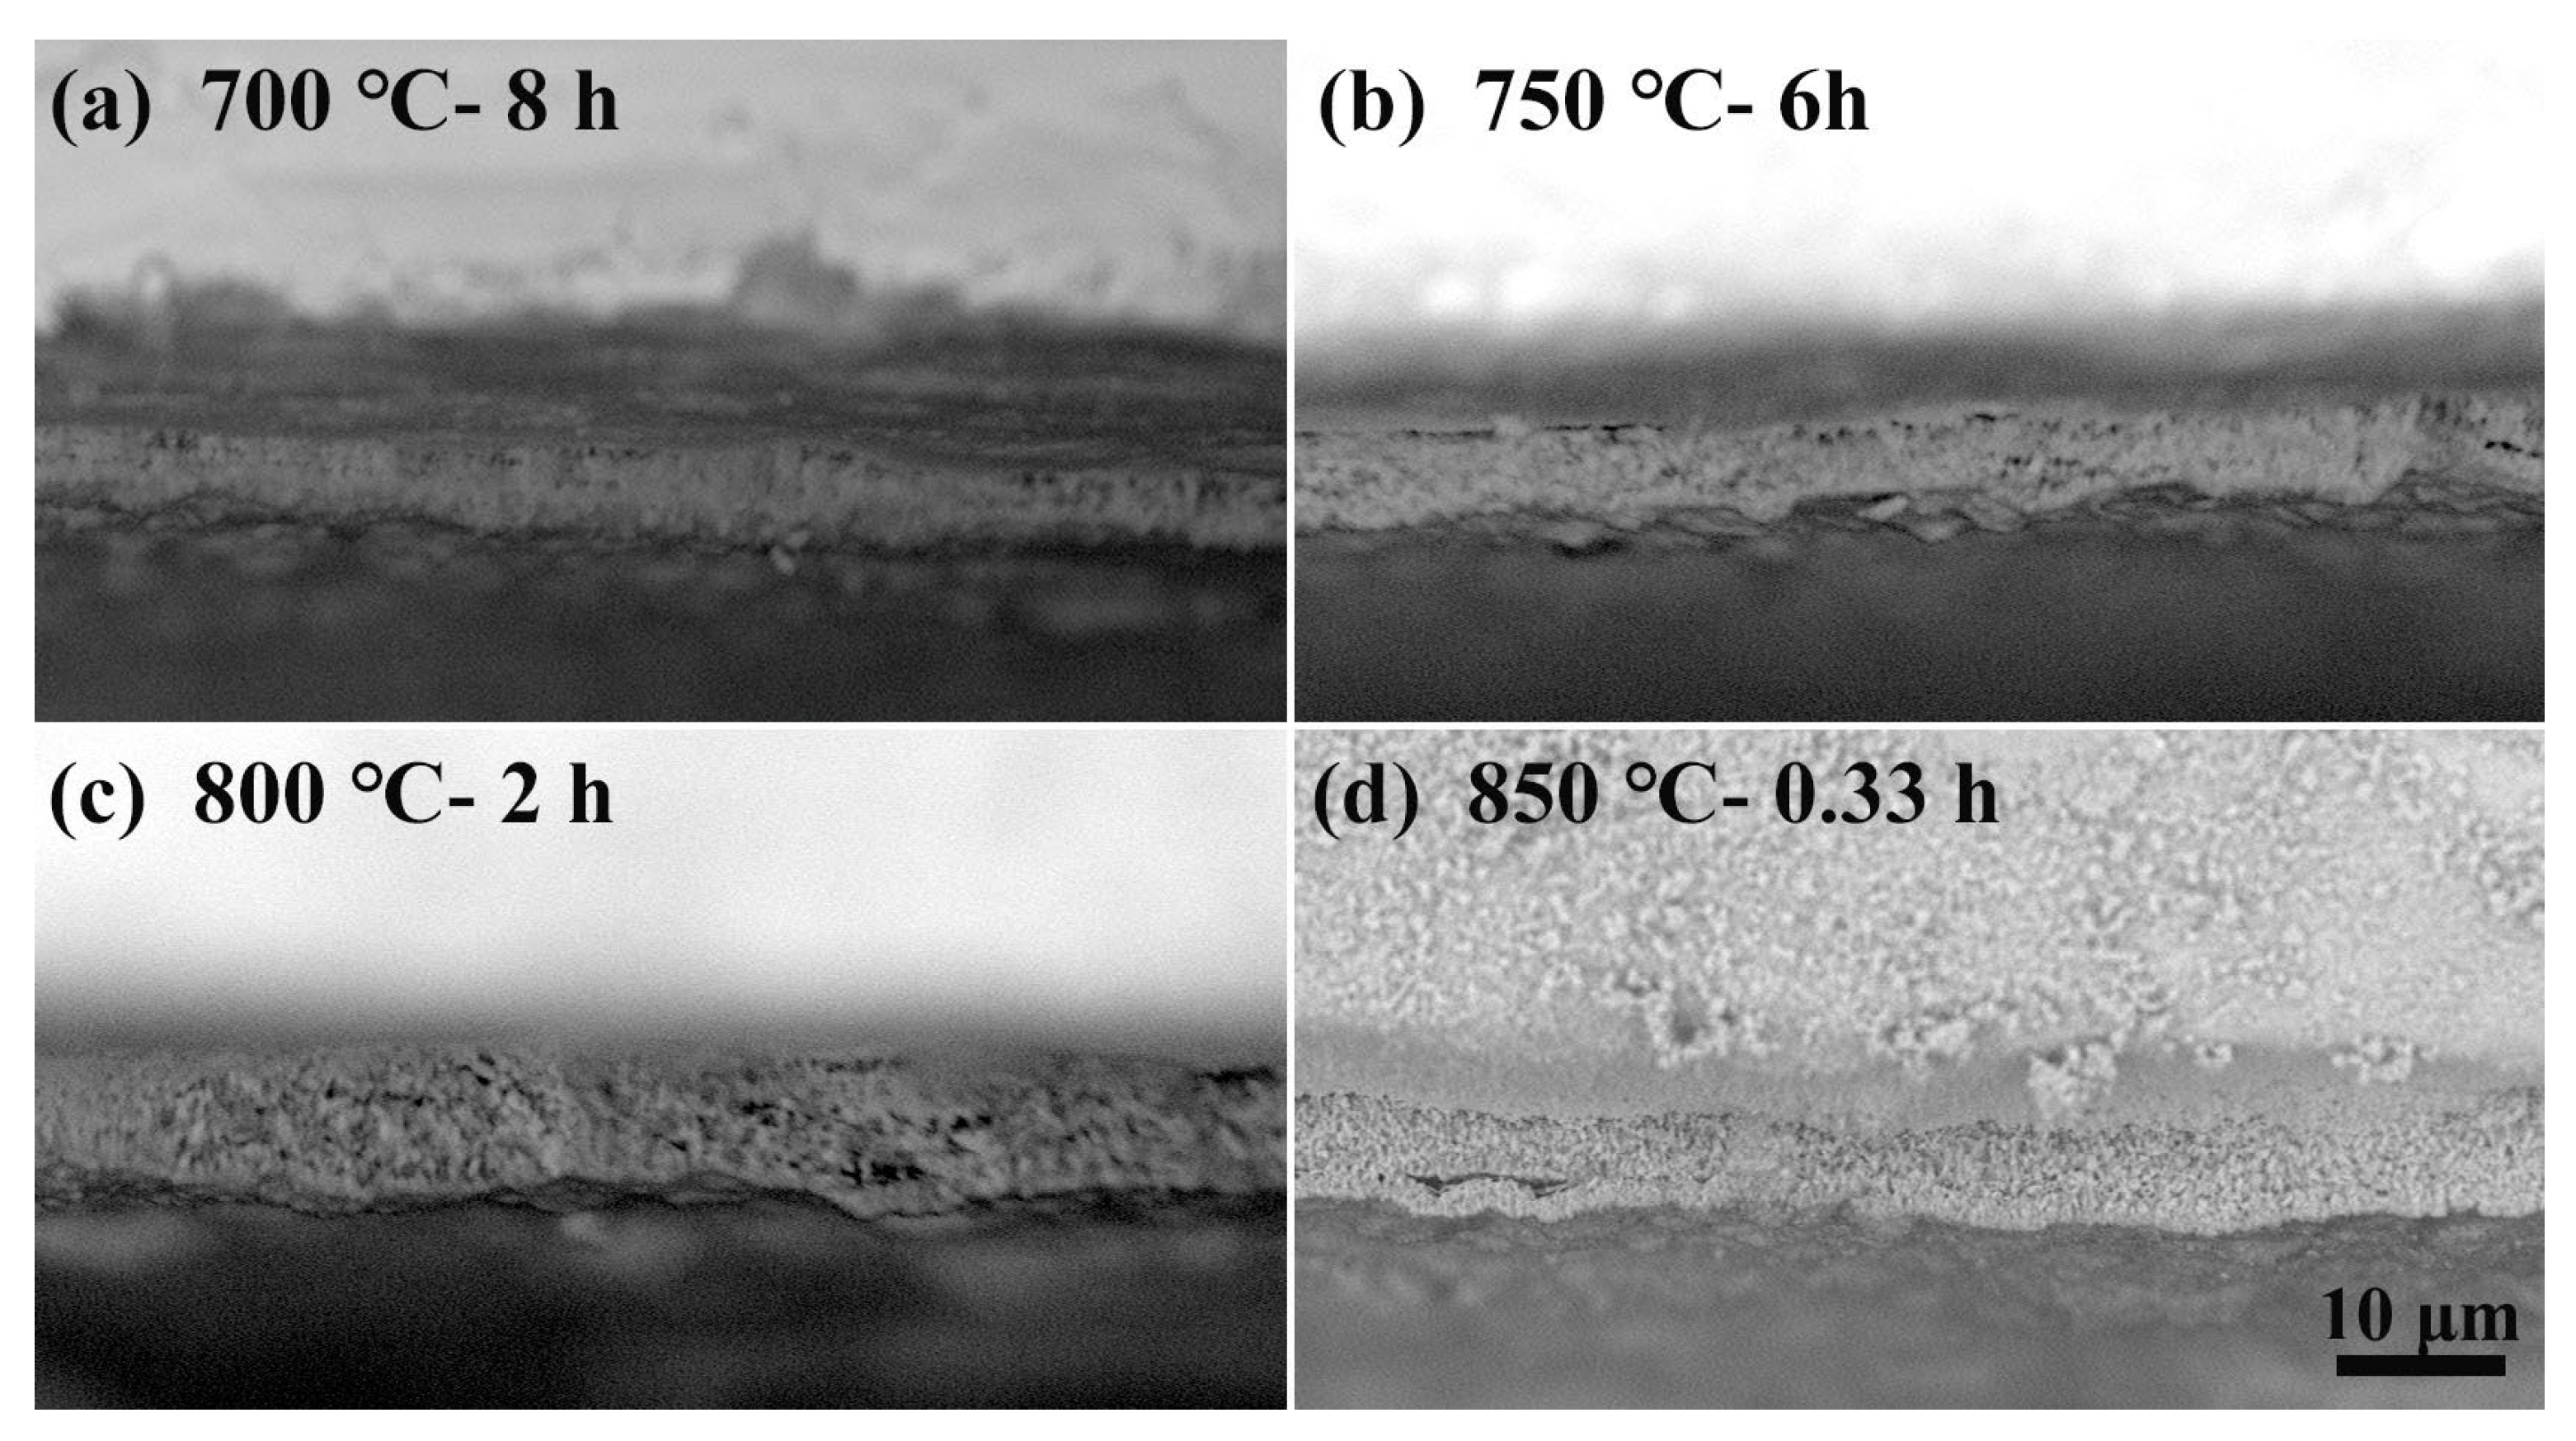
Temperature not only affects the oxidation rate and diffusion rate but also affects the mechanical properties of the substrate. The relationship between weight gain and time follows the parabolic oxidation kinetics at low temperatures (600 °C). When the temperature is raised to 700–850 °C, the relationship becomes linear. This study also showed that if the surface oxide layer is too thick, it will crack or spall after the substrate is removed from the muffle furnace. The appropriate thickness that has no cracking is ≈5–8 μm. Mechanical property test results indicate that low temperatures require longer diffusion times, which is uneconomical and leads to a greater reduction in the mechanical properties of the substrate compared to short-term treatment at high temperatures. Based on the test results, 850 °C is the preferred temperature for OBD treatment.
(2)
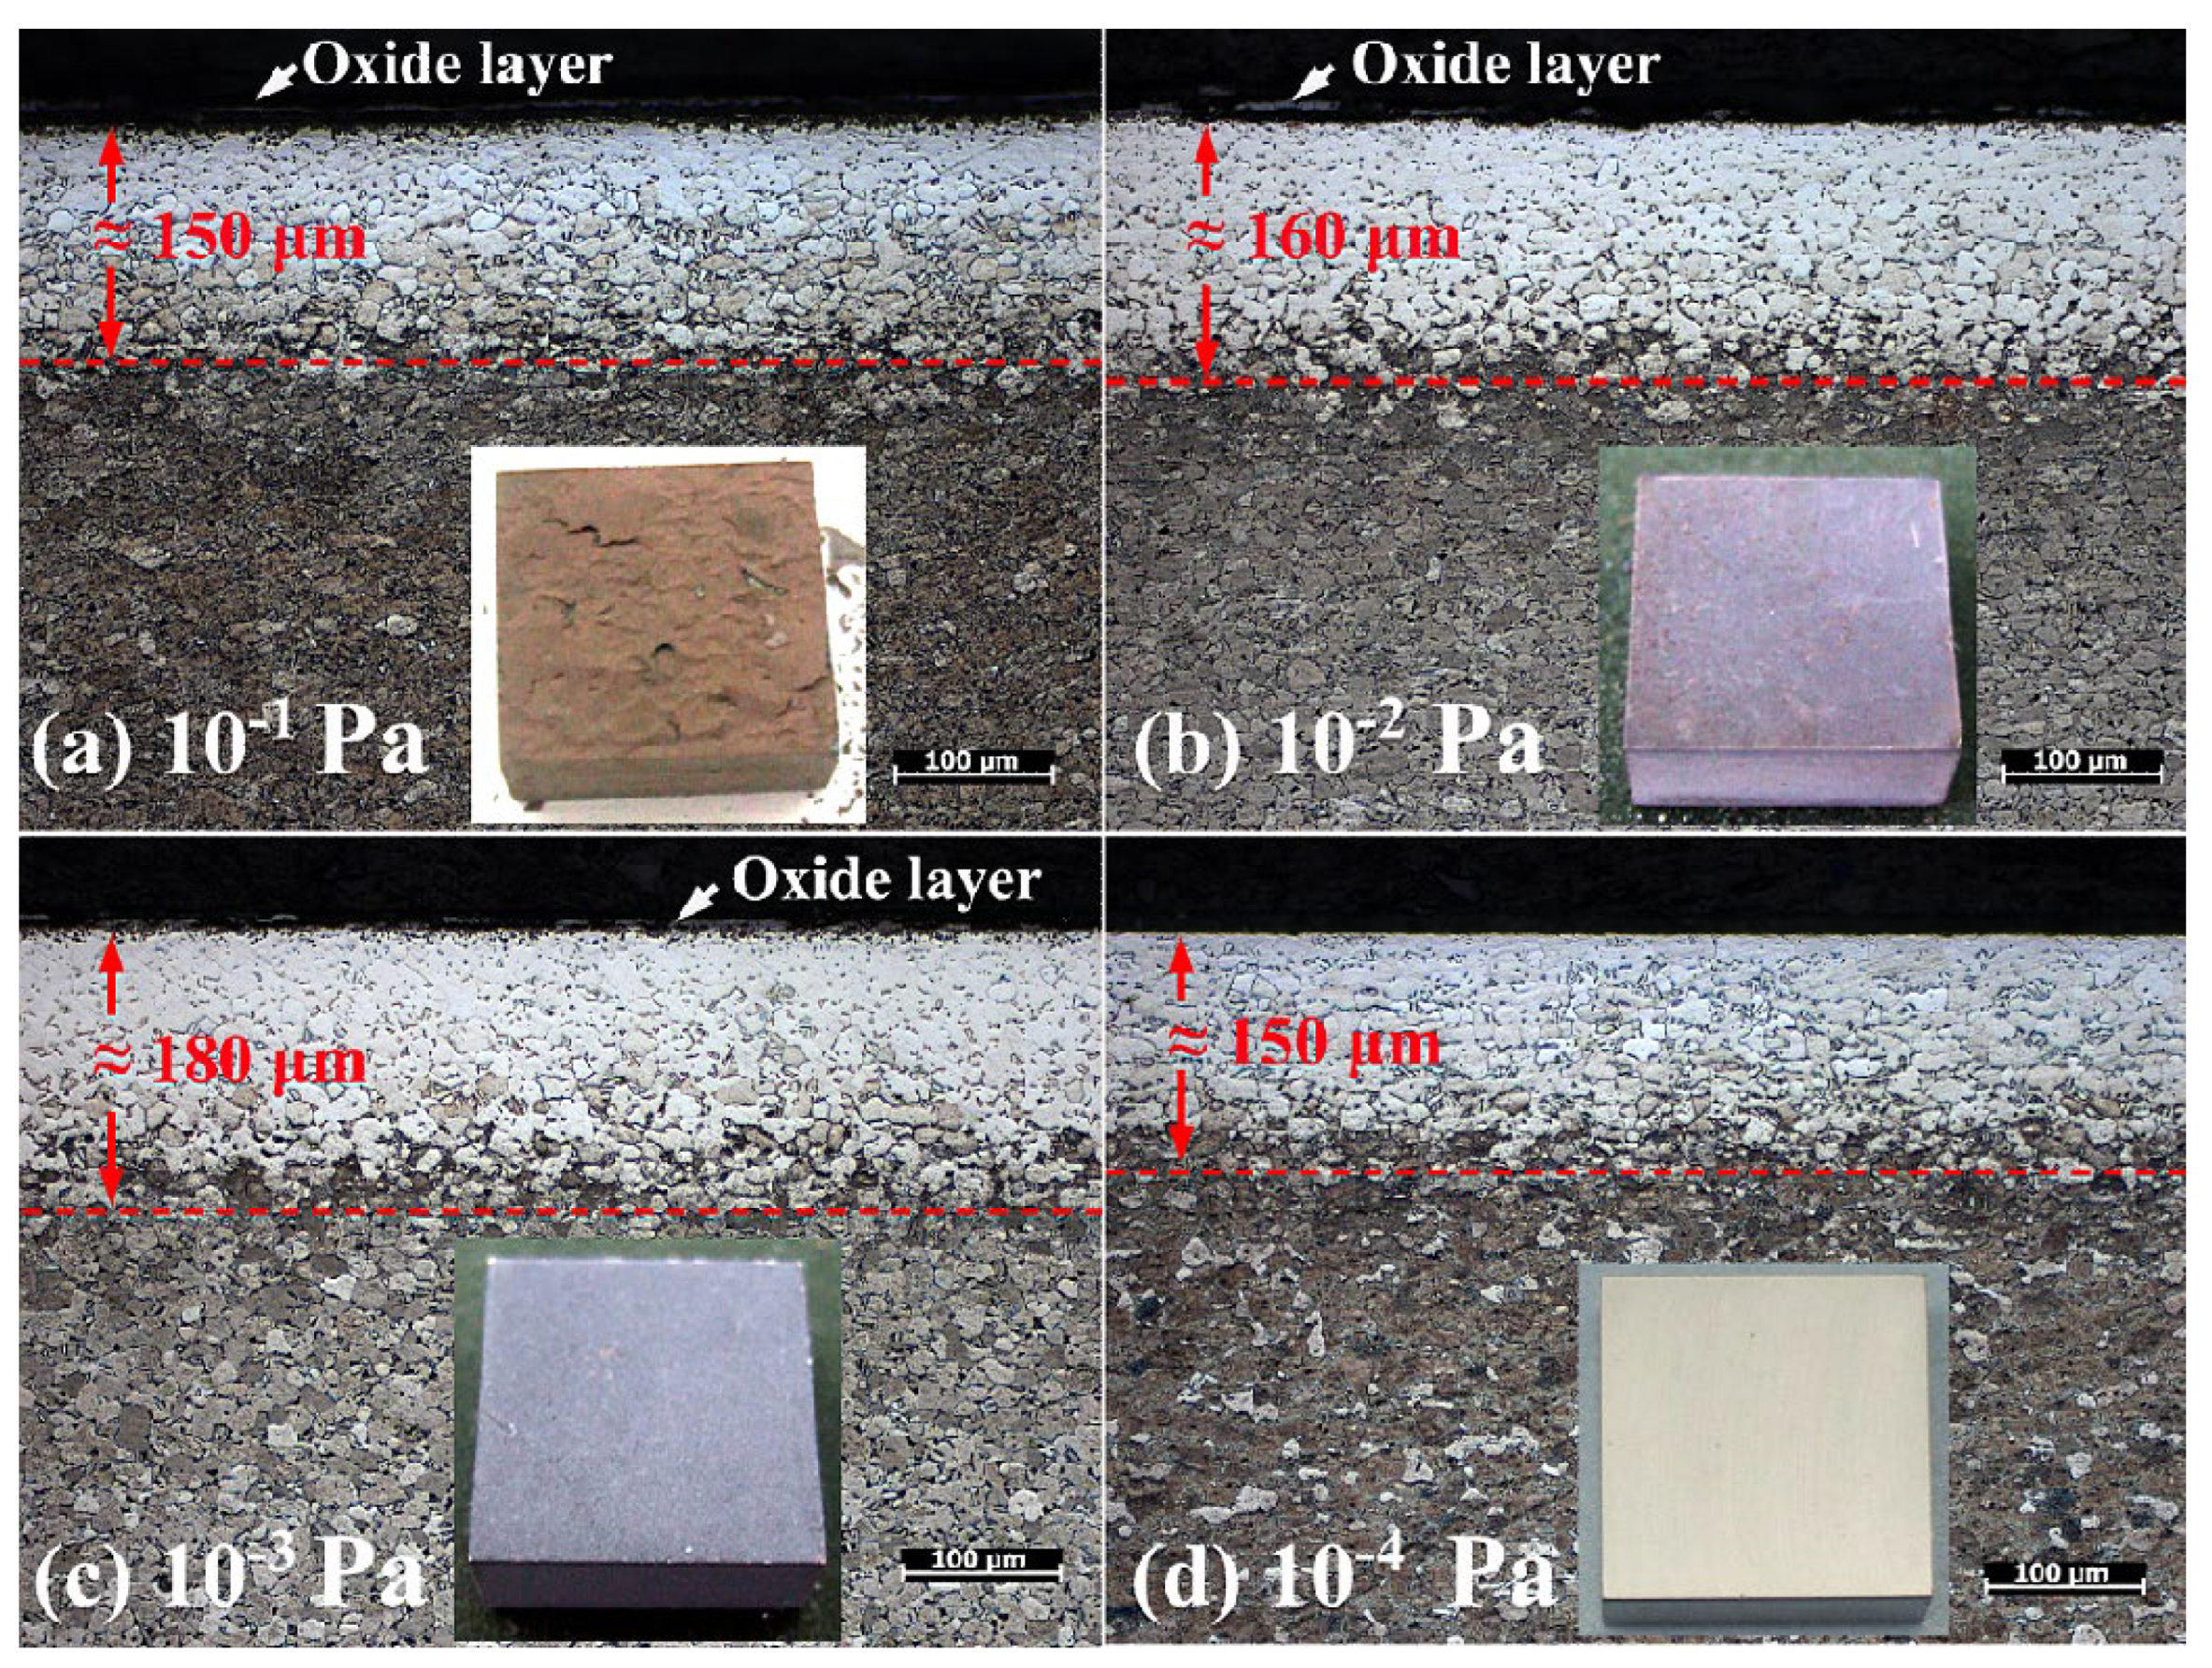
The influence of vacuum conditions on oxygen diffusion is significant. Oxygen contained in the vacuum diffusion environment can promote oxygen potential and accelerate the occurrence of diffusion to obtain a thicker OBD layer. However, if the oxygen content is too high (such as under a vacuum condition of 1 × 10⁻¹ Pa), oxidation will also be accelerated and the formed OBD layer will be consumed due to oxidation, resulting in a final OBD layer that is ≈150 μm thick and has an outermost cracked layer and a significant oxide layer on the surface. Except for an increase in the thickness to ≈160 μm under moderate vacuum conditions (such as 1 × 10⁻² Pa), both the cracked layer and the oxide layer still exist. The OBD layer obtained under the 1 × 10⁻³ Pa vacuum condition has the highest thickness (≈180 μm), hardness and no cracked surface layer; however, it also has a remaining oxide layer. Though the OBD layer obtained under the 1 × 10⁻⁴ Pa vacuum condition is slightly thinner, it has no remaining oxide layer. These results indicate that during the diffusion process, the vacuum condition should not be lower than 1 × 10⁻⁴ Pa.
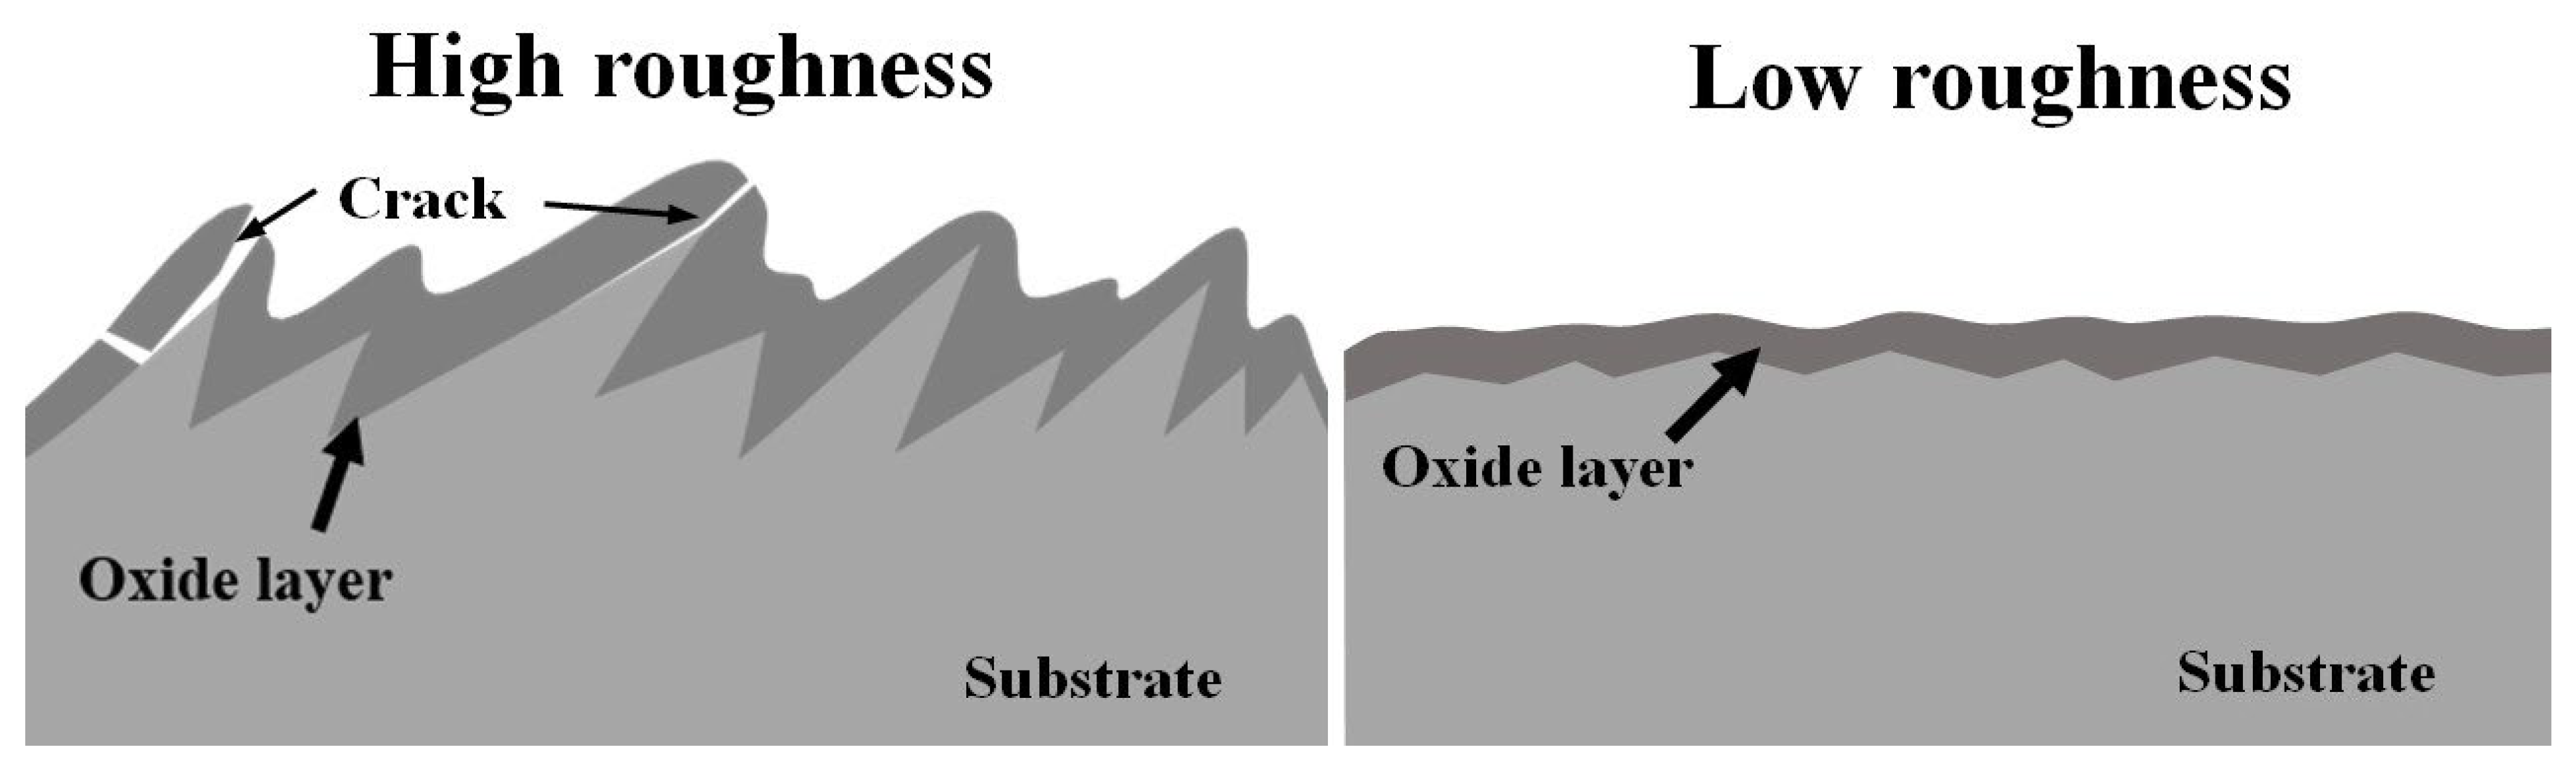
(3)
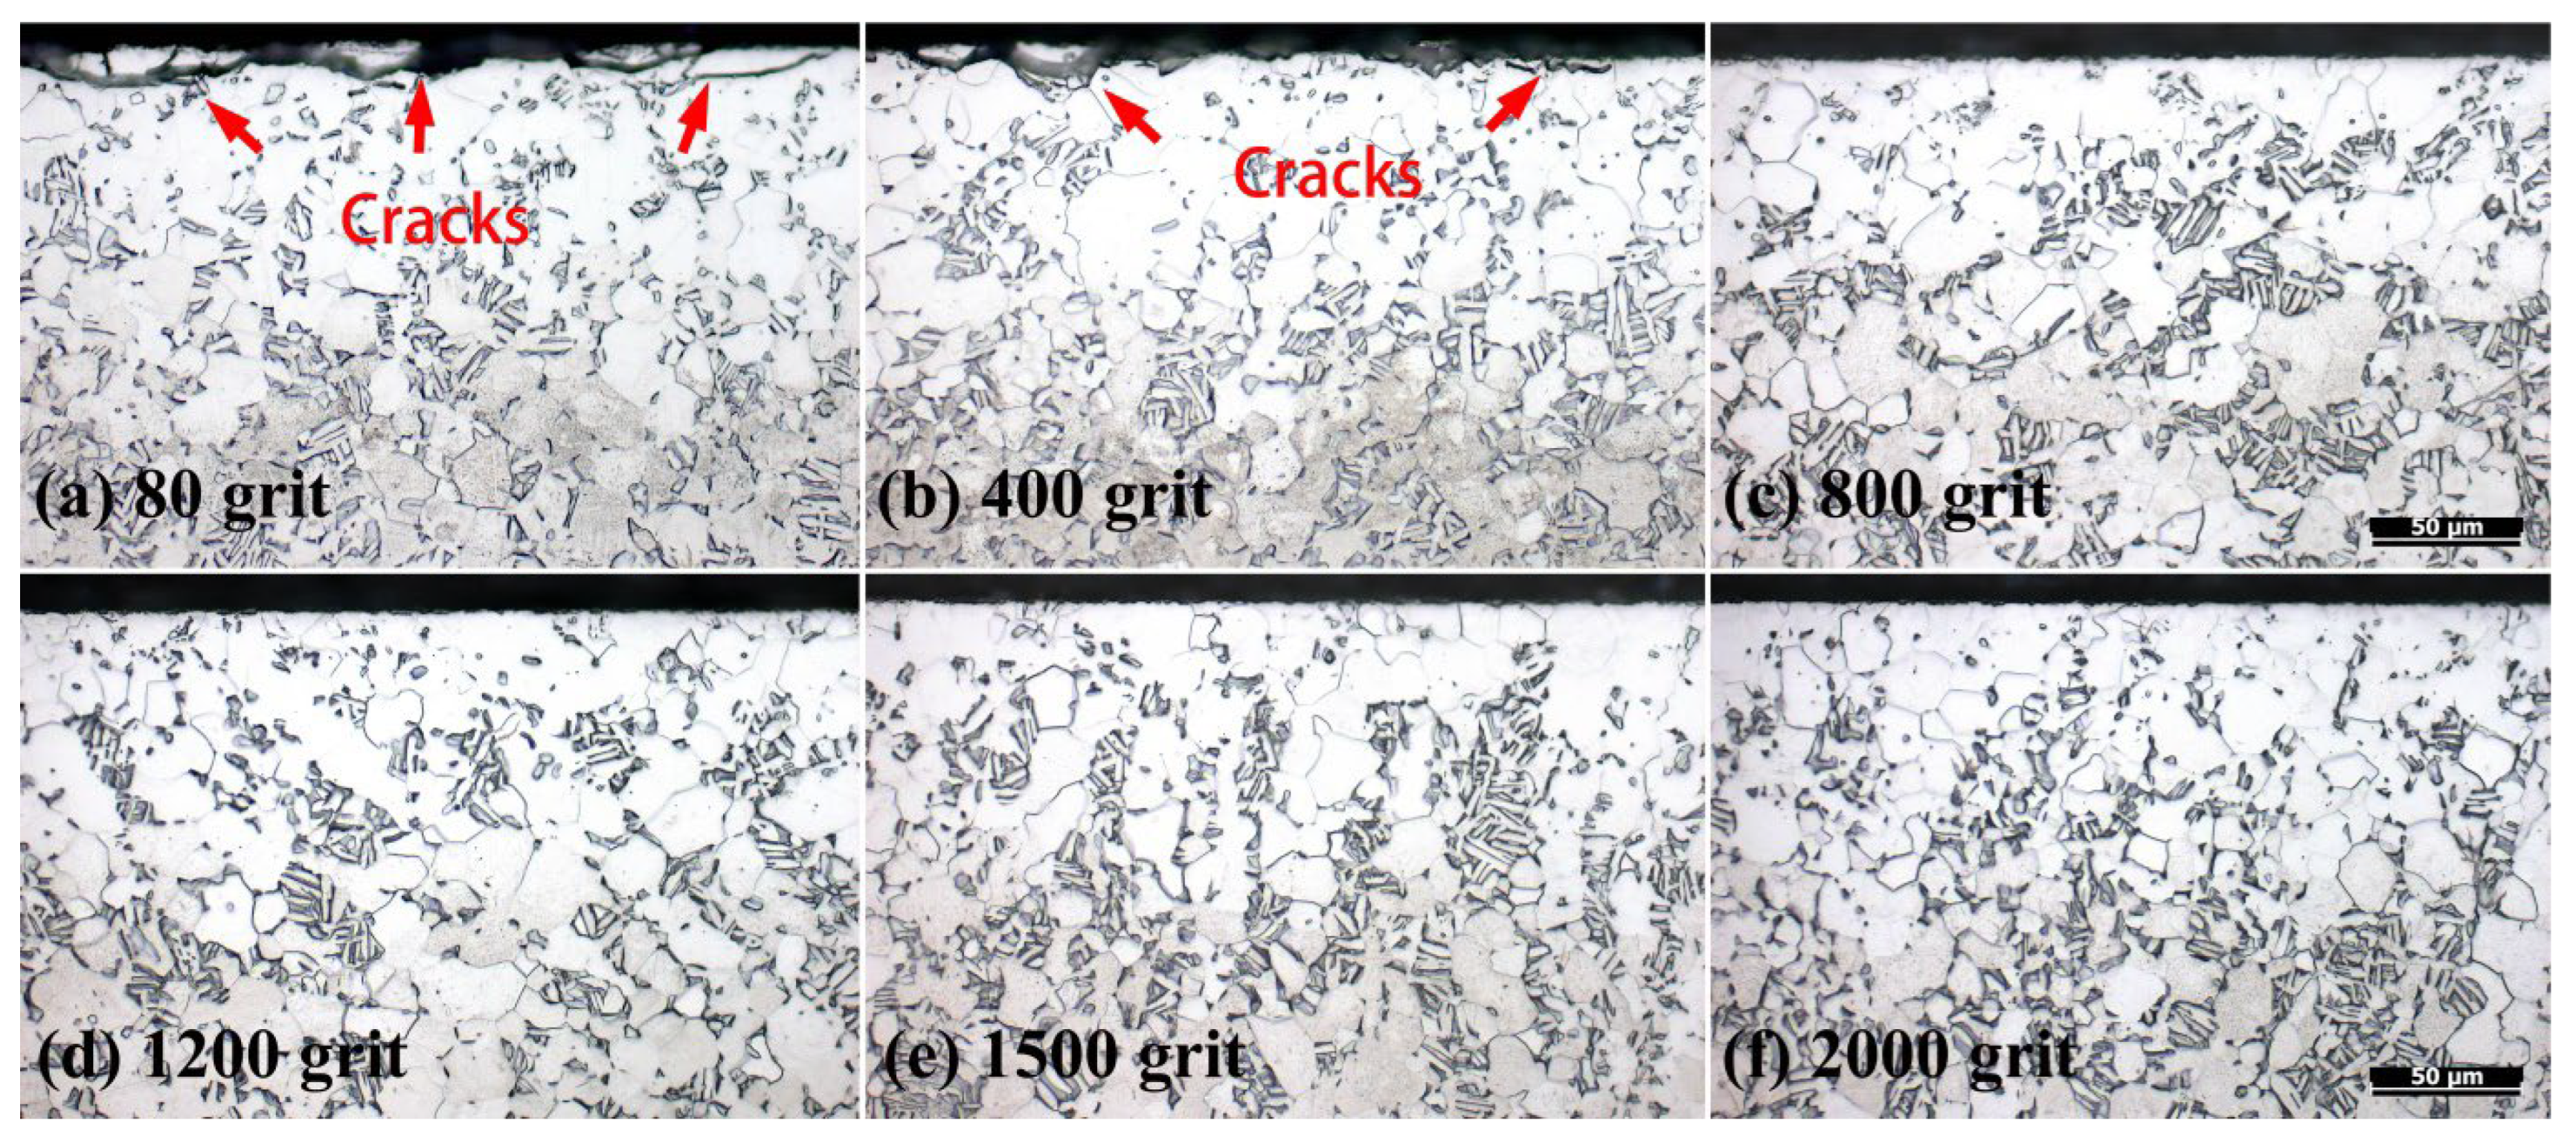
Surface roughness does not affect the thickness of the OBD layer, but it does affect the surface quality of the OBD layer. When the surface roughness is too high, mutual compression of the oxide layer at sharp locations will induce cracking of the oxide layer during the oxidation process; the outermost surface of the OBD layer will also crack during the diffusion process. Based on the experimental results, the appropriate surface roughness is Ra ≤ 0.132 (equivalent to polishing with sandpaper that is no coarser than 800#).

Author Contributions

Methodology, Writing—original draft, Y.X.: Investigation, Y.J.: Conceptualization, methodology, supervision, writing—review and editing, J.X.: Investigation, Q.X.: Validation, H.F.: Validation, Y.L.: Data curation, J.G. All authors have read and agreed to the published version of the manuscript.

Funding

The work was supported by the Postgraduate Research & Practice Innovation Program of Jiangsu Province (SJCX21-0526).

Institutional Review Board Statement

Not applicable.

Informed Consent Statement

Not applicable.

Data Availability Statement

Data are contained within the article.

Conflicts of Interest

The authors declare no conflict of interest.

References

  1. Williams, J.C.; Starke, E.A. Progress in structural materials for aerospace systems. Acta Mater. 2003, 51, 5775–5799. [Google Scholar] [CrossRef]
  2. Poondla, N.; Srivatsan, T.S.; Patnaik, A.; Petraroli, M. A study of the microstructure and hardness of two titanium alloys: Commercially pure and Ti–6Al–4V. J. Alloys Comp. 2009, 486, 162–167. [Google Scholar] [CrossRef]
  3. Banerjee, D.; Williams, J.C. Perspectives on titanium science and technology. Acta Mater. 2013, 61, 844–879. [Google Scholar] [CrossRef]
  4. Khorasani, A.M.; Goldberg, M.; Doeven, E.H.; Littlefair, G. Titanium in biomedical applications—Properties and fabrication: A review. J. Biomater. Tissue Eng. 2015, 5, 593–619. [Google Scholar] [CrossRef]
  5. Dong, H.; Bell, T. Enhanced wear resistance of titanium surfaces by a new thermal oxidation treatment. Wear 2000, 238, 131–137. [Google Scholar] [CrossRef]
  6. Bloyce, A.; Morton, P.H.; Bell, T. Surface Engineering; ASM: Metals Park, OH, USA, 1994; Volume 5, pp. 835–851. [Google Scholar]
  7. Bell, T.; Dong, H. Tribological enhancement of titanium alloys. In Proceedings of the First Asia International Conference on Tribology; Tsinghua University Press: Beijing, China, 1998; pp. 421–427. [Google Scholar]
  8. Hutson, A.L.; Niinomi, M.; Nicholas, T.; Eylon, D. Effect of various surface conditions on fretting fatigue behavior of Ti–6Al–4V. Int. J. Fatigue 2002, 24, 1223–1234. [Google Scholar] [CrossRef]
  9. Taheridoustabad, I.; Khosravi, M.; Yaghoubinezhad, Y. Fabrication of GO/RGO/TiC/TiB2 nanocomposite coating on Ti–6Al–4V alloy using electrical discharge coating and exploring its tribological properties. Tribol Int. 2021, 156, 106860. [Google Scholar] [CrossRef]
  10. Zhao, Y.; Lu, M.; Fan, Z.; Huang, S.; Huang, H. Laser deposition of wear-resistant titanium oxynitride/titanium composite coatings on Ti-6Al-4V alloy. Appl. Surf. Sci. 2020, 531, 147212. [Google Scholar] [CrossRef]
  11. Yang, Q.; Zhou, W.L.; Niu, Z.Q.; Zheng, X.B.; Wang, Q.; Wang, C.L.; Cao, Z.W.; Fu, X.S.; Chen, G.Q.; Li, Z.Q. Effect of different surface asperities and surface hardness induced by shot-peening on the fretting wear behavior of Ti-6Al-4V. Surf. Coat. Technol. 2018, 349, 1098–1106. [Google Scholar] [CrossRef]
  12. Tsuji, N.; Tanaka, S.; Takasugi, T. Effects of combined plasma-carburizing and shot-peening on fatigue and wear properties of Ti–6Al–4V alloy. Surf. Coat. Technol. 2009, 203, 1400–1405. [Google Scholar] [CrossRef]
  13. Dalili, N.; Edrisy, A.; Farokhzadeh, K.; Li, J.; Riahi, A.R. Improving the wear resistance of Ti–6Al–4V/TiC composites through thermal oxidation (TO). Wear 2010, 269, 590–601. [Google Scholar] [CrossRef]
  14. Dong, H.; Li, X.Y. Oxygen boost diffusion for the deep-case hardening of titanium alloys. Mater. Sci. Eng. A 2000, 280, 303–310. [Google Scholar] [CrossRef]
  15. Zhao, X.; Zhang, H.; Liu, H.; Li, S.; Wang, X. In vitro bio-tribological behaviour of textured nitride coating on selective laser melted Ti-6Al-4V alloy. Surf. Coat. Technol. 2021, 409, 126904. [Google Scholar] [CrossRef]
  16. Belkin, P.N.; Kusmanov, S.A.; Dyakov, I.G.; Komissarova, M.R.; Parfenyuk, V.I. Anode plasma electrolytic carburizing of commercial pure titanium. Surf. Coat. Technol. 2016, 307, 1303–1309. [Google Scholar] [CrossRef]
  17. Streicher, R.M.; Weber, H.; Schon, R.; Semlitsch, M. New surface modification for Ti-6Al-7Nb alloy: Oxygen diffusion hardening (0DH). Biomaterials 1991, 12, 125–129. [Google Scholar] [CrossRef] [PubMed]
  18. Dong, H.; Bloyce, A.; Morton, P.H.; Bell, T. Surface Oxidation of a Titanium or Titanium Alloy Article. U.S. Patent 6,210,807, 3 April 2001. [Google Scholar]
  19. Dong, H.; Bloyce, A.; Morton, P.H.; Bell, T. Surface engineering to improve tribological performance of Ti–6Al–4V. Surf. Eng. 1997, 13, 402–406. [Google Scholar] [CrossRef]
  20. Yazdi, R.; Ghasemi, H.M.; Abedini, M.; Wang, C.; Neville, A. OBD layer on Ti–6Al–4V alloy: Scratch and dry wear resistance. Tribol Lett. 2019, 67, 101. [Google Scholar] [CrossRef]
  21. Ebrahimi, A.R.; Zarei, F.; Khosroshahi, R.A. Effect of thermal oxidation process on fatigue behavior of Ti-4Al-2V alloy. Surf. Coat. Technol. 2008, 203, 199–203. [Google Scholar] [CrossRef]
  22. Takahashi, K.; Sato, E. Influence of surface treatments on fatigue strength of Ti6Al4V alloy. Mater. Trans. 2010, 51, 694–698. [Google Scholar] [CrossRef]
  23. Omidbakhsh, F.; Ebrahimi, A.R.; Mousavi, S.H.; Khosroshahi, R.A.; Nazarpour, S. Effect of oxygen boost diffusion treatment on fatigue behavior of Ti–4Al–2V alloy. Surf. Coat. Technol. 2011, 205, 2954–2963. [Google Scholar] [CrossRef]
  24. Zhang, Z.X.; Dong, H.; Bell, T.; Xu, B. The effect of treatment condition on boost diffusion of thermally oxidised titanium alloy. J. Alloys Compd. 2007, 431, 93–99. [Google Scholar] [CrossRef]
  25. Hurlen, T. Oxidation of titanium. J. Inst. Met. 1960, 89, 128–136. [Google Scholar]
  26. Robertson, J.; Manning, M.I. Limits to adherence of oxide scales. Mater. Sci. Technol. 1990, 6, 81–92. [Google Scholar] [CrossRef]
  27. Deadmore, D.L.; Lowell, C.E. The effect of ΔT (oxidizing temperature minus cooling temperature) on oxide spallation. Oxid. Met. 1977, 11, 91–106. [Google Scholar] [CrossRef]
  28. Jia, Y.F.; Pan, R.J.; Zhang, P.Y.; Sun, Z.T.; Chen, X.R.; Zhang, X.C.; Wu, X.J. Enhanced surface strengthening of titanium treated by combined surface deep-rolling and oxygen boost diffusion technique. Corros. Sci. 2019, 157, 256–267. [Google Scholar] [CrossRef]
  29. “Titanium Dioxide—Titania (TiO2)”. Azo Materials. 11 January 2002. Available online: www.azom.com/properties.aspx?ArticleID=1179 (accessed on 3 November 2023).
  30. “GRADE 5 (R56400) Ti-6Al-4V”. Usa-Titanium. 26 September 2016. Available online: www.usa-titanium.com/grade-5-r56400-ti-6al-4v (accessed on 3 November 2023).
  31. Coddet, C.; Craze, A.M.; Beranger, G. Measurements of the adhesion of thermal oxide films: Application to the oxidation of titanium. J. Mater. Sci. 1987, 22, 2969–2974. [Google Scholar] [CrossRef]
  32. ASTM E915-2010; Standard Test Method for Verifying the Alignment of X-ray Diffraction Instrumentation for Residual Stress Measurement. ASTM: West Conshohocken, PA, USA, 2010.
  33. Jiang, Y.; Mao, H.R.; Wang, X.W.; Lu, Y.L.; Gong, J.M. Effect of oxygen boost diffusion treatment on the mechanical properties of Ti-6Al-4V alloy. Surf. Interfaces 2021, 25, 101248. [Google Scholar] [CrossRef]
  34. Li, Z.; Qian, S.; Wang, W. Influence of superalloy substrate roughness on adhesion and oxidation behavior of magnetron-sputtered NiCoCrAlY coatings. Appl. Surf. Sci. 2011, 257, 10414–10420. [Google Scholar] [CrossRef]
  35. Zhang, Z.G.; Hou, P.Y.; Gesmundo, F.; Niu, Y. Effect of surface roughness on the development of protective Al2O3 on Fe–10Al (at.%) alloys containing 0–10 at.% Cr. Appl. Surf. Sci. 2006, 253, 881–888. [Google Scholar] [CrossRef]
  36. Nowak, W.J.; Wierzba, B. Effect of surface treatment on high-temperature oxidation behavior of IN 713C. J. Mater. Eng. Perform. 2018, 27, 5280–5290. [Google Scholar] [CrossRef]
Figure 1. The variation in normalized weight gain (mg/cm2) with respect to oxidation time and temperature.
Coatings 14 00314 g001
Figure 2. Cross-sectional SEM graphs of the specimens oxidized at (a) 700 °C for 8 h, (b) 750 °C for 6 h, (c) 800 °C for 2 h and (d) 850 °C for 0.33 h.
Coatings 14 00314 g002
Figure 3. Metallographic images of specimens after oxidation and diffusion at different temperatures.
Coatings 14 00314 g003
Figure 4. Hardness (a) and oxygen content distribution (b) along the cross-sectional direction under different diffusion conditions.
Coatings 14 00314 g004
Figure 5. (a) Surface cracking of metallographic specimen diffused at 800 °C for 80 h (OM photo). (b) surface characteristics of the specimen diffused at 800 °C for 80 h (SEM photo).
Coatings 14 00314 g005
Figure 6. Tensile curve of Ti–6Al–4V specimens after different heat treatments.
Coatings 14 00314 g006
Figure 7. Cross-sectional metallographic images of specimens diffused under different vacuum conditions.
Coatings 14 00314 g007
Figure 8. Hardness (a) and linear analysis of oxygen content distribution (b) along cross-sections of OBD layers formed under different vacuum conditions.
Coatings 14 00314 g008
Figure 9. Surface and cross-sectional characteristics of the OBD layer.
Coatings 14 00314 g009
Figure 10. Results of surface elemental EDX analysis.
Coatings 14 00314 g010
Figure 11. AFM 3D surface images and 2D surface topography curves of specimens after grinding using SiC papers: (a) 80 grit, (b) 800 grit and (c) 2000 grit.
Coatings 14 00314 g011
Figure 12. Characteristics of surface oxide layers.
Coatings 14 00314 g012
Figure 13. Thicknesses of surface oxide layers.
Coatings 14 00314 g013
Figure 14. A schematic diagram of cracking and detachment of the oxide layer.
Coatings 14 00314 g014
Figure 15. Thicknesses of the OBD layer of specimens with different surface roughness.
Coatings 14 00314 g015
Figure 16. Enlarged outmost surface characteristics of specimen with different surface roughness.
Coatings 14 00314 g016
Table 1. The surface character of each specimen.
SandpaperRa/μmAreal/μm2Ain/%
80 grit0.46326275.08
400 grit0.26725763.04
800 grit0.13225491.96
1200 grit0.10225180.72
1500 grit0.08325090.36
2000 grit0.07625060.24
Disclaimer/Publisher’s Note: The statements, opinions and data contained in all publications are solely those of the individual author(s) and contributor(s) and not of MDPI and/or the editor(s). MDPI and/or the editor(s) disclaim responsibility for any injury to people or property resulting from any ideas, methods, instructions or products referred to in the content.

