Article

Experimental Study on Tribological Properties of Coated Surface and Textured Surface under Seawater Lubrication Conditions

1
School of Mechanical Engineering, Yanshan University, Qinhuangdao 066004, China
2
State Key Laboratory of Lifting Machinery, Yanshan University, Qinhuangdao 066004, China
*
Authors to whom correspondence should be addressed.
Coatings 2024, 14(4), 415; https://doi.org/10.3390/coatings14040415
Submission received: 13 February 2024 / Revised: 27 March 2024 / Accepted: 29 March 2024 / Published: 30 March 2024
(This article belongs to the Section Tribology)

Abstract

:
In order to improve the tribological properties of the flow distribution pair of the seawater axial piston pump, SAF2507 super duplex stainless steel and carbon-fiber-reinforced polyetheretherketone (CF/PEEK) were selected as the matching materials. The surface coating treatment and surface texture treatment were carried out on the flow distribution pair, and the friction and wear test were carried out by MMD-5A. In order to fully understand the friction and wear properties of the surface coating flow distribution pair and the surface texture flow distribution pair, and analyze the friction and wear mechanism, the data of the friction coefficient, wear loss, and wear surface morphology were obtained in the experiment. The results show that the coating surface has little difference in the test, the texture surface significantly reduces the friction coefficient, and the wear scar density is significantly reduced. Adding texture to the surface of the lower sample is better than adding it to the surface of the upper sample. The research results are helpful in improving the tribological performance of the flow distribution pair of the seawater axial piston pump.

1. Introduction

The seawater axial piston pump is the core power component of the seawater hydraulic transmission system [1]. For remote islands or areas where conventional energy is difficult to reach, the seawater axial piston pump becomes one of the ideal power sources. Under seawater conditions, the lubricating medium not only contains a variety of inorganic salts mainly composed of NaCl, but also contains dissolved oxygen, particulate organic matter, and humic substances including humic acid. At the same time, seawater has a low viscosity, poor lubricity, strong corrosivity, and high vaporization pressure, and contains a large number of micro-organisms [2,3,4]. Under this working condition, it has a great influence on the tribological performance of the key friction pair of the seawater axial piston pump.
Lubrication and wear are common problems of all moving friction pairs. According to statistics, more than half of the parts failures are caused by excessive friction and insufficient lubrication [5]. It can enhance the lubrication of moving parts, reduce the friction and wear of moving parts, improve the tribological performance of key friction pairs of axial piston pumps, improve the reliability of the hydraulic system, and prolong the service life of the hydraulic system. There are many methods for improving the performance of the friction pair of seawater axial piston pumps, including structural improvement [6,7] and the selection of new materials [8]. However, these methods have not yet achieved the desired results.
Surface coating technology can form a coating on mechanical parts, change the physical and chemical properties of materials, effectively improve the friction and wear performance of mechanical parts, reduce material loss, and prolong the service life of machinery. Schuhler et al. [9] nitrided the surface of the sample, and added a PTFE coating and DLC + WC coating. Comparative tests were carried out under dry friction and oil lubrication conditions. The results show that the DLC + WC coating sample has the smallest wear rate in dry contact, and the surface of the nitrided sample exhibits stronger wear resistance under oil lubrication conditions. Zhao et al. [10] built a friction and wear test bench according to the motion characteristics of the cylinder/valve plate. Under oil lubrication, the two valve plates of the nitriding valve plate and the TiAlN coating valve plate were tested. The experimental results show that the friction coefficient of the TiAlN coating valve plate is 52.55%–64.9% lower than that of nitriding. The wear height of the TiAlN-coated valve plate is about 12%–14% of the nitrided one. Wu et al. [11] investigated the tribological characteristics of the different-mass Al2O3-TiO2 coatings combined with Si3N4 ceramics under silt-laden water and tap water lubrication. The tribological characteristics of the various couple pairs were researched using a ring-on-ring test rig. The experimental results show that Al2O3-13%TiO2 is the preferred coating to use in water hydraulic pumps when sliding against Si3N4. There are many studies on the friction and wear characteristics of different coatings, and there is a lack of research on the friction and wear characteristics of hydrophobic coatings.
Surface texture technology can reduce friction, reduce wear, and improve the surface lubrication bearing capacity [12,13,14]. Under dry friction conditions, surface texture can store abrasive particles and wear debris, reduce the actual contact area between friction and wear surfaces, and then play a role in reducing friction and wear [15,16,17]. During mixed or boundary lubrication, in the boundary friction state, the relative motion of the friction pair under a certain load will cause the surface to squeeze and deform, so that the lubricating fluid stored in the surface texture is squeezed out, and the surface of the friction pair is lubricated again to avoid the shortage of lubricating fluid on the friction surface [18,19]. In the state of fluid friction, the existence of the lubricating film avoids direct contact between the two friction surfaces. The surface texture can make the lubricating fluid produce hydrodynamic lubrication in the wedge gap, produce positive pressure in the convergence gap, and produce negative pressure in the divergence gap, which can enhance the bearing capacity of the lubricating film in the bearing area and improve the lubrication state [20,21,22,23]. Under the anti-friction mechanism of these three surface textures, scholars have carried out the following research: Xing et al. [24] studied the hydrodynamic lubrication of a rectangular micro-texture on sliding contact surfaces by the numerical calculation method. Based on the Reynolds equation, the theoretical model of the slider surface is established, and the oil film pressure is used to evaluate the hydrodynamic lubrication. It is found that the lubrication film pressure is related to the geometry and distribution of rectangular micro-pits. Liu et al. [25] studied the tribological properties of textured surfaces by numerical simulation and experimental research. The pressure distribution and velocity distribution of lubricating oil flow were analyzed by a three-dimensional computational fluid dynamics simulation. Then, the numerical simulation results are verified by experiments. It is found that the numerical simulation results are consistent with the experimental results, which verifies that the textured surface can achieve a significant friction reduction effect. Janssen et al. [26] applied a laser to process the circular texture on cold work steel X100CrMoV5-1, and tested it on a pin-on-disk test bench under shale oil lubrication conditions. The results show that the friction and wear generated by the textured sample can be greatly reduced, and the larger texture area rate can reduce the friction and reduce the wear of the sample. Zhang et al. [27] applied laser surface texturing technology to the valve plate. The test was carried out on the EHA pump prototype. The results show that the surface texture improves the efficiency by reducing the wear and cylinder tilt angle. The mechanical efficiency and volumetric efficiency of the prototype equipped with the textured valve plate are increased by about 2.6% and 1.4%, respectively. It should be indicated that most of the studies on surface texture focus on numerical simulation and oil lubrication conditions, and there is a lack of research under seawater lubrication.
Most of the tests on the friction pairs of axial piston pumps are designed under oil lubrication conditions, and there is a lack of friction and wear tests lubricated by seawater. The purpose of this study is to improve the tribological performance of the friction pair of the axial piston pump under seawater lubrication. The friction pair was treated by surface coating technology and surface texture technology. According to the actual working conditions, the test was carried out on the ring–disk friction and wear tester to obtain the test data such as friction force and friction coefficient. After the test, the surface morphology of the sample was observed and the wear loss of the sample was measured. All the data before and after the test were compared and analyzed to explore the main mechanism of the two technologies in reducing friction and wear resistance.

2. Materials and Methods

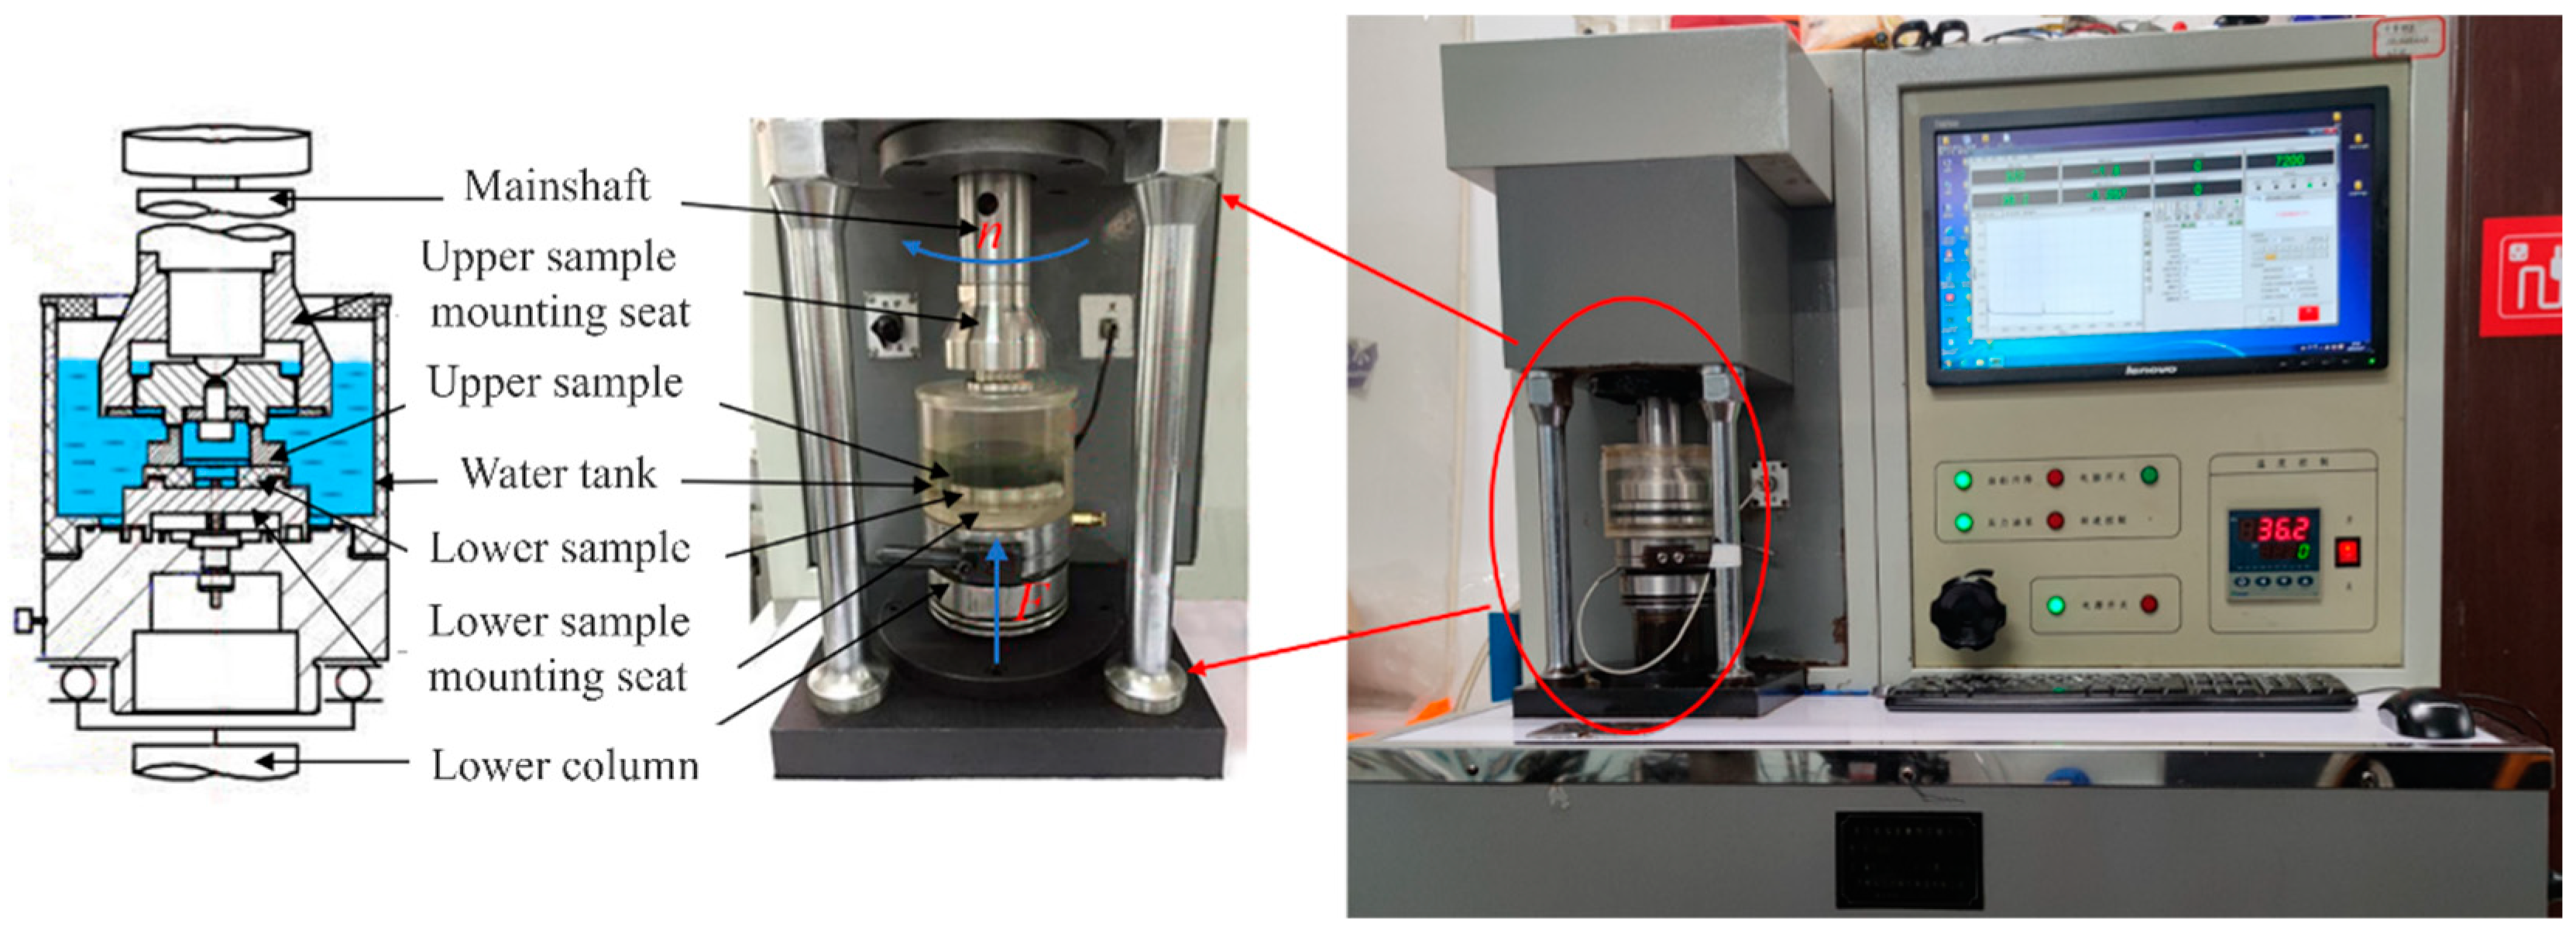
2.1. Experimental Set-Up
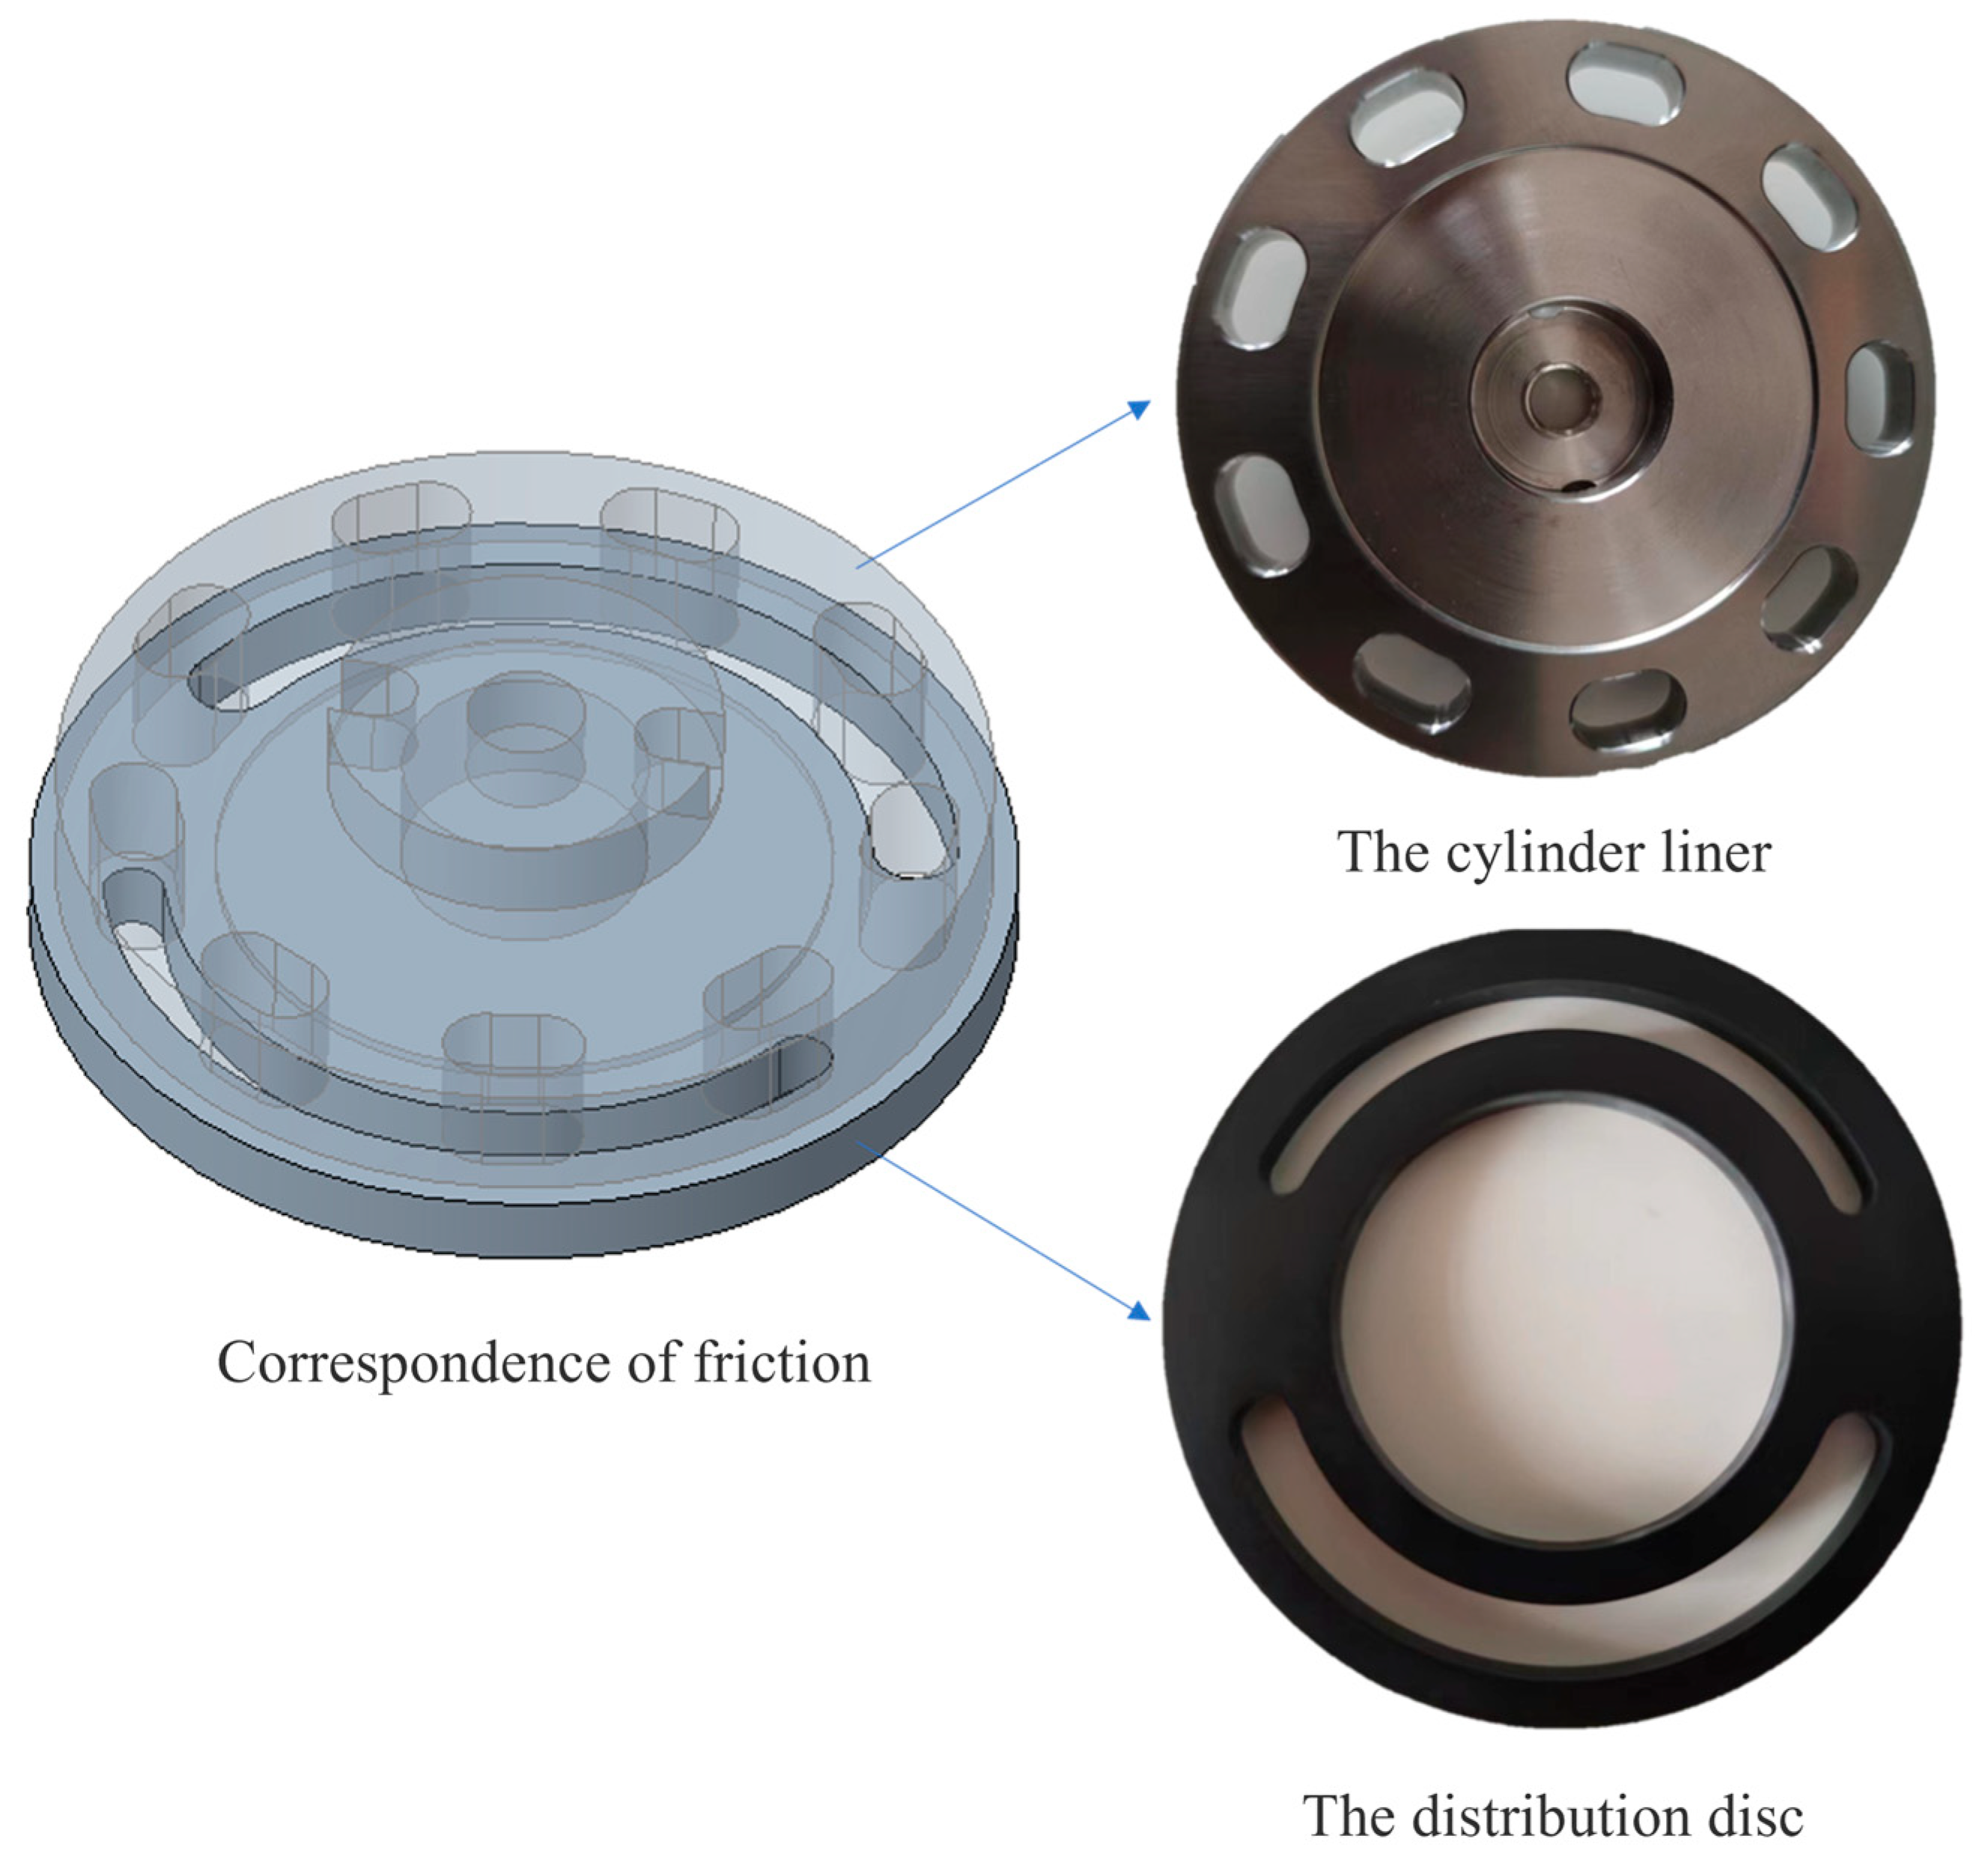
The MMD-5A multifunctional friction and wear tester produced by Jinan Chenda Company (Jinan, China) was used in this test. The indication error of the test force is ±1%. The structure and sample installation device are shown in Figure 1. The left half of the machine is divided into sample installation and power drive end, and the right half is divided into computer screen and manual control end. The upper sample of the flow distribution pair is installed on the driving spindle through the fixture and the driving spindle is driven by the servo motor to move along the clockwise direction, and the rotational speed is controlled by the computer. The lower sample of the flow distribution pair is fixed on the hydraulic column at the lower end by installing the base, and the hydraulic system controls the up and down movement and provides the load required for the test. To simulate the real seawater lubrication environment, the water box was processed with plexiglass and fixed on the lower hydraulic column by thread. At the beginning of the test, a certain amount of seawater was added to the water box, so that the upper and lower samples were completely immersed in seawater, and the plexiglass cover was installed to prevent seawater splashing during the test. The whole test is carried out under the control of the computer. The data generated during the test are measured by different sensors and transmitted in real time on the computer screen.
Figure 2 is the HARKE-SPCAX1 optical solid–liquid contact angle measuring instrument produced by HARKE. The contact angle measuring instrument is mainly composed of optical system, titration system, and video analysis system. The contact angle is measured by the sessile drop method. The unit-fitting method is used to calculate the contact angle value of the captured image. At the same time, the spreading process of the droplet on the solid surface can be recorded by continuous shooting. The contact angle test accuracy of the instrument can reach ±0.1°.

2.2. Test Specimen

Figure 3 is the ring–disk friction corresponding diagram of upper and lower samples. The sample material on the cylinder liner is super duplex stainless steel SAF2507, its main chemical composition is shown in Table 1, and mechanical properties are shown in Table 2.
Polyetheretherketone (PEEK) is a white powder, the average particle size is 10 μm, and the density is 1.32 g/cm3. The fiber diameter of the reinforced chopped carbon fiber is 7 μm, the density is 1.75 g/cm3, the tensile strength is 3.5 GPa, and the tensile modulus is 228 GPa.
Firstly, the chopped carbon fibers were soaked in acetone for 48 h, and then ultrasonically treated with a mixture of concentrated sulfuric acid and nitric acid in an ultrasonic cleaner for 20 min. After treatment, they were fully washed with distilled water and dried in an oven at 150 °C for 6 h. Subsequently, the carbon fiber and PEEK were fully mixed in a volume ratio of 3:7, and the mixture was placed in the mold of the hot press. The pressure was added to 10~14 MPa, and the temperature was raised to 375~390 °C. After the process of pressure release, exhaust, cooling, and de-molding, the CF/PEEK finished product was obtained. The main mechanical properties are shown in Table 3.

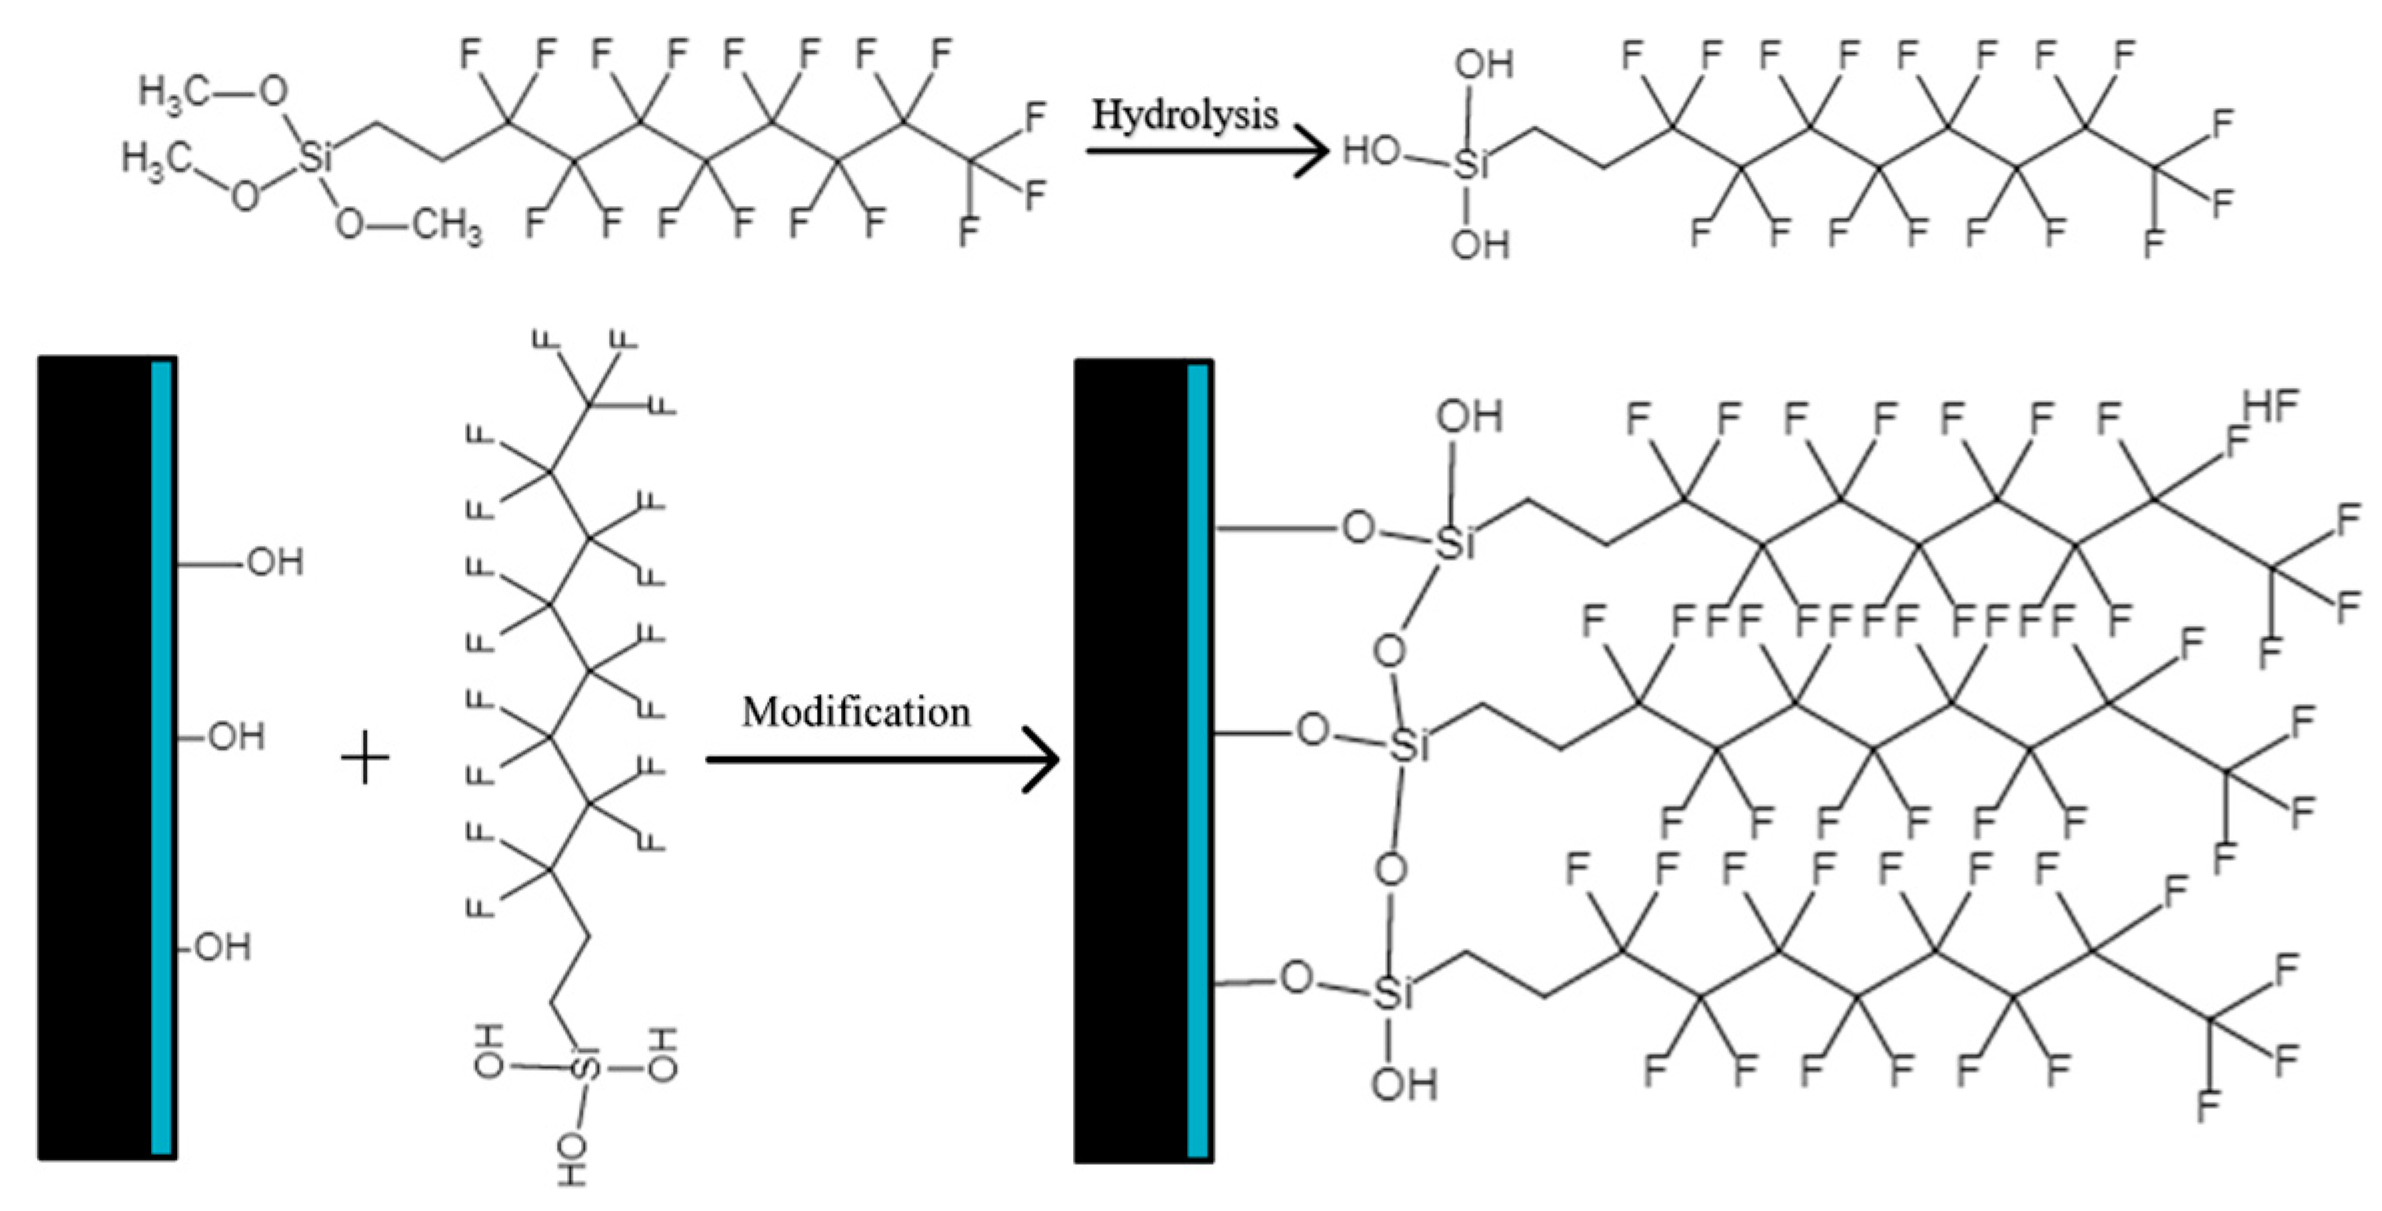
2.2.1. Surface Coating Sample Processing

Figure 4 is the modification mechanism of PFOTES on the upper and lower samples. The molecular formula of PFOTES is C13H13F17O3Si, and its molecular terminal group -Si-OCF3 will hydrolyze with trace water in an anhydrous ethanol solution to the form the -Si-OH group, which will dehydrate and condense with OH groups on the surface of the upper and lower samples. After the reaction, the long-chain silane molecules are modified to the surface of the sample. After drying at 100 °C for 30 min, a relatively stable hydrophobic perfluoromethyl group is formed on the surface of the sample.
Then, 0.5 mL of PFOTES was dissolved in 100 mL of absolute ethanol (99.7%) and stirred with a glass rod until the liquid was uniform and transparent to obtain a low-surface-energy solution. The upper/lower samples were immersed in the solution for 2 h, removed, and placed in a 100 °C drying oven for 30 min, and then cleaned in an ultrasonic cleaner with acetone and water for 20 min, respectively, and dried in the air to obtain a low-surface-energy upper/lower sample.

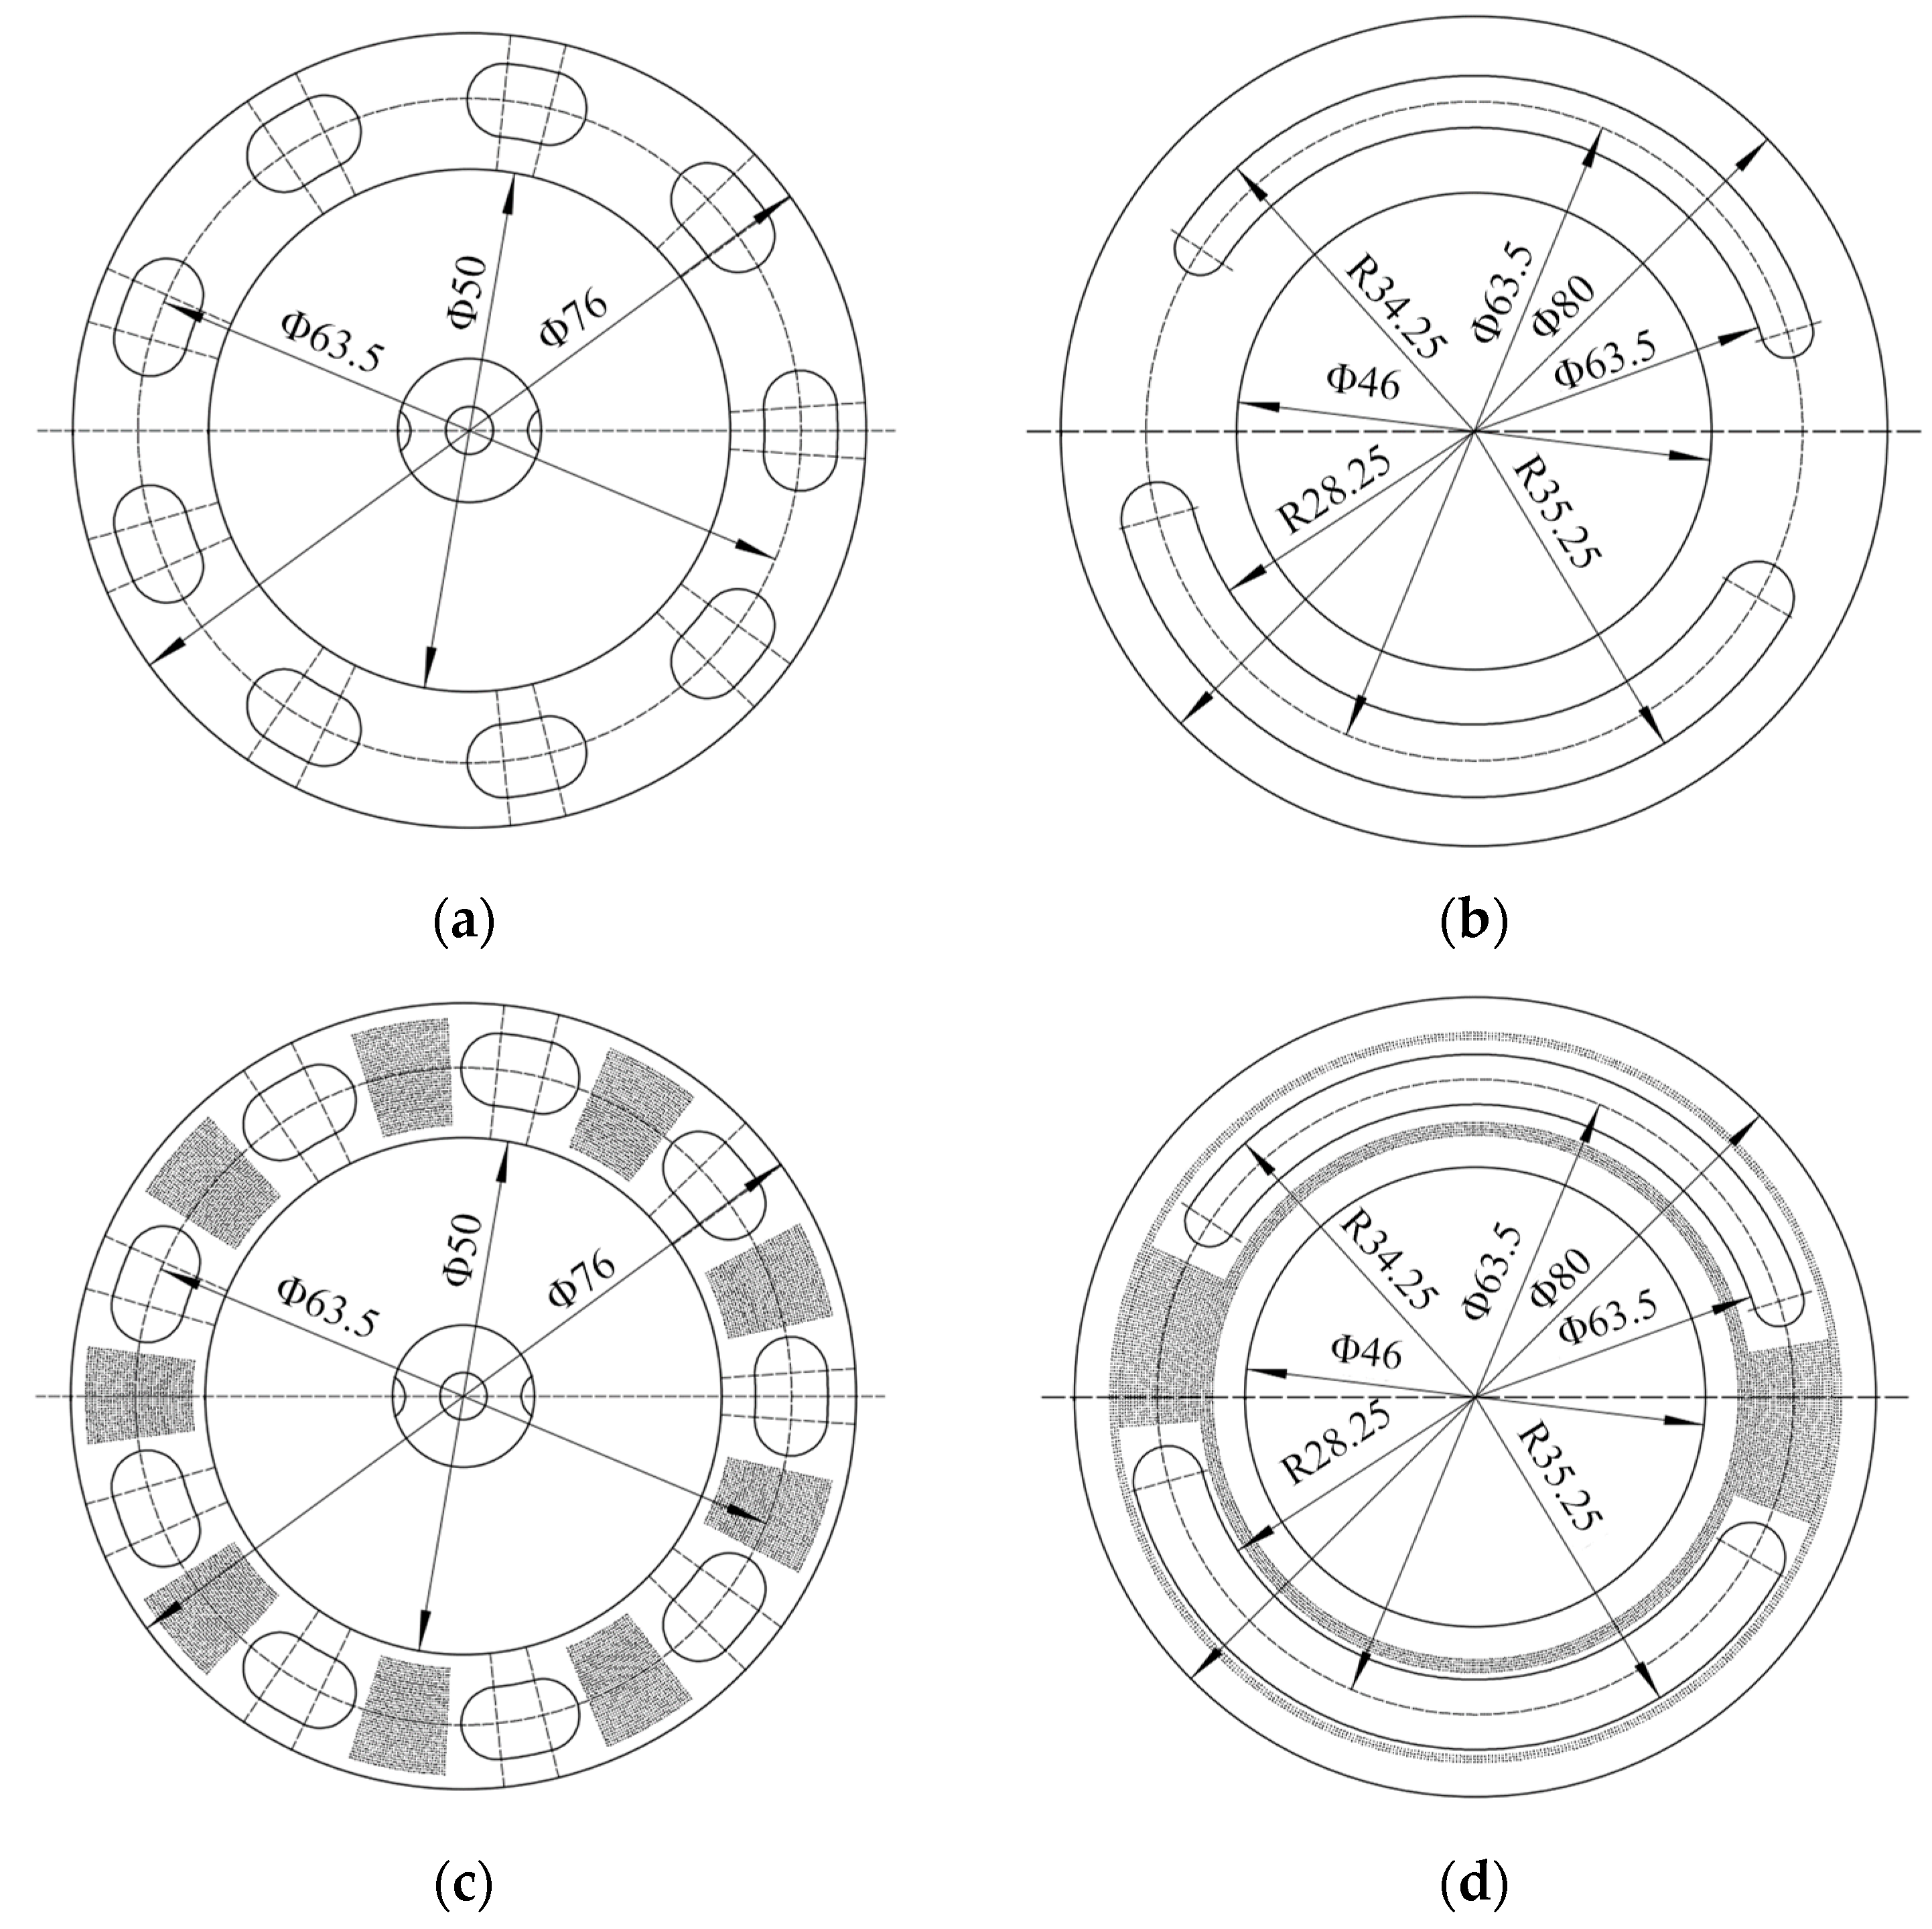
2.2.2. Surface Texture Sample Processing

The fiber laser marking machine is used for micro-texture processing. During the laser processing, the surface of the material is ablated by the laser beam to form a micro-pit. At the same time, the molten material residue will accumulate at the edge of the micro-pit. After cooling, different sizes of laser burrs are formed. After the laser treatment, the surface should be smoothed, and then the polished sample should be ultrasonically cleaned for 30 min to remove the debris remaining inside the micro-texture. Figure 5 is the schematic diagram of the surface texture sample.

2.3. Lubricating Medium

The natural seawater taken from the Qinhuangdao Sea area was used as the lubricating medium in the experiment. The density, viscosity, salinity, and pH values were 1.025 × 10⁻³ kg/m3, 0.956 × 10⁻³ Pas, 2.98%, and 7.2, respectively. Before the test, the retrieved seawater was set aside for about a week, and the surface seawater was selected for simple filtration to remove excess impurities for the test. In addition to simple standing and filtration, no other treatment was carried out on the seawater.

2.4. Test Scheme

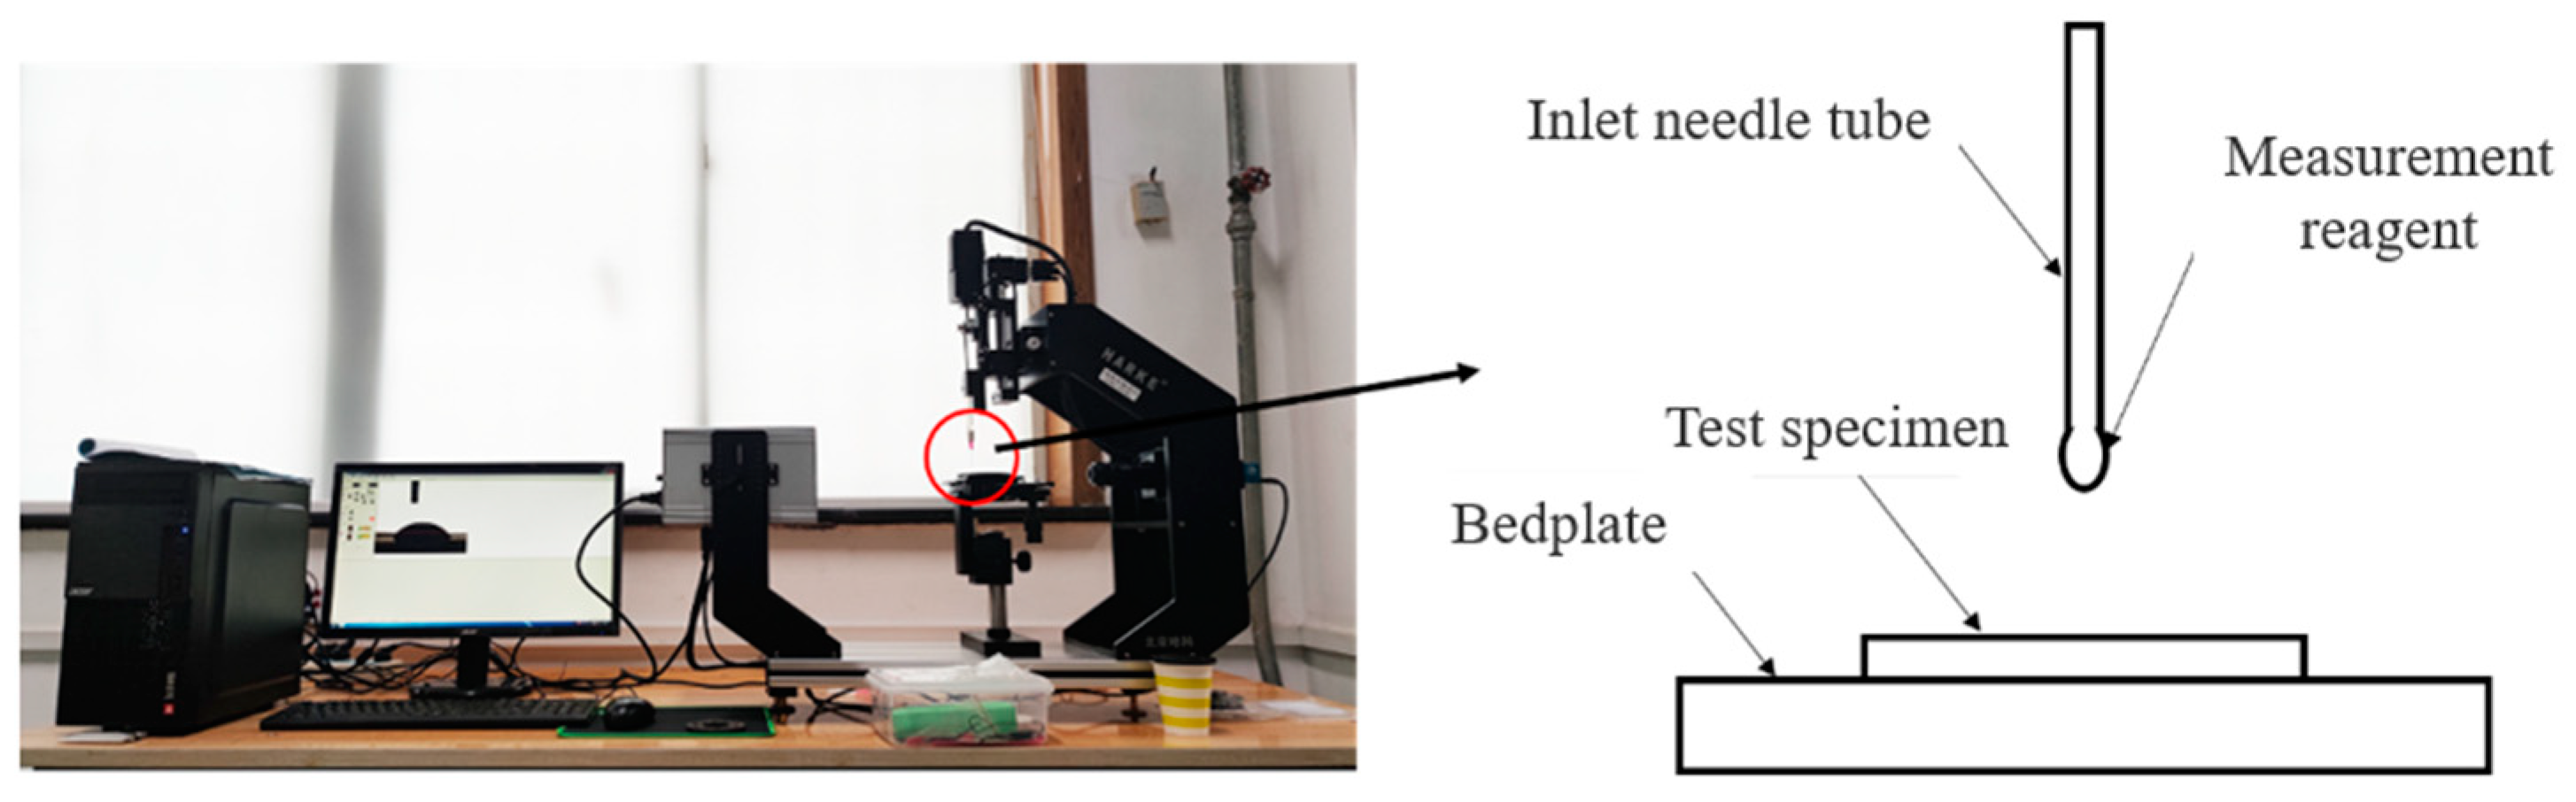
2.4.1. Contact Angle Measurement

The test sample is placed on the working table, and the lifting handwheel of the working table is adjusted to make it appear in the appropriate position of the video window. The computer is used to control the volume of the droplet. During the measurement, 1 μL liquid is dropped onto the surface of the sample using a micro syringe, and the drop needle is stopped when the droplet contacts the surface of the sample. The instantaneous morphology image of the liquid on the surface of the sample and the morphology image during the liquid spreading process are obtained by the high-speed camera on the contact angle measuring instrument. The morphology of the droplet is processed and analyzed by using the relevant software in the computer, and the contact angle of the droplet on the surface of the test sample is calculated.

2.4.2. Friction and Wear Test

In the surface coating test group, four different friction pair combinations were designed, as shown in Table 4. In the surface texture test group, eight different friction pair combinations were designed, as shown in Table 5.
Before the test, all samples were placed in an ultrasonic cleaning instrument for ultrasonic cleaning for 15 min, and dried naturally after cleaning. The dried samples were weighed using an electronic balance. To avoid errors in the measurement results, each sample was measured three times, and the average value was taken as the final result.
After the completion of the above preparation work, at room temperature, the friction and wear test were carried out under the condition of seawater immersion lubrication using the MMD-5A multi-functional friction. The normal load was set to 320 N, and the simulated seawater axial piston pump was the actual rotational speed of the flow distribution pair. The duration of each group of tests was 7200 s. The curves of friction coefficient and temperature of each friction pair changing with time were obtained during the test.
At the end of the test, to eliminate the influence of the water absorption of CF/PEEK material and the weight of the wear debris generated during the friction and wear process, the sample was washed again and dried continuously. Finally, the data before and after the test are summarized, and the comparative analysis of different variables is carried out to explore the influence of the two technologies on the friction and wear characteristics of the port plate pair.

3. Results and Discussion

3.1. Surface Coating

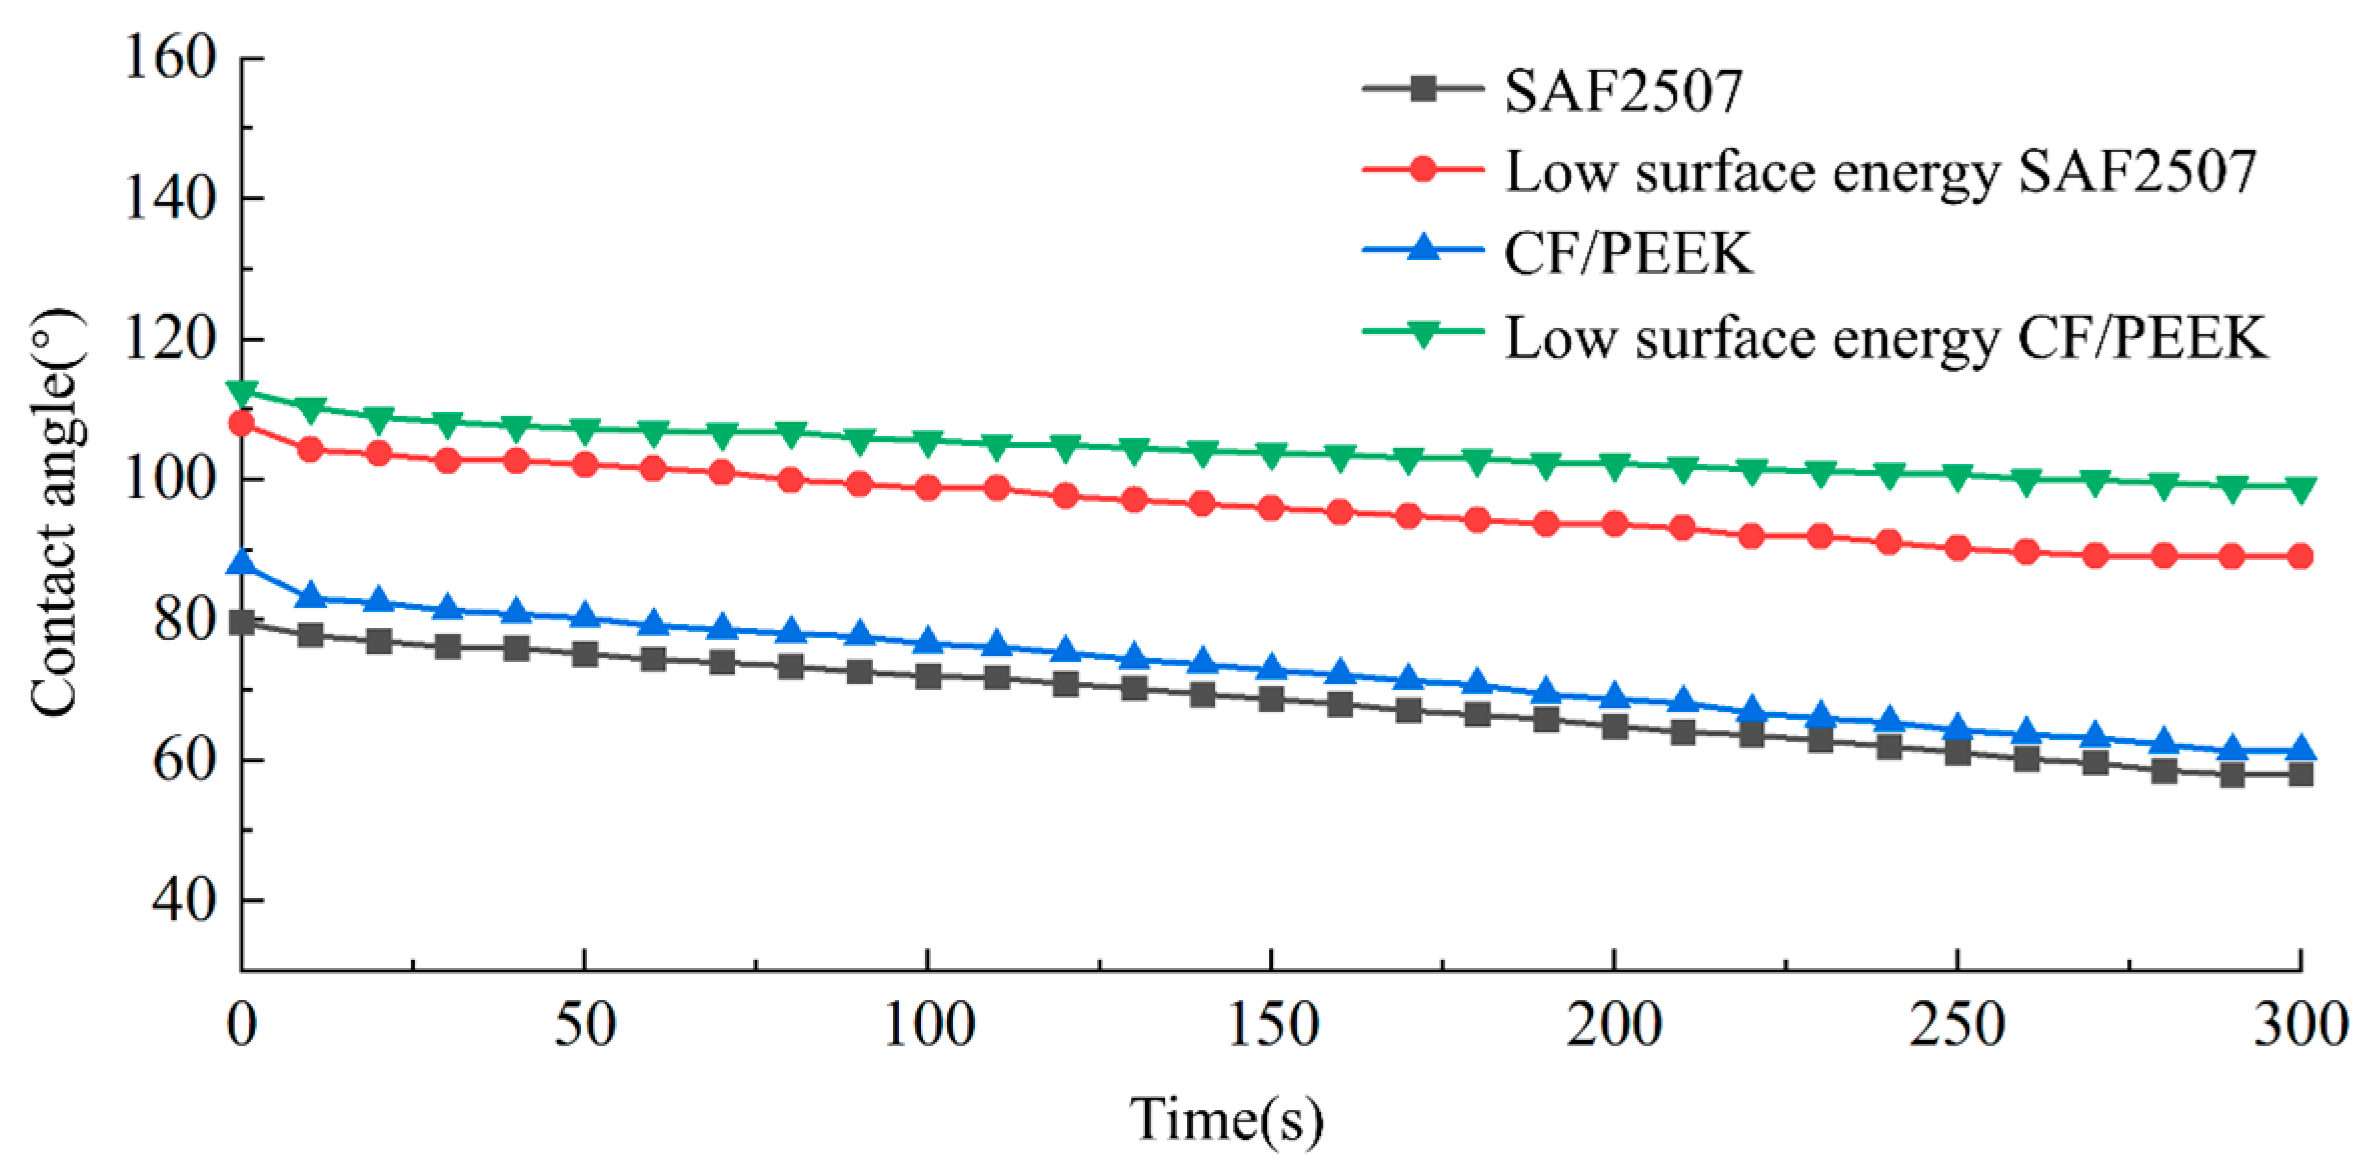
3.1.1. Surface Wettability

Figure 6 shows the change in the seawater contact angle with time. The value of the contact angle will decrease with the spreading and evaporation of the droplet until it reaches a relatively stable value. The contact angle decreases rapidly within 60 s of liquid dripping, and the seawater contact angle decreases from 79.6° and 85.8° to 74.4° and 79.1°, respectively. After that, the contact angle is still decreasing, but the decline rate is slowed down. At the end of the experiment, the seawater contact angles of SAF2507 and CF/PEEK are 58° and 61.3°, respectively, showing hydrophilicity. The contact angle of the low-surface-energy modified sample still decreases after 60 s, but it is relatively slow. The seawater contact angle of the low-surface-energy modified sample is always higher than 90° within 300 s, and the seawater contact angles are 90° and 99°, respectively, showing hydrophobicity.

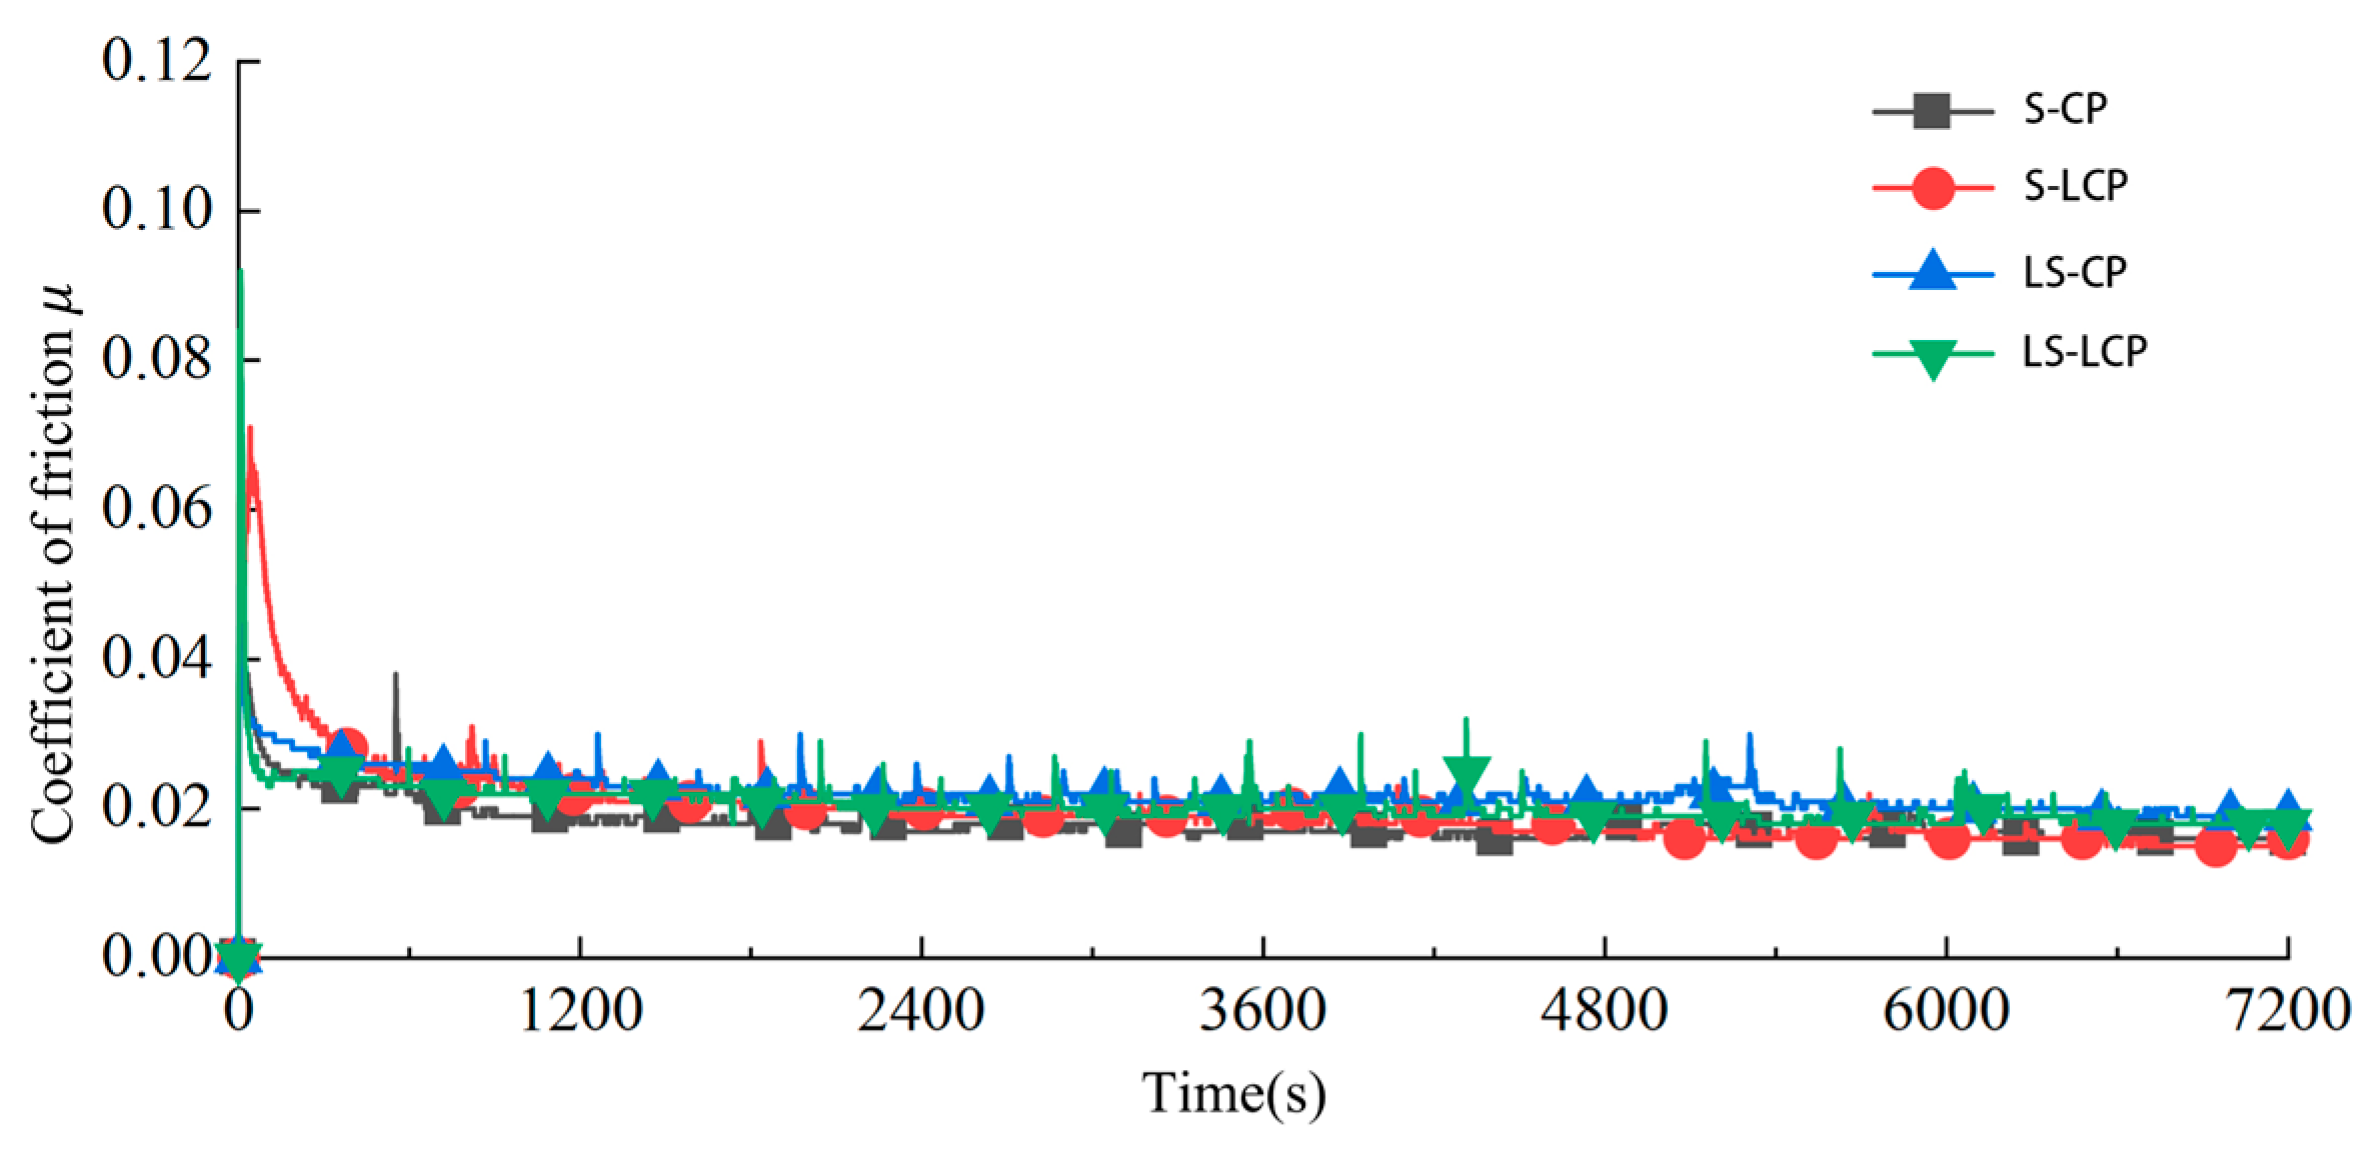
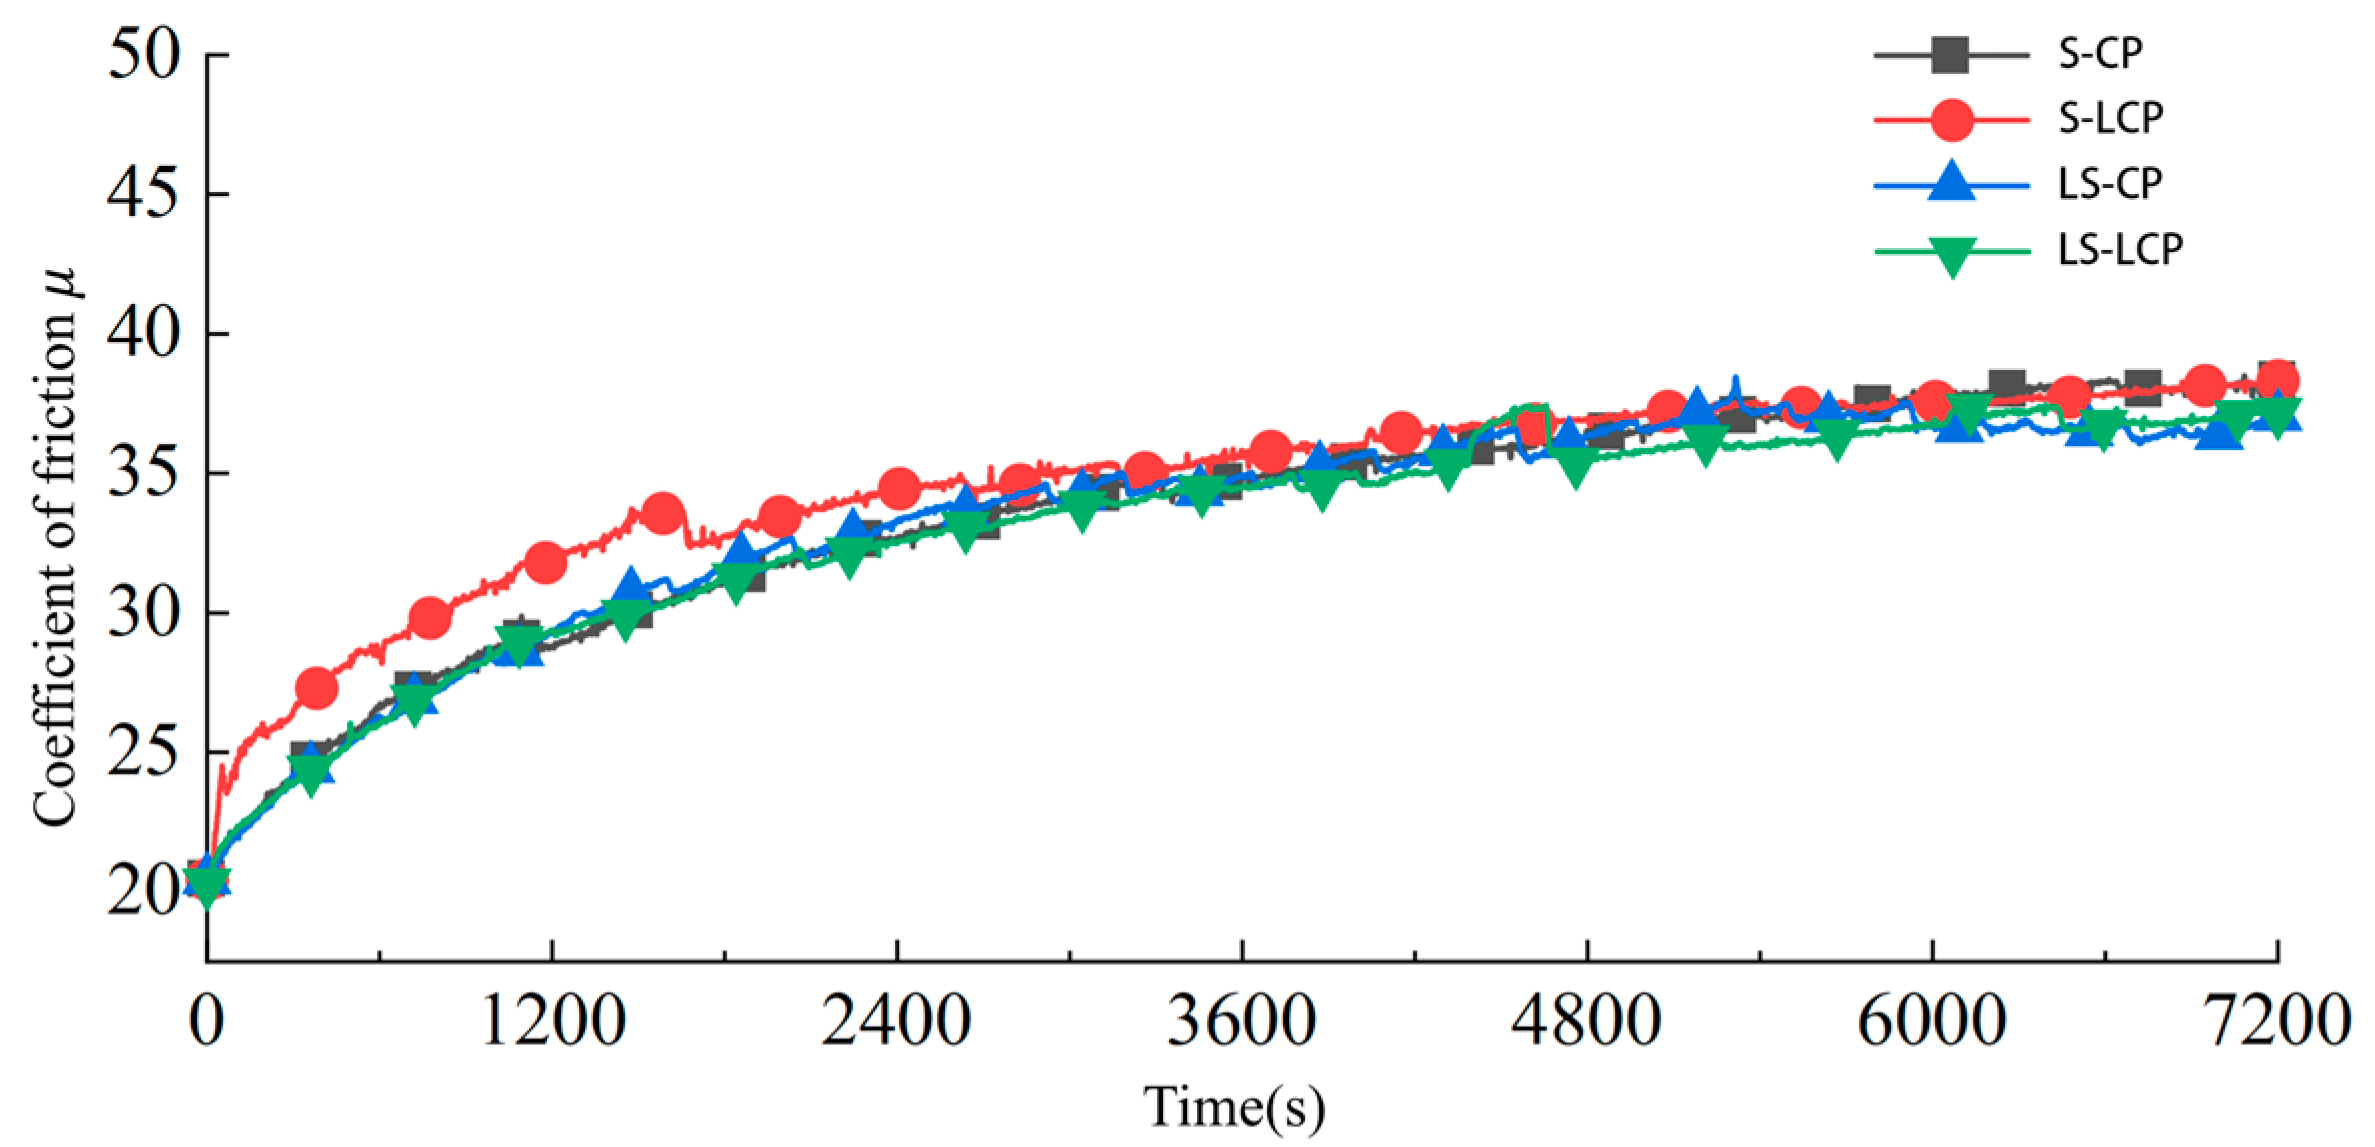
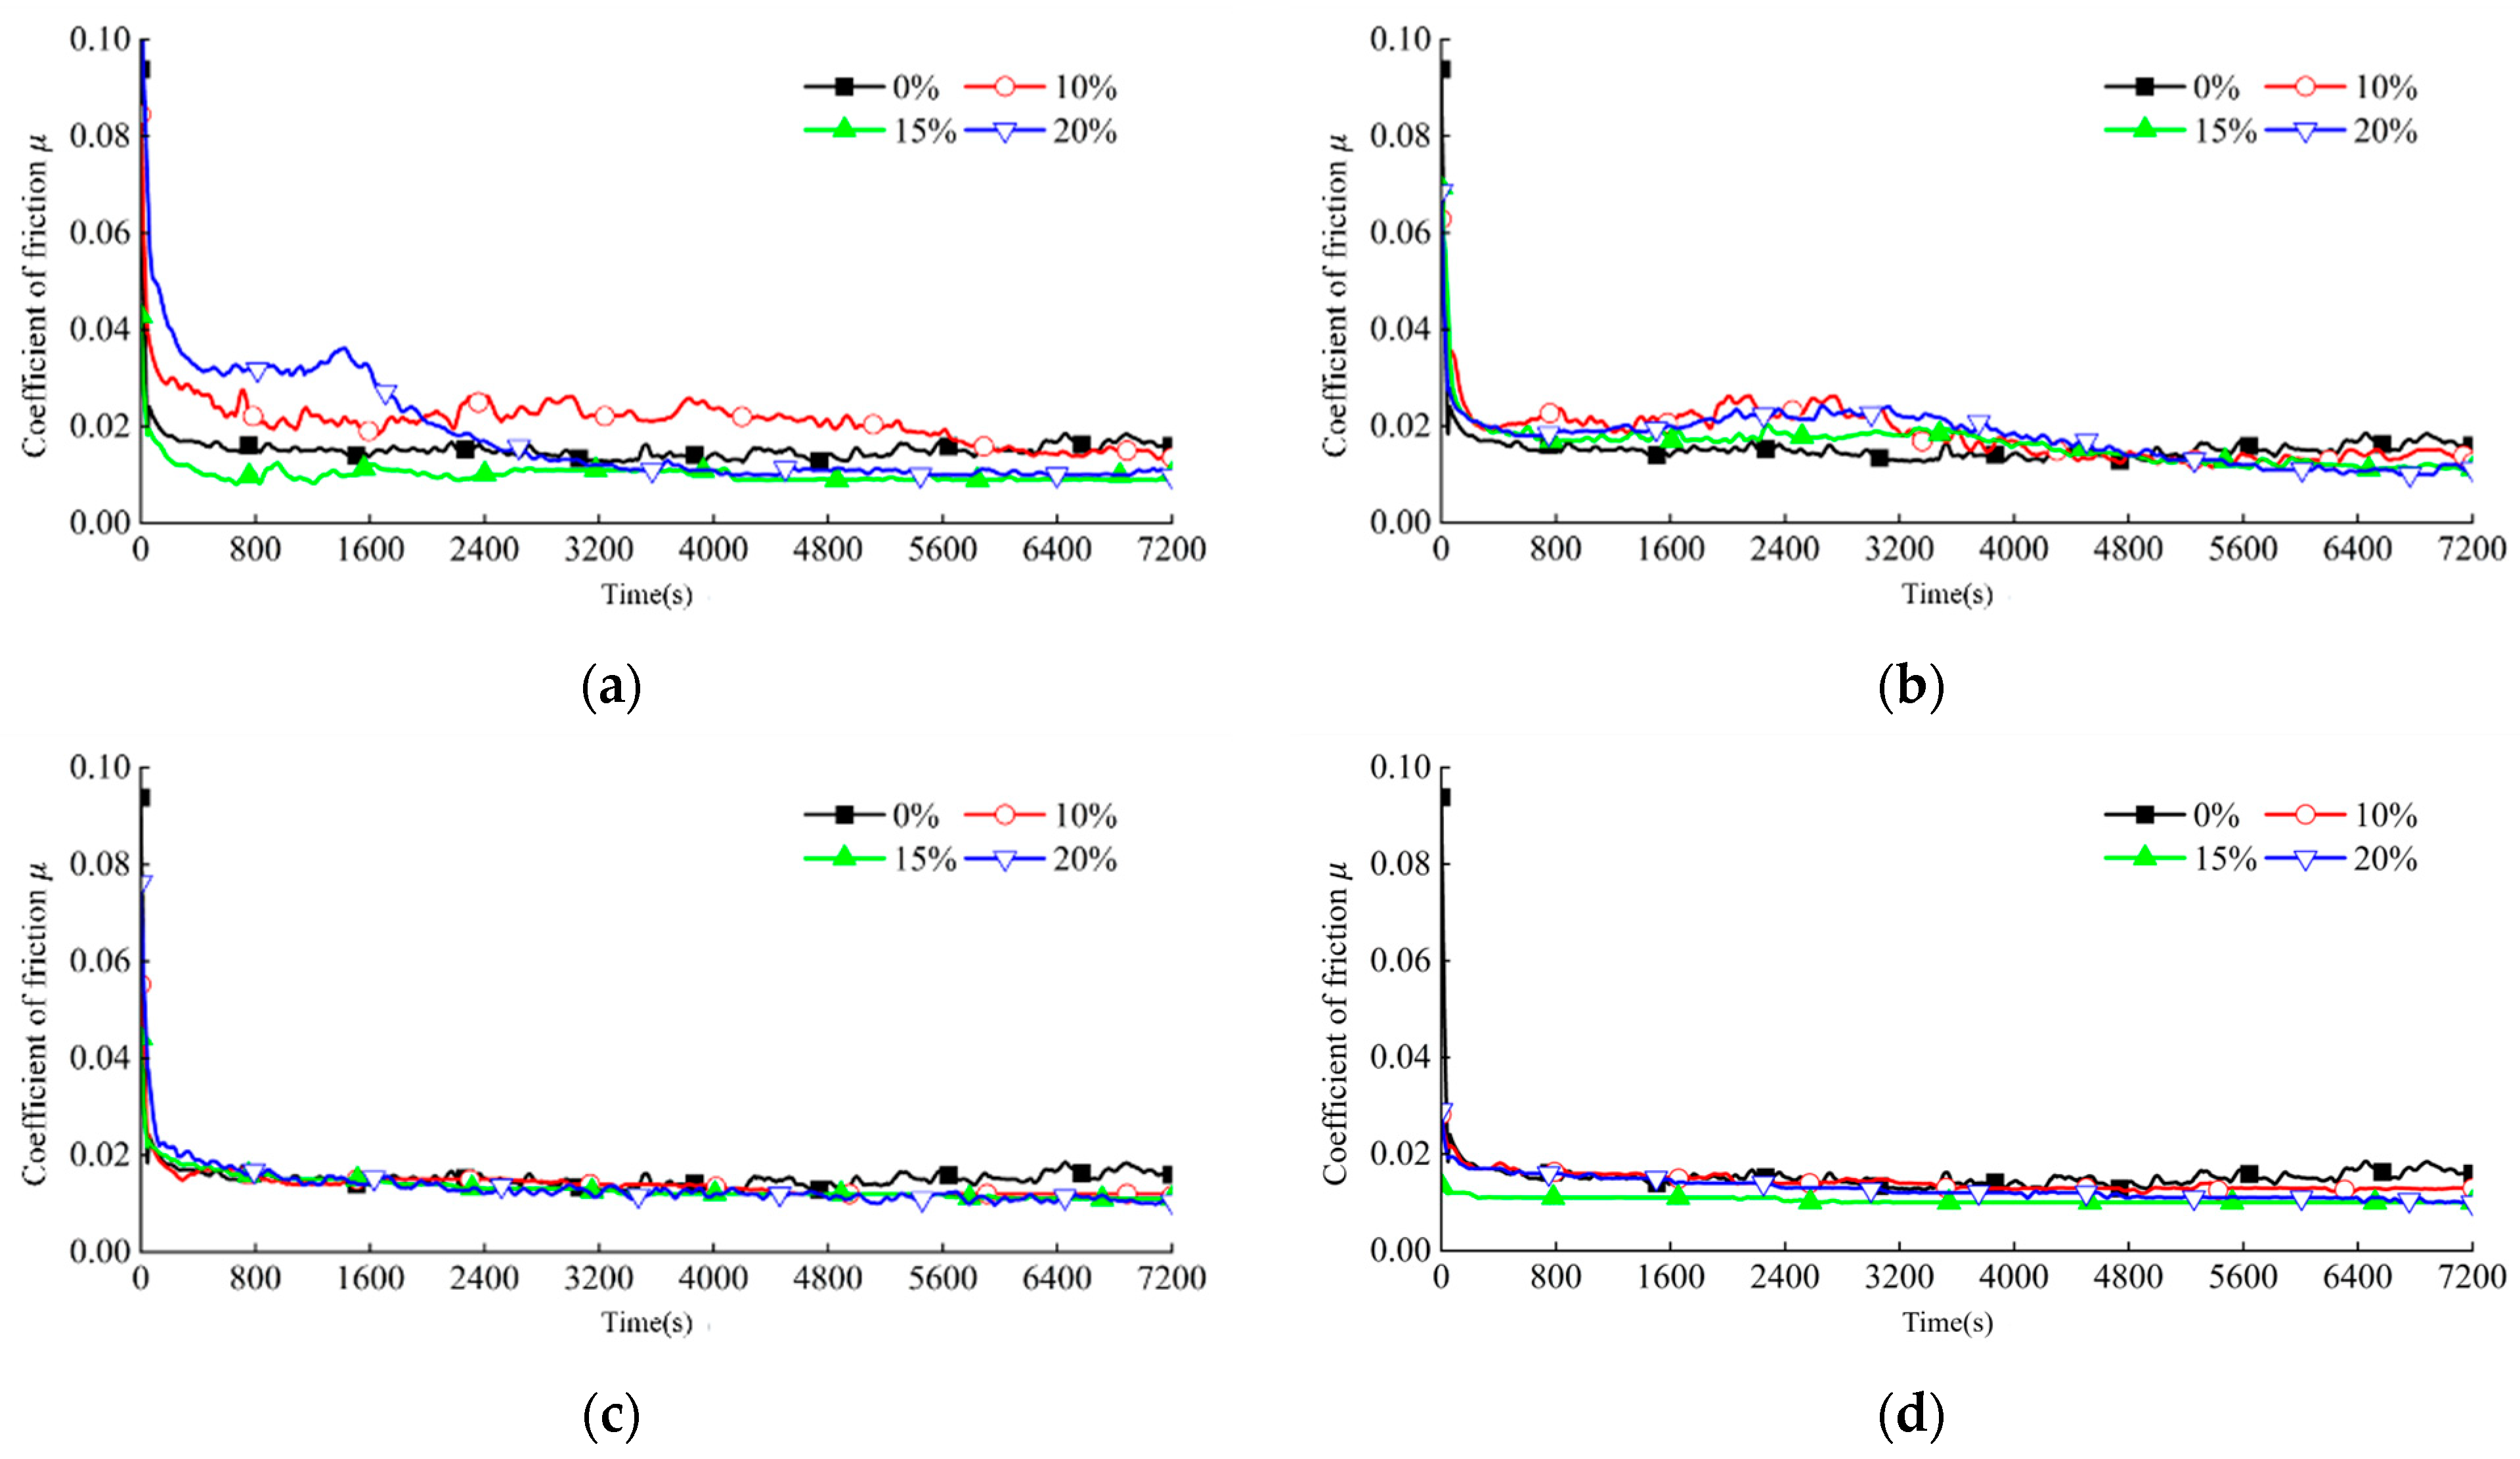
3.1.2. Frictional Characteristic

From the analysis of Figure 7, it can be found that, at the rotational speed of 1000 r/min, the friction coefficient of the four low distribution pairs decreased rapidly from 0.06~0.09 to 0.023~0.03 in the first 300 s, and, finally, stabilized at 0.02~0.017. The difference between the four friction coefficient curves is small. The friction coefficient of LS-LCP is the largest, and the rest of the flow distribution pair tends to be stable after 800 s. When the upper sample is a hydrophobic surface (LS-CP, LS-LCP), the friction coefficient curve has a small oscillation during the test. When the upper sample is a hydrophilic surface (S-CP, S-LCP), the friction coefficient curve fluctuates slightly after the initial running-in period, and the friction coefficient finally stabilizes at about 0.017 with the increase in time.
Figure 8 shows the variation curve of seawater temperature with time under different wetting combinations at 1000 r/min. No matter what kind of wetting combination, with the progress of the friction test, the friction generates heat, and the seawater temperature gradually increases, but the rising speed gradually slows down. When the friction environment reaches thermal equilibrium, the seawater temperature no longer rises. The water temperature of each group was stable at 38.1 °C, 38.1 °C, 37.2 °C, and 36.9 °C. S-CP and S-LCP have the highest temperature rise of the four groups. Corresponding to Figure 7, the friction coefficient of LS-CP and LS-LCP is higher than that of S-CP and S-LCP, but the temperature rise of S-CP and S-LCP is lower than that of LS-CP and LS-LCP, indicating that the coating surface added to the upper sample is beneficial to heat dissipation.

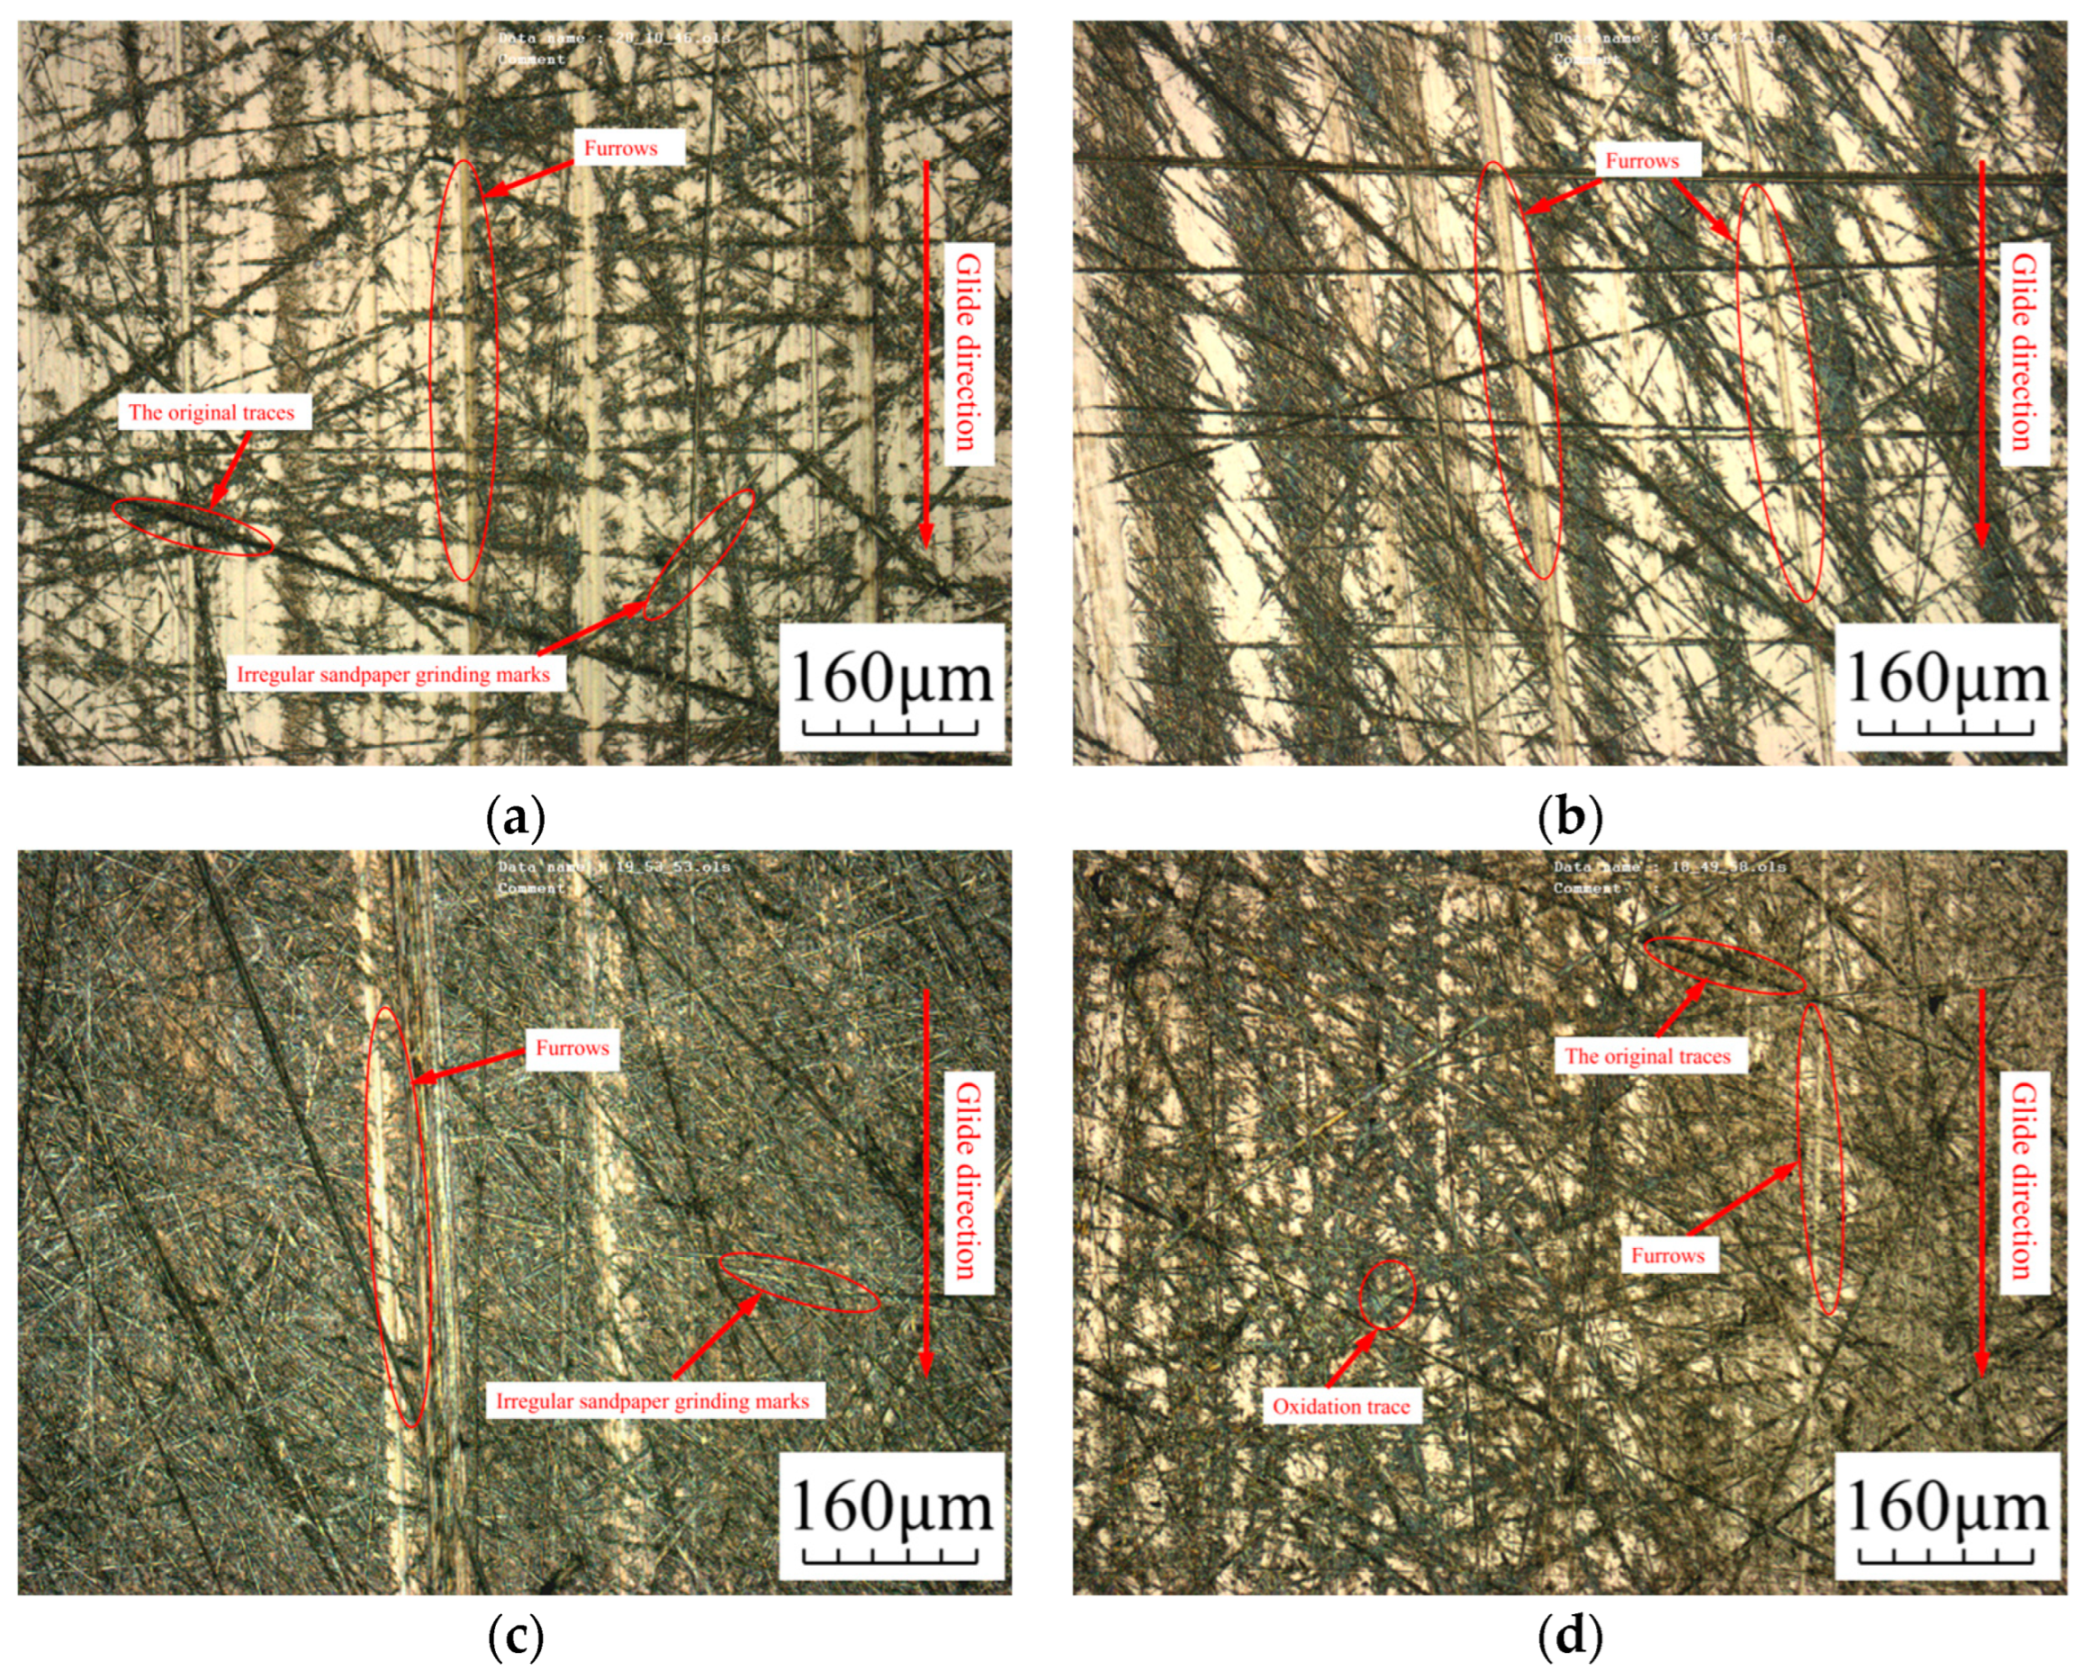
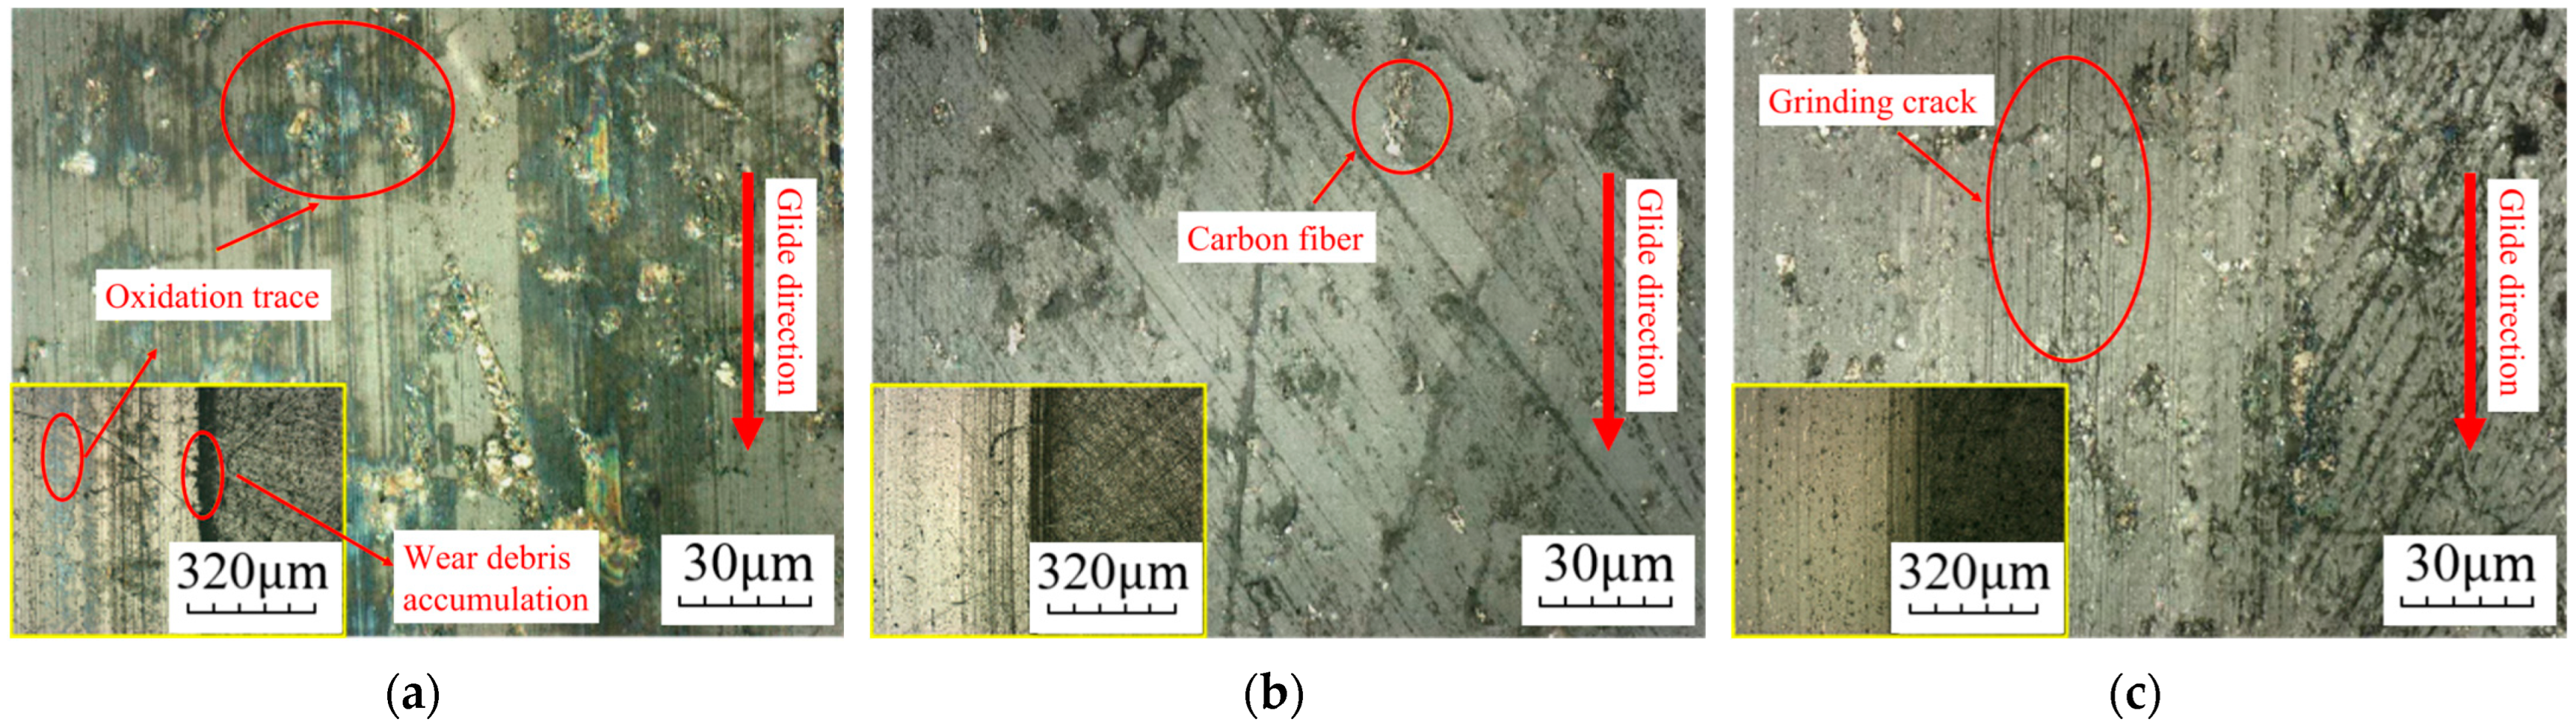
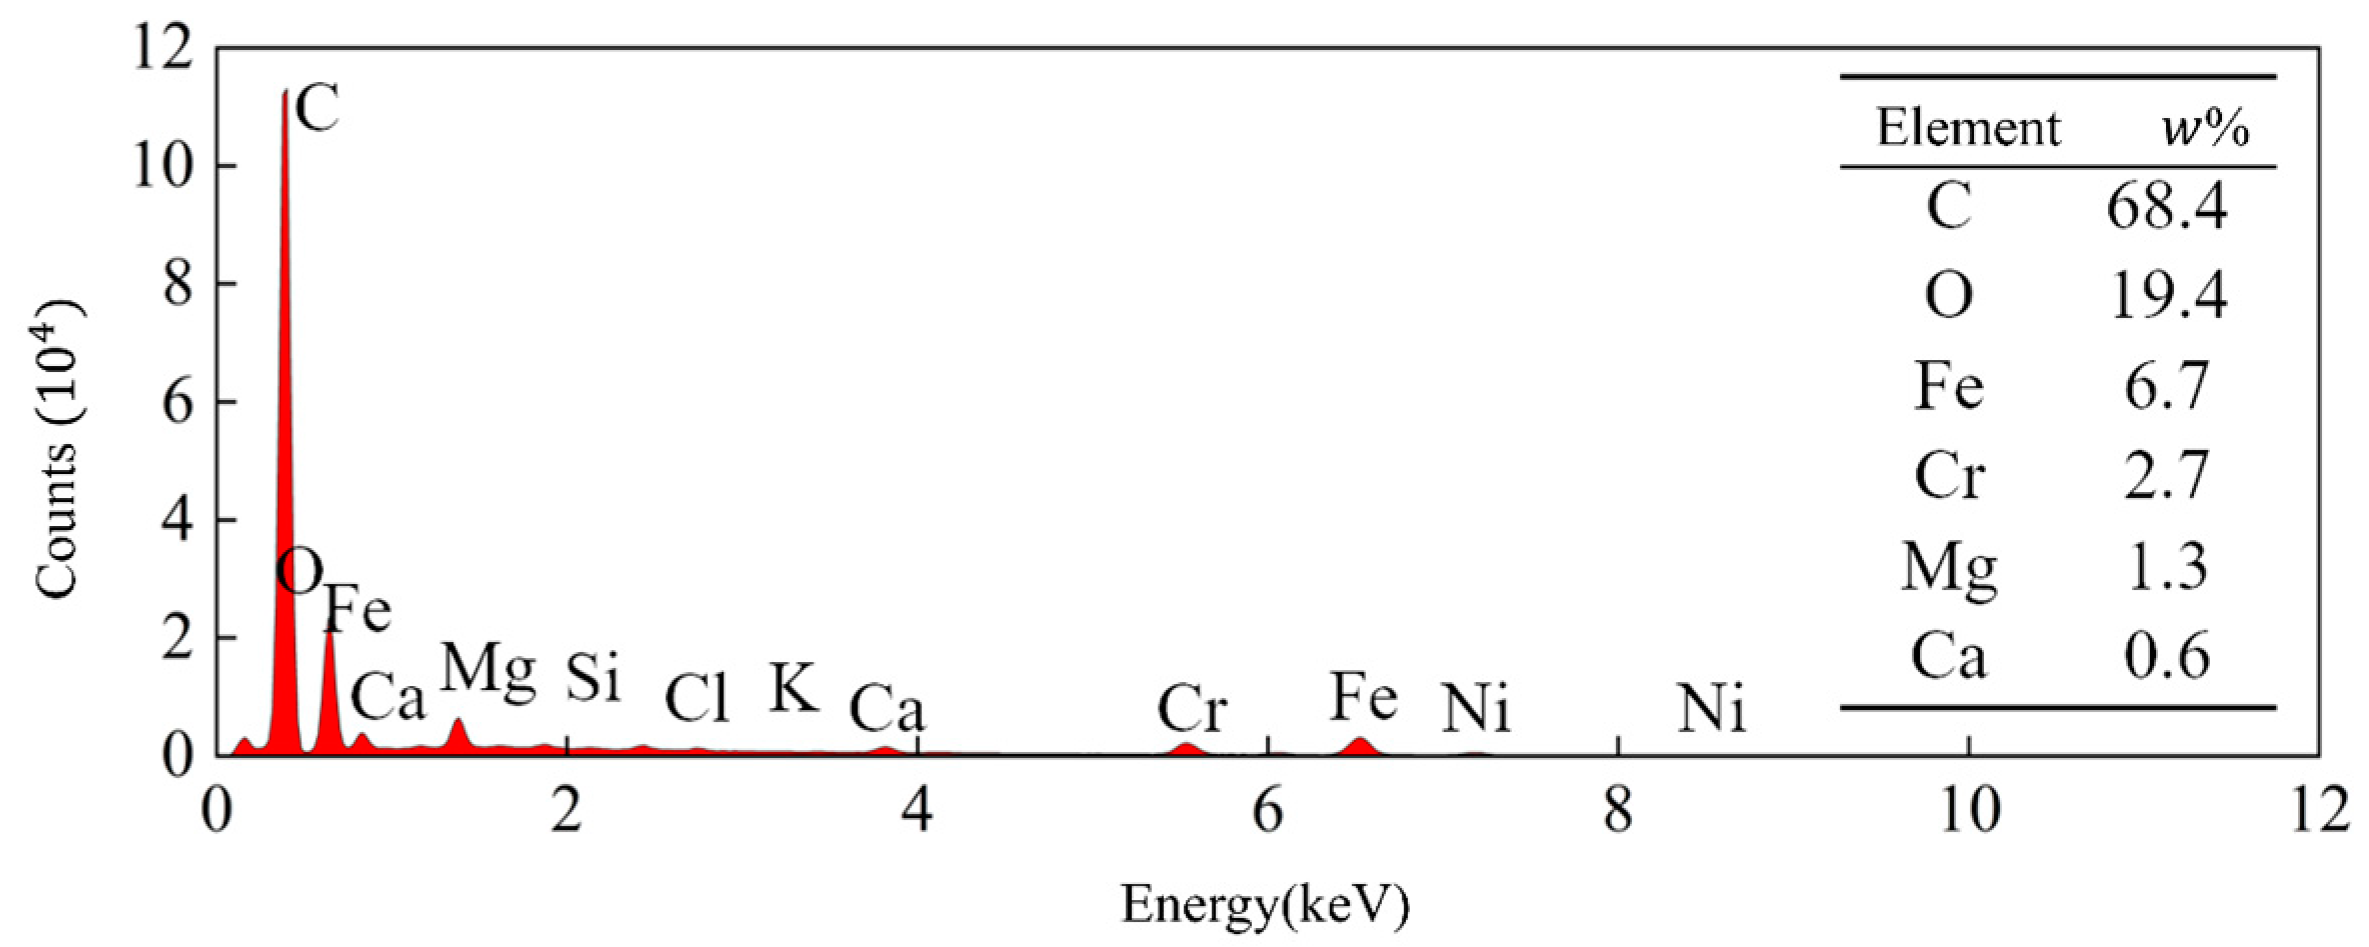
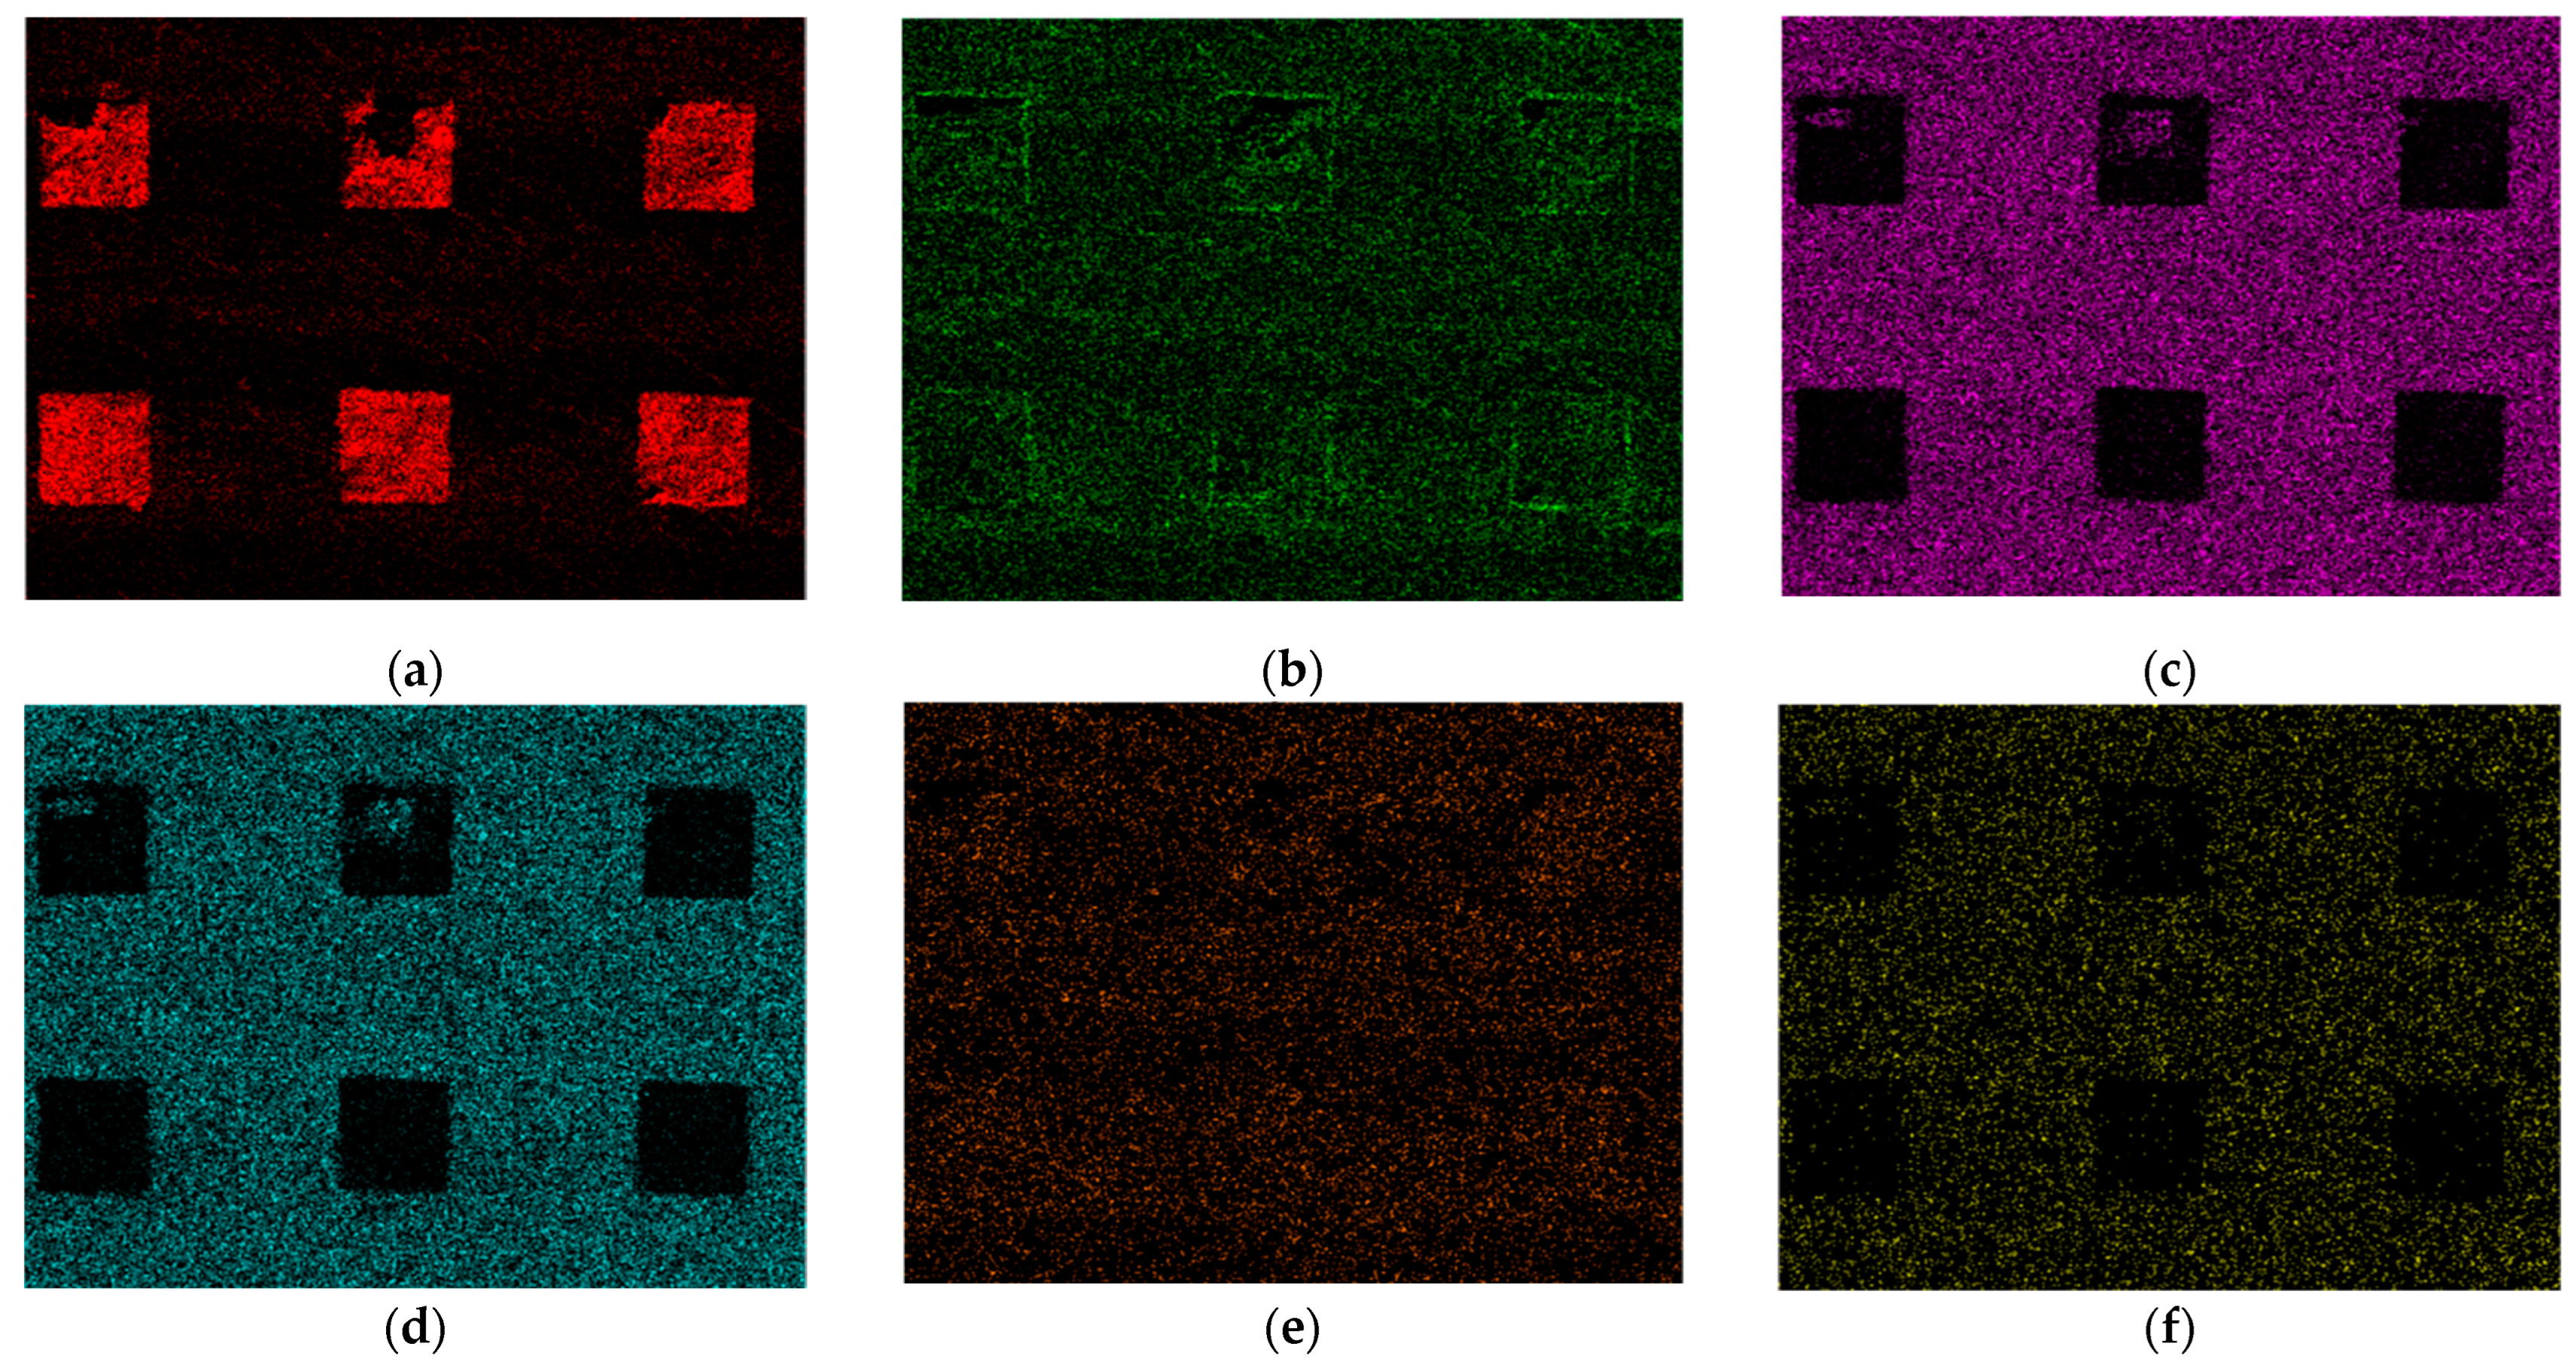
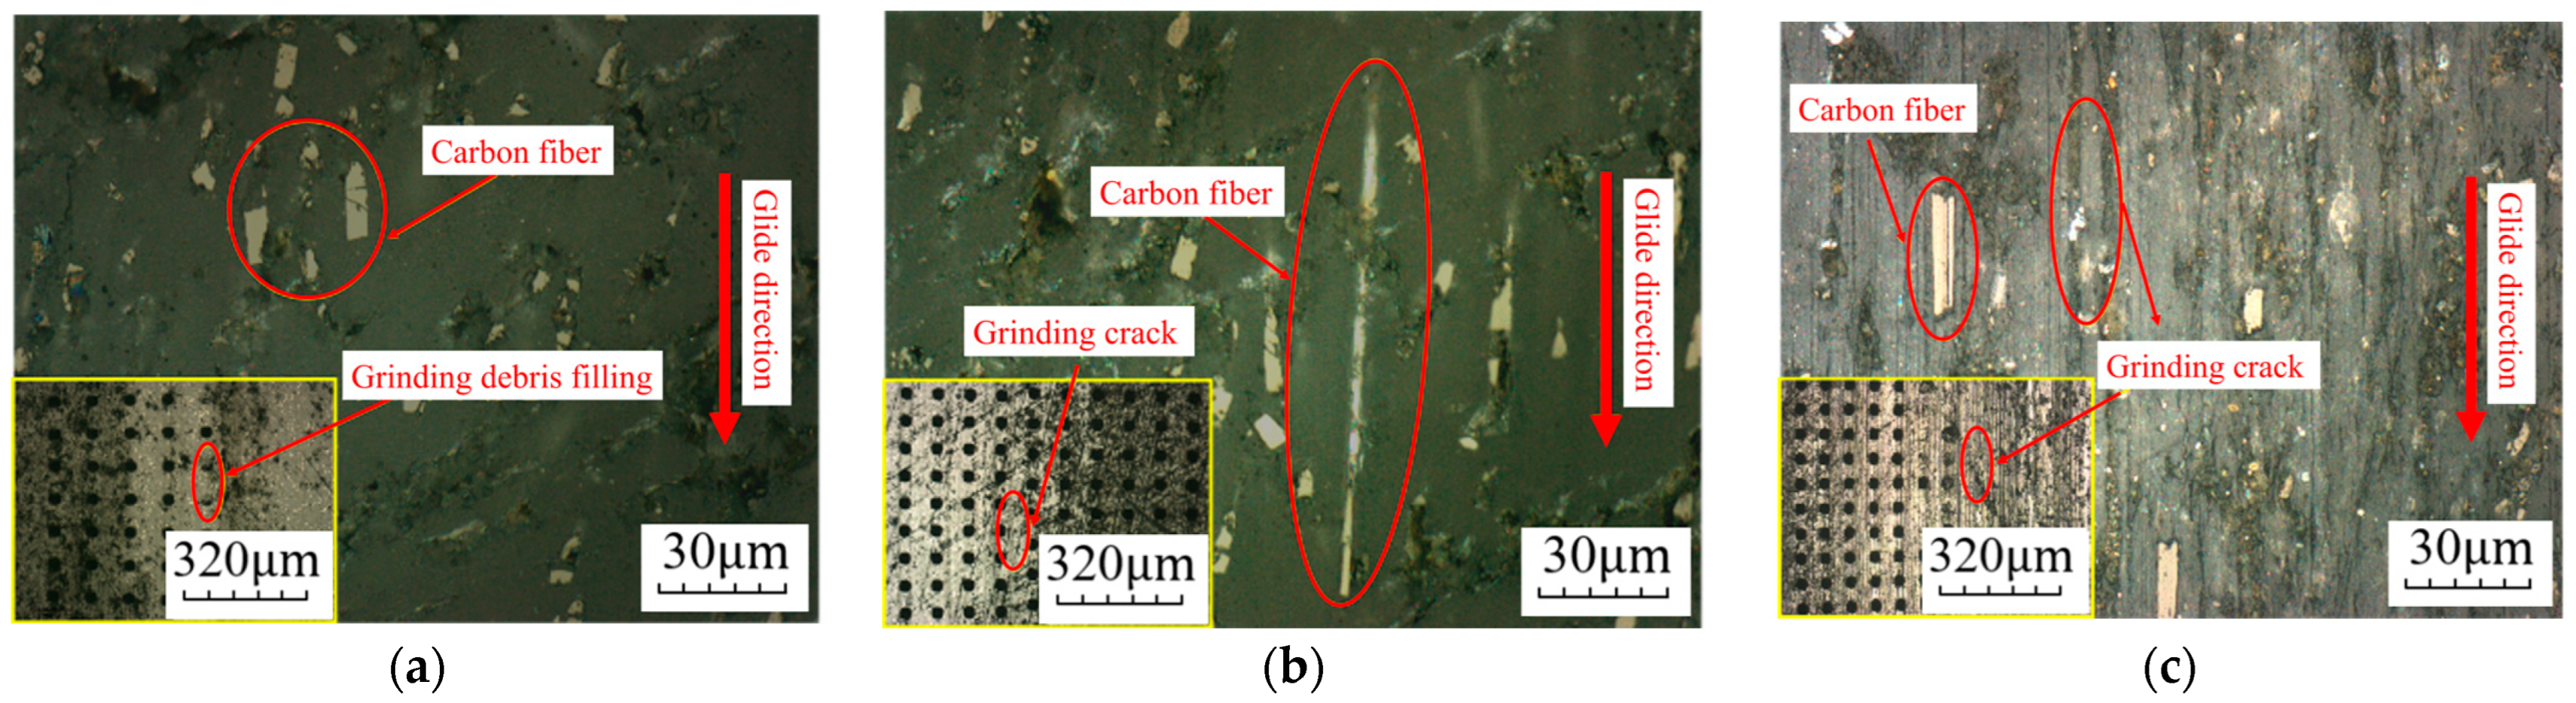
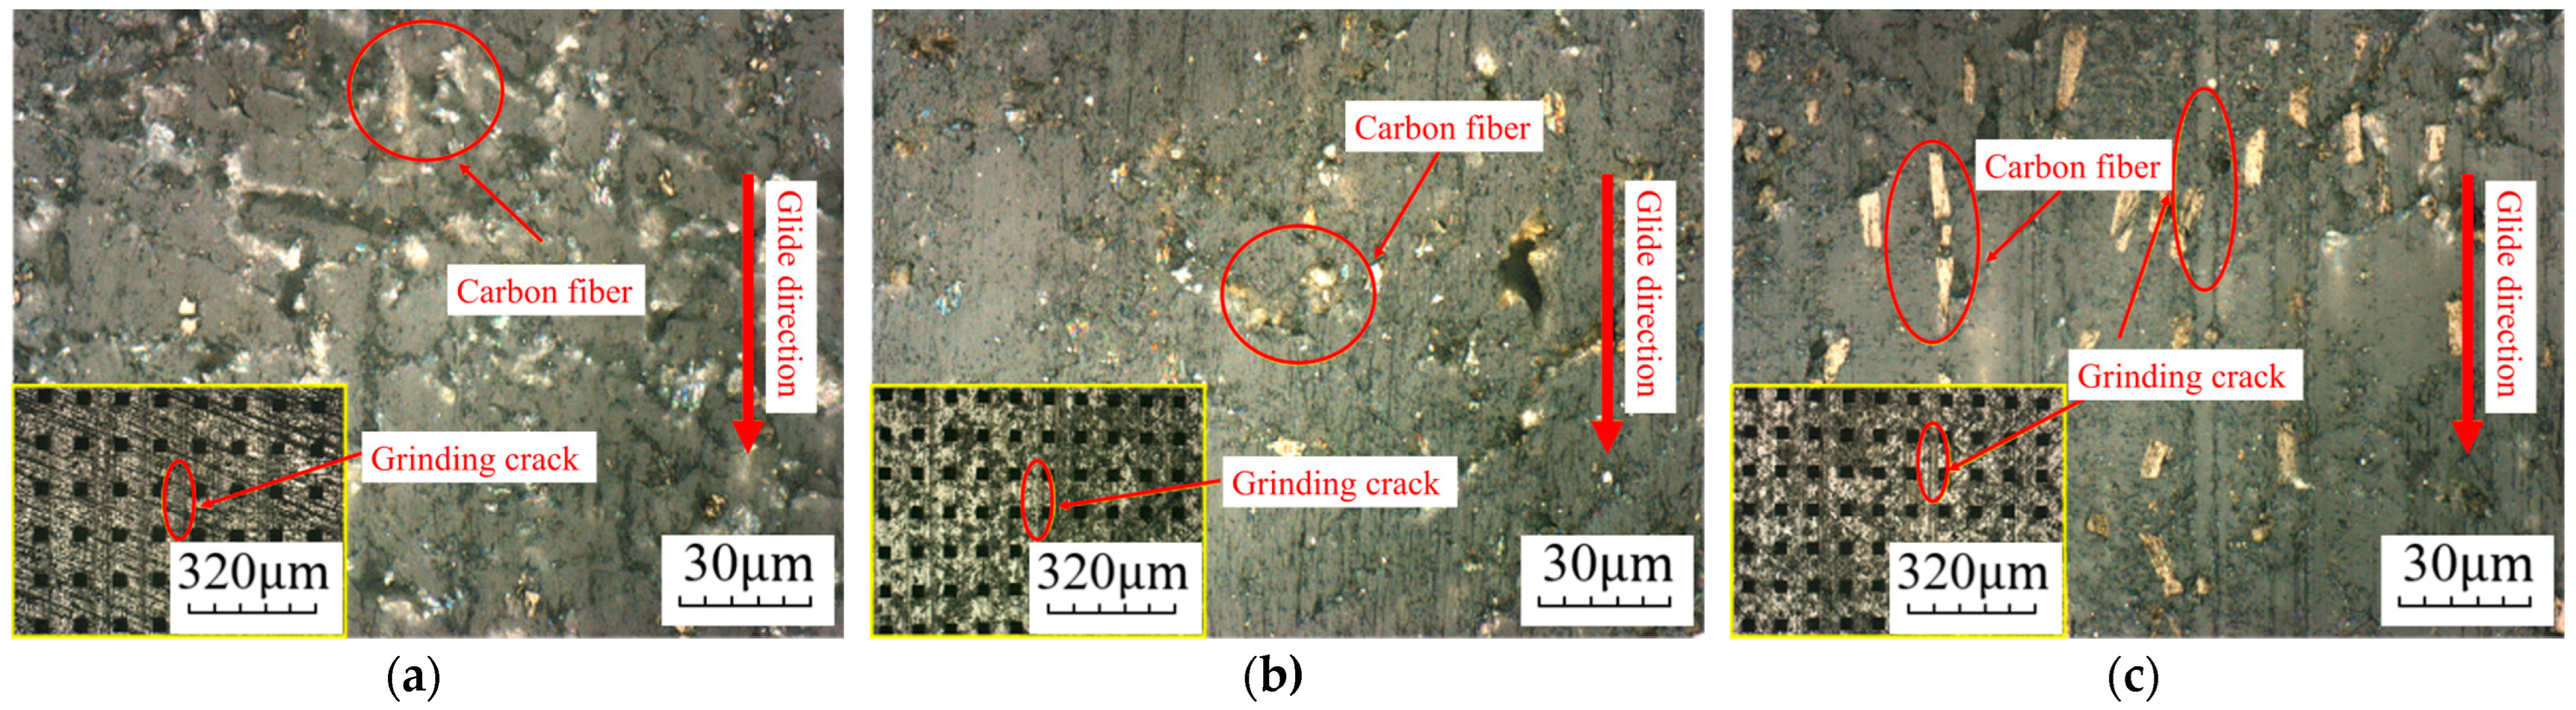
3.1.3. Wear Morphology

Figure 9 is the surface morphology of each sample before wear. By comparing Figure 10a,b, it can be found that the original sandpaper grinding marks on the surface of the upper sample SAF2507 are almost completely covered. After wear, the density of the furrow-shaped grinding marks on the surface is larger. By comparing Figure 10c,d, it can be found that furrow-like wear marks appear on the surface of the upper sample, but the density is not very high, and the original sandpaper grinding marks are still retained.
By comparing Figure 11a–c, it can be found that the surface spalling is more serious after wearing under the microscope, bright wear marks appear and the wear marks are dense, and the carbon fiber is seriously worn and exposed and exfoliated. From Figure 11d, it can be found that the bright grinding marks and carbon fiber exposure are also lighter.
When the upper sample is a hydrophilic surface (S-CP and S-LCP), regardless of whether the lower sample is hydrophilic or not, the wear is more serious. There are obvious furrows on the surface of the upper and lower samples after wear. Although the original traces are not completely covered, the surface morphology is also seriously damaged. When the upper sample is a hydrophobic surface (LS-CP and LS-LCP), the furrow-like wear scar density of the upper sample and the exposed area of the carbon fiber of the lower sample are significantly reduced, and, when the lower sample is a hydrophobic surface (LS-LCP), the furrow distribution is more uniform and the exposed area of carbon fiber is also lighter.

3.2. Surface Texture

3.2.1. Texture Shape and Area Ratio

It can be found from Figure 12a,b that, in the flow distribution pair of the textured upper sample and the smooth lower sample, the friction coefficient has been unstable in the early and middle stages of the test. The friction coefficient of the textured flow distribution pair is greater than that of the smooth port plate pair. It gradually stabilized in the later stage of the test, and the friction coefficient of the textured flow distribution pair was smaller than that of the smooth flow distribution pair. At the end of the test, when the upper sample is the cylindrical texture, the friction coefficient of the 15% area ratio is 0.009, which is lower than the other groups. When the upper sample is square cylindrical textures, the friction coefficient of the 20% area ratio was 0.01, which was lower than that of the other groups. It can be found from Figure 12c,d that, in the flow distribution pair of the smooth upper sample and the textured lower sample, the friction coefficient has no obvious fluctuation during the whole test process, and the friction coefficient of the textured flow distribution pair is smaller than that of smooth flow distribution pair. At the end of the test, when the lower sample is the cylindrical texture, the friction coefficient of the 20% area ratio is 0.012, which is lower than the other groups. When the lower sample is square cylindrical textures, the friction coefficient of the 20% area ratio was 0.01, which was lower than that of the other groups.
Comparing the friction coefficient of four different textured flow distribution pairs, the friction coefficient curve of the combination of the smooth upper sample and the textured lower sample is smoother than that of the textured upper sample and smooth lower sample in the friction and wear process. The friction coefficient of the flow distribution pair of the upper sample on the cylindrical texture with an area ratio of 15% and the smooth lower sample is the smallest, but the friction coefficient curve fluctuates significantly during the friction and wear process. Therefore, it is considered that the friction and wear performance of the flow distribution pair on the smooth upper sample and the square column texture lower sample with an area ratio of 20% are better.
Comparing the histogram of Figure 13a, it can be found that the wear loss of the lower sample is not reduced by processing the texture on the surface of the upper sample. The wear loss of the lower sample under the cylindrical texture flow distribution pair decreases with the increase in the area ratio. The wear loss of the lower sample with the area ratio of 10% is slightly higher than that of the smooth surface, and the wear loss of the sample with the area ratio of 15% and 20% is less than that of the smooth surface. The wear loss of the sample under the square cylindrical texture flow distribution pair is similar to that of the sample under the smooth flow distribution pair, and no obvious change rule is found. The wear loss of the sample with an area ratio of 20% is slightly higher than that of the smooth surface. It can be found from Figure 13b that processing the texture on the surface of the lower sample can effectively reduce the wear, and the wear loss of the lower sample is smaller than that of the smooth surface sample. On the other hand, the texture pits are processed on the surface of the lower sample. The wear debris particles generated during the test are stored in the pits, which also indirectly reduces the wear loss of the lower sample. By comparing the wear loss between the samples under different area ratios, it is found that the difference between them is very small, and no obvious change rule is found. In general, the wear loss of the samples under the square cylindrical texture is smaller, and the wear loss of the samples under the square cylindrical texture with an area ratio of 20% is the smallest, and the wear reduction effect is the best.

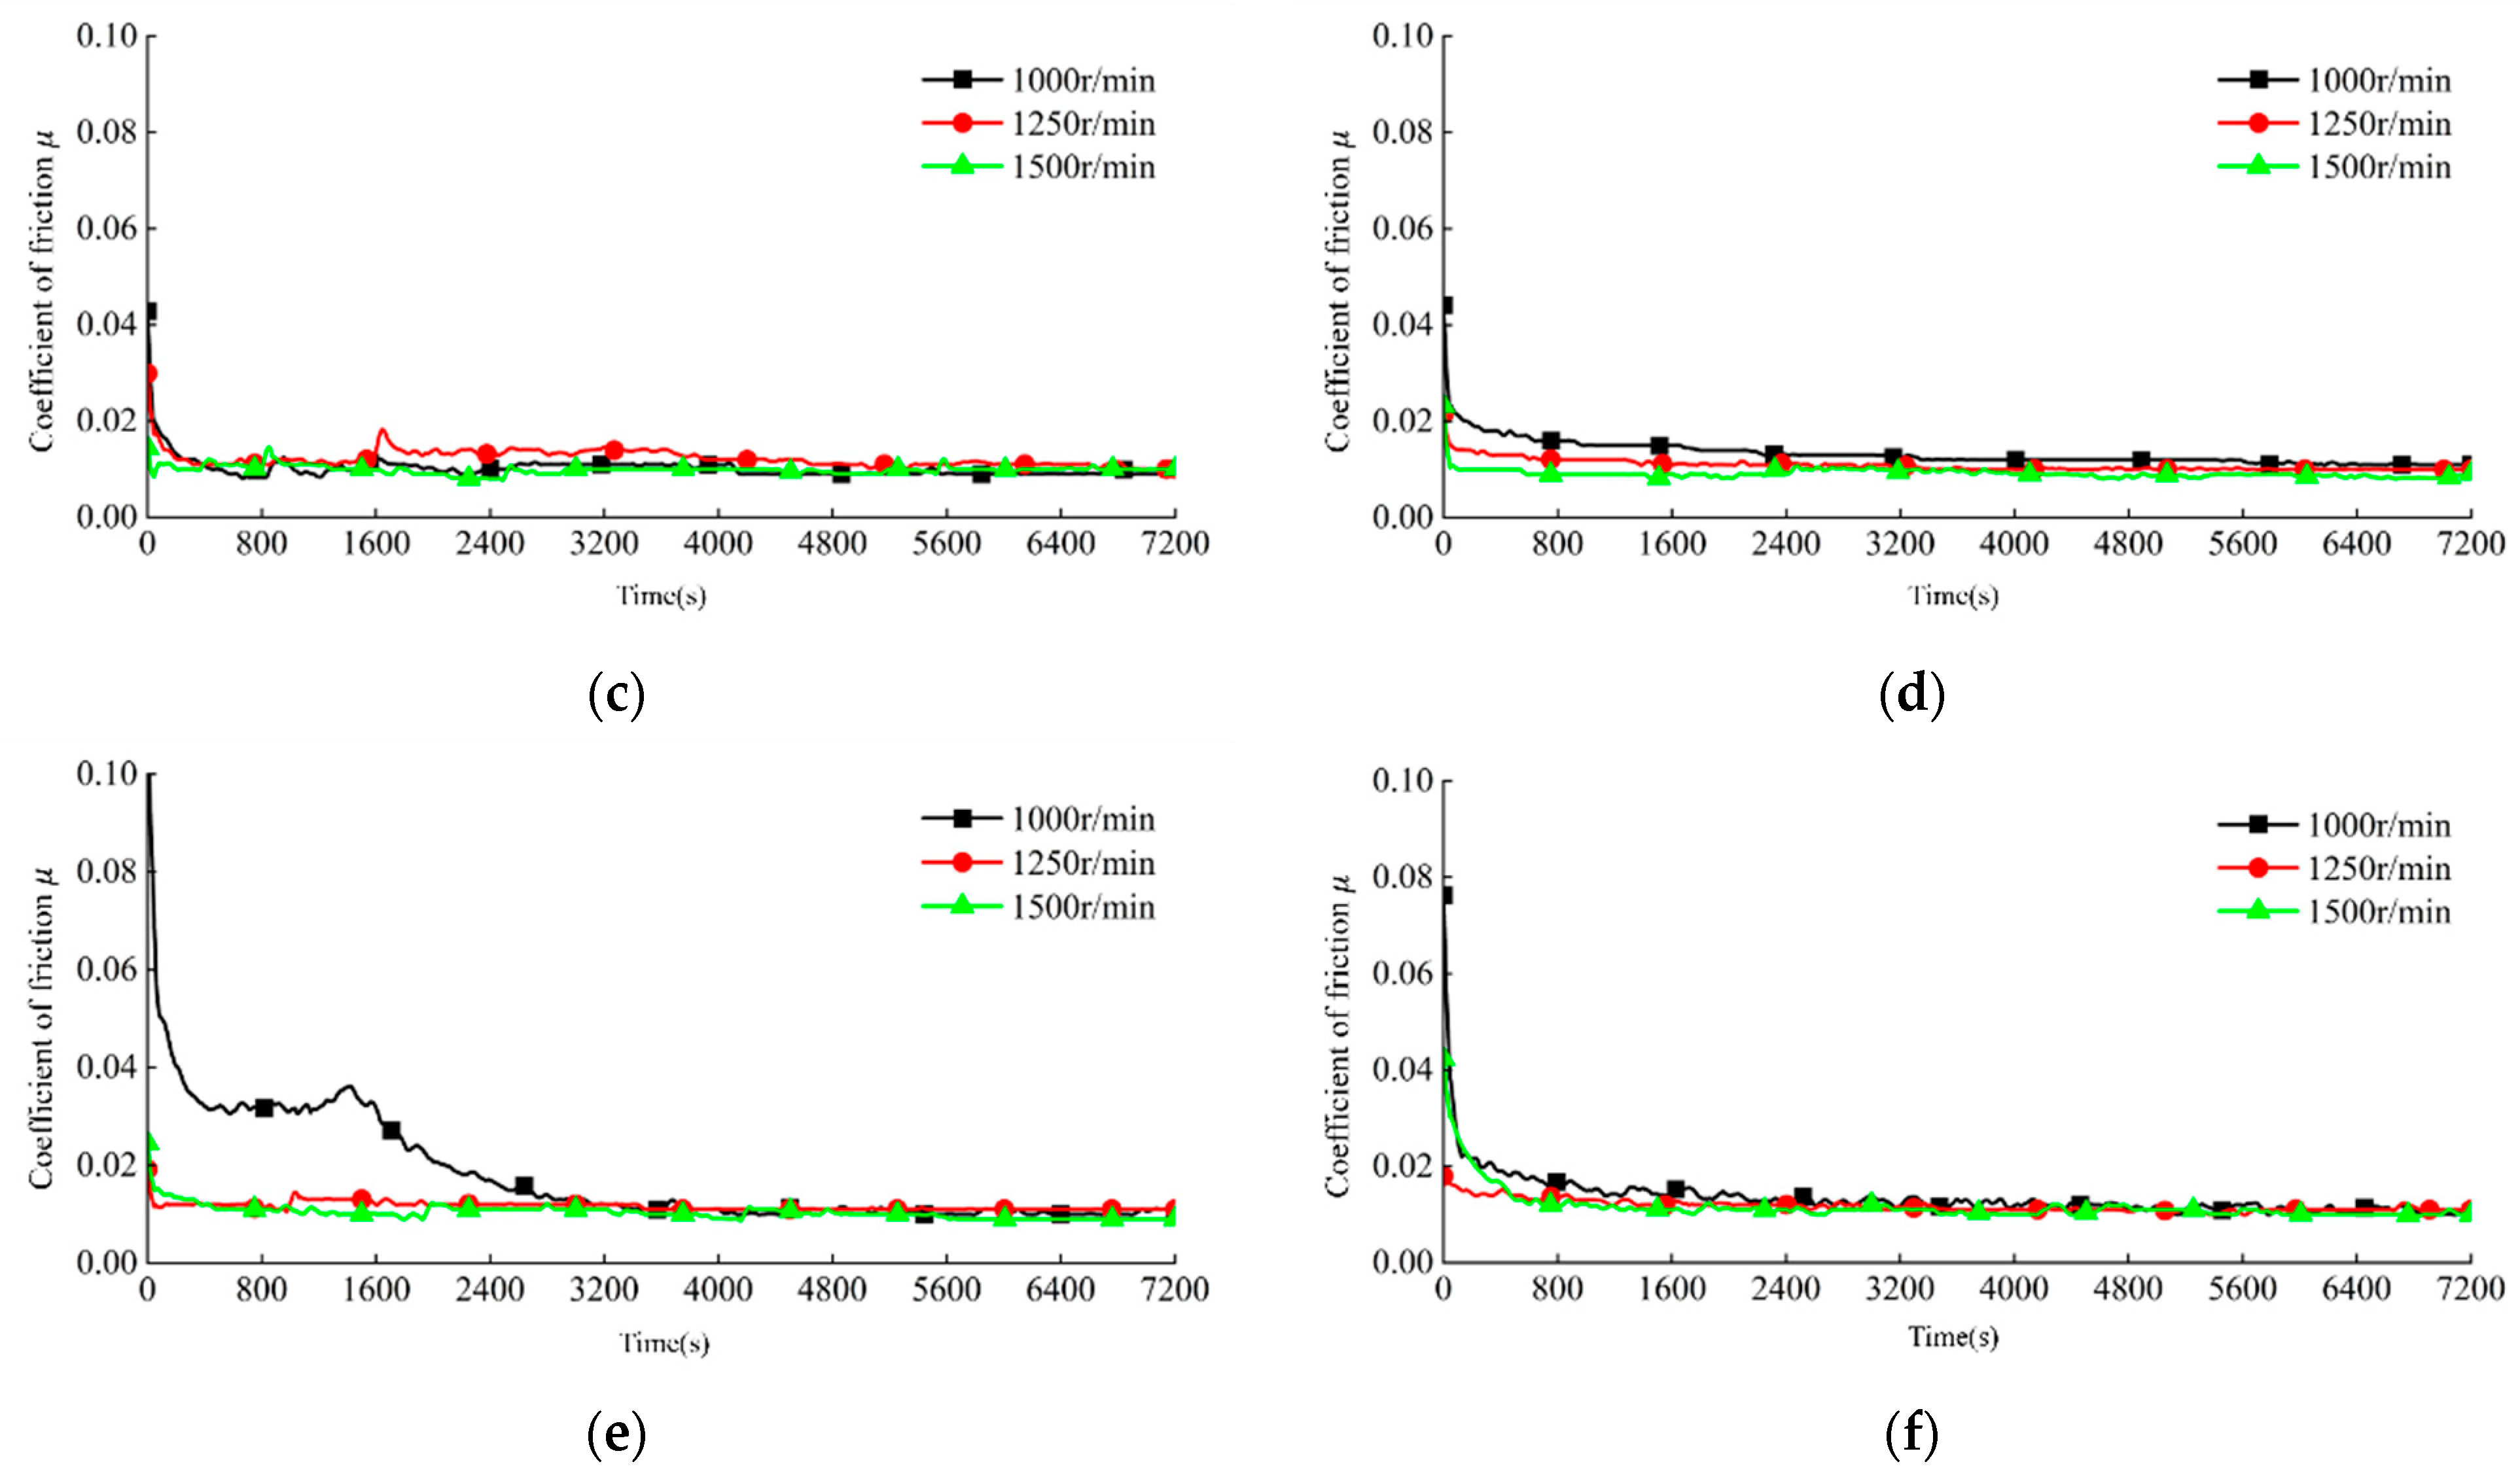
3.2.2. Rotational Speed

It can be found from Figure 14a,c,e that the friction coefficient difference of the textured flow distribution pair with an area ratio of 10% is about 0.003 at 1000 r/min and 1500 r/min. The area ratio was 15%, with a difference of 0.002; the area ratio was 20%, with a difference of 0.001. It can be seen that the friction coefficient of the textured flow distribution pairs with different area ratios decreases with the increase in the rotational speed. When the area ratio is larger, the effect of changing the rotational speed on the friction coefficient is smaller. This shows that increasing the texture area ratio can effectively improve the stability of the friction and wear of the port plate pairs. The larger the rotational speed, the shorter the time required for the friction coefficient to reach a steady state for the first time.
It can be found from Figure 14b,d,f that changing the rotational speed has a certain influence on the friction coefficient of the textured flow distribution pair. Among them, when the area ratio is 10%, the influence of the rotational speed on the friction coefficient is the most obvious. When the area ratio is 15%, the difference in the friction coefficient is obvious in the early stage of the test, and the difference is very small in the later stage of the test. When the area ratio is 20%, the friction coefficient is least affected by the rotational speed, and the friction coefficient at different rotational speeds is very small.
It can be seen from Figure 15 that, with the increase of rotational speed, the dynamic pressure effect increases the bearing capacity of the water film and slows down the direct contact between the friction interfaces, and the wear of the lower sample shows a decreasing trend.

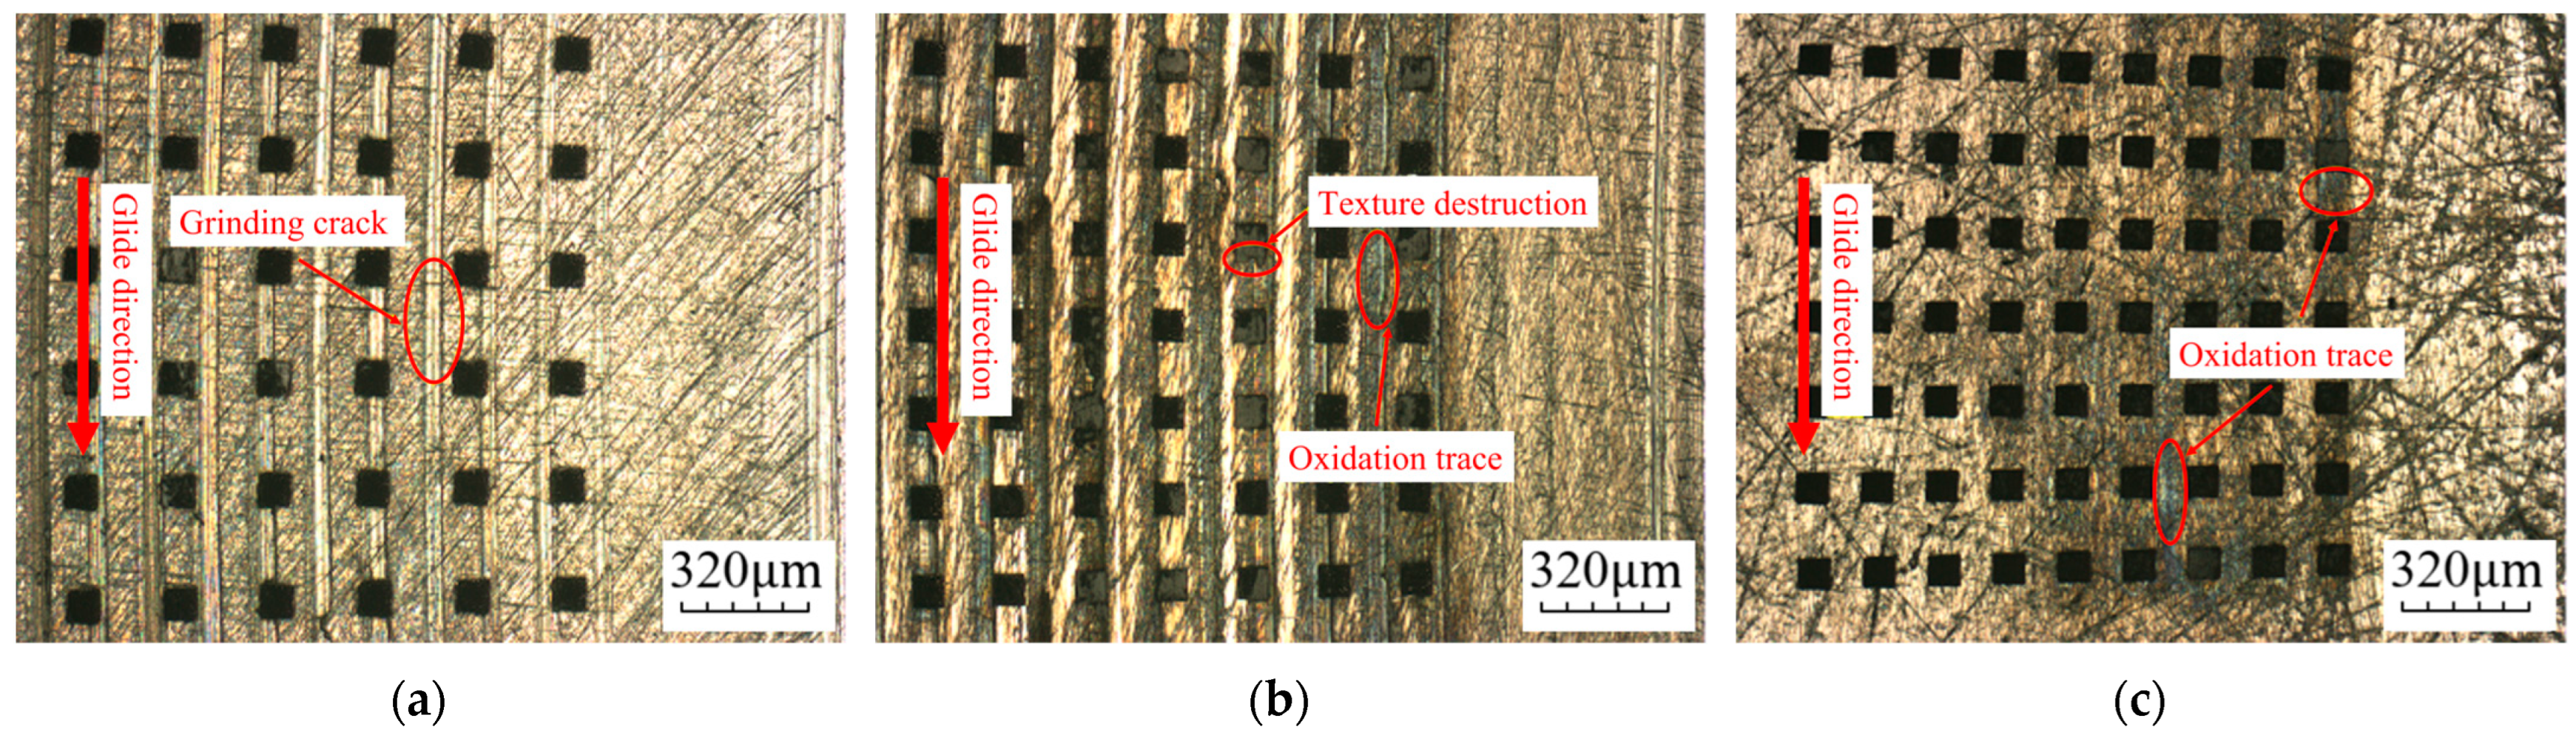
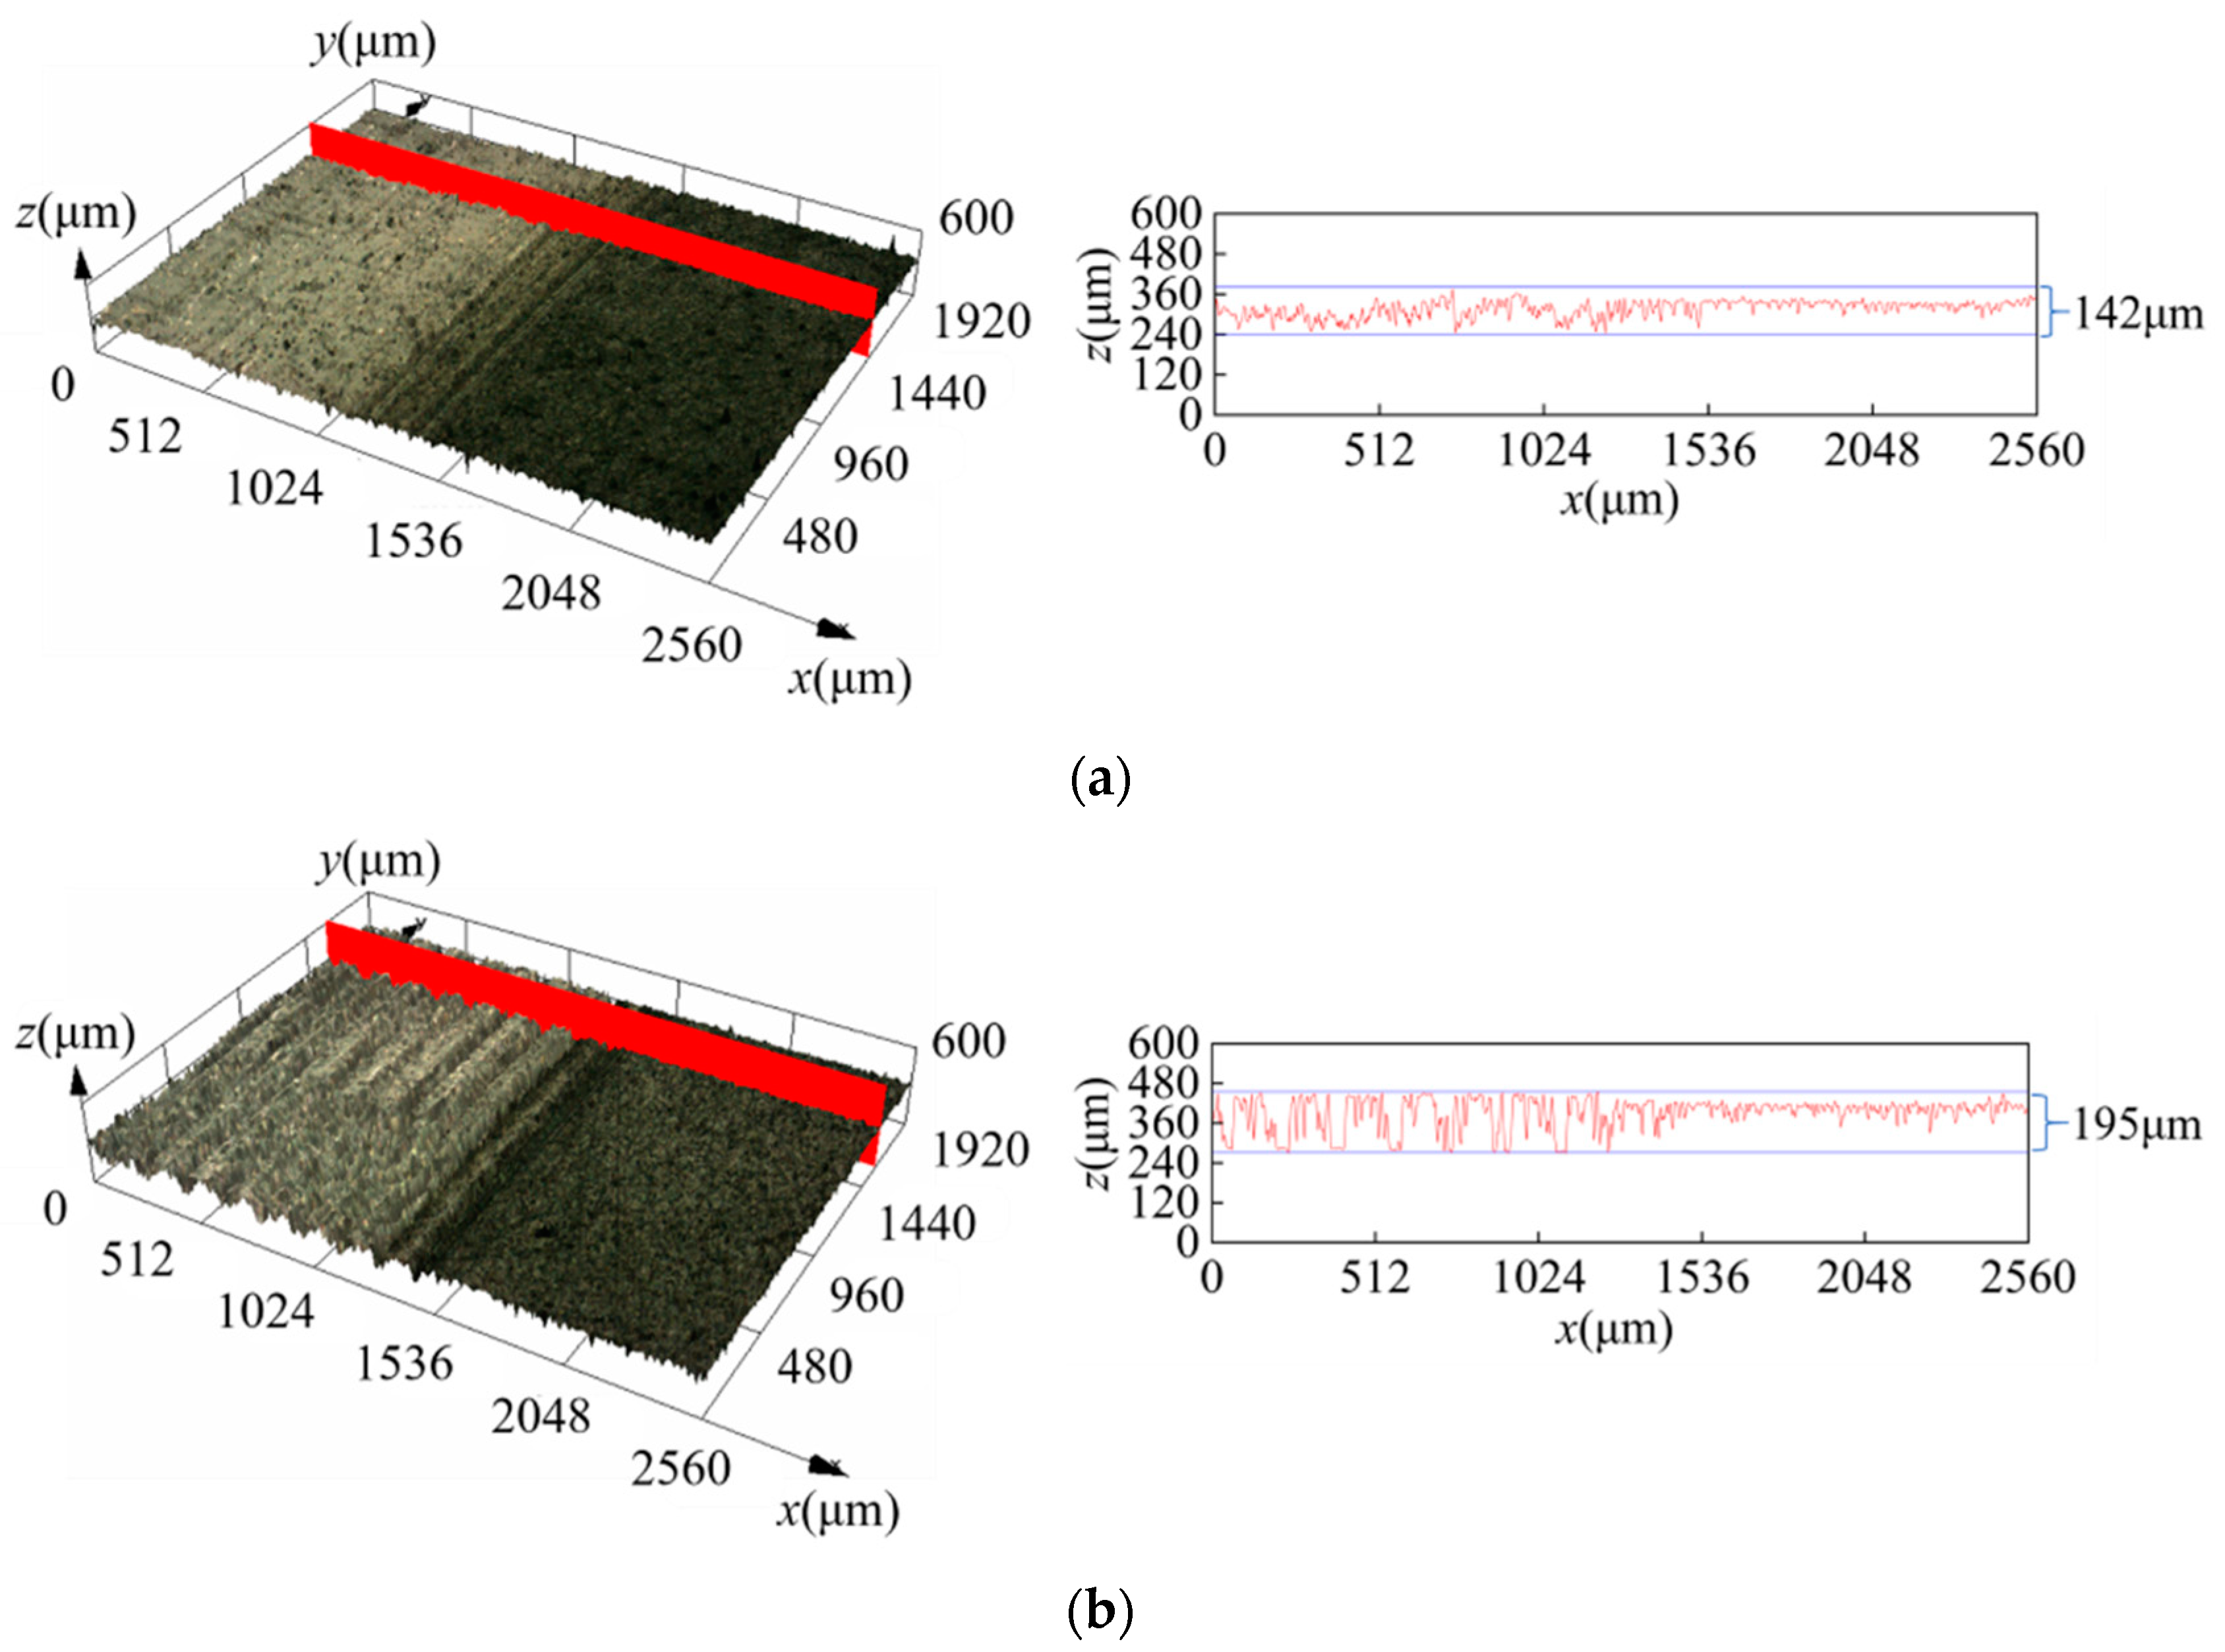
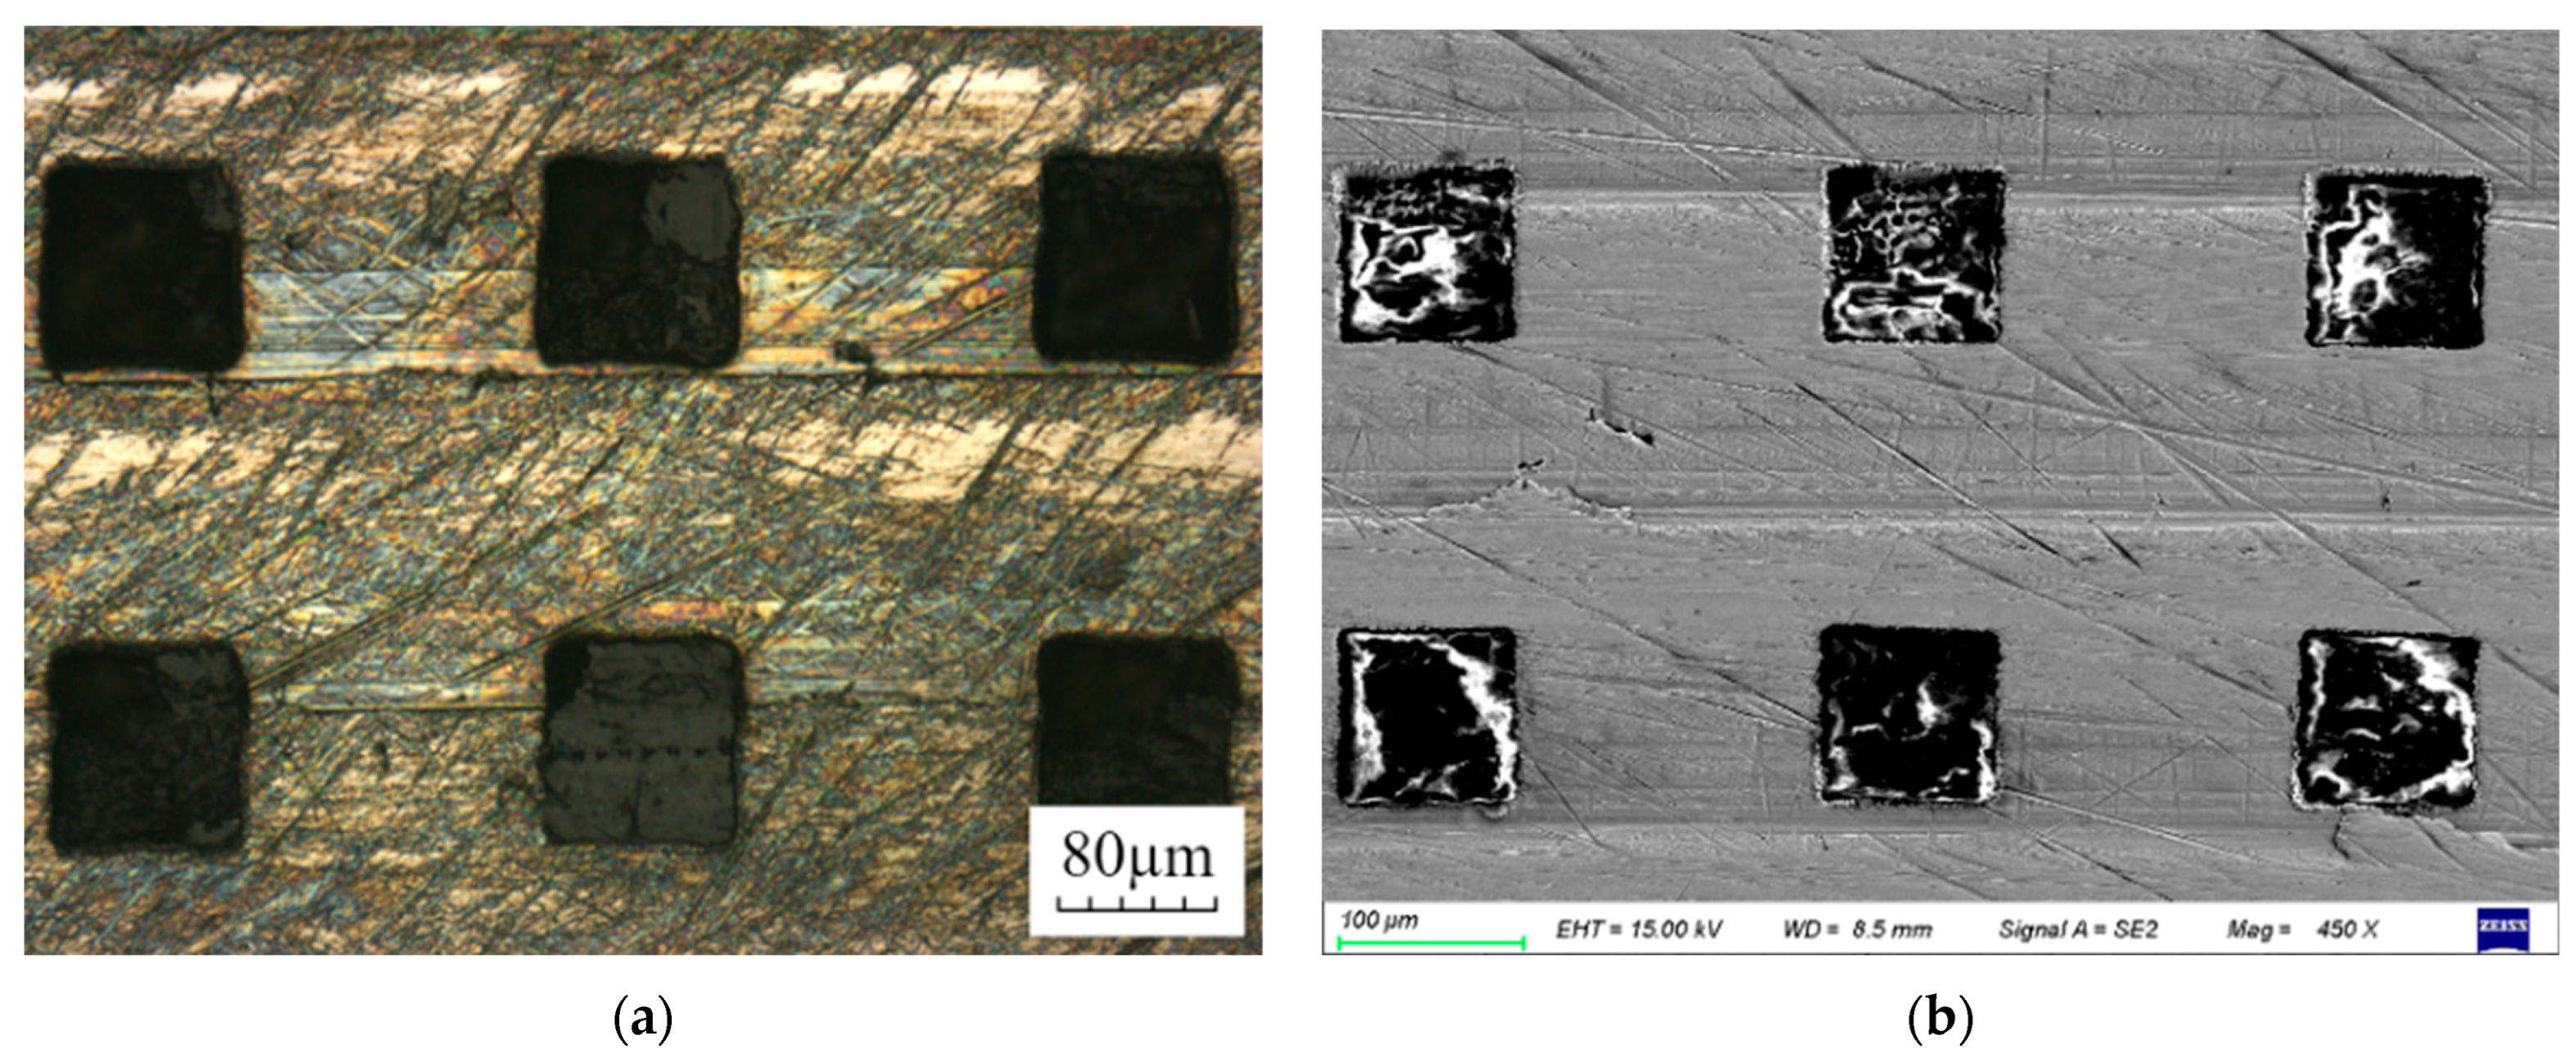
3.2.3. Wear Morphology

Comparing Figure 16 and Figure 17, it can be found from the diagram that the surface wear of the textured sample with an area ratio of 10% is the most serious. The surface wear marks of the textured samples with an area ratio of 15% were reduced, gray oxidation marks and dark yellow corrosion marks appeared in some areas, and flaky black substances appeared in some areas. The surface of the textured sample with an area ratio of 20% has the least wear marks, and the initial surface is almost not damaged. There is obvious black wear debris deposition in the texture pits.
Comparing Figure 18 and Figure 19, it can be found from the morphology of the low-magnification microscope that there are many small scratches in the wear area. The morphology difference between the wear area and the unworn area of the sample is more obvious. The color of the wear area becomes brighter, and many small white bright spots appear. Combined with the morphology under high magnification, it can be found that these white bright spots are carbon fibers that have been seriously worn. The original short carbon fibers become larger after wear and have been completely exposed to the surface of the sample. The carbon fibers in some areas are peeled off to form pits.
Comparing the cross-section of Figure 20, it can be found that the difference between the highest point and the lowest point of the wear mark of the sample under the cylindrical texture flow distribution pair is the smallest, which is 142 μm. The difference between the highest point and the lowest point of the wear mark of the sample under the square cylindrical texture flow distribution pair is the largest, reaching 195 μm. Combined with Figure 15, Figure 16, Figure 17 and Figure 18, it can be found that the wear of the sample under the cylindrical texture flow distribution pair is the smallest, and the tribological performance is the best.
Figure 21 shows the morphology of the laser confocal microscope and scanning electron microscope. It can be found from the analysis results of the energy spectrum elements inside the square cylindrical texture in Figure 22 that the mass fraction of C element increased to 68.4%, which became the element with the highest mass ratio in the pits. The increase in the C element indicated that a large amount of carbon fibers from the surface of the CF/PEEK lower sample were stored inside the textured pits. During the wear process, more abrasive particles were generated on the surface of the lower sample. Some of these abrasive particles were separated from the friction surface under the driving of the rotational motion, and the other part was captured and stored by the textured pits and did not participate in friction and wear. Before friction and wear, iron oxides existed on the surface of stainless steel, but, after the test, the mass fraction of the O element in the pit was 19.4%, indicating that additional oxide was formed during the friction and wear process, and oxidation wear occurred. The oxide was crushed and worn into granular abrasive grains stored in the texture pit. Trace amounts of the Cl, Na, and Ca elements were also found in the texture pits, which were derived from crystalline salts in seawater. The scanning images of different element surfaces in Figure 23 can also confirm the element distribution on the worn surface of texture pits.
It can be found from Figure 24 that, after friction and wear, a clear wear mark appeared on the surface of the upper sample along the movement direction, and the surface of the wear mark became smoother, indicating that the oxide film on the surface of the sample was worn out to expose the inside of the material. Ablative furrows also appeared on some surfaces, and there were obvious gray oxidation marks on both sides of the furrows, indicating that the hard abrasive particles in the seawater were mixed into the moving port plate, and the friction extrusion between the hard abrasive particles and the surface of the upper sample with the same high hardness caused the local temperature to rise, resulting in the ablation phenomenon.
By comparing the surface of the cylindrical texture samples with different area ratios from Figure 25, it is found that the surface morphology of the samples with area ratios of 10% and 15% is similar. There are slight scratches and friction marks on the surface, and the color of the friction serious area is obviously brightened. Most of the textures are well-preserved, no obvious damage is found, and some of the textures are filled with substances, which is presumed to be the wear debris falling off the surface of the lower sample during the friction and wear process. Combined with the morphology under high magnification, it can be seen that the surface of the sample is less worn, and some short carbon fibers become longer after wear compared with before the test. The overall wear of the surface of the sample with an area rate of 20% is more serious, and the surface wear marks are deeper. The original surface morphology of the sample is all replaced by wear marks. There are obvious furrow-like wear marks in some areas, indicating that serious abrasive wear occurs. Some textures were obviously damaged. Combined with the morphology of the high-magnification microscope, it can be seen that there were more wear marks on the surface of the sample, and the carbon fiber was seriously worn and irregularly broken. Some of the severely worn carbon fibers fell off to form irregular pits.
Comparing the surface of the square cylindrical textured samples with different area ratios from Figure 26, the surface morphology of the textured samples with different area ratios is not much different. The surface has furrow-like wear marks along the movement direction of the port plate pair, indicating that the wear mechanism is still dominated by abrasive wear. The original surface morphology of the sample is replaced by friction marks, and the color of the wear area becomes brighter, but the edge of the texture shape is well-preserved and no obvious wear is found. Combined with the morphology under high magnification, it can be seen that the brightness of the area after wear is improved because the carbon fiber originally covered under the surface becomes smoother after wear, directly exposed on the surface, and some wear areas have shallow friction traces.
It can be seen from the comparison that there are obvious friction marks on the wear surface of the textured lower sample, and obvious grooves and furrow-like wear marks appear in the area with serious wear. Most of the carbon fibers on the textured surface are exposed to the surface of the sample after wear. Some carbon fibers fall off due to wear and form irregular pits. Some texture pits are damaged and fail after wear, which is different from the texture processed on the surface of the upper sample. Due to the large hardness of the surface of the sample on SAF2507, the processed texture will only undergo small shape changes after severe wear, and almost no failure will occur.
By comparing Figure 27 and Figure 28, it can be found that the mass fraction of the C element on the surface of the upper sample of the textured lower sample flow distribution pair is less than the smooth flow distribution pair after wear. This shows that the carbon fiber abrasive particles involved in the friction and wear of the textured lower sample are less. After the test, the surface of the upper sample is bonded with less carbon element, indicating that the texture pits on the surface of the lower sample can effectively play the role of storing abrasive particles and wear debris, reducing the number of abrasive particles involved in friction and wear, showing better friction and wear performance.

4. Conclusions

In this paper, the friction and wear test under seawater lubrication is simulated. The surface coating technology and surface texture technology are used to treat the flow distribution pair of axial piston pumps. The effects of the two methods on the surface tribological properties are investigated, and the corresponding mechanisms of their effects on wear resistance are studied and clarified. The conclusions are as follows:
  • Under the condition of a 1000 r/min rotational speed, the friction coefficient of the double-hydrophobic flow distribution pair is not the smallest, but, from the stability of the wear process, the temperature change of the lubricating medium, and the wear surface morphology, the friction and wear performance of the double-hydrophobic surface is the best. This is because the surface free energy of the double-hydrophobic surface is low, which is beneficial to the occurrence of boundary slip, and the velocity slip is generated between the solid–liquid interface, which greatly reduces the friction force and plays a wear-reducing effect.
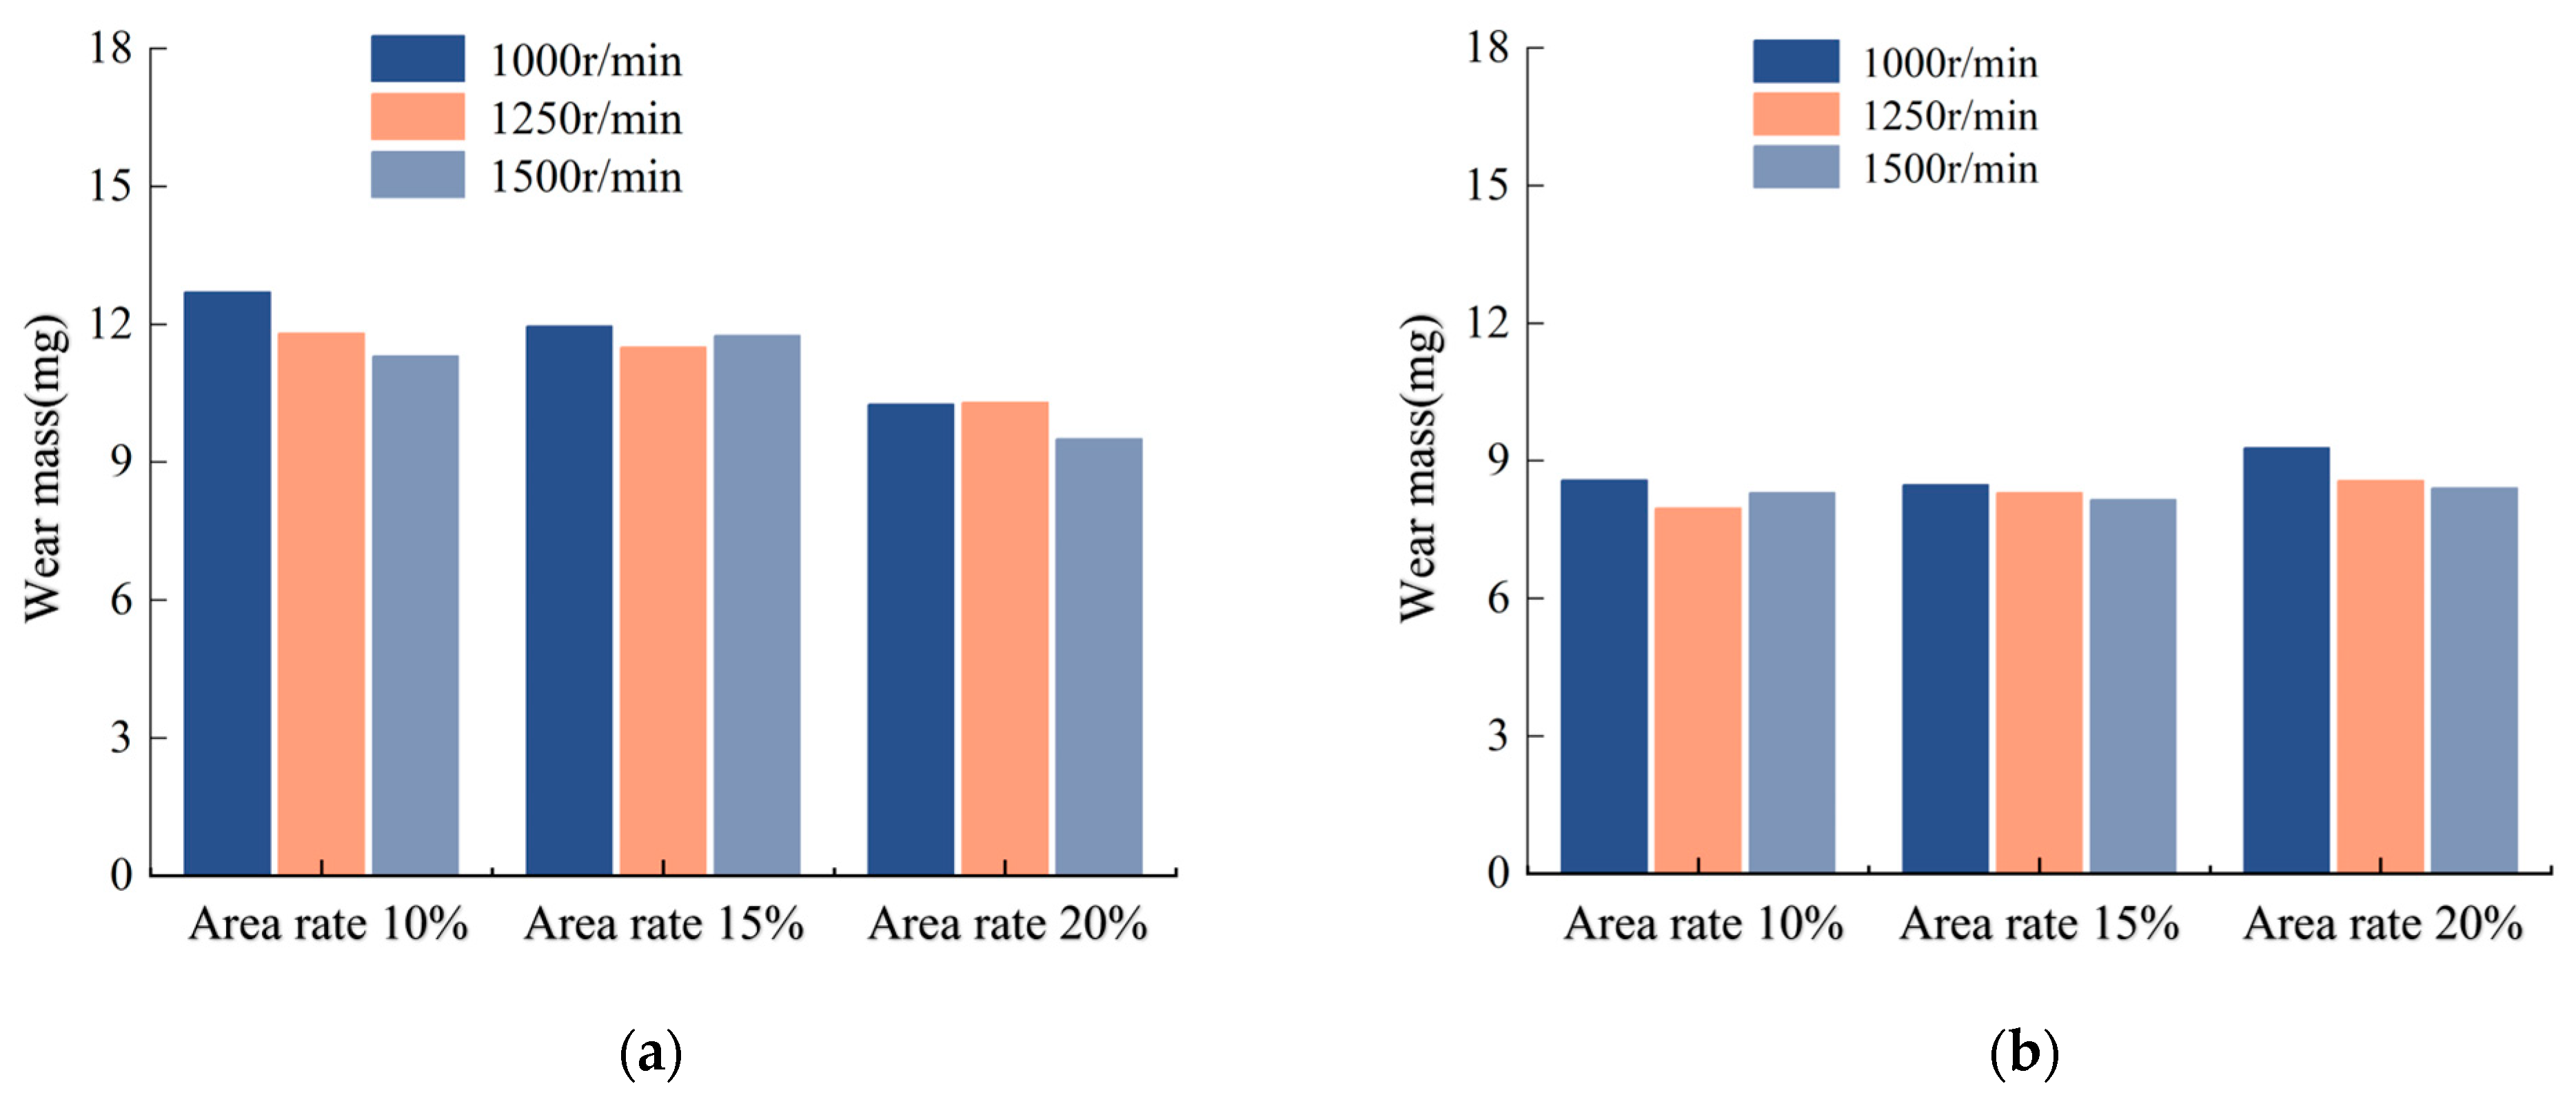
  • The friction and wear properties of the combination of the smooth upper sample and the surface textured lower sample are better than the combination of the surface textured upper sample and the smooth lower sample, and the square cylindrical texture shows better anti-friction and wear resistance. The friction coefficient increases with the increase in the area ratio, and the friction coefficient increases with the increase in the rotational speed. Since the hardness of SAF2507 is higher than that of CF/PEEK, when the texture is processed on the upper sample, the texture edge will cut the softer surface of the lower sample during the relative motion process, causing certain damage to the surface of the lower sample. When the texture is processed in the lower sample, the texture edge will not have a cutting effect on the surface of the other sample, and it will not appear during the friction and wear process. The square cylindrical texture is superior to the cylindrical texture, because the fluid will flow along the cylindrical wall towards both sides after entering the cylindrical texture, so the dynamic pressure effect is not good, while the square cylindrical texture will not produce this phenomenon.
  • Under seawater lubrication, the friction and wear reduction effect of the surface texture flow distribution pair is better than that of the surface coating. When the area ratio of texture on the sample is 10%, the wear is more serious. S-20% ST has better friction and wear performance.

Author Contributions

Conceptualization, Y.L. and D.G.; methodology, Y.L.; software, W.W.; validation, X.L., H.X. and C.W.; formal analysis, Z.Z., W.W. and M.S.; investigation, Z.Z.; resources, X.L. and M.S.; data curation, X.L.; writing—original draft preparation, Y.L., Z.Z., X.L. and W.W.; writing—review and editing, D.G., M.S., H.X. and C.W.; visualization, Y.L.; supervision, D.G.; project administration, D.G.; funding acquisition, Y.L. and D.G. All authors have read and agreed to the published version of the manuscript.

Funding

This research was supported by the National Natural Science Foundation of China (Grant No. 52005428), the Hebei Natural Science Foundation (Grant No. E2020203107 and Grant No. E2021203099), and the Open Fund Project of Shaanxi Provincial Key Laboratory of Hydraulic Technology (No. YYJS2022KF04).

Institutional Review Board Statement

Not applicable.

Informed Consent Statement

Not applicable.

Data Availability Statement

All data generated or analyzed during this study are included in this article.

Conflicts of Interest

The authors declare no conflicts of interest.

References

  1. Liang, Y.N.; Gao, D.R.; Chen, B. Friction and wear study on friction pairs with a biomimetic non-smooth surface of 316L relative to CF/PEEK under a seawater lubricated condition. Chin. J. Mech. Eng. 2019, 32, 66. [Google Scholar] [CrossRef]
  2. Cheng, B.X.; Duan, H.T.; Chen, Q. Effect of laser treatment on the tribological performance of polyetheretherketone (PEEK) under seawater lubrication. Appl. Surf. Sci. 2021, 566, 150668. [Google Scholar] [CrossRef]
  3. Ma, Z.H.; Nie, S.L.; Yin, F.L. Lifetime prediction of WC-6Ni/SiC friction pair under seawater lubrication using an Inverse Gaussian model. Ceram. Int. 2022, 48, 463–471. [Google Scholar] [CrossRef]
  4. Gheisari, R.; Polycarpou, A.A. Effect of surface microtexturing on seawater-lubricated contacts under starved and fully-flooded conditions. Tribol. Int. 2020, 148, 106339. [Google Scholar] [CrossRef]
  5. Pujar, V.; Devarajaiah, R.M.; Suresha, B.; Bharat, V. A review on mechanical and wear properties of fiber-reinforced thermoset composites with ceramic and lubricating fillers. Mater. Today Proc. 2021, 46, 7701–7710. [Google Scholar] [CrossRef]
  6. Hong, H.C.; Zhao, C.X.; Zhang, B. Flow Ripple Reduction of Axial-Piston Pump by Structure Optimizing of Outlet Triangular Damping Groove. Processes 2020, 8, 1664. [Google Scholar] [CrossRef]
  7. Jiang, J.H.; Wang, Z.B. Optimization and Influence of Micro-Chamfering on Oil Film Lubrication Characteristics of Slipper/Swashplate Interface within Axial Piston Pump. Energies 2021, 14, 1961. [Google Scholar] [CrossRef]
  8. Zhang, Z.H.; Nie, S.L.; Yuan, S.H. Comparative Evaluation of Tribological Characteristics of CF/PEEK and CF/PTFE/Graphite Filled PEEK Sliding against AISI630 Steel for Seawater Hydraulic Piston Pumps/Motors. Tribol. Trans. 2015, 58, 1096–1104. [Google Scholar] [CrossRef]
  9. Schuhler, G.; Jourani, A.; Bouvier, S. Efficacy of coatings and thermochemical treatments to improve wear resistance of axial piston pumps. Tribol. Int. 2018, 126, 376–385. [Google Scholar] [CrossRef]
  10. Zhao, J.G.; Fu, Y.L.; Wang, M.K. Experimental research on tribological characteristics of TiAlN coated valve plate in electro-hydrostatic actuator pumps. Tribol. Int. 2021, 155, 106782. [Google Scholar] [CrossRef]
  11. Wu, D.F.; Liu, Y.S.; Zhao, X.F. The Tribological Behaviors of Different Mass Ratio Al2O3-TiO2 Coatings in Water Lubrication Sliding against Si3N4. Tribol. Trans. 2016, 59, 352–362. [Google Scholar] [CrossRef]
  12. Fesanghary, M.; Khonsari, M.M. On the optimum groove shapes for load-carrying capacity enhancement in parallel flat surface bearings: Theory and experiment. Tribol. Int. 2013, 67, 254–262. [Google Scholar] [CrossRef]
  13. He, T.; Zhu, D.; Wang, J.X. Experimental and Numerical Investigations of the Stribeck Curves for Lubricated Counterformal Contacts. J. Tribol. 2017, 139, 021505. [Google Scholar] [CrossRef]
  14. Ryk, G.; Etsion, I. Testing piston rings with partial laser surface texturing for friction reduction. Wear 2006, 261, 792–796. [Google Scholar] [CrossRef]
  15. Zhang, H.; Zhang, D.Y.; Hua, M. A Study on the Tribological Behavior of Surface Texturing on Babbitt Alloy under Mixed or Starved Lubrication. Tribol. Lett. 2014, 56, 305–315. [Google Scholar] [CrossRef]
  16. Kovalchenko, A.; Ajayi, O.; Erdemir, A. The effect of laser surface texturing on transitions in lubrication regimes during unidirectional sliding contact. Tribol. Int. 2005, 38, 219–225. [Google Scholar] [CrossRef]
  17. Amanov, A.; Tsuboi, R.; Oe, H. The influence of bulges produced by laser surface texturing on the sliding friction and wear behavior. Tribol. Int. 2013, 60, 216–223. [Google Scholar] [CrossRef]
  18. Pettersson, U.; Jacobson, S. Influence of surface texture on boundary lubricated sliding contacts. Tribol. Int. 2003, 36, 857–864. [Google Scholar] [CrossRef]
  19. Gu, C.; Meng, X.; Xie, Y. Effects of surface texturing on ring/liner friction under starved lubrication. Tribol. Int. 2016, 94, 591–605. [Google Scholar] [CrossRef]
  20. Han, J.; Fang, L.; Sun, J. Hydrodynamic lubrication of microdimple textured surface using three-dimensional CFD. Tribol. Trans. 2010, 53, 860–870. [Google Scholar] [CrossRef]
  21. Vladescu, S.C.; Medina, S.; Olver, A.V. Lubricant film thickness and friction force measurements in a laser surface textured reciprocating line contact simulating the piston ring–liner pairing. Tribol. Int. 2016, 98, 317–329. [Google Scholar] [CrossRef]
  22. Zhang, J.; Meng, Y. Direct observation of cavitation phenomenon and hydrodynamic lubrication analysis of textured surfaces. Tribol. Lett. 2012, 46, 147–158. [Google Scholar] [CrossRef]
  23. Rosenkranz, A.; Costa, H.; Profito, F. Influence of surface texturing on hydrodynamic friction in plane converging bearings—An experimental and numerical approach. Tribol. Int. 2019, 134, 190–204. [Google Scholar] [CrossRef]
  24. Xing, Y.; Li, X.; Hu, R. Numerical analyses of rectangular micro-textures in hydrodynamic lubrication regime for sliding contacts. Meccanica 2021, 56, 365–382. [Google Scholar] [CrossRef]
  25. Liu, W.; Ni, H.; Chen, H. Numerical simulation and experimental investigation on tribological performance of micro-dimples textured surface under hydrodynamic lubrication. Int. J. Mech. Sci. 2019, 163, 105095. [Google Scholar] [CrossRef]
  26. Janssen, A.; Pinedo, B.; Igartua, A. Study on friction and wear reducing surface micro-structures for a positive displacement pump handling highly abrasive shale oil. Tribol. Int. 2017, 107, 1–9. [Google Scholar] [CrossRef]
  27. Zhang, J.H.; Chen, Y.; Xu, B. Effect of surface texture on wear reduction of the tilting cylinder and the valve plate for a high-speed electro-hydrostatic actuator pump. Wear 2018, 414–415, 68–78. [Google Scholar] [CrossRef]
Figure 1. MMD-5A friction and wear tester.
Coatings 14 00415 g001
Figure 2. HARKE–SPCAX1 contact angle tester.
Coatings 14 00415 g002
Figure 3. Ring–disk friction corresponding diagram of upper and lower samples.
Coatings 14 00415 g003
Figure 4. Modification mechanism of PFOTES on upper and lower samples.
Coatings 14 00415 g004
Figure 5. Surface texture sample schematic diagram: (a) the textured upper sample; (b) the lower sample; (c) the upper sample; and (d) the textured lower sample.
Coatings 14 00415 g005
Figure 6. The change of seawater contact angle with time.
Coatings 14 00415 g006
Figure 7. The variation curve of friction coefficient of flow distribution pair with time under different wetting combinations at 1000 r/min.
Coatings 14 00415 g007
Figure 8. The variation curve of seawater temperature with time under different wetting combinations at 1000 r/min.
Coatings 14 00415 g008
Figure 9. Surface morphology of each sample before wear: (a) the upper sample; and (b) the lower sample.
Coatings 14 00415 g009
Figure 10. Comparison of the morphology of the upper samples on the flow distribution pair with different wetting combinations after the test: (a) S-CP; (b) S-LCP; (c) LS-CP; and (d) LS-LCP.
Coatings 14 00415 g010
Figure 11. Comparison of the morphology of the lower samples on the flow distribution pair with different wetting combinations after the test: (a) S-CP; (b) S-LCP; (c) LS-CP; and (d) LS-LCP.
Coatings 14 00415 g011
Figure 12. The friction coefficient of surface textured samples with different area ratios and different texture shapes at rotational speed of 1000 r/min with time: (a) CT-S; (b) ST-S; (c) S-CT; and (d) S-ST.
Coatings 14 00415 g012
Figure 13. Wear loss of CF/PEEK lower sample: (a) textured upper sample–smooth lower sample; and (b) smooth upper sample–textured lower sample.
Coatings 14 00415 g013
Figure 14. The friction coefficient of surface textured samples with different area ratios and cylindrical textures at different rotational speeds varies with time: (a) 10% CT-S; (b) S-10% CT; (c) 15% CT-S; (d) S-15% CT; (e) 20% CT-S; and (f) S-20% CT.
Coatings 14 00415 g014aCoatings 14 00415 g014b
Figure 15. Wear mass of CF/PEEK lower sample at different rotational speeds: (a) textured upper sample–smooth lower sample; and (b) smooth upper sample–textured lower sample.
Coatings 14 00415 g015
Figure 16. The surface morphology of the upper sample after the test of CT-S: (a) area ratio 10%; (b) area ratio 15%; and (c) area ratio 20%.
Coatings 14 00415 g016
Figure 17. The surface morphology of the lower sample after the test of CT-S: (a) area ratio 10%; (b) area ratio 15%; and (c) area ratio 20%.
Coatings 14 00415 g017
Figure 18. The surface morphology of the upper sample after the test of ST-S: (a) area ratio 10%; (b) area ratio 15%; and (c) area ratio 20%.
Coatings 14 00415 g018
Figure 19. The surface morphology of the lower sample after the test of ST-S: (a) area ratio 10%; (b) area ratio 15%; (c) area ratio 20%.
Coatings 14 00415 g019
Figure 20. The three-dimensional morphology and cross-section of the worn surface of the lower sample after the test of the textured upper sample and the smooth lower sample: (a) cylindrical texture; and (b) square cylindrical texture.
Coatings 14 00415 g020
Figure 21. Square cylindrical texture pit wear surface diagram: (a) laser confocal microscope topography; and (b) scanning electron microscope morphology.
Coatings 14 00415 g021
Figure 22. Energy spectrum element diagram inside the square cylindrical texture.
Coatings 14 00415 g022
Figure 23. Square cylindrical texture pit wear surface scanning diagram: (a) carbon; (b) oxygen; (c) iron; (d) chromium; (e) magnesium; and (f) nickel element.
Coatings 14 00415 g023
Figure 24. The surface morphology of the smooth upper sample after the test of the upper sample and the textured lower sample: (a) region 1; (b) region 2; and (c) region 3.
Coatings 14 00415 g024
Figure 25. The surface morphology of the lower sample after the test of S-CT: (a) area ratio 10%; (b) area ratio 15%; and (c) area ratio 20%.
Coatings 14 00415 g025
Figure 26. The surface morphology of the lower sample after the test of S-ST: (a) area ratio 10%; (b) area ratio 15%; and (c) area ratio 20%.
Coatings 14 00415 g026
Figure 27. The surface energy spectrum element diagram of the upper sample of the smooth flow distribution pair after wear.
Coatings 14 00415 g027
Figure 28. The surface energy spectrum element diagram of the upper sample of the textured lower sample flow distribution pair after wear.
Coatings 14 00415 g028
Table 1. Chemical composition of duplex stainless steel SAF2507.
ElementContent/%
C≤0.03
Mn≤1.20
Si≤0.8
S≤0.02
P≤0.035
Cr24.0–26.0
Ni6.0–8.0
Mo3.0–5.0
Cu≤0.5
N0.24–0.32
FeBal.
Table 2. Mechanical properties of duplex stainless steel SAF2507.
Density/(g/cm3)Elasticity Modulus
/GPa
Brinell Hardness
/HB
Elongation
/%
Thermal
Conductance/(W·m−1·k−1)
Coefficient of
Thermal
Expansion/(10−6·°C−1)
Tensile Strength/MPaYield Strength/MPa
8.03200310201513795550
Table 3. The main mechanical properties of CF/PEEK.
Density/(g/cm3)Water
Absorption (24 h)/%
Rockwell Hardness/HRRHeat Distortion Temperature/°CCoefficient of
Thermal
Expansion/(10−6·°C−1)
Tensile Strength/MPaBending Strength/MPaCompressive Strength/MPa
1.40.061073151.5220298240
Table 4. Friction pair combination of surface coating test.
The Upper SampleThe Lower SampleAbbreviation
SAF2507CF/PEEKS-CP
SAF2507Low-surface-energy CF/PEEKS-LCP
Low-surface-energy SAF2507CF/PEEKLS-CP
Low-surface-energy SAF2507Low-surface-energy CF/PEEKLS-LCP
Table 5. Friction pair combination of surface texture test.
The Upper SampleThe Lower SampleAbbreviation
Cylindrical textured surfaceSmooth surfaceCT-S
Square cylindrical textured surfaceSmooth surfaceST-S
Smooth surfaceCylindrical textured surfaceS-CT
Smooth surfaceSquare cylindrical textured surfaceS-ST
Disclaimer/Publisher’s Note: The statements, opinions and data contained in all publications are solely those of the individual author(s) and contributor(s) and not of MDPI and/or the editor(s). MDPI and/or the editor(s) disclaim responsibility for any injury to people or property resulting from any ideas, methods, instructions or products referred to in the content.

