
Influence of Solid Waste Material Content on the Properties of Steel Slag-Waste Clay Brick Ceramic Bricks


Abstract
:1. Introduction
2. Materials and Methods
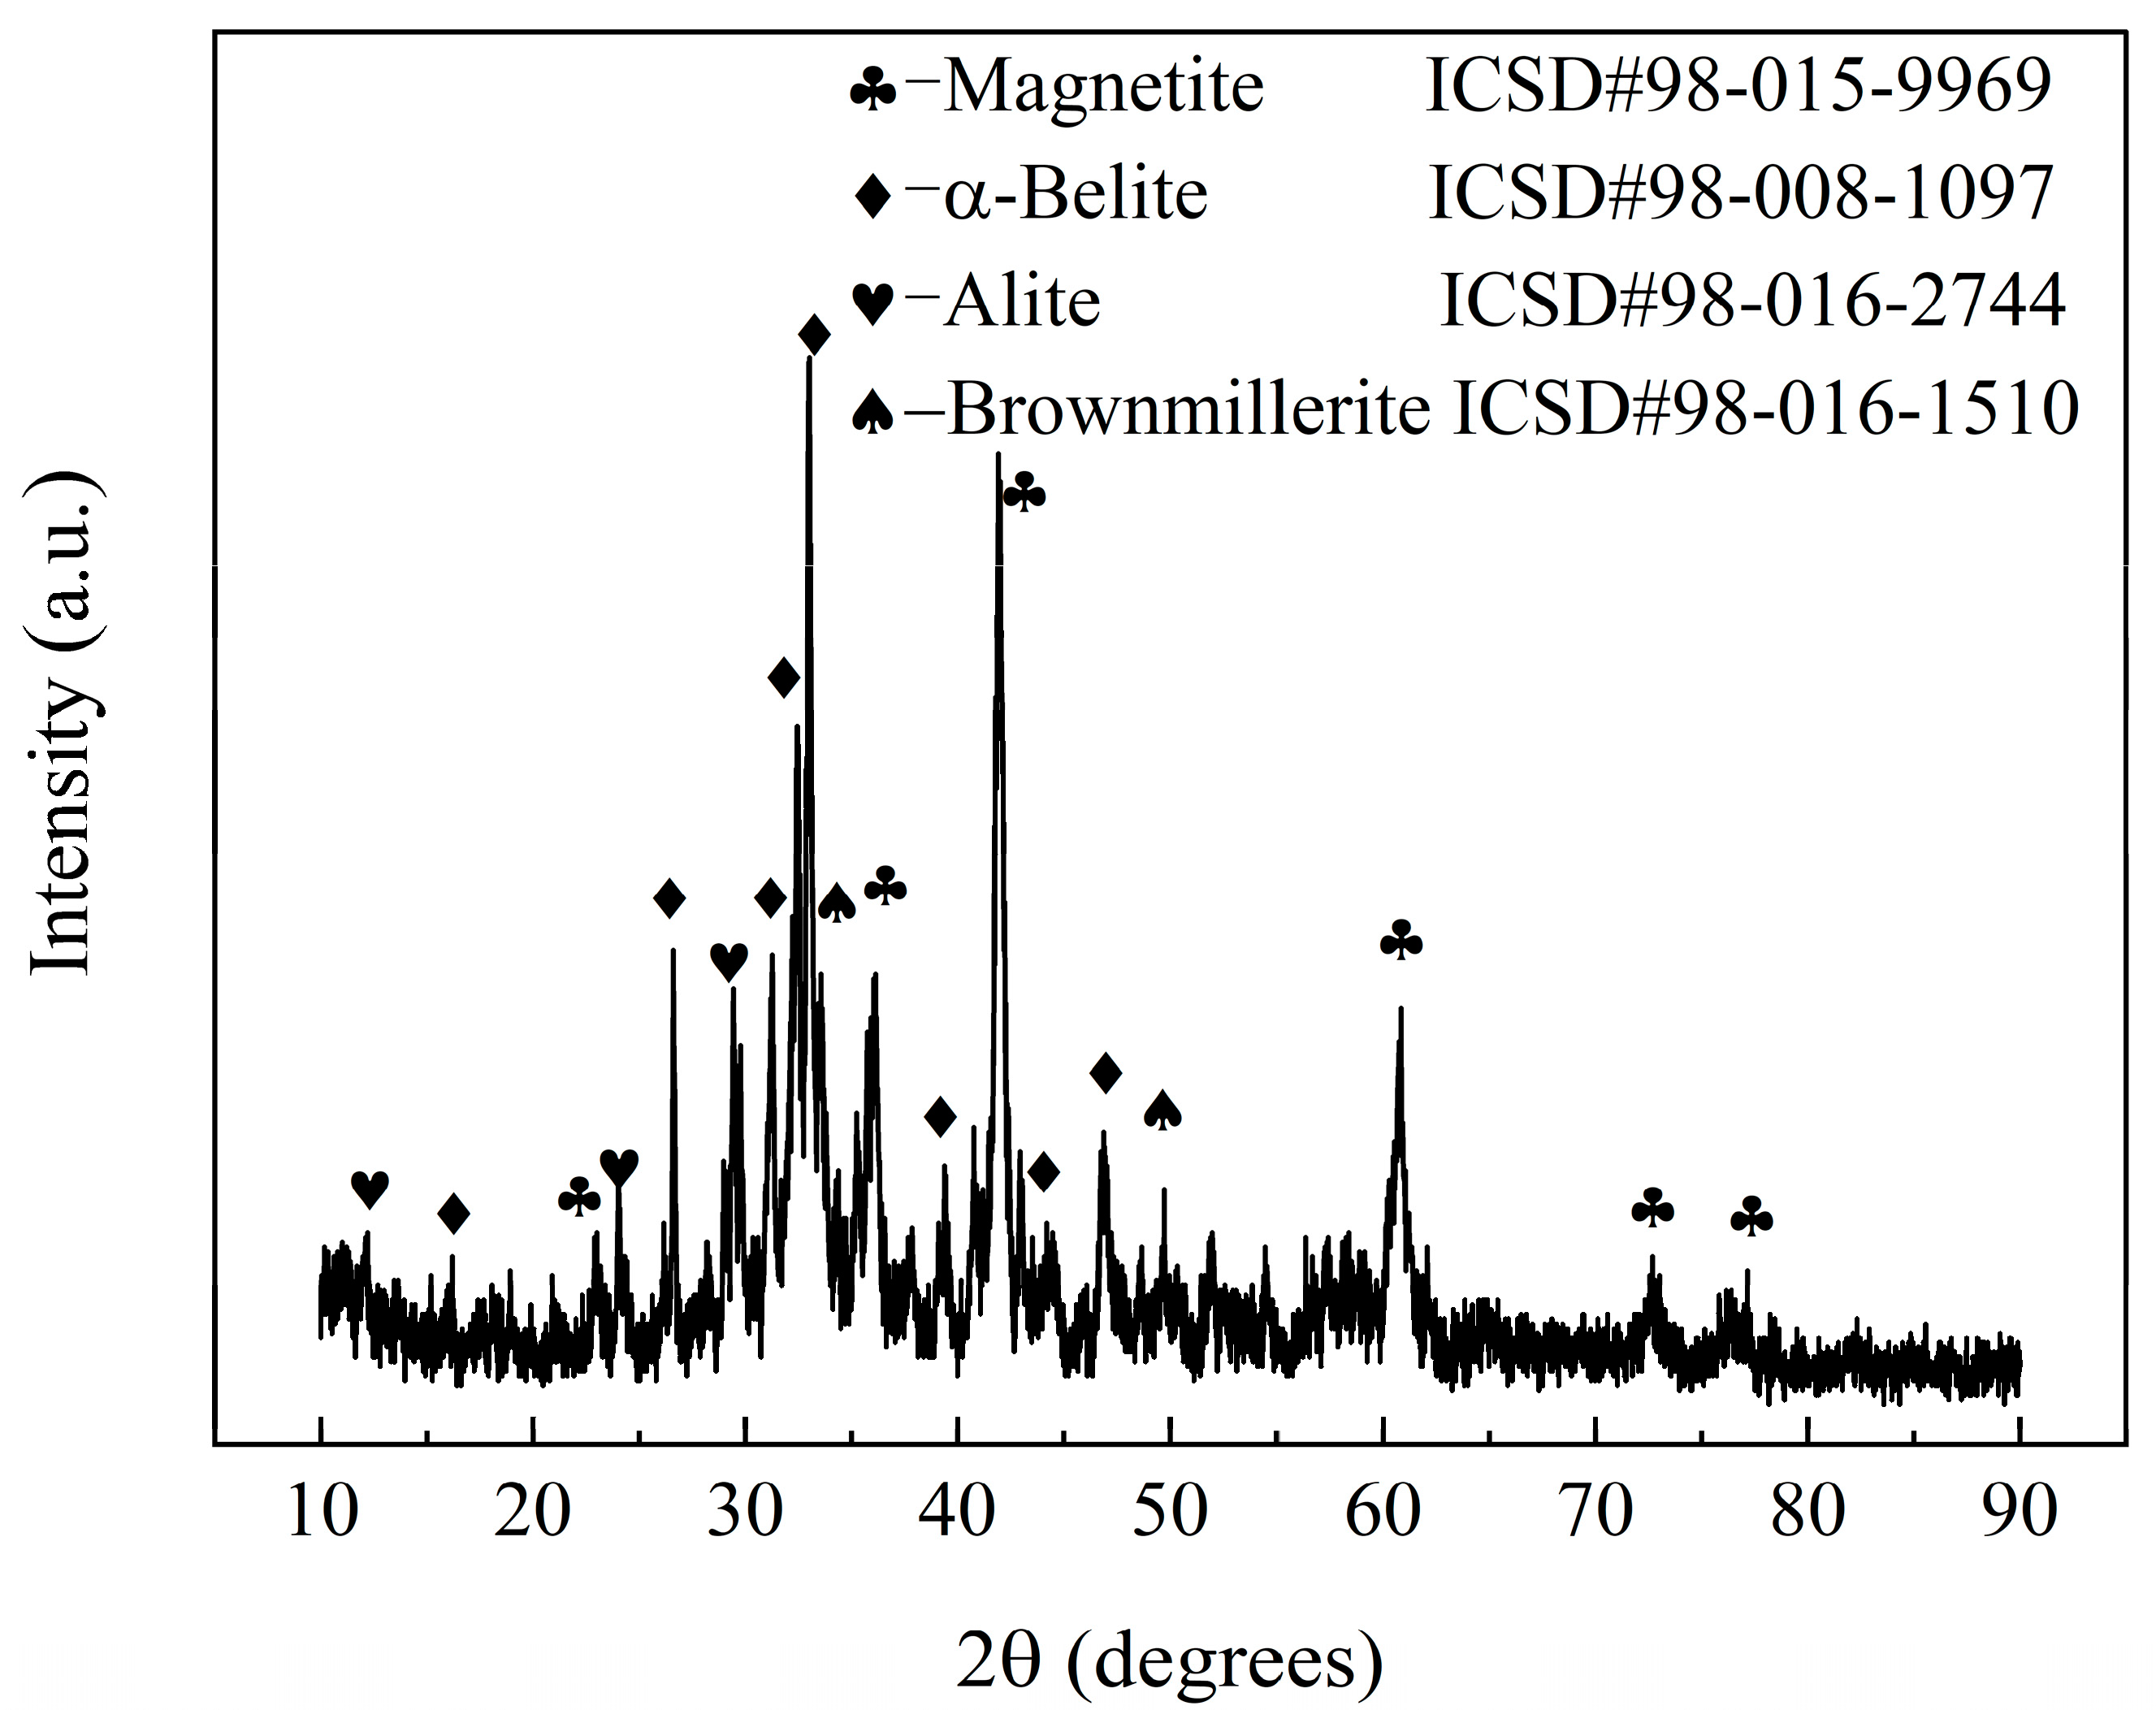
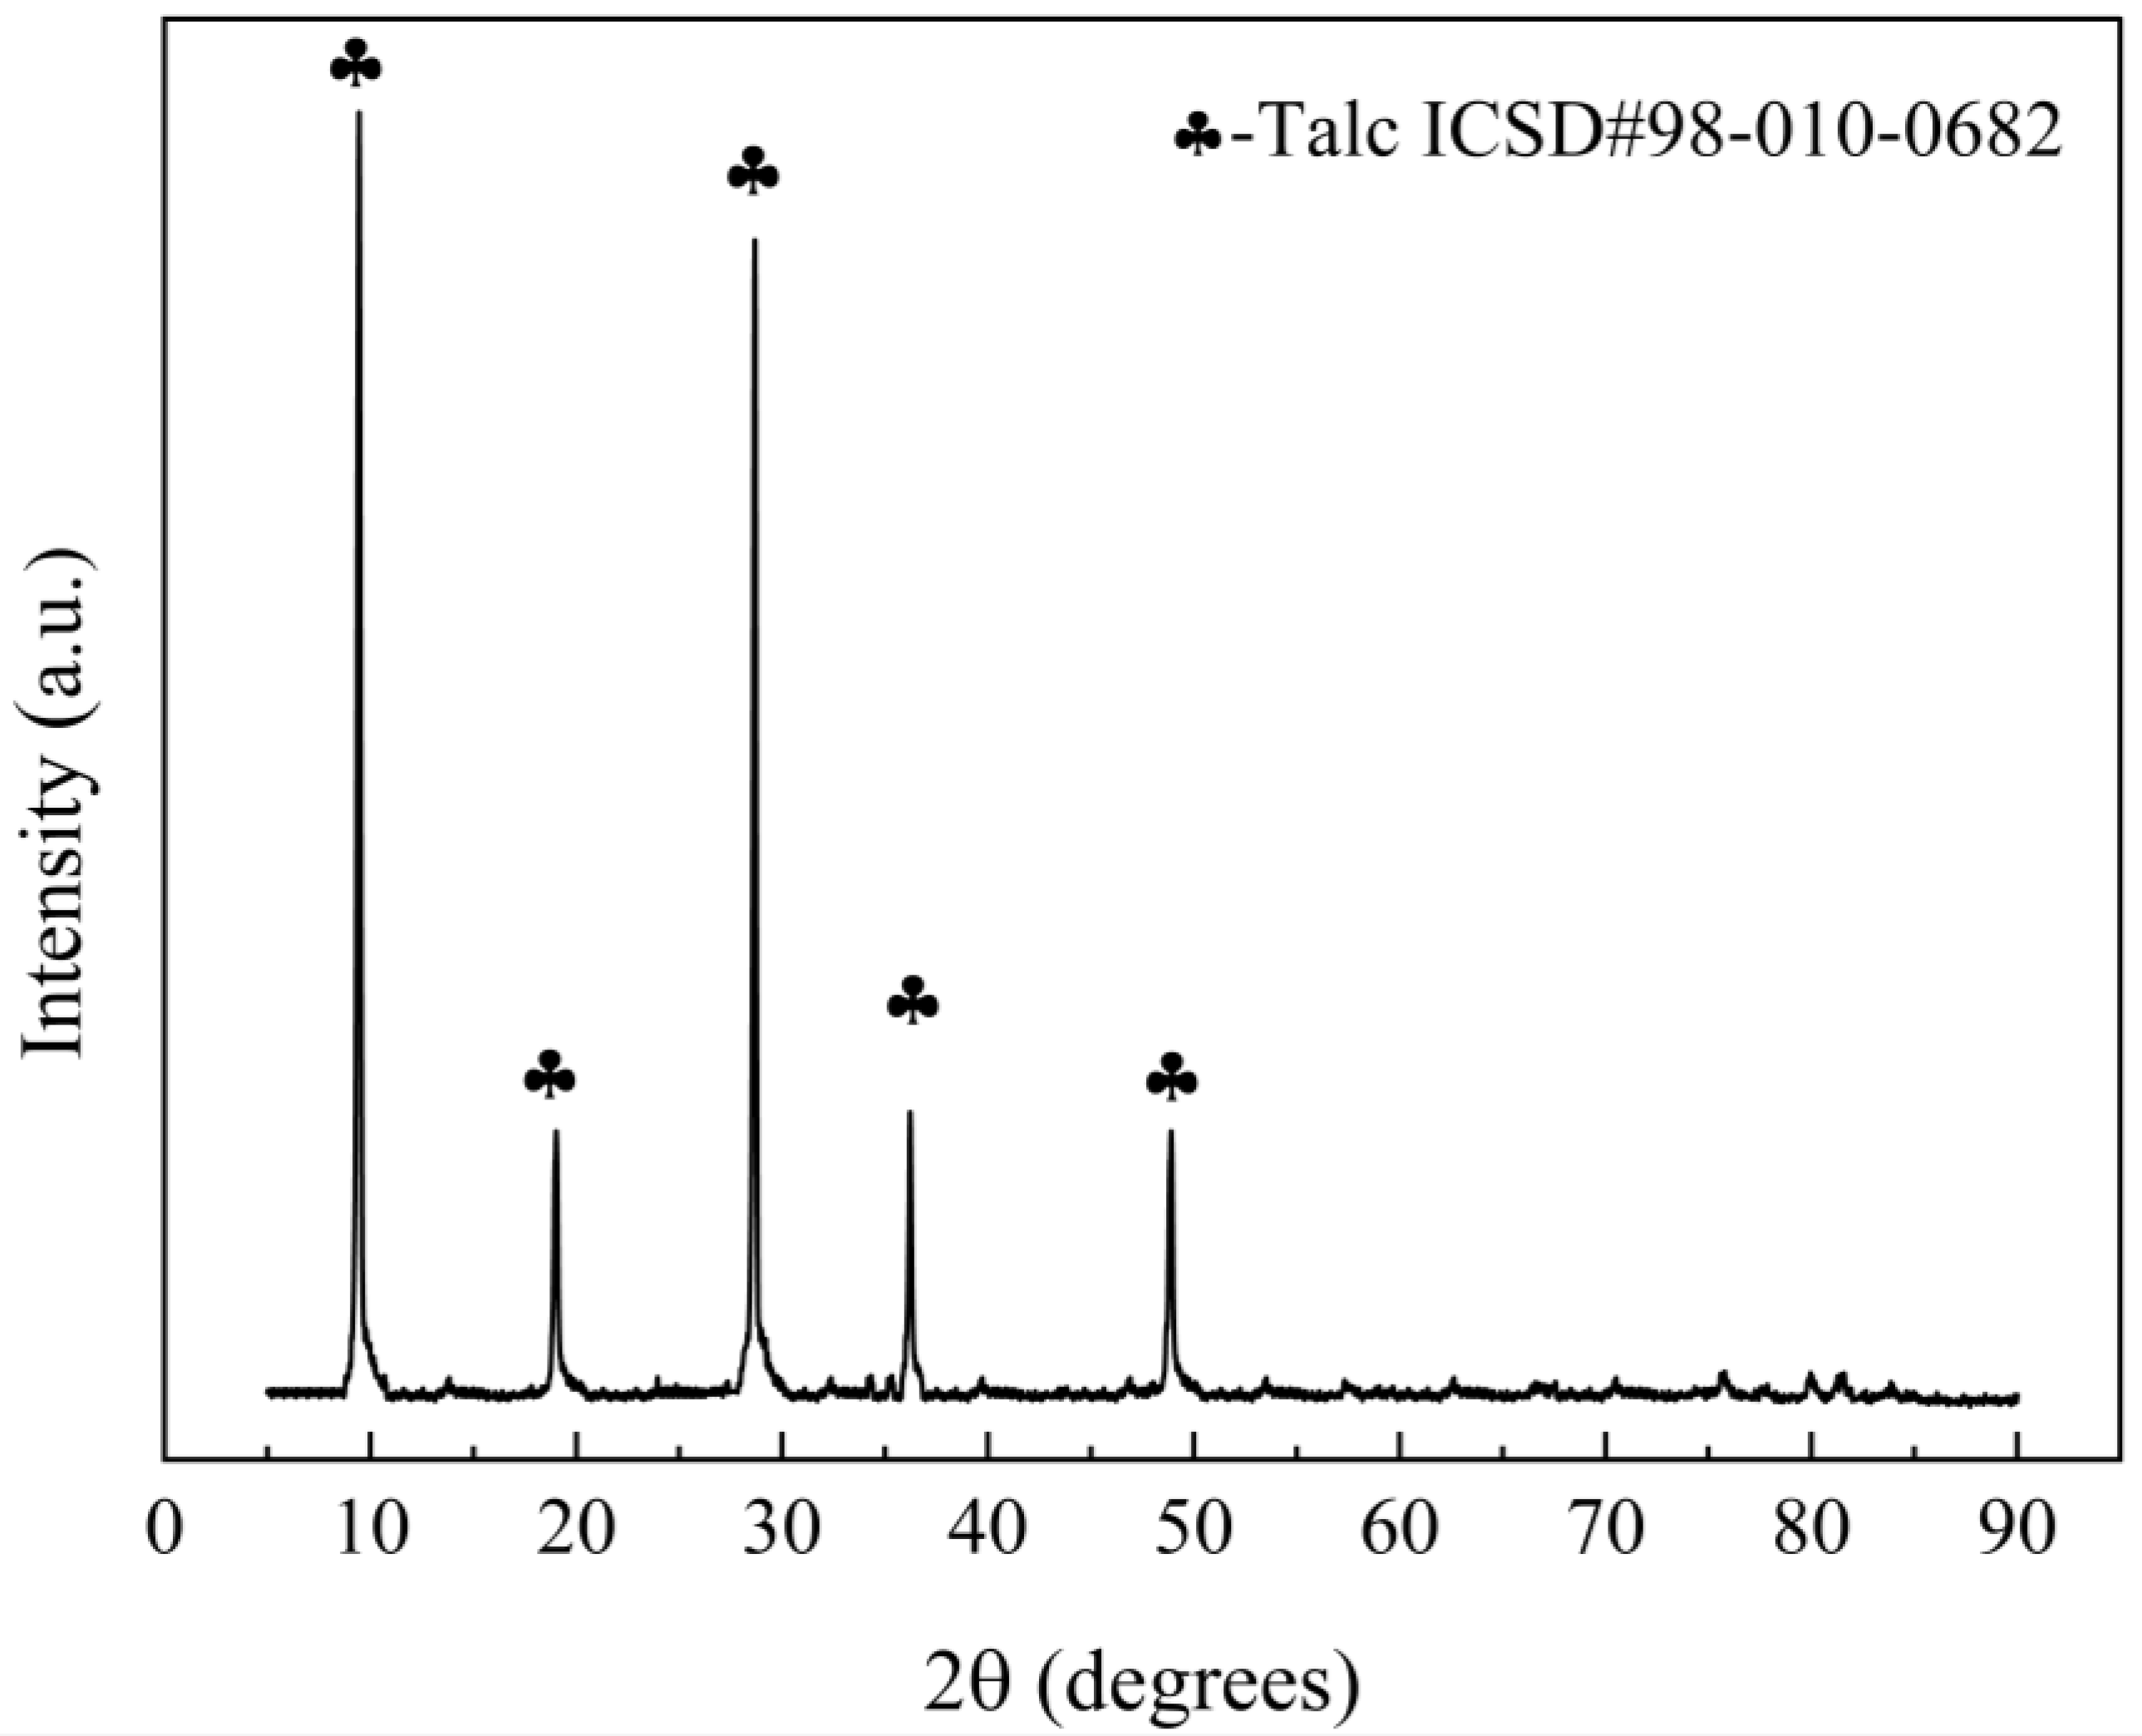
2.1. Materials
2.2. Formula Design
2.3. Sample Preparation Methods
2.4. Sample Performance Measurements
2.4.1. Macroscopic Performance Measurements
2.4.2. Microscopic Performance Measurements
3. Results
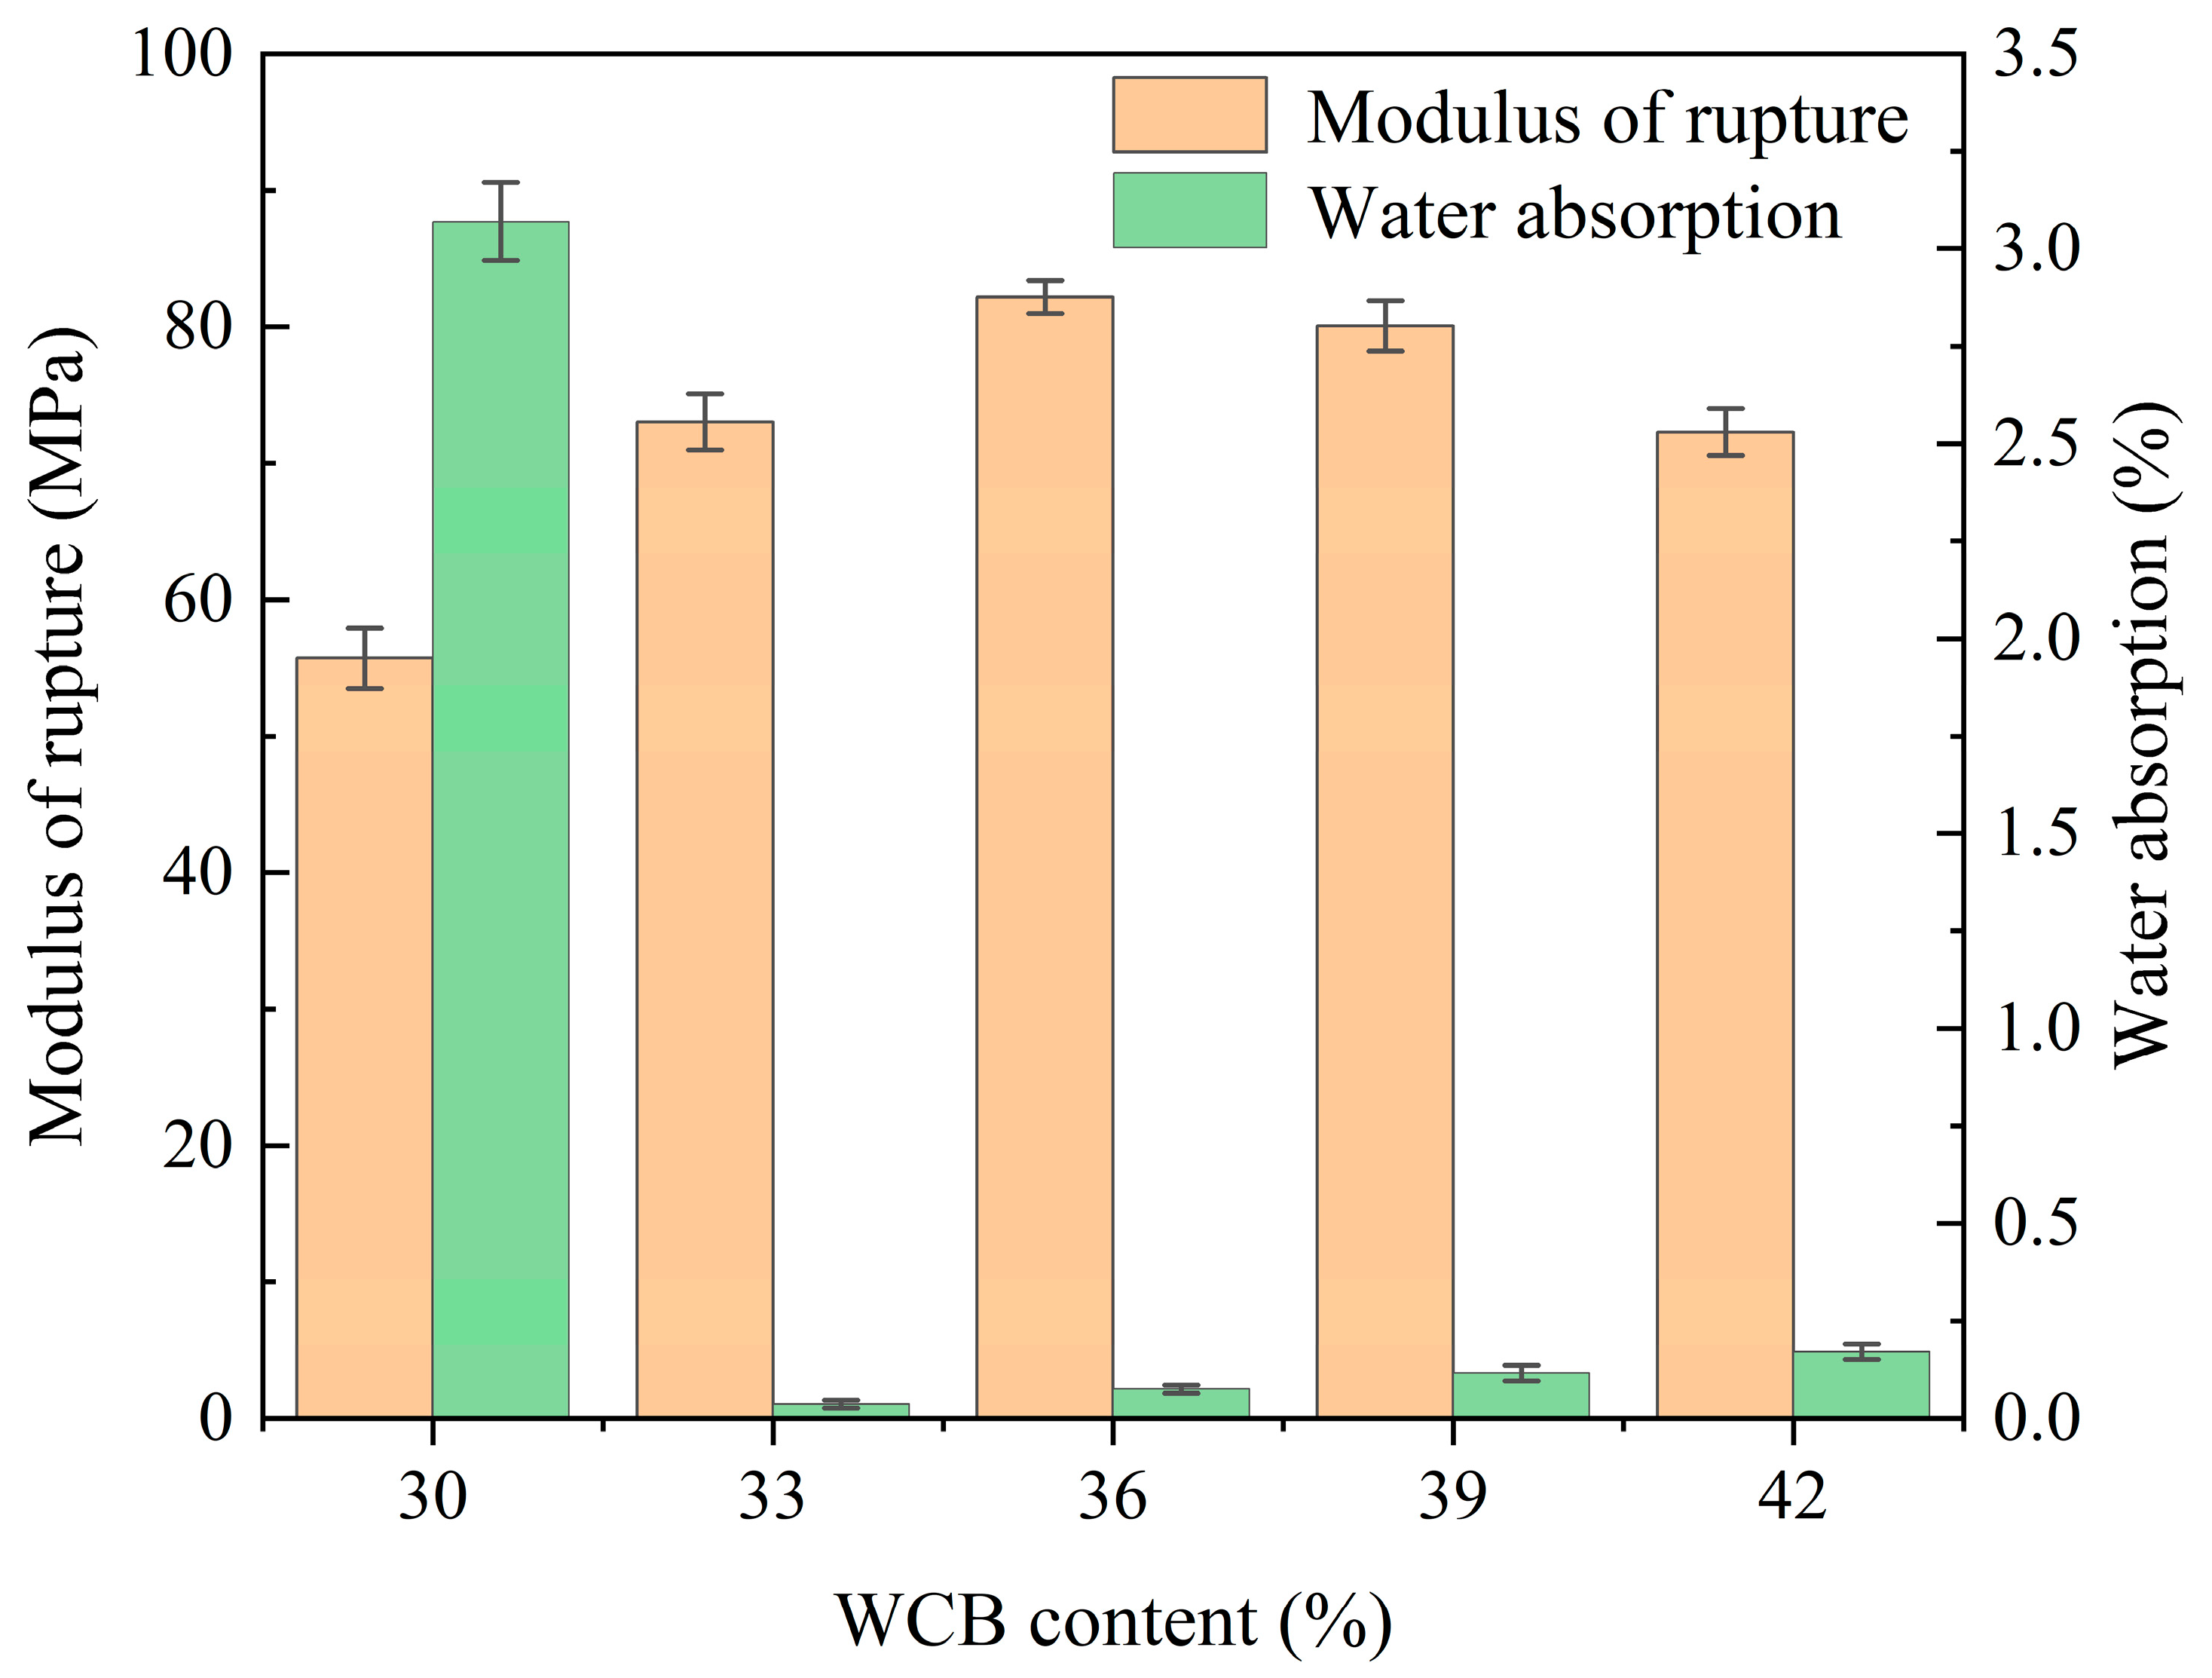
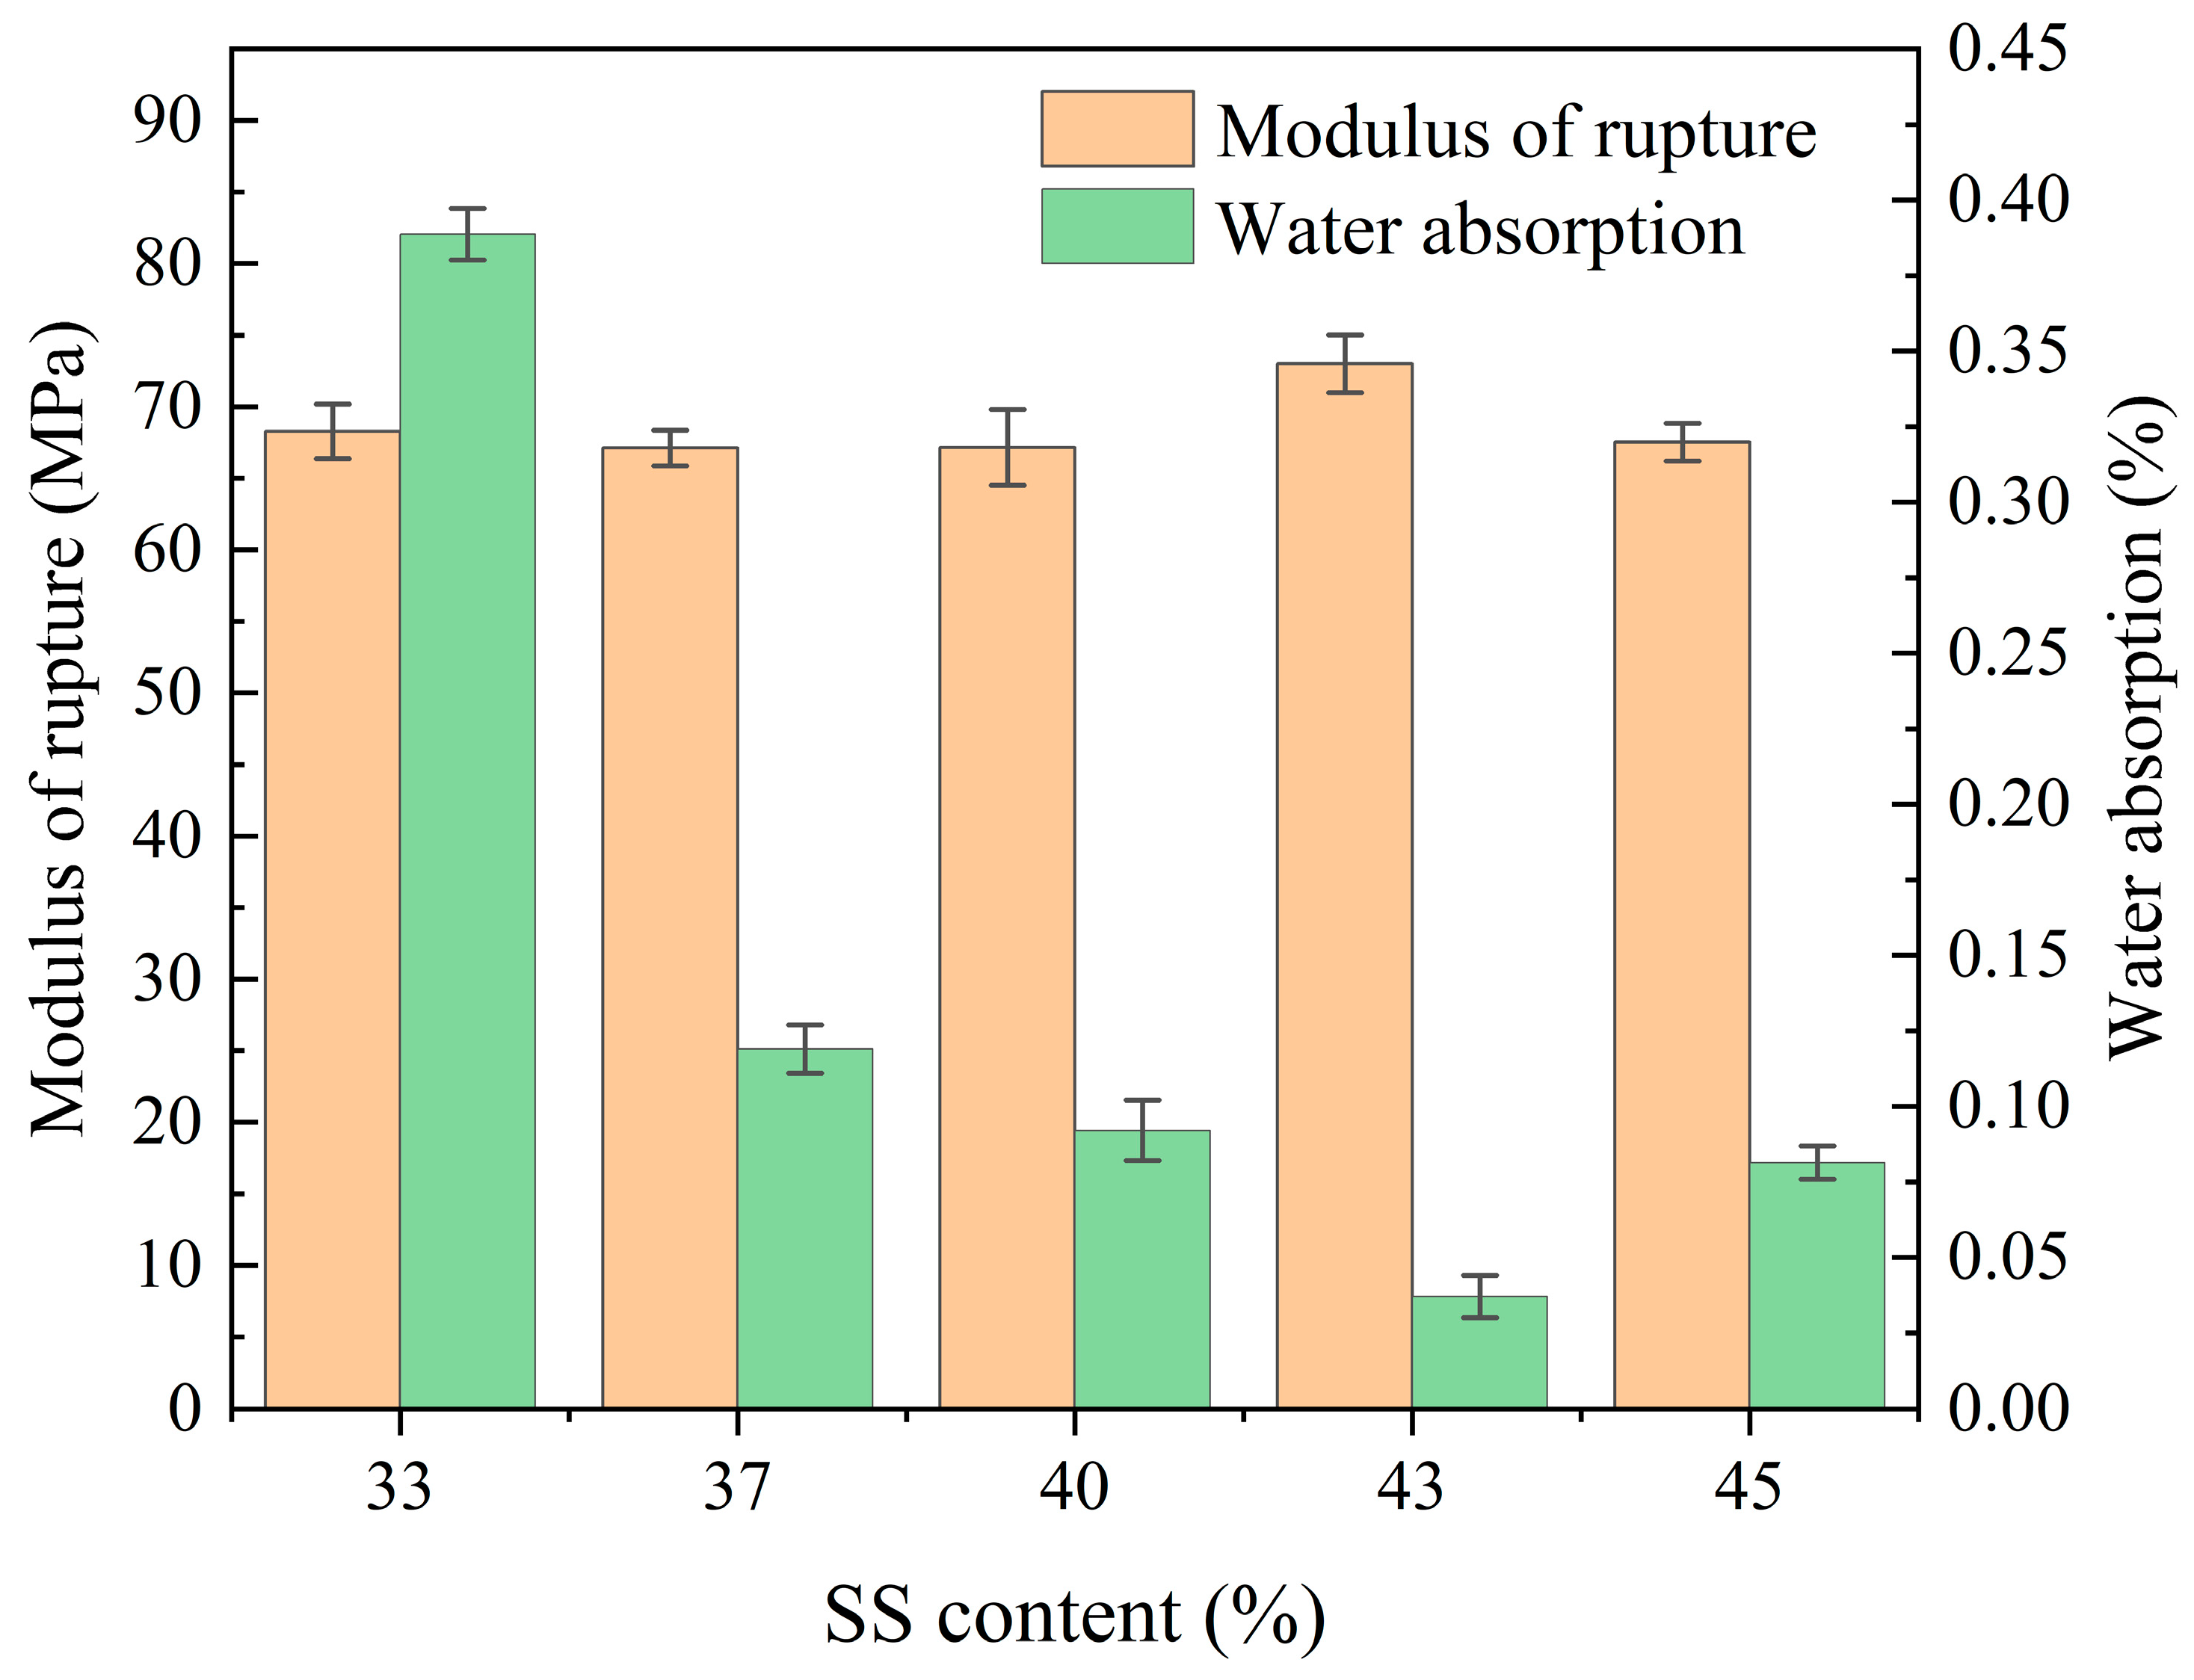
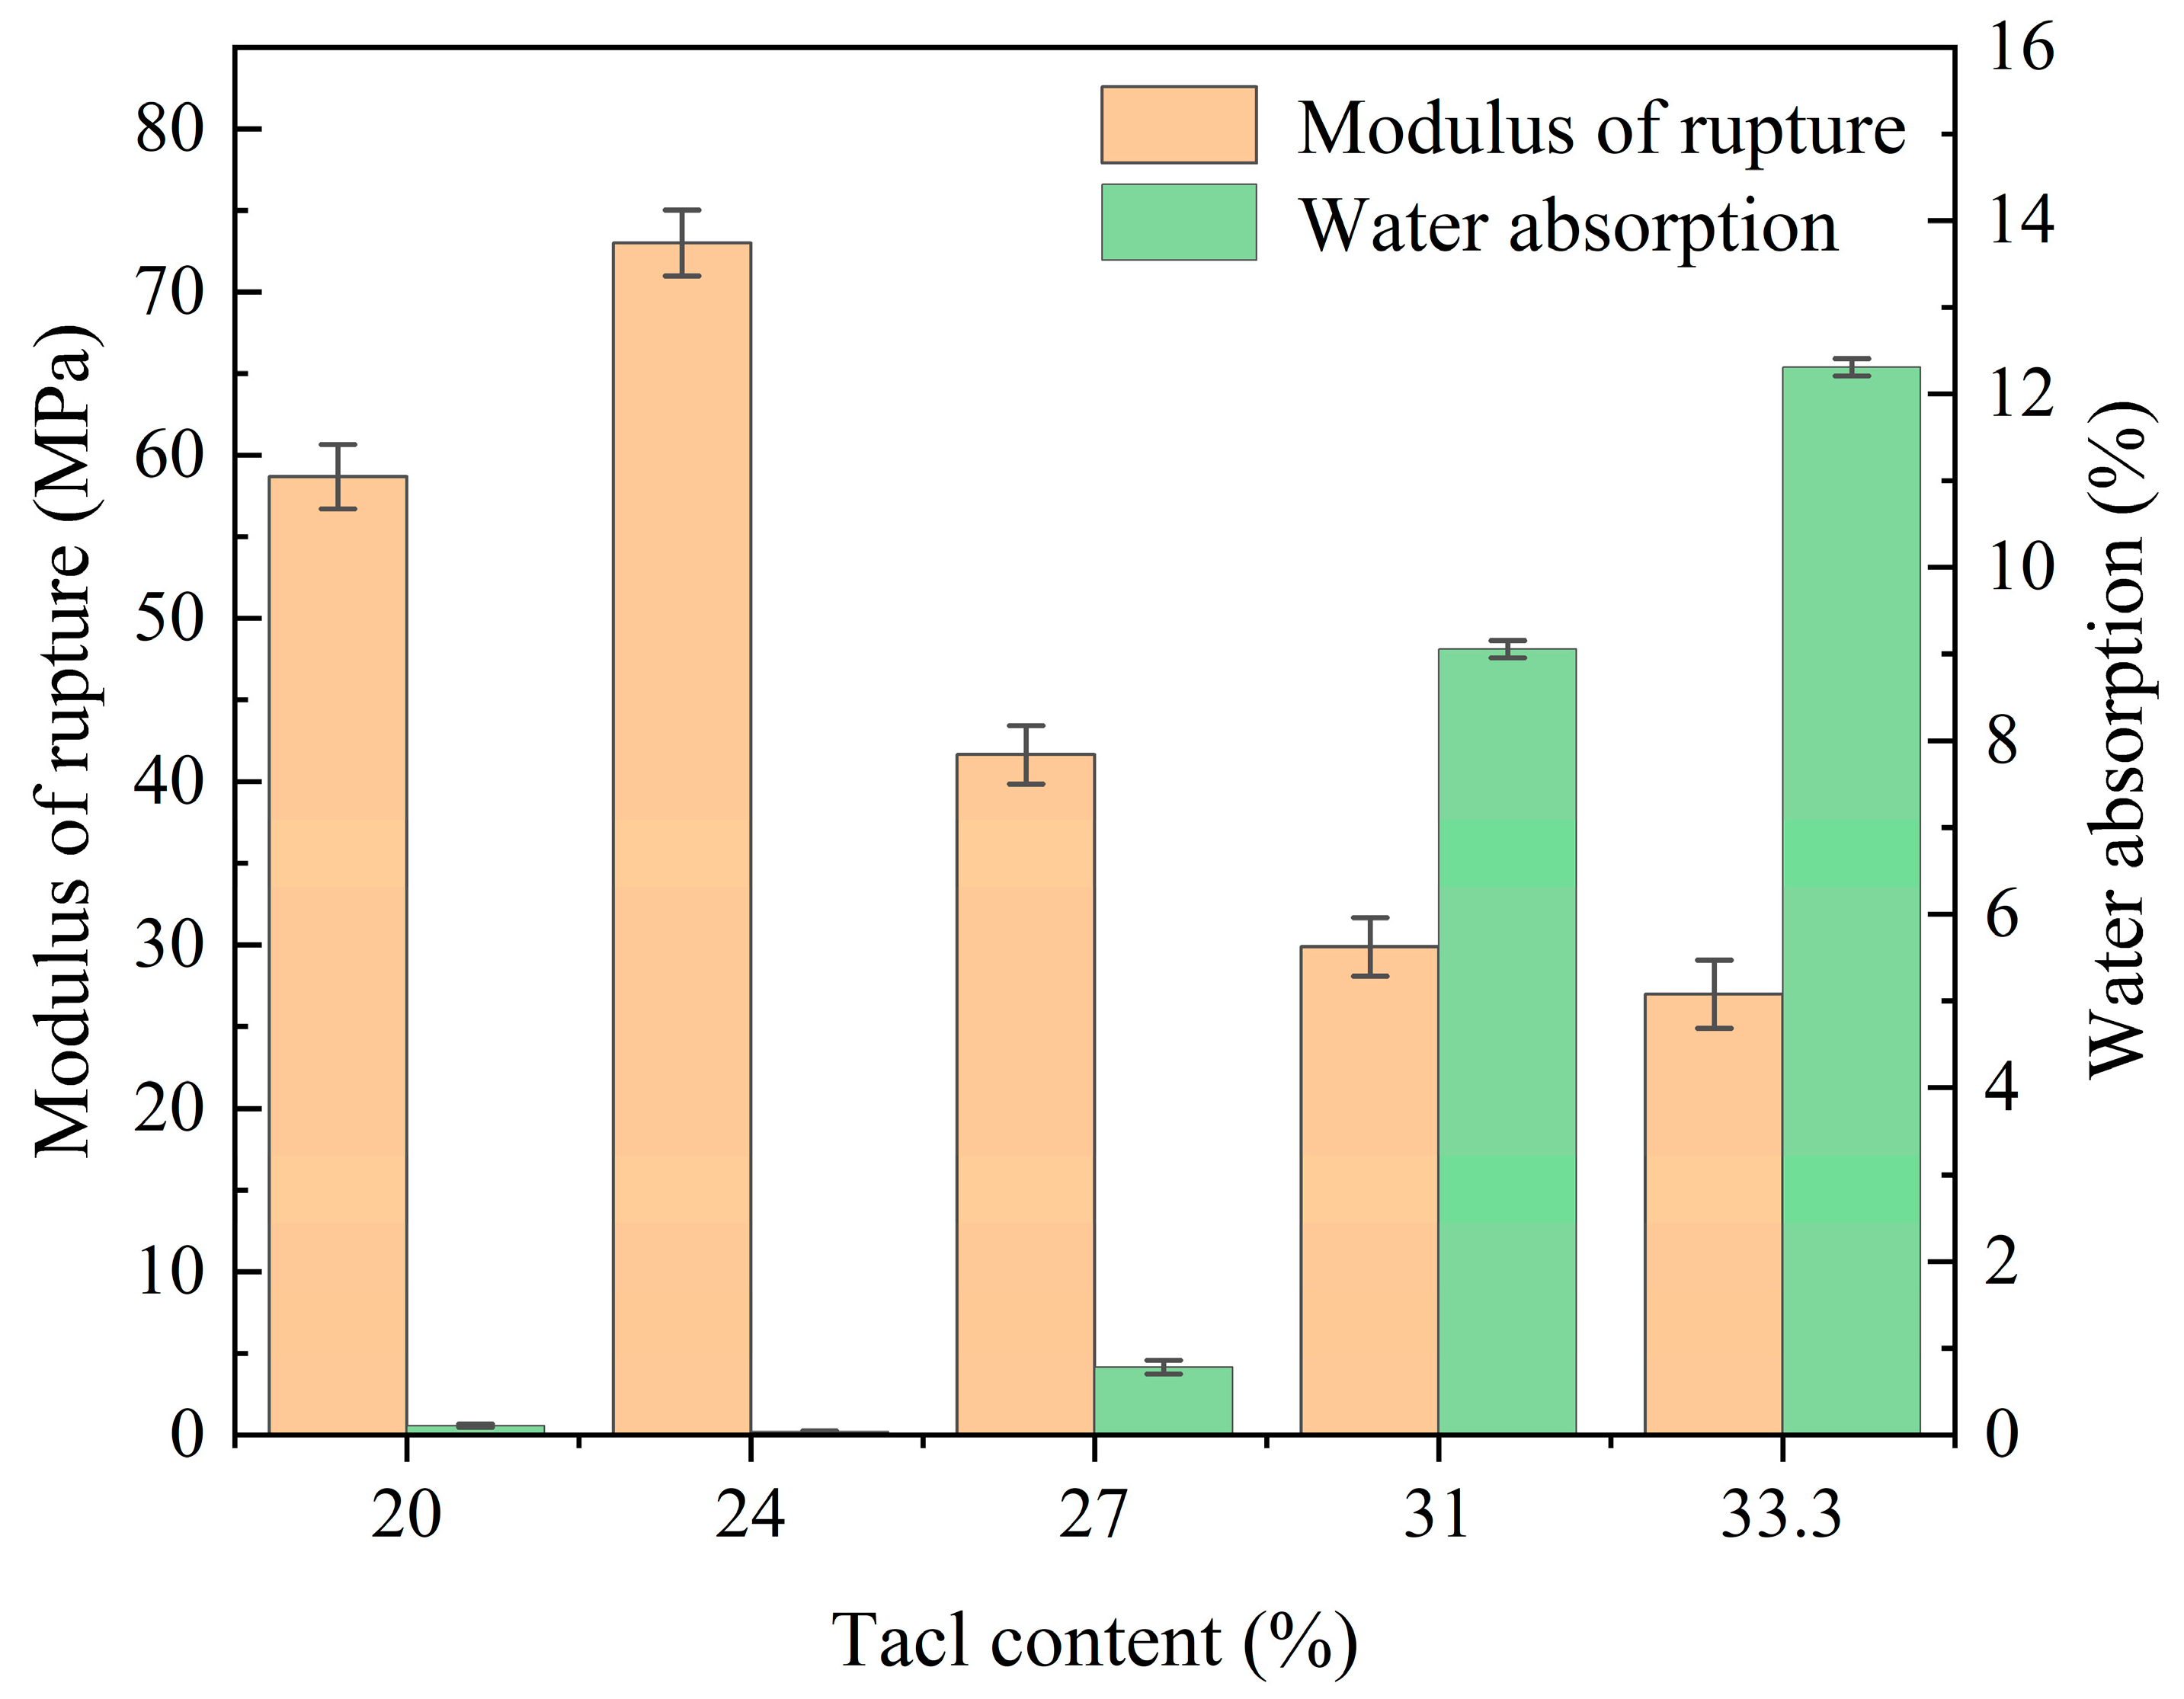
3.1. Physical and Mechanical Properties
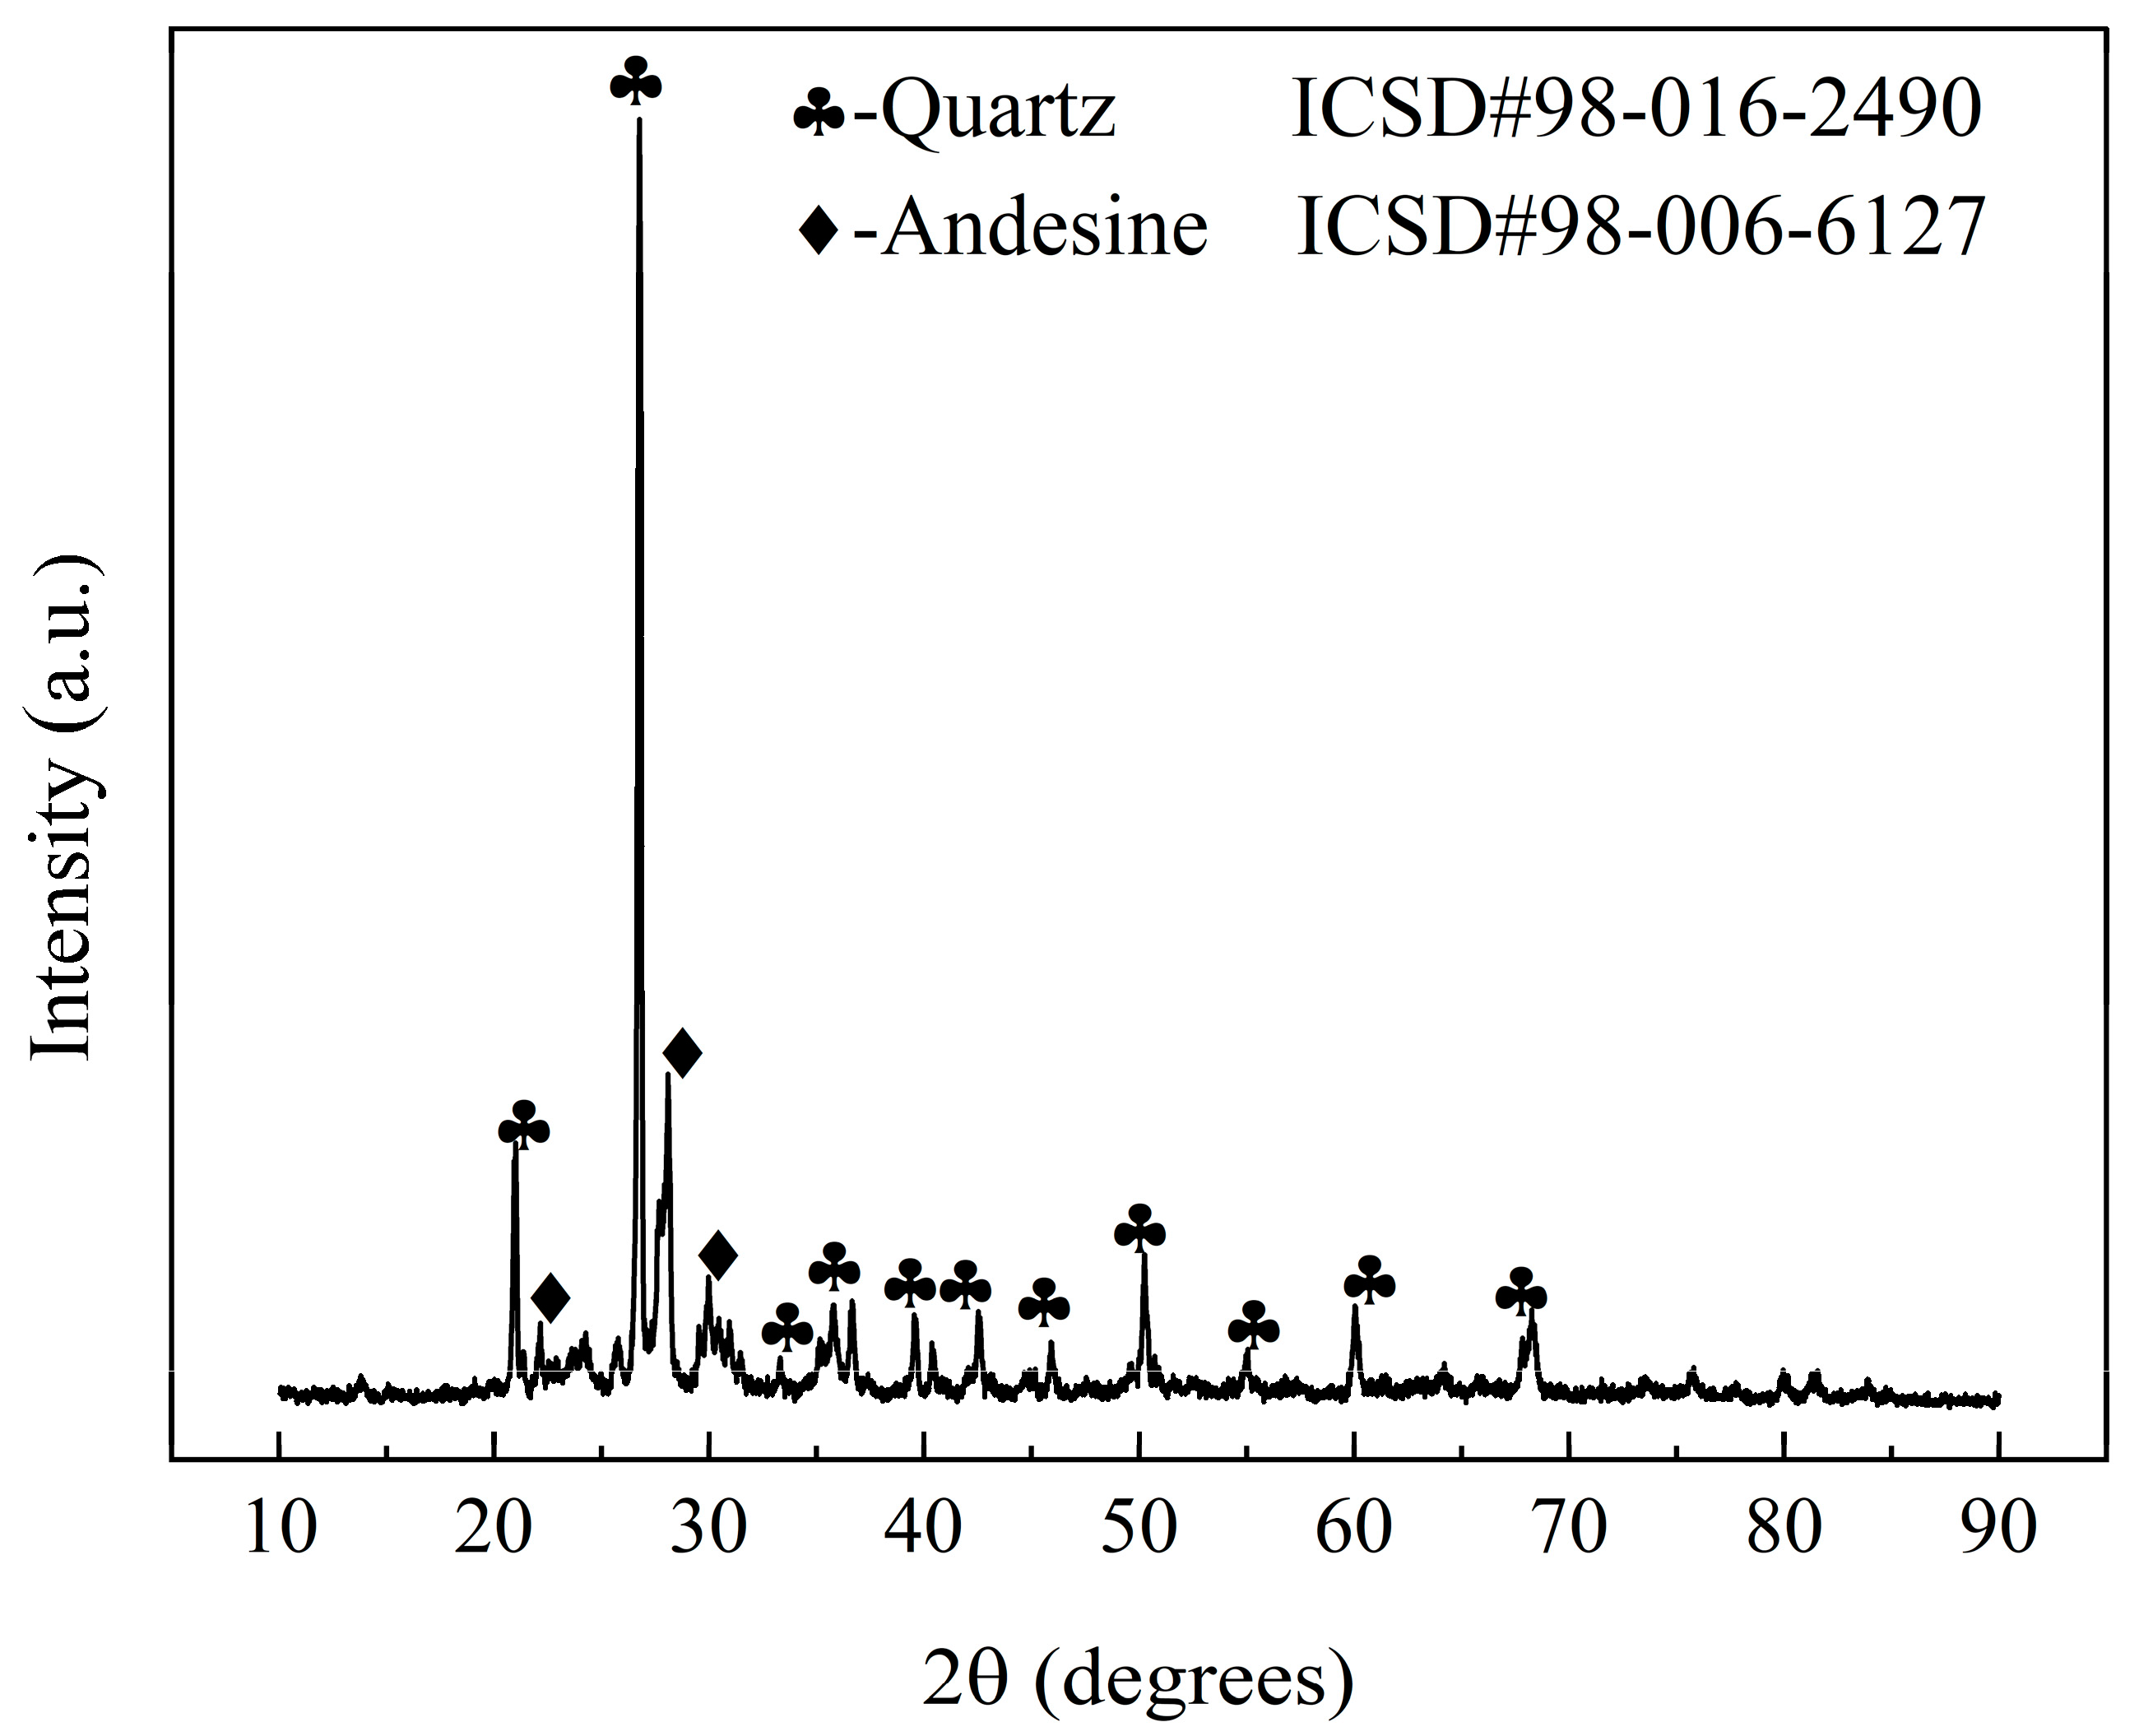
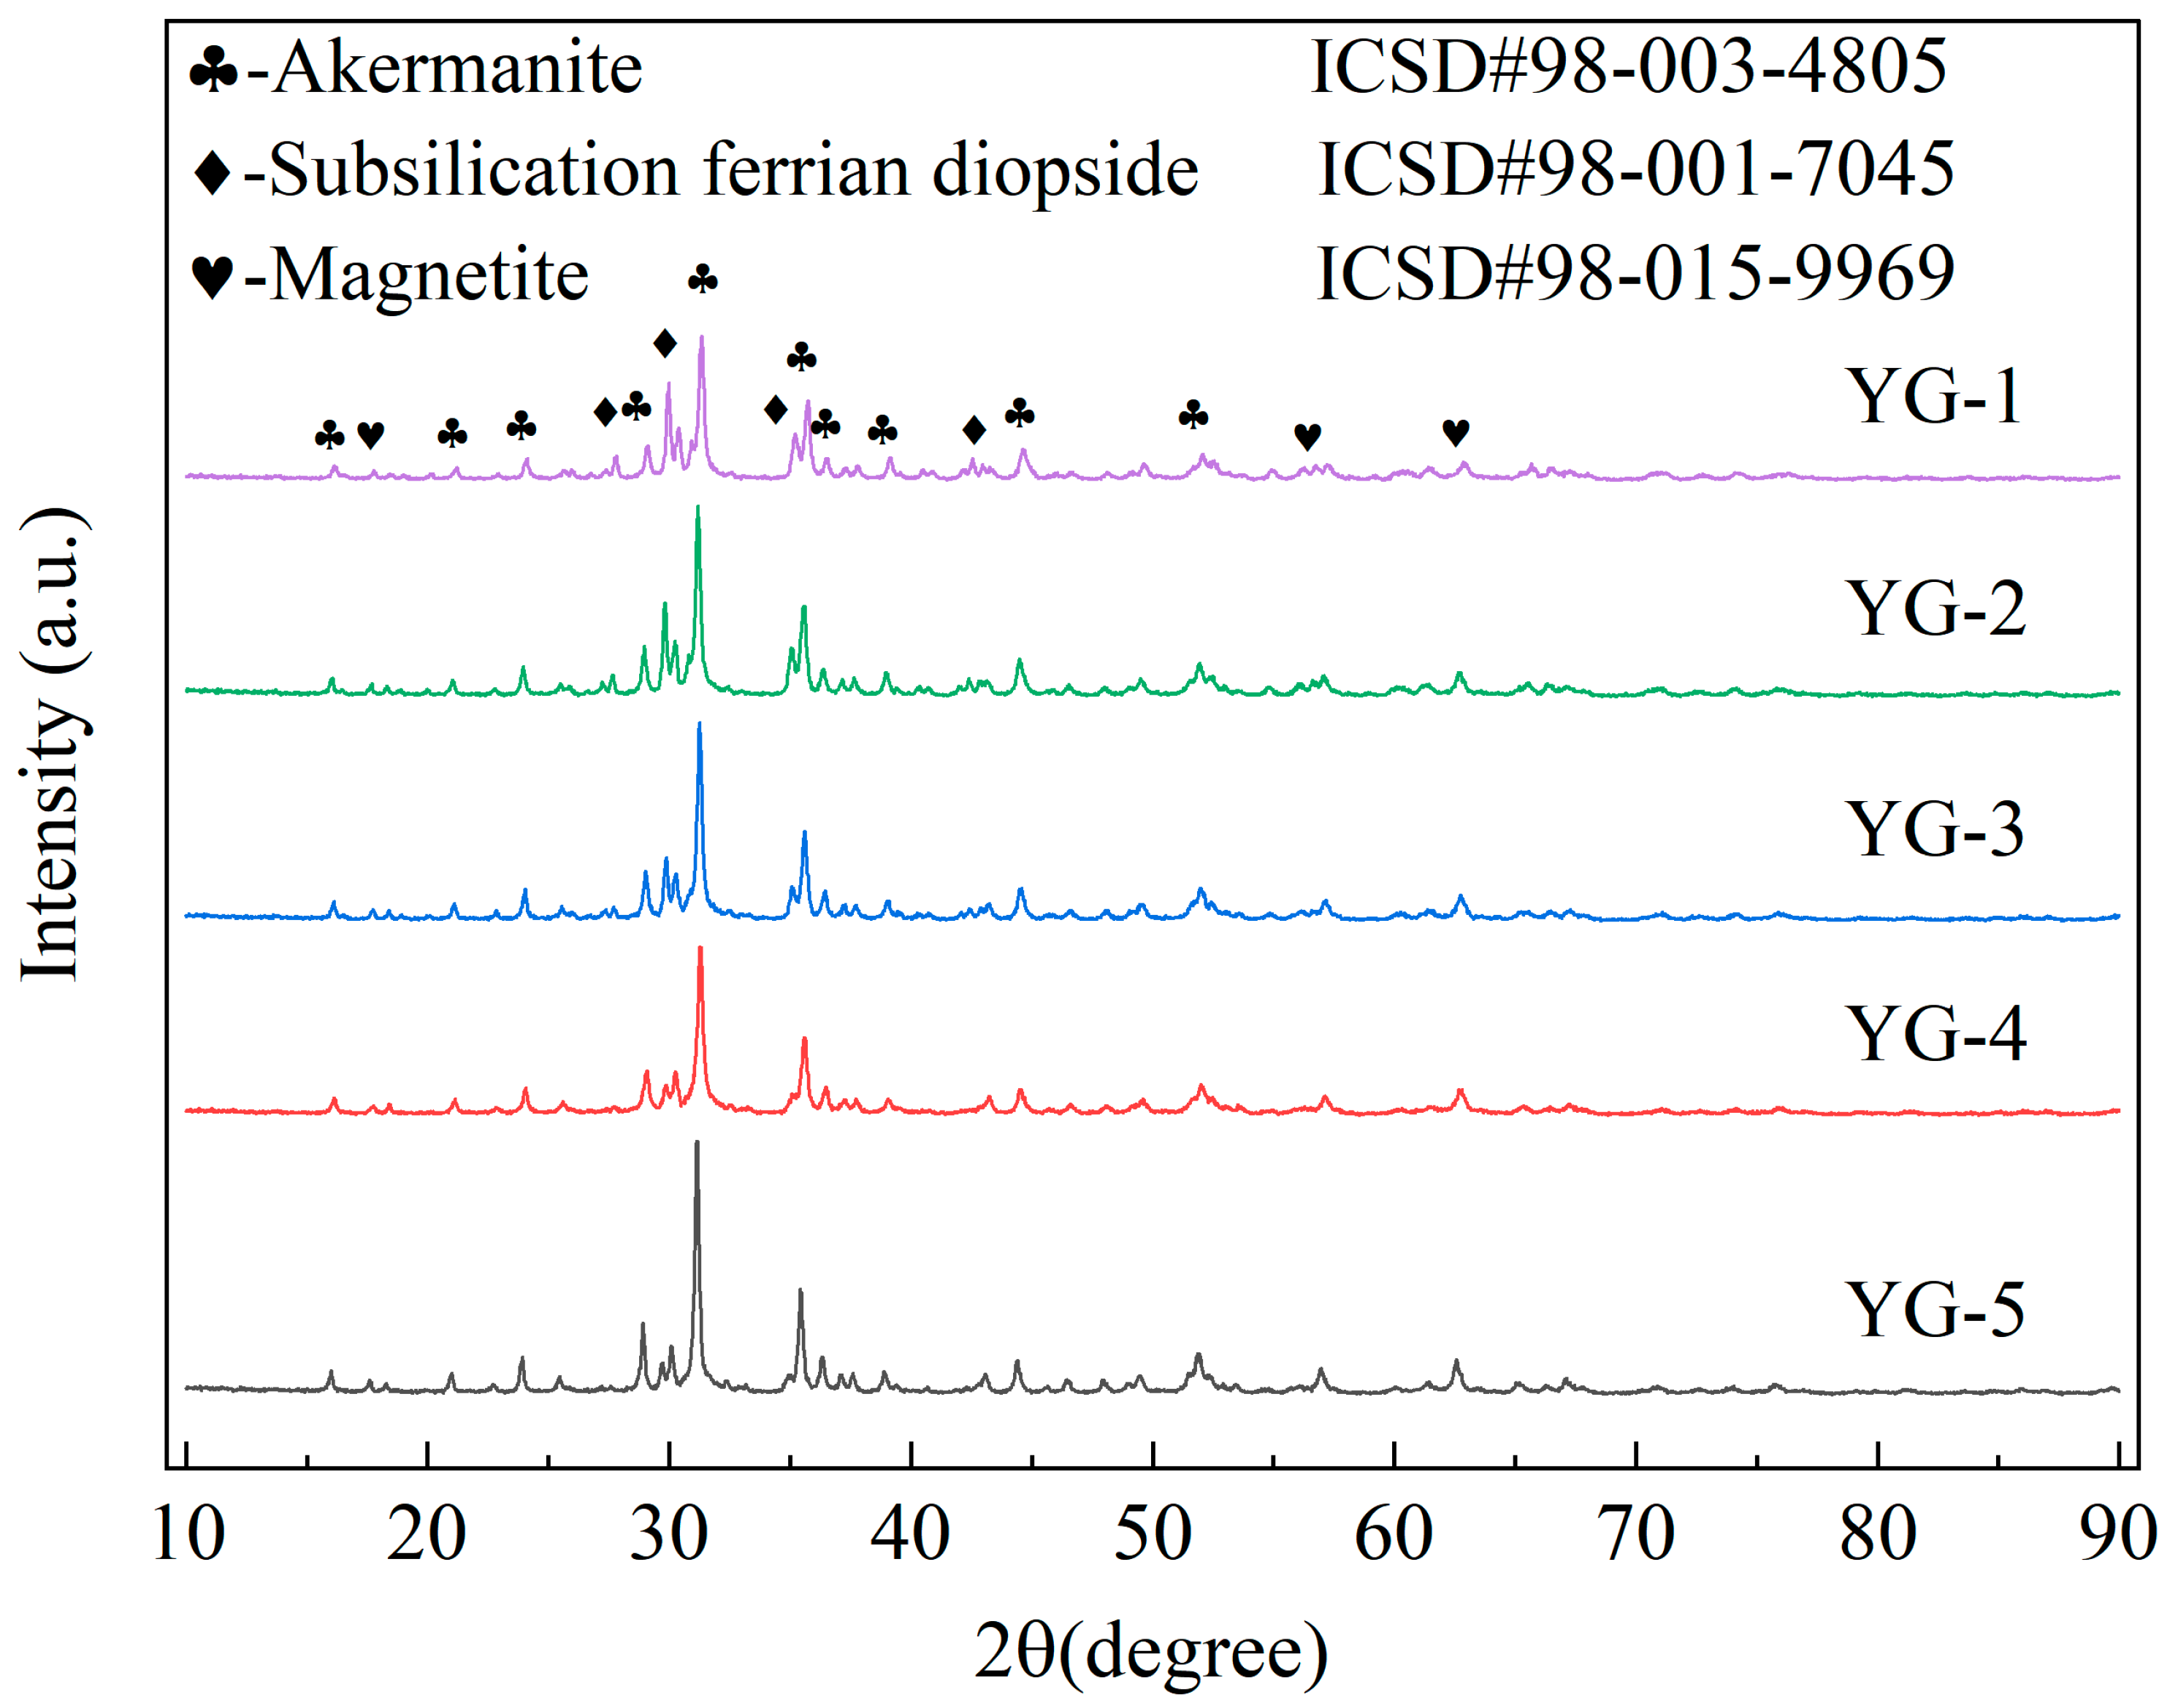
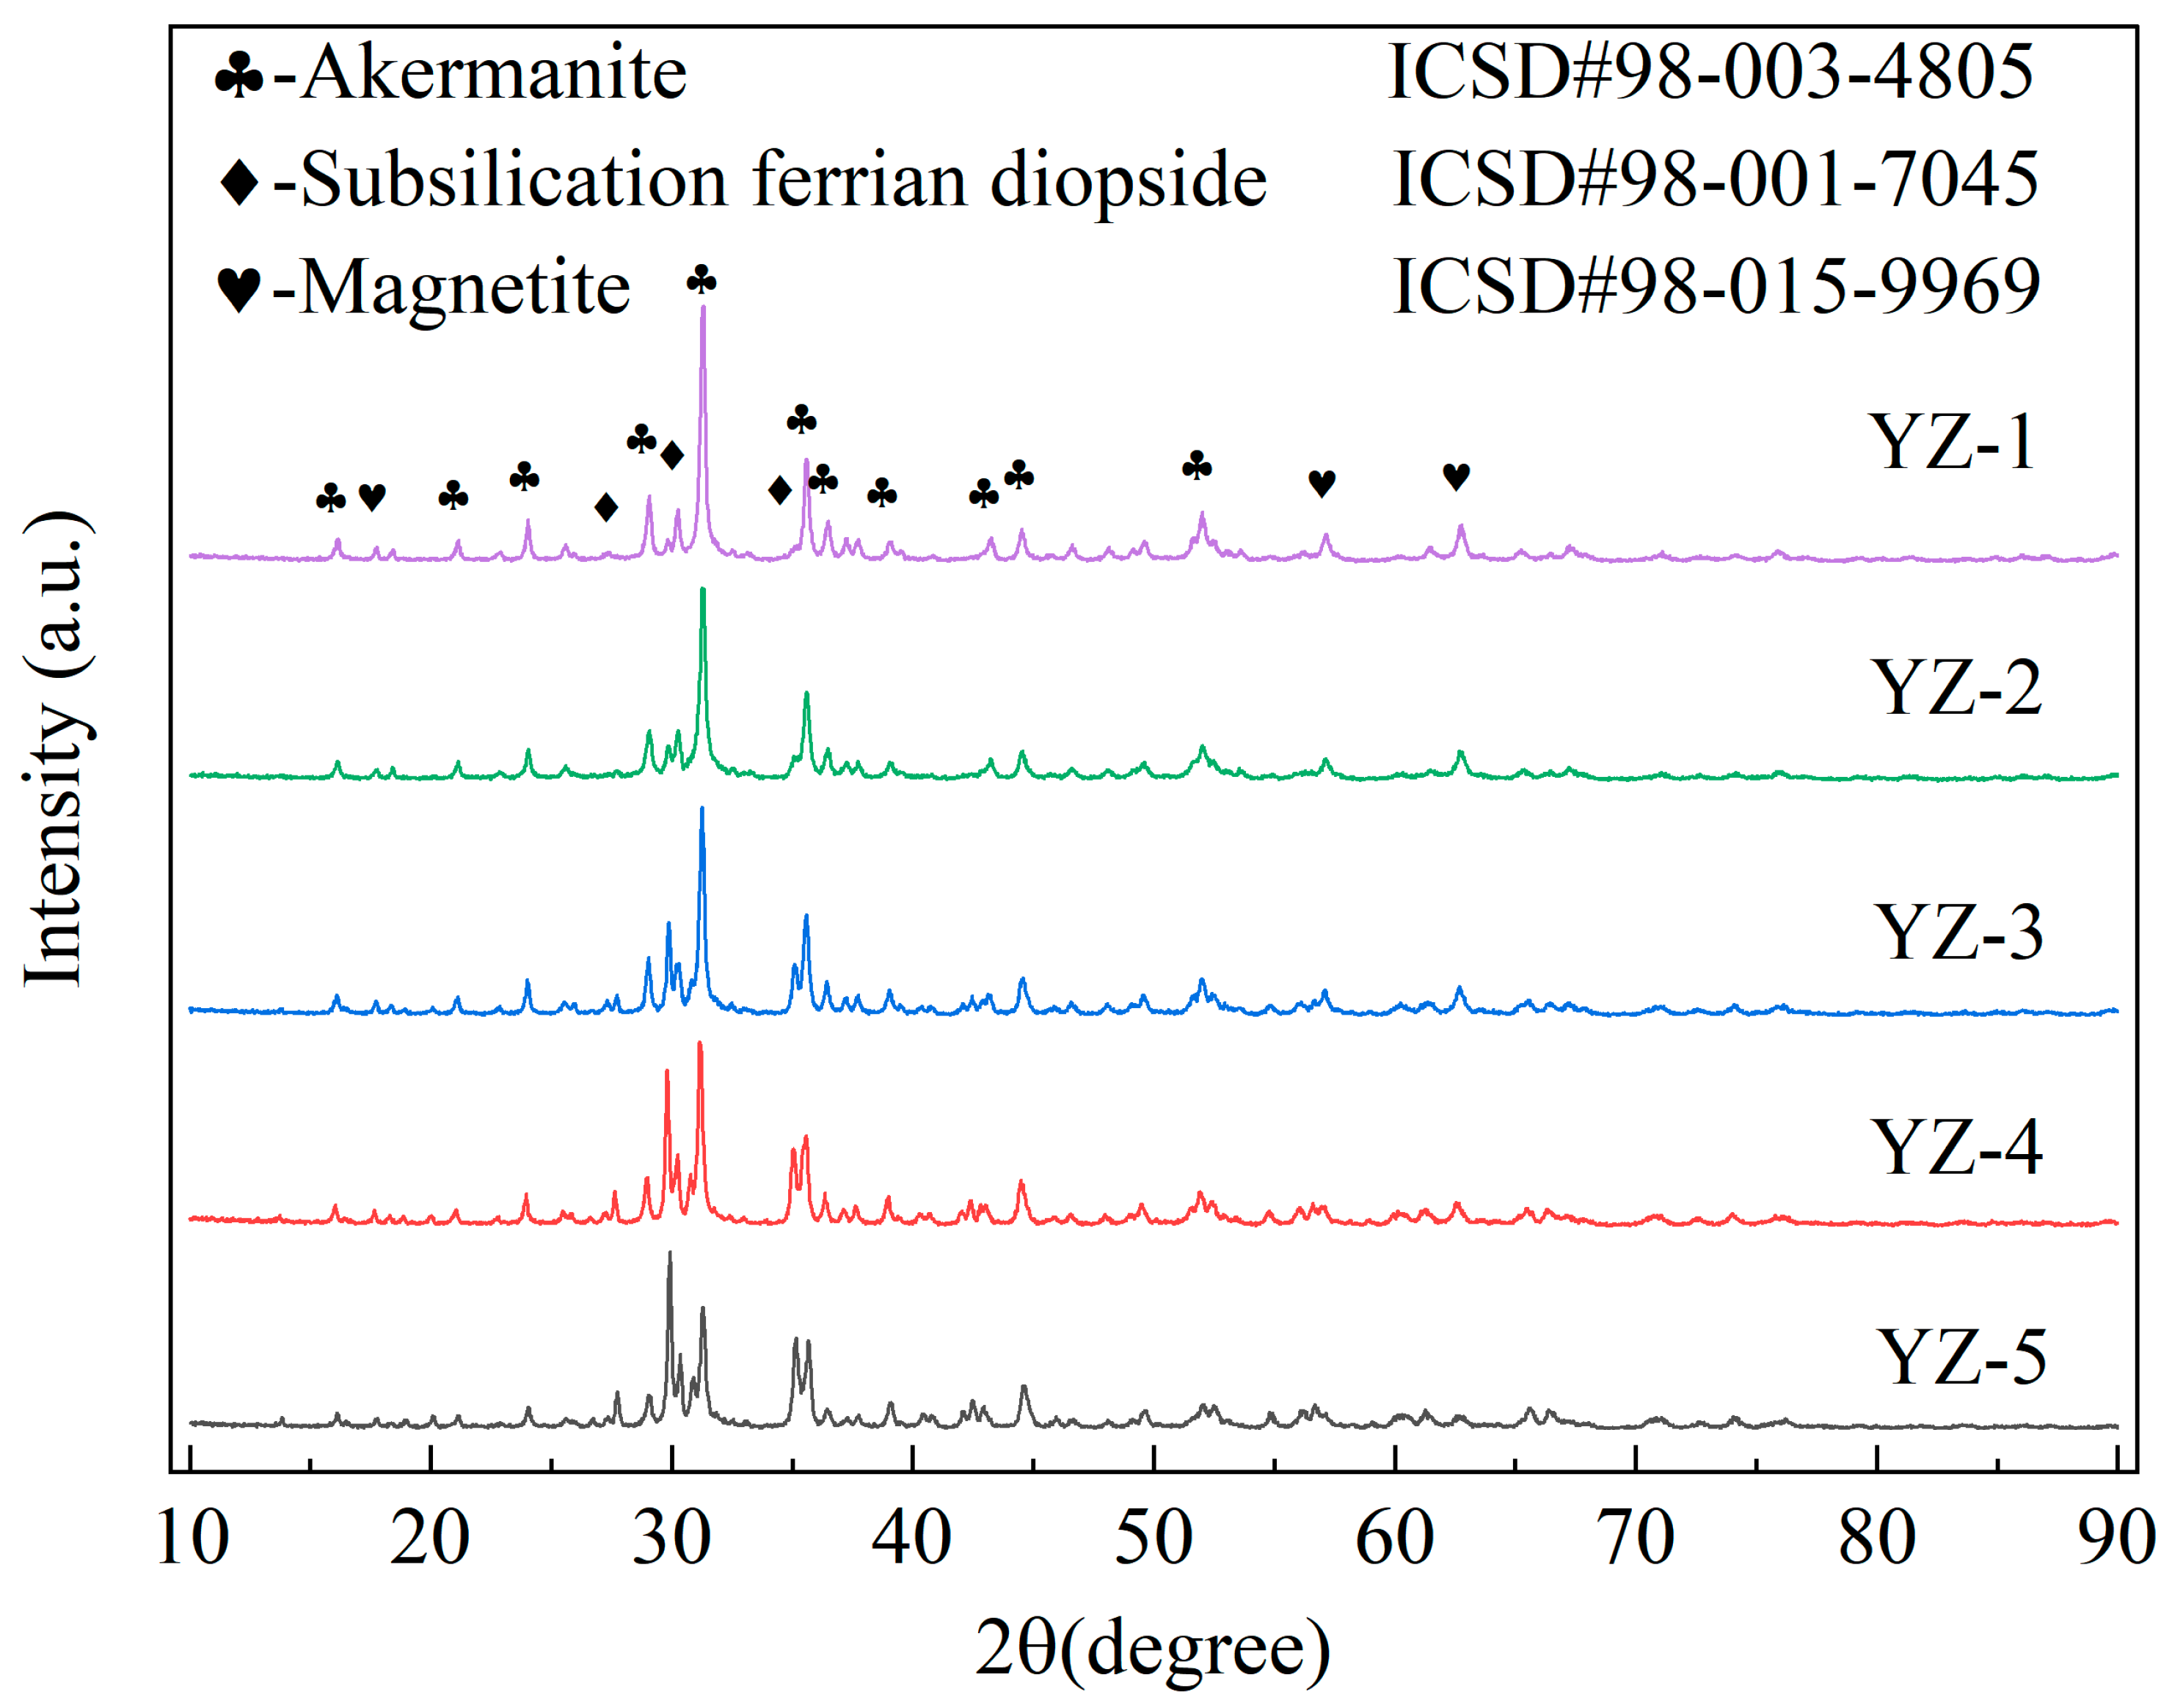
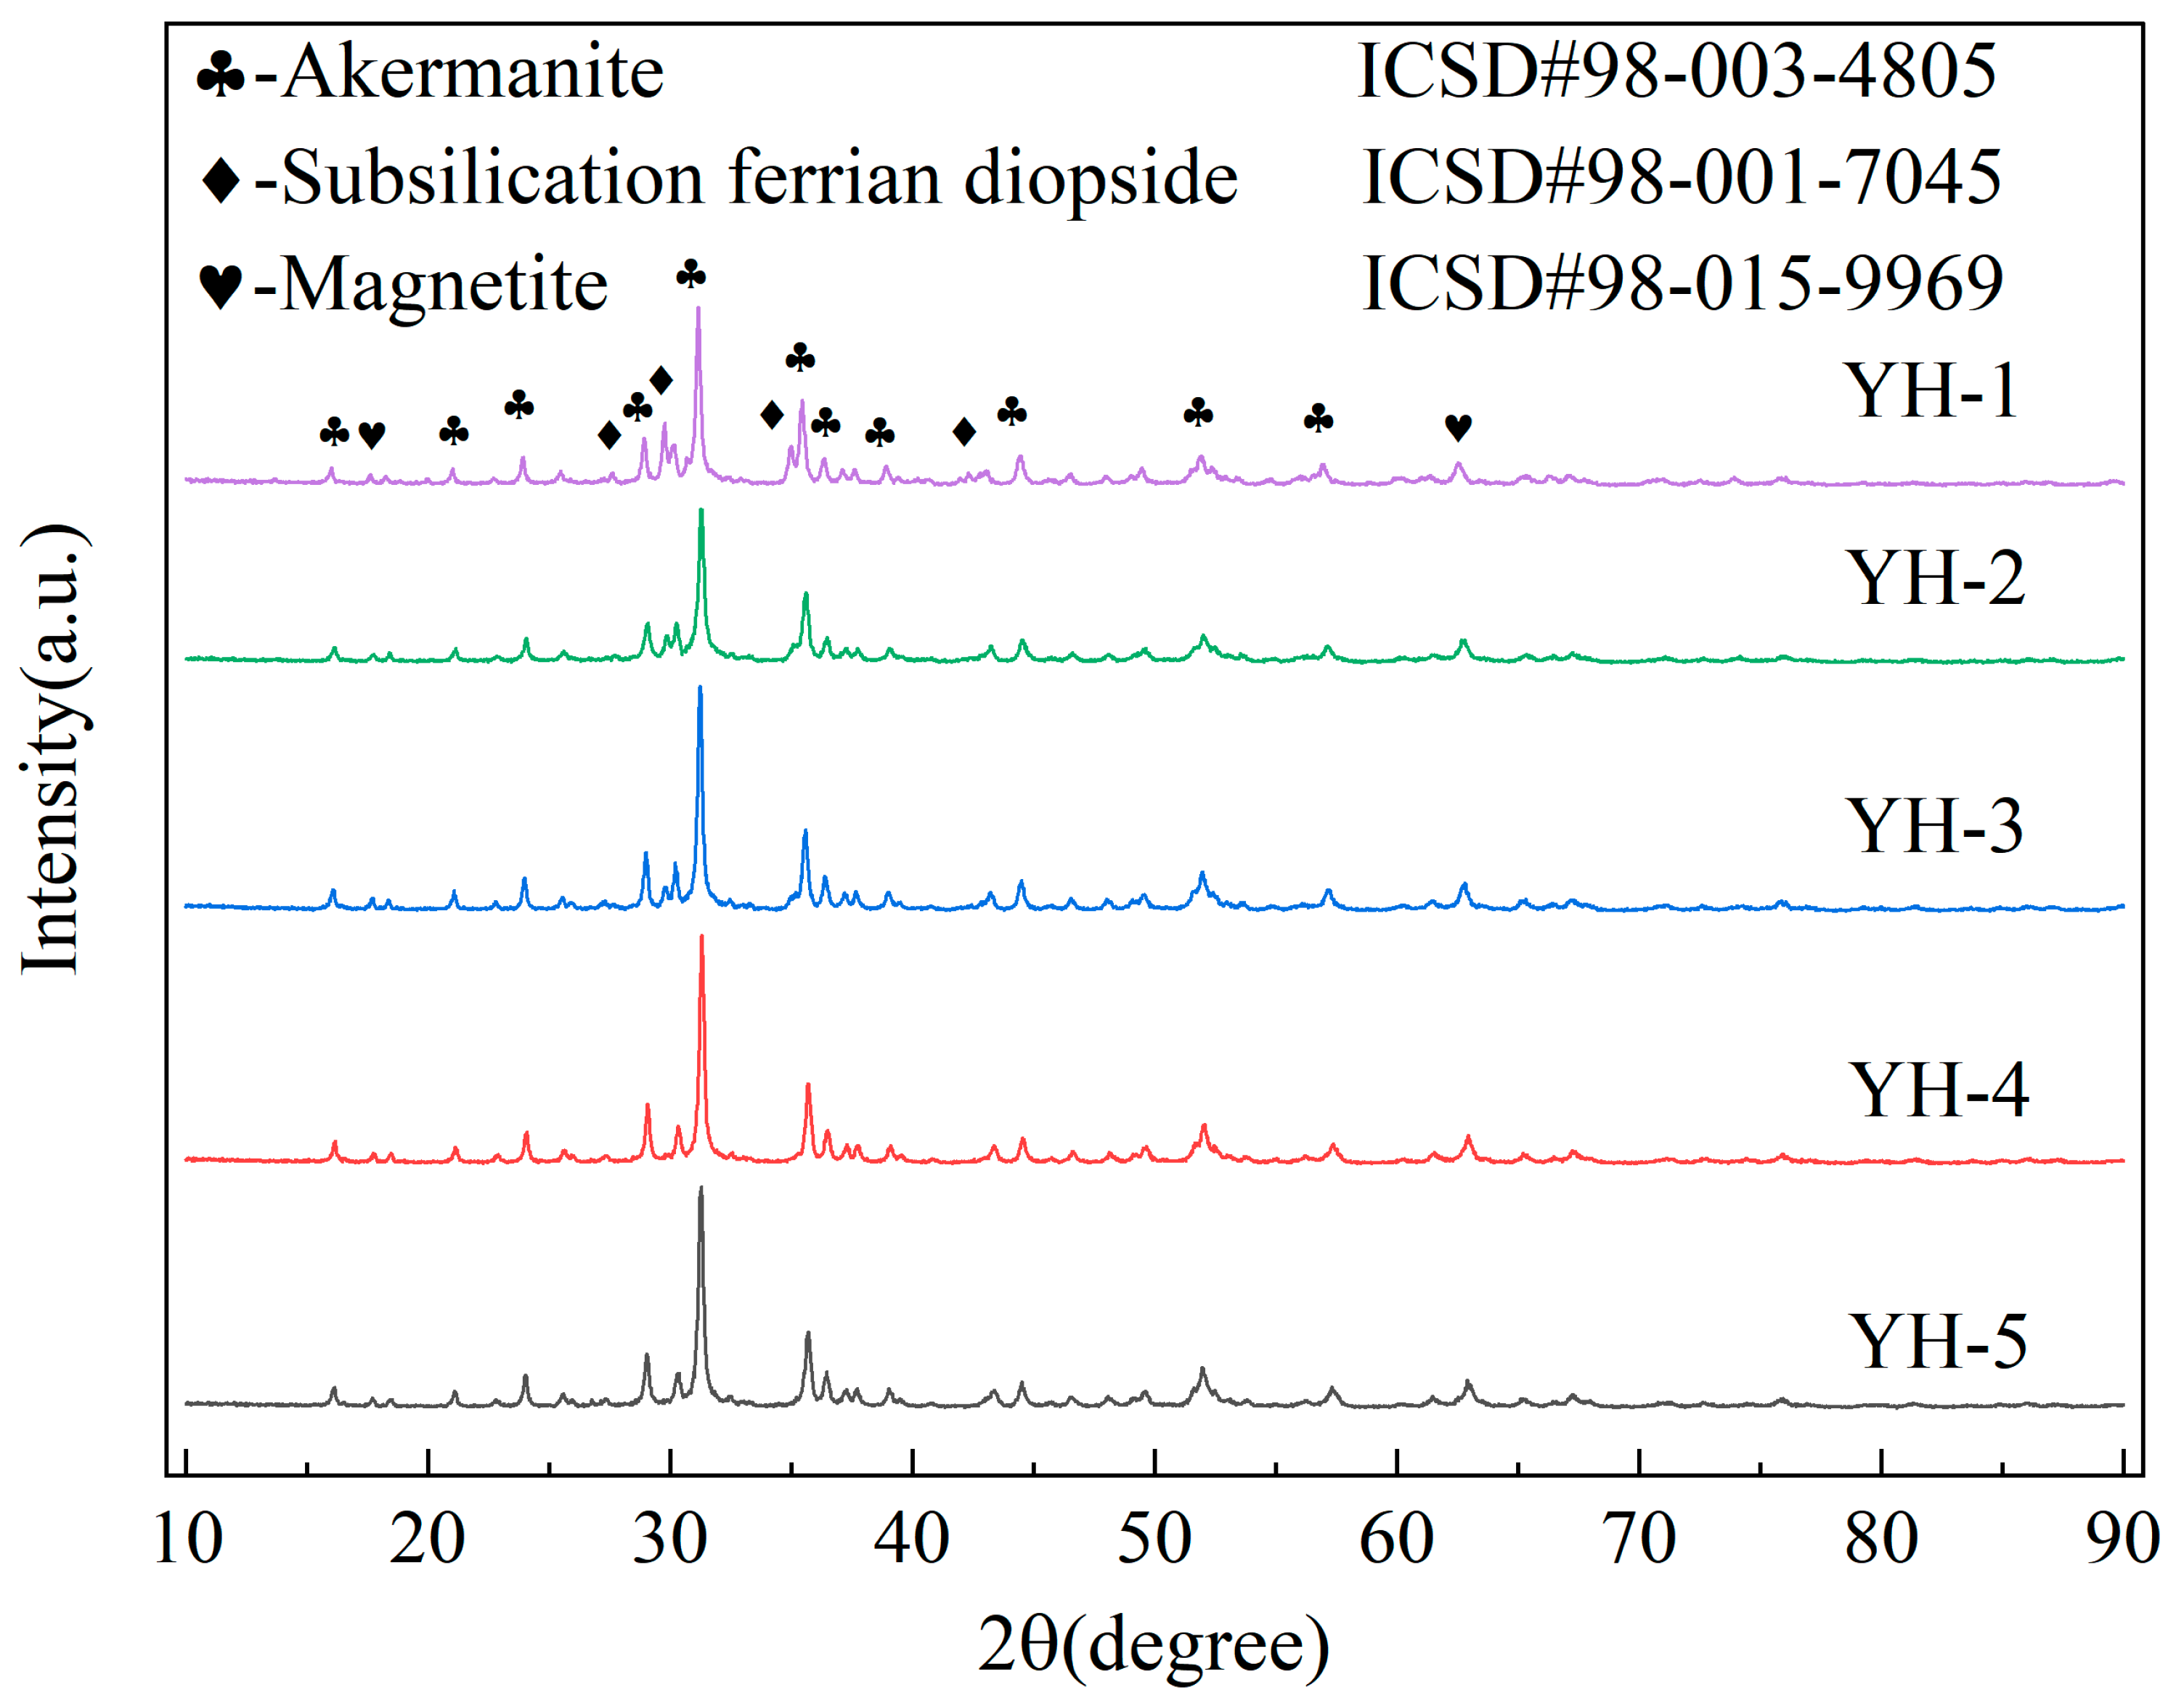
3.2. XRD Analysis
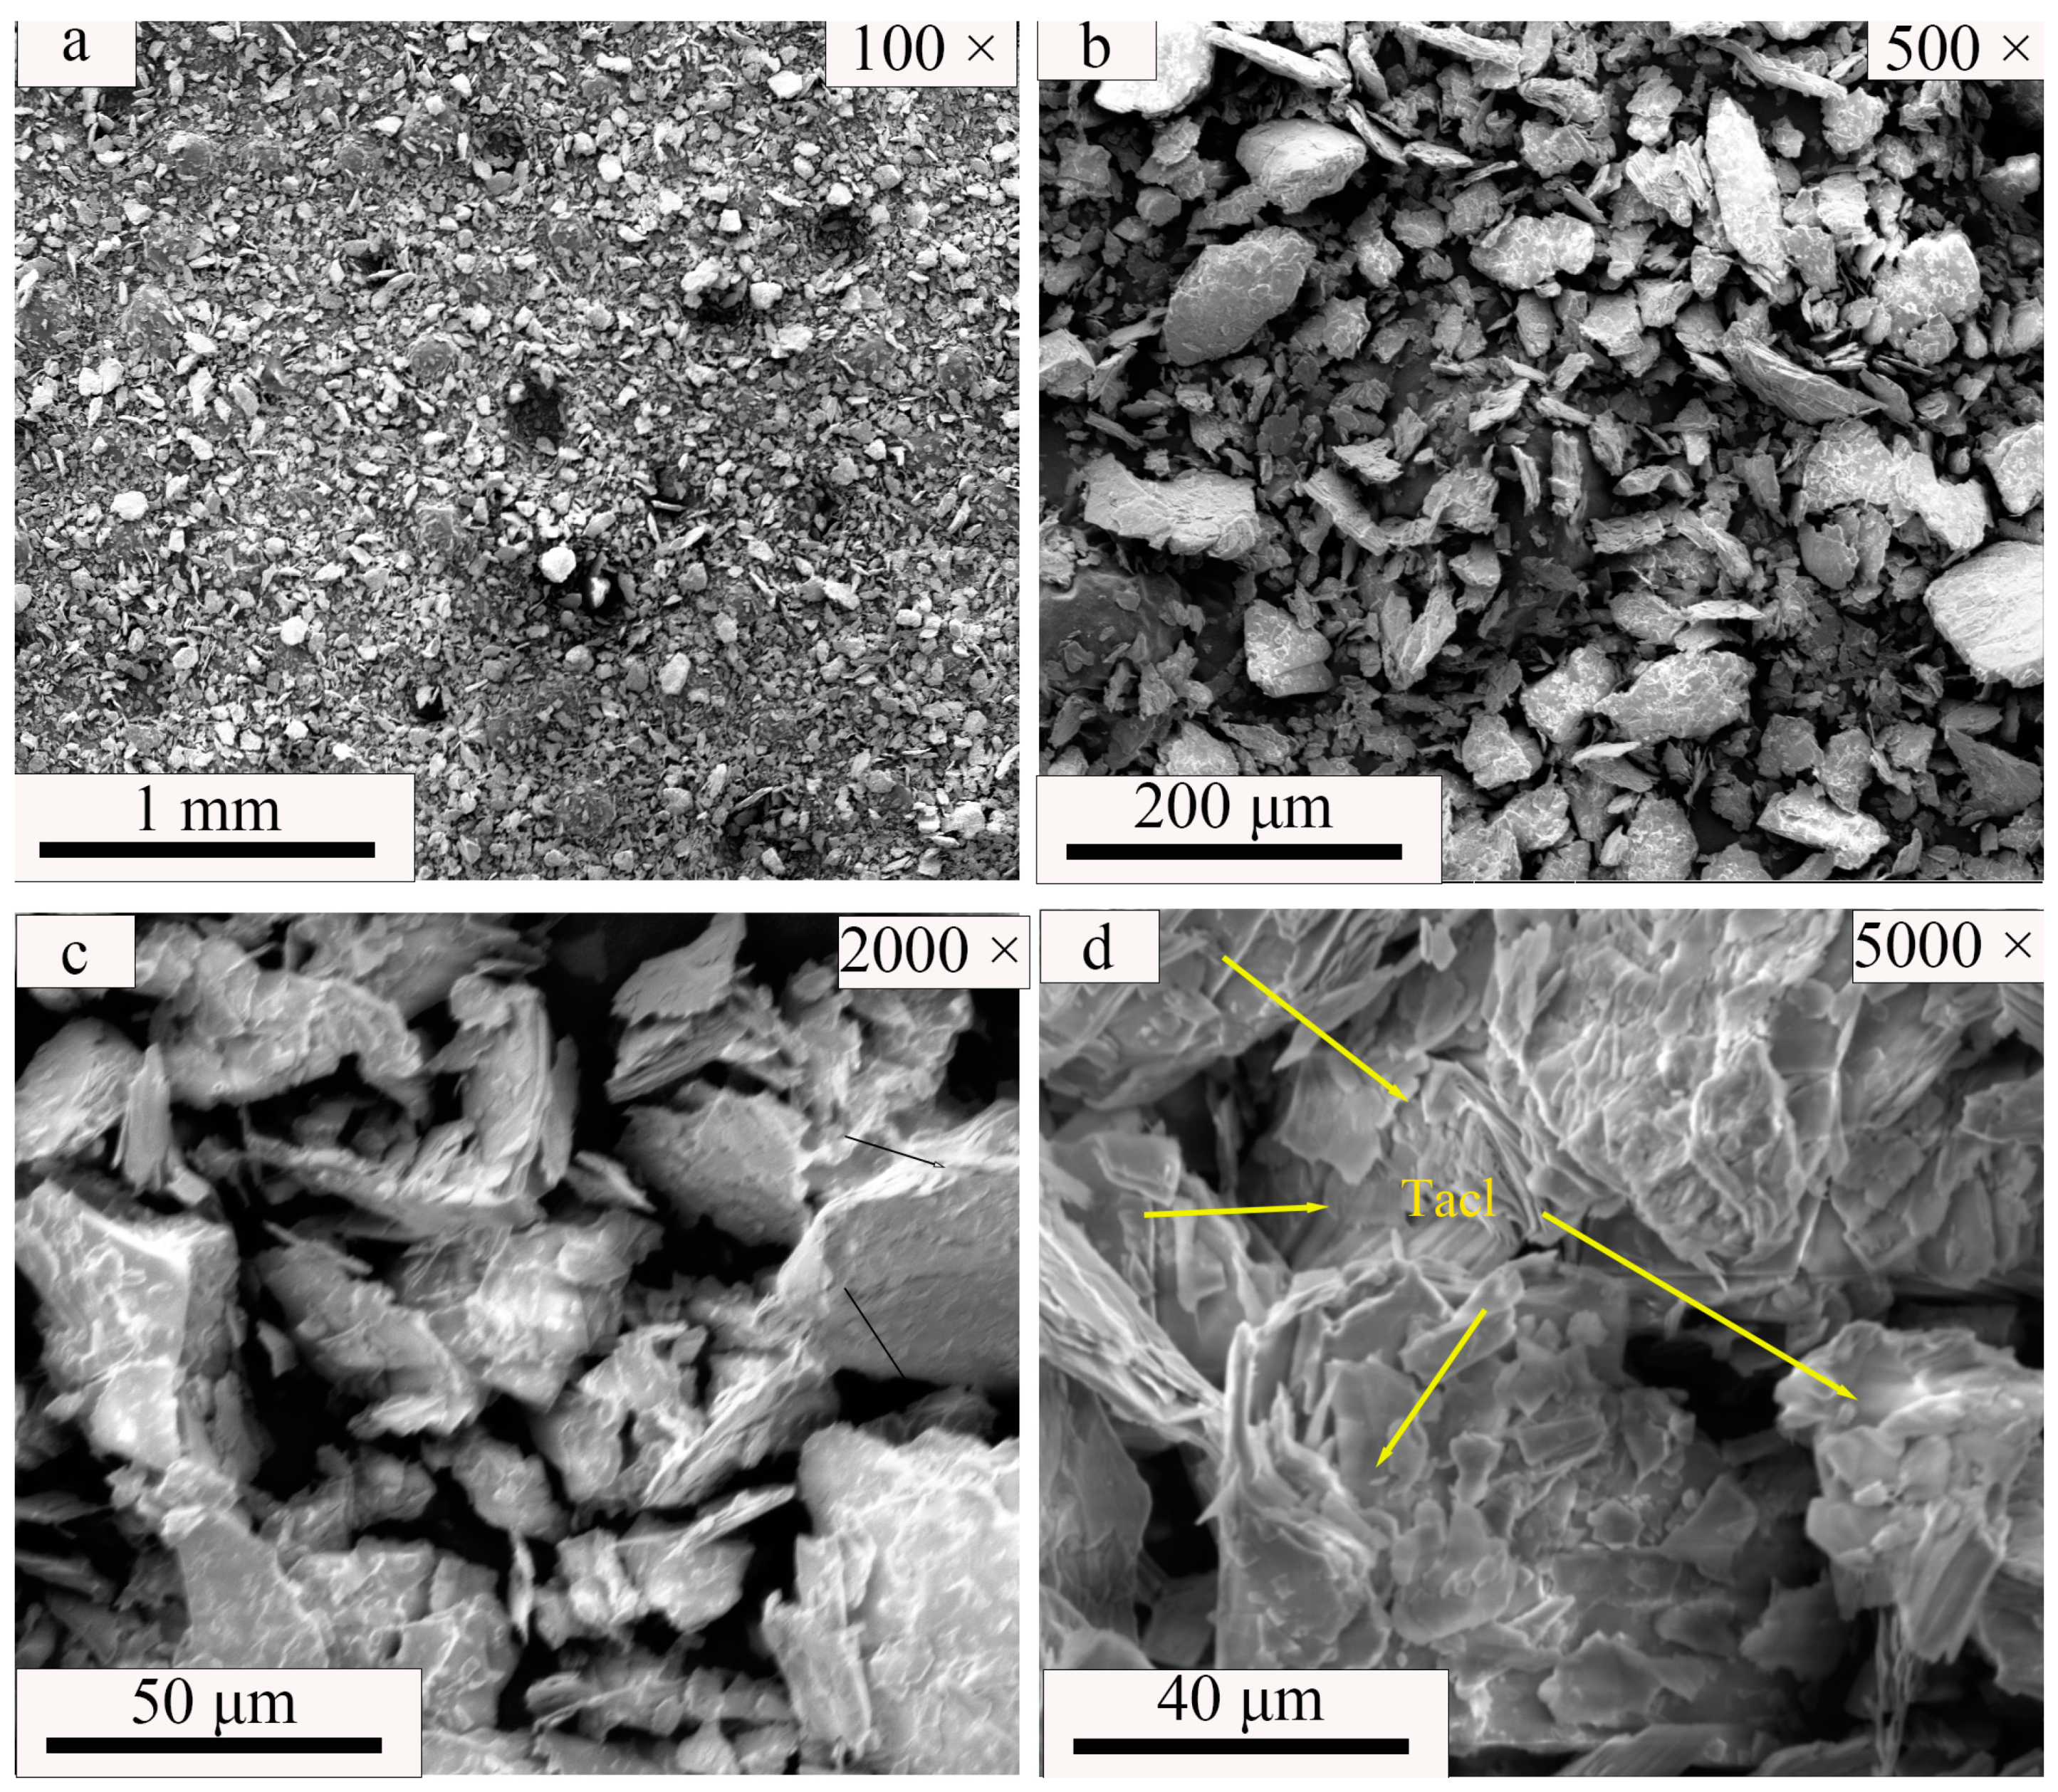
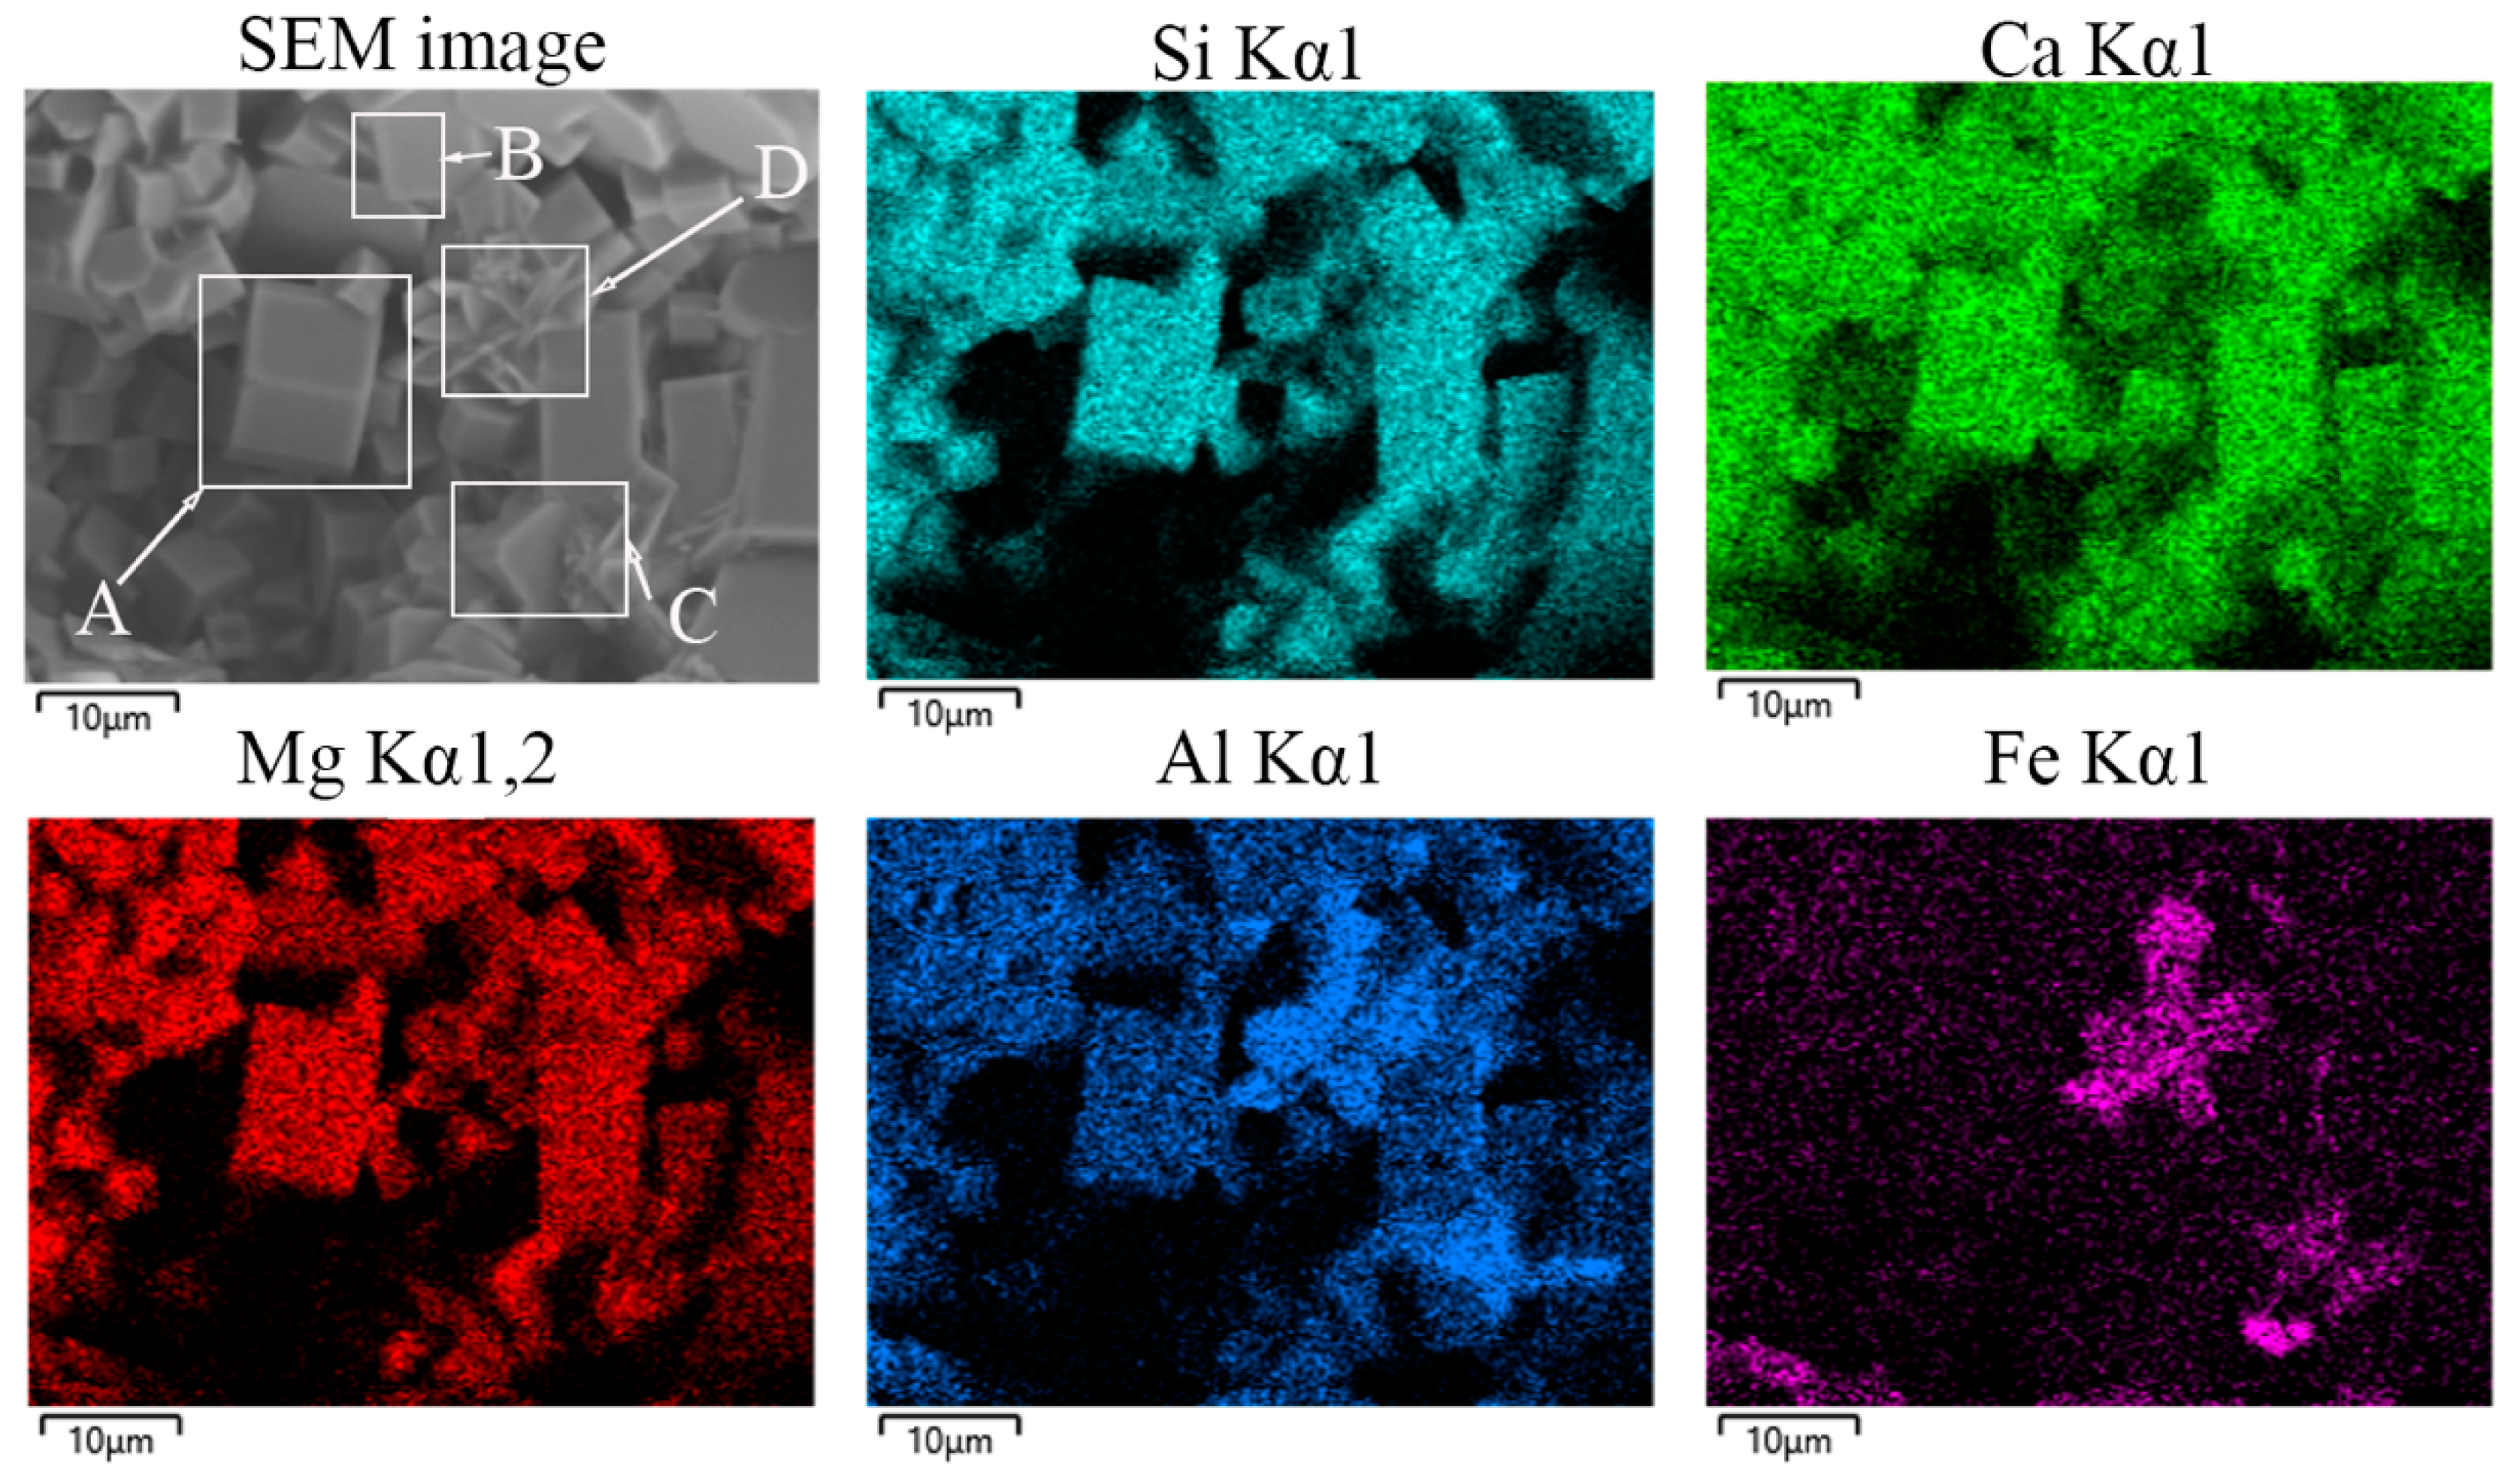
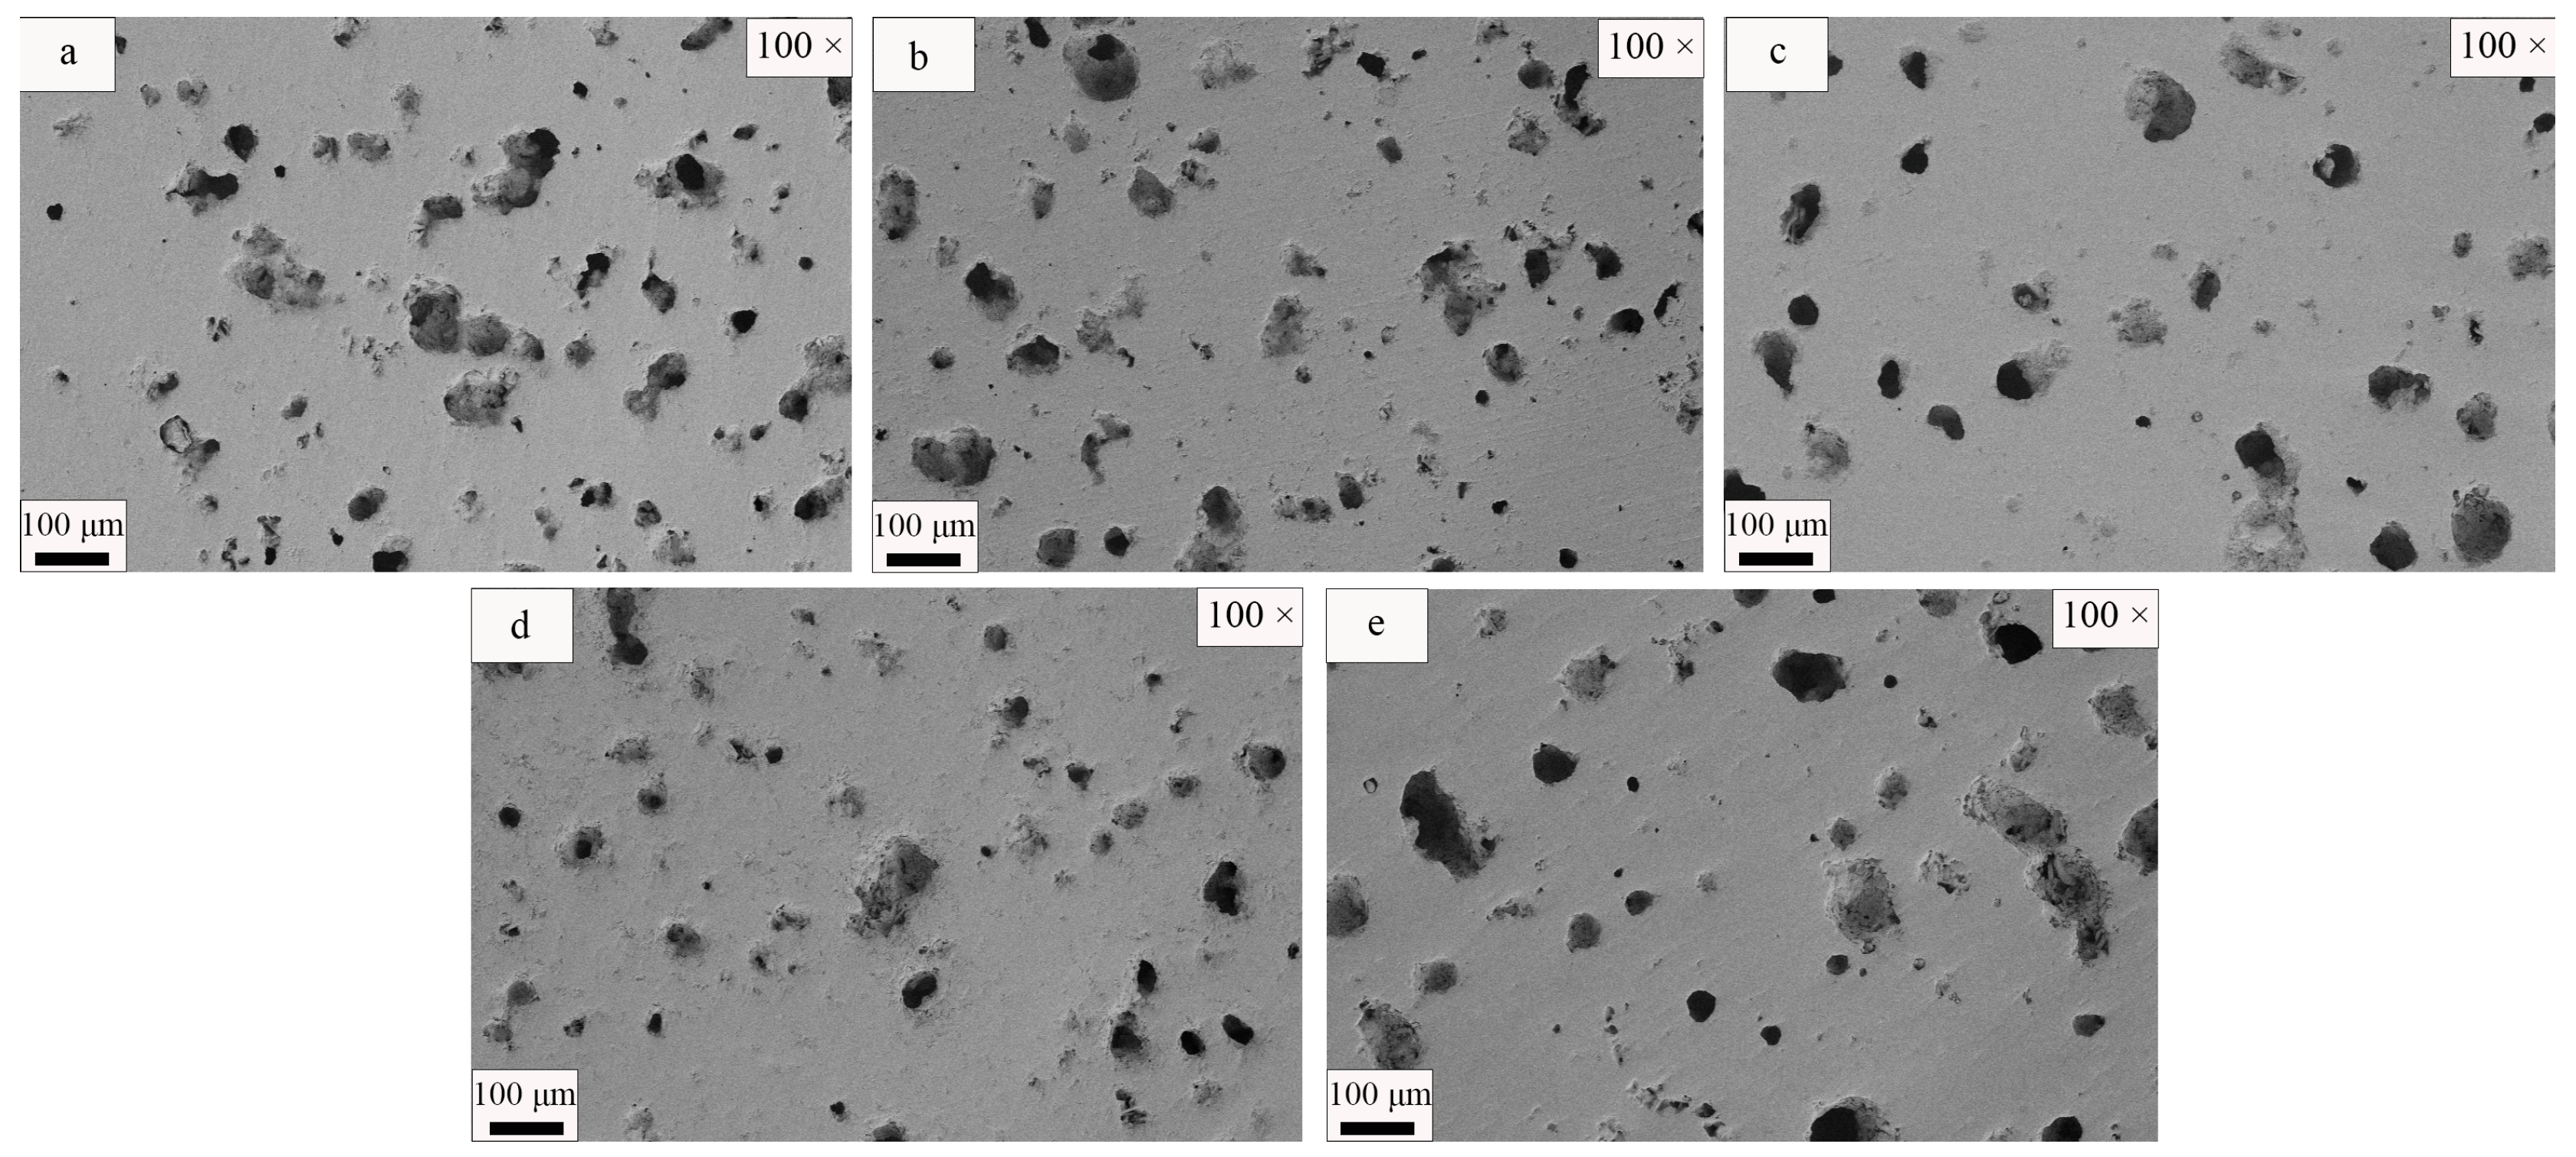
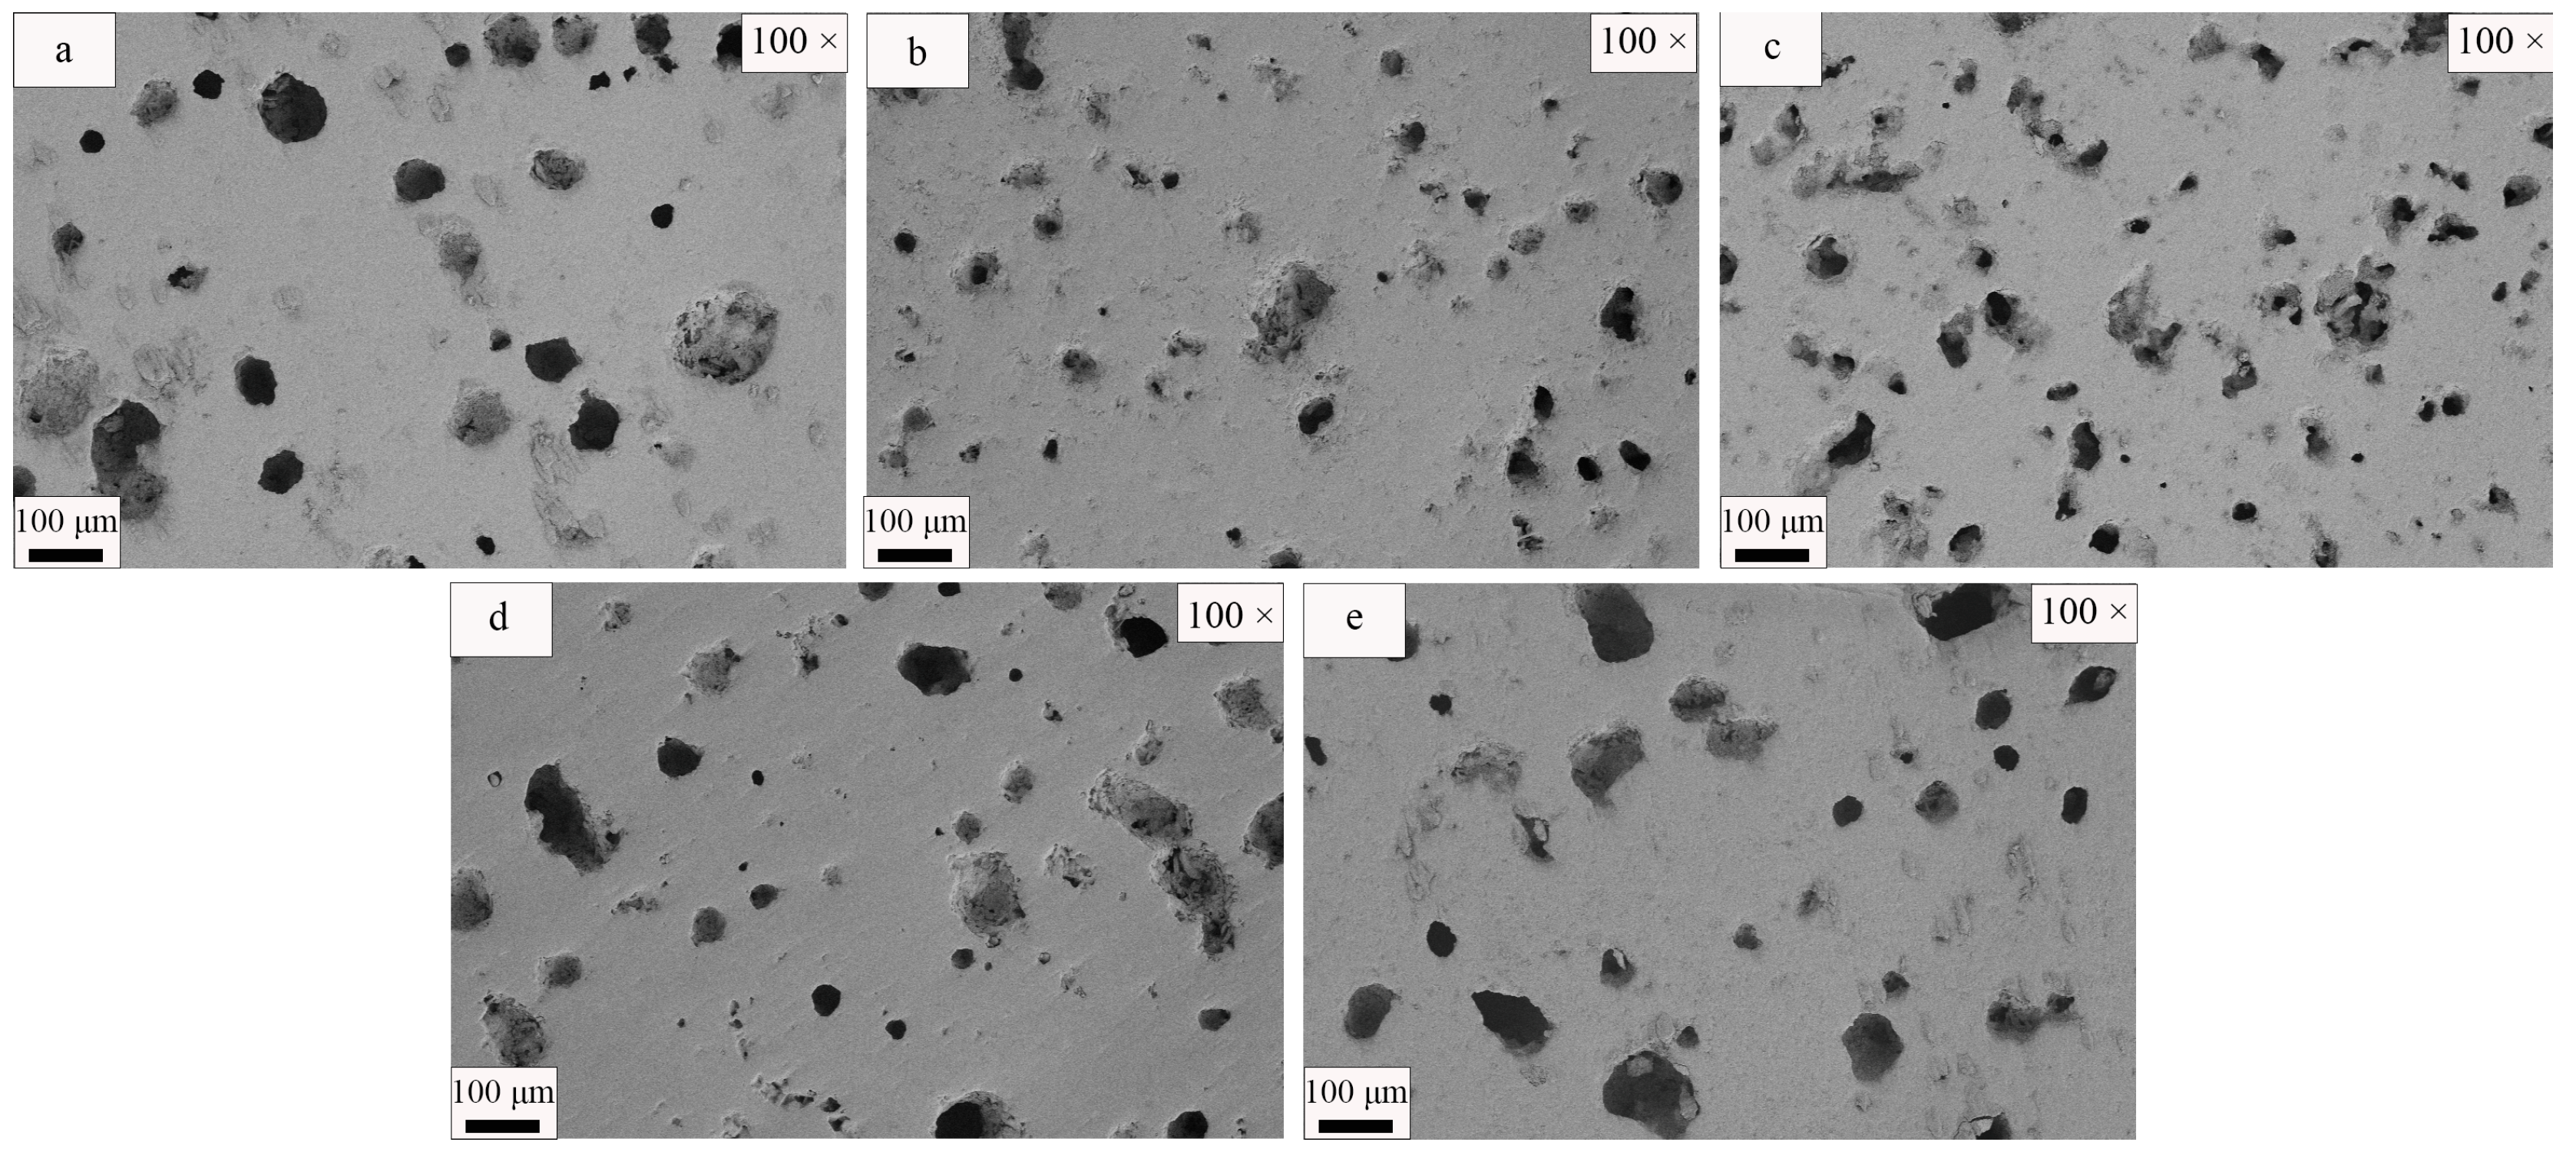
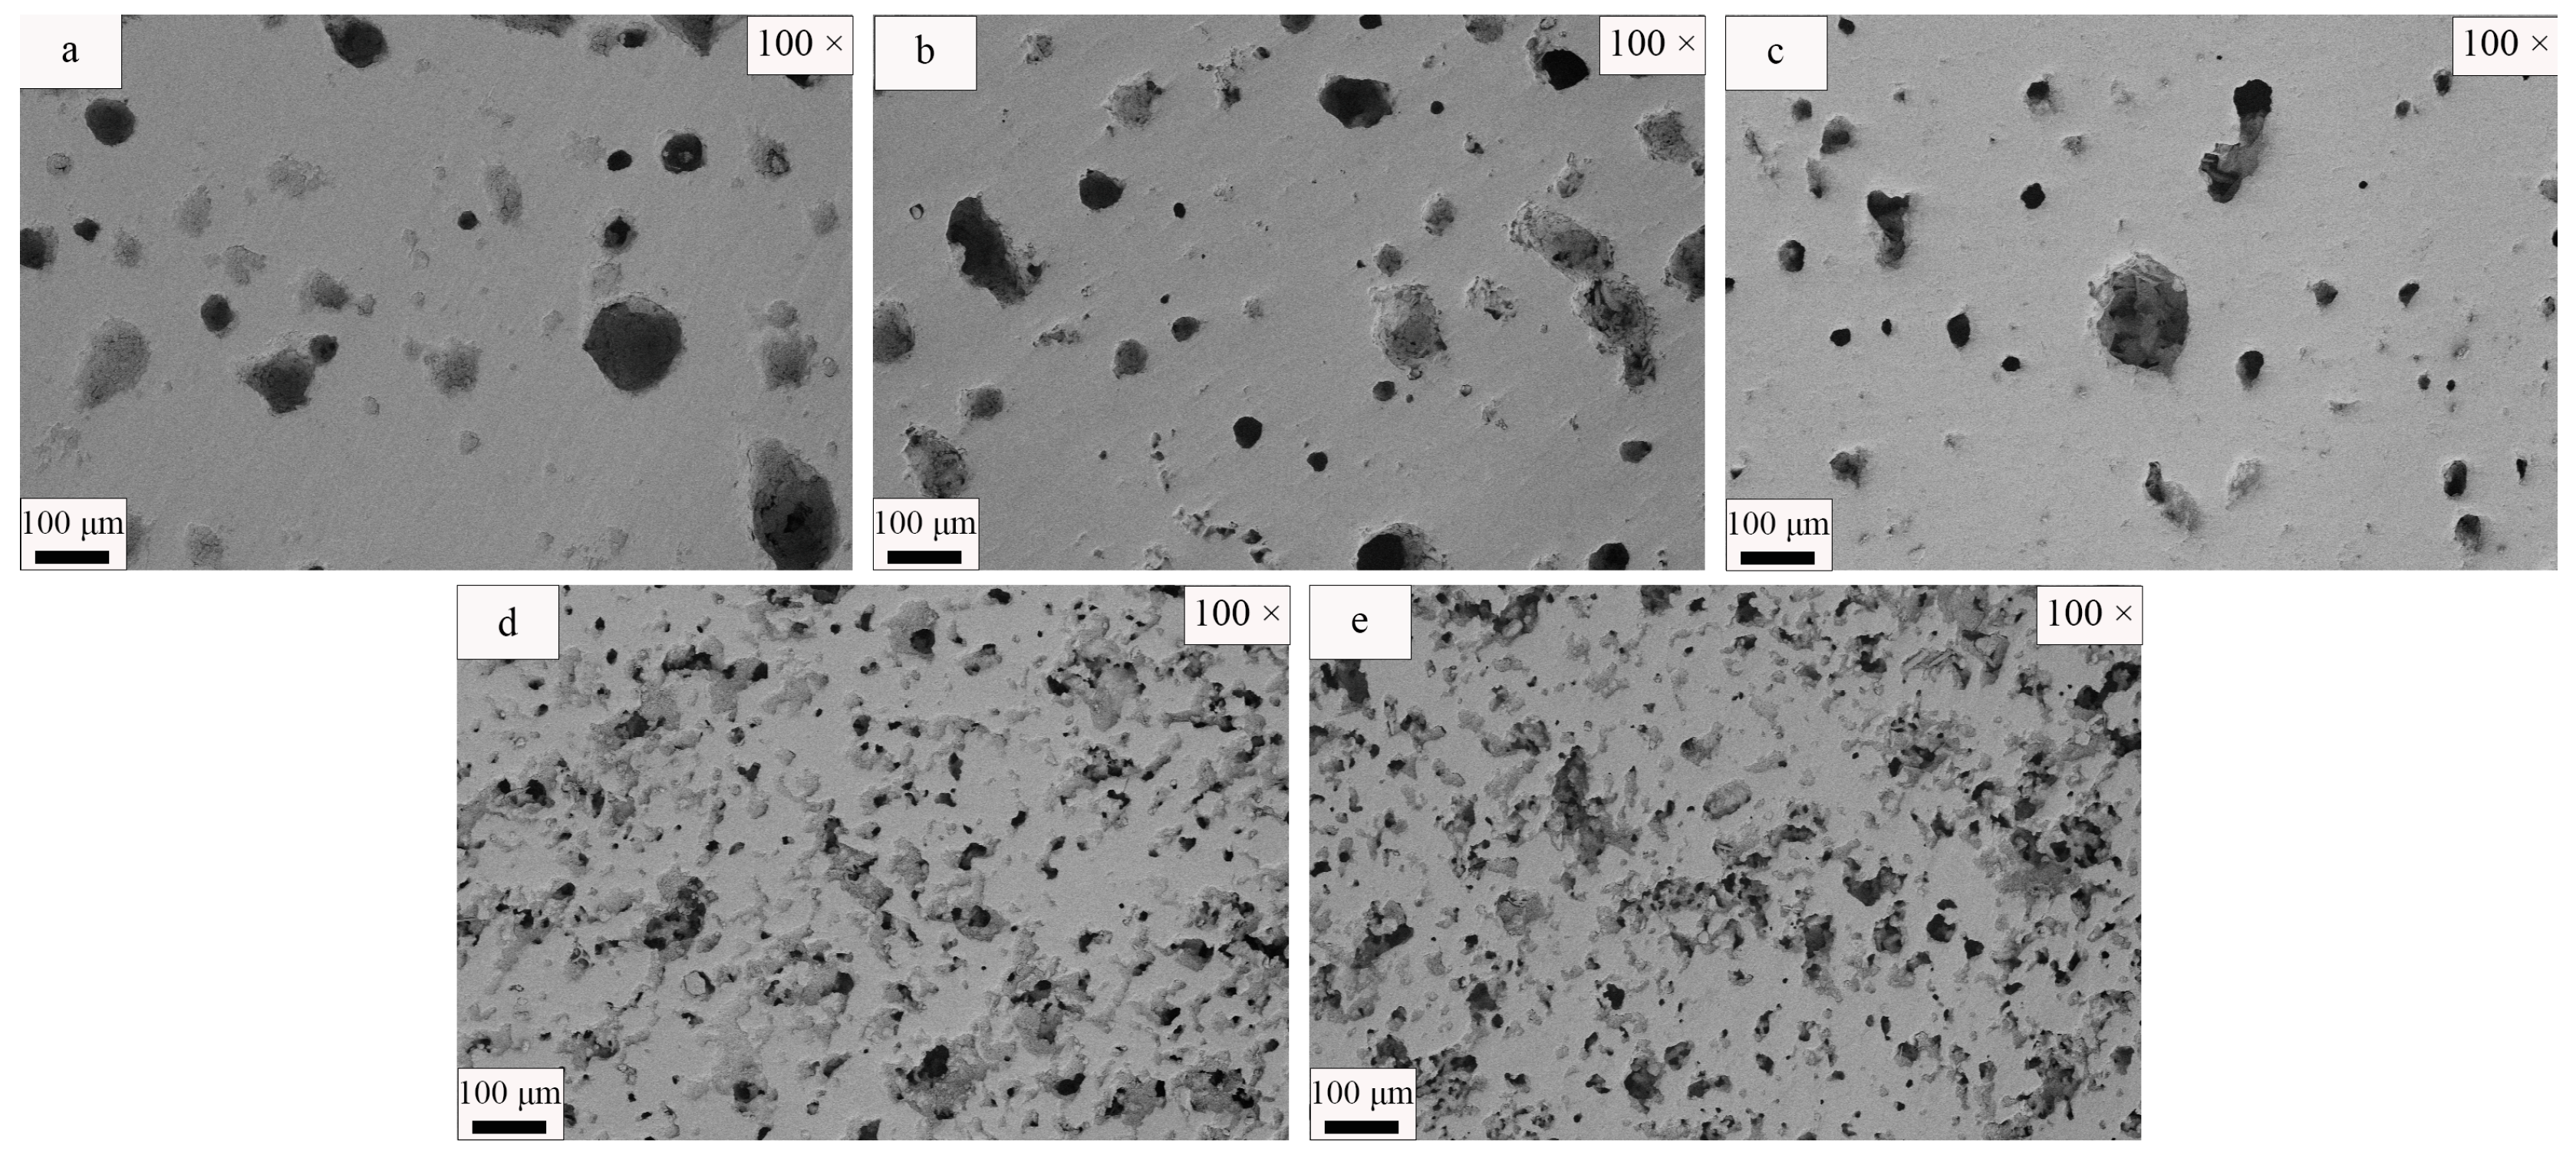
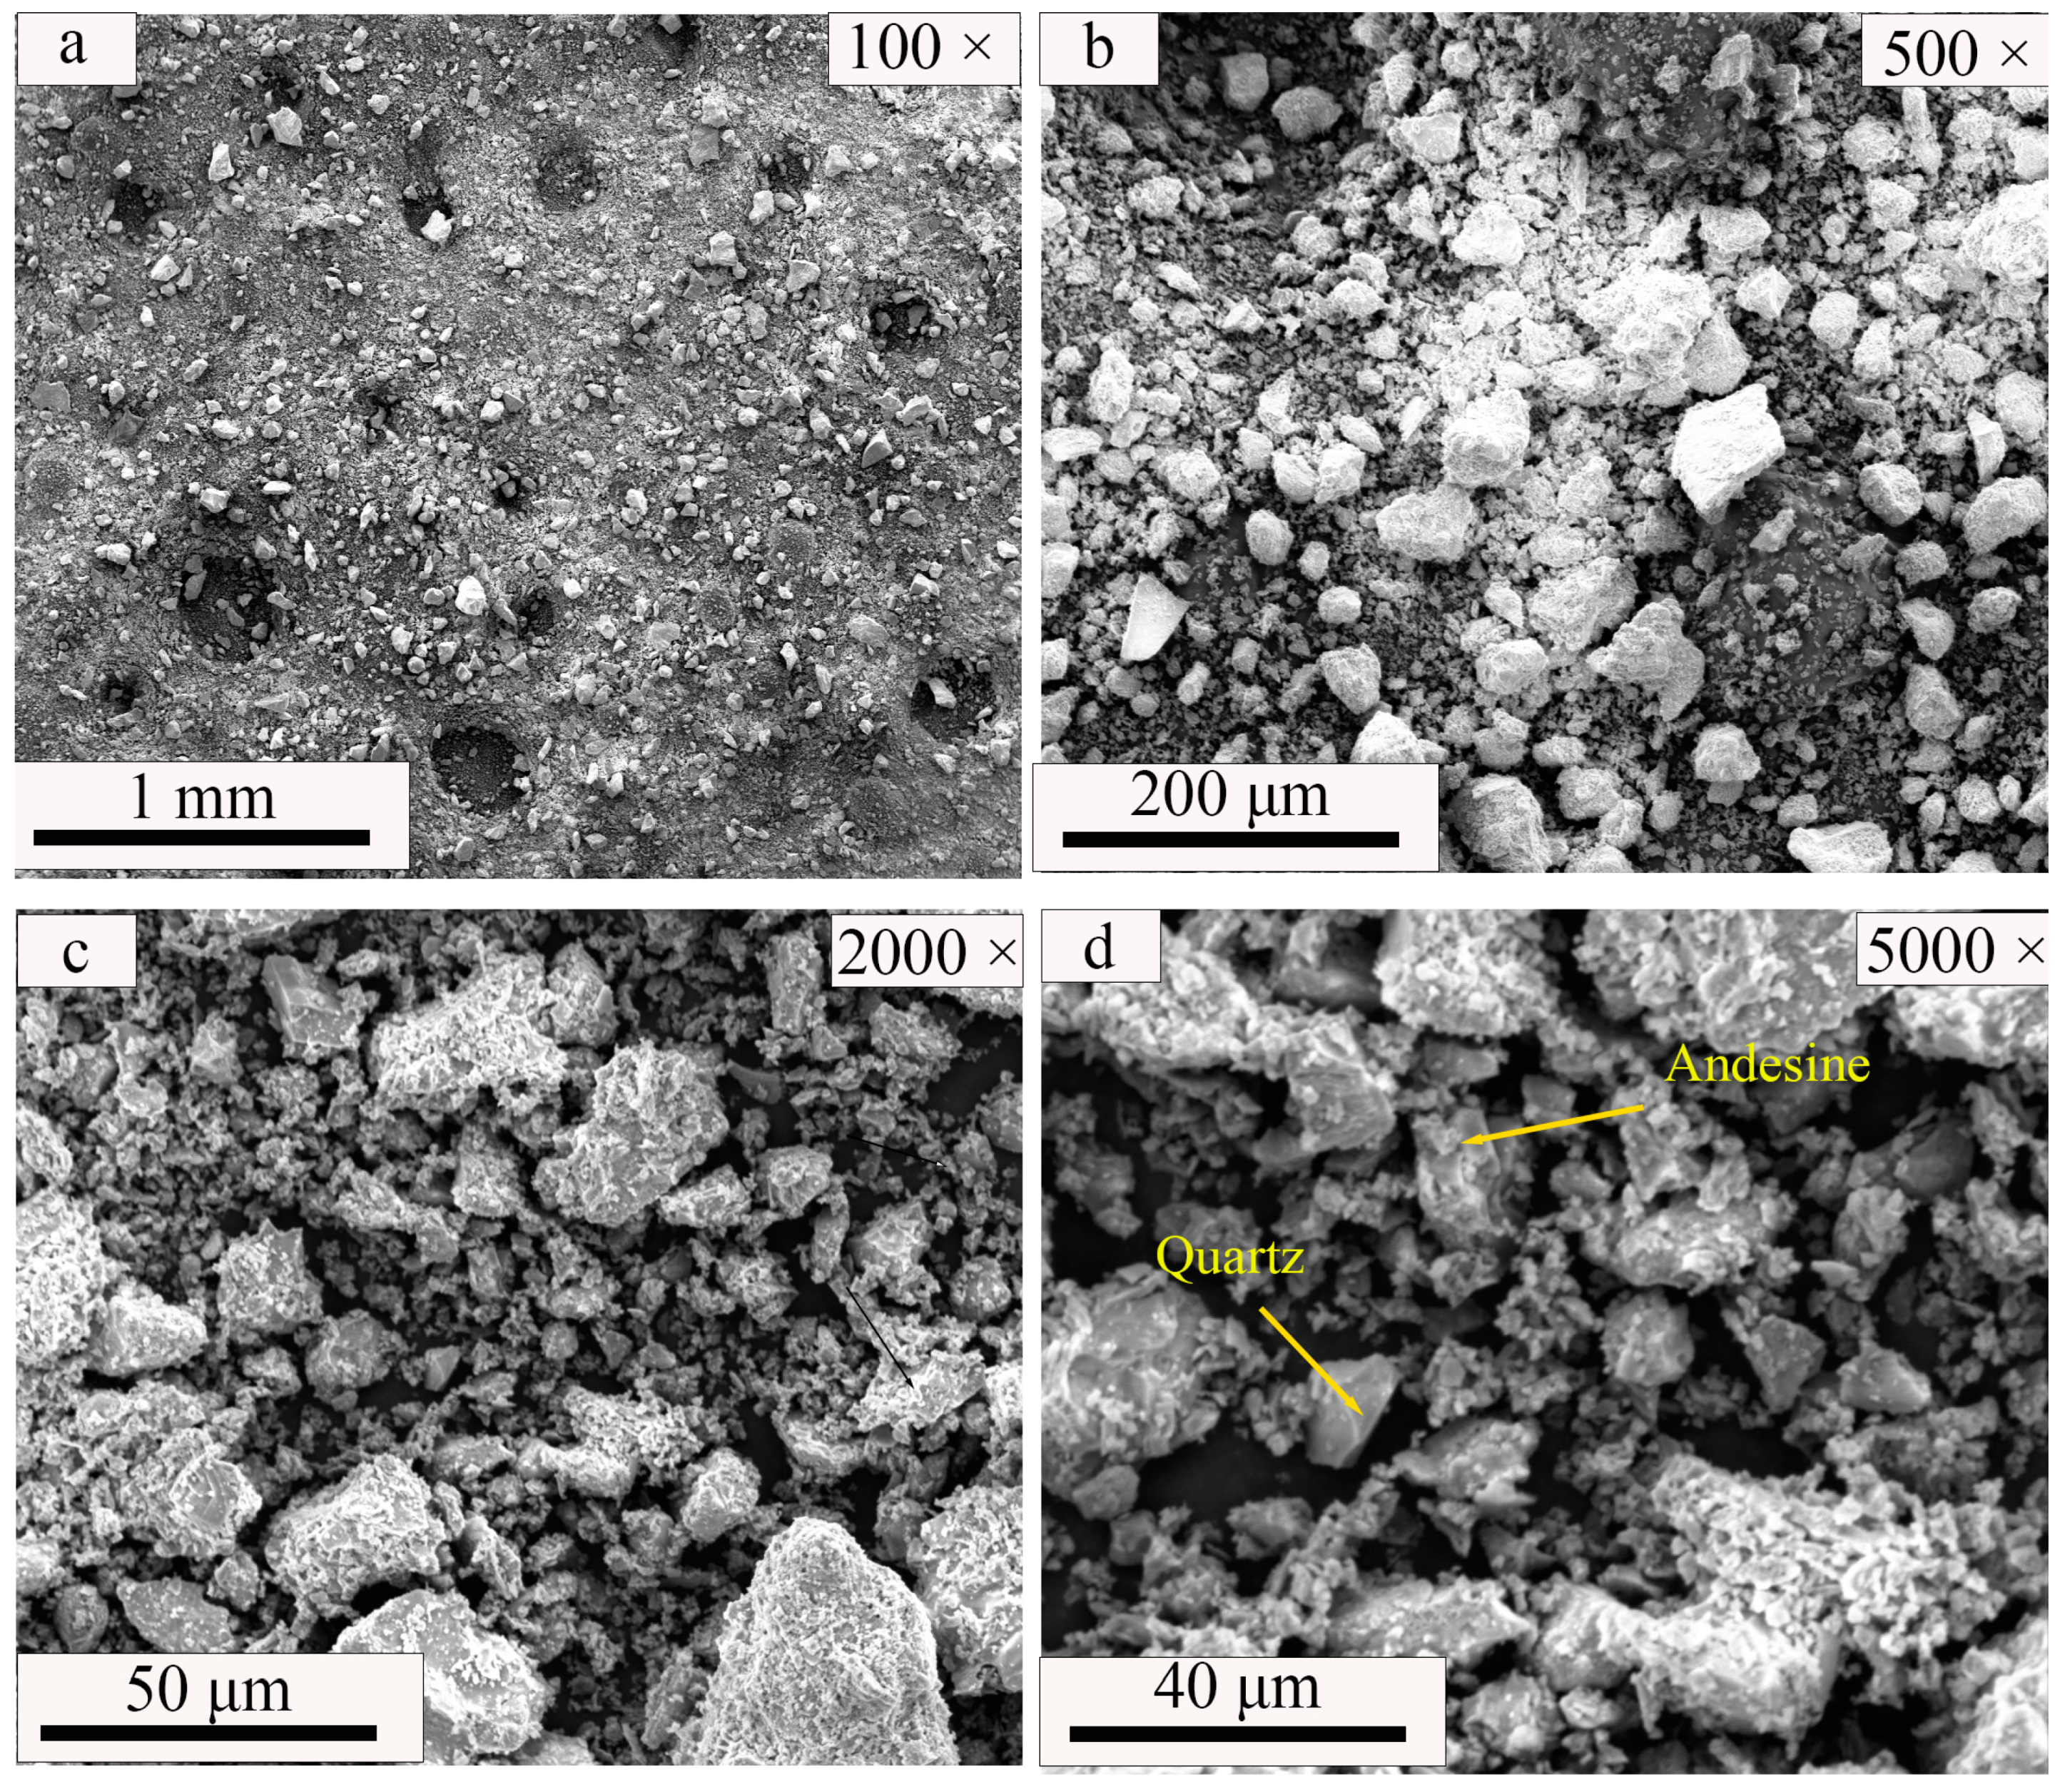
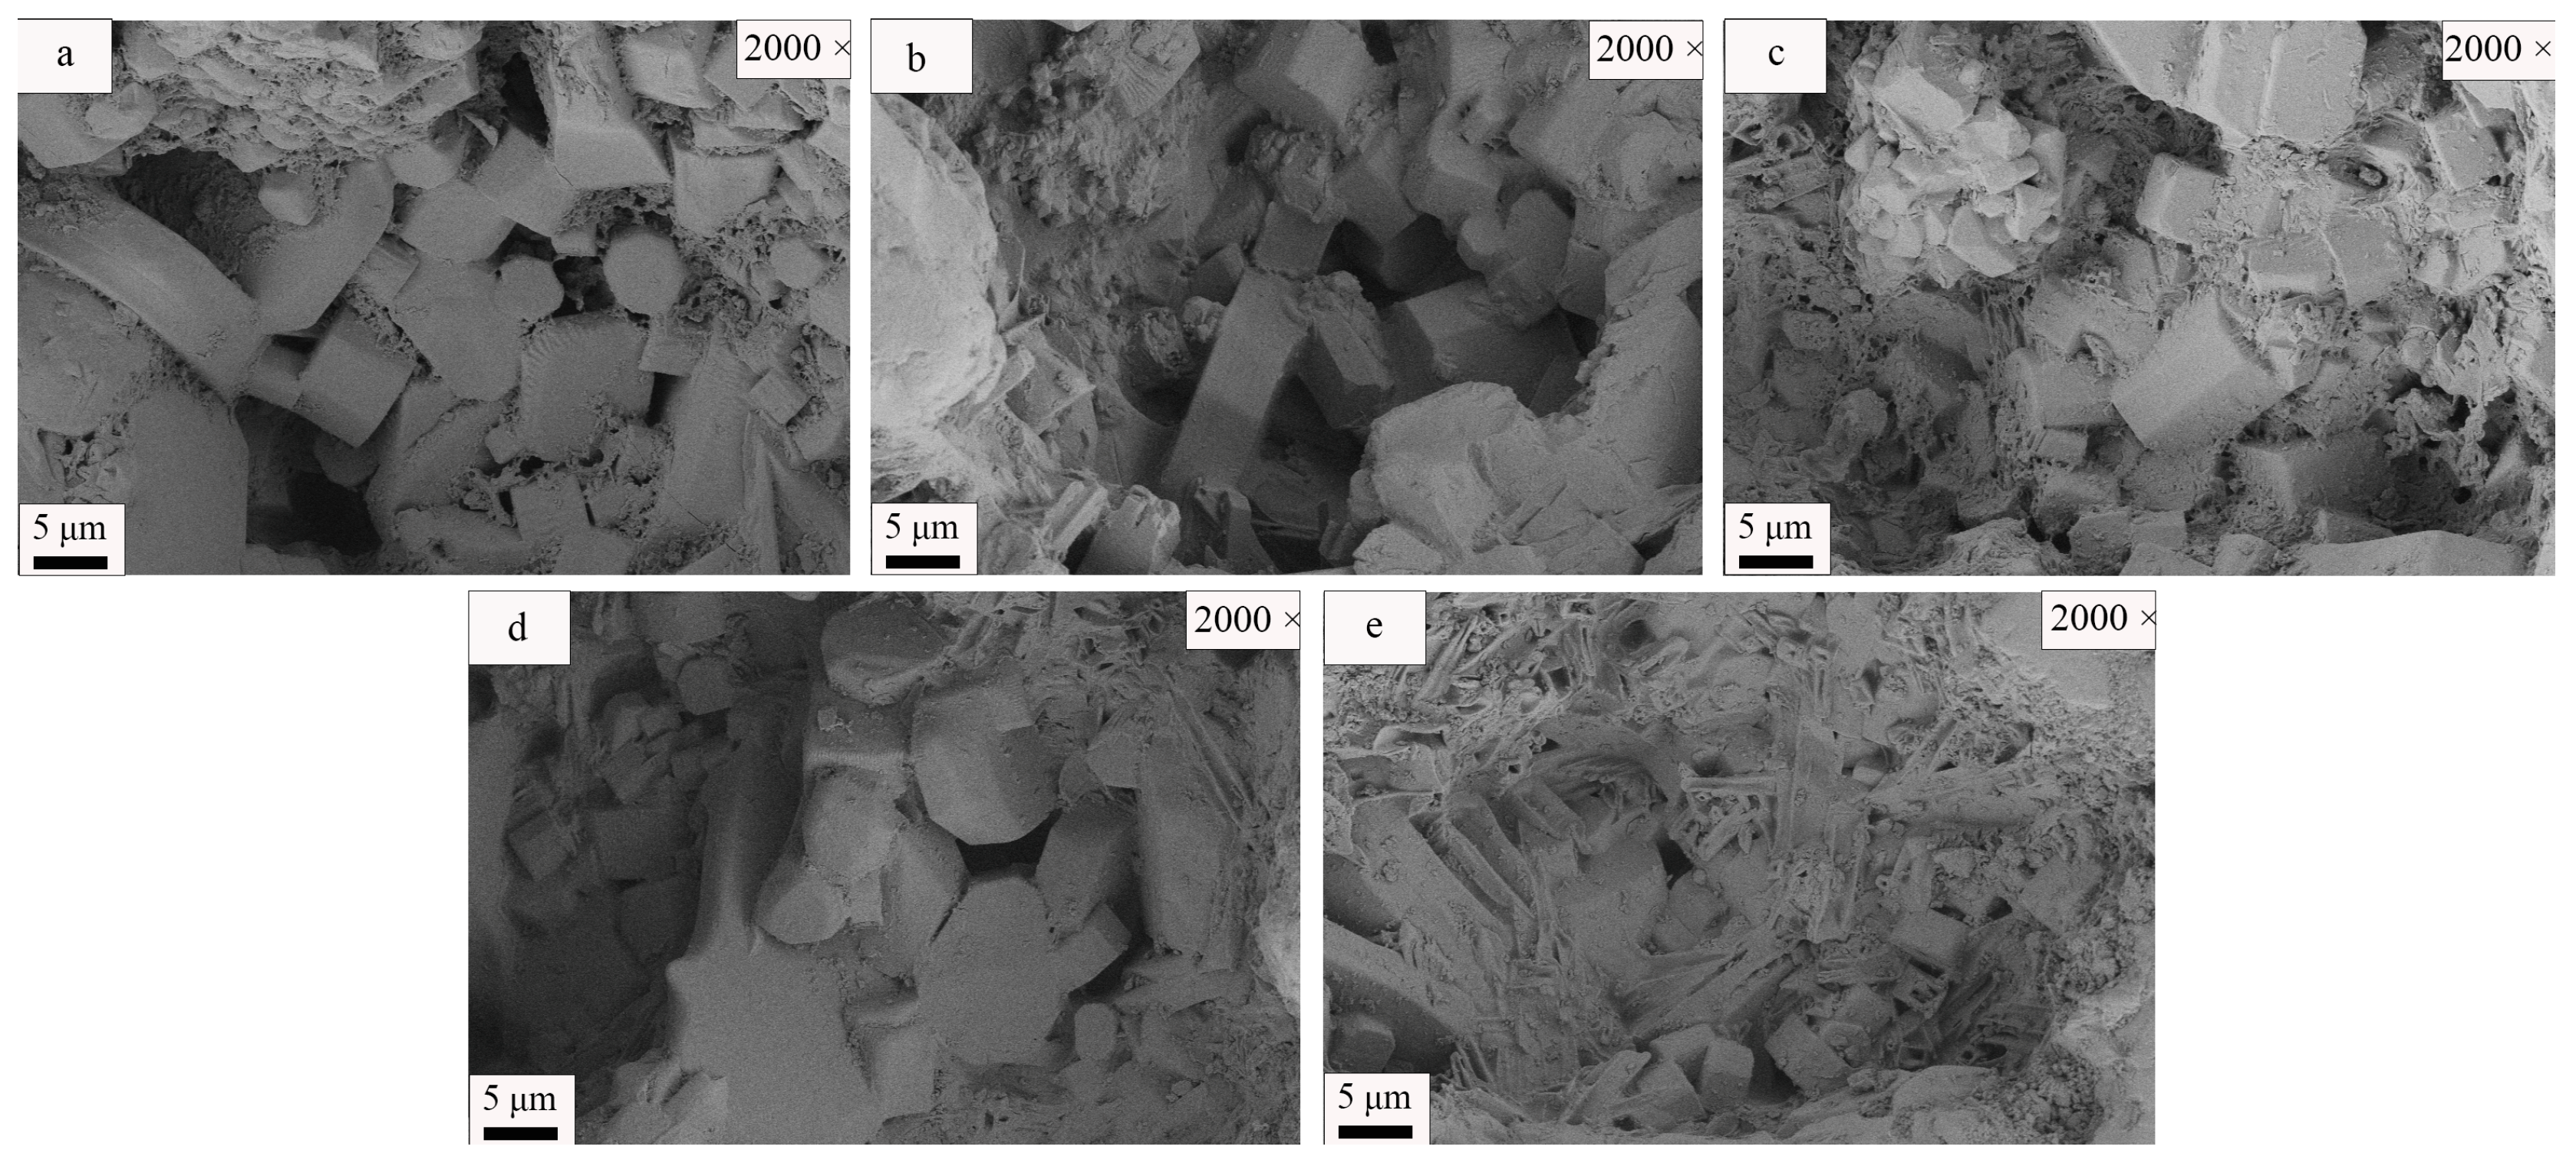
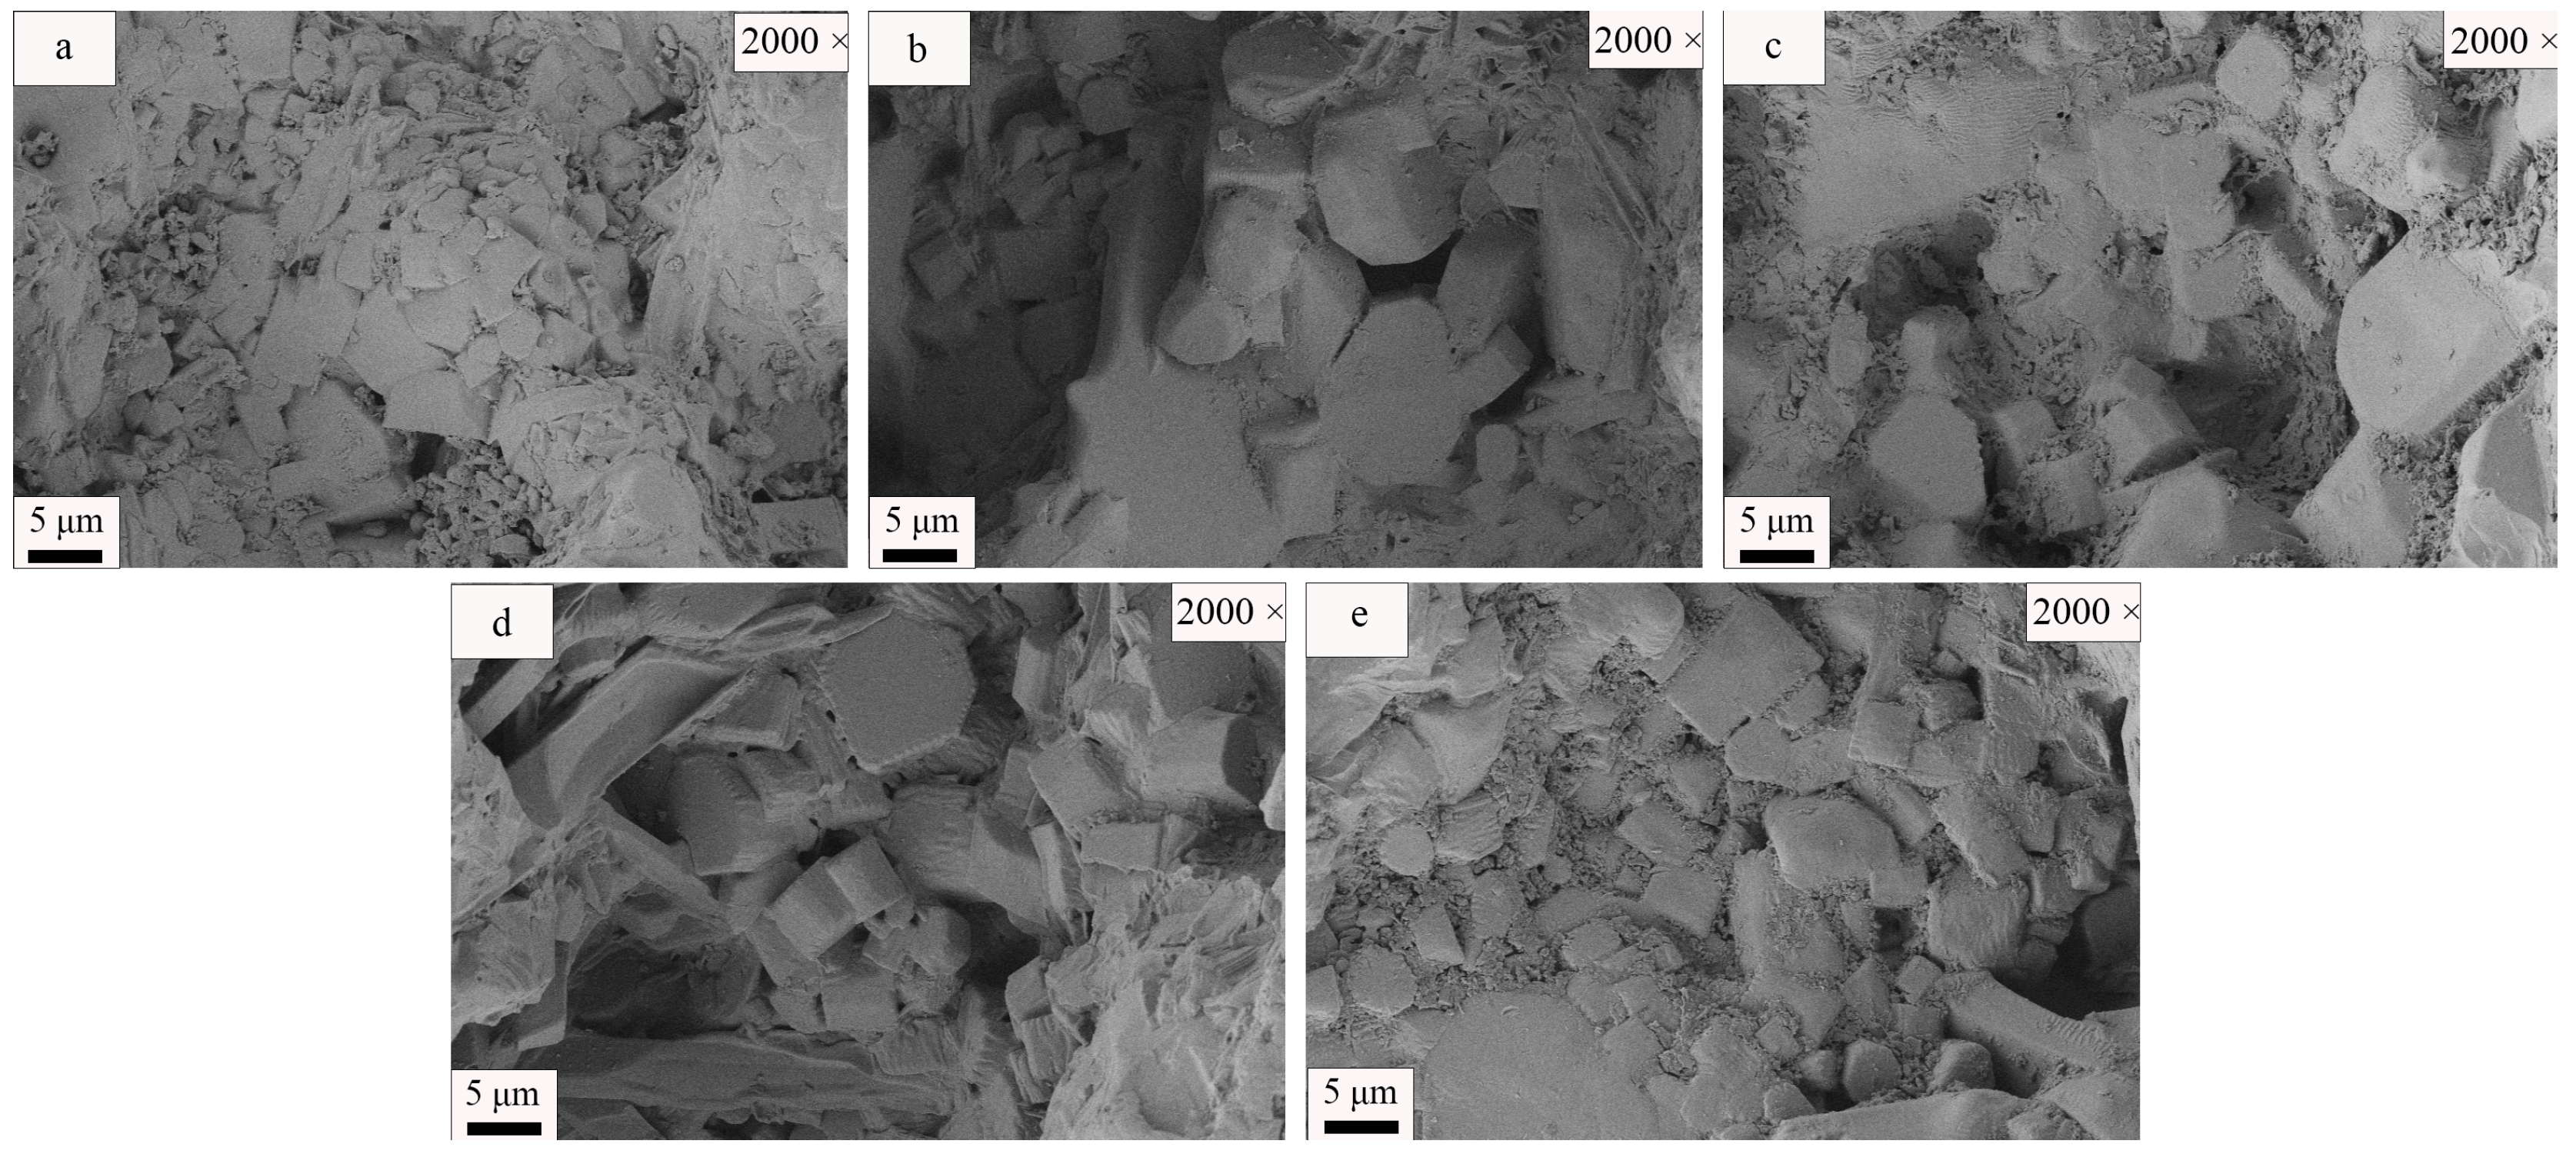
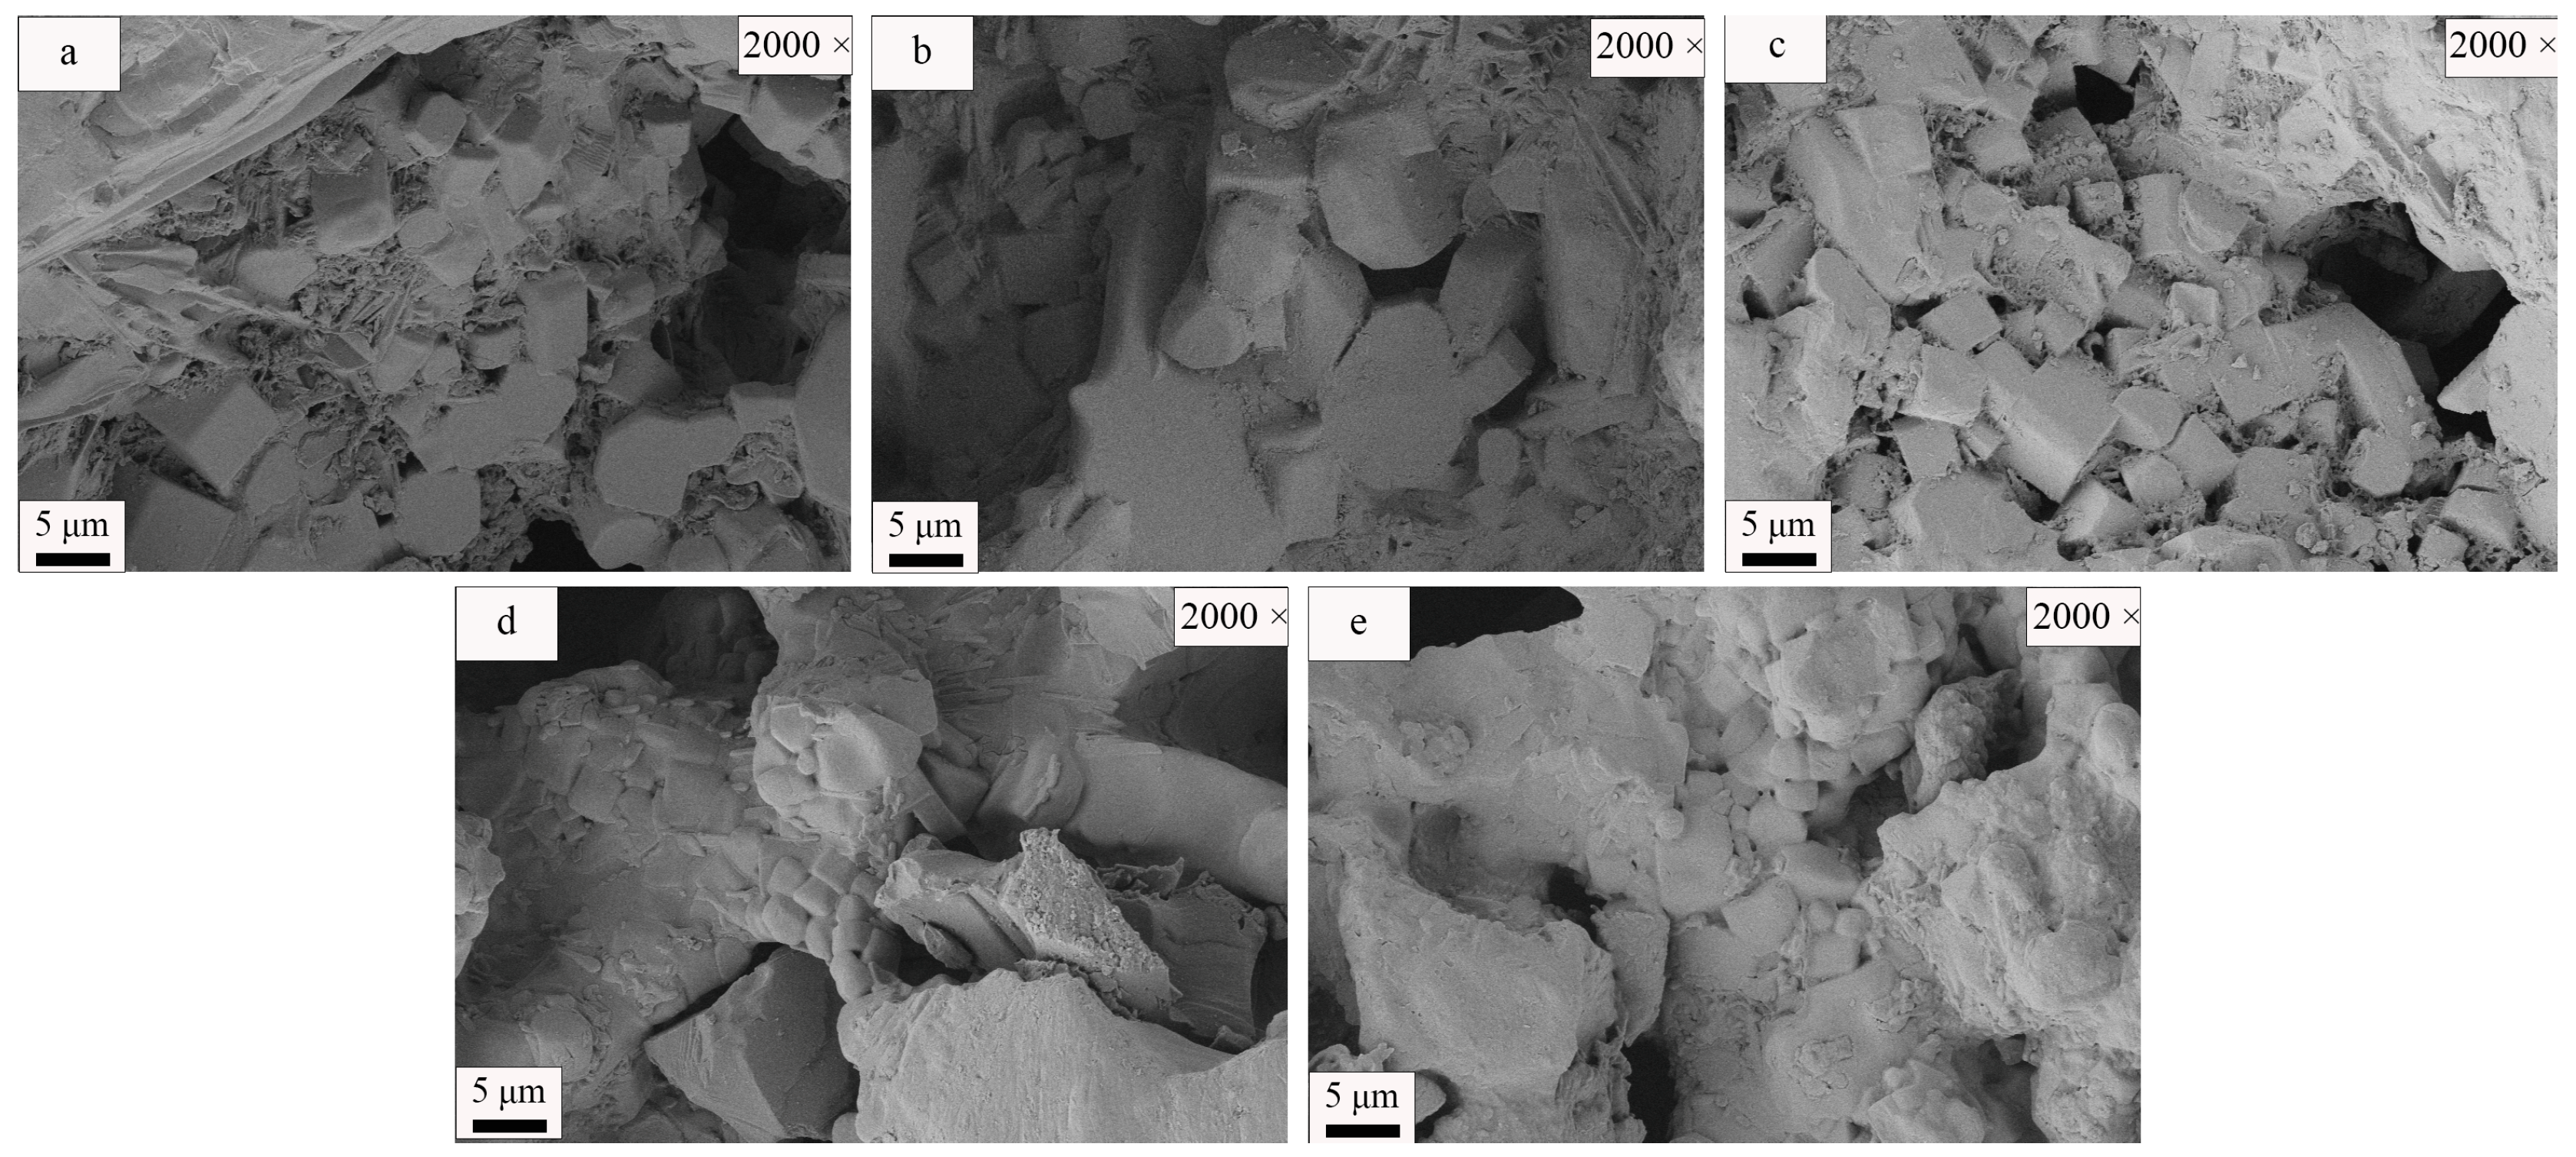
3.3. SEM Analysis
3.4. Economic Analysis
4. Discussion
5. Conclusions
Author Contributions
Funding
Institutional Review Board Statement
Informed Consent Statement
Data Availability Statement
Conflicts of Interest
References
- Teo, P.T.; Zakaria, S.K.; Sharif, N.M.; Abu Seman, A.; Taib MA, A.; Mohamed, J.J.; Yusoff, M.; Yusoff, A.H.; Mohamad, M.; Ali, A.; et al. Application of General Full Factorial Statistical Experimental Design’s Approach for the Development of Sustainable Clay-Based Ceramics Incorporated with Malaysia’s Electric Arc Furnace Steel Slag Waste. Crystals 2021, 11, 442. [Google Scholar] [CrossRef]
- Gao, W.H.; Zhou, W.T.; Lyu, X.; Liu, X.; Su, H.L.; Li, C.M.; Wang, H. Comprehensive utilization of steel slag: A review. Powder Technol. 2023, 422, 118449. [Google Scholar] [CrossRef]
- Yüksel, I. A review of steel slag usage in construction industry for sustainable development. Environ. Dev. Sustain. 2017, 19, 369–384. [Google Scholar] [CrossRef]
- Gao, T.M.; Dai, T.; Shen, L.; Jiang, L. Benefits of using steel slag in cement clinker production for environmental conservation and economic revenue generation. J. Clean Prod. 2021, 282, 124538. [Google Scholar] [CrossRef]
- Sas, W.; Gluchowski, A.; Radziemska, M.; Dzieciol, J.; Szymanski, A. Environmental and Geotechnical Assessment of the Steel Slags as a Material for Road Structure. Materials 2015, 8, 4857–4875. [Google Scholar] [CrossRef]
- Tozsin, G.; Yonar, F.; Yucel, O.; Dikbas, A. Utilization possibilities of steel slag as backfill material in coastal structures. Sci. Rep. 2023, 13, 4318. [Google Scholar] [CrossRef]
- Barca, C.; Meyer, D.; Liira, M.; Drissen, P.; Comeau, Y.; Andrès, Y.; Chazarenc, F. Steel slag filters to upgrade phosphorus removal in small wastewater treatment plants: Removal mechanisms and performance. Ecol. Eng. 2014, 68, 214–222. [Google Scholar] [CrossRef]
- Yang, L.Y.; Qian, X.M.; Wang, Z.; Li, Y.; Bai, H.; Li, H. Steel slag as low-cost adsorbent for the removal of phenanthrene and naphthalene. Adsorpt. Sci. Technol. 2018, 36, 1160–1177. [Google Scholar] [CrossRef]
- Ning, D.F.; Liang, Y.C.; Liu, Z.D.; Xiao, J.F.; Duan, A.W. Impacts of Steel-Slag-Based Silicate Fertilizer on Soil Acidity and Silicon Availability and Metals-Immobilization in a Paddy Soil. PLoS ONE 2016, 11, 0168163. [Google Scholar] [CrossRef]
- Han, F.; Yun, S.N.; Zhang, C.; Xu, H.F.; Wang, Z.Q. Steel slag as accelerant in anaerobic digestion for nonhazardous treatment and digestate fertilizer utilization. Bioresour. Technol. 2019, 282, 331–338. [Google Scholar] [CrossRef]
- Jiang, Y.; Ling, T.C.; Shi, C.J.; Pan, S.Y. Characteristics of steel slags and their use in cement and concrete—A review. Resour. Conserv. Recycl. 2018, 136, 187–197. [Google Scholar] [CrossRef]
- Liu, G.; Schollbach, K.; Li, P.P.; Brouwers, H.J.H. Valorization of converter steel slag into eco-friendly ultra-high performance concrete by ambient CO2 pre-treatment. Constr. Build. Mater. 2021, 280, 122580. [Google Scholar] [CrossRef]
- Zhang, Y.; Wu, Y.J.; Yang, X.K.; Li, D.H.; Zhang, X.Y.; Dong, X.; Yao, X.H.; Liu, J.C.; Guo, A.R. High-strength thermal insulating mullite nanofibrous porous ceramics. J. Eur. Ceram. Soc. 2020, 40, 2090–2096. [Google Scholar] [CrossRef]
- Zhao, L.H.; Li, Y.; Zhou, Y.Y.; Cang, D.Q. Preparation of novel ceramics with high CaO content from steel slag. Mater. Des. 2014, 64, 608–613. [Google Scholar] [CrossRef]
- Tabit, K.; Hajjou, H.; Waqif, M.; Saâdi, L. Effect of CaO/SiO2 ratio on phase transformation and properties of anorthite-based ceramics from coal fly ash and steel slag. Ceram. Int. 2020, 46, 7550–7558. [Google Scholar] [CrossRef]
- Ai, X.B.; Bai, H.; Zhao, L.H.; Cang, D.Q.; Tang, Q. Thermodynamic analysis and formula optimization of steel slag-based ceramic materials by FACTsage software. Int. J. Miner. Metall. Mater. 2013, 20, 379–385. [Google Scholar] [CrossRef]
- Zhang, X.D.; Zheng, C.Z.; Liu, S.P.; Zong, Y.B.; Zhou, Q.F.; Qin, S.C. Preparation of Steel Slag Ceramics with Different MgO/Al2O3 Ratios. Appl. Sci. 2019, 9, 4741. [Google Scholar] [CrossRef]
- Al-kroom, H.; Atyia, M.M.; Mahdy, M.G.; Abd Elrahman, M. The Effect of Finely-Grinded Crushed Brick Powder on Physical and Microstructural Characteristics of Lightweight Concrete. Minerals 2022, 12, 159. [Google Scholar] [CrossRef]
- Zhao, Y.S.; Gao, J.M.; Chen, F.; Liu, C.B.; Chen, X.M. Utilization of waste clay bricks as coarse and fine aggregates for the preparation of lightweight aggregate concrete. J. Clean Prod. 2018, 201, 706–715. [Google Scholar] [CrossRef]
- Ge, Z.; Wang, Y.Y.; Sun, R.J.; Wu, X.S.; Guan, Y.H. Influence of ground waste clay brick on properties of fresh and hardened concrete. Constr. Build. Mater. 2015, 98, 128–136. [Google Scholar] [CrossRef]
- Ibrahim, J.; Tihtih, M.; Gömze, L.A. Environmentally-friendly ceramic bricks made from zeolite-poor rock and sawdust. Constr. Build. Mater. 2021, 297, 123715. [Google Scholar] [CrossRef]
- Silva, R.V.; de Brito, J.; Lye, C.Q.; Dhir, R.K. The role of glass waste in the production of ceramic-based products and other applications: A review. J. Clean Prod. 2017, 167, 346–364. [Google Scholar] [CrossRef]
- Peng, L.H.; Qin, S. Sintering Behavior and Technological Properties of Low-Temperature Porcelain Tiles Prepared Using a Lithium Ore and Silica Crucible Waste. Minerals 2019, 9, 731. [Google Scholar] [CrossRef]
- Barreto, E.D.; Stafanato, K.V.; Marvila, M.T.; de Azevedo, A.R.G.; Ali, M.; Pereira, R.M.L.; Monteiro, S.N. Clay Ceramic Waste as Pozzolan Constituent in Cement for Structural Concrete. Materials 2021, 14, 2917. [Google Scholar] [CrossRef]
- Aliabdo, A.A.; Abd-Elmoaty, A.-E.M.; Hassan, H.H. Utilization of crushed clay brick in cellular concrete production. Alex. Eng. J. 2014, 53, 119–130. [Google Scholar] [CrossRef]
- Li, H.B.; Zhang, H.B.; Yan, P.F.; Tong, Y.F.; Yan, C.Y.; Ding, Y.F. Experiment on Size Effect and Fractal Characteristics of Waste Brick and Concrete Recycled Aggregate. Adv. Mater. Sci. Eng. 2021, 2021, 6097897. [Google Scholar] [CrossRef]
- Hu, Z.J.; Shi, T.; Cen, M.Q.; Wang, J.M.; Zhao, X.Y.; Zeng, C.; Zhou, Y.; Fan, Y.J.; Liu, Y.M.; Zhao, Z.F. Research progress on lunar and Martian concrete. Constr. Build. Mater. 2022, 343, 128117. [Google Scholar] [CrossRef]
- Zheng, C.; Lou, C.; Du, G.; Li, X.; Liu, Z.; Li, L. Mechanical properties of recycled concrete with demolished waste concrete aggregate and clay brick aggregate. Results Phys. 2018, 9, 1317–1322. [Google Scholar] [CrossRef]
- Deng, X.; Li, J.; Lu, Z.Y.; Zhang, J.J.; Luo, K.; Hou, L.; Niu, Y.H.; Hu, J.; He, K.W. Recycled mineral admixtures based on recycled clay brick. J. Build. Eng. 2023, 76, 107193. [Google Scholar] [CrossRef]
- Zong, Y.B.; Chen, W.H.; Fan, Y.; Yang, T.L.; Liu, Z.B.; Cang, D.Q. Complementation in the composition of steel slag and red mud for preparation of novel ceramics. Int. J. Miner. Metall. Mater. 2018, 25, 1010–1017. [Google Scholar] [CrossRef]
- GB/T 3810.3-2016; Ceramic Tiles—Methods of Test—Part 3: Determination of Water Absorption, Apparent Porosity, Apparent Relative Density and Bulk Density. General Administration of Quality Supervision, Inspection and Quarantine of the People’s Republic of China: Beijing, China; Standardization Administration of the People’s Republic of China: Beijing, China, 2016; p. 8.
- GB/T 3810.4-2016; Ceramic Tiles—Methods of Test—Part 4: Determination of Modulus of Rupture and Failure Strength. General Administration of Quality Supervision, Inspection and Quarantine of the People’s Republic of China: Beijing, China; Standardization Administration of the People’s Republic of China: Beijing, China, 2016; p. 12.
- Zhao, L.H.; Li, Y.; Zhang, L.L.; Cang, D.Q. Effects of CaO and Fe2O3 on the Microstructure and Mechanical Properties of SiO2-CaO-MgO-Fe2O3Ceramics from Steel Slag. ISIJ Int. 2017, 57, 15–22. [Google Scholar] [CrossRef]
- Ismail, H.; Ahmad, A.; Mohamad, H. Characteristics of akermanite-gehlenite and diopside bioceramics derived from CaO-MgO-Al2O3-SiO2 system as a potential bone substitute material. J. Aust. Ceram. Soc. 2023, 59, 1361–1371. [Google Scholar] [CrossRef]
- Yu, J.W.; Han, Y.X.; Li, Y.J.; Gao, P. Growth behavior of the magnetite phase in the reduction of hematite via a fluidized bed. Int. J. Miner. Metall. Mater. 2019, 26, 1231–1238. [Google Scholar] [CrossRef]
- Dunce, M.; Birks, E.; Antonova, M.; Bikse, L.; Dutkevica, S.; Freimanis, O.; Livins, M.; Eglite, L.; Smits, K.; Sternberg, A. Influence of sintering temperature on microstructure of Na0.5Bi0.5TiO3 ceramics. J. Alloys Compd. 2021, 884, 160955. [Google Scholar] [CrossRef]
- Fisher, J.G.; Kang, S.J.L. Strategies and practices for suppressing abnormal grain growth during liquid phase sintering. J. Am. Ceram. Soc. 2019, 102, 717–735. [Google Scholar] [CrossRef]
- Nakano, M.; Okazaki, J. Ideal Behavior of Sinter Block Densification and Relation Thereof to Yield and Strength in Iron Ore Sintering. ISIJ Int. 2011, 51, 1418–1424. [Google Scholar] [CrossRef]
- Wang, S.; Guo, Y.F.; Liu, K.; Yang, Z.; Liu, Y.J.; Jiang, Y.; Chen, F.; Zheng, F.Q.; Yang, L.Z. The Deposit Formation Mechanism in Coal-Fired Rotary Kiln for Iron Ore Pellet Production: A Review. Crystals 2021, 11, 974. [Google Scholar] [CrossRef]
- Stempkowska, A. Silicate Mineral Eutectics with Special Reference to Lithium. Materials 2021, 14, 4334. [Google Scholar] [CrossRef]
- Lu, J.S.; Li, Y.D.; Zou, C.M.; Liu, Z.Y.; Wang, C.L. Effect of sintering additives on the densification, crystallization and flexural strength of sintered glass-ceramics from waste granite powder. Mater. Chem. Phys. 2018, 216, 1–7. [Google Scholar] [CrossRef]


| SiO2 | Al2O3 | Fe2O3 | MgO | CaO | Na2O | K2O | MnO | P2O5 | TiO2 | Loss | |
|---|---|---|---|---|---|---|---|---|---|---|---|
| SS | 14.53 | 3.40 | 20.49 | 5.41 | 34.92 | 0.21 | 0.07 | 6.00 | 1.98 | 1.39 | 1.3 |
| WCB | 47.03 | 12.97 | 5.72 | 2.32 | 8.78 | 1.61 | 2.27 | 0.13 | 0.19 | 0.72 | 2.1 |
| Talc | 64.07 | 0.55 | 0.08 | 31.7 | 0.32 | - | - | - | - | - | 4.8 |
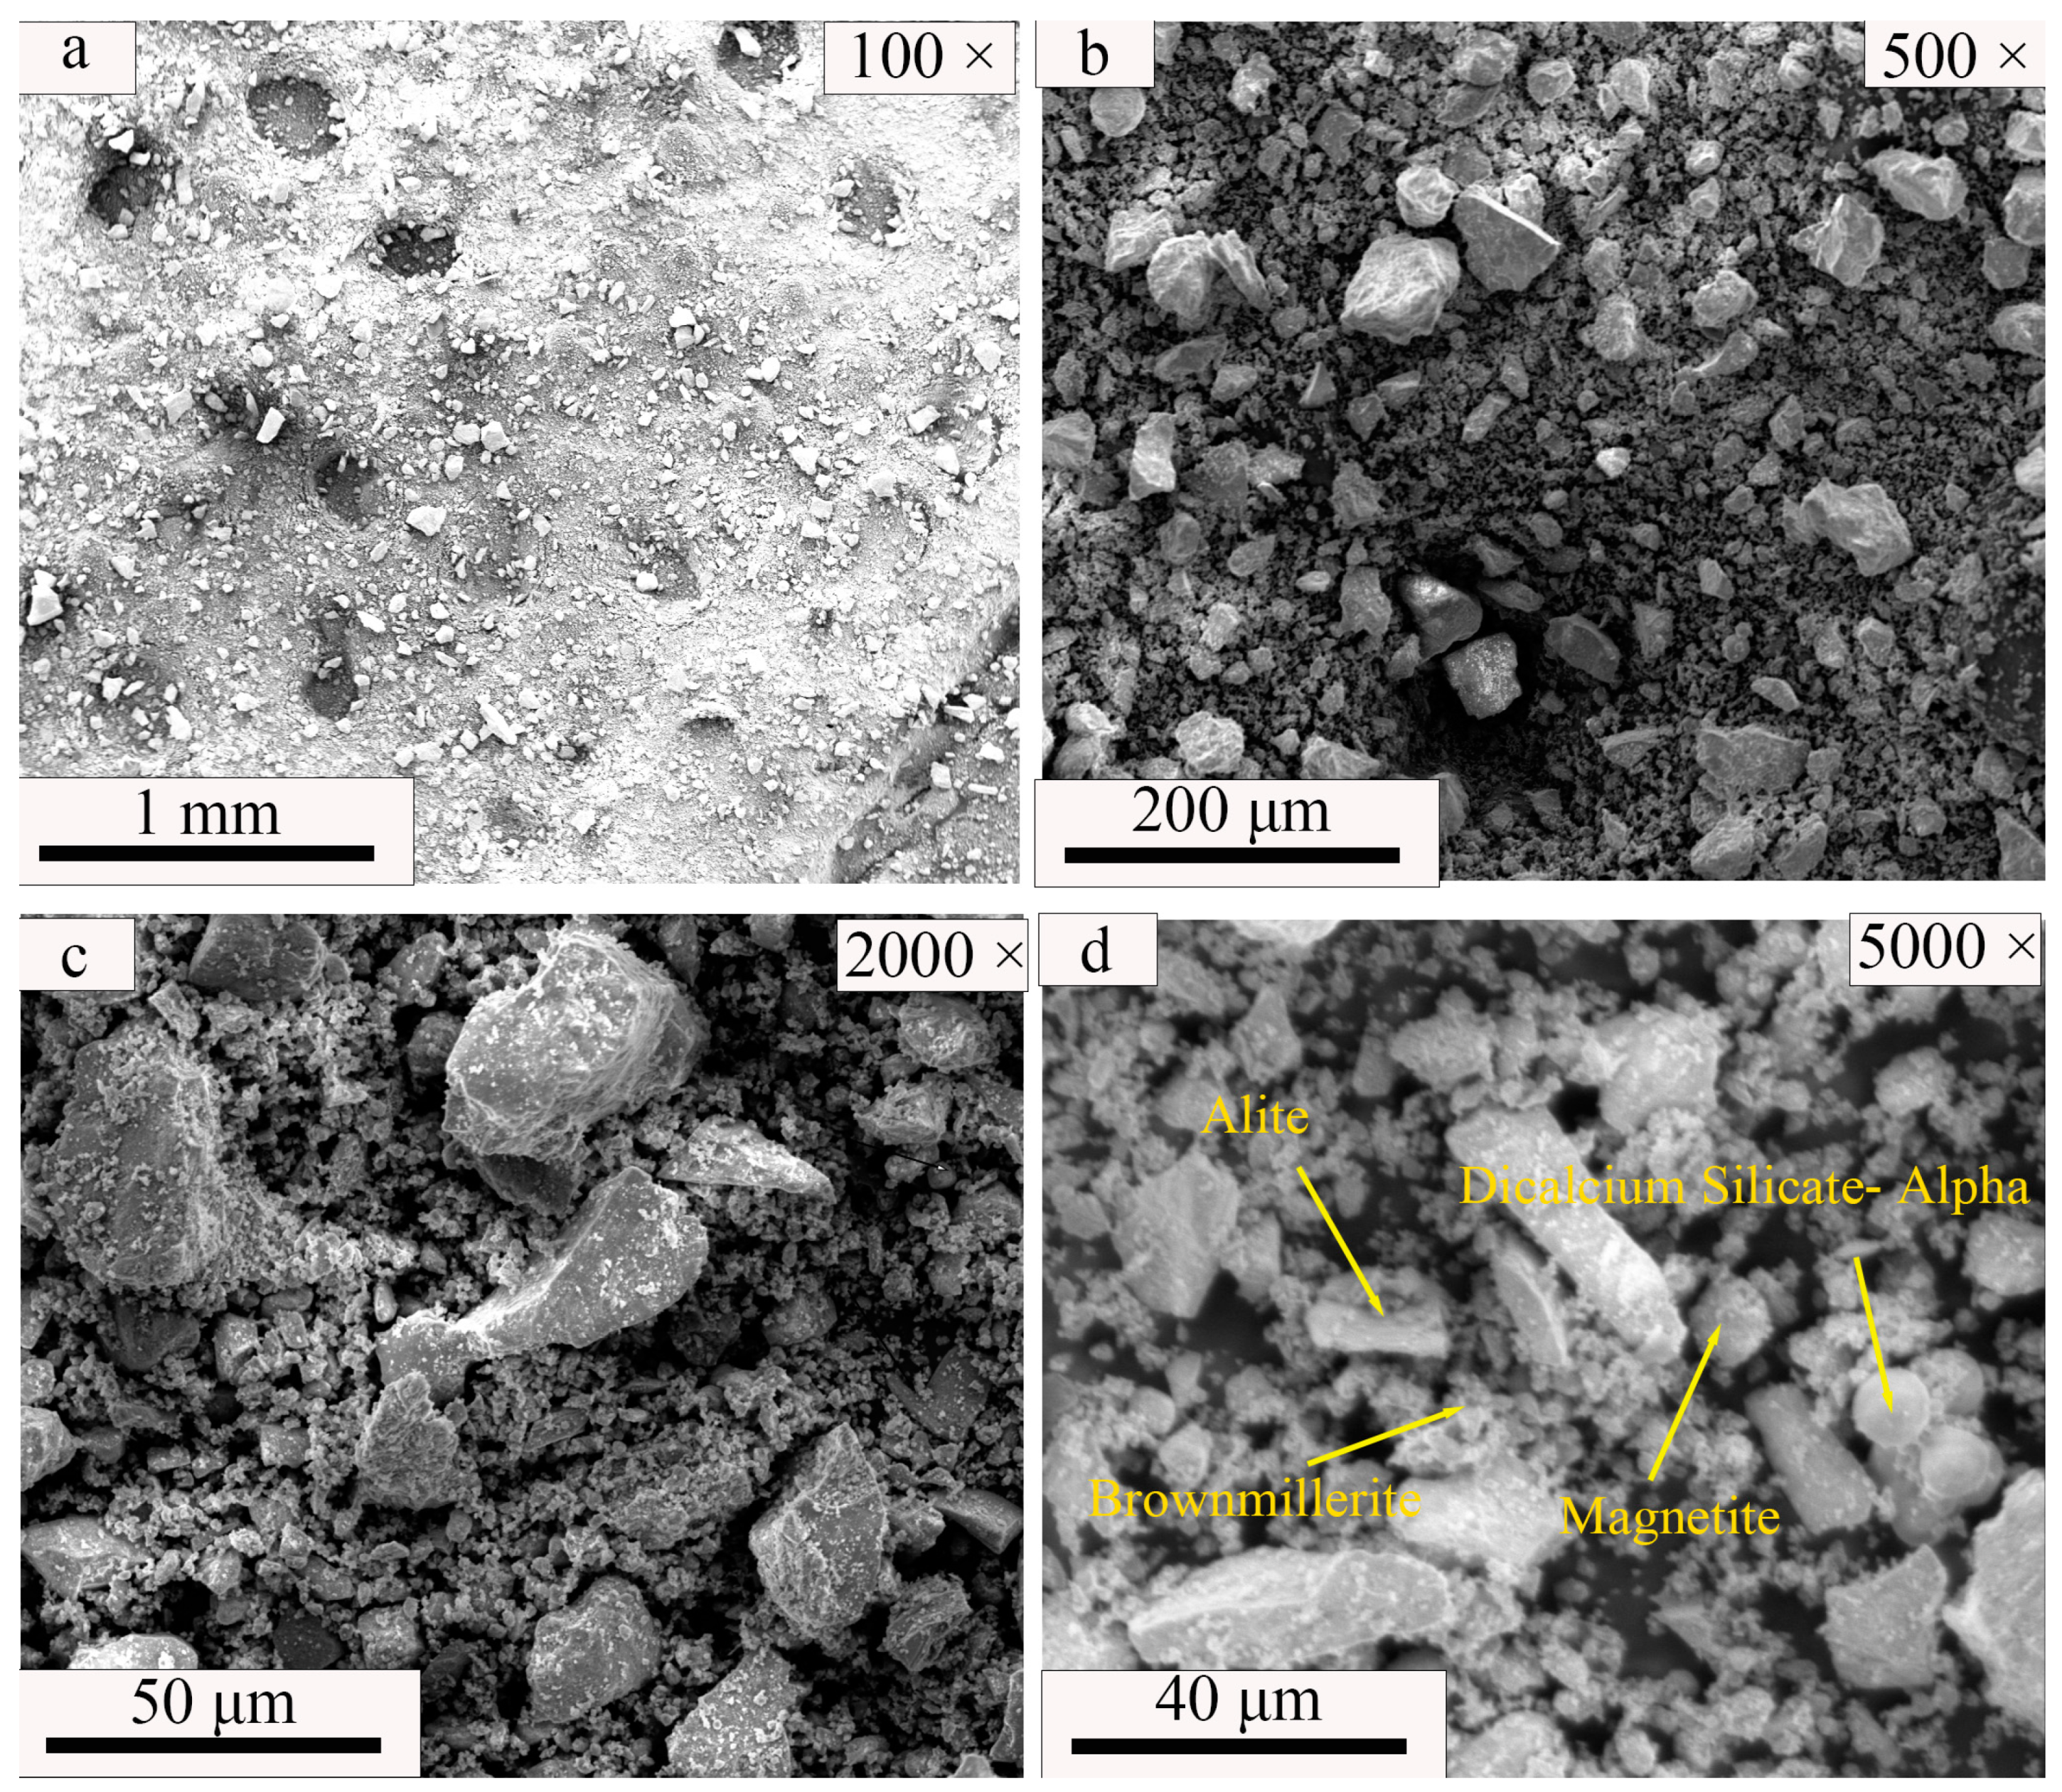
| Magnetite (Fe3O4) | Alite (3CaO·SiO2) | Dicalcium Silicate–Alpha (2CaO·SiO2) | Brownmillerite (4CaO·Al2O3·Fe2O3) | Quartz (SiO2) | Andesine ((Na,Ca) [(Si,Al)4O8]) | Talc (Mg3 [Si4O10](OH)2) | |
|---|---|---|---|---|---|---|---|
| SS | 7.8 | 17.2 | 46.1 | 17.2 | - | - | - |
| WCB | - | - | - | - | 66.9 | 33.1 | - |
| Talc | - | - | - | - | - | - | 100 |
| SS | WCB | Talc | ||||
|---|---|---|---|---|---|---|
| YG-1 | 30 g | 33% | 35 g | 39% | 25 g | 28% |
| YG-2 | 35 g | 37% | 35 g | 37% | 25 g | 26% |
| YG-3 | 40 g | 40% | 35 g | 35% | 25 g | 25% |
| YG-4 | 45 g | 43% | 35 g | 33% | 25 g | 24% |
| YG-5 | 50 g | 45% | 35 g | 32% | 25 g | 23% |
| SS | WCB | Talc | ||||
|---|---|---|---|---|---|---|
| YZ-1 | 45 g | 45% | 30 g | 30% | 25 g | 25% |
| YZ-2 | 45 g | 43% | 35 g | 33% | 25 g | 24% |
| YZ-3 | 45 g | 41% | 40 g | 36% | 25 g | 23% |
| YZ-4 | 45 g | 39% | 45 g | 39% | 25 g | 22% |
| YZ-5 | 45 g | 37.5% | 50 g | 42% | 25 g | 20.5% |
| SS | WCB | Talc | ||||
|---|---|---|---|---|---|---|
| YH-1 | 45 g | 45% | 35 g | 35% | 20 g | 20% |
| YH-2 | 45 g | 43% | 35 g | 33% | 25 g | 24% |
| YH-3 | 45 g | 41% | 35 g | 32% | 30 g | 27% |
| YH-4 | 45 g | 39% | 35 g | 30% | 35 g | 31% |
| YH-5 | 45 g | 37.5% | 35 g | 29.1% | 40 g | 33.3% |
| SiO2 | Al2O3 | Fe2O3 | MgO | CaO | Na2O | K2O | MnO | P2O5 | TiO2 | |
|---|---|---|---|---|---|---|---|---|---|---|
| YG-1 | 41.72 | 6.34 | 9.02 | 11.88 | 15.04 | 0.70 | 0.91 | 2.03 | 0.73 | 0.74 |
| YG-2 | 39.44 | 6.20 | 9.72 | 11.10 | 16.25 | 0.67 | 0.87 | 2.27 | 0.80 | 0.78 |
| YG-3 | 38.29 | 6.04 | 10.22 | 10.90 | 17.12 | 0.65 | 0.82 | 2.45 | 0.86 | 0.81 |
| YG-4 | 37.14 | 5.87 | 10.72 | 10.70 | 17.99 | 0.62 | 0.78 | 2.62 | 0.91 | 0.84 |
| YG-5 | 36.96 | 5.81 | 11.07 | 10.78 | 18.60 | 0.61 | 0.76 | 2.74 | 0.95 | 0.86 |
| SiO2 | Al2O3 | Fe2O3 | MgO | CaO | Na2O | K2O | MnO | P2O5 | TiO2 | |
|---|---|---|---|---|---|---|---|---|---|---|
| YZ-1 | 36.67 | 5.56 | 10.96 | 11.06 | 18.43 | 0.58 | 0.71 | 2.74 | 0.95 | 0.84 |
| YZ-2 | 37.14 | 5.87 | 10.72 | 10.70 | 17.99 | 0.62 | 0.78 | 2.62 | 0.91 | 0.84 |
| YZ-3 | 37.62 | 6.19 | 10.48 | 10.34 | 17.55 | 0.67 | 0.85 | 2.51 | 0.88 | 0.83 |
| YZ-4 | 38.10 | 6.51 | 10.24 | 9.99 | 17.11 | 0.71 | 0.91 | 2.39 | 0.85 | 0.82 |
| YZ-5 | 38.34 | 6.84 | 10.10 | 9.50 | 16.85 | 0.75 | 0.98 | 2.30 | 0.82 | 0.82 |
| SiO2 | Al2O3 | Fe2O3 | MgO | CaO | Na2O | K2O | MnO | P2O5 | TiO2 | |
|---|---|---|---|---|---|---|---|---|---|---|
| YH-1 | 35.81 | 6.18 | 11.24 | 9.59 | 18.85 | 0.66 | 0.83 | 2.75 | 0.96 | 0.88 |
| YH-2 | 37.14 | 5.87 | 10.72 | 10.70 | 17.99 | 0.62 | 0.78 | 2.62 | 0.91 | 0.84 |
| YH-3 | 38.31 | 5.69 | 10.25 | 11.52 | 17.21 | 0.60 | 0.76 | 2.50 | 0.87 | 0.80 |
| YH-4 | 39.64 | 5.39 | 9.73 | 12.63 | 16.35 | 0.56 | 0.71 | 2.38 | 0.83 | 0.76 |
| YH-5 | 40.38 | 5.34 | 9.43 | 13.03 | 15.83 | 0.56 | 0.71 | 2.29 | 0.80 | 0.74 |
| Akermanite (I/Counts) | Diopside (I/Counts) | Magnetite (I/Counts) | |
|---|---|---|---|
| YG-1 | 2008 | 1363.33 | 256.667 |
| YG-2 | 2658.33 | 1318.33 | 336.667 |
| YG-3 | 2761.71 | 900 | 382.33 |
| YG-4 | 3204.17 | 783.33 | 401.22 |
| YG-5 | 3508.33 | 401.22 | 446.67 |
| Akermanite (I/Counts) | Diopside (I/Counts) | Magnetite (I/Counts) | |
|---|---|---|---|
| YZ-1 | 3111.67 | 283.33 | 458.33 |
| YZ-2 | 3204.17 | 783.33 | 401.22 |
| YZ-3 | 2512.33 | 1148.33 | 328.33 |
| YZ-4 | 2250 | 1908.33 | 293.33 |
| YZ-5 | 1496.67 | 2161.67 | 180 |
| Akermanite (I/Counts) | Diopside (I/Counts) | Magnetite (I/Counts) | |
|---|---|---|---|
| YH-1 | 2728.33 | 973.33 | 361.66 |
| YH-2 | 3204.17 | 783.33 | 401.22 |
| YH-3 | 3426.67 | 908.33 | 456.66 |
| YH-4 | 3491.67 | 166.67 | 156.667 |
| YH-5 | 3521.43 | 156.667 | 446.67 |
| Akermanite (%) (Ca2MgSi2O7) | Diopside (%) (CaMgSi2O6) | Magnetite (%) (Fe3O4) | |
|---|---|---|---|
| YG-1 | 40.3 | 53.1 | 6.6 |
| YG-2 | 56.5 | 35.3 | 8.3 |
| YG-3 | 57.5 | 33.6 | 8.9 |
| YG-4 | 67.4 | 21.3 | 11.3 |
| YG-5 | 75.7 | 11.7 | 12.5 |
| YZ-1 | 80 | 8.2 | 11.9 |
| YZ-2 | 67.5 | 21.3 | 11.3 |
| YZ-3 | 59.2 | 32 | 8.8 |
| YZ-4 | 47.2 | 51.8 | 1.0 |
| YH-1 | 64.5 | 25.3 | 10.2 |
| YH-2 | 67.5 | 21.3 | 11.3 |
| YH-3 | 77.1 | 12.1 | 10.8 |
| YH-4 | 86.3 | - | 13.7 |
| Materials | Porcelain Clay | Porcelain Stone | Quartz | Talc | SS | WCB |
|---|---|---|---|---|---|---|
| Price (CNY/ton) | 1000 | 1500 | 450 | 950 | 0 | 0 |
| Porcelain Clay (%) | Porcelain Stone (%) | Quartz (%) | SS (%) | WCB (%) | Talc (%) | |
|---|---|---|---|---|---|---|
| Traditional ceramic tile | 70 | 20 | 10 | - | - | - |
| Ceramic tiles in this experiment | - | - | - | 41 | 36 | 23 |
Disclaimer/Publisher’s Note: The statements, opinions and data contained in all publications are solely those of the individual author(s) and contributor(s) and not of MDPI and/or the editor(s). MDPI and/or the editor(s) disclaim responsibility for any injury to people or property resulting from any ideas, methods, instructions or products referred to in the content. |
© 2024 by the authors. Licensee MDPI, Basel, Switzerland. This article is an open access article distributed under the terms and conditions of the Creative Commons Attribution (CC BY) license (https://creativecommons.org/licenses/by/4.0/).
Share and Cite
Ji, Y.; Li, E.; Zhu, G.; Wang, R.; Sha, Q. Influence of Solid Waste Material Content on the Properties of Steel Slag-Waste Clay Brick Ceramic Bricks. Coatings 2024, 14, 434. https://doi.org/10.3390/coatings14040434
Ji Y, Li E, Zhu G, Wang R, Sha Q. Influence of Solid Waste Material Content on the Properties of Steel Slag-Waste Clay Brick Ceramic Bricks. Coatings. 2024; 14(4):434. https://doi.org/10.3390/coatings14040434
Chicago/Turabian StyleJi, Ying, Enyao Li, Gang Zhu, Ruiqi Wang, and Qianqian Sha. 2024. "Influence of Solid Waste Material Content on the Properties of Steel Slag-Waste Clay Brick Ceramic Bricks" Coatings 14, no. 4: 434. https://doi.org/10.3390/coatings14040434