Article

The Growth Behavior and Mechanisms of Pitting Corrosion on Super 13Cr Martensitic Stainless Steel Surfaces at Different Diameter-to-Depth Ratios

1
Xi’an Key Laboratory of High Performance Oil and Gas Field Materials, School of Materials Science and Engineering, Xi’an Shiyou University, Xi’an 710065, China
2
CNPC Tubular Goods Research Institute, State Key Laboratory for Performance and Structure Safety of Petroleum Tubular Goods and Equipment Materials, Xi’an 710077, China
*
Author to whom correspondence should be addressed.
Coatings 2024, 14(4), 435; https://doi.org/10.3390/coatings14040435
Submission received: 5 March 2024 / Revised: 2 April 2024 / Accepted: 5 April 2024 / Published: 7 April 2024
(This article belongs to the Special Issue Recent Progress in Thin Films and Coatings of Metallic Compounds)

Abstract

:
This study employs finite element analysis and simulated environmental immersion experiments to methodically investigate the growth behavior of pitting corrosion in stainless steel. It particularly examines how the diameter-to-depth ratio of the pit influences its growth dynamics. The findings underscore substantial variations in growth patterns and corrosion rates corresponding to different diameter-to-depth ratios. Key parameters, including electrolyte current density, potential, Fe2+ and Cl ion concentrations, and pH values, play a crucial role in the corrosion mechanism. Remarkably, a pronounced increase in the corrosion rate at the pit bottom was observed with the increase in the diameter-to-depth ratio to 1:5. The results of this work provide insight into stainless steel pitting mechanisms, enabling the development of more effective prevention strategies.

1. Introduction

Super 13Cr martensitic stainless steel (S13Cr MSS), due to its excellent physical and corrosion resistance properties, has replaced carbon steel as the primary material in oil pipelines [1,2,3,4]. However, pitting and stress corrosion cracking can lead to premature failure of stainless steel [5,6,7].
In recent years, extensive research has been conducted on the pitting resistance of S13Cr MSS. The presence of surface defects means that the corrosion-resistant passive film cannot fully cover the surface of the material, leading to corrosion resistance heterogeneity and severe pitting [8]. An increase in service temperature has been shown to inhibit the density of the Cr-rich layer [9,10], inducing an increase in pitting sensitivity [11]. When the service temperature is too low, the composition of the S13Cr MSS passive film is affected, enhancing pitting sensitivity [12,13]. Under the influence of external forces, the passive film of S13Cr MSS degrades, causing a negative shift in pitting potential and high sensitivity to pitting corrosion [6,14]. Meanwhile, the external stress also increases the adsorption and penetration speed of Cl ions, promoting the diffusion of point defects in the passive film and thereby leading to rapid decomposition of the film [12]. As for S13Cr MSS itself, the Mo-rich intermetallic compounds can reduce the corrosion resistance of S13Cr MSS [15], while the reverse austenite can ensure the lower corrosion current density and the better metastable pitting resistance of the steel [16,17,18,19].
The numerical modeling of pitting growth behavior has long been considered a highly complex task [20]. The problem of localized corrosion involves complex electrolyte–metal interface interactions, where the irregular shape of the interface and its changes are influenced by both the local mechanical and chemical factors, which in turn depend on the specific morphology of the interface [21]. Recently, new mathematical models describing mass transfer, homogeneous chemical reactions, and charge balance have been proposed to better understand the diffusion and transport properties, as well as their impact on corrosion evolution in multiple substances [22,23,24]. Stahle [25] and Abubakar [26] were among the first to apply the phase field models in corrosion problems. In addition, Mai et al. [27,28] proposed a phase field corrosion model that explained the diffusion behavior of solutes and reactants in the electrolyte. Ansari et al. [29] considered the ion transport in the electrolyte and the electrochemical reactions at the electrolyte/metal interface, employing a phase field model for quantitatively predicting the kinetics of pitting corrosion. The results indicate that mutual coupling between pits increases the corrosion rate, making it easier to form larger pits. Moreover, compared to compressive stress, tensile stress is conducive to a higher corrosion rate. Further, the corrosion rate of {111} crystal planes is only one-third of those of {110} and {100} crystal planes. Finally, without considering the influence of stress concentration, insoluble inclusions hinder the growth direction of pits. Mai et al. [28] considered the role of mechanics in the corrosion process, focusing on the enhancement of the corrosion rate by the mechanical field [30] as well as on the formation, rupture, and subsequent repassivation of the passive film [31]. Therefore, existing models mainly describe the interface issues of localized corrosion, whereas the relationship between the late growth and the initial morphology of pits is still not clear. Since the growth behavior and morphology of pits are of great importance for stress corrosion cracking, it is necessary to clarify the impact of the initial morphology of pits on the evolution of pitting corrosion.
This work aims to elucidate the morphological and corrosion evolution patterns of pits with different initial diameter-to-depth ratios during service through experiments and finite element calculations. Special attention is paid to the effects of electrolyte current density, electrolyte potential, Fe and Cl ion concentrations, pH, and corrosion rate changes over time on the pitting corrosion.

2. Materials and Methods

2.1. Experimental Testing

Commercial S13Cr MSS, manufactured by Baosteel (see the chemical composition in Table 1), was used in the study. The material was cut into strips measuring 40 mm × 10 mm × 3 mm. Samples were sequentially polished with 500–2000 grit silicon carbide sandpapers, then cleaned with deionized water and degreased in acetone.
The simulated environmental immersion solution replicated the oilfield conditions and was categorized into live acid, spent acid, condensate water, and formation water. The specific components and immersion durations are detailed in Table 2. After immersion, samples were derusted using a hydrochloric acid–hexamethylenetetramine solution and rinsed with clean water. The morphological features of samples after immersion were characterized using a TESCAN CLARA scanning electron microscope, equipped with an Xplore energy-dispersive X-ray spectrometer (EDS). In order to determine the composition of corrosion products, X-ray photoelectron spectroscopy (XPS, K-Alpha) was introduced to profile the characteristic peaks.

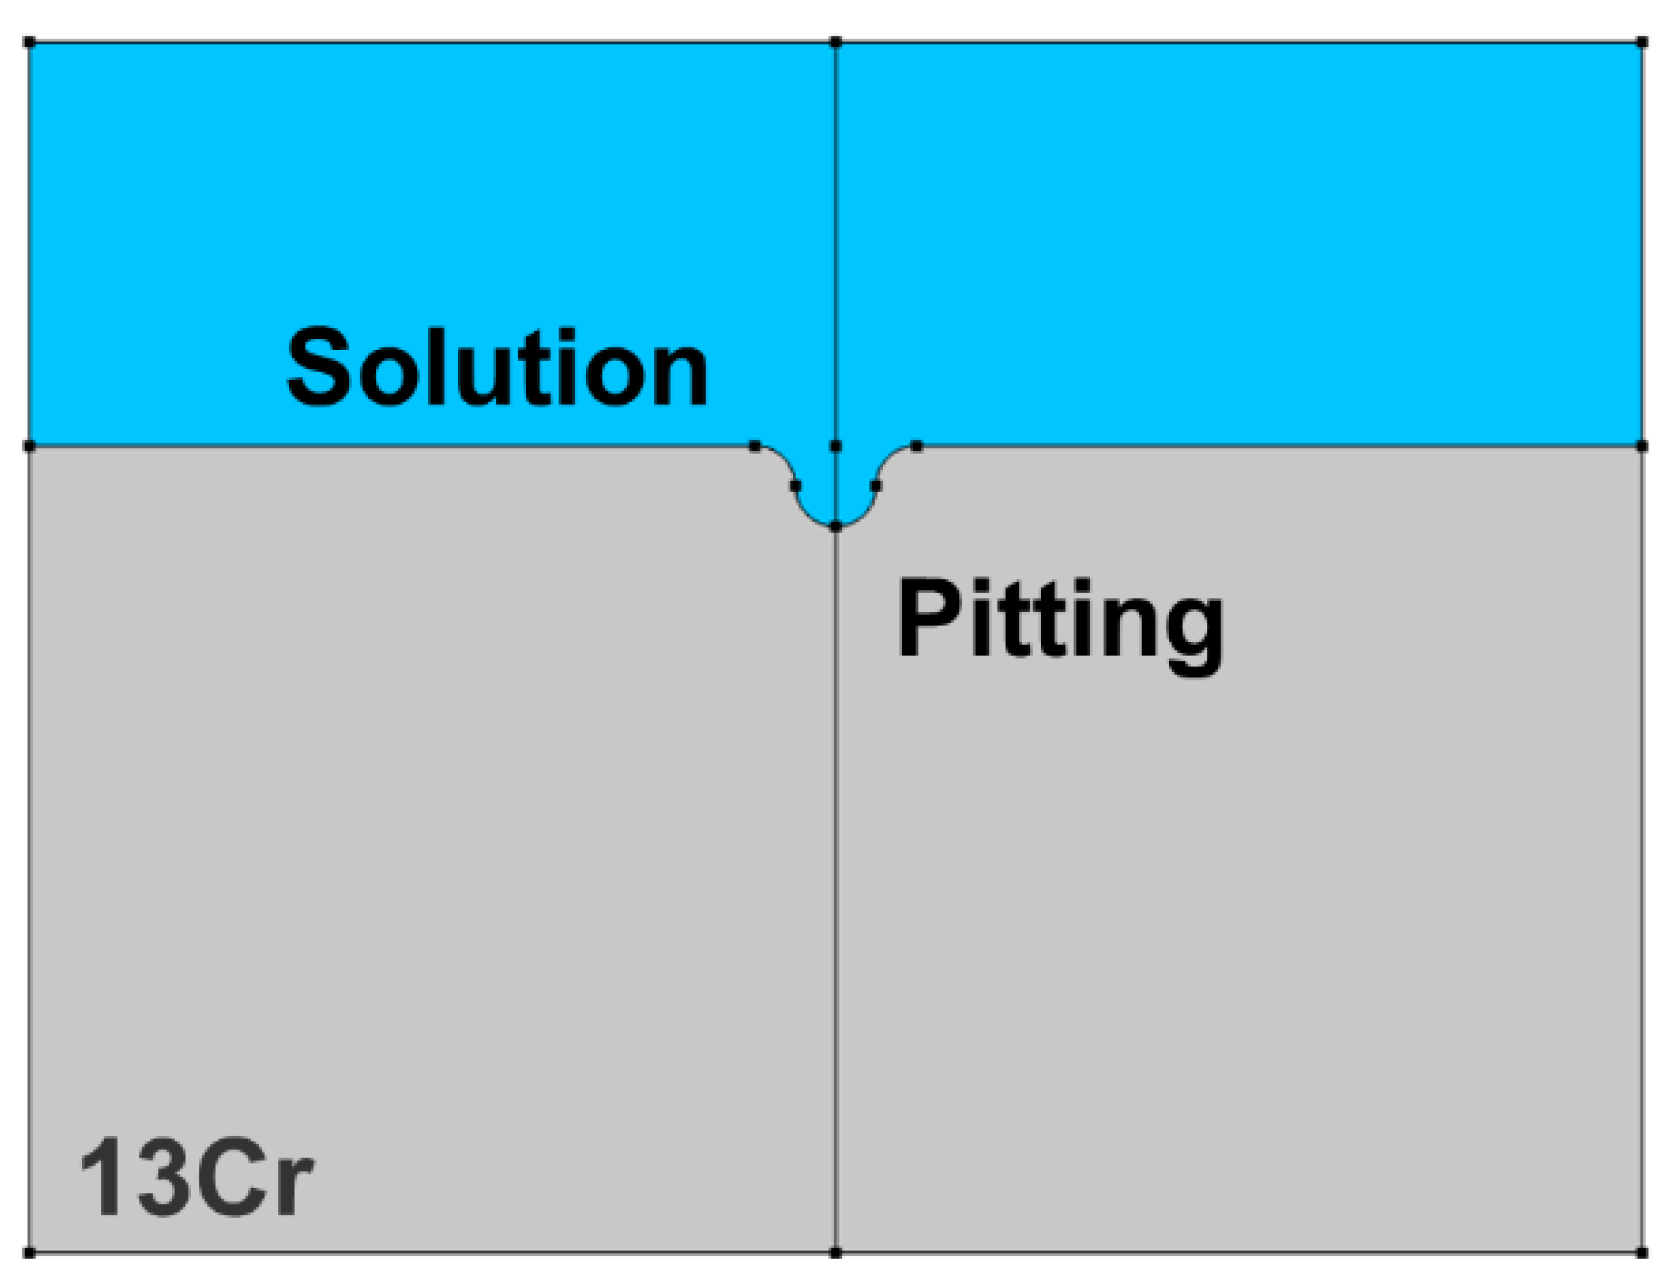
2.2. The Finite Element Model

The occurrence of metal corrosion is determined by electrochemical peculiarities, mainly the current density, of the material [29]. Pitting corrosion—a severe localized corrosion phenomenon on the metal surface—is largely controlled by the current density vector in the electrolyte [32]. Therefore, the current density vector in the electrolyte was calculated to characterize the growth trend of pitting corrosion of S13Cr MSS using COMSOL Multiphysics medium.
The model employed in the simulation had the dimensions of 40 μm × 30 μm and featured pits with diameters of 1 μm and depths of 1, 3, and 5 μm, resulting in diameter-to-depth ratios of 1:1, 1:3, and 1:5, respectively. A triangular mesh with maximum and minimum sizes of 1 μm and 2 × 10⁻⁴ μm was introduced. The tertiary current distribution and Nernst–Planck interface were embedded in the model for calculating the pit growth, opting for a transient solver for the solution. An example illustrated in Figure 1 with a diameter-to-depth ratio of 1:1 designates the solution/steel interface as a free boundary, whereas the remaining solution boundaries are treated as electrically insulating.
The electrochemical dissolution of pitting involves the oxidation of steel and the reduction of oxygen. The reduction of oxygen primarily occurs on the metal surface external to the pitting site, while iron is oxidized within the pit to balance the oxygen reduction reaction as follows:
Anodic   reaction :   Fe ( s ) Fe 2 + + 2 e
Cathodic   reaction :   4 H + + 4 e + O 2 2 H 2 O
In the vicinity of the electrode surface within the electrolyte, the dissolved iron forms the iron hydroxide conforming to the equation below:
Fe 2 + + 2 OH Fe ( OH ) 2 ( s )
Furthermore, it is assumed that the anodic reaction in the steel is the dissolution of iron, with alloy elements dissolving alongside iron. The corrosion of steel is activation-controlled. The electrode kinetics of the anodic and cathodic reactions are described by a simplified Tafel expression of the Butler–Volmer equation as follows [33]:
i a = i 0 , a exp ( η a b a )
i c = i 0 , c exp ( η c b c )
η = φ φ e q
where the subscripts a and c, respectively, denote the anodic and cathodic reactions, i represents the charge transfer current density, i 0 is the exchange current density, φ is the electrode potential, φ e q is the equilibrium electrode potential, η is the overpotential of activation, and b is the Tafel slope.
The corrosion process is based on the Nernst–Planck equation, which assumes that electroneutrality is maintained and that water autolytic reactions are in equilibrium. The equation is capable of modelling the transport of substances by all three modes of transport: diffusion, electromigration, and convection, thus accurately describing the effects of component changes during pitting corrosion. This makes the model well suited to study and simulate the complex electrochemical and physical phenomena that occur during pitting.
J i = D i c i z i μ m , i F c i Φ l + c i u
where F is Faraday’s constant (C/mol), J i represents the flux of the substance (mol/(m2·s)), the charge of the substance is z i , c i represents the concentration of ions (mol/m3), D i is the diffusion coefficient (m2/s), μ m , i is the ion mobility (s·mol/kg), Φ l is the potential of the electrolyte, and u and is the velocity vector (m/s).
This physical field interface also uses the water-based electroneutrality equation in the set of equations describing the conservation of matter and current as follows:
i z i c i + c H c OH = 0
where c H is the concentration of H+, and c O H is the concentration of OH ions. This also means that all charged substances in the electrolyte need to be defined in the simulation as well as accounting for the self-ionisation equilibrium of water.
The current–voltage relationship in this simulated electrochemical process also follows Ohm’s law:
i s = σ s Φ s
· i s = Q s
where i s denotes the current density vector of the electrode (A/m2), σ s denotes the conductivity (S/m), Φ s denotes the potential in the metal conductor, and Q s denotes the general current source term (A/m3).
Since the electrolyte is an ionic conductor, its net current density can be described by the sum of the fluxes of all the ions:
i l = F i z i J i + F J H F J O H
where i l denotes the current density vector of the electrolyte (A/m2) and J i represents the flux of the substance (mol/(m2·s)).
In addition, the kinetic behaviour was also calculated based on the Butler–Volmer expression through the equation:
i l o c , m = i 0 ( ( exp [ α a F η R T ] exp [ α c F η R T ] )
where i l o c , m indicates the current density of the electrode (A/m2), i 0 indicates the exchange current density (A/m2), η indicates the electrode potential, T indicates the thermodynamic temperature, R indicates the gas constant, α c indicates the charge transfer coefficient in the positive (cathode) direction, α a indicates the charge transfer coefficient in the negative (anode) direction, and η indicates the activation overpotential.
The setting of the electrode–electrolyte interface in the physical field of the cubic current distribution should also take into account the equilibrium potentials:
E e q = E 0 + R T n F ln α o α r
where, E e q denotes the equilibrium potential of the metal in V, E 0 denotes the standard electrode potential of the metal in V, n denotes the number of electrons gained and lost in the electrode reaction (valence number of the metal ion), α o denotes the activity of the oxidised metal ion in solution, and α r denotes the activity of the reduced metal ion in solution. We used these calculations to obtain the required physical quantities.

3. Results

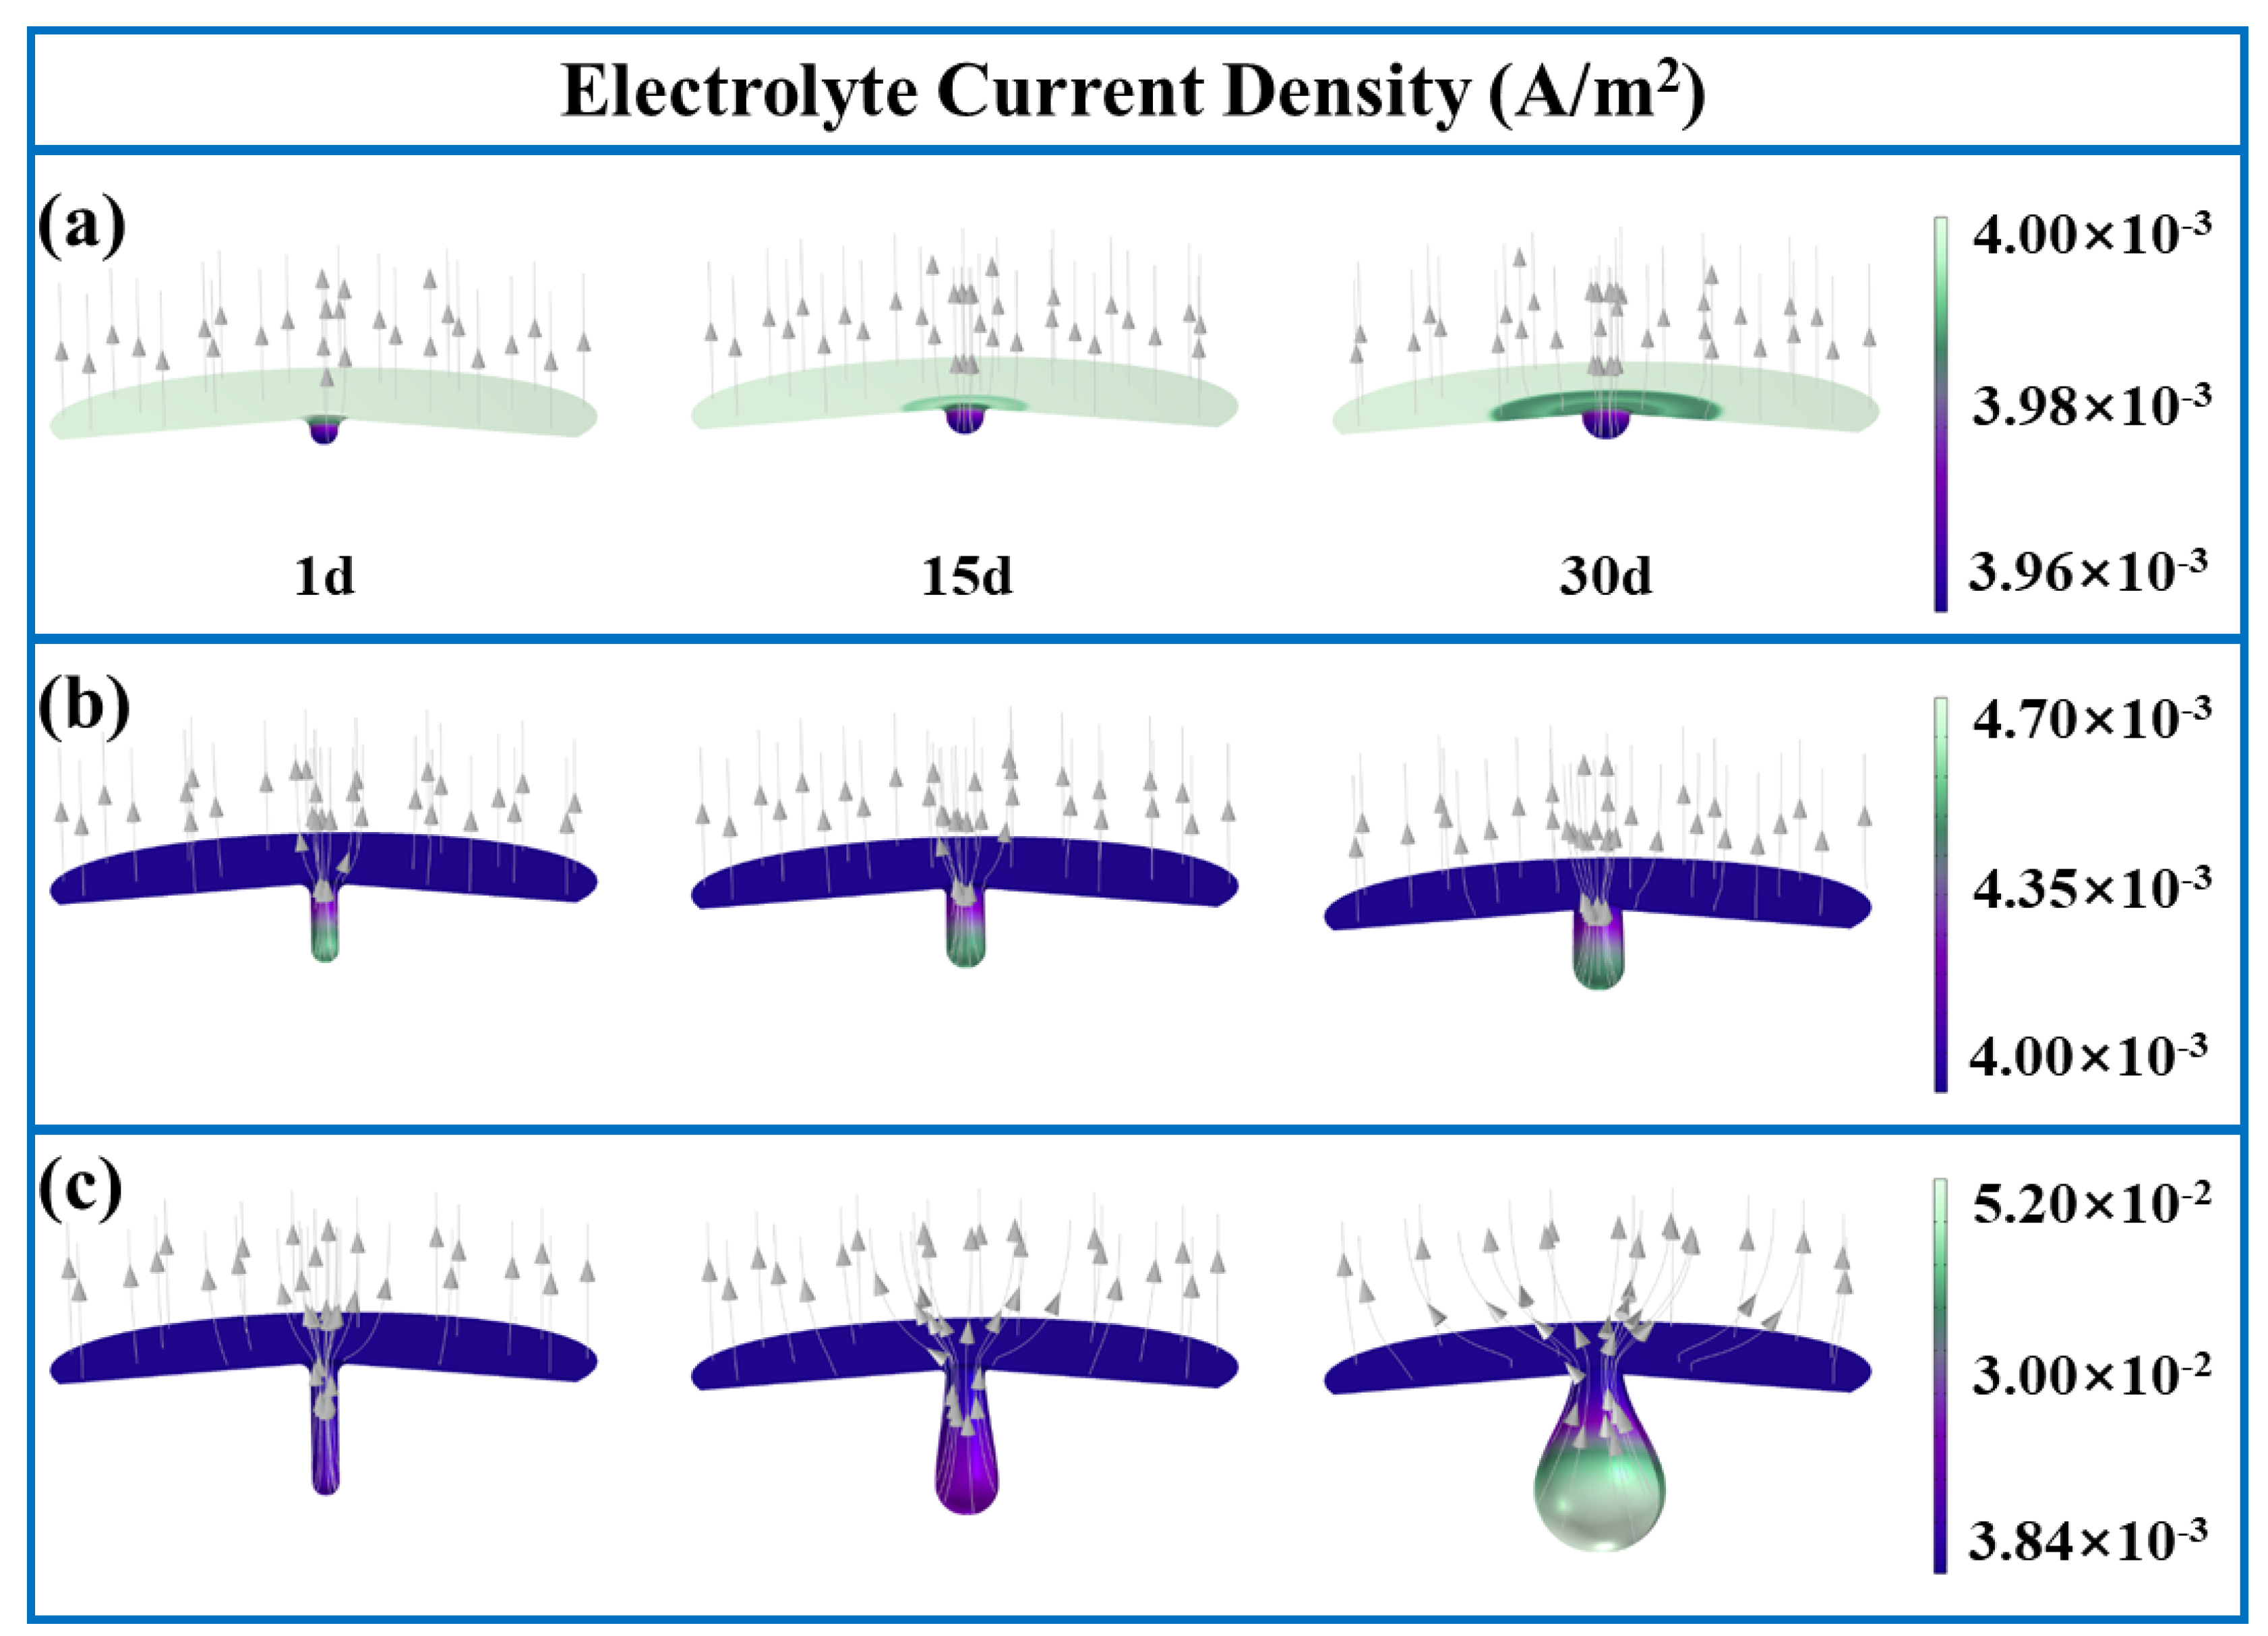
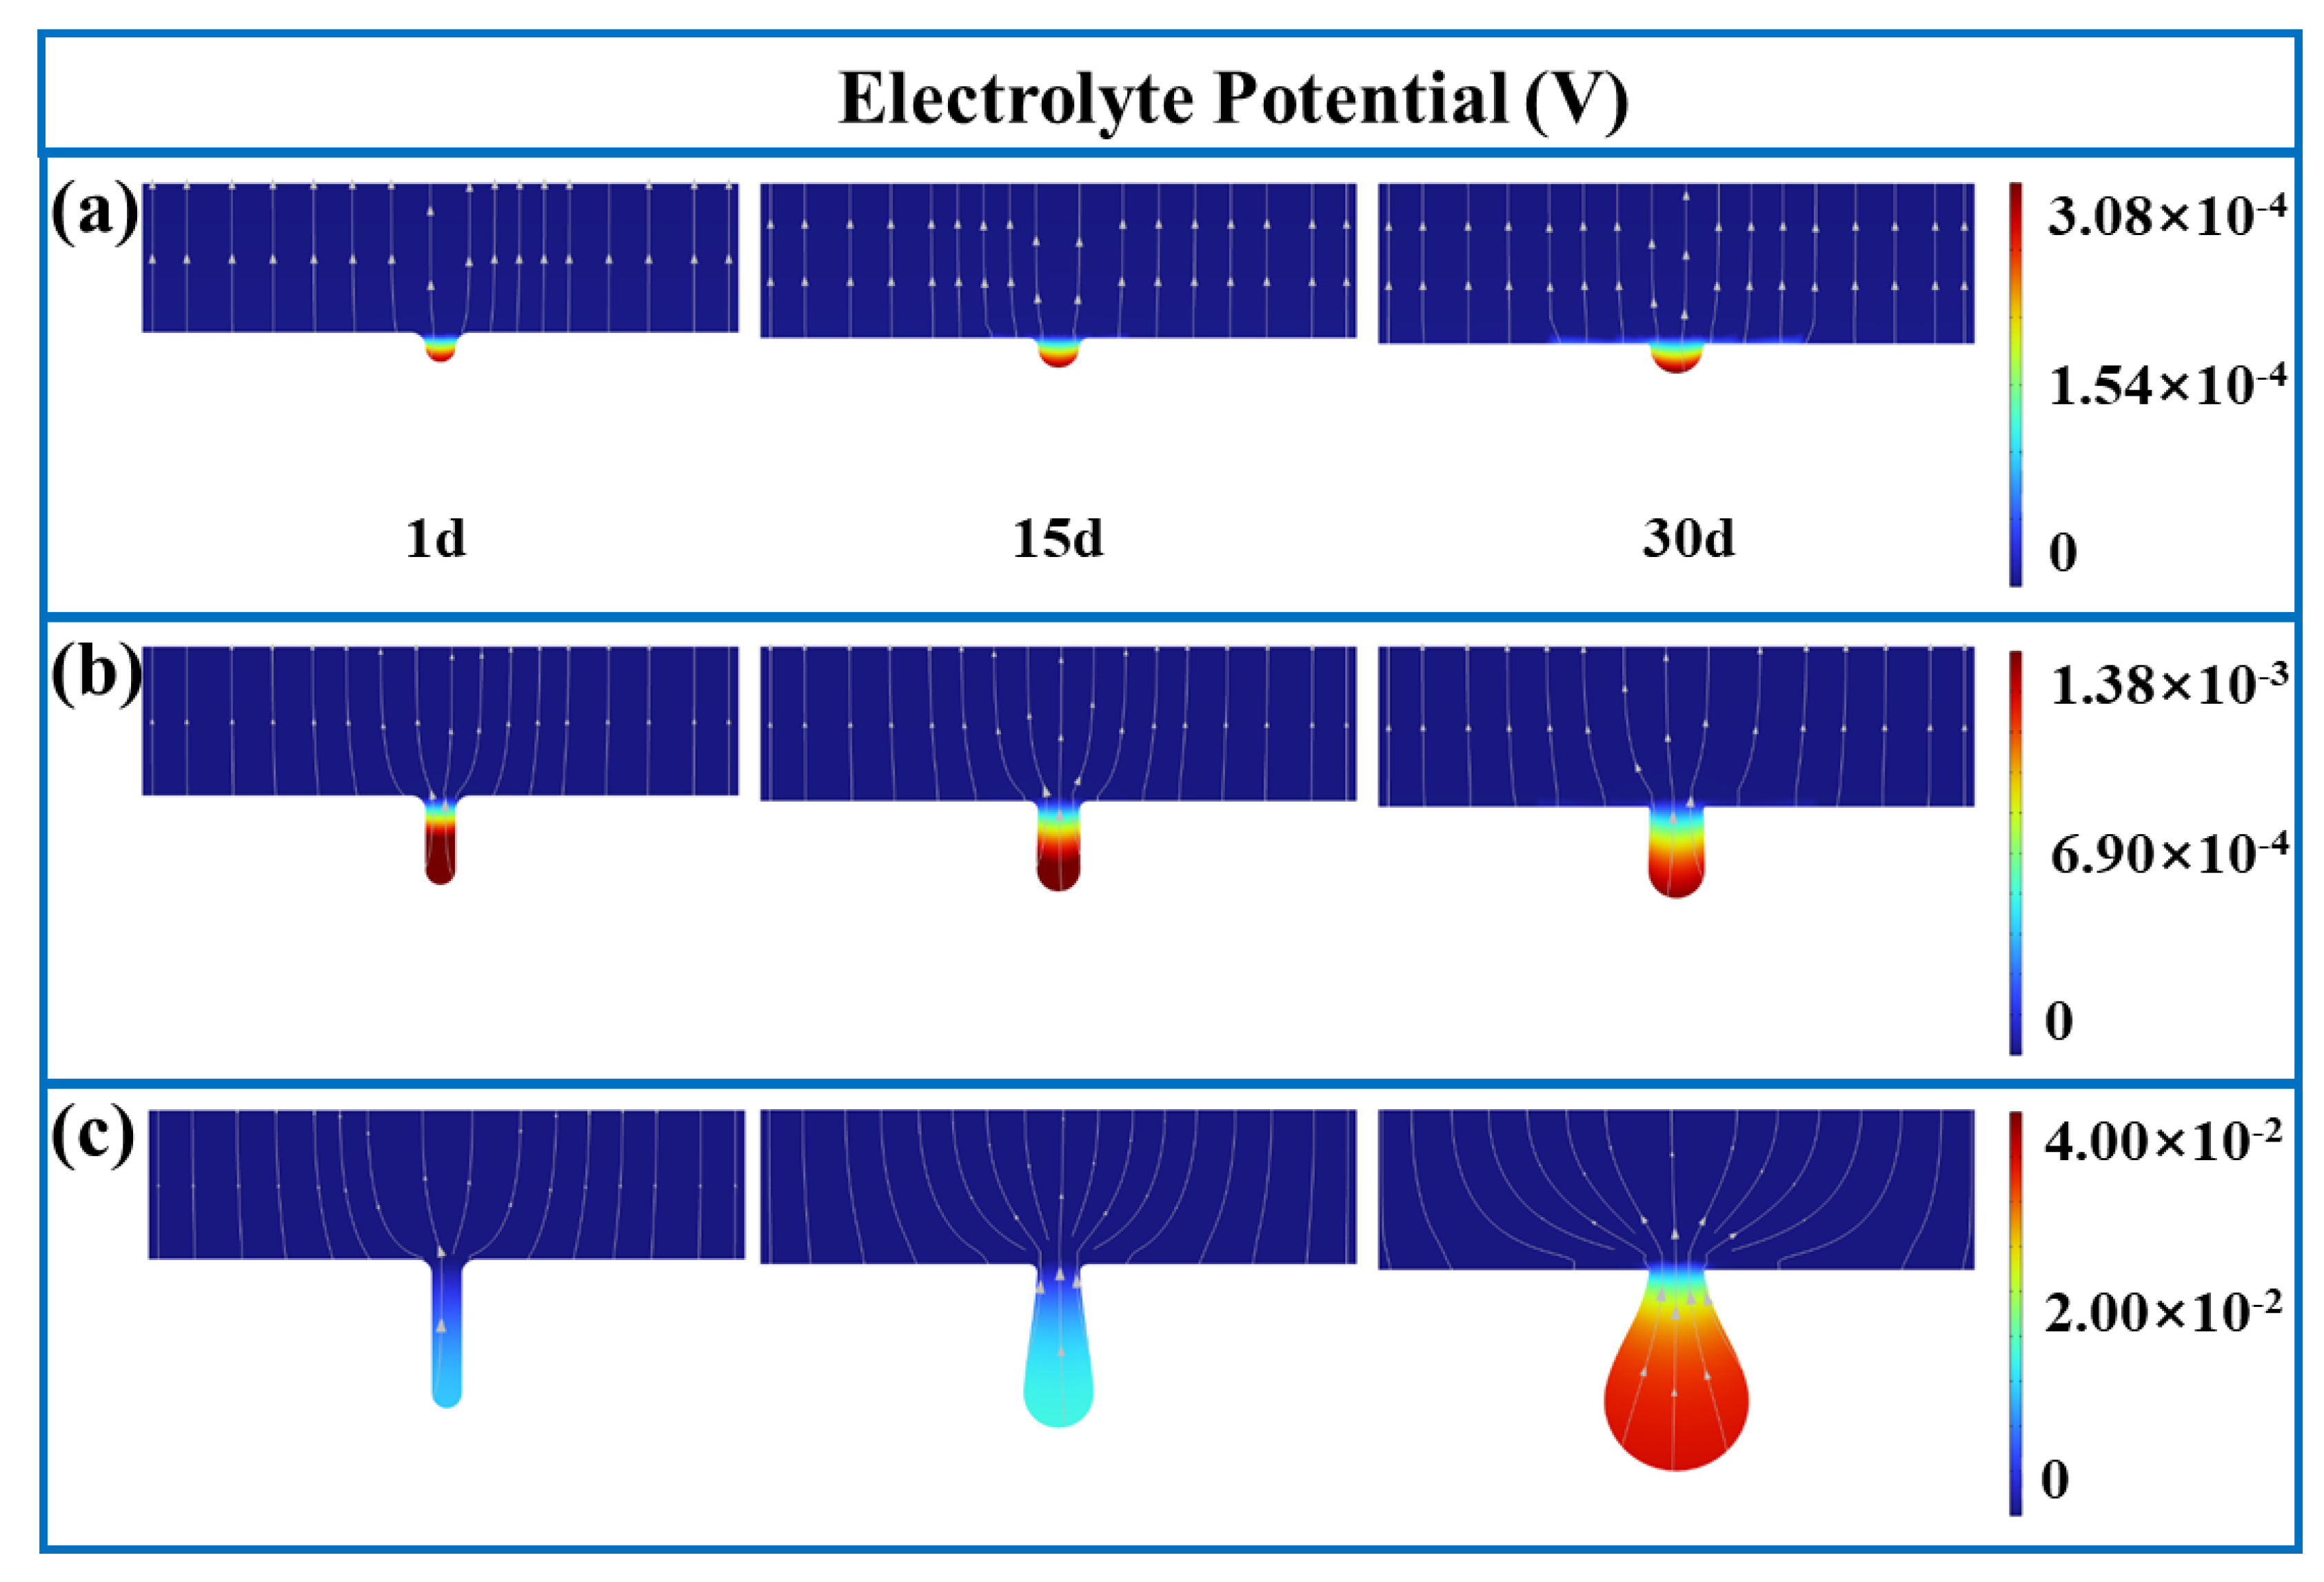
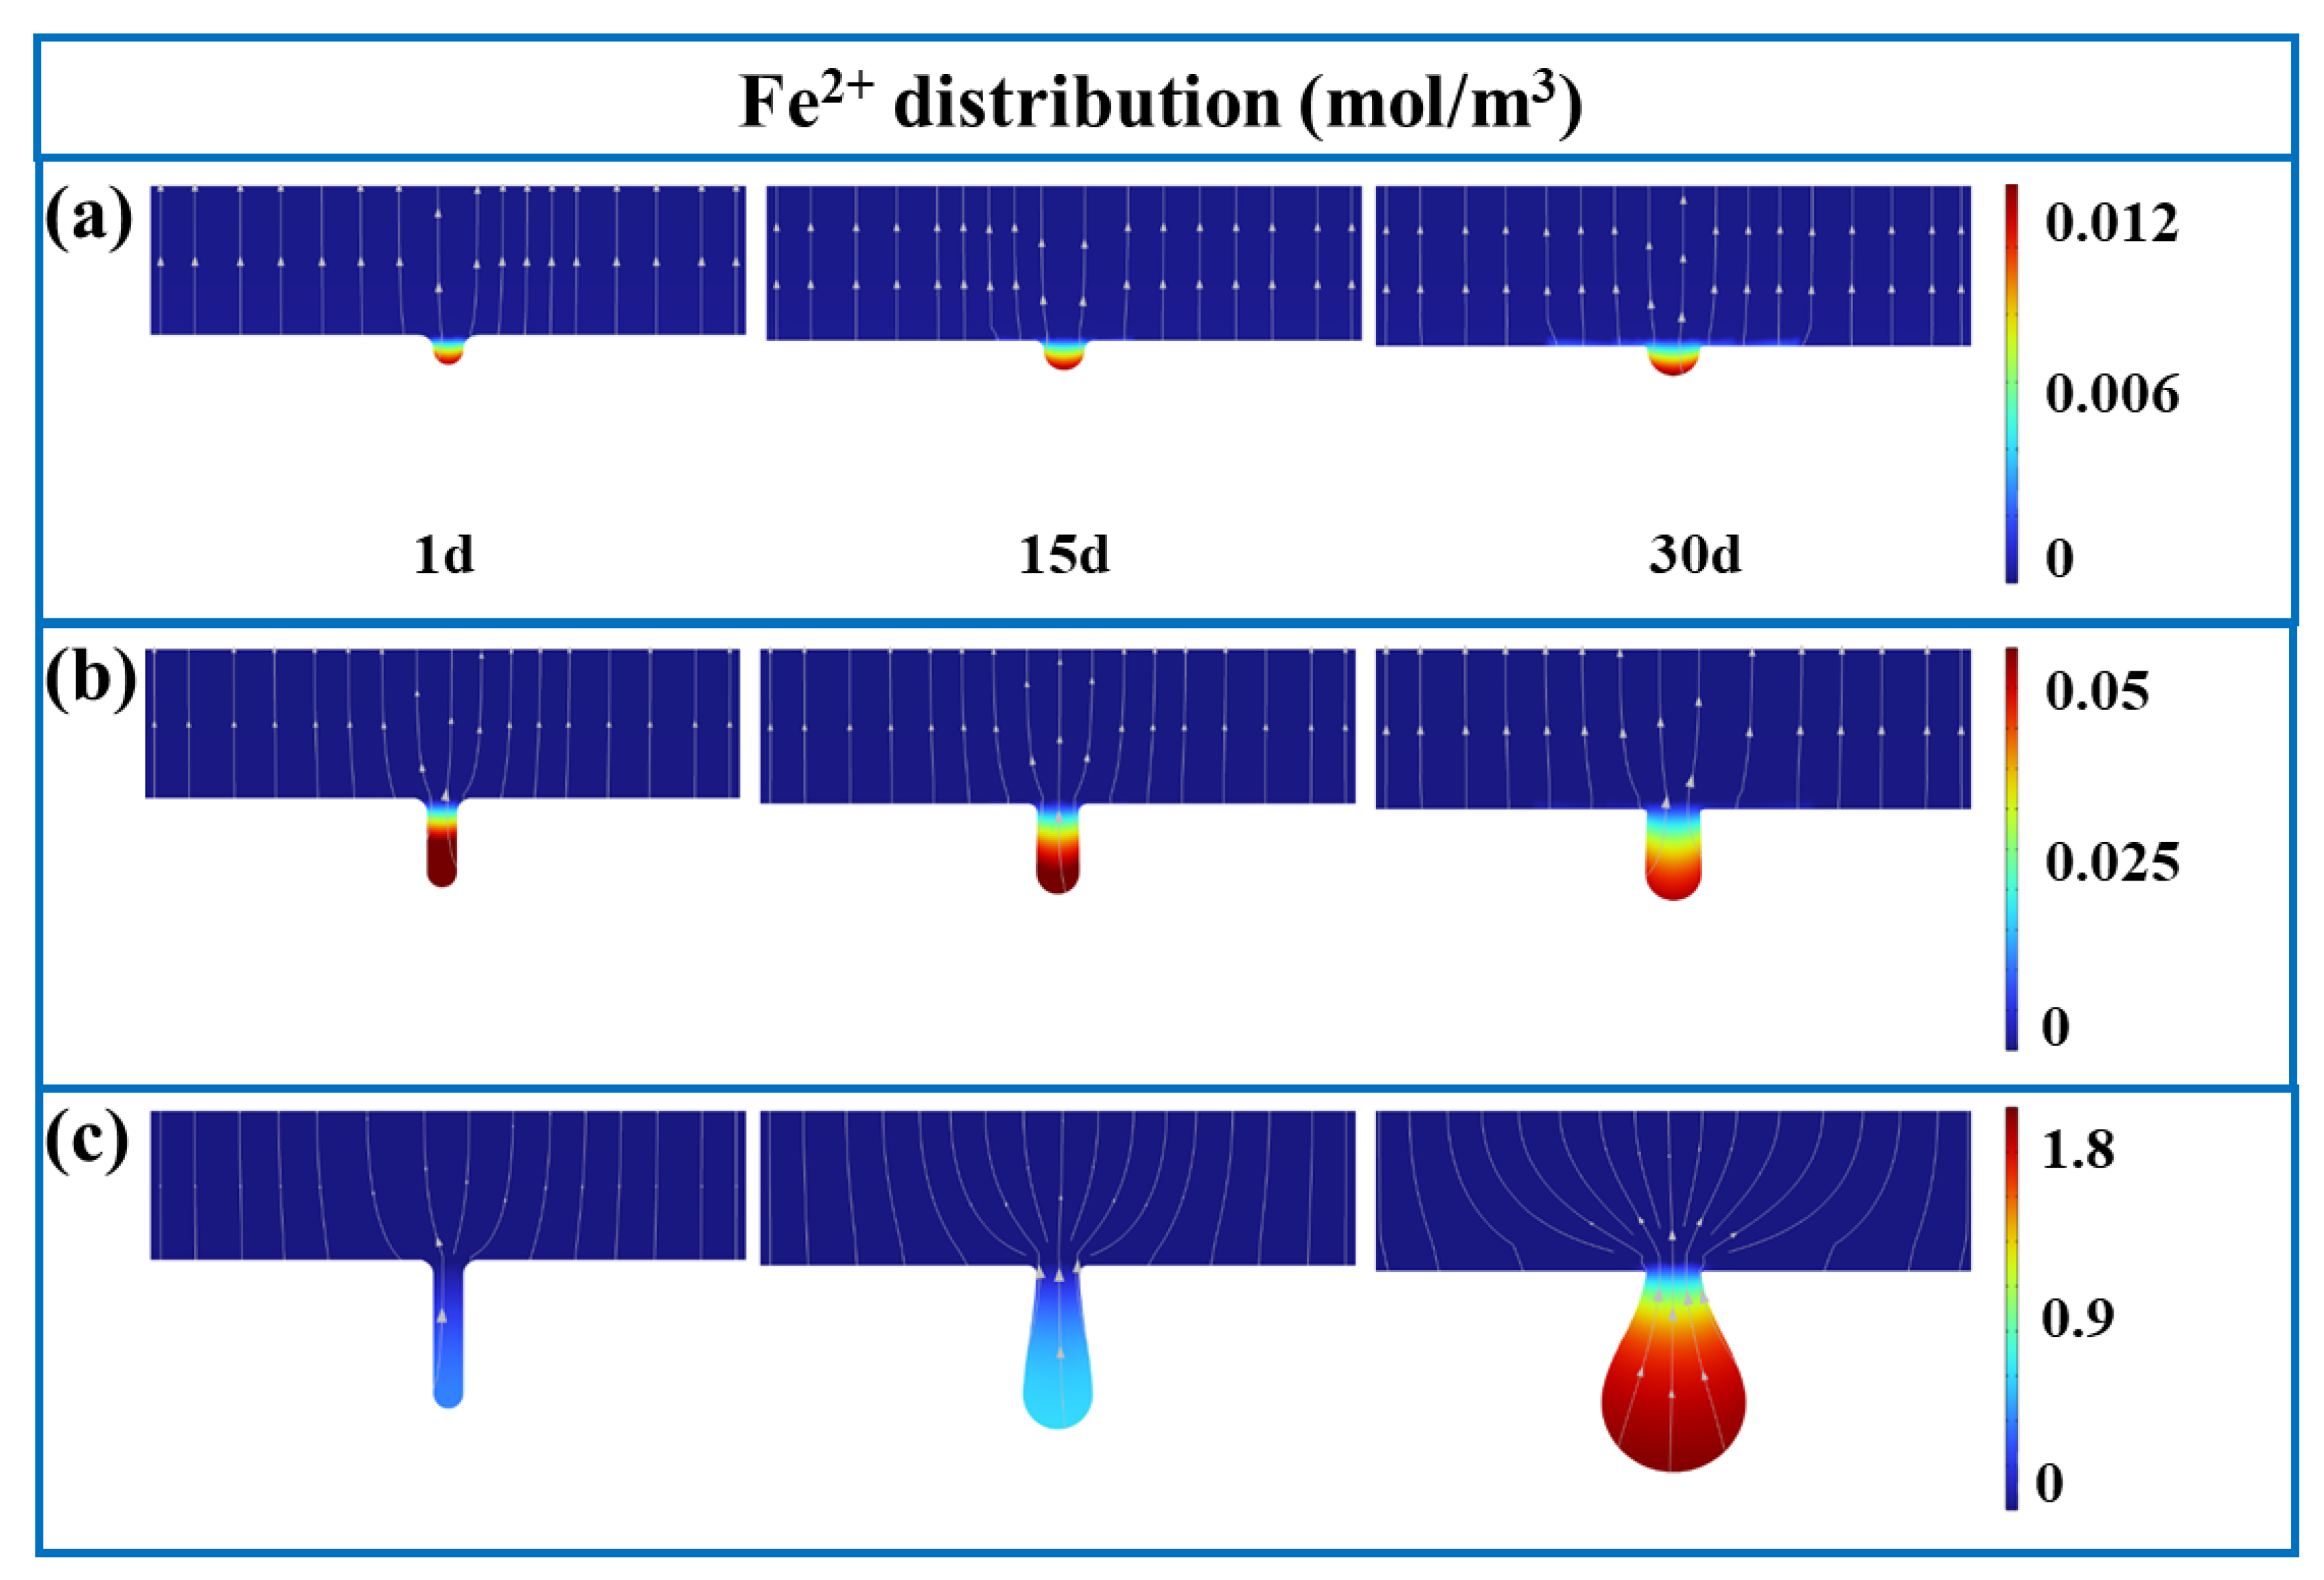
3.1. FE Analysis Results

Figure 2 shows the current density vector in the electrolyte distribution for pits with three different diameter-to-depth ratios after undergoing corrosion for various durations. For a pit with a 1:1 ratio, the current flowed upward perpendicular to the model plane. At the initial stage of corrosion (Day 1), the current density vector in the electrolyte on the S13Cr MSS surface and at the bottom of the pit was approximately the same (about 3.97 × 10⁻³ A/m2), while the current density on the inner walls of the pit was significantly lower than on the matrix surface (around 3.96 × 10⁻³ A/m2). By the 30-th day, the affected area of the pit expanded, exhibiting no significant change in values but a gradual transition of the pit shape to hemispherical. Therefore, at a 1:1 diameter-to-depth ratio, the dissolution rate of the pits in different directions was roughly identical.
For a pit with a diameter-to-depth ratio of 1:3, the current density vector in the electrolyte varied over time, as shown in Figure 2b. Unlike the 1:1 ratio, the current density on the inner walls of the pit was significantly higher than on the surface of 13Cr, increasing with depth and reaching a maximum at the bottom (4.70 × 10⁻³ A/m2). This indicated a distinct pattern in the progression of pitting corrosion related to the aspect ratio of pits.
For a pit with a diameter-to-depth ratio of 1:5, the current density vector in the electrolyte changed over time as depicted in Figure 2c. The maximum electrolyte current density in the pit reached 5.20 × 10⁻³ A/m2, while the minimum was 3.84 × 10⁻³ A/m2. The current density vector in the electrolyte at the bottom of the pit was ten times higher than that at the surface. This indicated that once the diameter-to-depth ratio reached 1:5, the dissolution rate at the bottom of the pit exceeded that at the matrix surface.
The presence of pits caused an uneven electrolyte current density distribution. Furthermore, as the corrosion evolved over time, the current density vector in the electrolyte inside the pits increased, indicating an acceleration of the corrosion rate. Morphologically, it was evident that at the diameter-to-depth ratios of 1:1 and 1:3, the shape of the pits underwent no significant change, meaning that the lateral and vertical corrosion rates were comparable. This was consistent with findings reported in works [29,34,35]. At a ratio of 1:5, the pits became droplet-shaped owing to a remarkable difference in corrosion rates at the bottom, the middle and the top of the pit.
Figure 3 shows the electrolyte potential distribution in pits with different diameter-to-depth ratios at varying stages of corrosion. It reveals the uniform electrolyte potential distribution outside the pitting area and the increase of potentials at the bottom of pits with increasing diameter-to-depth ratio. This revealed the impact of pit morphology on the electrolyte potential dynamics during corrosion.
The notable difference in electrolyte potential at the base of corrosion pits led to significant variations in pit morphology, particularly across different diameter-to-depth ratios. Higher electrolyte potentials indicate an increased tendency for the metal surface to undergo oxidation reactions. In these reactions, metal atoms were more likely to lose electrons and transform into metal ions, accelerating the corrosion process. This increase in metal ion concentration, in turn, raises the electrolyte potential, creating a self-reinforcing cycle of corrosion [36,37]. This effect became especially evident when the diameter-to-depth ratio reaches 1:5, resulting in the formation of pits with a droplet-like shape. In contrast, at diameter-to-depth ratios of 1:1 and 1:3, the differences in corrosion rates between the sides and bottom of the pits were less pronounced. This is due to a smaller potential difference with the surrounding metal surface, leading to a more even corrosion pattern.
The analysis of dissolution trends in conjunction with Figure 2 provided a clearer understanding of the substrate dissolution mechanisms. The electrolyte potential at the bottom of the pits increased to various degrees, indicating that most of the substrate has dissolved at these locations. The dissolution of more cations promoted a positive shift in electrolyte potential, highlighting the aggressive dissolution behavior at the bottom of pits.
Figure 4 illustrates the variation in Fe2+ concentration within pits under different conditions. The ion concentration in the solution—a factor determining the electrolyte potential variations [7]—confirmed that the highest electrolyte potentials occurred at the bottom of the pits. The Fe2+ concentration distribution across different diameter-to-depth ratios showed the varying trend. At a ratio of 1:1, the shallow depth of pits resulted in slower substrate dissolution rates and smaller dissolution areas, leading to lower Fe2+ concentrations. With the increase in the ratio to 1:3 and especially to 1:5, the Fe2+ concentration rose significantly, highlighting the effect of pit geometry on the ion distribution and diffusion patterns, which was in line with the experimental findings of Zhao [38].
Figure 5 displays the variation in Cl concentration within pits under different conditions, revealing a trend similar to that of Fe2+ concentration. A significant amount of Cl was primarily concentrated at the bottom of the pits, decreasing toward the surface of the substrate. As the corrosion proceeded, the Cl concentration inside the pits and on the substrate surface correspondingly increased, indicating the noticeable role of Cl in pitting corrosion.
The variation in ion concentration is closely linked to the electrochemical reactions occurring during the pitting corrosion. Pitting corrosion, a common form of localized corrosion [7], exemplifies a scenario where a large cathode and a small anode lead to corrosion acceleration. The deposition of Fe2+ at the pit entrance hinders material exchange between the inside and outside of the pit, creating a stagnation condition within the pit compared to the exterior. This condition fosters an oxygen concentration cell with a small O2 level inside the pit and multiple oxygen ions outside, accelerating ionization within the pit. Consequently, the Fe2+ concentration inside the pit increases. To maintain the electrical neutrality, Cl ions enter the pit, enhancing the activity of H+, which in turn increases the metal dissolution rate at the pit bottom [29,35,39]. This process results in the increase in Fe2+ and Cl concentrations at the pit bottom as the pitting progresses, agreeing with the above increases in corrosion rate and electrolyte potential changes.
Figure 6 depicts the pH changes inside and outside the pits with different diameter-to-depth ratios. The changes were predominantly observed at the pit bottoms and inner walls, exhibiting the minimal pH fluctuation on the substrate surface, suggesting localized substrate dissolution within the pits. The lower pH values, indicating the higher proton concentrations, correlated with the faster corrosion rates. For pits with ratios of 1:1 and 1:3, the pH variation was minimal, reflecting a slower corrosion rate, despite a gradient difference between the pit bottom and the substrate surface.
The accumulation of large H+ and Cl amounts in pits hampered the diffusion of dissolved metal Fe2+ ions from the inside to the outside of the pit, leading to an increase in cation concentration within the pit. To maintain electrical neutrality, multiple Cl ions continuously migrated into the pit, combining with dissolved metal cations at the bottom to form chlorides. This chloride formation further resulted in the production of metal hydroxides and acidic substances within the pit [40,41], thus decreasing the pH value at the pit bottom as the corrosion proceeded. This enhanced acidity at the pit bottom and accelerated the anodic reaction rate [35,42], leading to the rapid vertical development of the pit.
The corrosion rate at different parts of pits at different diameter-to-depth ratios showed the varying trend (Figure 7). At the pit top and the ratios of 1:3 and 1:5, the corrosion rate increased over time, while oscillating at a ratio of 1:1. As seen from the middle and bottom parts of the pits, the deeper pits (with the ratio of 1:5) possessed an exponential increase in corrosion rate, unlike those with ratios of 1:1 and 1:3. This indicated the rapid downward growth for pits with a ratio of 1:5, highlighting the significant effect of pit geometry on the corrosion dynamics.
Figure 8 displays the total electrode corrosion rate over a 0-to-30-day period for pits with various depths. The x-axis represents the vertical displacement due to pitting, and the y-axis shows the total electrode corrosion rate. The corrosion rate at a diameter-to-depth ratio of 1:5 was much higher than those at the other two ratios, demonstrating an increase with depth. This trend corroborated with the above findings on electrolyte current density, potential, ion concentrations, and pH values, illustrating the comprehensive impact of these factors on the evolution of corrosion.

3.2. Analytical Insights from Simulated Immersion Experiments

To validate the specific composition of the corrosion products in the samples, this study conducted X-ray Photoelectron Spectroscopy (XPS) analyses. The XPS results for C1s, O1s, Fe2p3/2, and Cr2p3/2 on the sample surfaces are presented in Figure 9. The XPS spectra for C1s exhibit characteristics of two distinct peak groups, with the fitting curve confirming the presence of C–O and C=O functional groups at binding energies of 286.0 eV and 288.5 eV, respectively. Similarly, the fitting results for O1s also display dual-peak characteristics, pinpointing the C–O and C=O bonds at 532.1 eV and 533.2 eV [15,43,44], respectively. Hence, the corrosion products are primarily composed of carbonates. The primary components of the corrosion products are further elucidated through the analysis of Fe2p3/2 and Cr2p3/2 peaks. The fitting curve for the Fe2p3/2 peak identifies a peak at 712.0 eV corresponding to FeCO3, while a peak at 709.0 eV is attributed to FeCr2O4. In addition, fitting of the Cr2p3/2 XPS spectra reveals a peak at 577.8 eV corresponding to Cr2O3, and a peak at 576.5 eV identified as FeCr2O4 [15,44,45], thereby providing a detailed insight into the composition of the corrosion products on the samples.
The SEM and EDS images (Figure 10) from the simulated immersion tests of the 13Cr surface revealed circular pits with an approximate diameter of 22 μm, surrounded by cracks of various sizes. Following the immersion, the specimen’s surface was found to be extensively covered with corrosion products. These products were identified as iron–chromium compounds with a minor presence of iron(II) carbonate (FeCO3), aligning with the conclusions of other studies [7,13]. The differential thermal expansion of the corrosion products from the substrate induced the substantial internal stress, leading to cracks in the corrosion product film [46]. The elemental analysis revealed a predominance of Fe, Cr, and O elements around the pits, with Cl notably enriched around the pits, which agreed with the finite element analysis data. This Cl enrichment was attributed to electrochemical reactions within the pits, whereby Cl anions were required to maintain the charge balance through their directional movement [47]. Additionally, the areas enriched in Cl showed less Cr, indicating the presence of Fe and O elements, which suggested that the protective oxide film on the substrate surface was compromised by the pits, facilitating further corrosion [40,48].

4. Conclusions

The finite element analysis and simulated environment immersion test were used to address the growth behavior of pitting corrosion. The finite element analysis consisted in assessing the current density vector in the electrolyte, potential, Fe and Cl ion concentrations, pH values, and electrode corrosion rates. The immersion test furnished information about the primary morphology and chemical composition around the pits. Based on the findings, the main conclusions can be drawn as follows.
(1)
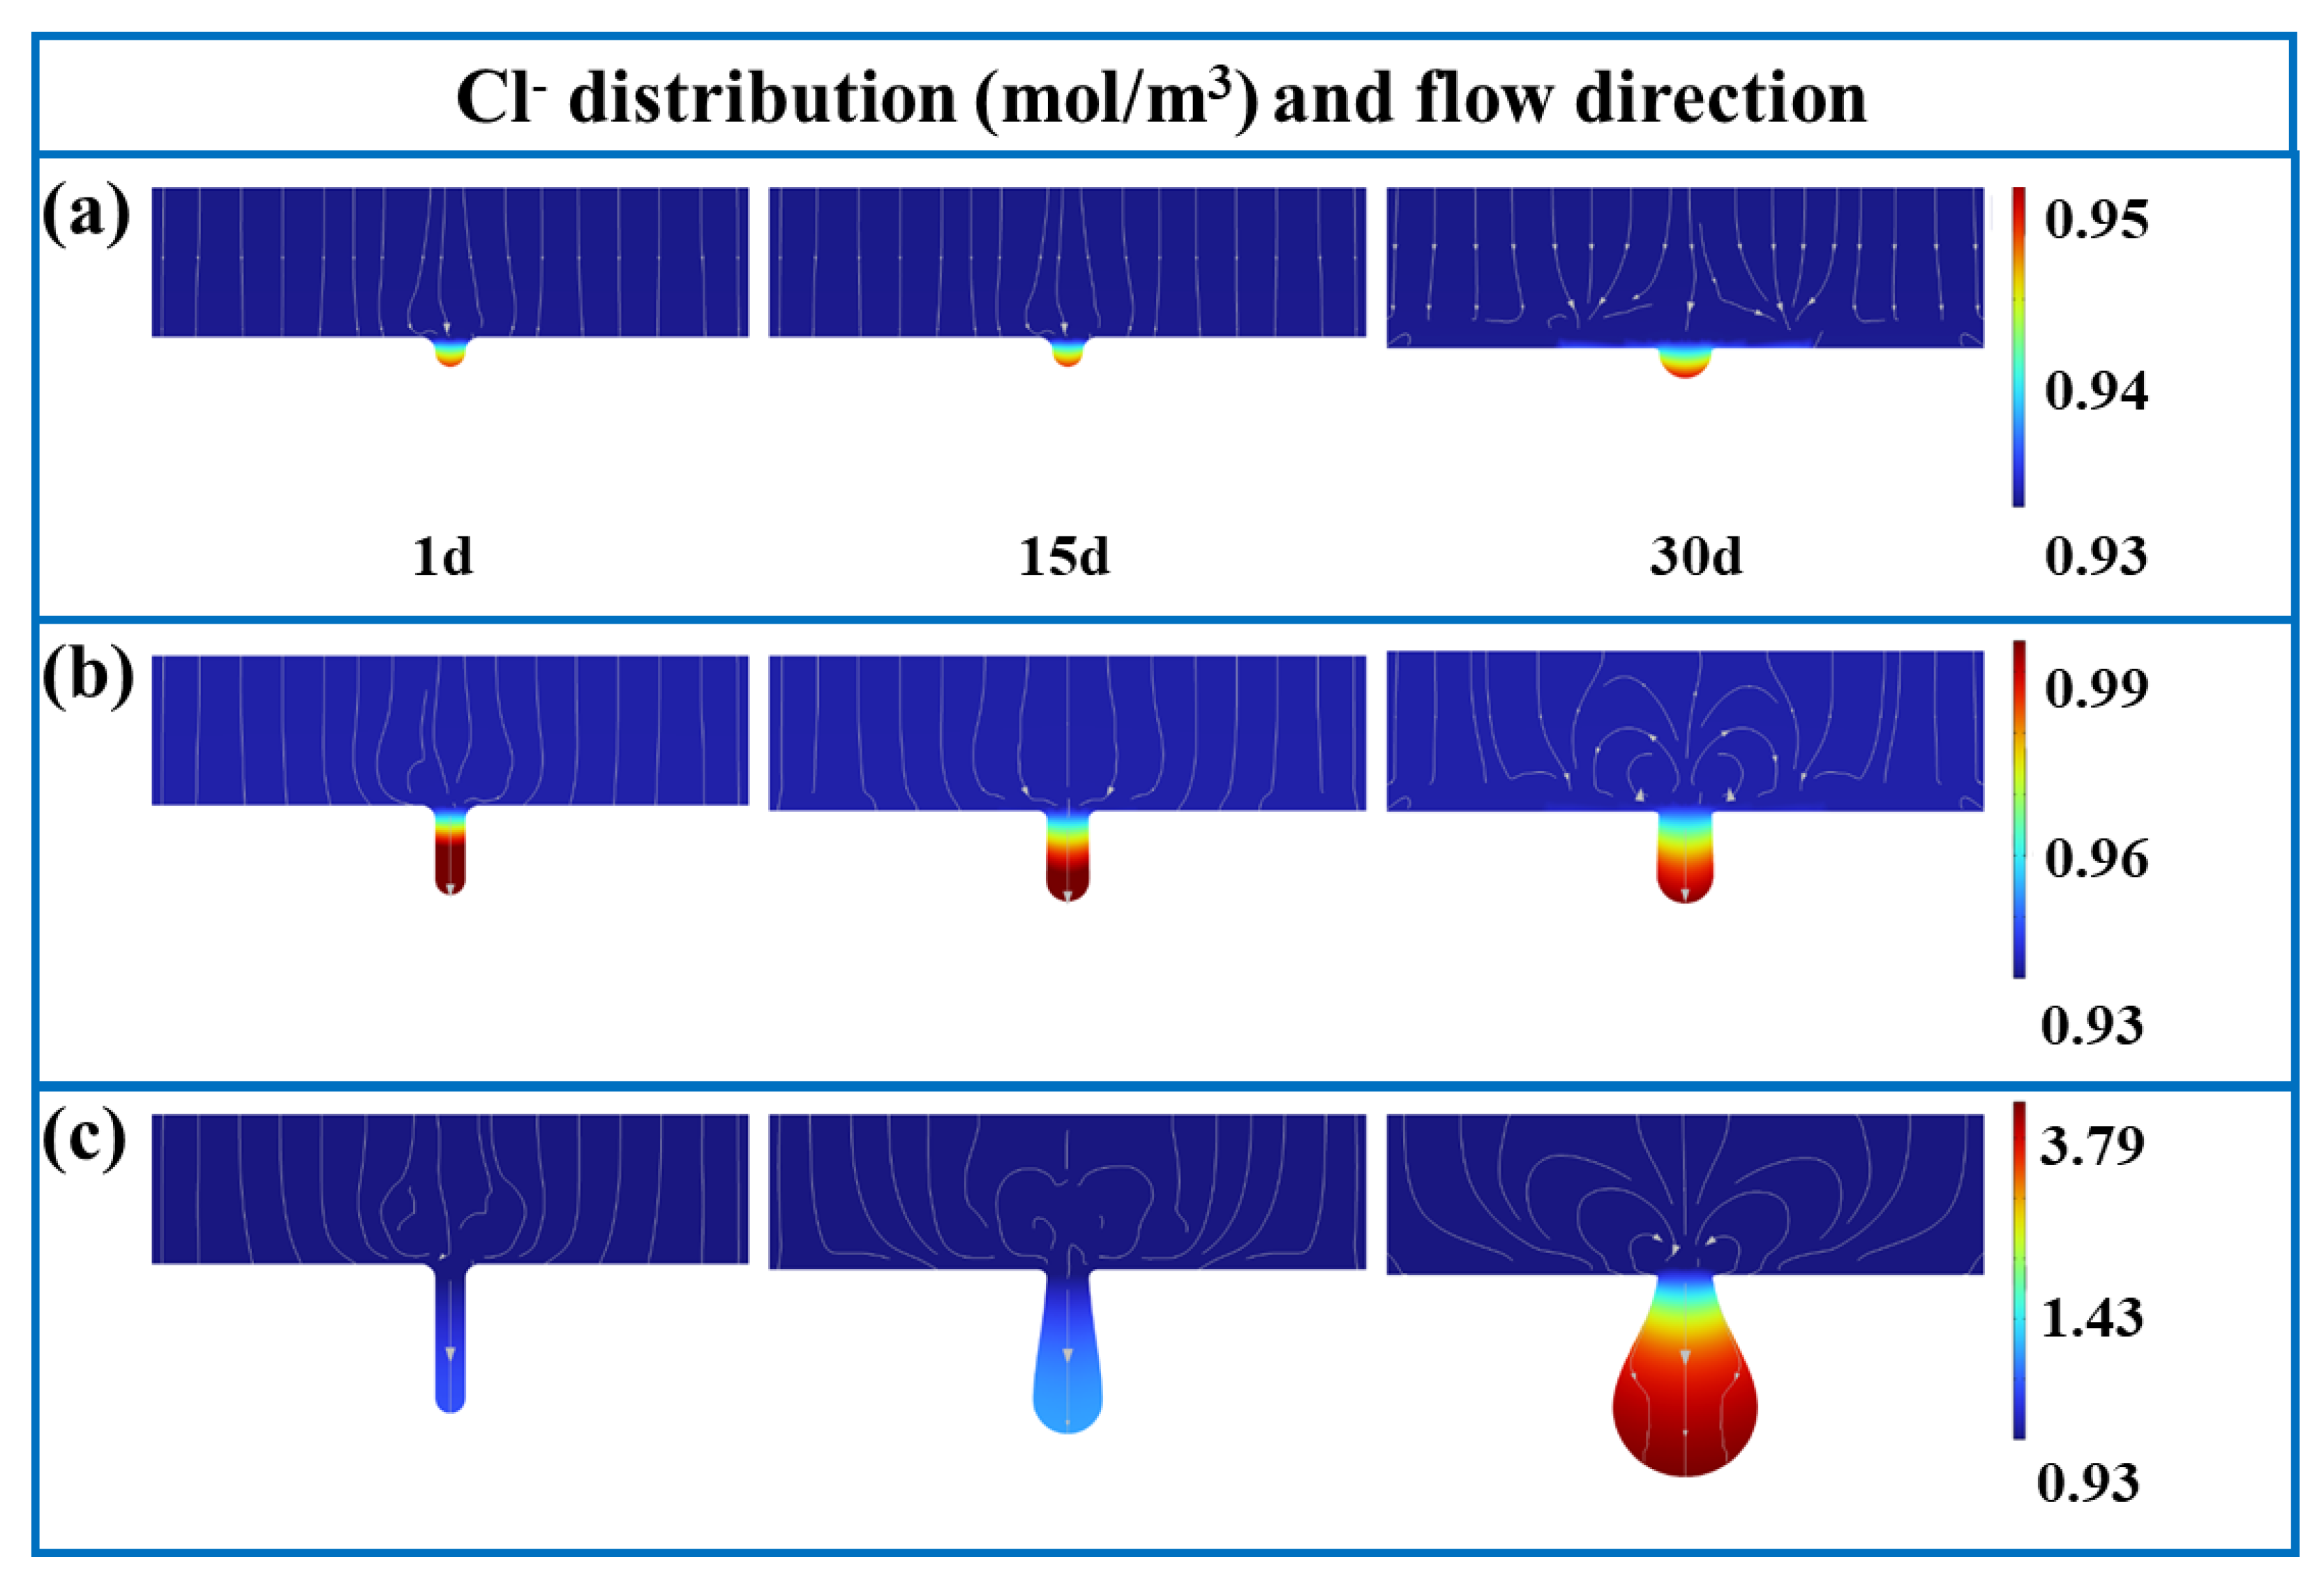
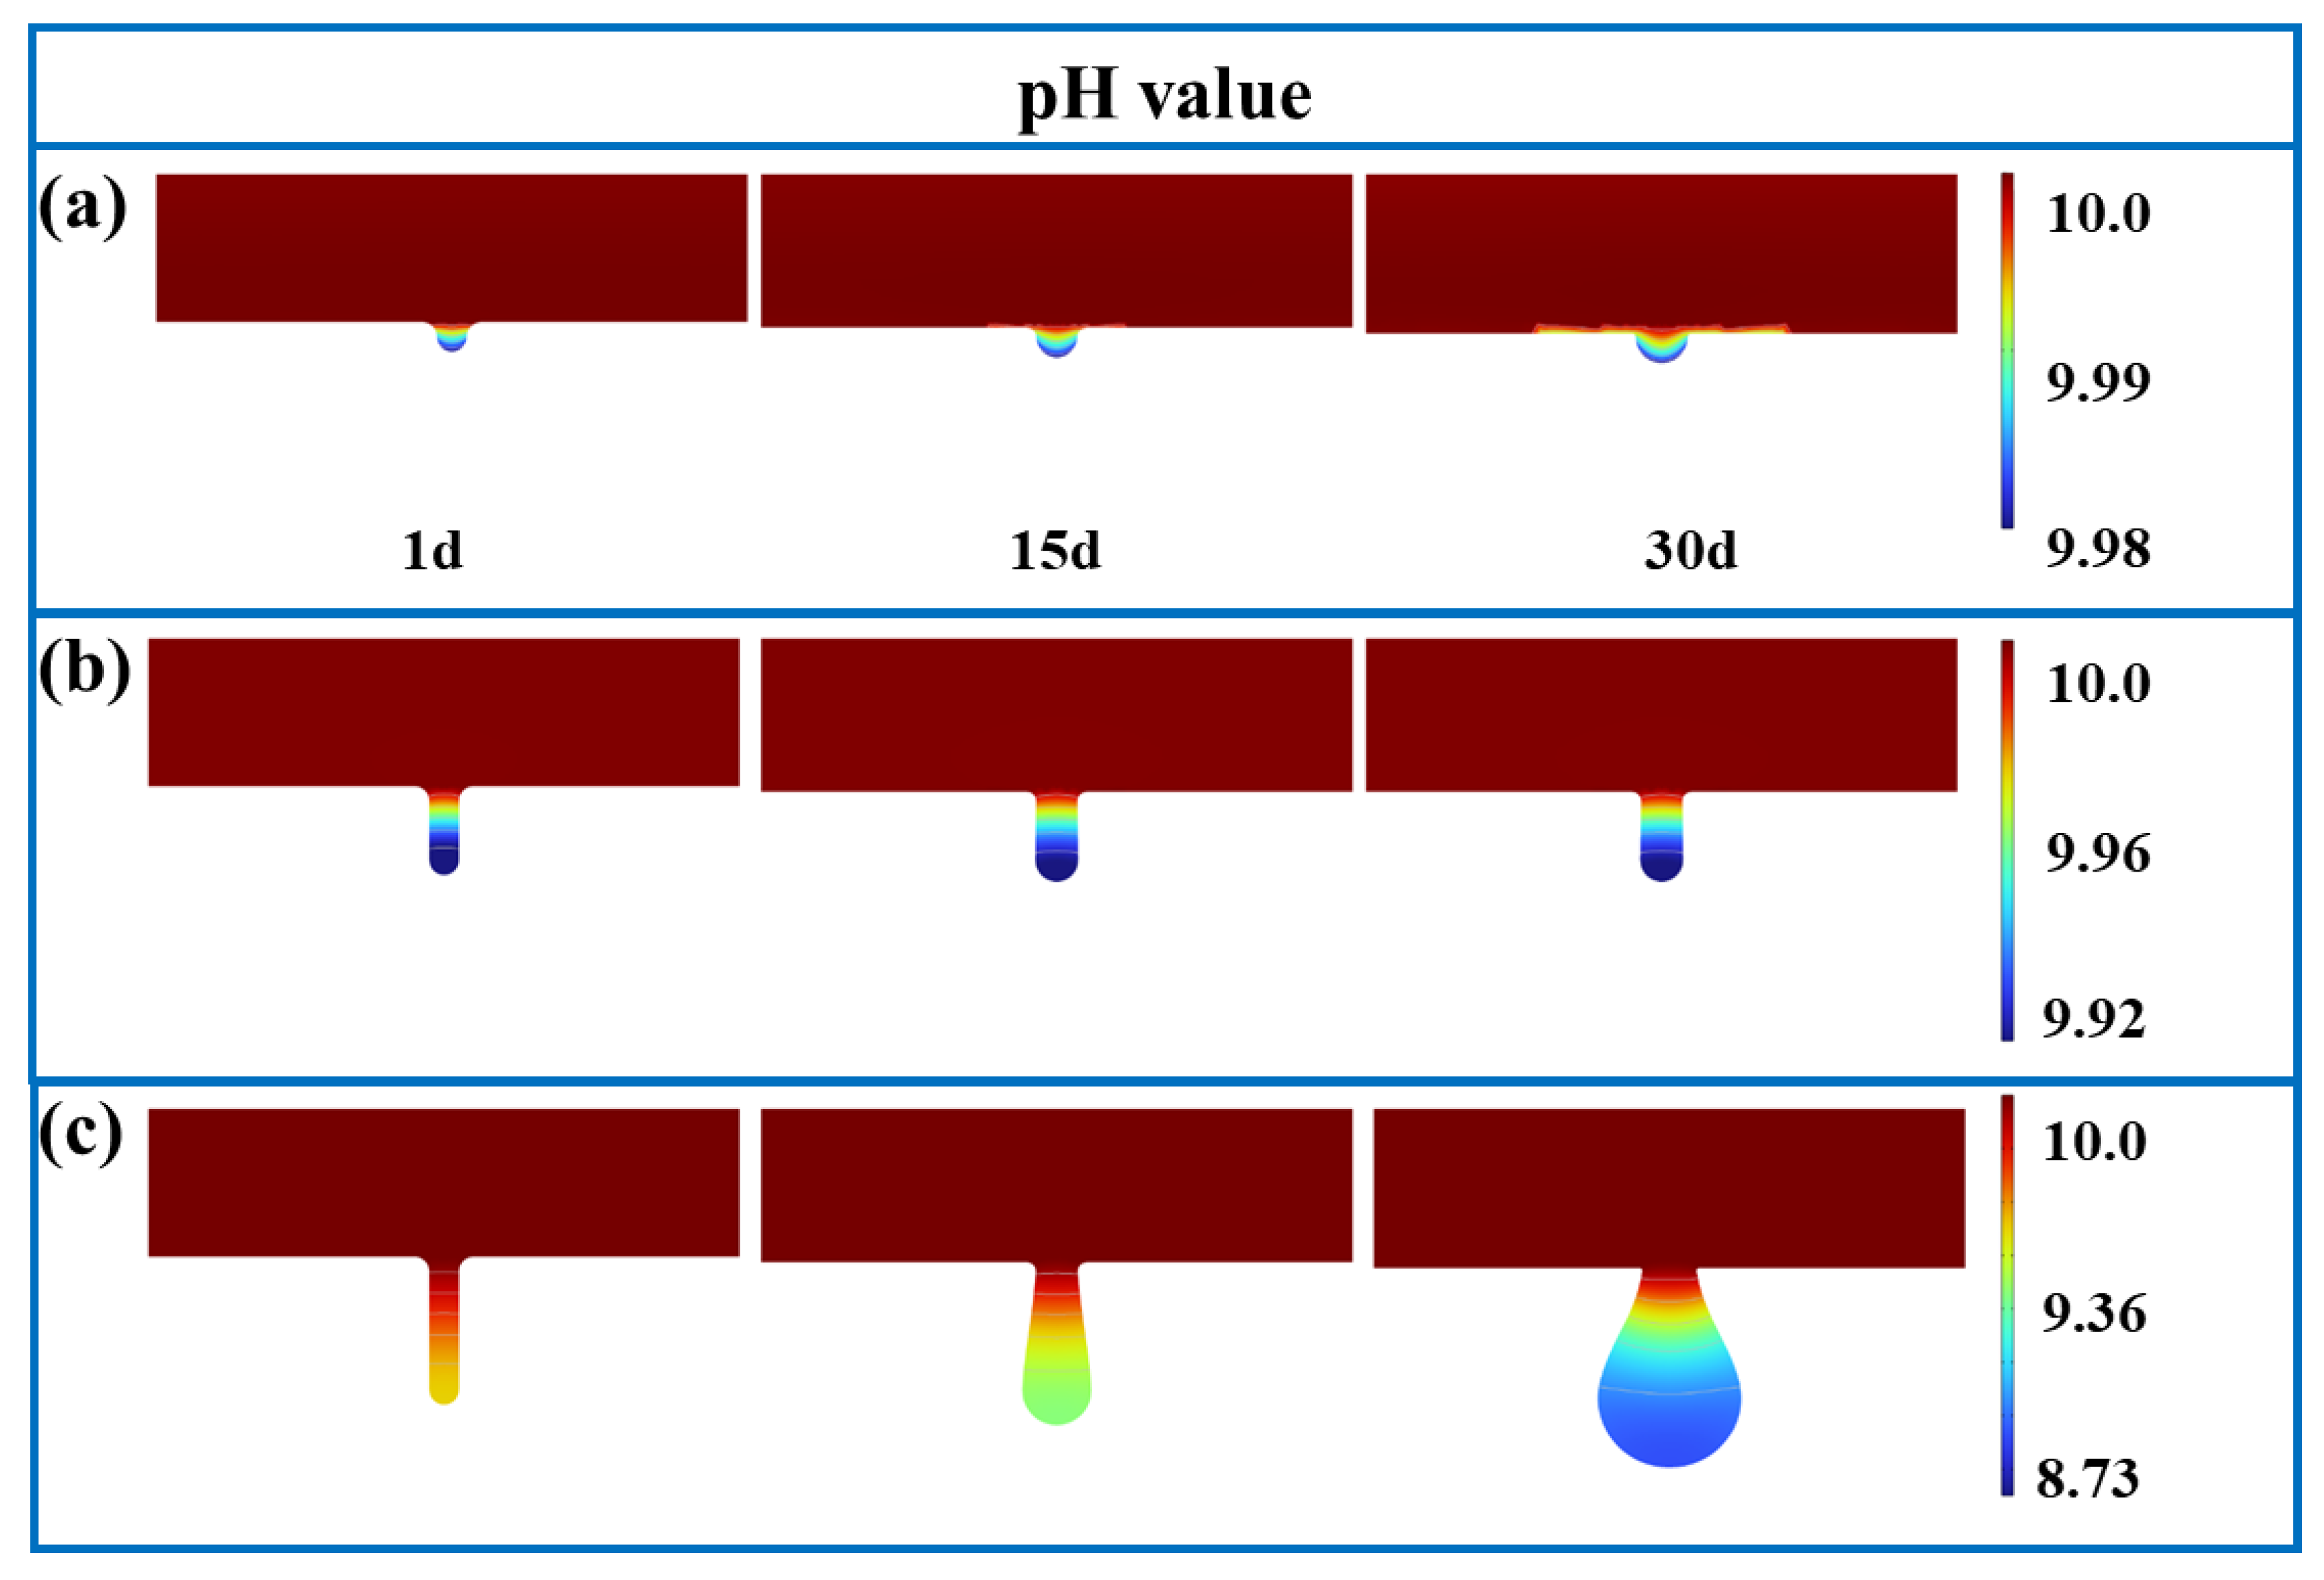
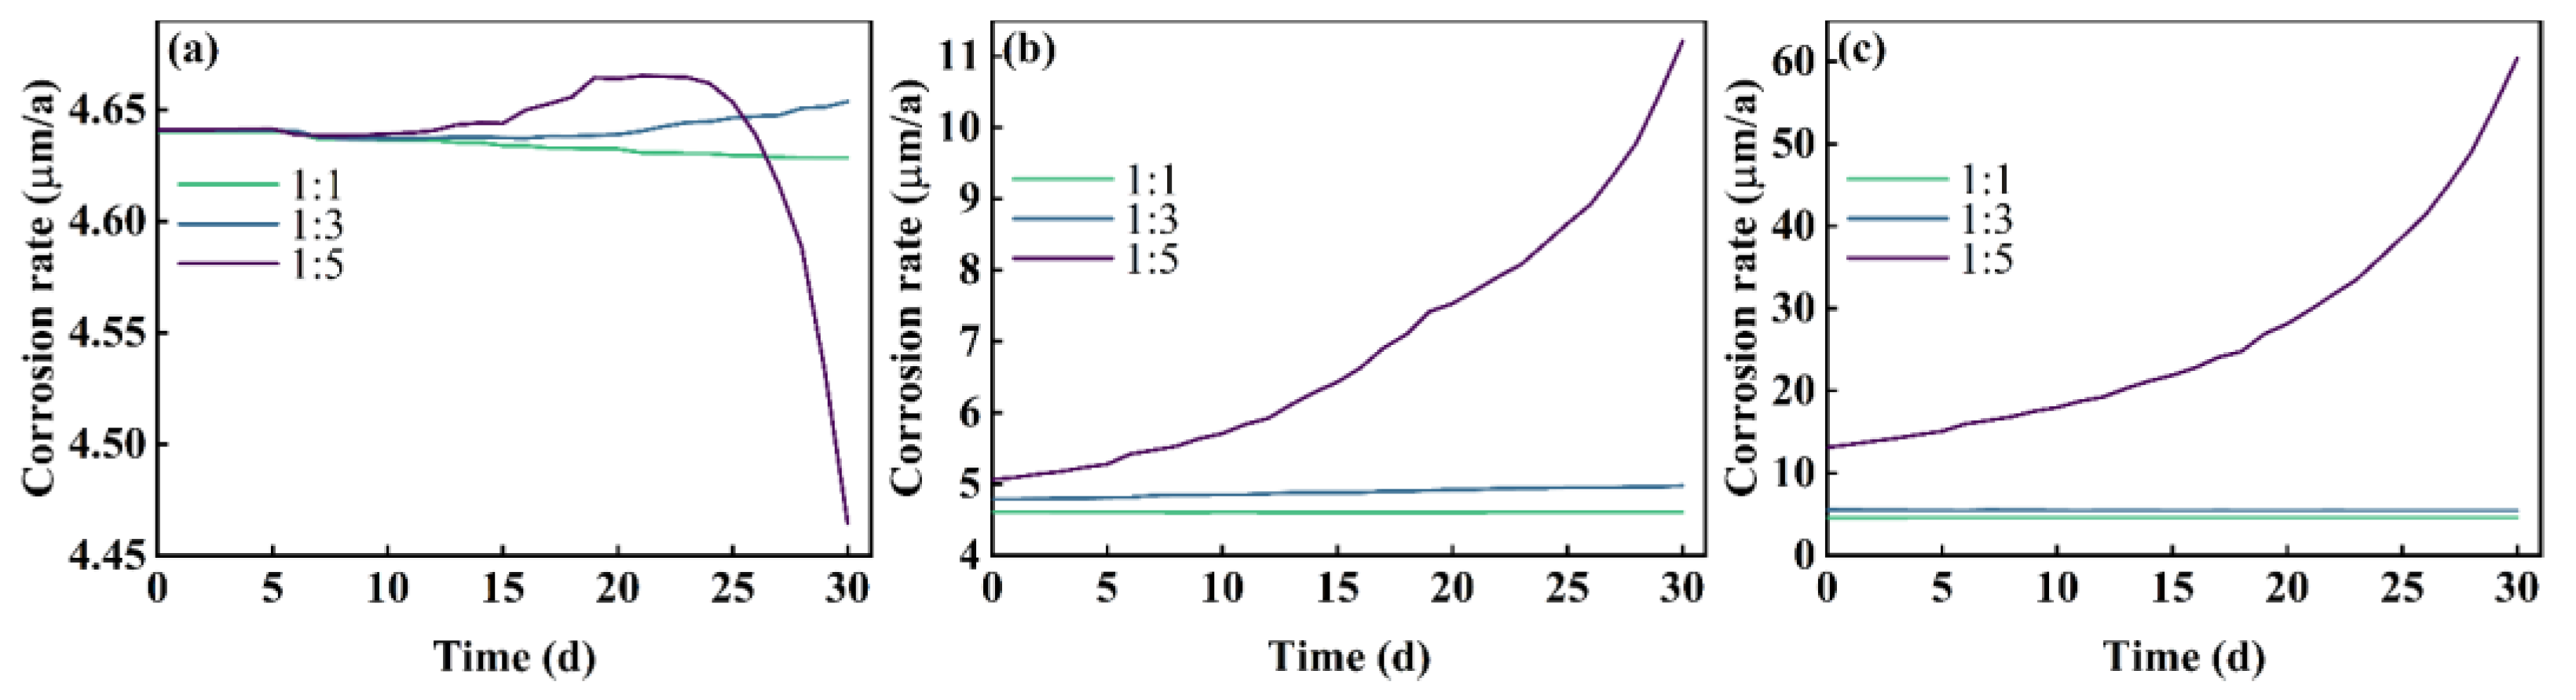
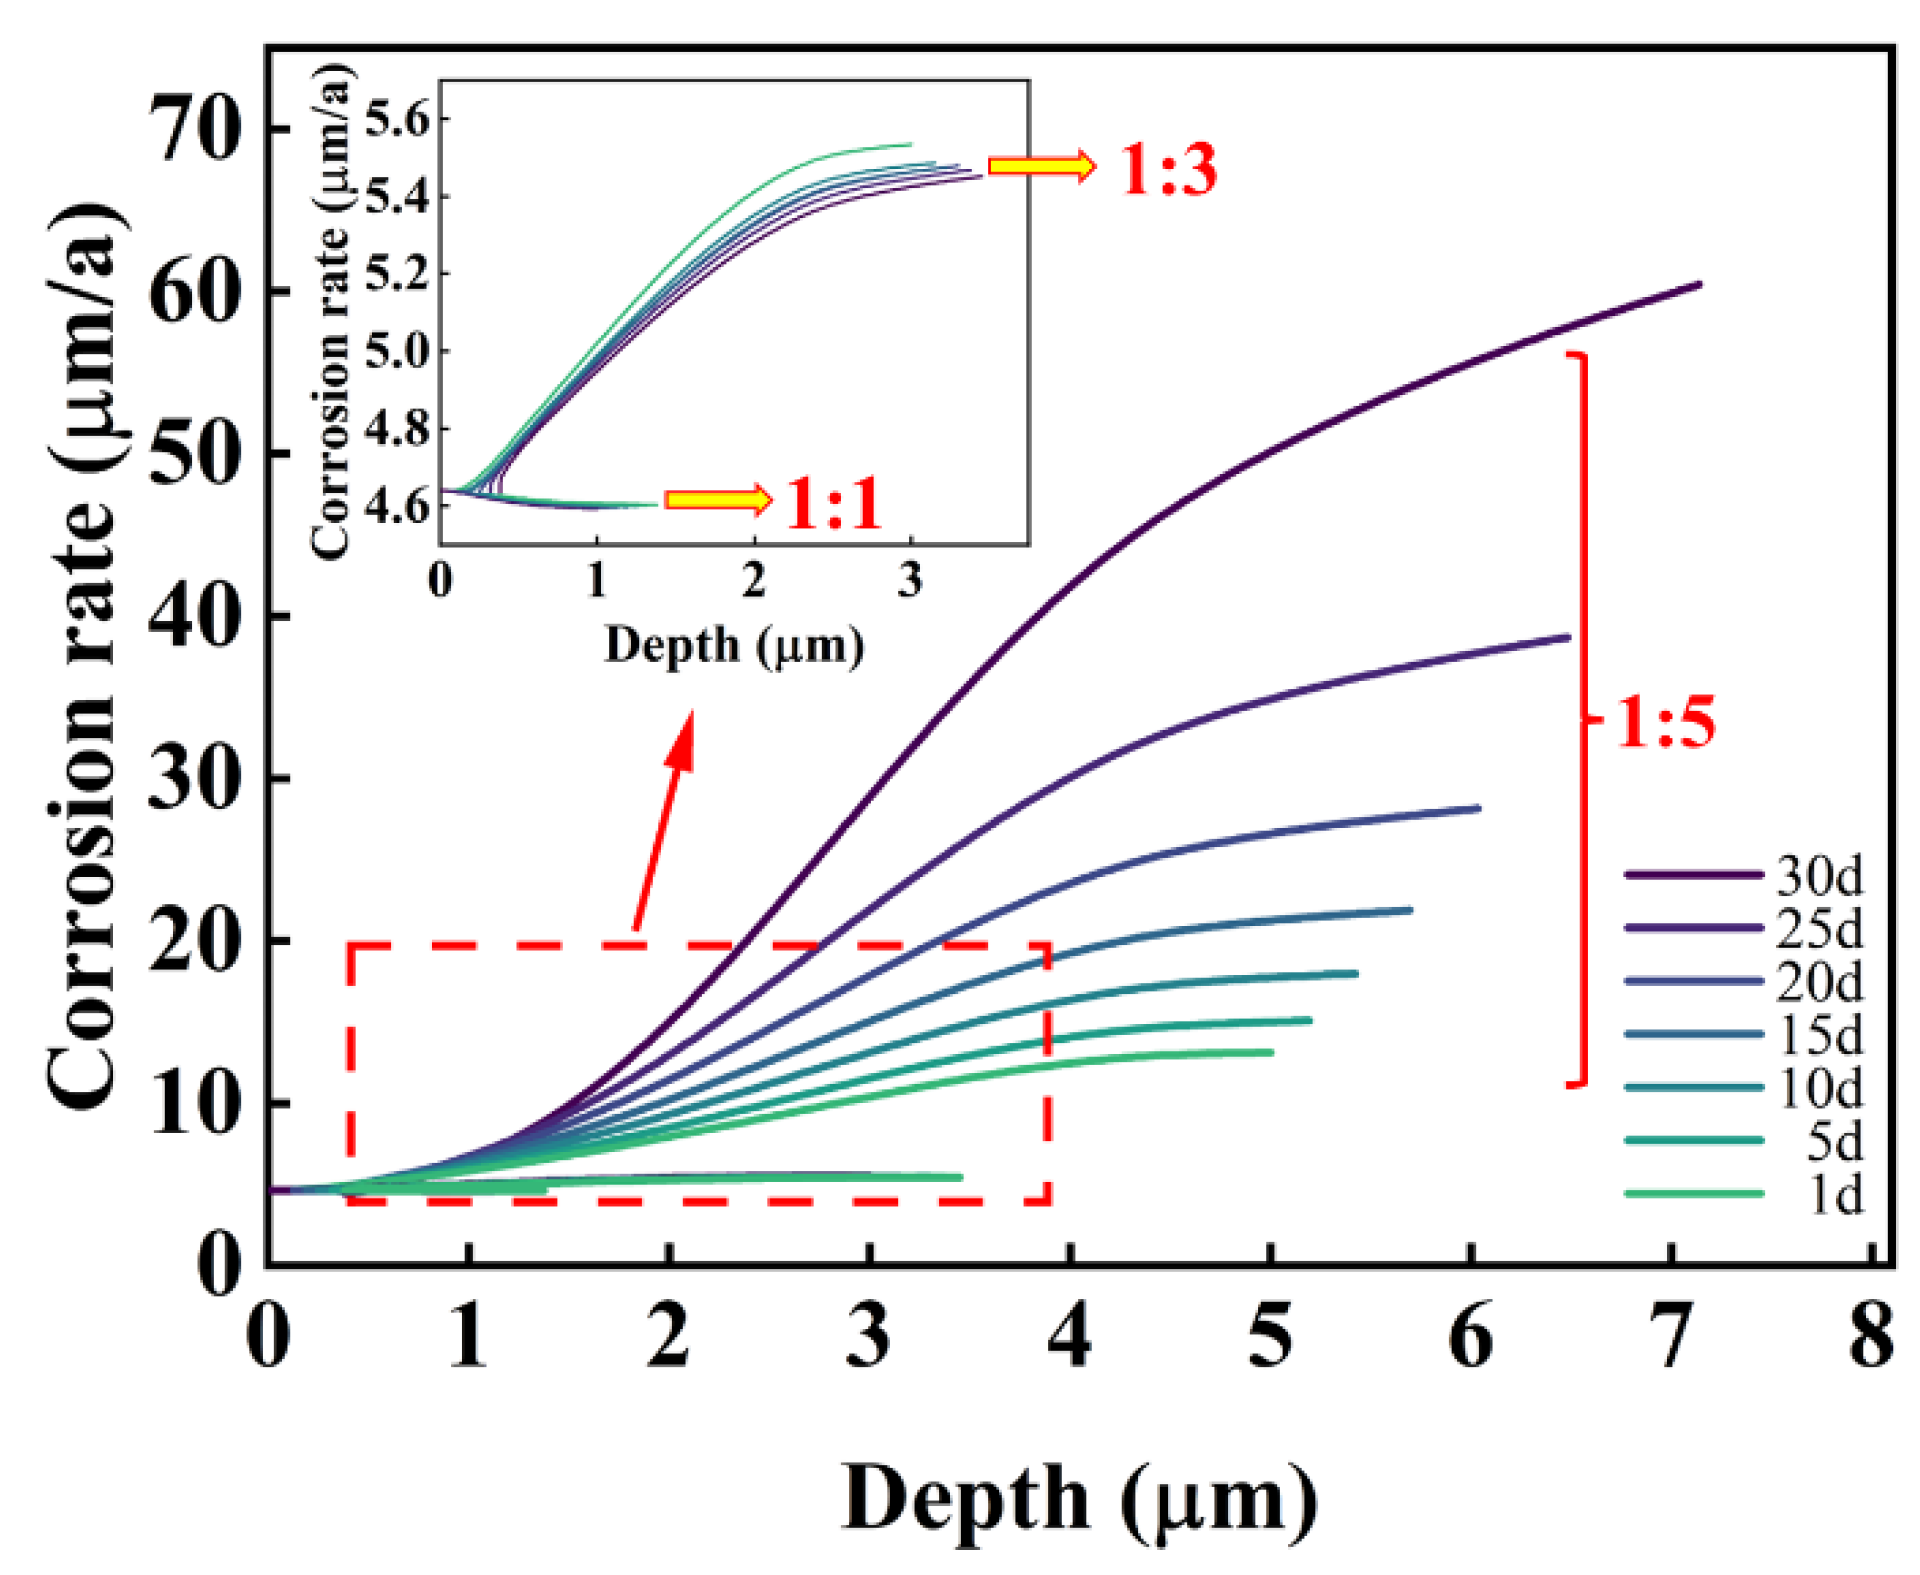
The corrosion rate is influenced by electrolyte current density, potential, and concentrations of Fe and Cl ions, as well as pH values. For pits with diameter-to-depth ratios below 1:3, growth rates are similar in all directions, leading to the uniform expansion of pitting. At a ratio of 1:5, the growth rate at the bottom of pits surpasses those at the middle and top, resulting in a droplet-shaped pit morphology.
(2)
The corrosion rate at the bottom of pits increases exponentially with the diameter-to-depth ratio. Fe and Cl ions accumulate within pits, creating a localized galvanic cell that accelerates corrosion through the pronounced cathode–small anode effect.
(3)
The diffusion of Cl ions into pits causes Cr depletion at the edges, undermining the protective oxide layer around pits and lowering the local corrosion potential, which accelerates corrosion around the pits.

Author Contributions

Z.Y.: Writing—Original Draft, Visualization; H.D.: Writing—Review & Editing, Supervision, Validation; Y.H.: Writing—Review & Editing; Y.Z.: Data Curation; P.L.: Investigation; Y.F.: Investigation. All authors have read and agreed to the published version of the manuscript.

Funding

This work was financially supported by the National Natural Science Foundation of China (grant no. 51904331) and Xi’an Shiyou University Graduate Innovation and Practice Ability Training Project (no. YCS22112066).

Institutional Review Board Statement

No applicable.

Informed Consent Statement

No applicable.

Data Availability Statement

Data is contained within the article.

Acknowledgments

The authors thank YanCheng Technology for the support of SEM, EDS.

Conflicts of Interest

The authors declare no conflicts of interest.

References

  1. Long, Y.; Wu, G.; Fu, A.Q.; Xie, J.F.; Zhao, M.F.; Bai, Z.Q.; Luo, J.H.; Feng, Y.R. Failure Analysis of the 13Cr Valve Cage of Tubing Pump Used in an Oilfield. Eng. Fail. Anal. 2018, 93, 330–339. [Google Scholar] [CrossRef]
  2. Fu, A.; Long, Y.; Liu, H.; Zhao, M.; Xie, J.; Su, H.; Li, X.; Yuan, J.; Lei, X.; Yin, C.; et al. Stress Corrosion Cracking Behavior of Super 13Cr Tubing in Phosphate Packer Fluid of High Pressure High Temperature Gas Well. Eng. Fail. Anal. 2022, 139, 106478. [Google Scholar] [CrossRef]
  3. Qi, W.; Wang, J.; Li, X.; Cui, Y.; Zhao, Y.; Xie, J.; Zeng, G.; Gao, Q.; Zhang, T.; Wang, F. Effect of Oxide Scale on Corrosion Behavior of HP-13Cr Stainless Steel during Well Completion Process. J. Mater. Sci. Technol. 2021, 64, 153. [Google Scholar] [CrossRef]
  4. Cho, H.-J.; Kim, S.-H.; Cho, Y.; Kim, S.-J. Effect of Copper Addition on Tensile Behavior in Fe-Cr-Ni Stable Austenitic Stainless Steel. Mater. Charact. 2022, 190, 112052. [Google Scholar] [CrossRef]
  5. Dai, J.; Li, H.-B.; Feng, H.; Jiang, Z.-H.; Qu, J.-D.; Zhao, Y.; Zhang, T. Revealing Significant Effect of Nitrogen on Prolonging Pitting Corrosion Lifetime of Martensitic Stainless Steel by Modelling Approach. Corros. Sci. 2022, 203, 110369. [Google Scholar] [CrossRef]
  6. Li, Y.Z.; Wang, X.; Zhang, G.A. Corrosion Behaviour of 13Cr Stainless Steel under Stress and Crevice in 3.5 Wt.% NaCl Solution. Corros. Sci. 2020, 163, 108290. [Google Scholar] [CrossRef]
  7. Li, J.; Lin, B.; Zheng, H.; Wang, Y.; Zhang, H.; Zhang, Y.; Nie, Z.; Tang, J. Study on Pitting Corrosion Behavior and Semi In-Situ Pitting Corrosion Growth Model of 304 L SS with Elastic Stress in NaCl Corrosion Environment. Corros. Sci. 2023, 211, 110862. [Google Scholar] [CrossRef]
  8. Man, C.; Dong, C.; Liu, T.; Kong, D.; Wang, D.; Li, X. The Enhancement of Microstructure on the Passive and Pitting Behaviors of Selective Laser Melting 316L SS in Simulated Body Fluid. Appl. Surf. Sci. 2019, 467–468, 193–205. [Google Scholar] [CrossRef]
  9. Pradhan, S.K.; Bhuyan, P.; Bairi, L.R.; Mandal, S. Comprehending the Role of Individual Microstructural Features on Electrochemical Response and Passive Film Behaviour in Type 304 Austenitic Stainless Steel. Corros. Sci. 2021, 180, 109187. [Google Scholar] [CrossRef]
  10. Ha, H.-Y.; Kim, K.-W.; Park, S.-J.; Lee, T.-H.; Park, H.; Moon, J.; Hong, H.-U.; Lee, C.-H. Effects of Cr on Pitting Corrosion Resistance and Passive Film Properties of Austenitic Fe–19Mn–12Al–1.5 C Lightweight Steel. Corros. Sci. 2022, 206, 110529. [Google Scholar] [CrossRef]
  11. Wang, Z.; Jin, J.; Zhang, G.-H.; Fan, X.-H.; Zhang, L. Effect of Temperature on the Passive Film Structure and Corrosion Performance of CoCrFeMoNi High-Entropy Alloy. Corros. Sci. 2022, 208, 110661. [Google Scholar] [CrossRef]
  12. Wang, R.; Wang, D.; Nagaumi, H.; Wu, Z.; Li, X.; Zhang, H. Understanding the Corrosion Behavior by Passive Film Evolution in Zn-Containing Al-Si-Cu Cast Alloy. Corros. Sci. 2022, 205, 110468. [Google Scholar] [CrossRef]
  13. Yin, Z.F.; Wang, X.Z.; Liu, L.; Wu, J.Q.; Zhang, Y.Q. Characterization of Corrosion Product Layers from CO2 Corrosion of 13Cr Stainless Steel in Simulated Oilfield Solution. J. Mater. Eng. Perform. 2011, 20, 1330–1335. [Google Scholar] [CrossRef]
  14. Xiao, G.; Tan, S.; Yu, Z.; Dong, B.; Yi, Y.; Tian, G.; Yu, H.; Shi, S. CO2 Corrosion Behaviors of 13Cr Steel in the High-Temperature Steam Environment. Petroleum 2020, 6, 106–113. [Google Scholar] [CrossRef]
  15. Yue, X.; Zhang, L.; Sun, C.; Xu, S.; Wang, C.; Lu, M.; Neville, A.; Hua, Y. A Thermodynamic and Kinetic Study of the Formation and Evolution of Corrosion Product Scales on 13Cr Stainless Steel in a Geothermal Environment. Corros. Sci. 2020, 169, 108640. [Google Scholar] [CrossRef]
  16. Loable, C.; Viçosa, I.N.; Mesquita, T.J.; Mantel, M.; Nogueira, R.P.; Berthomé, G.; Chauveau, E.; Roche, V. Synergy between Molybdenum and Nitrogen on the Pitting Corrosion and Passive Film Resistance of Austenitic Stainless Steels as a pH-Dependent Effect. Mater. Chem. Phys. 2017, 186, 237–245. [Google Scholar] [CrossRef]
  17. Moon, J.; Ha, H.-Y.; Park, S.-J.; Lee, T.-H.; Jang, J.H.; Lee, C.-H.; Han, H.N.; Hong, H.-U. Effect of Mo and Cr Additions on the Microstructure, Mechanical Properties and Pitting Corrosion Resistance of Austenitic Fe-30Mn-10.5Al-1.1C Lightweight Steels. J. Alloys Compd. 2019, 775, 1136–1146. [Google Scholar] [CrossRef]
  18. Qi, X.; Mao, H.; Yang, Y. Corrosion Behavior of Nitrogen Alloyed Martensitic Stainless Steel in Chloride Containing Solutions. Corros. Sci. 2017, 120, 90–98. [Google Scholar] [CrossRef]
  19. Lei, X.; Feng, Y.; Zhang, J.; Fu, A.; Yin, C.; Macdonald, D.D. Impact of Reversed Austenite on the Pitting Corrosion Behavior of Super 13Cr Martensitic Stainless Steel. Electrochim. Acta 2016, 191, 640–650. [Google Scholar] [CrossRef]
  20. Turnbull, A. Modelling of Environment Assisted Cracking. Corros. Sci. 1993, 34, 921–960. [Google Scholar] [CrossRef]
  21. Martínez-Pañeda, E. Progress and Opportunities in Modelling Environmentally Assisted Cracking. arXiv 2021, arXiv:2108.00816. [Google Scholar]
  22. Sharland, S.M.; Tasker, P.W. A Mathematical Model of Crevice and Pitting Corrosion—I. The Physical Model. Corros. Sci. 1988, 28, 603–620. [Google Scholar] [CrossRef]
  23. Sarkar, S.; Aquino, W. Electroneutrality and Ionic Interactions in the Modeling of Mass Transport in Dilute Electrochemical Systems. Electrochim. Acta 2011, 56, 8969–8978. [Google Scholar] [CrossRef]
  24. Sun, X.; Srinivasan, J.; Kelly, R.G.; Duddu, R. Numerical Investigation of Critical Electrochemical Factors for Pitting Corrosion Using a Multi-Species Reactive Transport Model. Corros. Sci. 2021, 179, 109130. [Google Scholar] [CrossRef]
  25. Ståhle, P.; Hansen, E. Phase Field Modelling of Stress Corrosion. Eng. Fail. Anal. 2015, 47, 241–251. [Google Scholar] [CrossRef]
  26. Abubakar, A.A.; Akhtar, S.S.; Arif, A.F.M. Phase Field Modeling of V2O5 Hot Corrosion Kinetics in Thermal Barrier Coatings. Comput. Mater. Sci. 2015, 99, 105–116. [Google Scholar] [CrossRef]
  27. Mai, W.; Soghrati, S.; Buchheit, R.G. A Phase Field Model for Simulating the Pitting Corrosion. Corros. Sci. 2016, 110, 157–166. [Google Scholar] [CrossRef]
  28. Mai, W.; Soghrati, S. A Phase Field Model for Simulating the Stress Corrosion Cracking Initiated from Pits. Corros. Sci. 2017, 125, 87–98. [Google Scholar] [CrossRef]
  29. Ansari, T.Q.; Xiao, Z.; Hu, S.; Li, Y.; Luo, J.-L.; Shi, S.-Q. Phase-Field Model of Pitting Corrosion Kinetics in Metallic Materials. Npj Comput. Mater. 2018, 4, 38. [Google Scholar] [CrossRef]
  30. Gutman, E.M. An Inconsistency in “Film Rupture Model” of Stress Corrosion Cracking. Corros. Sci. 2007, 49, 2289–2302. [Google Scholar] [CrossRef]
  31. Scully, J.C. The Interaction of Strain-Rate and Repassivation Rate in Stress Corrosion Crack Propagation. Corros. Sci. 1980, 20, 997–1016. [Google Scholar] [CrossRef]
  32. Xu, D.; Ling, G.; Wang, H. Effect of Current Density on the Mechanical Properties and Defects of Nanocrystalline Cr Al Solid Solution Alloy Coatings. Surf. Coat. Technol. 2023, 461, 129424. [Google Scholar] [CrossRef]
  33. Xu, L.Y.; Cheng, Y.F. Development of a Finite Element Model for Simulation and Prediction of Mechanoelectrochemical Effect of Pipeline Corrosion. Corros. Sci. 2013, 73, 150–160. [Google Scholar] [CrossRef]
  34. Ansari, T.Q.; Luo, J.-L.; Shi, S.-Q. Modeling the Effect of Insoluble Corrosion Products on Pitting Corrosion Kinetics of Metals. NPJ Mater. Degrad. 2019, 3, 28. [Google Scholar] [CrossRef]
  35. Cui, C.; Ma, R.; Martínez-Pañeda, E. Electro-Chemo-Mechanical Phase Field Modeling of Localized Corrosion: Theory and COMSOL Implementation. Eng. Comput. 2023, 39, 3877–3894. [Google Scholar] [CrossRef]
  36. Liu, C.; Revilla, R.I.; Zhang, D.; Liu, Z.; Lutz, A.; Zhang, F.; Zhao, T.; Ma, H.; Li, X.; Terryn, H. Role of Al2O3 Inclusions on the Localized Corrosion of Q460NH Weathering Steel in Marine Environment. Corros. Sci. 2018, 138, 96–104. [Google Scholar] [CrossRef]
  37. Nishimoto, M.; Muto, I.; Sugawara, Y.; Hara, N. Passivity of (Mn,Cr)S Inclusions in Type 304 Stainless Steel: The Role of Cr and the Critical Concentration for Preventing Inclusion Dissolution in NaCl Solution. Corros. Sci. 2020, 176, 109060. [Google Scholar] [CrossRef]
  38. Zhao, Y.; Zhu, Z.; Zhao, X.; Tian, R.; Lei, Y.; Yu, P.; Peng, H.; Chen, L. Clarify the Effect of Reversed Austenite on the Pitting Corrosion Resistance of Super 13Cr Martensitic Stainless Steel. Corros. Sci. 2023, 213, 110992. [Google Scholar] [CrossRef]
  39. Sahu, S.; Frankel, G.S. Phase Field Modeling of Crystallographic Corrosion Pits. J. Electrochem. Soc. 2022, 169, 020557. [Google Scholar] [CrossRef]
  40. Wei, G.; Lu, S.; Li, S.; Yao, K.; Luan, H.; Fang, X. Unmasking of the Temperature Window and Mechanism for “Loss of Passivation” Effect of a Cr-13 Type Martensite Stainless Steel. Corros. Sci. 2020, 177, 108951. [Google Scholar] [CrossRef]
  41. Kayani, S.H.; Ha, H.-Y.; Cho, Y.-H.; Son, H.-W.; Lee, J.-M. Dislocation-Assisted Localised Pitting Corrosion Behaviour of Al Si Mg Cu Mn Alloy. Corros. Sci. 2023, 221, 111372. [Google Scholar] [CrossRef]
  42. Li, W.; Li, D.; Yu, Z.; Xie, Y.; Liu, F.; Jin, Y. A FEM Model for Simulating Trenching Process around a MnS Inclusion Embedded in Stainless Steel. J. Electroanal. Chem. 2021, 882, 114977. [Google Scholar] [CrossRef]
  43. Nohira, H.; Tsai, W.; Besling, W.; Young, E.; Petry, J.; Conard, T.; Vandervorst, W.; De Gendt, S.; Heyns, M.; Maes, J.; et al. Characterization of ALCVD-Al2O3 and ZrO2 Layer Using X-Ray Photoelectron Spectroscopy. J. Non-Cryst. Solids 2002, 303, 83–87. [Google Scholar] [CrossRef]
  44. Huang, X.; Li, X.; Zhan, Z.; Xiao, K.; Fang, X.; Li, Z. Effect of Long-Term Pre-Oxidation on the Corrosion Rate of 316L Stainless Steel in a High-Temperature Water Environment. J. Mater. Eng. Perform. 2022, 31, 7935–7944. [Google Scholar] [CrossRef]
  45. Yue, X.; Zhang, L.; Wang, Y.; Xu, S.; Wang, C.; Lu, M.; Neville, A.; Hua, Y. Evolution and Characterization of the Film Formed on Super 13Cr Stainless Steel in CO2-Saturated Formation Water at High Temperature. Corros. Sci. 2020, 163, 108277. [Google Scholar] [CrossRef]
  46. Li, X.; Zhao, W.; Shi, S.; Wang, M.; Li, J.; Xu, X.; Sun, J. Corrosion Product Film Formation Mechanism of 110H-13Cr Casing Steel in Simulated Ultra-High-Temperature Gas Environment for Shale Oil Production. Corros. Sci. 2024, 226, 111662. [Google Scholar] [CrossRef]
  47. Duan, X.; Han, T.; Guan, X.; Wang, Y.; Su, H.; Ming, K.; Wang, J.; Zheng, S. Cooperative Effect of Cr and Al Elements on Passivation Enhancement of Eutectic High-Entropy Alloy AlCoCrFeNi2.1 with Precipitates. J. Mater. Sci. Technol. 2023, 136, 97–108. [Google Scholar] [CrossRef]
  48. Zhang, B.; Wang, J.; Wu, B.; Guo, X.W.; Wang, Y.J.; Chen, D.; Zhang, Y.C.; Du, K.; Oguzie, E.E.; Ma, X.L. Unmasking Chloride Attack on the Passive Film of Metals. Nat. Commun. 2018, 9, 2559. [Google Scholar] [CrossRef]
Figure 1. Finite element geometric model of pitting corrosion.
Coatings 14 00435 g001
Figure 2. Cloud diagrams depicting the current density vector in the electrolyte distribution in pits with three different diameter-to-depth ratios: (a) 1:1, (b) 1:3, and (c) 1:5.
Coatings 14 00435 g002
Figure 3. Electrolyte potential in pits with different depth-to-diameter ratios: (a) 1:1; (b) 1:3; (c) 1:5.
Coatings 14 00435 g003
Figure 4. Fe2+ distribution and flow direction in pits with different depth-to-diameter ratios: (a) 1:1; (b) 1:3; (c) 1:5.
Coatings 14 00435 g004
Figure 5. Cl distribution and flow direction in pits with three different depth-to-diameter ratios: (a) 1:1; (b) 1:3; (c) 1:5.
Coatings 14 00435 g005
Figure 6. Electrolyte pH values for pits with different depth-to-diameter ratios: (a) 1:1; (b) 1:3; (c) 1:5.
Coatings 14 00435 g006
Figure 7. Corrosion rates at different positions within pits: (a) top; (b) middle; (c) bottom.
Coatings 14 00435 g007
Figure 8. Corrosion rates for pits with different depth-to-diameter ratios.
Coatings 14 00435 g008
Figure 9. XPS spectra of 13Cr stainless steel surface after immersion experiments. (a) C1s, (b) O1s, (c) Fe2p3/2, (d) Cr2p3/2.
Coatings 14 00435 g009
Figure 10. Pitting corrosion morphology and EDS maps of 13Cr surfaces.
Coatings 14 00435 g010
Table 1. Chemical composition of S13Cr MSS (wt.%).
CSiMnPSCrNiMoFe
0.0170.230.490.0120.004313.35.011.85Bal.
Table 2. Simulated environmental soaking solution: composition, temperature, and immersion duration.
Full-Life-Cycle EnvironmentComposition/mg·L−1pHTemperature/°CTime
Live acid (LA)10%HCl + 1.5%HF + 3%HAc + 5%TG201 corrosion inhibitor10%~20% acid solution1204 h
Spent acid (SA)K+/1597.32, Ca2+/11,693.00, Mg2+/3145.63, Cl/62,738.01, Fe2+/52.402.61805 d
Condensate water (CW)K+/7380, Ca2+/4.745, Mg2+/2.463, Na+/1050, HCO3−/4310, Cl/2990, SO42−/8627.7918010 d
Formation water (FW)K+/6620, Ca2+/8310, Mg2+/561, Na+/76,500, HCO3−/189, Cl/128,000, SO42−/4306.9818015, 30, 60 and 90 d
Disclaimer/Publisher’s Note: The statements, opinions and data contained in all publications are solely those of the individual author(s) and contributor(s) and not of MDPI and/or the editor(s). MDPI and/or the editor(s) disclaim responsibility for any injury to people or property resulting from any ideas, methods, instructions or products referred to in the content.

