Article

Formation Mechanism of Ti–Si Multi-Layer Coatings on the Surface of Ti–6Al–4V Alloy

1
State Key Laboratory of Advanced Processing and Recycling of Nonferrous Metals, School of Materials Science and Engineering, Lanzhou University of Technology, Lanzhou 730050, China
2
College of Physics and Electronic Engineering, Northwest Normal University, Lanzhou 730070, China
3
The Joint Institute of Mechanical Engineering, National Academy of Sciences of Belarus, 220072 Minsk, Belarus
*
Author to whom correspondence should be addressed.
Coatings 2024, 14(4), 450; https://doi.org/10.3390/coatings14040450
Submission received: 12 March 2024 / Revised: 2 April 2024 / Accepted: 3 April 2024 / Published: 9 April 2024
(This article belongs to the Section Surface Characterization, Deposition and Modification)

Abstract

:
Titanium alloys are widely used in aerospace applications due to their high specific strength and exceptional corrosion resistance. In this study, a silicide coating with a multi-layer structure was designed and prepared via a pack cementation process to improve the high-temperature oxidation resistance of titanium alloy. A new theory based on the Le Chatelier’s principle is proposed to explain the generation mechanism of active Si atoms. Taking the chemical potential as a bridge, a functional model of the relationship between the diffusion driving force and the change in the Gibbs free energy of reaction diffusion is established. Experimental results indicate that the depth of the silicide coating increases with the siliconization temperature (1000–1100 °C) and time (0–5 h). The multi-layer coating prepared at 1075 °C for 3 h exhibits a thick and dense structure with a thickness of 23.52 μm. This coating consists of an outer layer of TiSi2 (9.40 μm), a middle layer of TiSi (3.36 μm), and an inner layer of Ti5Si3 (10.76 μm). Under this preparation parameter, increasing the temperature or prolonging the holding time will cause the outward diffusion flux of atoms in the substrate to be much larger than the diffusion flux of silicon atoms to the substrate, thus forming pores in the coating. The calculated value of the diffusion driving force FTiSi = 2.012S is significantly smaller than that of F TiSi 2 = 13.120S and F Ti 5 Si 3 = 14.552S, which perfectly reveals the relationship between the thickness of each layer in the Ti–Si multi-layer coating.

1. Introduction

The demand for high-performance materials is increasing in modern industries, particularly in harsh service environments such as high temperature, high pressure, and corrosion, where material stability is crucial for engineering applications [1,2,3]. Titanium alloys are extensively utilized in fields such as aero-engines and shipbuilding due to their high specific strength, high specific stiffness, and excellent corrosion resistance [4]. However, titanium alloys still face significant challenges at higher temperatures [5]. To address this issue, researchers have employed various surface modification techniques such as thermal spraying [6], laser cladding [7], and pack cementation [8] to create coatings on titanium alloy surfaces, achieving significant advancements.
Compared with other methods, the microstructure of the coating prepared by the pack cementation process is uniform and dense, and there is a high-strength metallurgical bonding between the coating and the substrate [9]. This method has the advantages of low cost and easy operation, and it is not limited by the shape and size of the workpiece. This technique has found extensive applications in the preparation of titanium alloy surfaces with aluminide coatings [10,11], boride coatings [12,13,14], and silicide coatings [15]. Among them, the silicide coating shows good thermal stability and high-temperature oxidation resistance. At high temperatures, the SiO2 film formed on the coating’s surface exhibits mobility and self-healing ability, making it suitable for protecting titanium alloy parts in high-temperature environments [16]. Huang et al. [17] prepared a silicide coating on the surface of TC4 alloy via a pack cementation process. The coating exhibits a gradient structure with TiSi2 as the outer layer, TiSi as the intermediate layer, and Ti5Si3 and Ti5Si4 as the inner layer. This gradient structure significantly enhances the high-temperature oxidation resistance of the titanium alloy. Li et al. [18] prepared a silicide coating composed of TiSi2, Ti5Si3, and Ti5Si4 on the surface of TiAl alloy. Their findings revealed that a dense oxide film consisting of SiO2 and Al2O3 formed on the coating’s surface during high-temperature exposure at 1000 °C. The oxidation rate constants of the coatings were approximately two orders of magnitude lower than those of pure TiAl alloys, indicating that the Ti–Si series of coatings can serve as an effective antioxidant layer for Ti-based alloys. In summary, the silicide multi-layer coating prepared on the surface of titanium alloy has good high-temperature oxidation resistance. However, the growth mechanism of the silicide layer related to thickness distribution and microstructure are still unclear, which is crucial for the high-temperature service performance of the coatings [19].
In this study, the pack cementation process was used to prepare a multi-layer silicide coating on the surface of Ti–6Al–4V alloy. The optimal preparation parameters were determined by controlling the diffusion temperature and holding time. By analyzing the thermodynamic and kinetic growth conditions of silicide coatings, the formation mechanism of the multi-layer coatings was revealed. A relationship model between the thermodynamics of diffusion reaction and the thickness of each layer in the Ti–Si multi-layer coating was constructed based on the driving force of diffusion. This study is expected to provide a theoretical basis for the growth mechanism of the coating prepared by the pack cementation process.

2. Experimental

2.1. Sample Preparation

The substrate material is TC4 (Ti–6Al–4V) titanium alloy, which is an α + β-type titanium alloy, and its main chemical composition is shown in Table 1. The sample was prepared into blocks measuring 10 mm × 10 mm × 5 mm using wire cutting. Before the experiment, the surface of the substrate was sanded using 240#, 400#, 600#, 800#, and 1200# sandpaper to remove the oxide film. The sanded substrate was then cleaned using ultrasonic cleaning in acetone, alcohol, and deionized water.
Experiments were conducted to prepare the coatings using the pack cementation process. The pack mixtures consisted of 15Si–6NaF–79Al2O3 (wt. %), with Si powder as the donor source, NaF powder as the activator, and Al2O3 powder as the filler. To ensure proper mixing, the pack mixtures were ball-milled using a planetary ball mill at 300 r/min for 6 h. The specimens were then placed in an alumina crucible containing the pack powder, sealed with a high-temperature binder, and placed in a tube furnace [20]. The furnace was heated to the desired temperature at a ramp rate of 10 °C/min, with nitrogen passed through as a protective gas. The optimum temperature for sample preparation was determined using the univariate optimum-seeking method, based on previous experimental explorations by the authors and the group. The growth behavior of the silicide coatings was then investigated at the optimum temperature, with the parameters of the coating preparation shown in Table 2.

2.2. Characterization

After sample preparation, the surface-attached impurities were removed through sequential ultrasonic cleaning in acetone, alcohol, and deionized water. The physical phase composition of the silicide coatings was determined using a Bruker D8 ADVANCE X-ray diffractometer (XRD, Cu target, 40 kV, Bruker, Karlsruhe, Germany). The scanning range was set from 10° to 80° with a step size of 0.02° and a scanning speed of 2°/min. The surface micromorphology of the coatings was characterized using secondary electron imaging (SEI) in a Quanta FEG 450 (FEI Company, Hillsboro, OR, USA) scanning electron microscope. Backscattered electron imaging (BSEI, FEI Company, Hillsboro, OR, USA) was employed to analyze the coating cross-section, and energy-dispersive spectroscope (EDS, FEI Company, Hillsboro, OR, USA) was used to examine the distribution of each element. The thickness of the silicide coating at each experimental point was calculated as the average of six measurements.
The XRD results in this paper were analyzed using Rietveld refinement with Full Prof software (https://www.ill.eu/sites/fullprof/php/downloads.html). The red scatter plots (Yobs) represent the raw data, the black lines (Ycalc) represent the fitted data, the green scatter plots (Bragg position) indicate the positions of the XRD diffraction peaks of the corresponding phases, and the blue lines (Diff) indicate the accuracy of the fitted data. The fitted lines of the XRD spectra in this paper are generally flat, with only slight fluctuations at some peaks. The overall fit is good, and the fitted data are in good agreement with the original data. The quality of the Rietveld refinement results can also be assessed using metrics such as Rwp (weighted graphical residual variance factor), Rp (graphical residual variance factor), Rexp (expected residual variance factor), and S2 [21,22,23]. The expressions for Rwp, Rp, Rexp, and S2 are as follows [24]:
R wp = 100 i = 1 , n ω i y i y ci 2 / i = 1 , n ω i y i 2 1 2
R p = 100 i = 1 , n y i y ci / i = 1 , n y i
R exp = 100 ( n p ) / i ω i y i 2
S 2 = R wp / R exp 2
where yi represents the observed intensity at a certain 2θ, yci is the calculated intensity at the same angle, ωi is 1/yi, n represents the number of diffraction data points, and p is the number of the refined parameters.
A smaller value of the R factor indicates better refinement. In this paper, the Rwp values range from 11.7% to 14.4%, which meets the criterion of Rwp < 15% [25]. This suggests that the results are highly accurate and reliable.

3. Coating Preparation and Growth Mechanism

3.1. Effect of Temperatures on Ti–Si Coatings

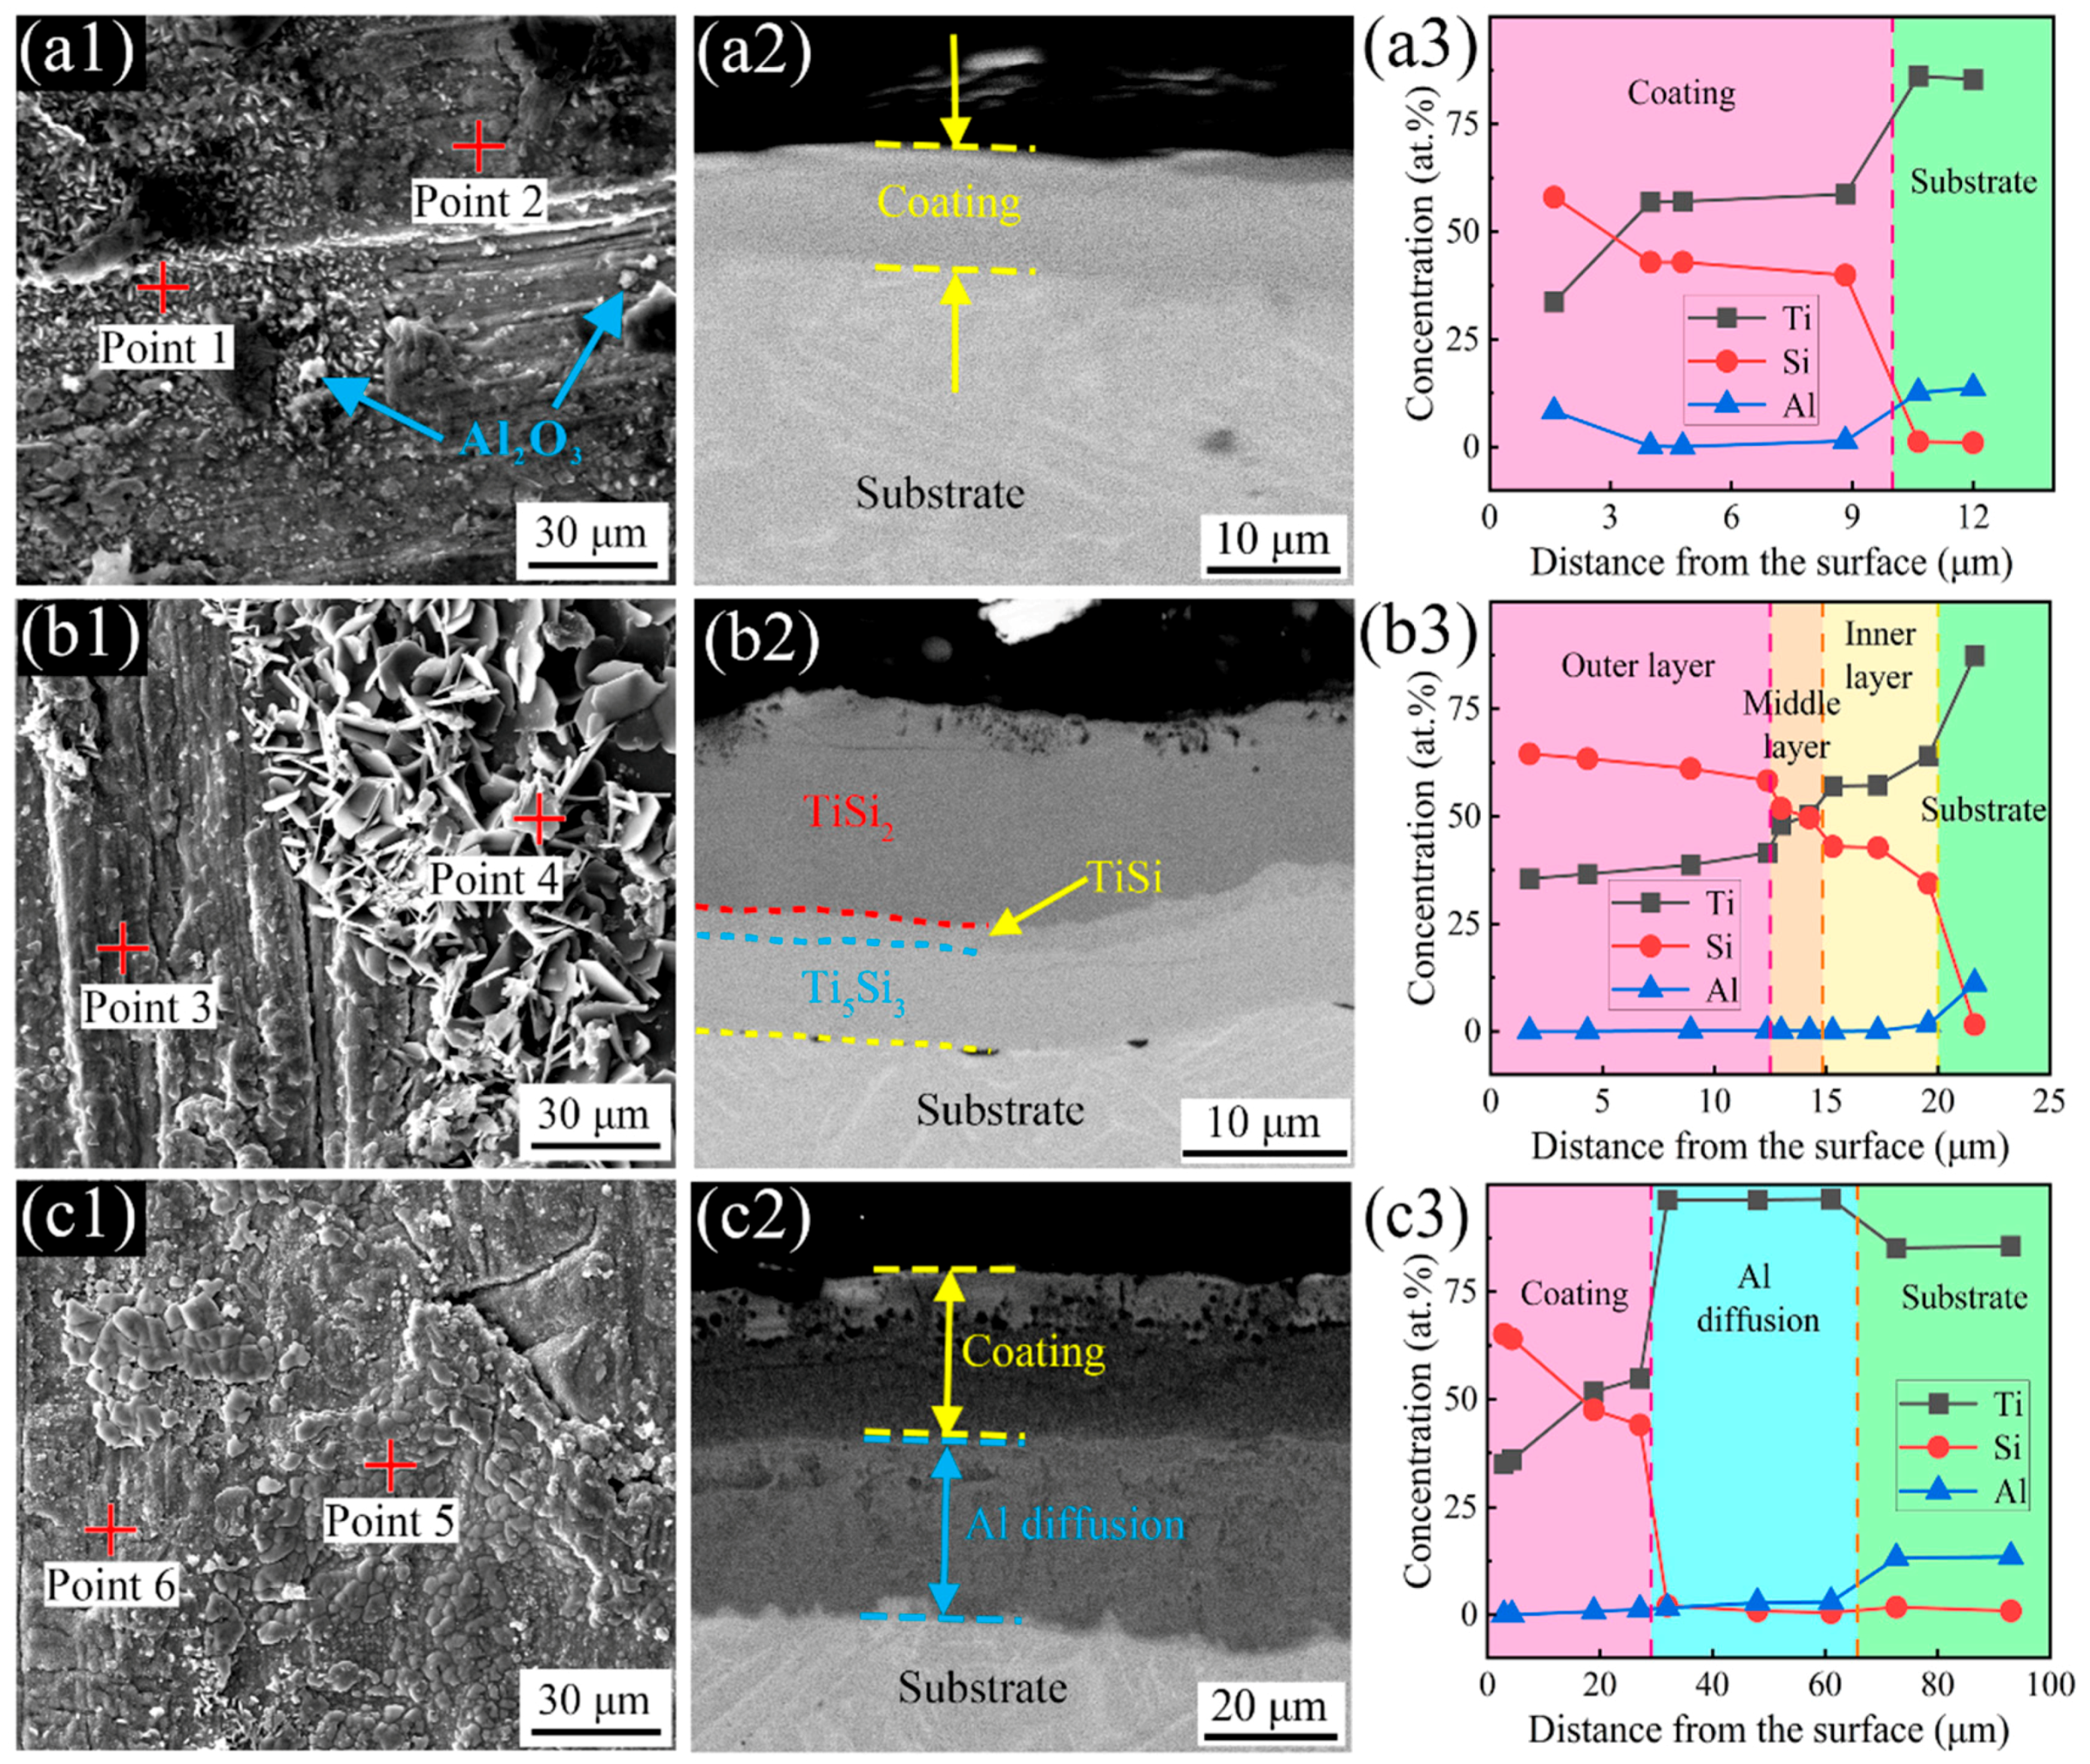
Figure 1 presents the surface, cross-section, and corresponding EDS analysis of the composite coatings after being held at temperatures of 1000 °C, 1050 °C, and 1100 °C for 3 h. The EDS results for the surface are provided in Table 3. At 1000 °C, there were white dot-like particles observed on the sample surface. According to the EDS (Figure 1(a1) and point 1 in Table 3) and XRD results in Figure 2, these punctate particles are Al2O3. Point 2 in Figure 1(a1) exhibited high concentrations of Ti and Si, with a composition ratio close to 1:1. On the surface of the sample prepared at 1050 °C (Figure 1(b1) and point 3 in Table 3), a significant amount of Ti and Si was found, with a composition ratio close to 1:2. The results of EDS and XRD indicate that the flaky structure in Figure 1(b1) is Al2O3, which aligns with the findings of Pang et al. [26]. At 1100 °C, point 5 in Figure 1(c1) exhibited higher oxygen content and lower silicon content. Combining this with the XRD analysis, it can be inferred that this area contains a considerable amount of TiO. Point 6 in Figure 1(c1) exhibited a large number of Ti and Si, with an atomic ratio of about 1:2.
Cross-sectional SEM images and EDS analysis show that the thickness of the coating increases with increasing temperature. The coatings prepared at 1000 °C (Figure 1(a2,a3)) have a thickness of approximately 10 μm. The Si content decreases as the coating depth increases. The coatings prepared at 1050 °C (Figure 1(b2,b3)) have a thickness of around 20 μm and exhibit a distinct three-layer phase structure. Through EDS analysis, it can be determined that the coating consists of an outer layer of TiSi2 measuring 12.5 μm, an intermediate layer of TiSi measuring 2.35 μm, and an inner layer of Ti5Si3 measuring 5.15 μm. This coating demonstrates a typical gradient structure with a homogeneous and dense structure. At 1100 °C, a silicide coating with a thickness of approximately 25 μm forms on the substrate surface (Figure 1(c2,c3)). It is worth mentioning that it is not the original TC4 titanium alloy substrate that is in contact with the silicide coating, but rather the titanium-enriched area with a thickness of about 33 μm, which has an Al and Si content close to 0. This is because the Al atoms in the substrate keep diffusing outward at high temperatures, while the Si atoms do not diffuse into the substrate in time, resulting in the formation of a titanium-enriched area.
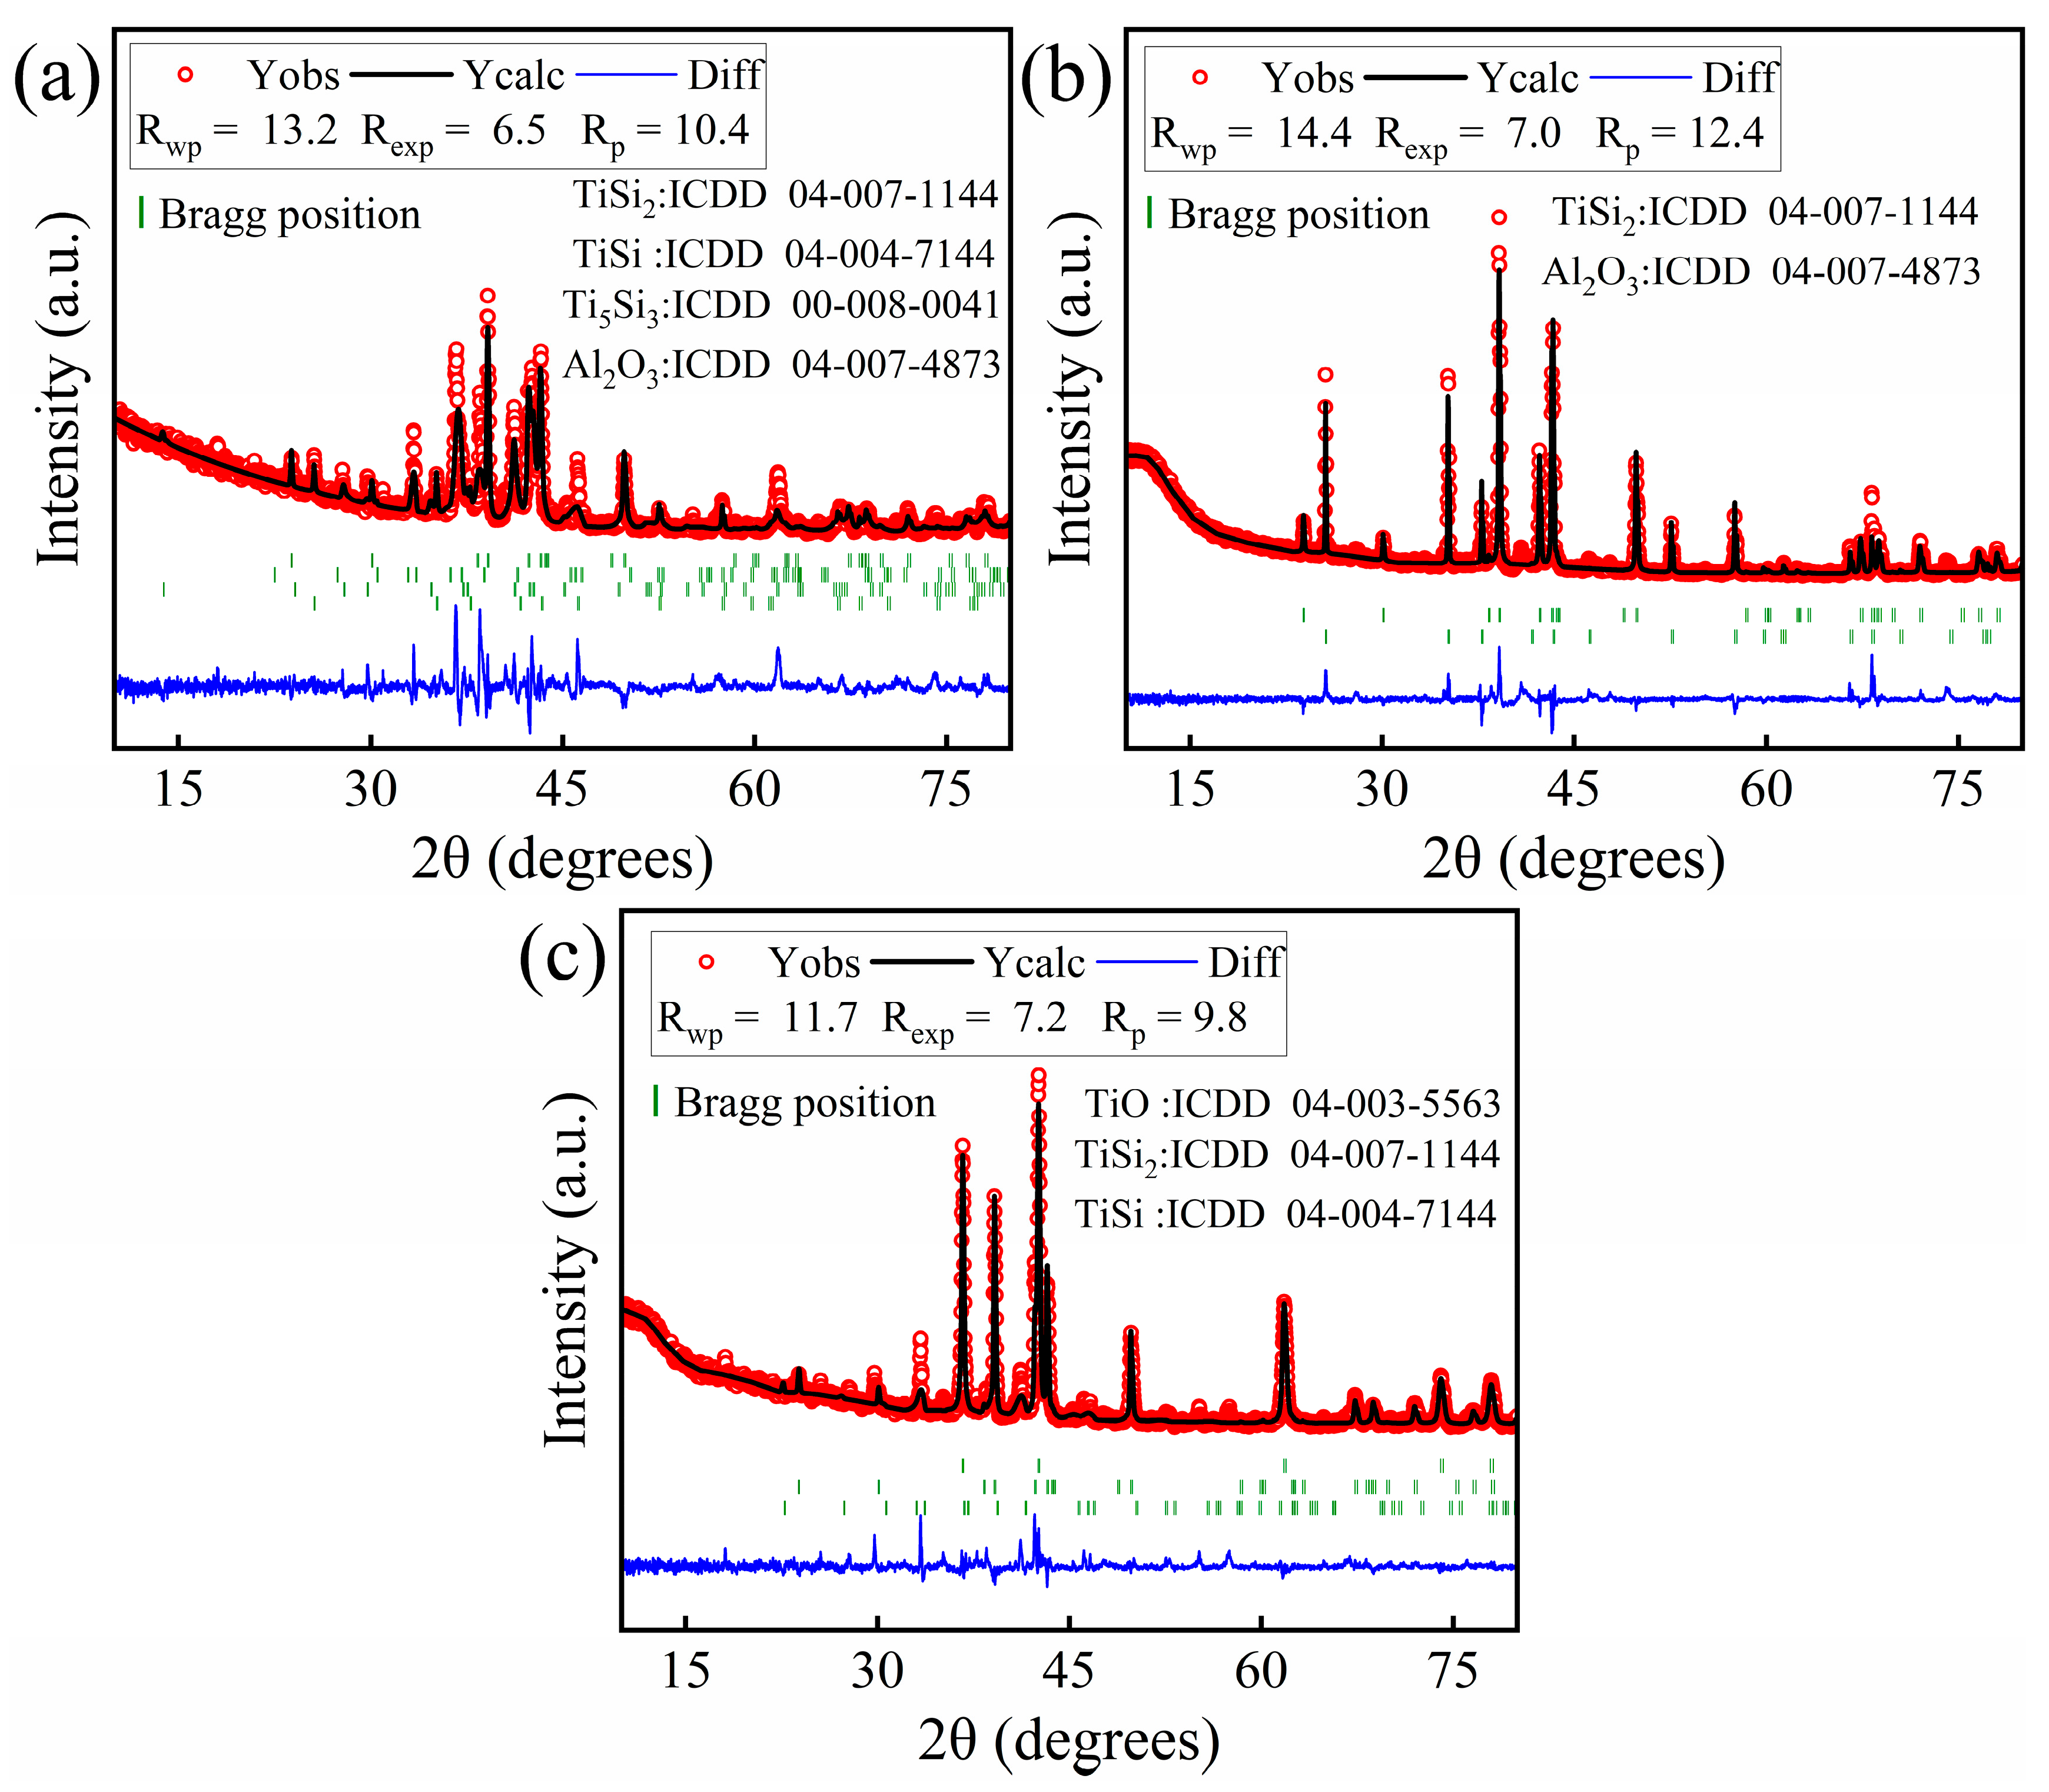
The Rietveld refinement results of XRD on the coating surface after holding at different temperatures (1000 °C, 1050 °C, and 1100 °C) for 3 h are presented in Figure 2. The surface of the coating prepared at 1000 °C primarily consists of TiSi2 (ICDD 04-007-1144), TiSi (ICDD 04-004-7144), Ti5Si3 (ICDD 00-008-0041), and Al2O3 (ICDD 04-007-4873). The TiSi phase accounts for 70.29 wt. % (Table 4). In contrast, the surface of the coatings prepared at 1050 °C only contains two phases, TiSi2 and Al2O3, with a significant increase in their content to 41.55 wt. % and 58.45 wt. %, respectively, compared to 1000 °C. The surface of the samples prepared by holding them at 1100 °C for 3 h exhibits a significant presence of TiO (ICDD 04-003-5563), with a content of 54.60 wt. %. Compared to 1050 °C, the TiSi2 content decreases, and a small amount of TiSi is additionally present.
At a temperature of 1000 °C, the coating is primarily composed of TiSi2, TiSi, and Ti5Si3 phases, with a small amount of Al2O3 present on the surface. This is due to the outward growth of the coating, which results in part of the Al2O3 used as a filler being bonded to the surface of the coating [4,27]. The flaky Al2O3 that adheres to the sample surface at 1050 °C is formed through the reaction of aluminum atoms diffusing outward within the substrate with the remaining oxygen in the crucible. At 1100 °C, the number of reactive aluminum atoms significantly increases due to the higher temperature, leading to a substantial rise in the rate of outward diffusion of Al atoms within the substrate. The diffusion activation energy can be described by the following empirical equations, which are numerically equivalent [28]:
Q = 32 T m
where Q denotes the diffusion activation energy of the atom and Tm indicates the melting point of the substance.
The melting point of Si is significantly higher than that of Al, resulting in a greater required activation energy for the diffusion of silicon atoms. Although an increase in temperature enhances the diffusion rate of active silicon atoms, it is much less influenced by temperature compared to aluminum atoms. Consequently, the diffusion rate of silicon atoms is considerably lower than that of aluminum atoms, leading to the formation of a Ti enrichment zone in the internal region near the coating. Moreover, the temperature rise accelerates the diffusion rate of silicon atoms, but the supply of active silicon atoms becomes insufficient. As a result, the internally diffused silicon atoms can only be provided by the outer layer of TiSi2, which facilitates the conversion of TiSi2 to TiSi. The reaction principle can be summarized as follows:
Ti Si 2 = TiSi + [ Si ]
Therefore, XRD at 1100 °C detected some TiSi.
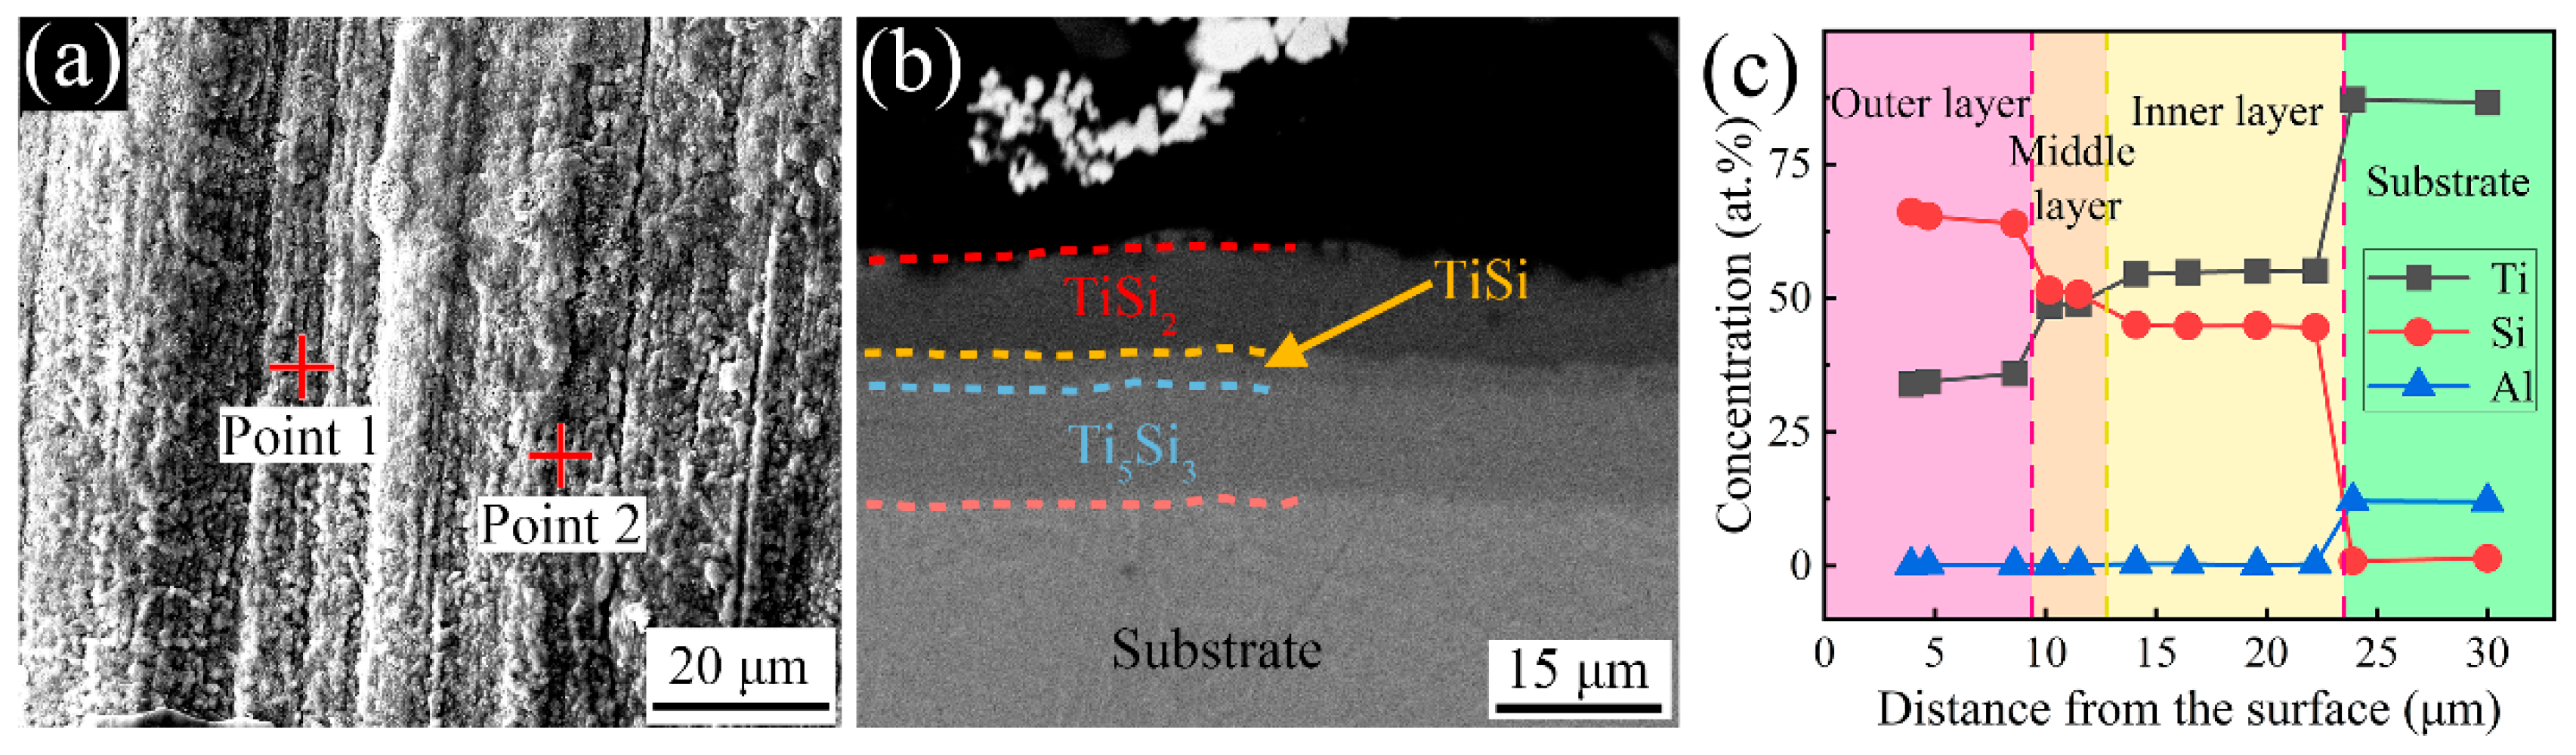
Based on the experimental results, considering the structure of the coating (uniform densification) and the preparation efficiency (fast coating growth), the temperature was increased to 1075 °C to ensure higher densification and prepare thicker coatings. The cross-section of the coatings held at 1075 °C for 3 h and the corresponding spot scan results are shown in Figure 3. Compared with the cross-section of the coatings held at 1050 °C for 3 h, the coatings prepared at 1075 °C for the same holding time also exhibited good homogeneity and densification, with a significant increase in thickness. Therefore, the optimal temperature for preparing silicide coatings on TC4 titanium alloy was determined to be 1075 °C.

3.2. Effect of Holding Time on Ti–Si Coatings

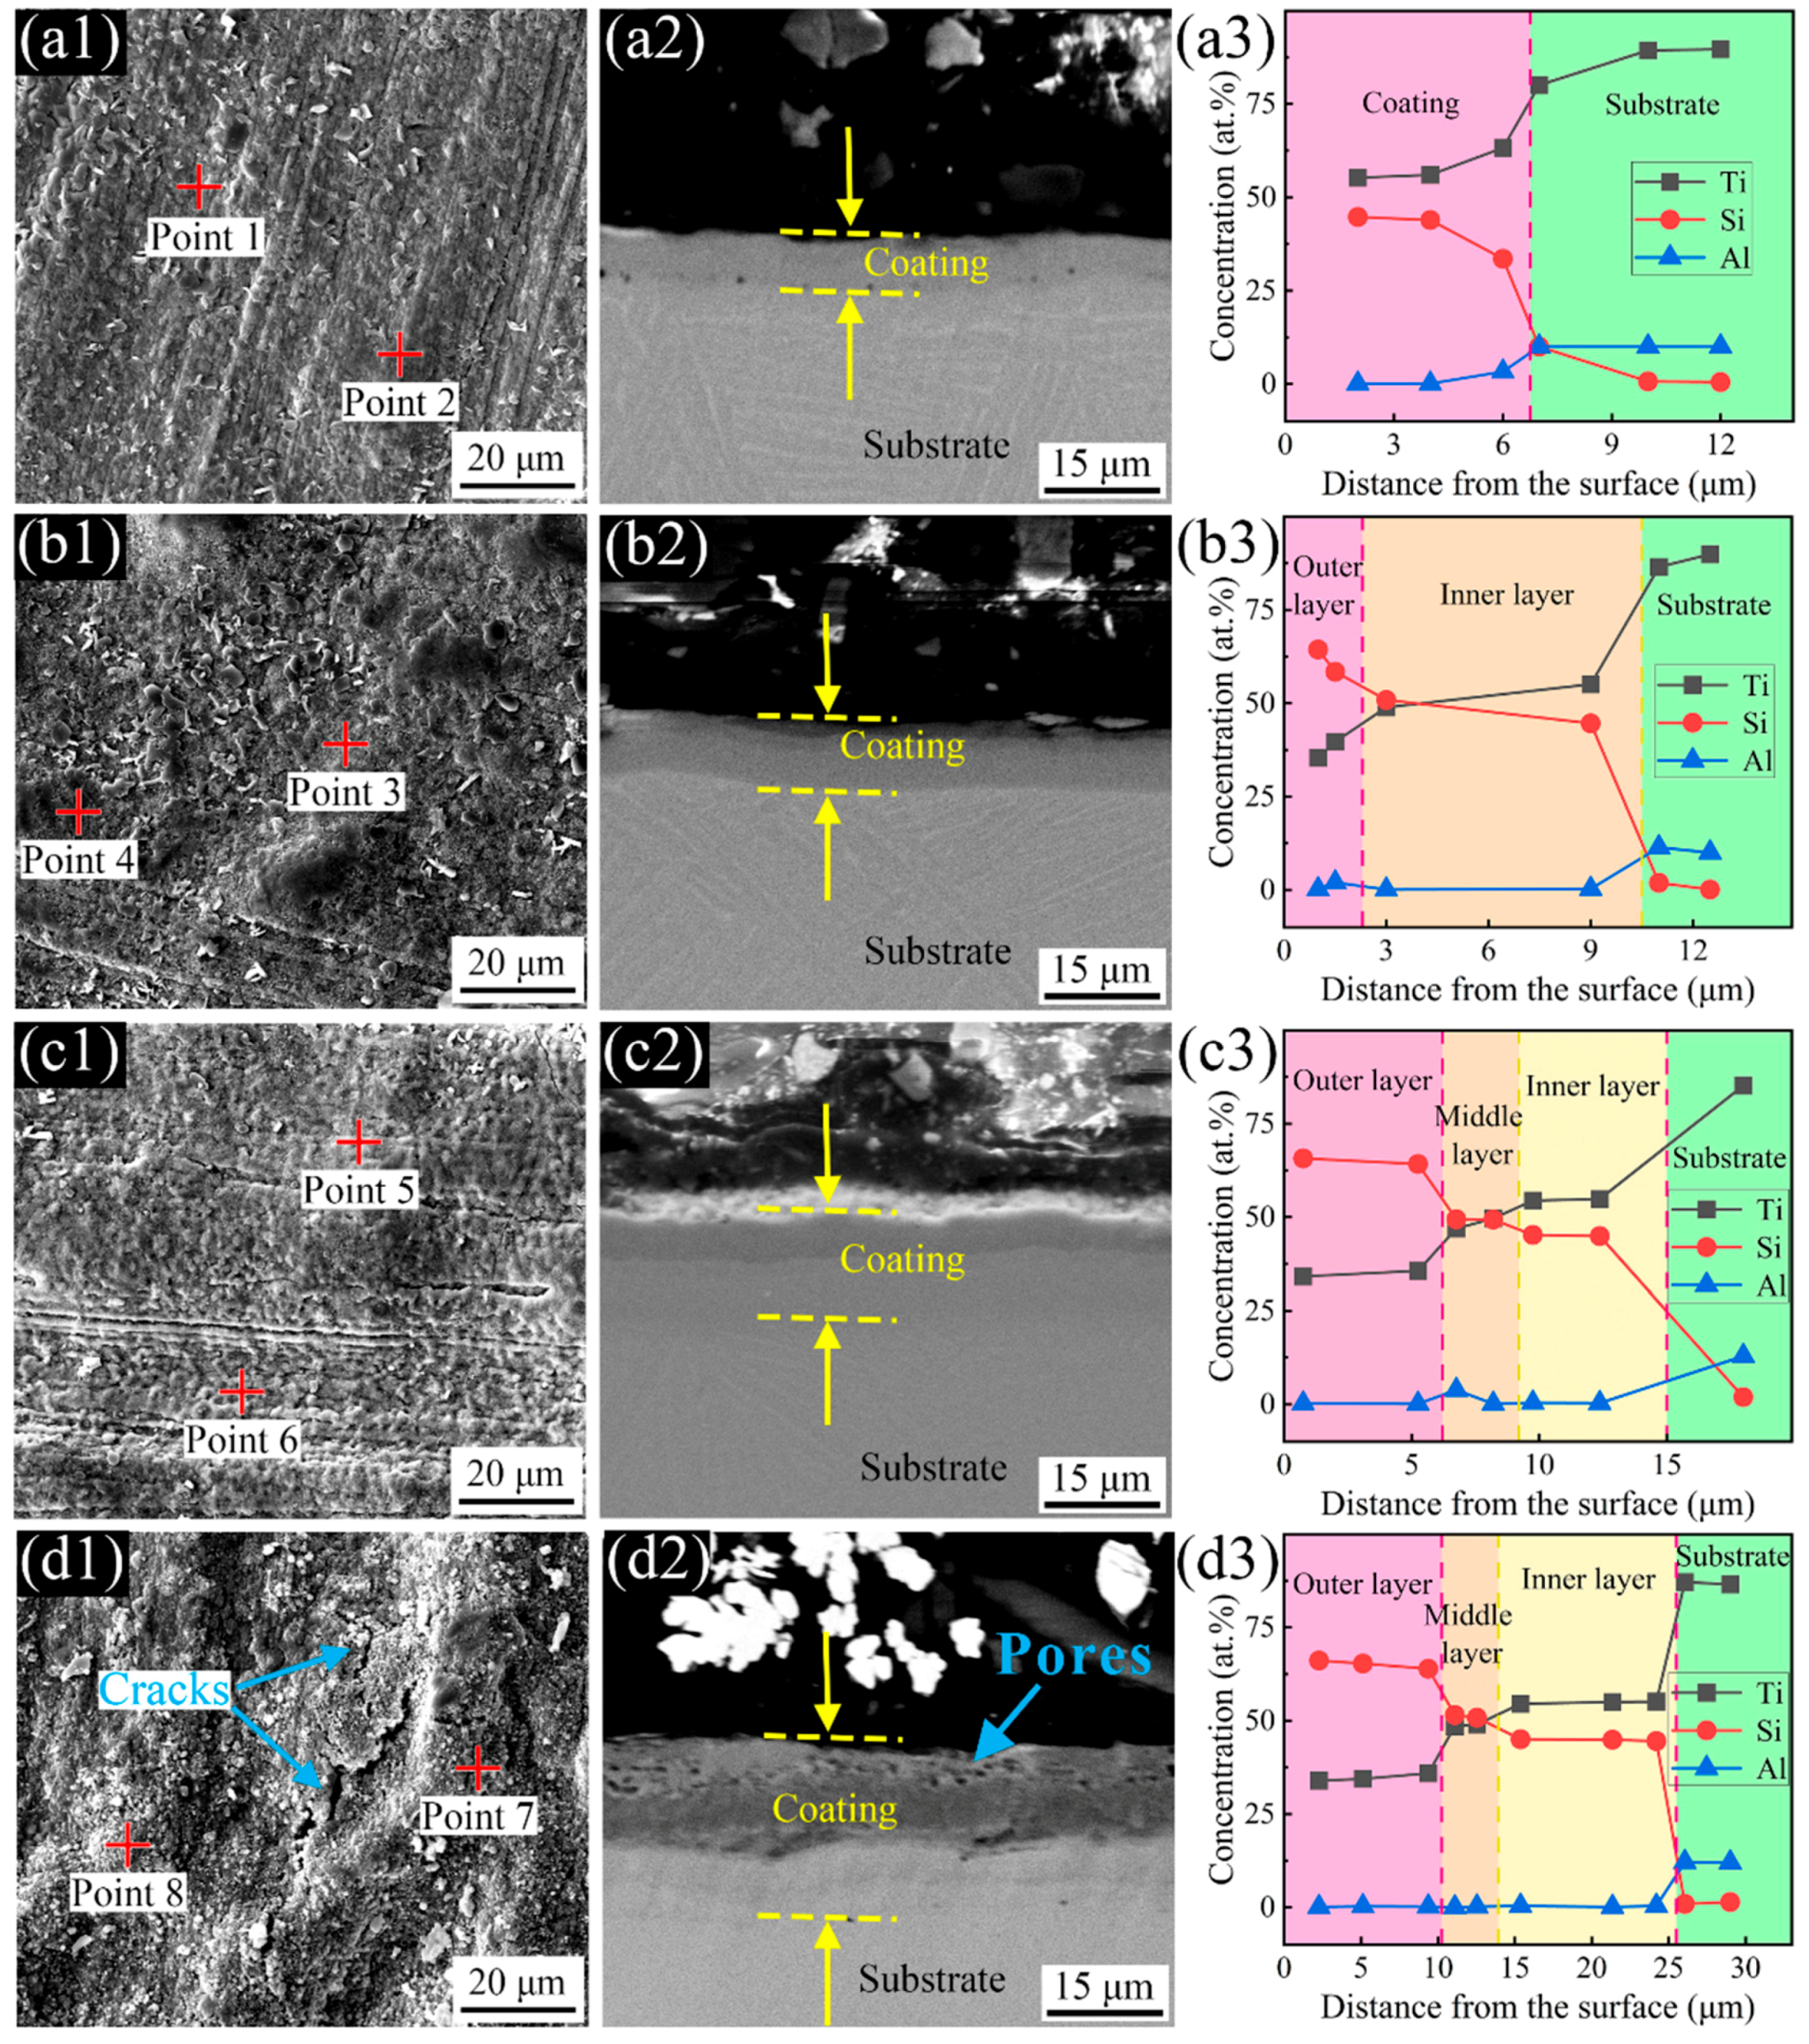
Figure 4 presents the surface and cross-section of the coatings prepared at 1075 °C with different holding times, along with the corresponding cross-section EDS results. By combining the surface SEM and EDS analysis (Figure 4 and Table 5 and Table 6), it is observed that at a temperature of 1075 °C, without heat preservation (Figure 4(a1)), the Si content at point 1 on the sample surface is only 6.7%, indicating that the coating may not have formed at this position. The content of Ti and Si at point 2 is close to 1:1, indicating that TiSi is generated at this position, which is also well confirmed by XRD results (Figure 5a). Combined with XRD, TiSi2 and TiSi are formed on the surface after heat preservation for 0.5 h. When the holding time exceeds 1 h, the coating surface is completely covered by TiSi2.
The cross-sectional morphology of the coatings and the EDS results in Figure 4 indicate that the thickness of the coating gradually increases with the holding time. Initially, at 0 h of holding time, the coating is approximately 7 μm thick and does not exhibit a clear phase interface. After 0.5 h, the coating thickness increases to about 10.5 μm and a noticeable phase interface becomes evident. The thickness further increases to approximately 15 μm at 1 h. When the holding time is extended to 3 h (Figure 3), the coating exhibits a three-layer phase structure as observed in the cross-section. The cross-section EDS results confirm that the three-layer coating with a gradient structure consists of a 9.4 μm TiSi2 outer layer, a 3.36 μm TiSi middle layer, and a 10.76 μm Ti5Si3 inner layer. However, when the holding time is extended to 5 h, the coating develops numerous pores. This can be attributed to the excessive holding time, which depletes the activated silicon atoms within the pack mixtures, making it challenging to provide enough activated silicon atoms. Meanwhile, a significant amount of titanium and aluminum atoms still exist in the substrate and diffuse outward due to the gradient of the chemical potential at high temperatures. Consequently, the diffusion flux of titanium and aluminum atoms to the outside becomes much larger than the diffusion flux of silicon atoms to the inside, resulting in the formation of pores in the coating [29,30].
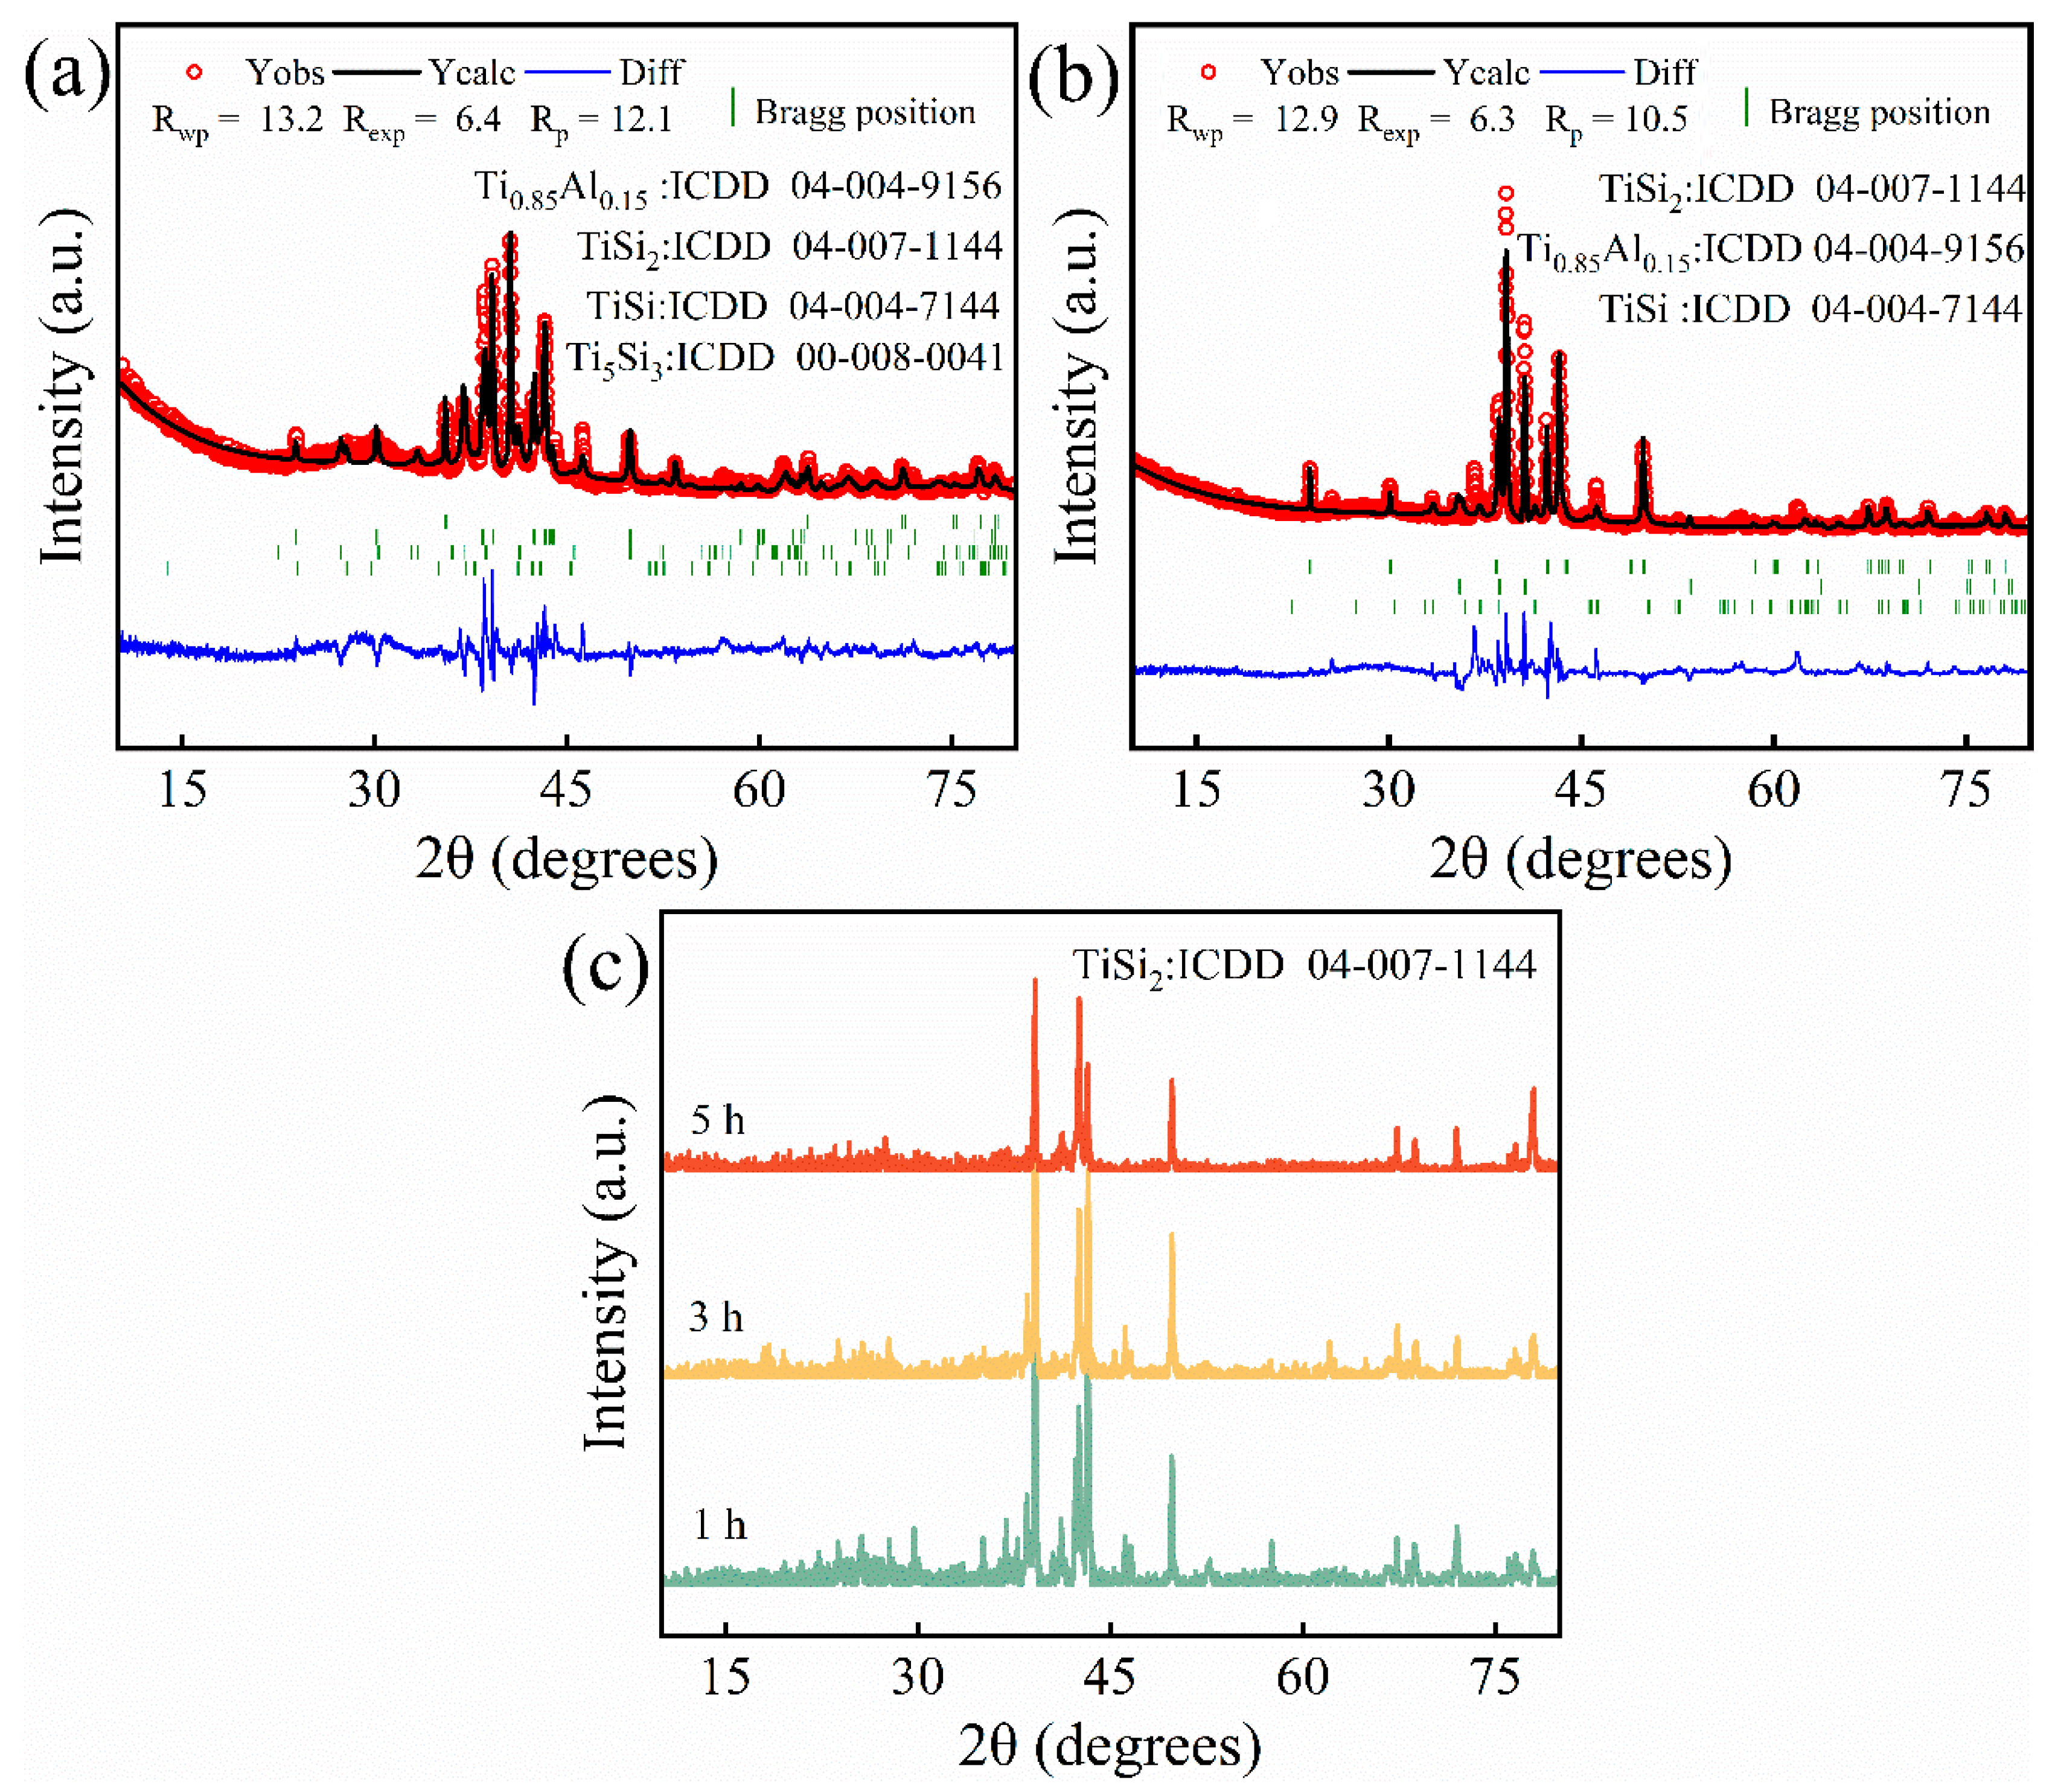
By analyzing the XRD patterns of the coating surfaces at different holding times, it can be observed that at the holding time of 0 h (Figure 5a), the coating surface mainly consists of Ti0.85Al0.15, TiSi2, TiSi, and Ti5Si3. The content of each phase was determined through XRD refinement (Table 7). The results indicate that the total amount of TiSi2, TiSi, and Ti5Si3 is less than 10 wt. %, suggesting that the substrate surface is not yet fully covered by the silicide coating. It is important to note that the area not covered by the coating is not the TC4 titanium alloy substrate, but rather Ti0.85Al0.15 containing 15 at. % Al. A search of crystallographic documents revealed that this structure arises from the substitution of 15% of the titanium atoms in the pure Ti crystal cells with aluminum atoms. As the holding time was extended to 0.5 h, the phase composition of the coating surface was transformed into TiSi2, Ti0.85Al0.15, and TiSi (Figure 5b). The TiSi2 phase constitutes a high proportion of 66.95 wt. %, while the content of the bare Ti0.85Al0.15 phase decreases to 27.25 wt. %. This suggests that after 0.5 h of growth, the TiSi2 phase, which is preferentially formed by the coating, gradually covers the substrate surface, and a small amount of TiSi phase also develops. With the holding time extended to 1 h, 3 h, and 5 h (Figure 5c), only TiSi2 is observed on the coating surface. This is attributed to the limited penetration depth of X-rays and the gradual increase in coating thickness with the extension of the holding time. X-rays are unable to penetrate the single-phase TiSi2 region in the outermost layer of the coating [31,32]. Hence, after a holding time of more than 1 h, only the TiSi2 can be detected on the coating surface by XRD.

3.3. Growth Mechanism of Ti–Si Composite Coatings

The process of pack cementation involves two main stages: gas-phase reaction and solid-state diffusion [33]. In the gas-phase reaction stage, the silicon powder produces active silicon atoms under the action of the activator. In the solid-state diffusion stage, the active atoms are deposited onto the substrate surface and interdiffused with the substrate, gradually forming Ti–Si intermetallic compounds.

3.3.1. Gas Phase Reaction

The application of the Gibbs free energy criterion is limited to systems that are under isothermal and isobaric conditions [34,35]. However, in the pack cementation process, the system is always in an isothermal and isovolumetric state with changing pressure. As a result, employing ΔG as a criterion for chemical reactions within pack mixtures has certain limitations. In this study, a new theory based on Le Chatelier’s principle is proposed to explain the generation mechanism of active Si atoms.
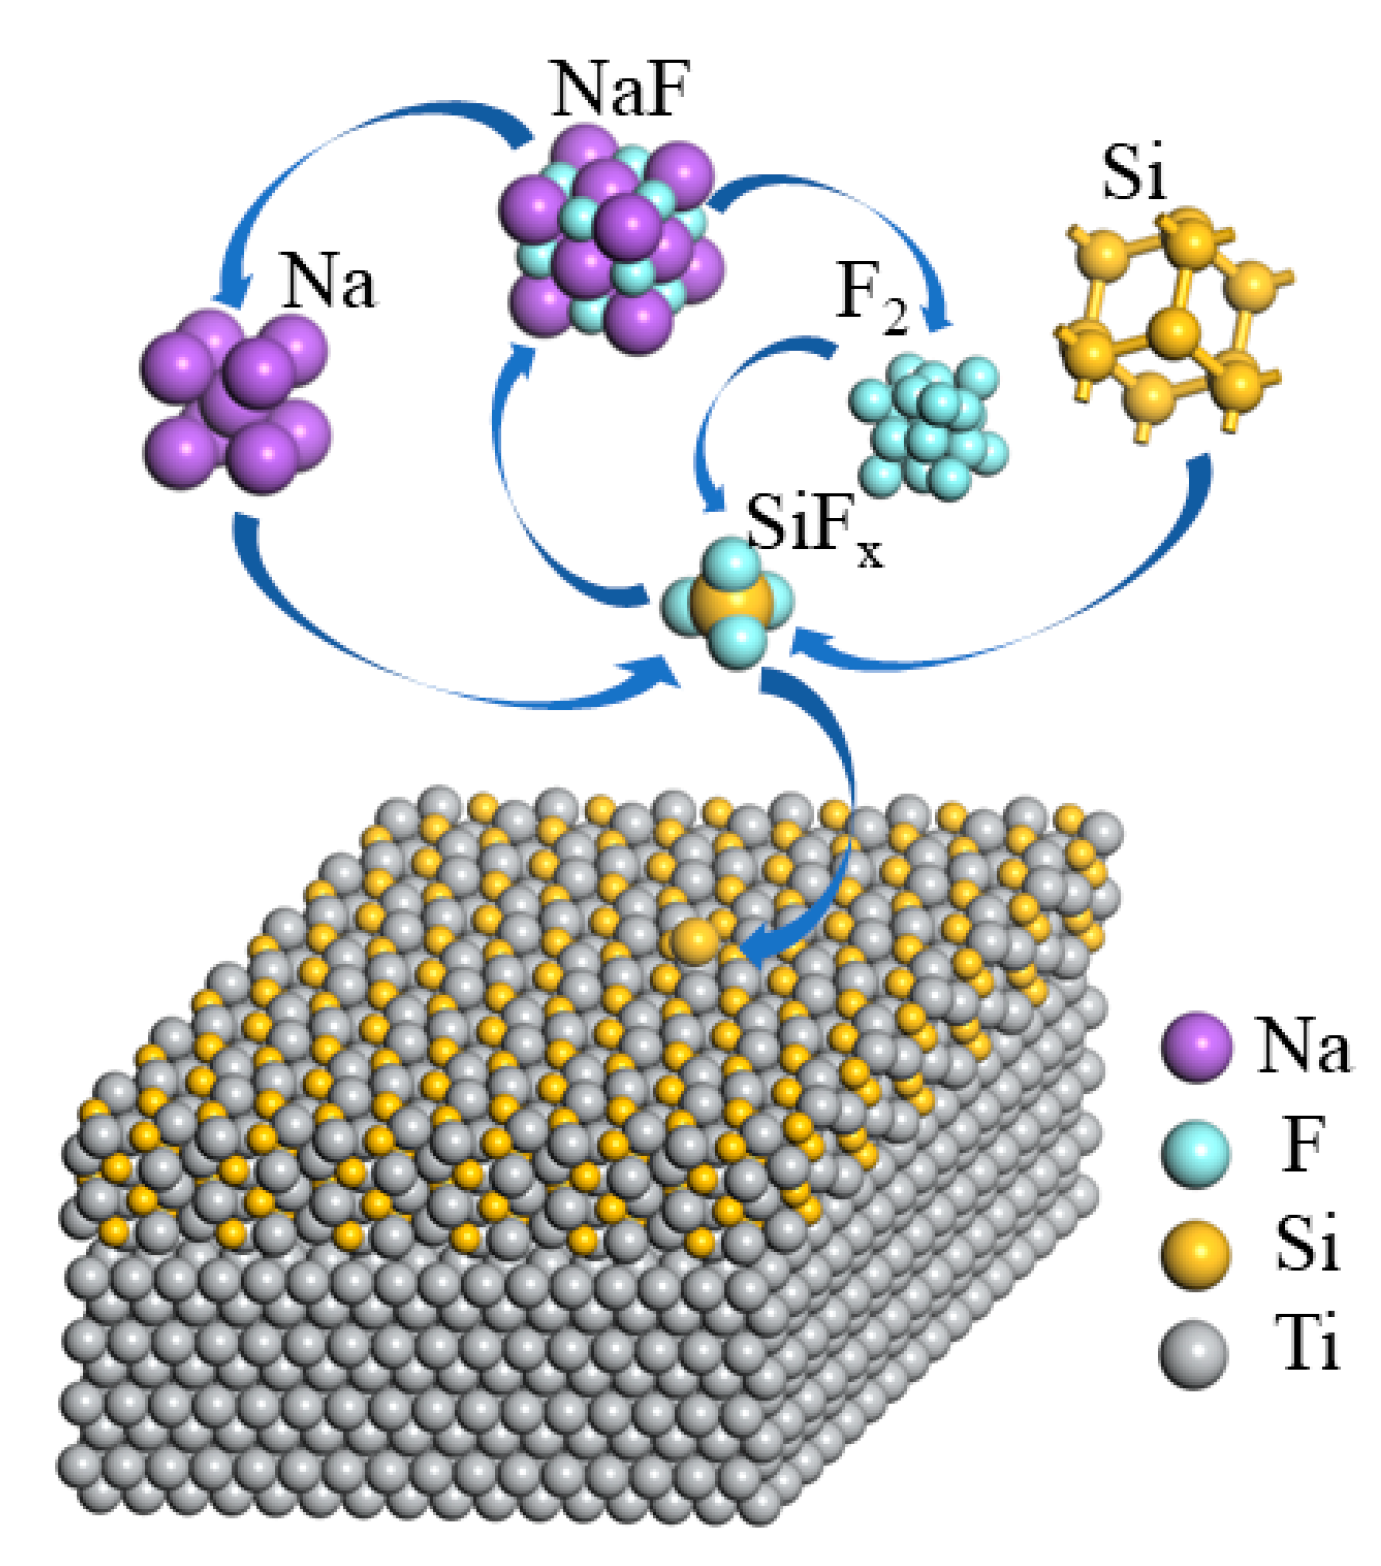
Figure 6 presents a schematic diagram illustrating the mechanism of activated atom generation. In the pack cementation process, the rise in temperature leads to the conversion of NaF into a gaseous state and decomposition [36]:
NaF s = NaF g
2 NaF g = 2 Na ( g ) + F 2 ( g )
In the pack mixtures, reactive silicon atoms [Si] react with the halide gas produced by the decomposition of NaF to form the gaseous halide SiFx (x = 1, 2, 3, 4) in the following reaction:
F 2 ( g ) + 2 [ Si ] ( s ) = 2 SiF ( g )
F 2 ( g ) + [ Si ] ( s ) = Si F 2 ( g )
3 F 2 ( g ) + 2 [ Si ] ( s ) = 2 Si F 3 ( g )
2 F 2 ( g ) + [ Si ] ( s ) = Si F 4 ( g )
Later, silicon atoms are transported to the surface of the titanium alloy substrate by relying on the mobility of gaseous SiFx. They then undergo a replacement reaction with Na, which is generated from the previous stage of thermal decomposition. The generated [Si] atoms are adsorbed by the regions of the substrate with high surface energy, leading to the occurrence of the following reactions:
SiF ( g ) + Na ( g ) = NaF ( g ) + [ Si ]
Si F 2 ( g ) + 2 Na ( g ) = 2 NaF ( g ) + [ Si ]
Si F 3 g + 3 Na g = 3 NaF ( g ) + Si
Si F 4 ( g ) + 4 Na ( g ) = 4 NaF ( g ) + Si
The resulting NaF undergoes decomposition, repeating reactions (7)–(16) to continuously produce [Si].
During the diffusion of [Si] into the substrate, there is a continuous depletion of [Si] adsorbed on the surface of the substrate. As a result, the equilibrium of reactions (13)–(16) shifts toward the production of [Si], leading to a decrease in the amount of SiFx in the system. This decrease facilitates the occurrence of reactions (9)–(12). The same reason also promotes the occurrence of reactions (7) and (8), where the reactant NaF is supplied by reactions (13)–(16). It can be observed that the reactions involving NaF form a closed loop, and the driving force for this closed-loop reaction originates from the diffusion of [Si] from the surface of the substrate into the body of the substrate, resulting in a chemical potential difference.

3.3.2. Solid-State Diffusion Phase

In an isothermal and isocapacitated closed system, ΔA (change in Helmholtz free energy) is commonly used to determine the likelihood of a reaction occurring [37]:
A = U     T S
However, changes in pressure within the system will have little effect on solid-state diffusion:
Δ PV 0
Consequently, the following applies:
A = U T S U + Δ PV T S = G
Therefore, ΔG can be used as a thermodynamic criterion for the solid-state diffusion phase transition. 
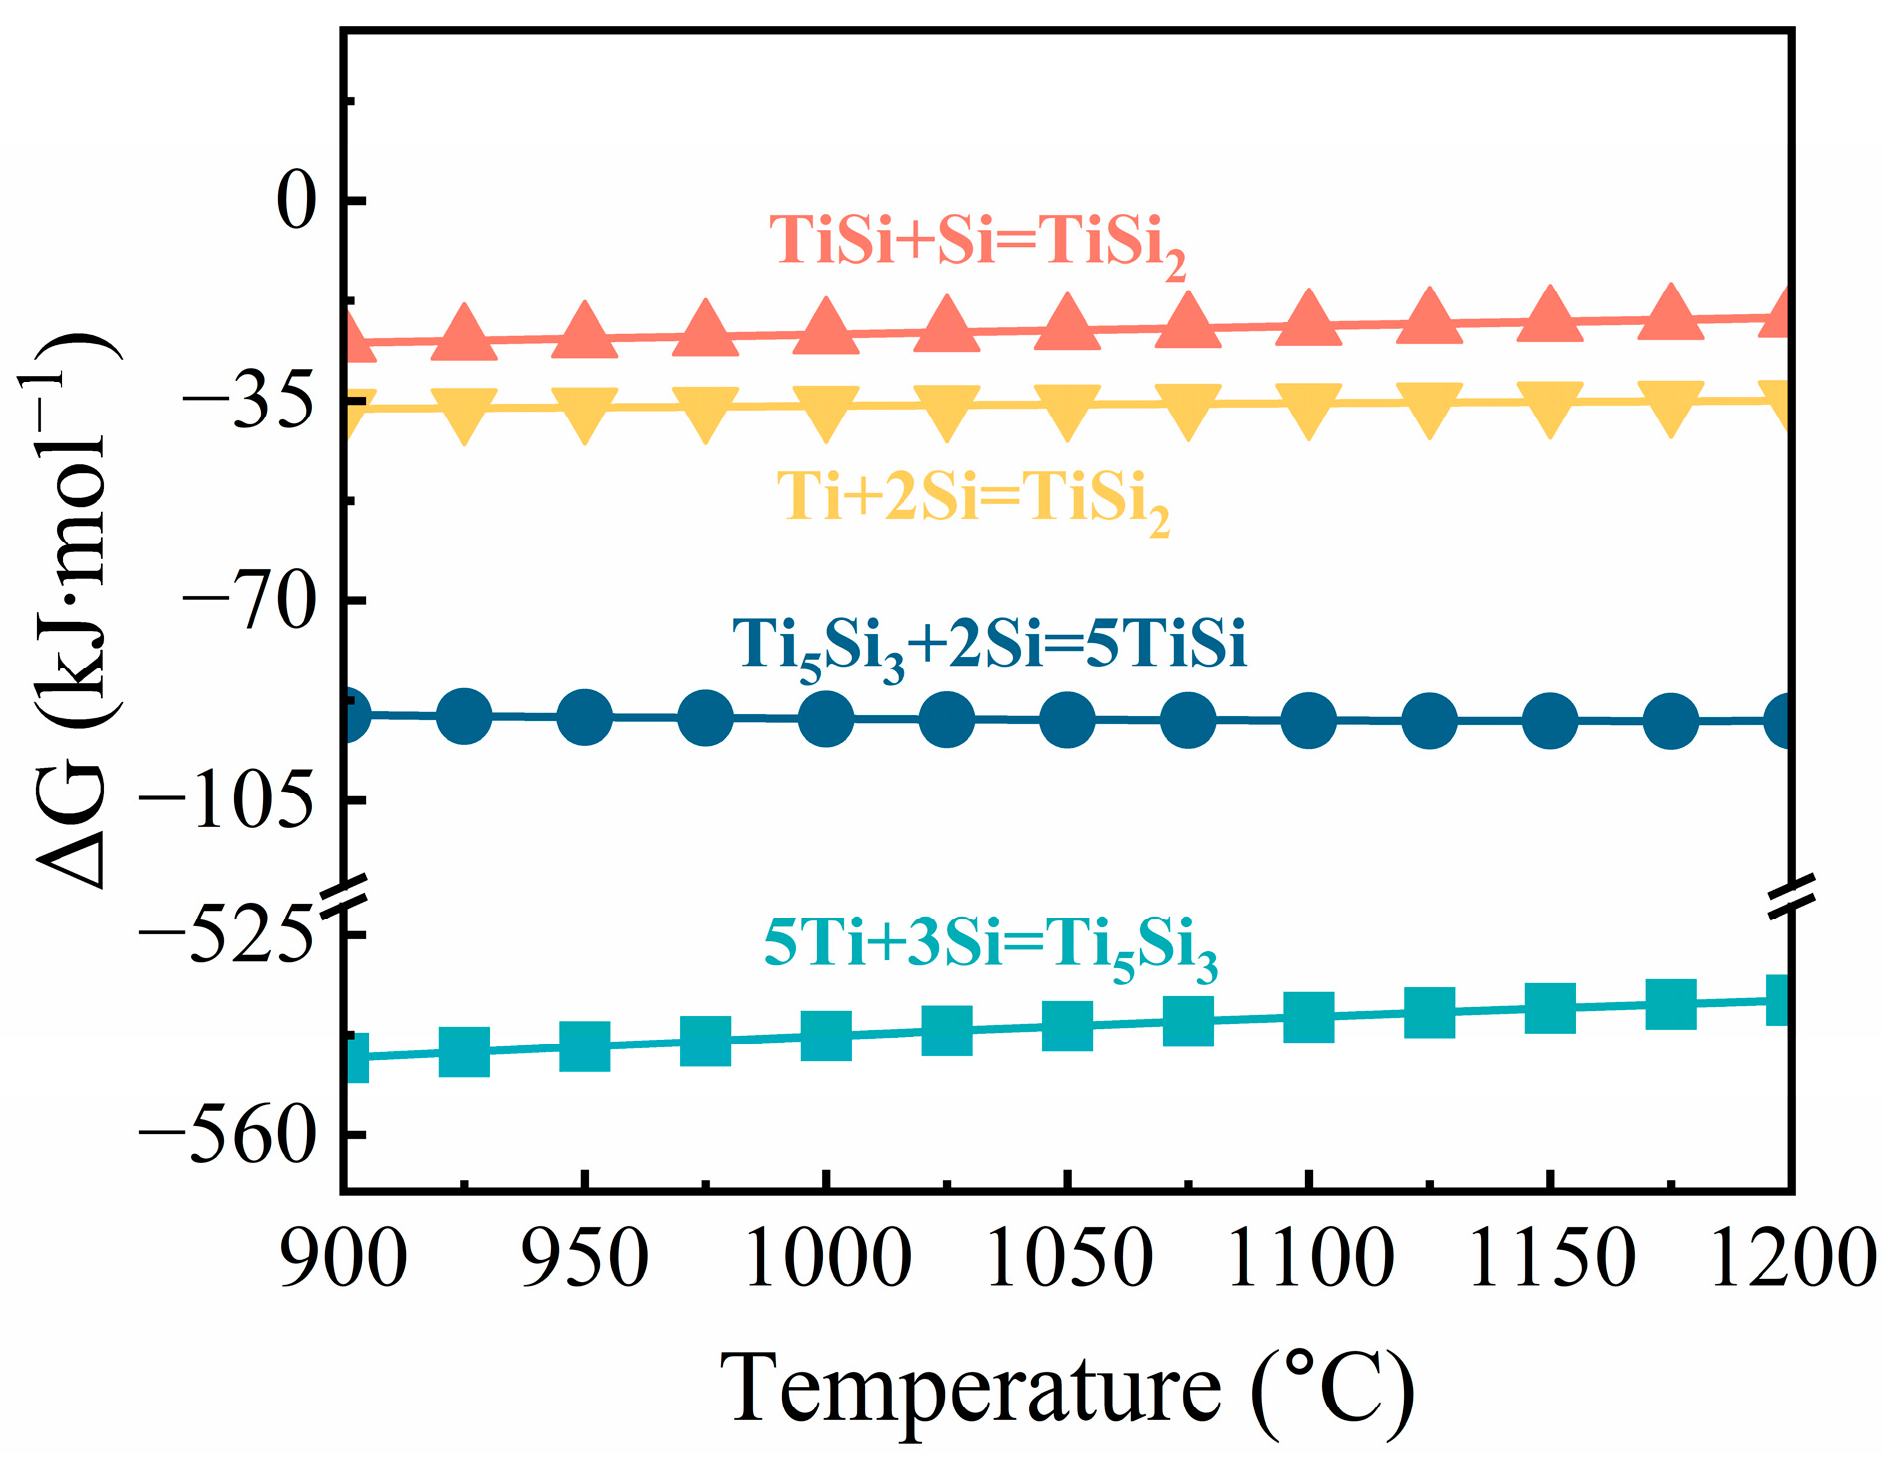
Figure 7 shows the ΔG of TiSi2, TiSi, and Ti5Si3 formed at 900 °C to 1200 °C. As can be seen from the figure, the ΔG is less than 0 kJ·mol−1. It is thermodynamically determined that all the following reactions can occur.
The [Si] deposited on the surface of the substrate at the beginning of the diffusion reaction diffuses into the substrate driven by the chemical potential gradient. This diffusion process leads to the gradual formation of a coating with a multi-layer structure consisting of TiSi2, TiSi, and Ti5Si3. Ti5Si3 is produced in the innermost layer of the coating with the following reaction principle [4]:
5 Ti + 3 [ Si ] = Ti 5 Si 3
The intermediate layer TiSi is generated by the reactive diffusion of [Si] into the Ti5Si3 phase by the following reaction:
Ti 5 Si 3 + 2 [ Si ] = 5 TiSi
The outer TiSi2 is produced by reactive diffusion of [Si] into the TiSi phase on one hand (Reaction (22)), and on the other hand, [Si] reacts directly with Ti diffused into the substrate surface to produce TiSi2 (Reaction (23)):
TiSi + [ Si ] = TiSi 2
Ti + 2 [ Si ] = TiSi 2
Based on the experimental results (Figure 3 and Figure 4), it is evident that the coating exhibits a three-layer structure. The thicknesses of the Ti5Si3 phase in the inner layer and the TiSi2 phase in the outer layer are notably greater than those of the TiSi phase in the middle layer. This phenomenon is due to the difference in the diffusion driving force, which can be demonstrated by calculating the chemical potential gradient (∇μ) [38]. In this study, a computational model for the diffusion driving force F was developed.
The modeling assumptions are as follows:
  • During the growth of the coating, the phase interfaces maintain a planar and parallel arrangement with the surface.
  • In the initial state, there is a small thickness present in all phases, and the atoms are uniformly distributed within the same phase [39,40].
Modeling:
For the reaction diffusion process, the mechanism of production of the product C can be expressed by the chemical reaction equation as follows:
xA + yB + · · · = zC
where x, y, and z are the reaction equation leveling coefficients. A, B, and C denote reactants and products. Then, the n mol reaction can be expressed as follows:
nxA + nyB + · · · = nzC
The amount of change in chemical potential (Δμ) in the reaction can be expressed as follows:
μ = μ C μ A , B , = G C n ( G A + G B + ) n = ( G C G A G B ) n = G n
The chemical potential gradient for reaction diffusion can be derived from the change in chemical potential Δμ versus distance d0:
μ = μ d 0
where d0 represents the average distance over which the atoms diffuse in a 1 mol reaction. The volume of the phase change due to reaction diffusion is denoted by V, the thickness of the phase change induced is denoted by h, and the surface area of the sample is denoted by S. Then, the following applies:
d = 1 2 h = v 2 s
By substituting Formulas (26) and (28) into Formula (27), the following is obtained:
μ = G n d 0 = 2 G n V 0 2 S = 2 S 2 G n V 0
The driving force of reaction diffusion F is as follows:
F = μ
There is the following relationship between the driving force of reaction diffusion F, the average velocity of diffusion v, the volume of phase changes due to diffusion V, and the thickness of the coating h:
F v V h
As a result, a relationship between h and ΔG was established.
The validation of the results is as follows:
In the present study, ΔG and the volume of products V were calculated for reactions (11)–(14) at 1075 °C for holding time t as shown in Table 8.
The data were brought into the above model to calculate the chemical potential gradient that produces each phase of the material during the coating growth process:
μ Ti 5 Si 3 = 2 S 2 G 1 n 1 V 0 , 1   = 2 S 7.276 = 14.552 S
μ TiSi = 2 S 2 G 2 n 2 V 0 , 2 = 2 S 1.006 = 2.012 S
μ Ti Si 2 = 2 S 2 G 3 n 3 V 0 , 3 + 2 S 2 G 4 n 4 V 0 , 4 = 2 S 0.854 + 2 S 5.706 = 13.120 S
Then, the driving force F is as follows:
F Ti 5 Si 3 = μ Ti 5 Si 3 = 14.552 S
F TiSi = μ TiSi = 2.012 S
F Ti Si 2 = μ Ti Si 2 = 13.120 S
It can be seen that F Ti 5 Si 3 and F Ti Si 2 are much larger than FTiSi. The thickness h of each phase in the coating is proportional to the driving force F of diffusion. Consequently, the TiSi2 and Ti5Si3 phases exhibit greater thickness, while the TiSi phase consistently remains thinner in the three-layer coatings investigated in this study.

4. Conclusions

In this study, the optimal process parameters for preparing multi-layer silicide coatings on the surface of TC4 titanium alloy were determined by controlling the temperature and holding time. The growth thermodynamics and kinetics of the coating were analyzed in depth. The following conclusions were drawn:
(1)
The silicide coatings prepared at different temperatures and holding times exhibit a similar gradient structure. The multi-layer silicide coating prepared at 1075 °C for 3 h demonstrates a thick and dense structure. The coating has a total thickness of 23.52 μm, with an outer layer of TiSi2 measuring 9.4 μm, an intermediate layer of TiSi measuring 3.36 μm, and an inner layer of Ti5Si3 measuring 10.76 μm.
(2)
Based on the optimal preparation parameters of holding at 1075 °C for 3 h, increasing the temperature or prolonging the holding time will lead to the formation of pores inside the coating. This can be attributed to the fact that the outward diffusion flux of atoms in the substrate is much larger than the diffusion flux of Si atoms into the substrate.
(2)
A model was constructed to examine the relationship between the thermodynamics of reaction diffusion and the thickness of each layer in the Ti–Si multi-layer coating. The calculation results indicate that the driving force of solid diffusion FTiSi = 2.012S at 1075 °C is significantly smaller than that of F Ti Si 2 = 13.120S and F Ti 5 Si 3 = 14.552S, which explains why the TiSi2 and Ti5Si3 phases are thicker than TiSi phase.

Author Contributions

Conceptualization, B.C. and G.L.; methodology, Y.Z. and G.L.; software, Y.Z.; investigation, X.Z. (Xudong Zhao); resources, W.L., U.S., and Z.V.; data curation, Y.Z.; writing—original draft preparation, Y.Z.; writing—review and editing, B.C. and W.L.; visualization, X.Z. (Xinjian Zhang) and G.L.; supervision, B.C.; project administration, W.L.; funding acquisition, W.L. All authors have read and agreed to the published version of the manuscript.

Funding

This research is jointly supported by the Major Project of Science and Technology of Gansu (21ZD4DA017), the National Key Research and Development Program (2022YFE0121900), the program of science and technology international cooperation demonstrative base of metal surface engineering along the silk road (2017D01003), and the “111” project (D21032).

Institutional Review Board Statement

Not applicable.

Informed Consent Statement

Not applicable.

Data Availability Statement

Data are contained within the article.

Conflicts of Interest

The authors declare no conflicts of interest.

References

  1. Shishkin, R.A.; Yuferov, Y.U. A novel SiC composite material infiltrated by basalt glass-ceramic with a high hardness. Ceram. Int. 2023, 49, 27674–27681. [Google Scholar] [CrossRef]
  2. Lou, Y.; Chen, L.; Wu, H.; To, S. Influence of cutting velocity on surface roughness during the ultra-precision cutting of titanium alloys based on a comparison between simulation and experiment. PLoS ONE 2023, 18, 0288502. [Google Scholar] [CrossRef] [PubMed]
  3. Han, F.; Yuan, S.; Lin, N.; Zeng, Q.; Jia, H.; Li, M.; Wu, Y. Research Status of Surface Modification of Titanium-Based Alloys by Pack Cementation. Surf. Rev. Lett. 2021, 28, 2130004. [Google Scholar] [CrossRef]
  4. Oukati Sadeq, F.; Sharifitabar, M.; Shafiee Afarani, M. Synthesis of Ti–Si–Al coatings on the surface of Ti–6Al–4V alloy via hot dip siliconizing route. Surf. Coat. Technol. 2018, 337, 349–356. [Google Scholar] [CrossRef]
  5. Zhao, E.; Sun, S.; Zhang, Y. Recent advances in silicon containing high temperature titanium alloys. J. Mater. Res. Technol. 2021, 14, 3029–3049. [Google Scholar] [CrossRef]
  6. Wang, S.; Li, Z.; Du, J. Research Progress in Plasma Spray Coating Materials on the Titanium Alloy Substrates. Surf. Technol. 2013, 42, 93–97. [Google Scholar]
  7. Wu, L.; Li, Y.; Zhao, Z.; Bai, P.; Li, Z.; Li, J.; Huo, P.; Du, W. Microstructure Characterisation and Mechanical Properties of Ti/TiBCN Coatings Fabricated by Laser Cladding. Laser. Eng. 2021, 48, 163–181. [Google Scholar]
  8. Ra, X.; Zhang, J.; Wang, W.; Gong, X.; Tu, Y.; Guo, M.; Li, S. Growth Kinetics and Tribological Properties of NbC Coating on Different Steel Substrates Prepared by Pack Cementation Method. Rare Metal Mat. Eng. 2022, 51, 3964–3973. [Google Scholar]
  9. Choi, W.J.; Lee, H.; Park, C.W.; Kim, Y.D.; Byun, J. High temperature oxidation behavior of molybdenum borides by silicon pack cementation process. Int. J. Refract. Met. Hard Mater. 2021, 100, 105609. [Google Scholar] [CrossRef]
  10. Rezaee, B.; Rastegari, S.; Eyvazjamadi, H. Formation mechanism of Pt-modified aluminide coating structure by out-of-the-pack aluminizing. Surf. Eng. 2021, 37, 343–350. [Google Scholar] [CrossRef]
  11. Hu, J.; Liao, J.; Yang, X.; Zeng, J.; Li, H.; Song, B.; Xu, H.; Guo, N.; Jin, Y. Microstructure and properties of Al-coating on AZ31 magnesium alloy prepared by pack-cementation. Trans. Nonferrous Met. Soc. China 2022, 32, 493–502. [Google Scholar] [CrossRef]
  12. Ouyang, D.; Hu, S.; Tao, C.; Cui, X.; Zhu, Z.; Lu, S. Experiment and modeling of TiB2/TiB boride layer of Ti−6Al−2Zr−1Mo−1V alloy. Trans. Nonferrous Met. Soc. China 2021, 31, 3752–3761. [Google Scholar] [CrossRef]
  13. Qu, D.; Liu, D.; Wang, X.; Duan, Y.; Peng, M. Corrosion and wear properties of TB2 titanium alloy borided by pack boriding with La2O3. Trans. Nonferrous Met. Soc. China 2022, 32, 861–881. [Google Scholar] [CrossRef]
  14. Deng, D.; Wang, C.; Liu, Q.; Niu, T. Effect of standard heat treatment on microstructure and properties of borided Inconel 718. Trans. Nonferrous Met. Soc. China 2015, 25, 437–443. [Google Scholar] [CrossRef]
  15. Chaia, N.; Cury, P.L.; Rodrigues, G.; Coelho, G.C.; Nunes, C.A. Aluminide and silicide diffusion coatings by pack cementation for Nb-Ti-Al alloy. Surf. Coat. Technol. 2020, 389, 125675. [Google Scholar] [CrossRef]
  16. Li, X.; Tian, J.; Tian, W.; Li, X.; Xie, W. Oxidation Resistant Ce-modified Silicide Coatings Prepared on Ti–6Al–4V Alloy by Pack Cementation Process. Oxid. Met. 2018, 89, 471. [Google Scholar] [CrossRef]
  17. Huang, B.; Li, X.; Xie, X.; Lai, S.; Tian, J.; TiaN, W.; Liu, Z. High Temperature Oxidation Behavior and Failure Mechanism of Silicide Diffusion Coating Deposited on TC4 Alloy. Rare Metal Mat. Eng. 2021, 50, 544–551. [Google Scholar]
  18. Li, Y.; Xie, F.; Wu, X. Microstructure and high temperature oxidation resistance of Si−Y co-deposition coatings prepared on TiAl alloy by pack cementation process. Trans. Nonferrous Met. Soc. China 2015, 25, 803–810. [Google Scholar] [CrossRef]
  19. Liu, X.; Ding, J.; Hou, W.; Shi, X.; Feng, T.; Meng, X.; Wen, S.; Tong, M.; Yue, Z. Microstructural, mechanical and corrosion characterization of (C-HA)SiCnws coating on AZ31 magnesium alloy surface. Surf. Coat. Technol. 2024, 476, 130207. [Google Scholar] [CrossRef]
  20. Sun, J.; Zhou, Y.; Zhang, H. Preparation and oxidation behavior of a novel CeO2-modified chromizing coating. Trans. Nonferrous Met. Soc. China 2013, 23, 1375–1381. [Google Scholar] [CrossRef]
  21. Durán, A.; Reguera, E.; Mendivil, L.F.; González, M.; Verdin, E. Negative magnetization in the medium-entropy Pr1/3Dy1/3Ho1/3CrO3 and PrCrO3 ceramics: Comparative crystal structure, optic, dielectric and magnetic properties. J. Mater. Sci. 2023, 58, 15021–15034. [Google Scholar] [CrossRef]
  22. Cui, X.; Feng, Z.; Jin, Y.; Cao, Y.; Deng, D.; Chu, H.; Cao, S.; Dong, C.; Zhang, J. AutoFP: A GUI for highly automated Rietveld refinement using an expert system algorithm based on FullProf. J. Appl. Crystallogr. 2015, 48, 1581–1586. [Google Scholar] [CrossRef]
  23. Shen, Y.; Tao, H.; Lin, Y.; Zeng, X.; Wang, T.; Tao, J.; Pan, L. Fabrication and Wear Resistance of TiO2/Al2O3 Coatings by Micro-arc Oxidation. Rare Metal Mat. Eng. 2017, 46, 23–27. [Google Scholar]
  24. Deng, F.; Lin, X.; He, Y.; Li, S.; Zi, R.; Lai, S. Quantitative Phase Analysis by the Rietveld Method for Forensic Science. J. Forensic. Sci. 2015, 60, 1040. [Google Scholar] [CrossRef] [PubMed]
  25. Trukhanov, A.V.; Turchenko, V.O.; Bobrikov, I.A.; Trukhanov, S.V.; Kazakevich, I.S.; Balagurov, A.M. Crystal structure and magnetic properties of the BaFe12−xAlxO19 (x = 0.1 − 1.2) solid solutions. J. Magn. Magn. Mater. 2015, 393, 253–259. [Google Scholar] [CrossRef]
  26. Pang, X.; Li, S.; Qin, L.; Pei, Y.; Gong, S. Effect of trace Ce on high-temperature oxidation behavior of an Al–Si–coated Ni-based single crystal superalloy. J. Iron Steel Res. Int. 2019, 26, 78–83. [Google Scholar] [CrossRef]
  27. Li, Y.; Xie, F.; Yang, S. Microstructure and hot corrosion resistance of Si-Al-Y coated TiAl alloy. J. Cent. South Univ. 2020, 27, 2530–2537. [Google Scholar] [CrossRef]
  28. Li, X.; Guo, X. Effects of activators on formation of Si-Zr-Y co-deposition coatings on Nb-Ti-Si-Cr base ultrahigh temperature alloy. Acta Metall. Sin. 2012, 48, 1394–1402. [Google Scholar] [CrossRef]
  29. Knight, G.; Georgiou, O.; Dettmann, C.; Klages, R. Dependence of chaotic diffusion on the size and position of holes. Chaos 2012, 22, 023132. [Google Scholar] [CrossRef]
  30. Cangialosi, D.; Boucher, V.; Alegría, A.; Colmenero, J. Free volume holes diffusion to describe physical aging in poly(mehtyl methacrylate)/silica nanocomposites. J. Chem. Phys. 2011, 135, 014901. [Google Scholar] [CrossRef]
  31. Hirano, K.; Takahashi, Y.; Nagamachi, S. Application of x-ray phase plate to grazing incidence x-ray topography for the control of penetration depth. Nucl. Instrum. Methods Phys. Res. Sect. A 2013, 729, 537–540. [Google Scholar] [CrossRef]
  32. Gupta, A. Depth resolved structural studies in multi-layers using X-ray standing waves. Hyperfine Interact. 2005, 160, 123–142. [Google Scholar] [CrossRef]
  33. He, H.; Liu, Q.; Bo, X.; Wang, X.; Wang, Y.; Yao, Z.; Han, X.; Liu, C. In-situ Fabrication of (Ti, Mo) Si2/MoSi2CompositeCoating to Protect Mo Substrate Against Cyclic Oxidation at 1200 °C. Rare Met. Mater. Eng. 2021, 50, 3828–3836. [Google Scholar]
  34. Peter, W.; Borja, I.; George, P. Estimating Gibbs free energies via isobaric-isothermal flows. Mach. Learn-Sci. Technol. 2023, 4, 035039. [Google Scholar]
  35. Tamás, K.; János, L.; Dezső, B. The extrapolation of phase equilibrium curves of mixtures in the isobaric—Isothermal Gibbs ensemble. Mol. Phys. 2002, 100, 3429–3441. [Google Scholar]
  36. Zarchi, H.K.; Soltanieh, M.; Aboutalebi, M.; Guo, X. Kinetic study on NaF-activated pack-aluminizing of pure titanium at 950–1100 °C. Trans. Nonferrous Met. Soc. China 2014, 24, 1959–1968. [Google Scholar] [CrossRef]
  37. Castier, M. Helmholtz function-based global phase stability test and its link to the isothermal–isochoric flash problem. Fluid Phase Equilibria 2014, 379, 104–111. [Google Scholar]
  38. White, H.D.; Yoon, Y.H.; Ren, Y.; Roos, C.J.; Wang, Y.; Koros, W.J.; Lively, R.P. Selective permeation up a chemical potential gradient to enable an unusual solvent purification modality. Proc. Natl. Acad. Sci. USA 2023, 120, e2220127120. [Google Scholar] [CrossRef]
  39. Gao, H.; Li, X.; Feng, W.; Peng, D. Diffusion Numerical Simulation of Zinc in Sherardizing. Surf. Technol. 2018, 47, 135–141. [Google Scholar]
  40. Najafizadeh, M.; Ghasempour-Mouziraji, M.; Zhang, D. Silicon Diffusion in Silicide Coatings Deposition by the PackCementation Method on AISI D2 Tool Steel. Silicon 2022, 14, 3349–3356. [Google Scholar] [CrossRef]
Figure 1. Coating morphology and cross-section EDS analysis results of coatings prepared at different temperatures: (a1a3) 1000 °C, (b1b3) 1050 °C, (c1c3) 1100 °C.
Coatings 14 00450 g001
Figure 2. XRD patterns of coating surfaces at different temperatures: (a) 1000 °C, (b) 1050 °C, (c) 1100 °C.
Coatings 14 00450 g002
Figure 3. Coatings prepared by holding at 1075 °C for 3 h: (a) surface topography, (b) cross-sectional SEM image, (c) cross-sectional EDS analysis.
Coatings 14 00450 g003
Figure 4. Coatings prepared by holding at 1075 °C for different times: (a1a3) 0 h, (b1b3) 0.5 h, (c1c3) 1 h, (d1d3) 5 h.
Coatings 14 00450 g004
Figure 5. XRD patterns of coating surfaces prepared at 1075 °C for different holding times: (a) 0 h, (b) 0.5 h, (c) 1 h, 3 h, 5 h.
Coatings 14 00450 g005
Figure 6. Mechanism of [Si] generation.
Coatings 14 00450 g006
Figure 7. Relationship of ΔG with temperature.
Coatings 14 00450 g007
Table 1. Chemical composition of TC4 titanium alloy (wt. %).
ElementTiAlVFeOC
ContentBal.5.50~6.503.50~4.50≤0.25≤0.20≤0.08
Table 2. Process parameters for the preparation of silicide coatings.
Composition of Pack Mixtures (wt. %)Temperature (°C)Time (h)
AlNaFAl2O3
1567910003
1567910503
1567910750, 0.5, 1, 3, 5
1567911003
Table 3. EDS analysis of the surface of the coating prepared at 1000 °C, 1050 °C, and 1100 °C for 3 h (at. %).
Point123456
Ti5.454.035.00.943.336.6
Si2.541.162.3-21.661.0
Al25.41.02.733.98.42.4
O66.73.9-65.226.7-
Table 4. XRD refinement results of coating surfaces prepared at different temperatures.
SamplePhaseContent (wt. %)Rwp (%)Rexp (%)Space Group
1000 °CTiSi213.2513.26.5Fddd
TiSi70.29Pnma
Ti5Si38.82P63/mcm
Al2O37.64R-3c
1050 °CTiSi241.5514.47.0Fddd
Al2O358.45R-3c
1100 °CTiO54.6011.77.2Fm-3m
TiSi236.82Fddd
TiSi8.58Pnma
Table 5. EDS results of the surface of the coating prepared at 1075 °C for 3 h (at. %).
Point12
Ti30.432.6
Si69.667.4
Table 6. EDS results of the surface of the coating prepared at 1075 °C for 0 h, 0.5 h, 1 h and 5 h. (at. %).
Point12345678
Ti82.354.231.549.535.634.032.533.7
Si6.745.565.350.564.265.967.266.1
Al11.00.33.2-0.20.10.30.2
Table 7. XRD refinement results for 0 h and 0.5 h holding at 1075 °C.
SamplePhaseContent (wt. %)Rwp (%)Rexp (%)Space Group
0 hTi0.85Al0.1591.0513.26.4P63/mmc
TiSi24.69Fddd
TiSi2.20Pnma
Ti5Si32.06P63/mcm
0.5 hTiSi266.9512.96.3Fddd
Ti0.85Al0.1527.25P63/mmc
TiSi5.80Pnma
Table 8. ΔG and V for reactions (11)–(14) of n mol.
Serial NumberReaction EquationΔG/kJ∙mol−1ProductV/cm3
1n1∙5Ti + n1∙3Si = n1Ti5Si3−539.975n1Ti5Si374.218n1
2n2Ti5Si3 + n2∙2Si = n2∙5TiSi−90.999n2TiSi90.420n2
3n3TiSi + n3Si = n3TiSi2−22.207n3TiSi226.010n3
4n4Ti + n4∙2Si = n4TiSi2−148.402n4TiSi226.010n4
Disclaimer/Publisher’s Note: The statements, opinions and data contained in all publications are solely those of the individual author(s) and contributor(s) and not of MDPI and/or the editor(s). MDPI and/or the editor(s) disclaim responsibility for any injury to people or property resulting from any ideas, methods, instructions or products referred to in the content.

