Abstract
Laser surface texturing has attracted growing interest, particularly in functional surface modification. Lasers with nanosecond pulse widths and infrared wavelengths are commonly used for metallic surface texturing because of their low cost and potential for fabricating a large range of textures. In this research, a laser with a nanosecond pulse width and infrared wavelength was used for the surface texturing of 316 stainless steels. Standard grooved and near-isotropic surface textures, as well as novel porous texture and feather-like dendrite texture, were fabricated through single-time laser texturing. Water contact angle tests were performed on the post-process surfaces, and they showed wettability changes from superhydrophilic to superhydrophobic according to different types of textures. Discussion on the relationship between water contact angle and surface roughness, groove width/depth ratio, surface carbon and oxygen contents indicated that it is the surface morphology that impacts changes in wettability. The comprehensive formation mechanism of different textures and the wettability control mechanism through different textures have been systematically discussed. For the first time, the three-level (point-line-area) laser surface ablation mechanism has been established. The proposed findings can be used for future laser texturing process designs on metals using lasers with a nanosecond pulse width and an infrared wavelength for various applications including wettability modification.
1. Introduction
Among all laser-based processing techniques, laser surface texturing (LST) is widely used to fabricate surface features with precisions from micro- to nano-scales. LST is employed in many applications, such as tribology [1], colouring [2], biology [3], wettability modification and corrosion resistance [4]. Combined with the advantages of laser processing, LST can create a range of surface patterns from grooves [5], protrusion or pillars [6], and pores [7] to hierarchical surface features [8] through a contactless, fast, tailorable process. This allows for the modification of the surfaces of different materials during various manufacturing processes, avoiding pre-/post-production surface treatments.
LST through a nanosecond pulsed laser on metal is more difficult to control compared with picosecond and femtosecond pulsed lasers. This is because nanosecond pulsed lasers involve more heating effects, such as heating effect zones [9], melting, cracking and recrystallisation behaviours [10]. However, the good availability and affordability of this type of laser still attract many researchers and manufacturers in the industry. Different types of textures have been fabricated through nanosecond lasers. Groove surface texture is one of the common types of surface patterns made by a nanosecond pulse width and infrared wavelength. For example, Ta et al. [11] fabricated the microgroove textures on copper and brass using a nanosecond laser with a 1064nm wavelength for potential use in sensing devices. Another study from Boinovich et al. [12] fabricated microgrooves on aluminium alloys with excellent corrosion, wear, and thermal stress resistance. The commonly fabricated groove texture is ideal for initially understanding the controlled texturing process. Apart from grooved textures, a laser with a nanosecond pulse width and infrared wavelength has also been used for surface roughening or surface melting, which could manufacture isotropic or near-isotropic surface textures. Zupančič et al. [13] created nano-micron hierarchical surface textures, which showed enhanced boiling heat transfer compared with the original surface. Pacquentin et al. [14] used a nanosecond infrared laser on 304 stainless steel to improve the corrosion resistance via surface melting. With these possible applications, isotropic or near-isotropic surface textures can be used to analyse controlled texturing. Other types of textures have also been achieved using lasers with a nanosecond pulse width and infrared wavelength, such as hexagonal honeycomb micro-structure on titanium [15]. There are also other examples like the dual-scale porous surface fabricated by Long et al. [16] using a nanosecond laser on copper. In general, nanosecond pulsed lasers have the potential to fabricate different types of textures.
Controlled texturing via lasers has another important function, which is the modification of surface wettability, especially for materials used in biomedical devices. Wettability modifications through LST techniques have been achieved in the past few decades through different types of texture morphologies, since texture morphology has important effects on surface wettability. Seid et al. [17] demonstrated that grooved surface textures produced through laser surface texturing of 304 stainless sheets of steel have an increased surface roughness and hydrophilicity after using the Ti: sapphire femtosecond laser at 30 fs, 10 kHz and 200 µJ. Razi et al. [18] produced 316L stainless steel surfaces with near-isotropic to isotropic textures (micro-bumps and micro-pits) with an Nd: YAG laser with both a 1064 and a 532 nm wavelength at 12 ns and 5 Hz. The LST increased the hydrophilicity of 316L stainless steel. Many other experiments revealed the impressive superhydrophobicity properties induced by LST [7,19,20,21]. However, surface chemistry has also been proved to be functional in surface wettability modification [22,23]. Considering that it is difficult to separate surface morphology modification and surface chemistry modification for the LST process in air, understanding the contribution of surface morphology and chemistry to wettability change is vital for wettability control through LST.
Modification of surface wettability can be used in other applications. For example, surface texturing was applied to surface treatment of stainless steel and various types of metal alloys to improve their corrosion resistance by modifying surface wettability [24]. Modifying surface wettability can potentially improve the biocompatibility of materials used as implants. Kedia et al. [25] demonstrated increased adhesion, alignment, and spreading of bone cells on 316L stainless steel surfaces fabricated using a nanosecond laser. Li et al. [26] used the LST method to texture stents in a nitrogen environment and achieved a threefold increase in cell adhesion and an eightfold increase in proliferation. Liang et al. [27] fabricated laser-induced periodic surface structures to encourage endothelialisation. Thus, understanding controlled LST is highly beneficial for controlled wettability.
In this research, fabrication methodology with a nanosecond pulsed laser on 316 stainless steel for six types of textures has been researched, including the smooth/rough grooved texture, smooth/rough near-isotropic texture, porous texture and feather-like dendrite texture-covered groove textures. The formation mechanisms for the textures have been discussed for a better understanding of the texturing process control. The wettability control methodology of different types of textures was found to be different, and they were discussed following the texturing control process in this research. The contribution of surface morphology and surface chemistry has also been revealed.
2. Experiments and Methodology
2.1. Materials
Rectangular sheets of 316 stainless steels (316 SS) were provided by RS component (Corby, UK), originally with a size of 300 mm (width) × 500 mm (length) × 0.5 mm (thickness). The chemical composition of the materials is shown in Table 1 [28]. The 316 stainless steel plates were cut by CO2 laser into smaller 50 mm × 50 mm plates. On each plate, square-shaped areas were processed via LST, and the central part of the squares was selected for further surface characterisation.

Table 1.
Chemical composition (wt%) of 316 stainless steels (ASTM A240) [28].
2.2. Laser Processing
All samples were manufactured using a 70 W Innolas MMS-SPI redENERGY® fibre laser (SPI Lasers UK Ltd., Rugby, UK). This infrared laser has a 1060 nm wavelength and several pre-set waveforms. Pulse width for this laser ranges from 10 ns to 520 ns for different waveforms. The laser setup and laser scanning path are shown in Figure 1. Spot size measurements were taken with the laser settings as shown in Table 2, and the spot size at focus on the samples processed for this work was 70.76 ± 1.72 µm. Fluence [29], energy density [29], pulse overlap, and line overlap were calculated using Equations (1)–(4):
where F is the fluence (J/cm2), I is the intensity (%), Pm is the full average laser power (70 W), d is the beam spot diameter (cm), and f is the laser pulse frequency (Hz).
where P is the power density (W/cm2), and t is the pulse width (μs).
where p is the pitch (mm), and PO or LO were set to 0 if the calculated results were less than 0.
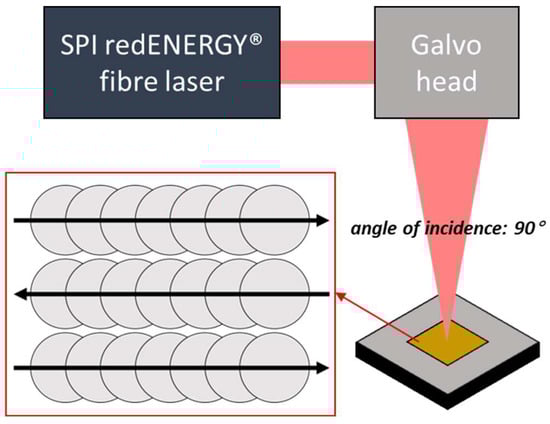
Figure 1.
Laser setup and scanning patterns.
Table 2.
Laser parameters of samples.
Laser parameters used to prepare samples are shown in Table 2, and the samples prepared by each process were named S1 to S19, respectively.
2.3. Surface Characterisation
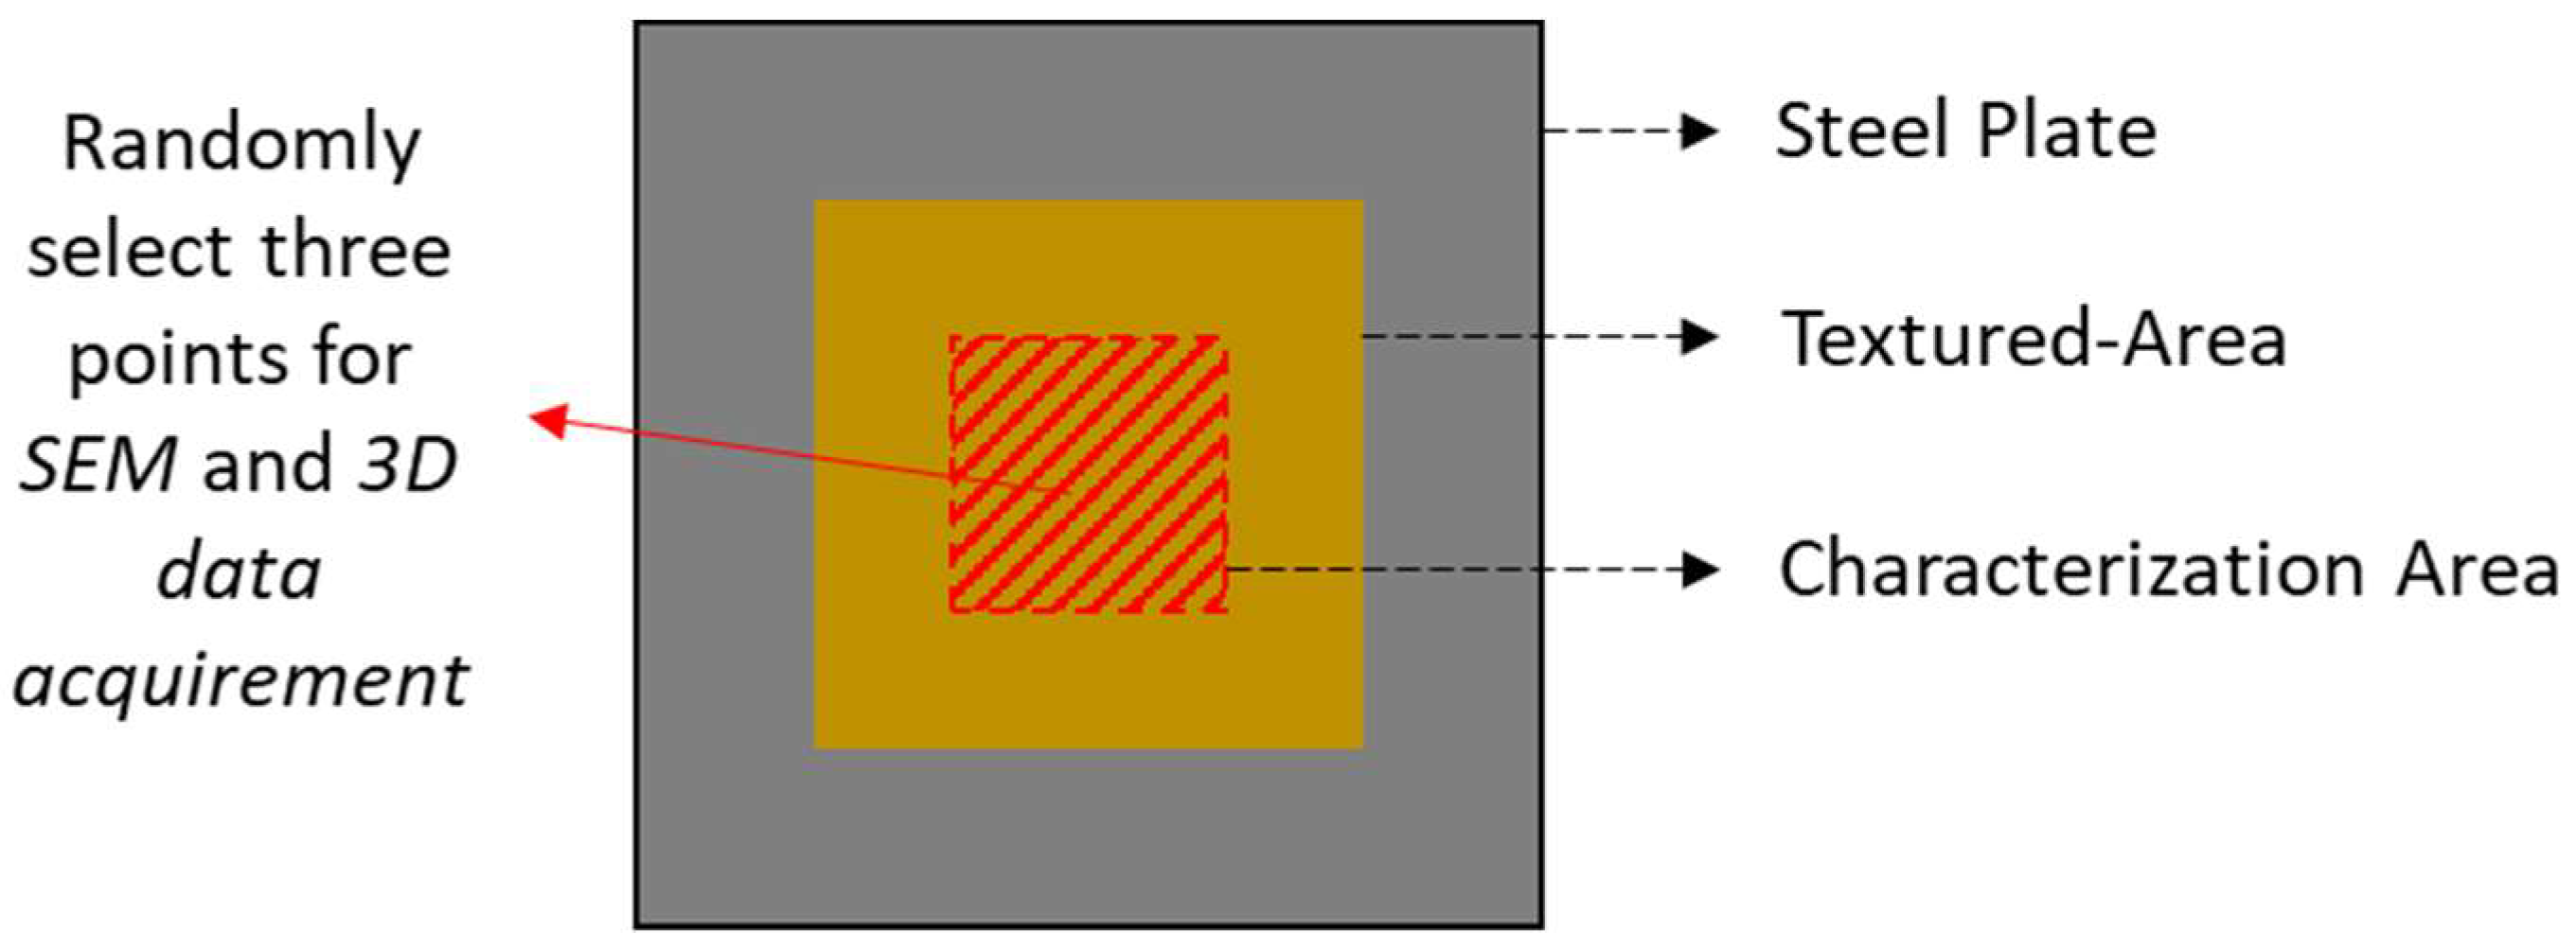
The map of the sample surface and the corresponding textured and characterisation areas are shown in Figure 2. A Hitachi TM3030 (Hitachi High-Technologies Corporation, Tokyo, Japan)/Joel 7800F (JOEL Ltd., Tokyo, Japan) scanning electron microscope (SEM) was used to characterise the sample. SEM images were taken from three locations in the central part of each ablated area (see Figure 2 square marked with red lines). Alicona InfiniteFocuseTM 3D profilometer (Bruker Alicona, Raaba, Austria) was used for surface topography and surface roughness analysis. The 3D scanning area on each textured sample was 713.1878 μm × 541.0390 μm in the middle region.
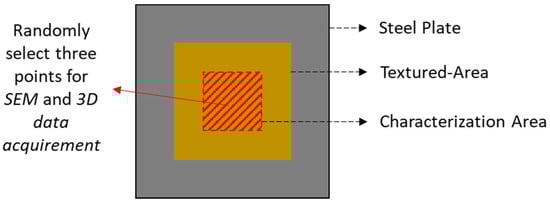
Figure 2.
Schematic diagram to show the characterisation area.
Str measurement was used to identify the grooved and near-isotropic structures. One of each 3D scanning data of each textured sample was selected for Str measurement. Ra was measured at the bottom of the grooves. Three grooves from each 3D scanning of each sample were selected, and six groove areas were used in total for Ra measurement.
2.4. Water Contact Angle Test
Three different locations around the middle part of each textured square were selected, and 8 μL deionised water was dropped on each location through the pipette used for each measurement. After dropping the water on the surface, the images of the water droplets were taken, and the water contact angle (WCA) was measured by ImageJ 1.53t with the LB-ADSA plugin [30]. Because WCA will change with time due to the oxidation of surfaces and adsorption from the ambient environment, samples were cleaned with isopropanol in an ultrasonic bath for 15 min to remove contamination from absorption in the ambient environment. WCA of the control sample was measured by selecting the 4 points in untreated areas on each sample plate, and in total, 12 points were measured. According to Law [31], a hydrophilic surface has WCA < 90°, a hydrophobic surface has WCA > 90°, and a superhydrophobic surface has WCA > 145°. And the superhydrophilic surface has WCA = 0°.
2.5. X-ray Photoelectron Spectroscopy Characterisation
X-ray photoelectron spectroscopy (XPS) is a surface chemistry characterisation which uses X-rays to initiate and detect the emission of electrons. In this chapter, the Thermo Scientific K-Alpha X-ray Photoelectron Spectrometer was used. It has an Al K-alpha monochromatic source (1486.6 eV). The XPS high-energy resolution (Hi-Res) scans of C1s and O1s were used to determine the carbon and oxygen composition. The scanning area at the centre of each laser-textured square is a circle with a 400 µm diameter, as shown in Figure 3.
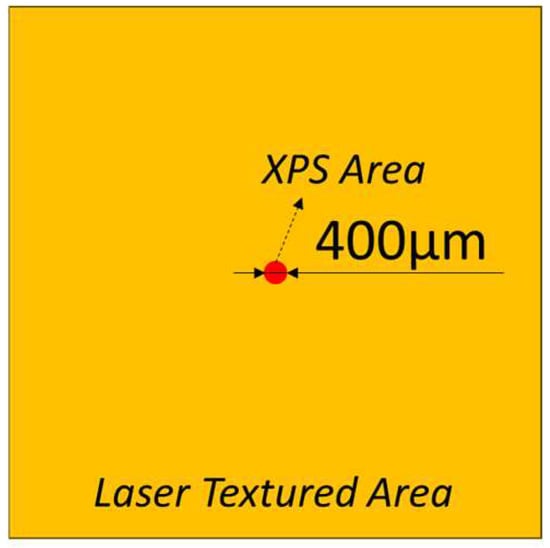
Figure 3.
XPS scanning area.
3. Results and Discussion
3.1. Morphology and Surface Roughness Characterisation of Textures
The first important finding is that several textures were produced through one-time laser scanning, including the commonly found grooved and near-isotropic textures and novel porous and feather-like textures. These results proved the ability to fabricate a large range of textures by LST with nanosecond laser on stainless steel.
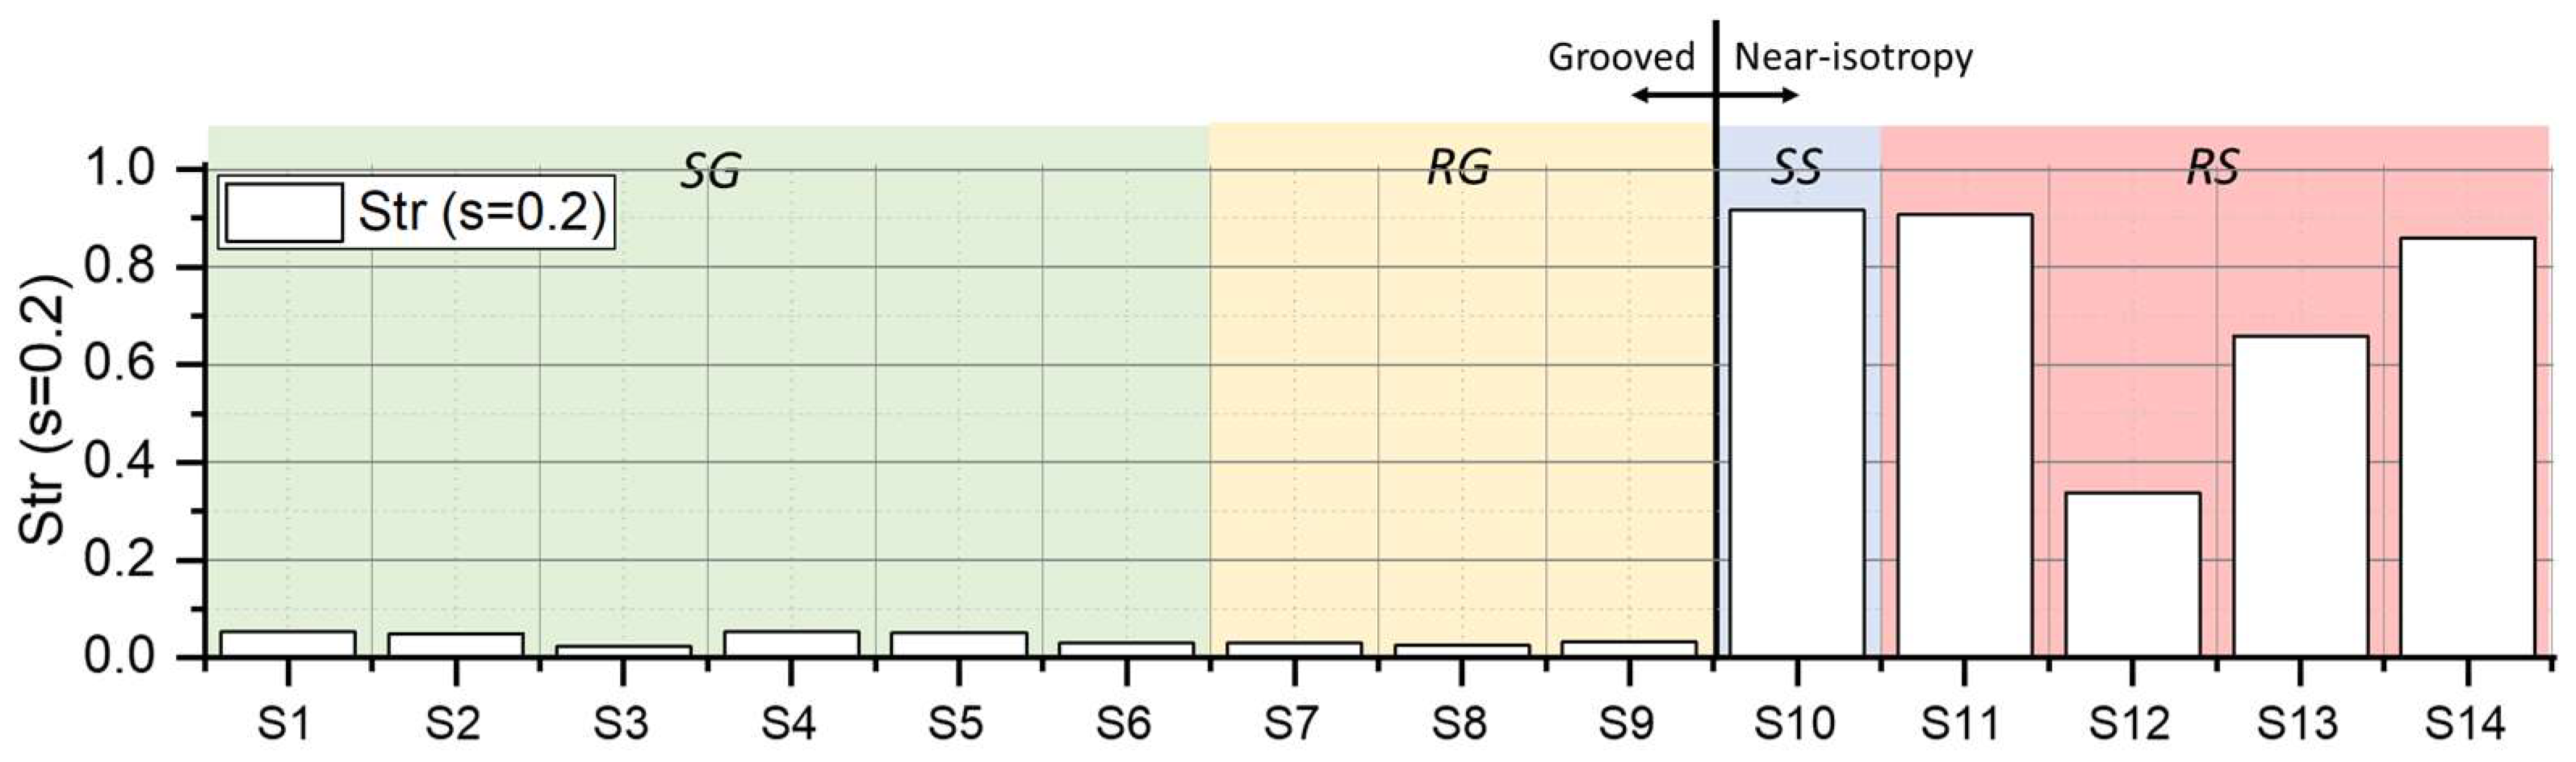
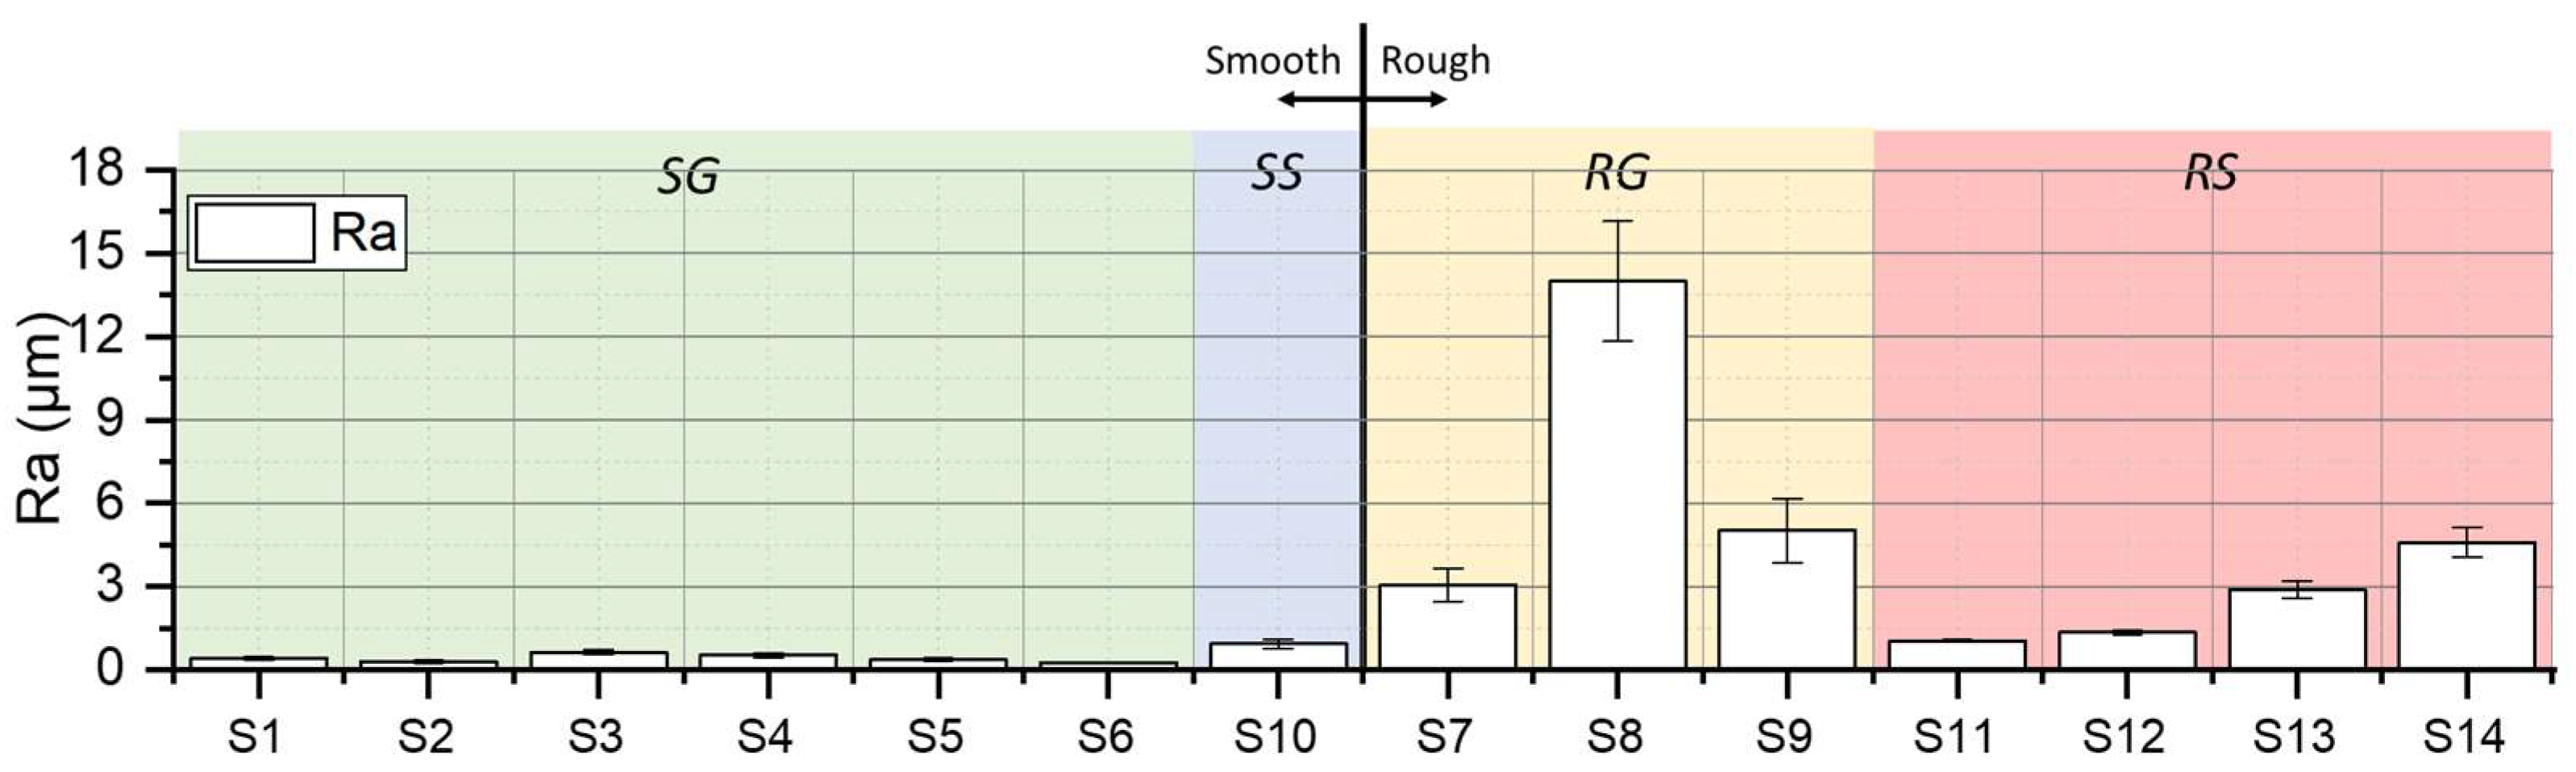
Commonly found textures have been classified through Str and Ra. Str is the texture aspect ratio and the value of Str is calculated by dividing the horizontal distance in the direction in which the auto-correlation function decays to 0.2 the fastest by the horizontal distance in the direction of the slowest decay of the auto-correlation function to 0.2. Str is the roughness data showing the uniformity of the texture, and the value of Str is between 0 and 1. The closer to 0 the value is, the more anisotropic the texture is, and the closer to 1 the value is, the more isotropic the texture is. Because the samples were fabricated through one-time scanning, low Str means the surface is more grooved (Str = 0 means fully grooved), and high Str means the surface is more isotropic (Str = 1 means fully isotropic). Ra is the roughness average and is calculated by the arithmetic average of the absolute values of the profile height from the mean level. The laser textured samples S1 to S14 (see Table 2 for corresponding process parameters) were classified into four basic groups of textures: smooth grooved (SG) samples, rough grooved (RG) samples, smooth near-isotropic (SS) surfaces and rough near-isotropic (RS) surfaces, according to their morphology and Str and Ra measurement. Str and Ra measurement confirmed the differences between the four groups of textures: low Str (typically lower than 0.1) was classified as grooved, and high Str was classified as near-isotropic, which is highly isotropic but not fully isotropic; low Ra (typically lower than 2 µm) was classified as smooth surface and high Ra was classified as rough surface. Both 3D (Str) and 2D (Ra) surface roughness measurements are shown, respectively, in Figure 4 and Figure 5, and the SEM images has been shown in Figure 6. SG samples present low Str and low Ra values, while low Str and high Ra values characterise RG samples. SS samples have high Str and low Ra values. Finally, RS samples present high Str and high Ra. In addition, two special structures, porous surface (P) and feather-like dendrites texture-covered grooves (F), were also observed in samples S15 to S19 (see Figure 7a,b).
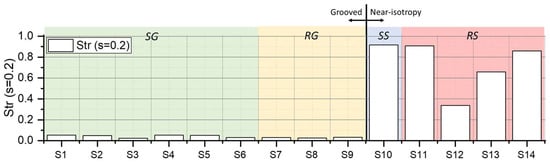
Figure 4.
Str of SG, RG, SS, and RS samples.
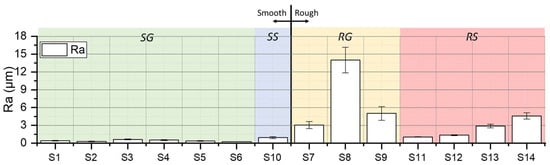
Figure 5.
Ra of SG, SS, RG, and RS samples.
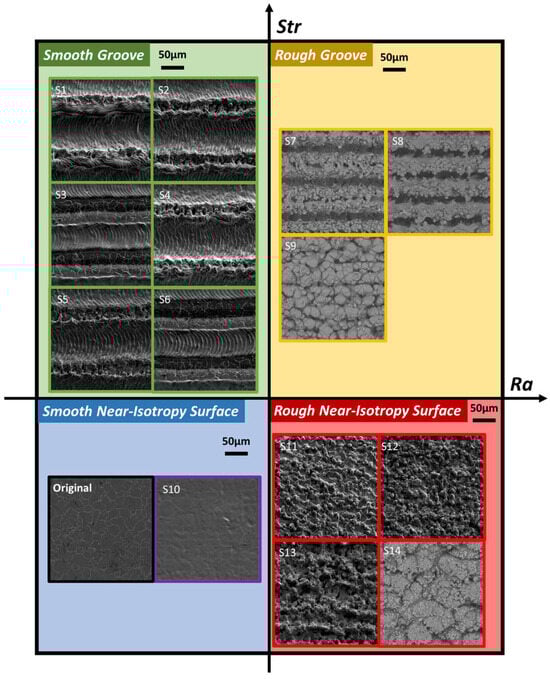
Figure 6.
SEM images of SG, RG, SS and RS samples with original samples (in SS group).

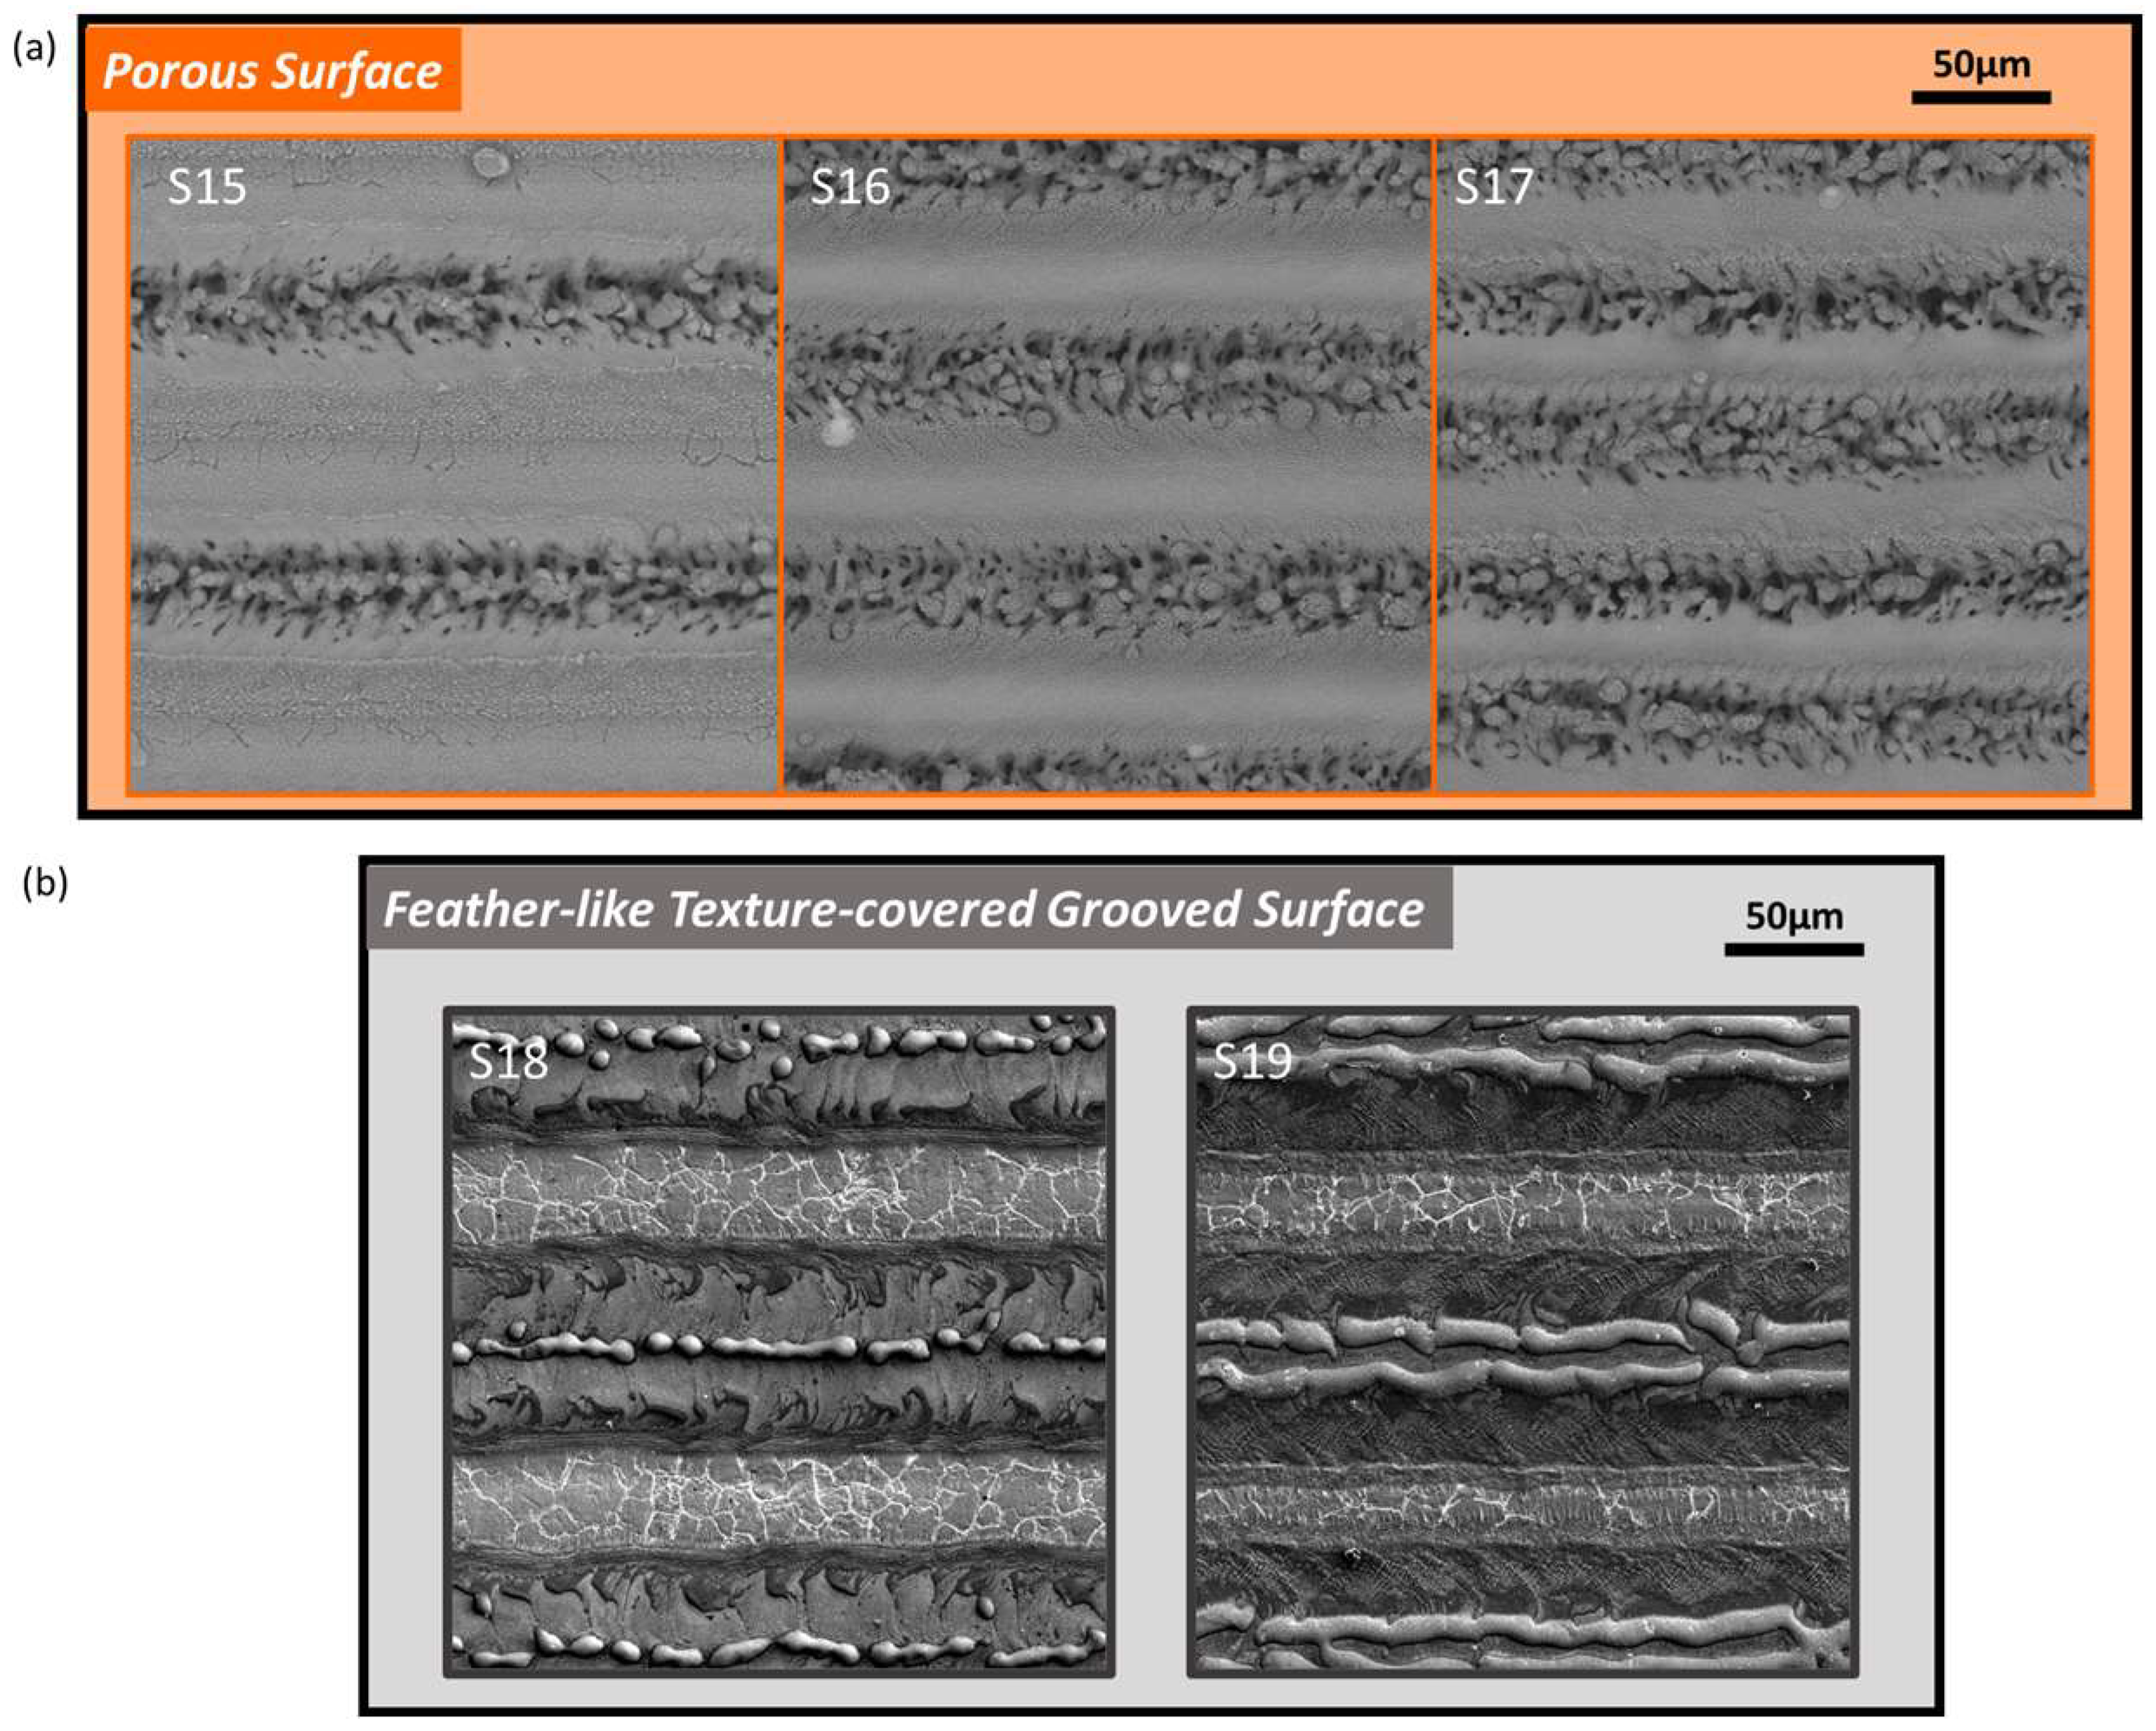
Figure 7.
(a) P samples and (b) F samples.
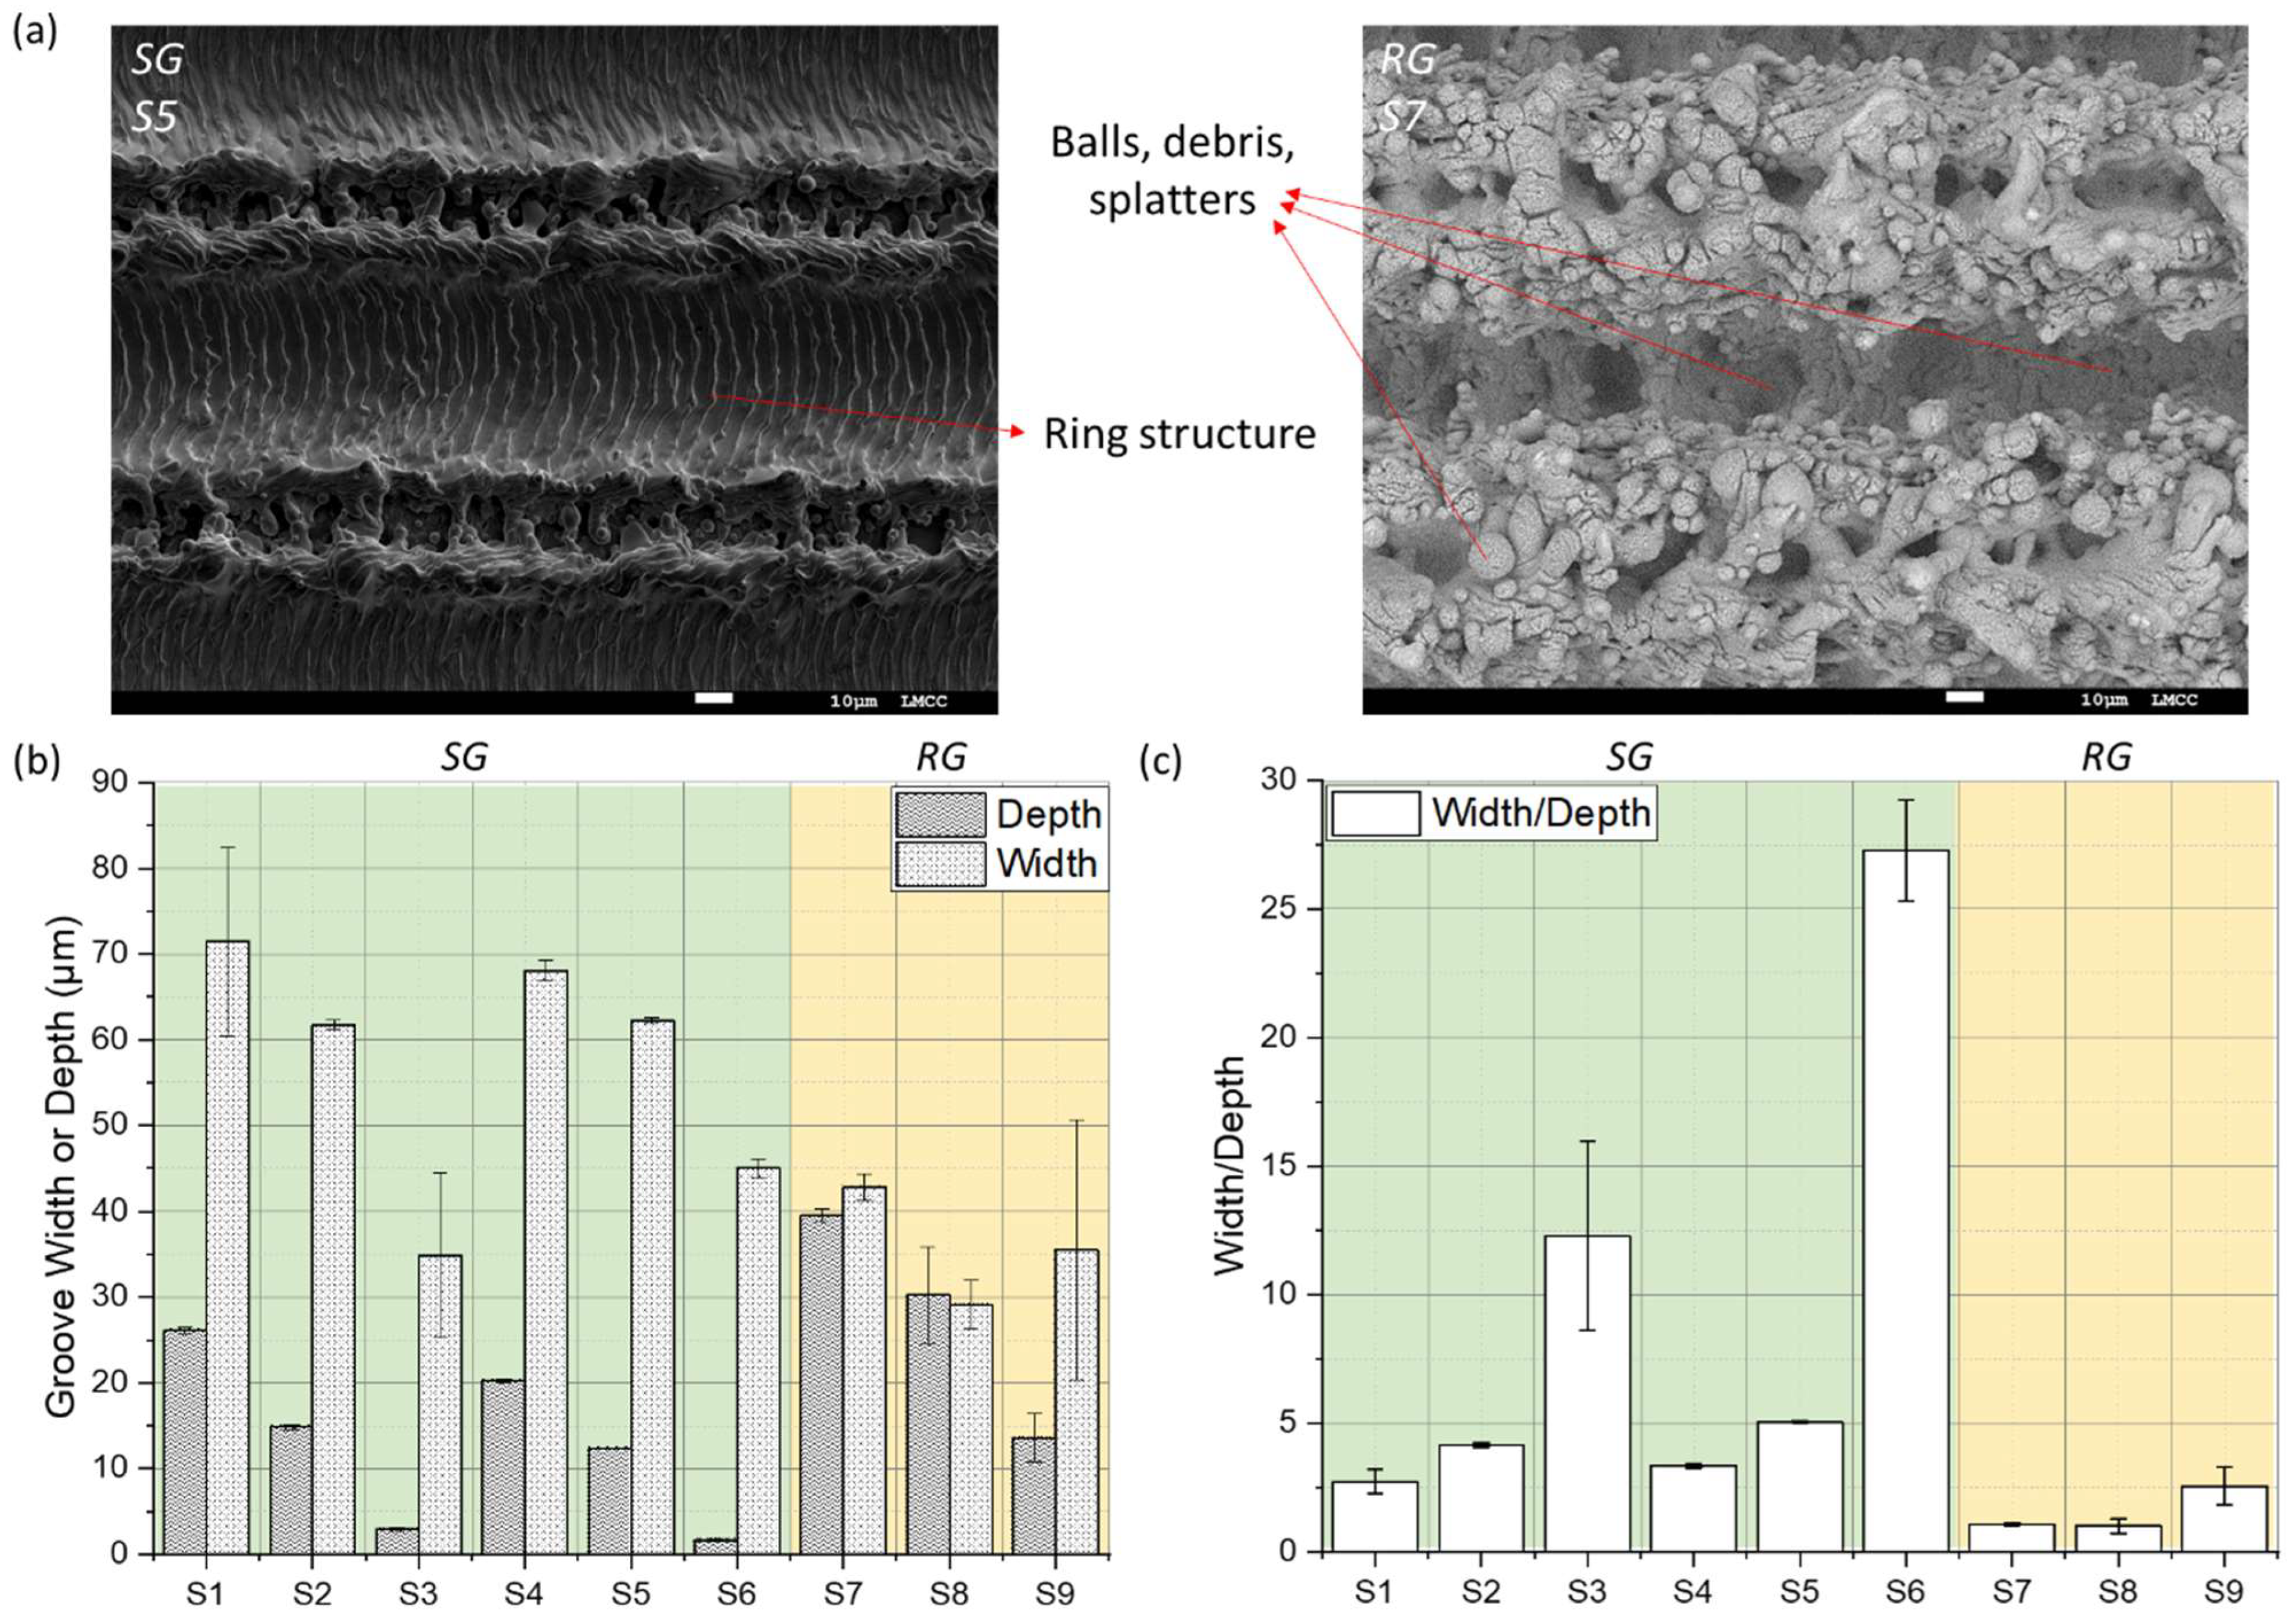
Grooved surfaces were fabricated at a higher pitch. And the adjacent laser scanning lines were more separated compared with near-isotropic morphologies. Some of the samples have clear edges of each groove stacked from the molten material (S2–S6). Other groove samples have the groove ridges merged from adjacent grooves (S1, S7–S8). Typical SG and RG sample topography is shown in Figure 8a. The SG sample has smooth groove ridges and valleys and the ring structure is clearly observed inside the grooves. The RG sample has rough groove ridges and valley areas. The surface was full of heating marks of balls, debris and splatters. The irregular porous surface was also found due to the irregular stacking of molten materials. The groove dimensions of SG and RG samples are shown in Figure 8b,c. SG samples usually have a high width/depth ratio, and RG samples usually have large groove depth.
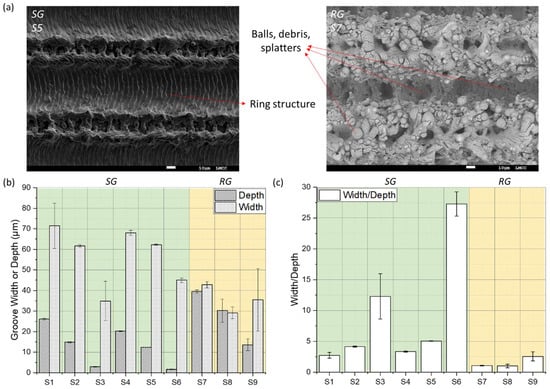
Figure 8.
(a) Typical topographies of SG and RG samples. (b) Depth and width of SG and RG samples. (c) Aseptic ratio of grooves of SG and RG samples.
Surface textures with near-isotropic morphology were fabricated at a lower pitch. Adjacent laser scanning lines strongly affected each other at a low pitch. The groove structure was rarely observed at extremely low pitch (such as 10 µm, compared to the spot size of 70.76 ± 1.72 µm) and the treated surface showed a more uniform texture (such as S10 and S11 shown in Figure 9). SS sample had an even and smooth surface morphology, as Figure 9a shows. The height fluctuation of the surface in z direction is negligible according to Sa data and 3D structure (Figure 9b). Heat marks were not commonly found on this type of surface texture. This could be due to the high overlapping which remelted a large number of heating marks and the energy density was below the ablation threshold. Although the surface roughness is still higher than the original surface (Sa = 0.236 ± 0.006 µm), this series of laser settings has the potential to smooth the rough surfaces. RS samples were created by high energy and low pitch settings. They are covered with large amounts of micron splatters, protrusion, pores and nano oxidations, as Figure 9c shows. The Sa of RS also confirms the observation from SEM images, as Figure 9d shows. This type of surface texture has a hierarchical surface pattern with pores and holes due to the irregular splatters.
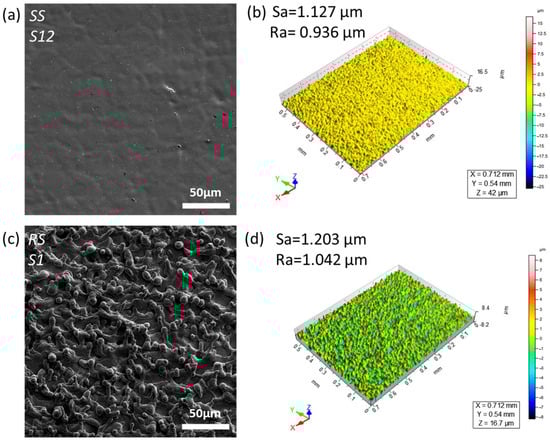
Figure 9.
(a) SEM image of SS sample (S10). (b) 3D surface structure of S10. (c) SEM image of one of RS sample (S11). (d) 3D surface structure of S11.
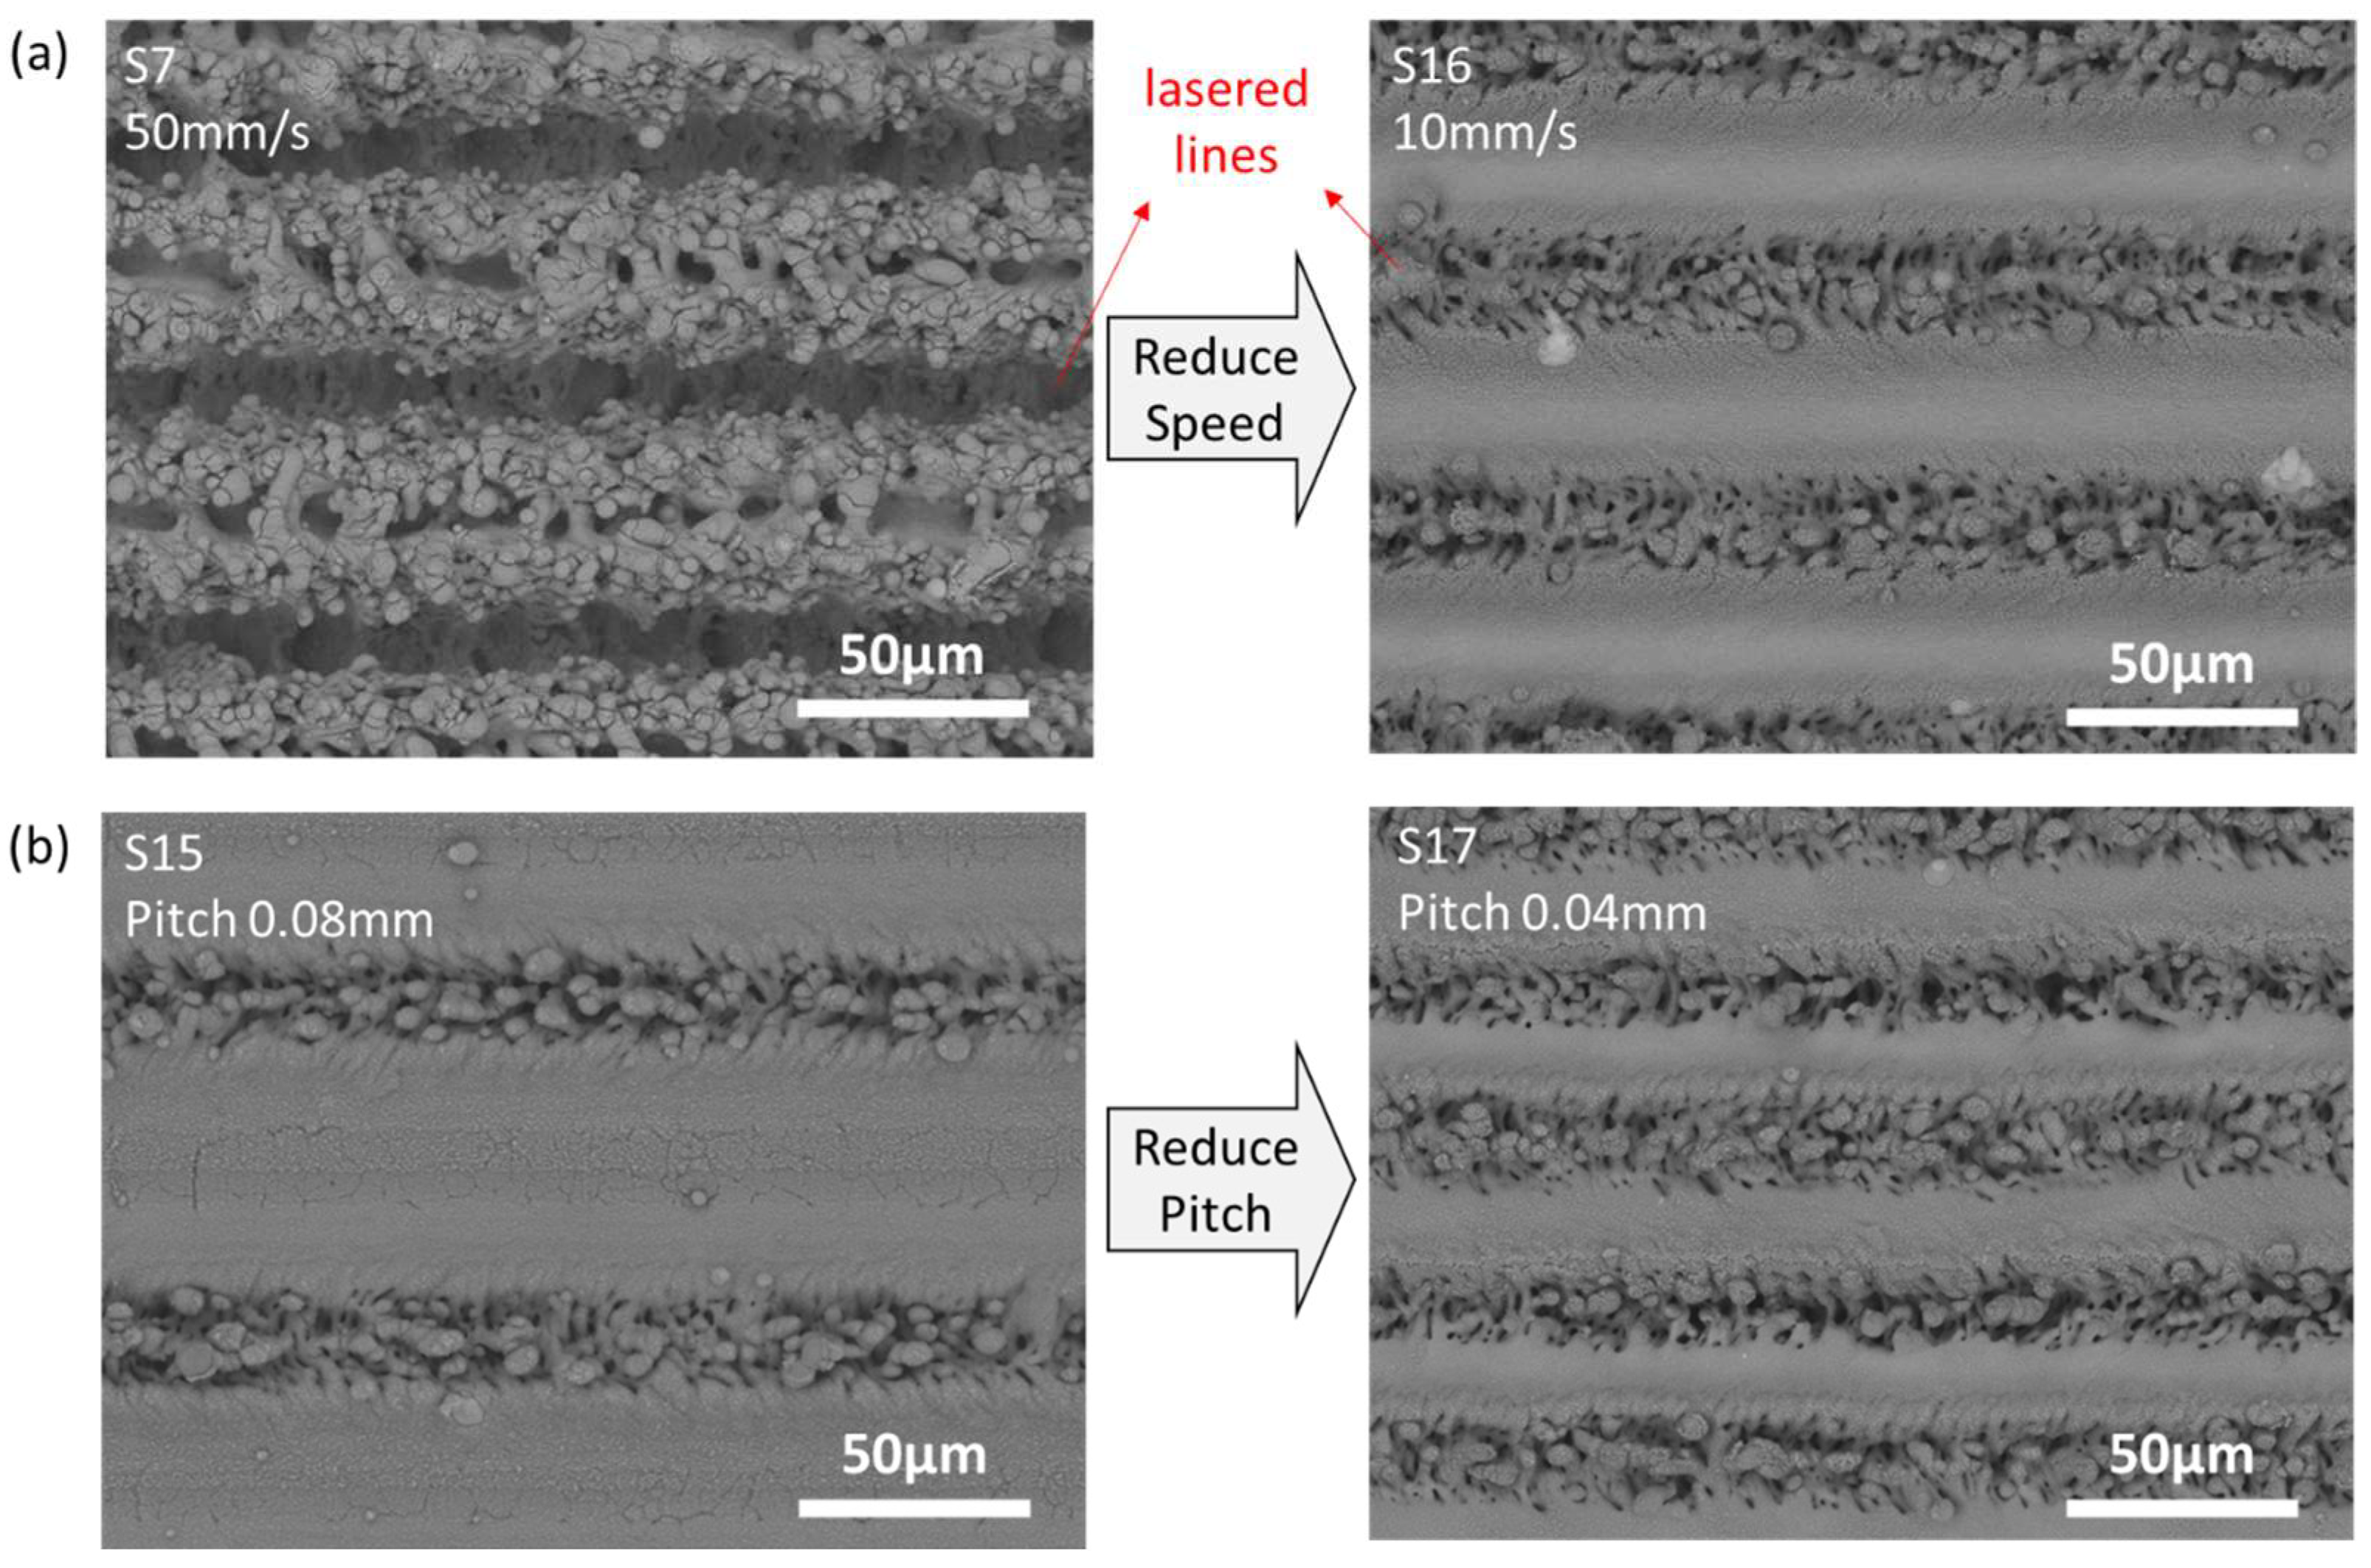
Two further interesting textures have also been successfully fabricated in this study using single-time nanosecond laser scanning. Compared with the SG and RG samples, P samples (S15–S17) and F samples (S18–S19) were produced at extremely high pulse overlapping (≥99%) but through different mechanisms. P samples were produced through a reduction in feed speed, as Figure 10a shows. The pulse overlapping for samples S15, S16, and S17 is extremely high (>99%), as shown in Table 2. The violent ablation and laser-materials interaction resulted in the porous structure of P samples. Some researchers have fabricated porous surface structures through femtosecond laser [32] or multiple laser scanning [33] on metals. Our findings suggest a more convenient and cheaper way to achieve a porous structure. Additionally, it is possible to process the entire surface by simply reducing the scanning pitch from 0.08 mm (S15) to 0.04 mm (S17), as shown in Figure 10b. Coverage of porous structures has the potential for some biomedical applications such as drug carriers [34]. The increased surface areas also demonstrate the potential for altering cell behaviour [35]. Successful fabrication of P samples proved the potential to make large areas of porous surface structure through a one-time, simple and cheap manufacturing process. F samples were fabricated by extremely high frequency values (500 kHz). These surfaces were covered by feather-like textures (Figure 11a). This surface structure was classified as a grooved structure, but the groove is shallow and there are some protrusions in the middle. However, both Sa and Ra are relatively low (Table 3). The direction of feather-like texture was from the groove edges to the groove middle and aligned with the laser scanning direction. Star-like features could also be observed between feather structures. These star-like features were highly possibly the start-point of the growth of feather-like textures. This feather-like dendrites crystal structure is commonly observed in casting [36] and additive manufacturing processes [37] and is rarely observed in laser texturing. It is the first time these feather-like dendrite textures have been found in the surface texturing process.
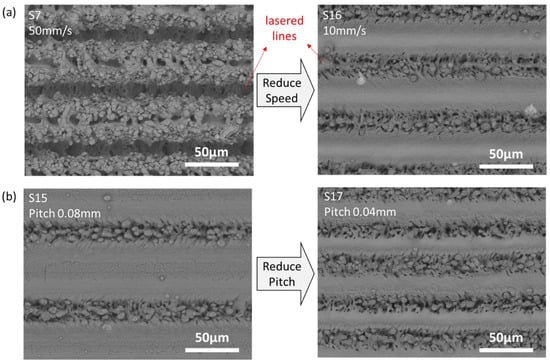
Figure 10.
(a) Fabrication of P samples through reducing feed speed. Other laser parameters: 240 ns, 20 kHz, 35.58 J/cm2, 0.06 mm pitch. (b) Reducing pitch to make porous structures cover the whole surface. Other laser parameters: 240 ns, 20 mm/s, 20 kHz, 35.58 J/cm2.
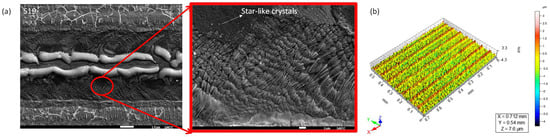
Figure 11.
(a) SEM images of feather-like texture-covered sample S19. (b) 3D surface structure of S19.
Table 3.
Surface characterisation of F samples.
3.2. Formation Mechanism of Grooved and Near-Isotropic Textures
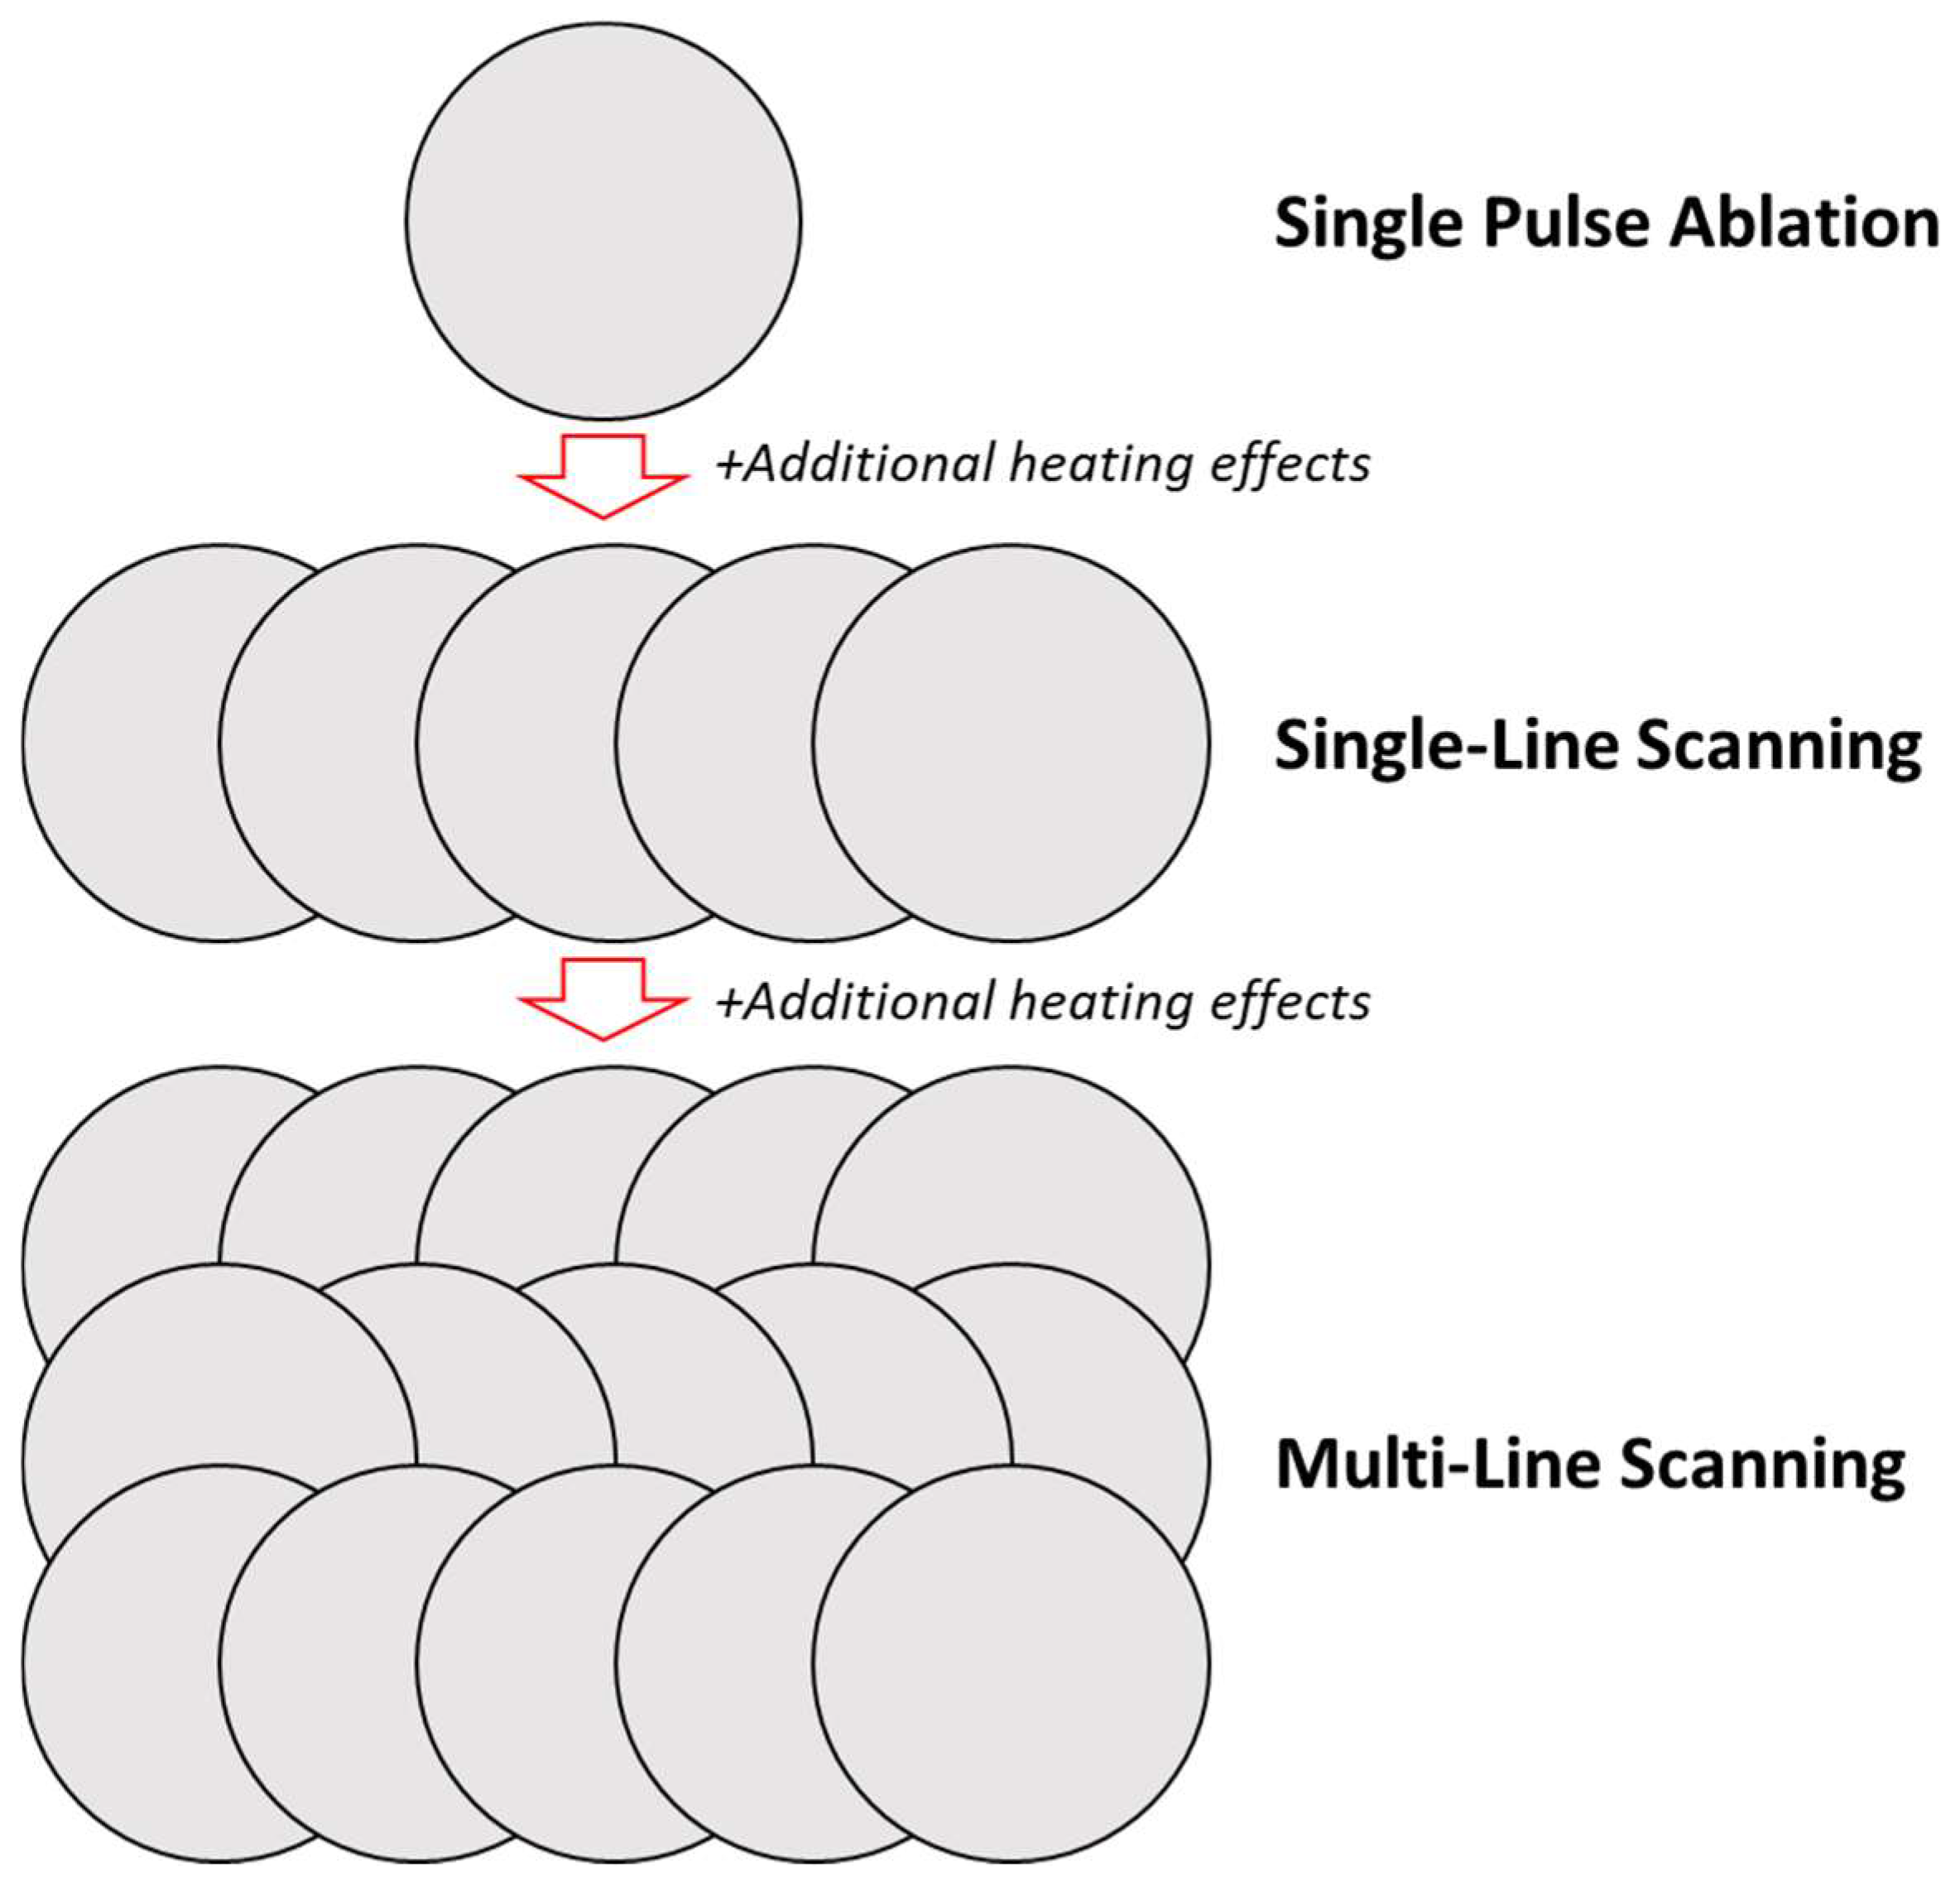
Understanding the mechanism is important for controlling the LST process through a nanosecond laser on stainless steel. It is believed that the formation mechanism of different types of textures is the outcome of a serious accumulation effect at hierarchical levels (see Figure 12), from single-pulse ablation to single-line scanning and multiple-line scanning, with additional considerations of heating effects from thermal dynamic effects and accumulative heating energy caused by pulse overlap and line overlap.
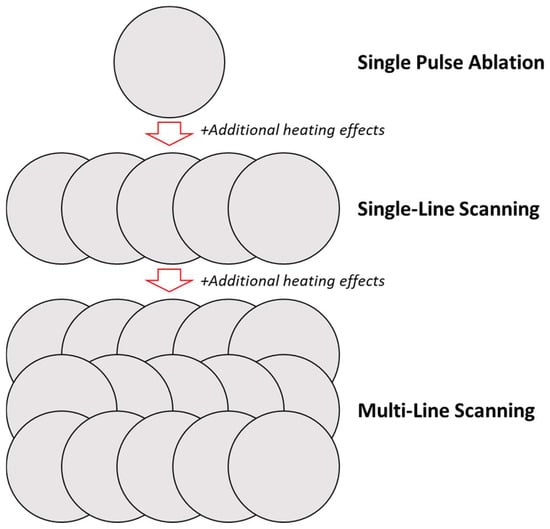
Figure 12.
Accumulation effects from spot ablation to surface ablation.
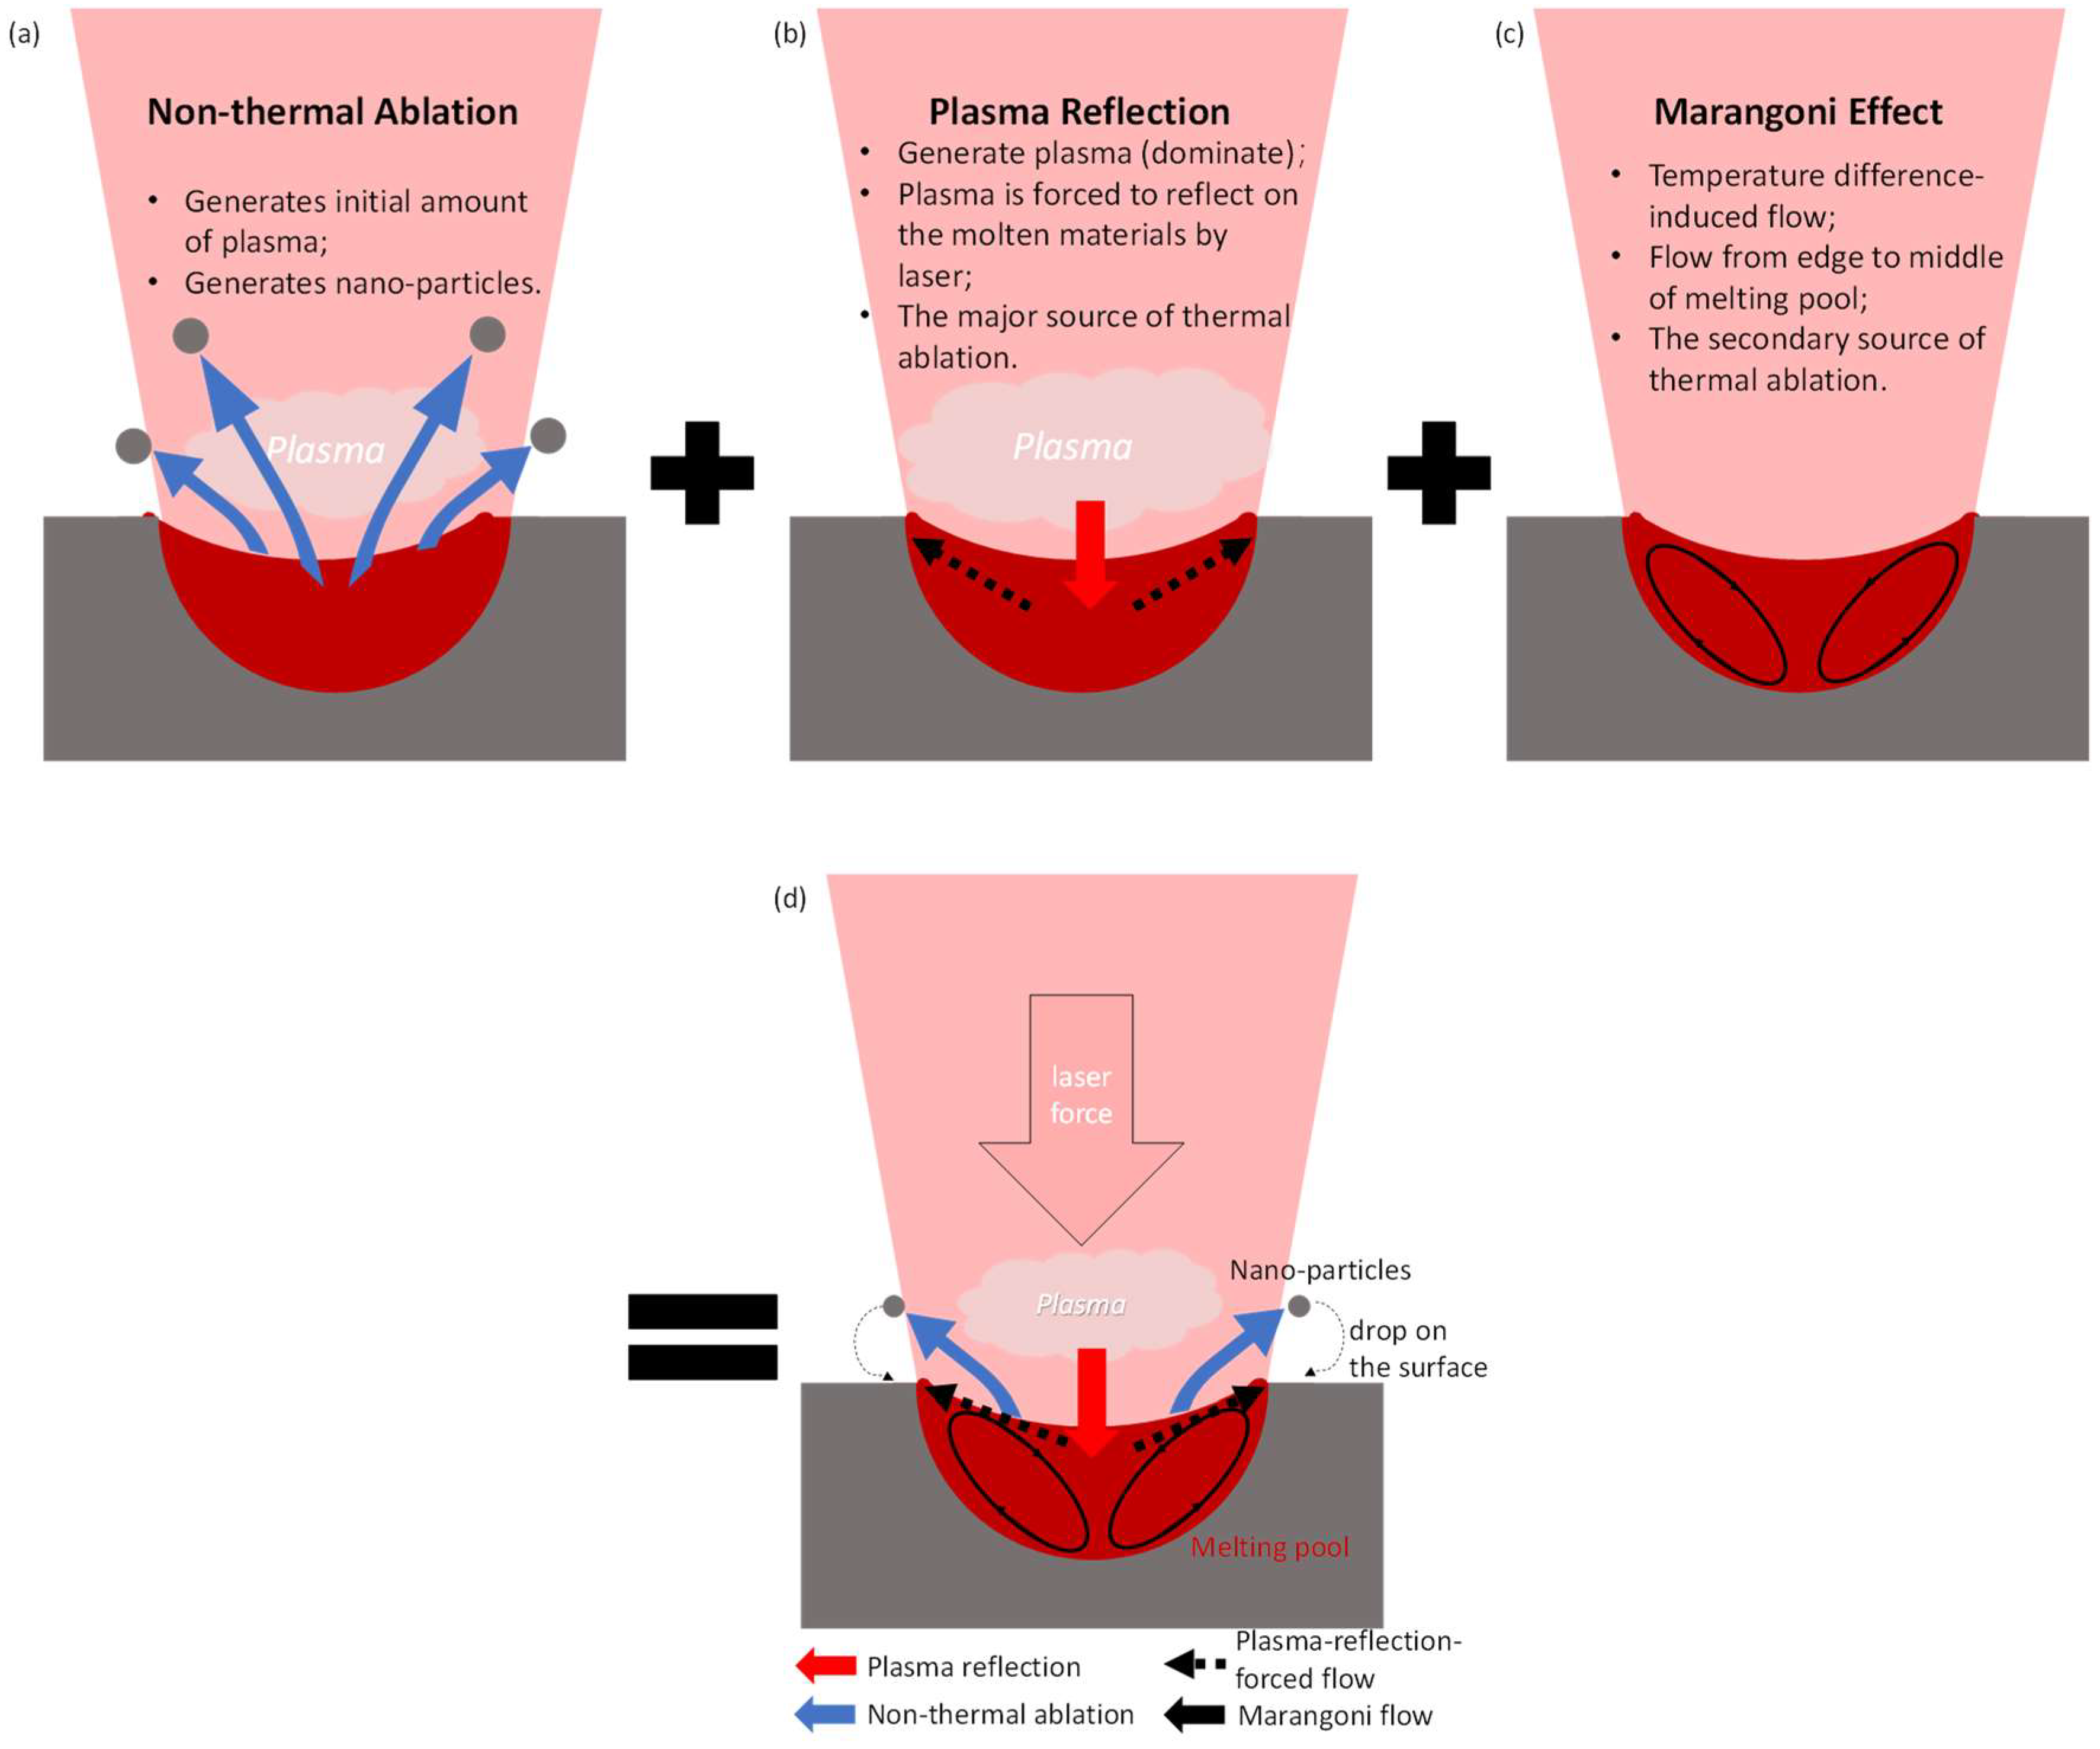
Several steps occur during the nanosecond laser manufacture of a single-pulse ablation on metal. The three key laser and metal interactions are non-thermal ablation, the plasma reflection (thermal process) and Marangoni flow as shown in Figure 13. Firstly, the laser energy absorptions and material excitation increase the temperature of the surface. Then, non-thermal ablation occurs due to energy absorption (Figure 13a). Further temperature increase evaporates the material and forms the plasma. The materials’ vapour and plasma formed are then forced to press the surface in a process called plasma reflections (Figure 13b). Eventually, the plasma is ejected into the air and the shock wave continues to transmit to the base materials. Marangoni flow also continues until cooling down (Figure 13c). Other researchers have also depicted these series of interactions to aid the explanation of the ablation mechanisms [38,39,40,41,42].
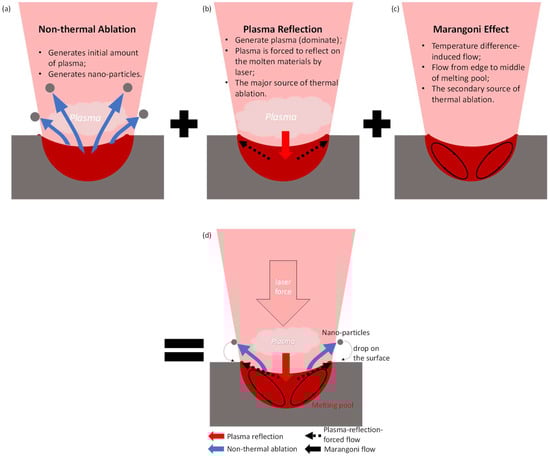
Figure 13.
Laser texturing mechanism for metals of single spot by nanosecond infrared laser. (a) Non-thermal ablation, (b) plasma reflection, (c) Marangoni effect. Part of the schematic diagram is adopted from Leitz et al. [38], Hamad [39], Lahaye et al. [40], He et al. [41] and Gaudiuso [42].
Laser single-pulse fluence, energy density, and pulse width are the main factors affecting these laser–metal interactions in single-pulse ablation. Firstly, the non-thermal and thermal ablations depend on the laser energy absorbed, which is highly related to the laser single-pulse fluence (and further laser energy density), materials absorption and laser pulse duration. Secondly, the intensity of plasma reflection is affected by the corresponding amount of plasma produced and the duration of plasma reflection. Plasma induced by lasers with a long width and long wavelength on metals was usually dominated by heating effects such as melting, evaporation and boiling [42]. The plasma expansion can last a few microseconds, and the laser with a longer pulse width can interact more with plasma [39]. The plasma amount is proportional to the energy absorbed, and the duration of plasma reflection depends on the pulse duration.
Thirdly, the Marangoni effect is a consequence of temperature differences between the middle and the edges of laser points, here the laser ablation area (i.e., the groove) in the current study [43,44]. The temperature difference induces the difference in surface tension [45]; this will further induce the flow of molten materials. The mathematical model from Siao and Wen [46] indicates two different flow directions. Figure 13c shows the inward direction from the edge to the middle of the melting pool. This happens when the sulphur content is lower than 140 ppm, and the surface tension is positive [46], which is the condition in this research, since 316SS has a sulphur content higher than 140 ppm. It should also be mentioned that Siao and Wen [46] also pointed out that the molten pool width and depth are mainly controlled by the Marangoni effect at low energy levels but by the keyhole phenomenon at high energy levels, during which the materials inside the molten pool evaporate from pores and holes [47]. The inward Marangoni flow and low feed speed can enhance the keyhole phenomenon [48]. The temperature difference for the Marangoni effect depends on the energy absorbed, i.e., laser energy density and pulse duration. Hence, laser energy density and pulse duration are the main factors affecting the morphology of a single-pulse laser irradiation. During the ablation process at a high energy density, the plasma reflection and Marangoni co-effect force the molten materials to flow to the edge of the ablated areas to make a sunk structure, as shown in Figure 13d. When these two forces are high enough, the flow of molten can be solidified to form splatters, balls, and particles at the edges (Figure 8a).
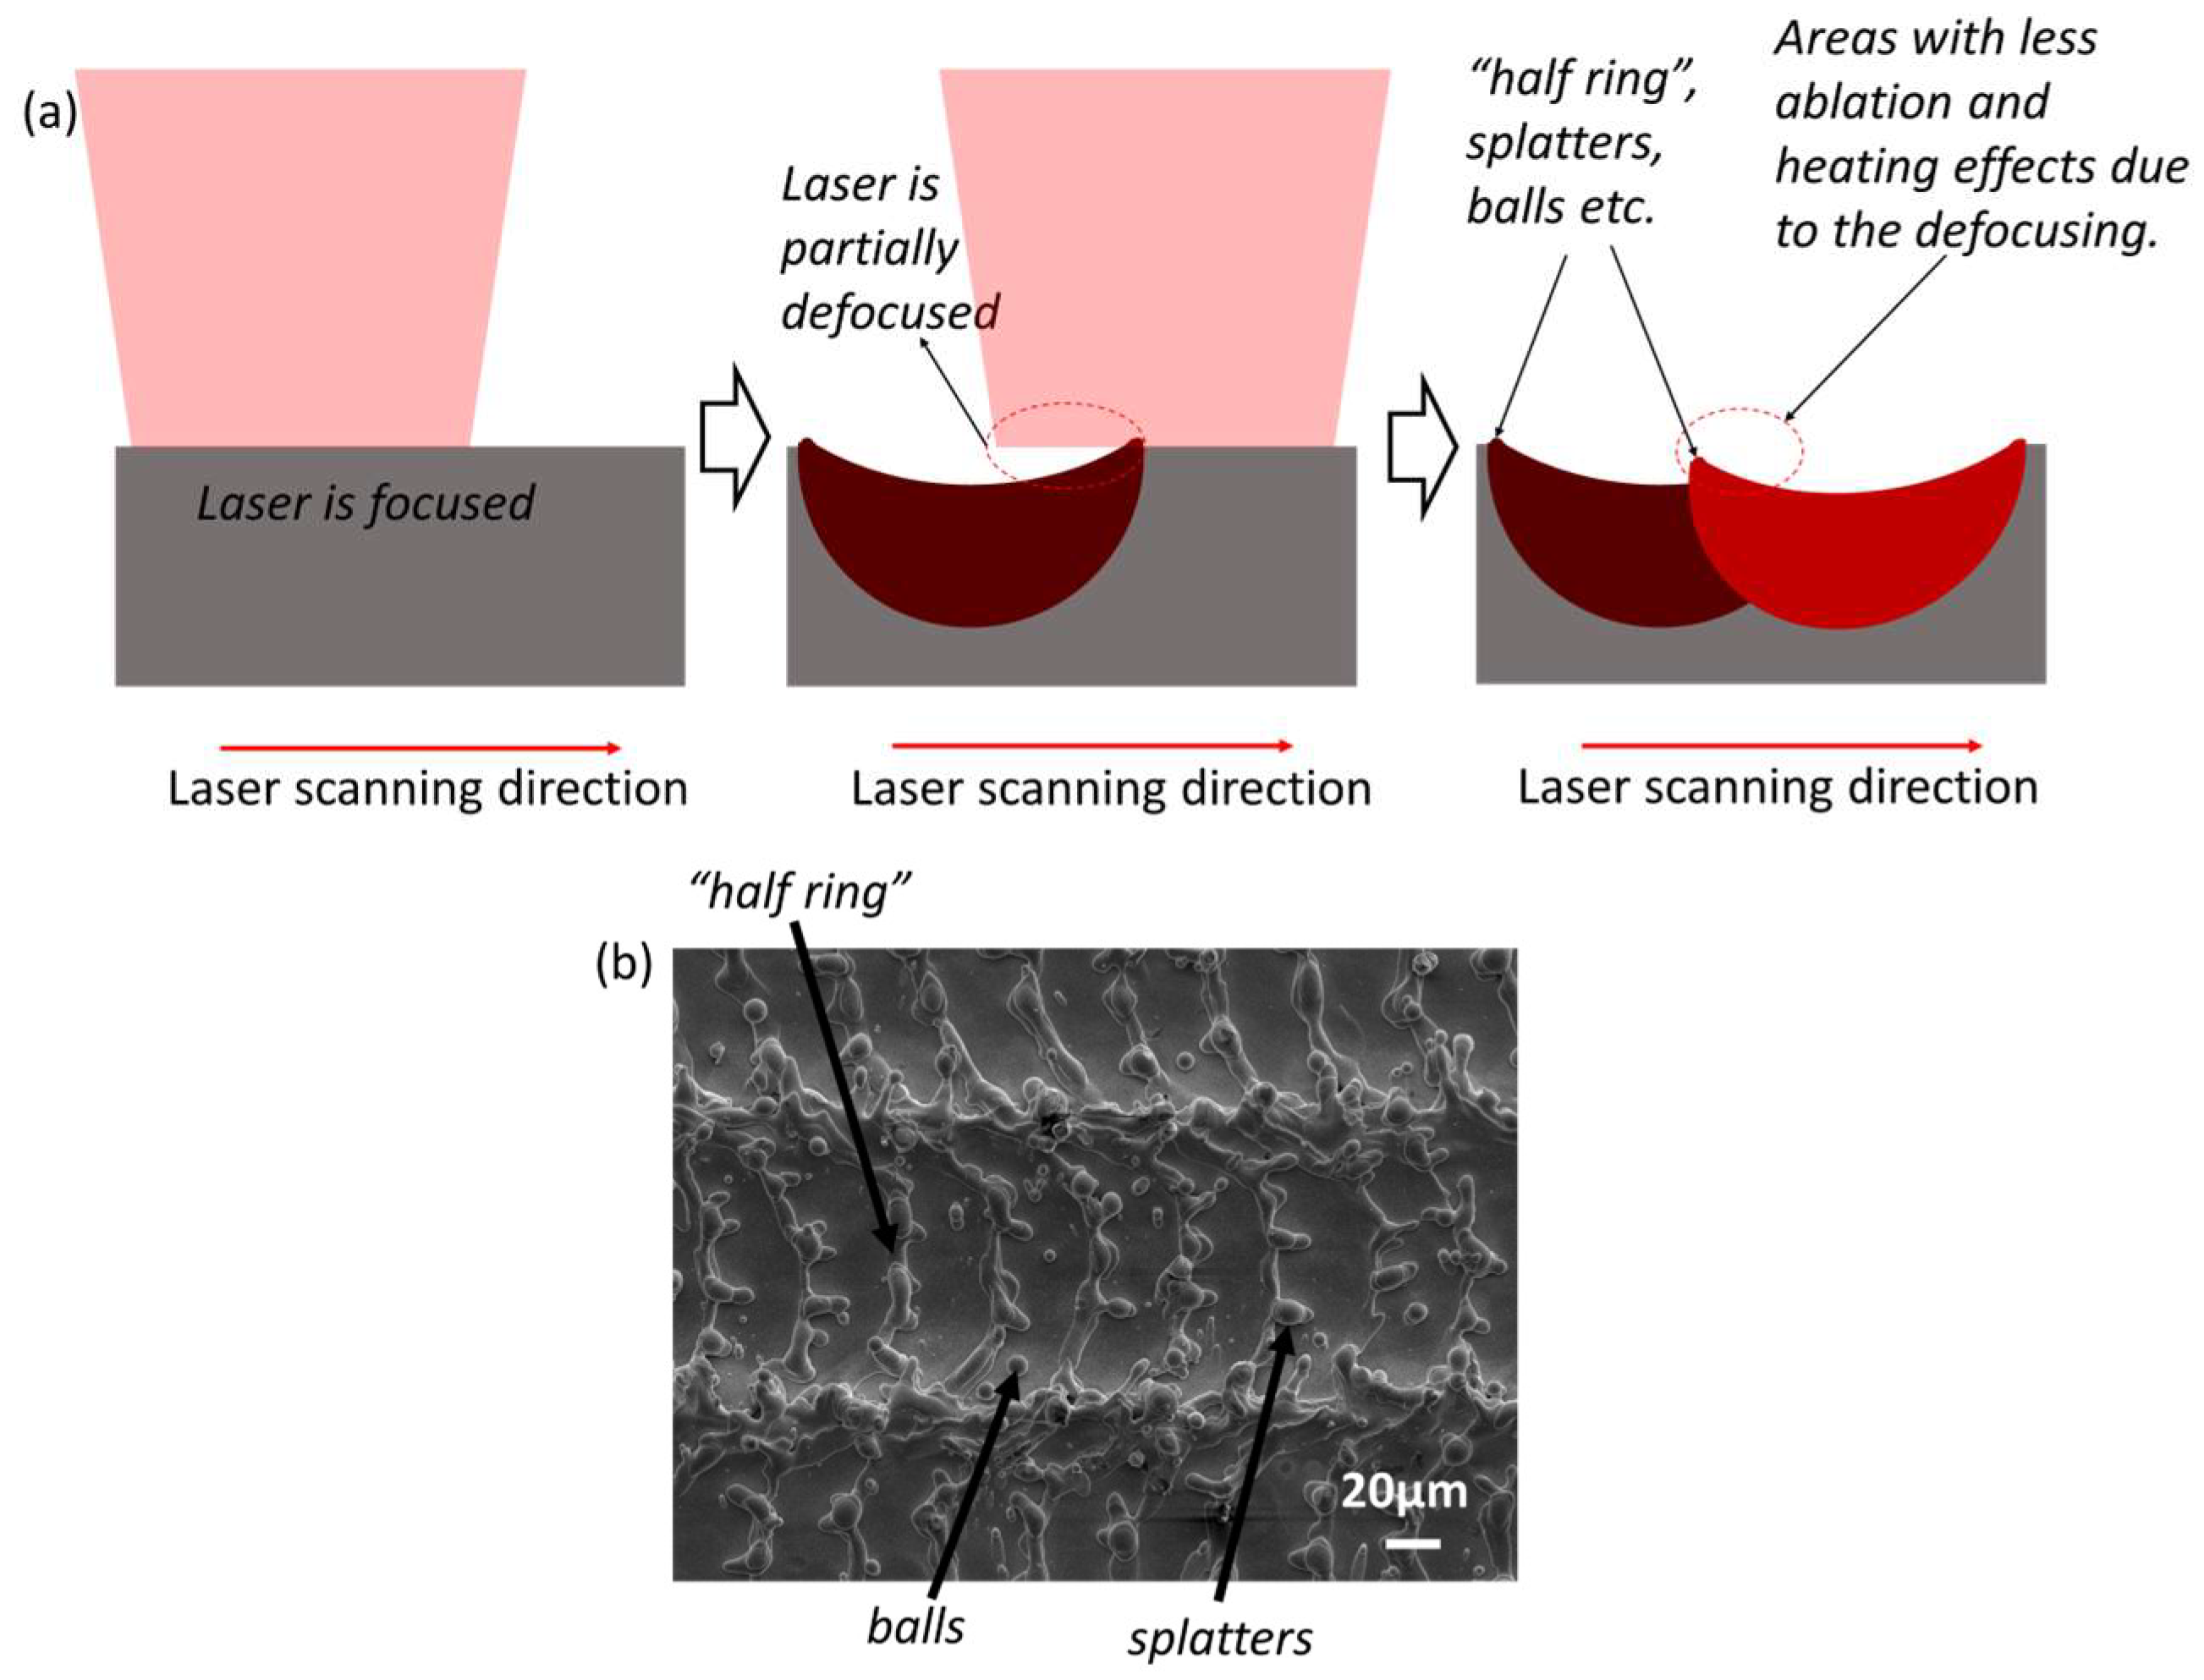
During laser line scanning on metals by a pulse laser, the processing resulted in a grooved structure. The processing of groove structures could be described using the schematic diagrams shown in Figure 14a. After processing the first single-pulse ablation, another laser pulse was irradiated with a bit of overlapping and defocusing at overlapping areas. The pulse ablation edge formed by the slight defocusing has a “half-ring” structure with a bit of ball and splatters. This half-ring structure is shallower than the edge of the grooves due to the defocusing. Each pulse ablation still has thermal and nonthermal ablation and Marangoni flow. Overlapping of pulse ablation ablates more materials and ejects more molten to the groove edges. The overlapping ablation finally builds up the groove structures with a high ridge and lower groove valleys with the ring structures. Because the molten materials are forced to the edge of the grooves and the adjacent areas, including the adjacent ablated areas, there are some thermal structures such as “half rings”, splatters and balls inside the grooves, as depicted in Figure 14b.
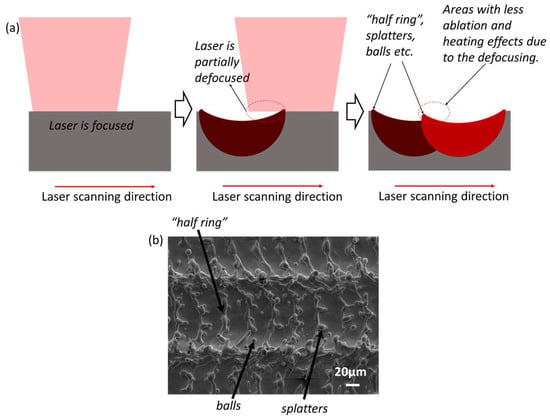
Figure 14.
Laser texturing mechanism of a single line scanning using a nanosecond infrared laser on metals. (a) The ablation of two adjacent pulse; (b) The morphology of “half ring”, balls and splatters.
The accumulation effects of each single-pulse ablation lead to the formation of rough or smooth grooves (see Figure 15e and Figure 16e), depending on the combination of laser parameters. Adjusting pulse overlap could change the groove structure from smooth to rough. Schnell et al. [49] textured Ti6Al4V while changing pulse overlaps from 40% to 90%. The groove changed from a smooth groove with a clear surface structure to a rough groove with many secondary features from excessive heating, such as cracks. Another study from Kittiboonanan et al. [50] showed similar surface textures after increasing pulse overlap from 10% to 90%. Their results also revealed that the features were enhanced and amplified at a higher pulse overlap. Additionally, the surface became more porous due to the excessive heating.
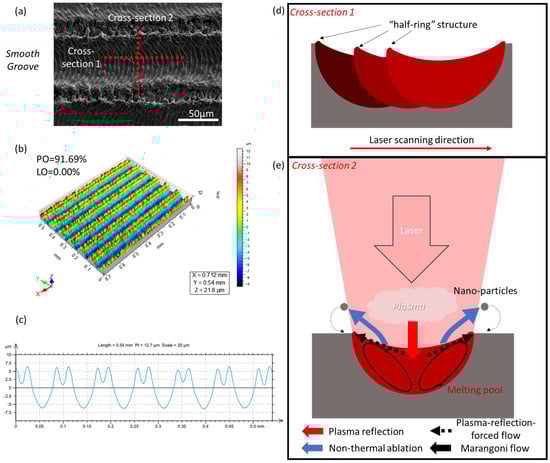
Figure 15.
Smooth groove surface texture: (a) SEM image of sample S5; (b) surface 3D structure of sample S5; (c) average cross-section view of sample S5; (d,e) two cross-section view of laser ablation mechanism.
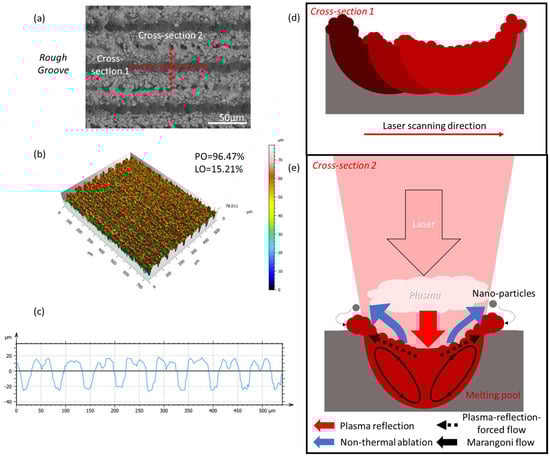
Figure 16.
Rough groove surface texture: (a) SEM image of sample S7; (b) surface 3D structure of sample S7; (c) average cross-section view of sample S7; (d,e) two cross-section view of laser ablation mechanism.
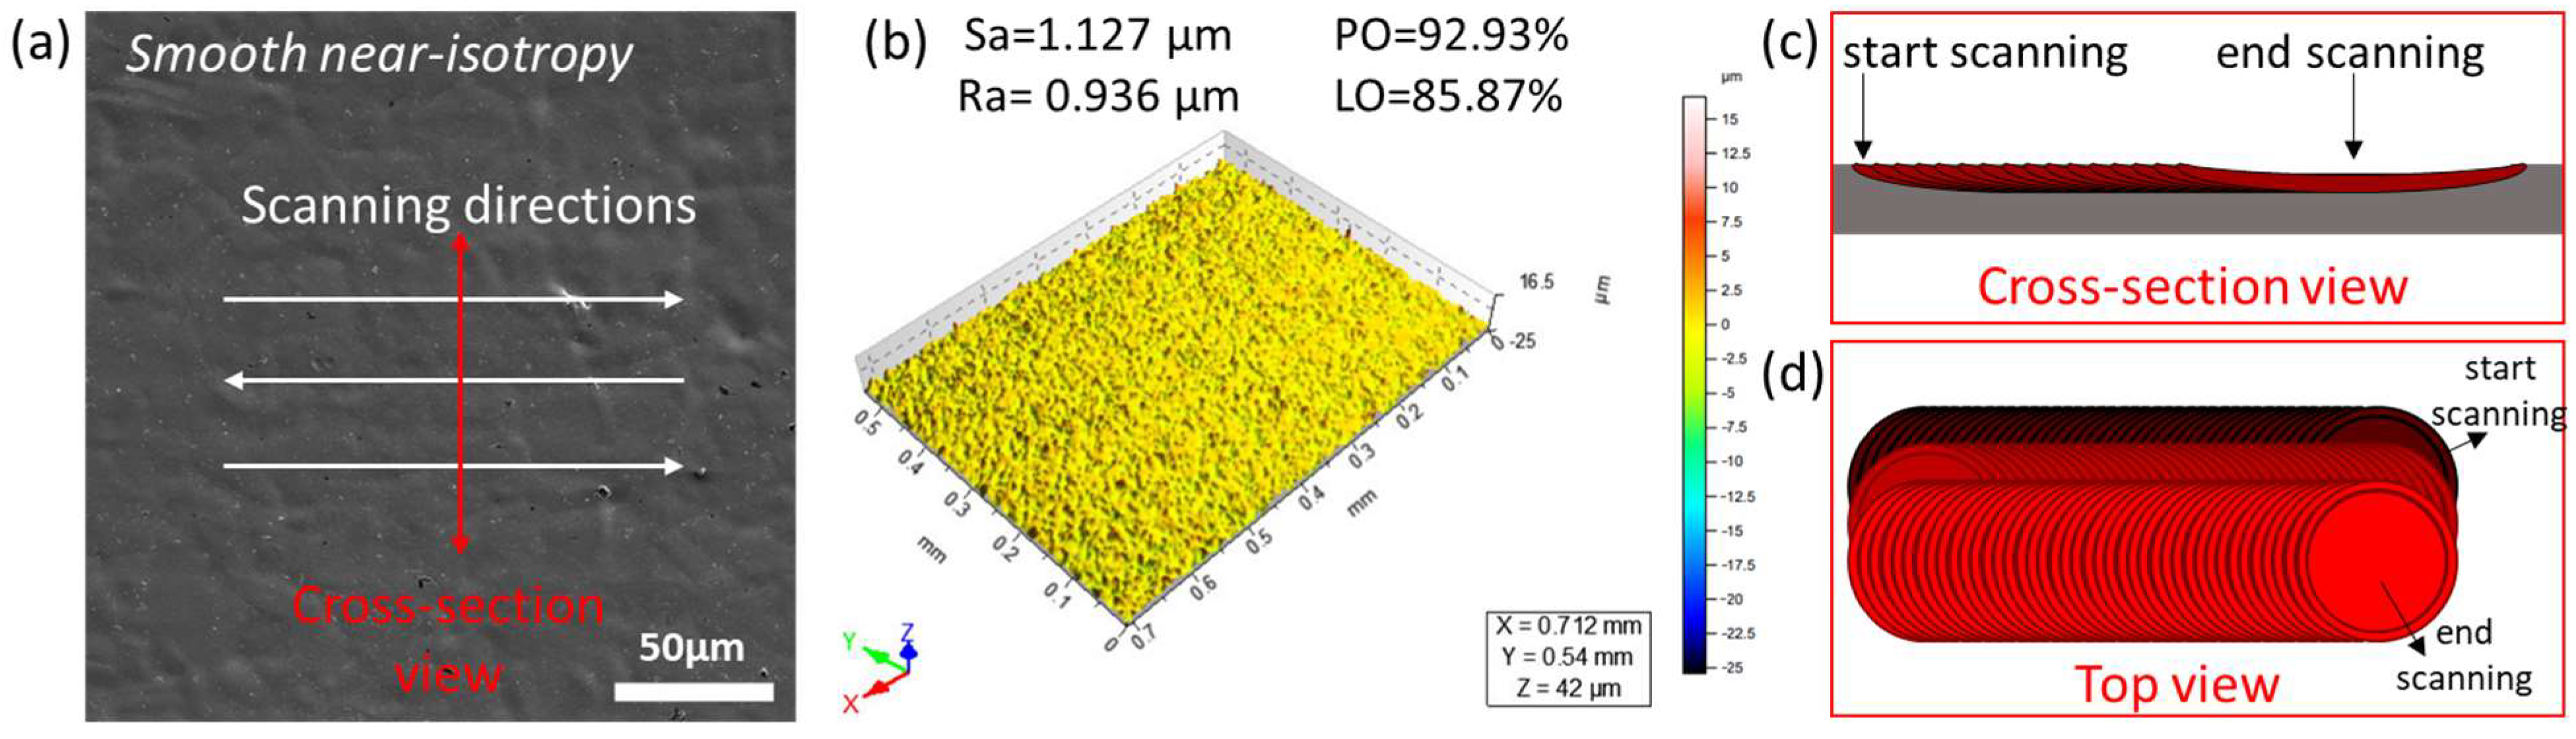
Scanning pitch is important for morphology of multiple-line scanning. It is the key to ablate areas of a surface. A reduction in pitch resulted in more remelting and re-solidification of previously ablated areas. Surfaces textures with near-isotropic morphology can be achieved at a lower pitch. The groove structure is rarely observed at extremely low pitch (e.g., 10 µm, compared to the spot size of 70.76 ± 1.72 µm). Also, the treated surface showed a more uniform texture. Figure 17 and Figure 18 show the formation mechanism of SS and RS samples. Figure 17a shows the schematic line of laser scanning routes. At the beginning of the scan route, the laser first fabricated a smooth groove. Then, multiple-line scanning in parallel and adjacently resulted in the formation of a smooth surface with uniform, low-height features due to overlapping, but also led to more heating, resulting in higher surface roughness (Sa = 1.127 ± 0.266 µm) than the as-received surface (Sa = 0.236 ± 0.006 µm). In Figure 18, the RS samples showed a texture with micro-protrusions covered with nano features (Figure 18c) and porous structures. The overlapping of multiple rough grooves created this rough surface, and that large amount of splatters resulted from melting and resolidification, which is similar to the results from Cocean et al. [51]. Excessive heating induced a lot of oxidation on the surface. SEM images and the 3D surface structure in Figure 17a,b and Figure 18a,b show many features, including the small height amplification bump on SS samples and large height amplification protrusions on RS samples. These are both the consequences of the complex ablation, melting, solidification, remelting and re-solidification between each spot ablation and line ablation, as shown in Figure 17c,d and Figure 18d,e. Wu et al. [52] indicated similar results in their research, in which a diamond surface was ablated through a sub-nanosecond pulsed laser with a different scanning pitch. The results indicated that the surface at a low scanning pitch has an isotropic surface 3D structure with micron features, found at a high scanning pitch, but is more randomly spread across the surface. Xie et al. [53] have also absorbed isotropic surface textures at a low scanning pitch through femtosecond laser ablation on aluminium samples. The micron features on the isotropic textures at a low scanning pitch could also be observed at a high pitch but were enhanced by large line overlaps. Their result also has a similar irregular rough surface to that of the S11–S14 sample in this research. The results from this literature supported the importance of scanning pitch and the accumulation effects from single-line to multi-line laser scanning.
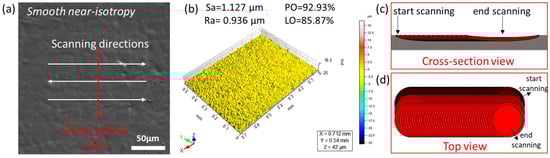
Figure 17.
Smooth near-isotropic structure: (a) SEM of S10, (b) surface 3D structure of S10, and (c,d) formation mechanism.
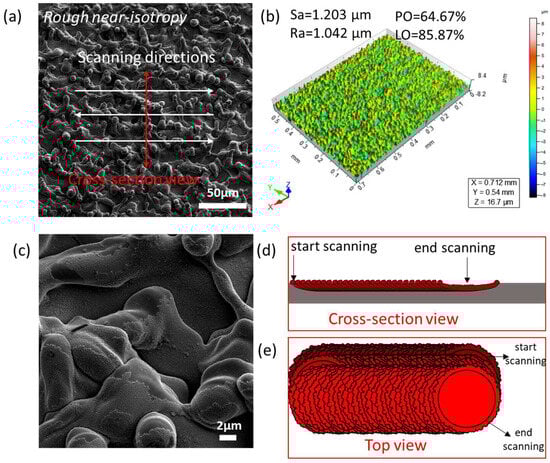
Figure 18.
Rough near-isotropic structure: (a) SEM of S11, (b) surface 3D structure of S11, (c) nano features covered micro-protrusion (S11), and (d,e) formation mechanism.
3.3. Porous and Feather-like Dendrites Crystal Textures
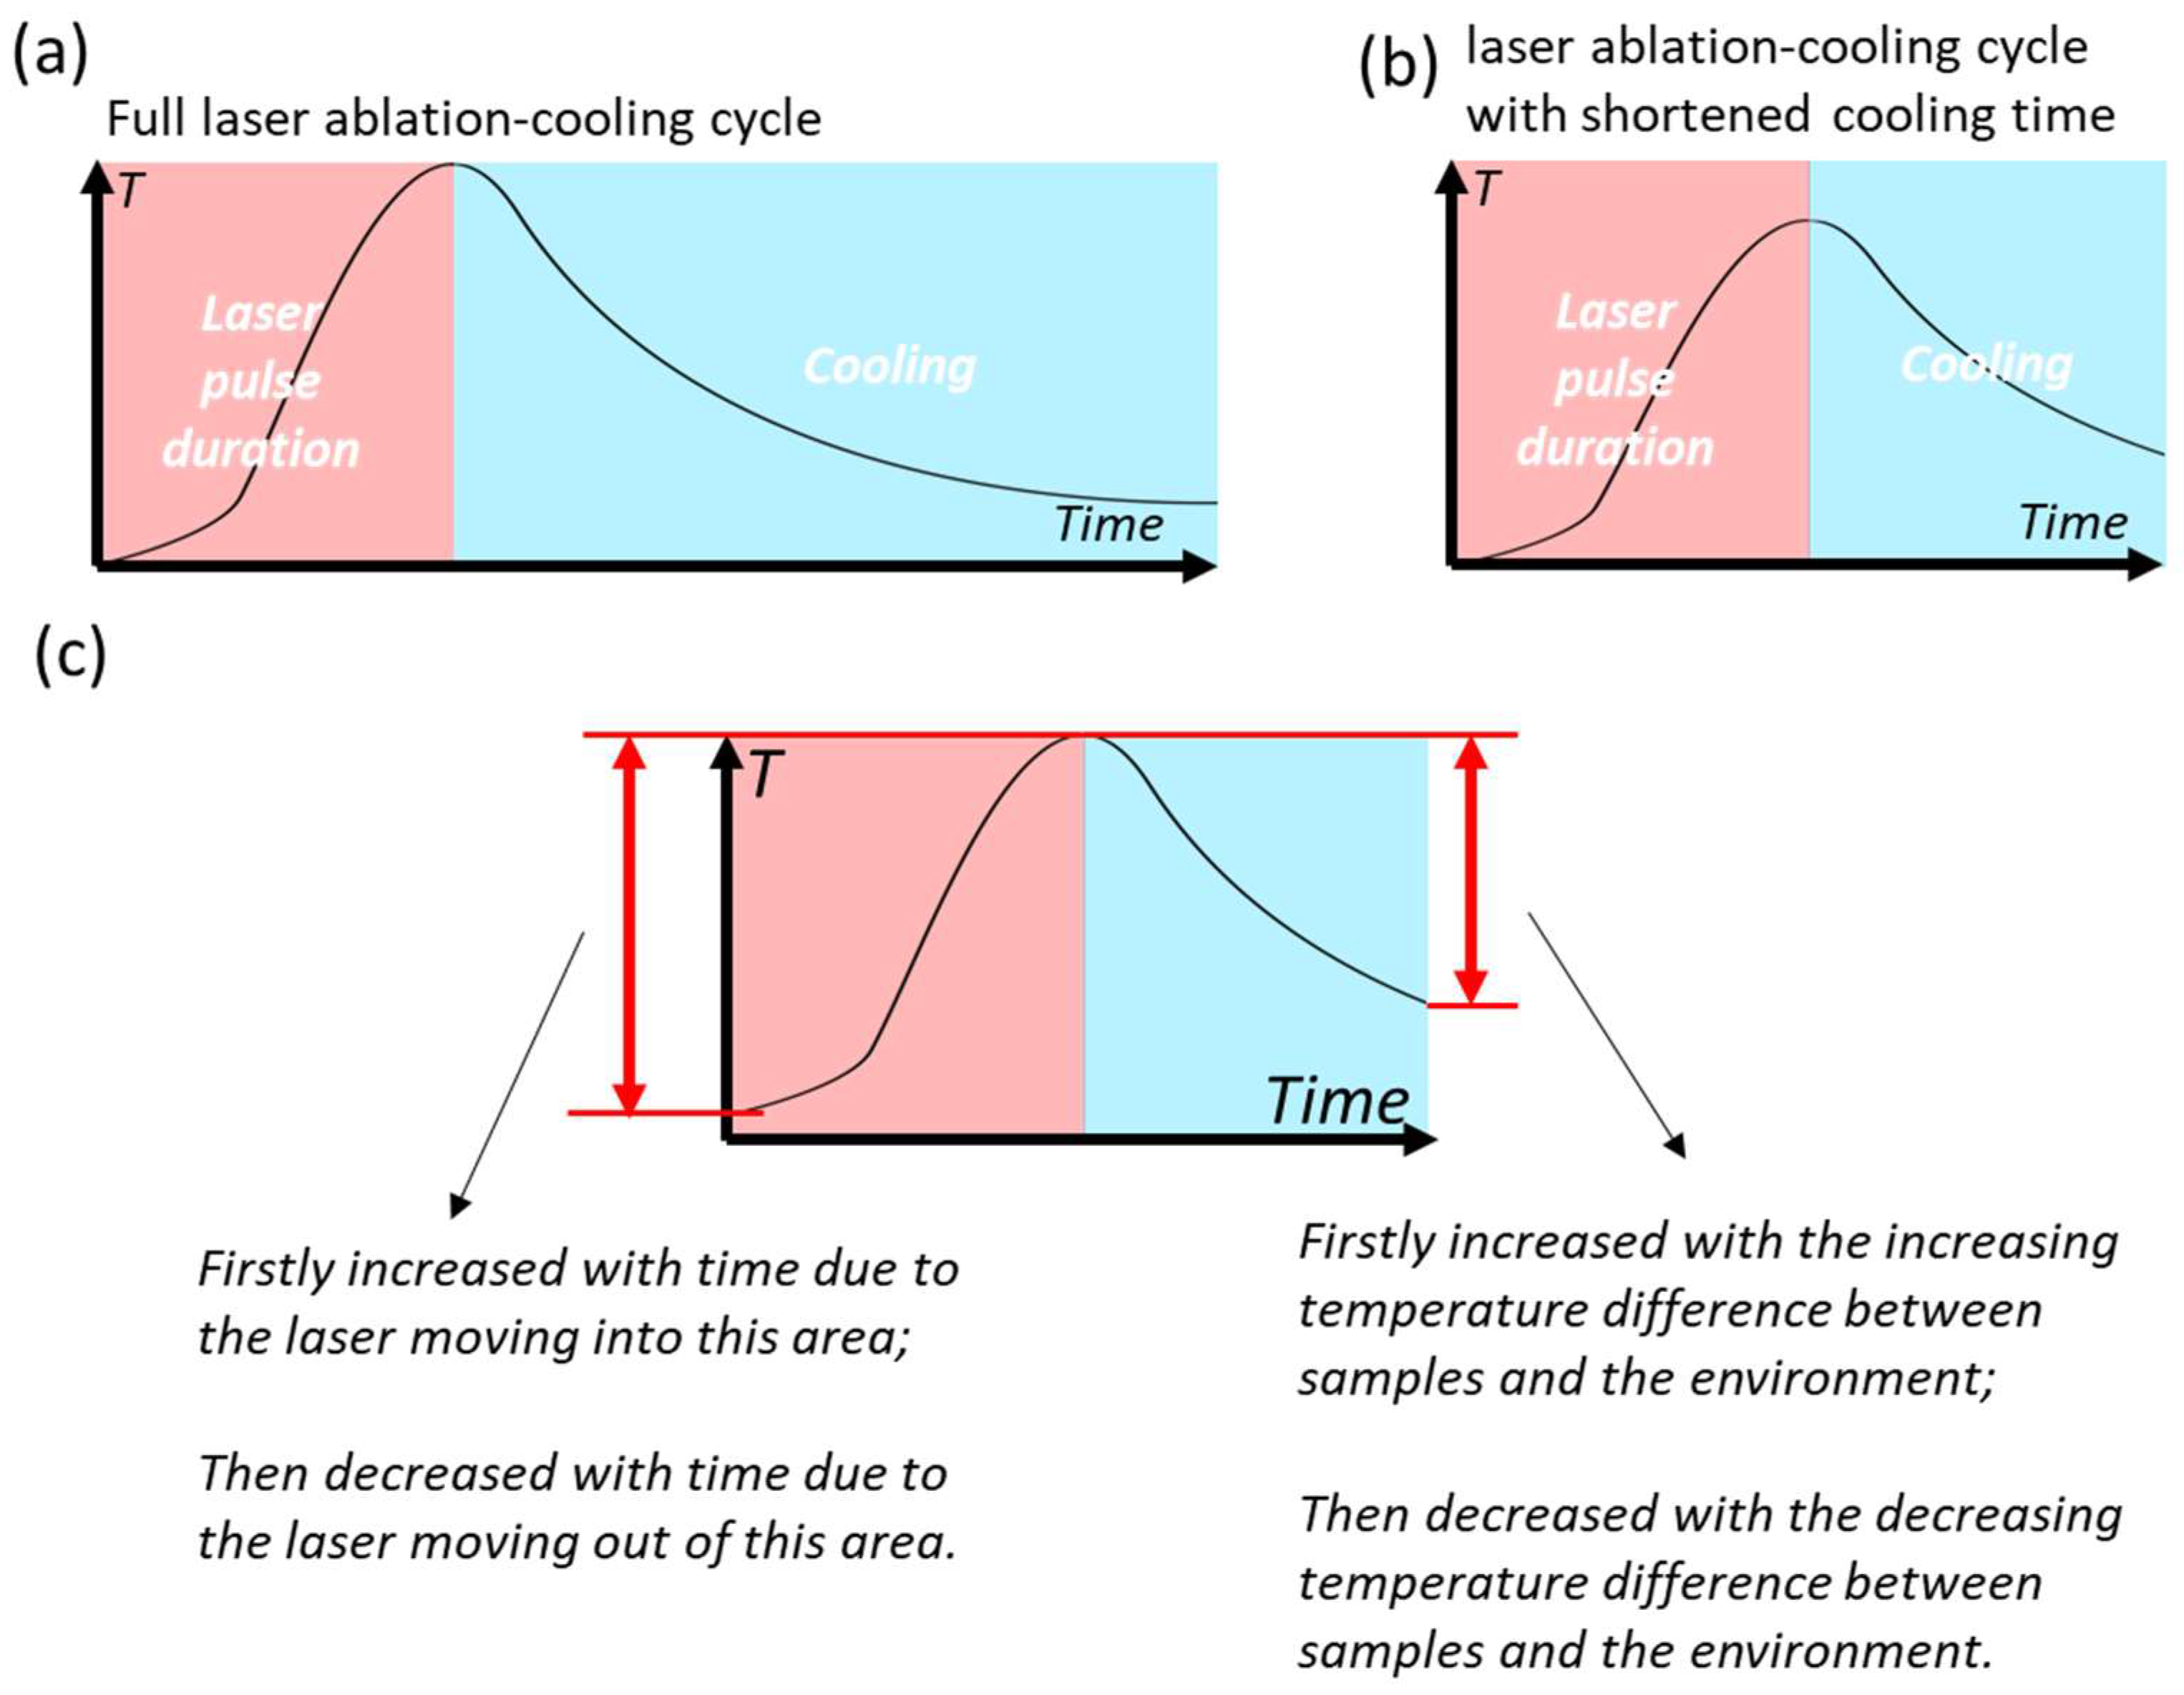
The novel textures, porous and feather-like textures were both formed at extremely high pulse overlap. The mechanisms of the formation of these two textures are different from classical textures, with more consideration of heating effects. Before the detailed analysis of mechanisms, the thermal heating–cooling cycle of extremely low feed speed and extremely high frequency has been shown in Figure 19. Extremely low feed speed did not affect the cooling stage since it does not change the time between pulses as Figure 19a shows. The single-pulse fluence is also higher than the condition with high frequency, according to Equation (1). An extremely high frequency shortened the cooling time, because high frequency resulted in a low intermediate time between pulses (Figure 19b). The single-pulse fluence was also low, according to Equation (1). During the laser single-line scanning, the temperature rising during laser ablation was increased with the laser move-in and decreased with the laser move-out. According to Newton’s law of cooling, the cooling rate was proportional to the temperature difference between the spots and the environment [54]. With the understanding of this information, a detailed analysis of formation mechanisms is discussed below.

Figure 19.
(a) Full temperature–time curve during laser pulse and cooling. Sample with extremely low feed speed went through this process. The high temperature rising is due to the high single pulse fluence. (b) Temperature–time curve with shortened cooling time due to the shortened time between pulses. Sample with extremely high frequency went through this process due to the shortened intermediate time between pulses. The low temperature rising is due to the low single pulse fluence. (c) Explaining the temperature rise and temperature drop rate during single-line laser scanning.
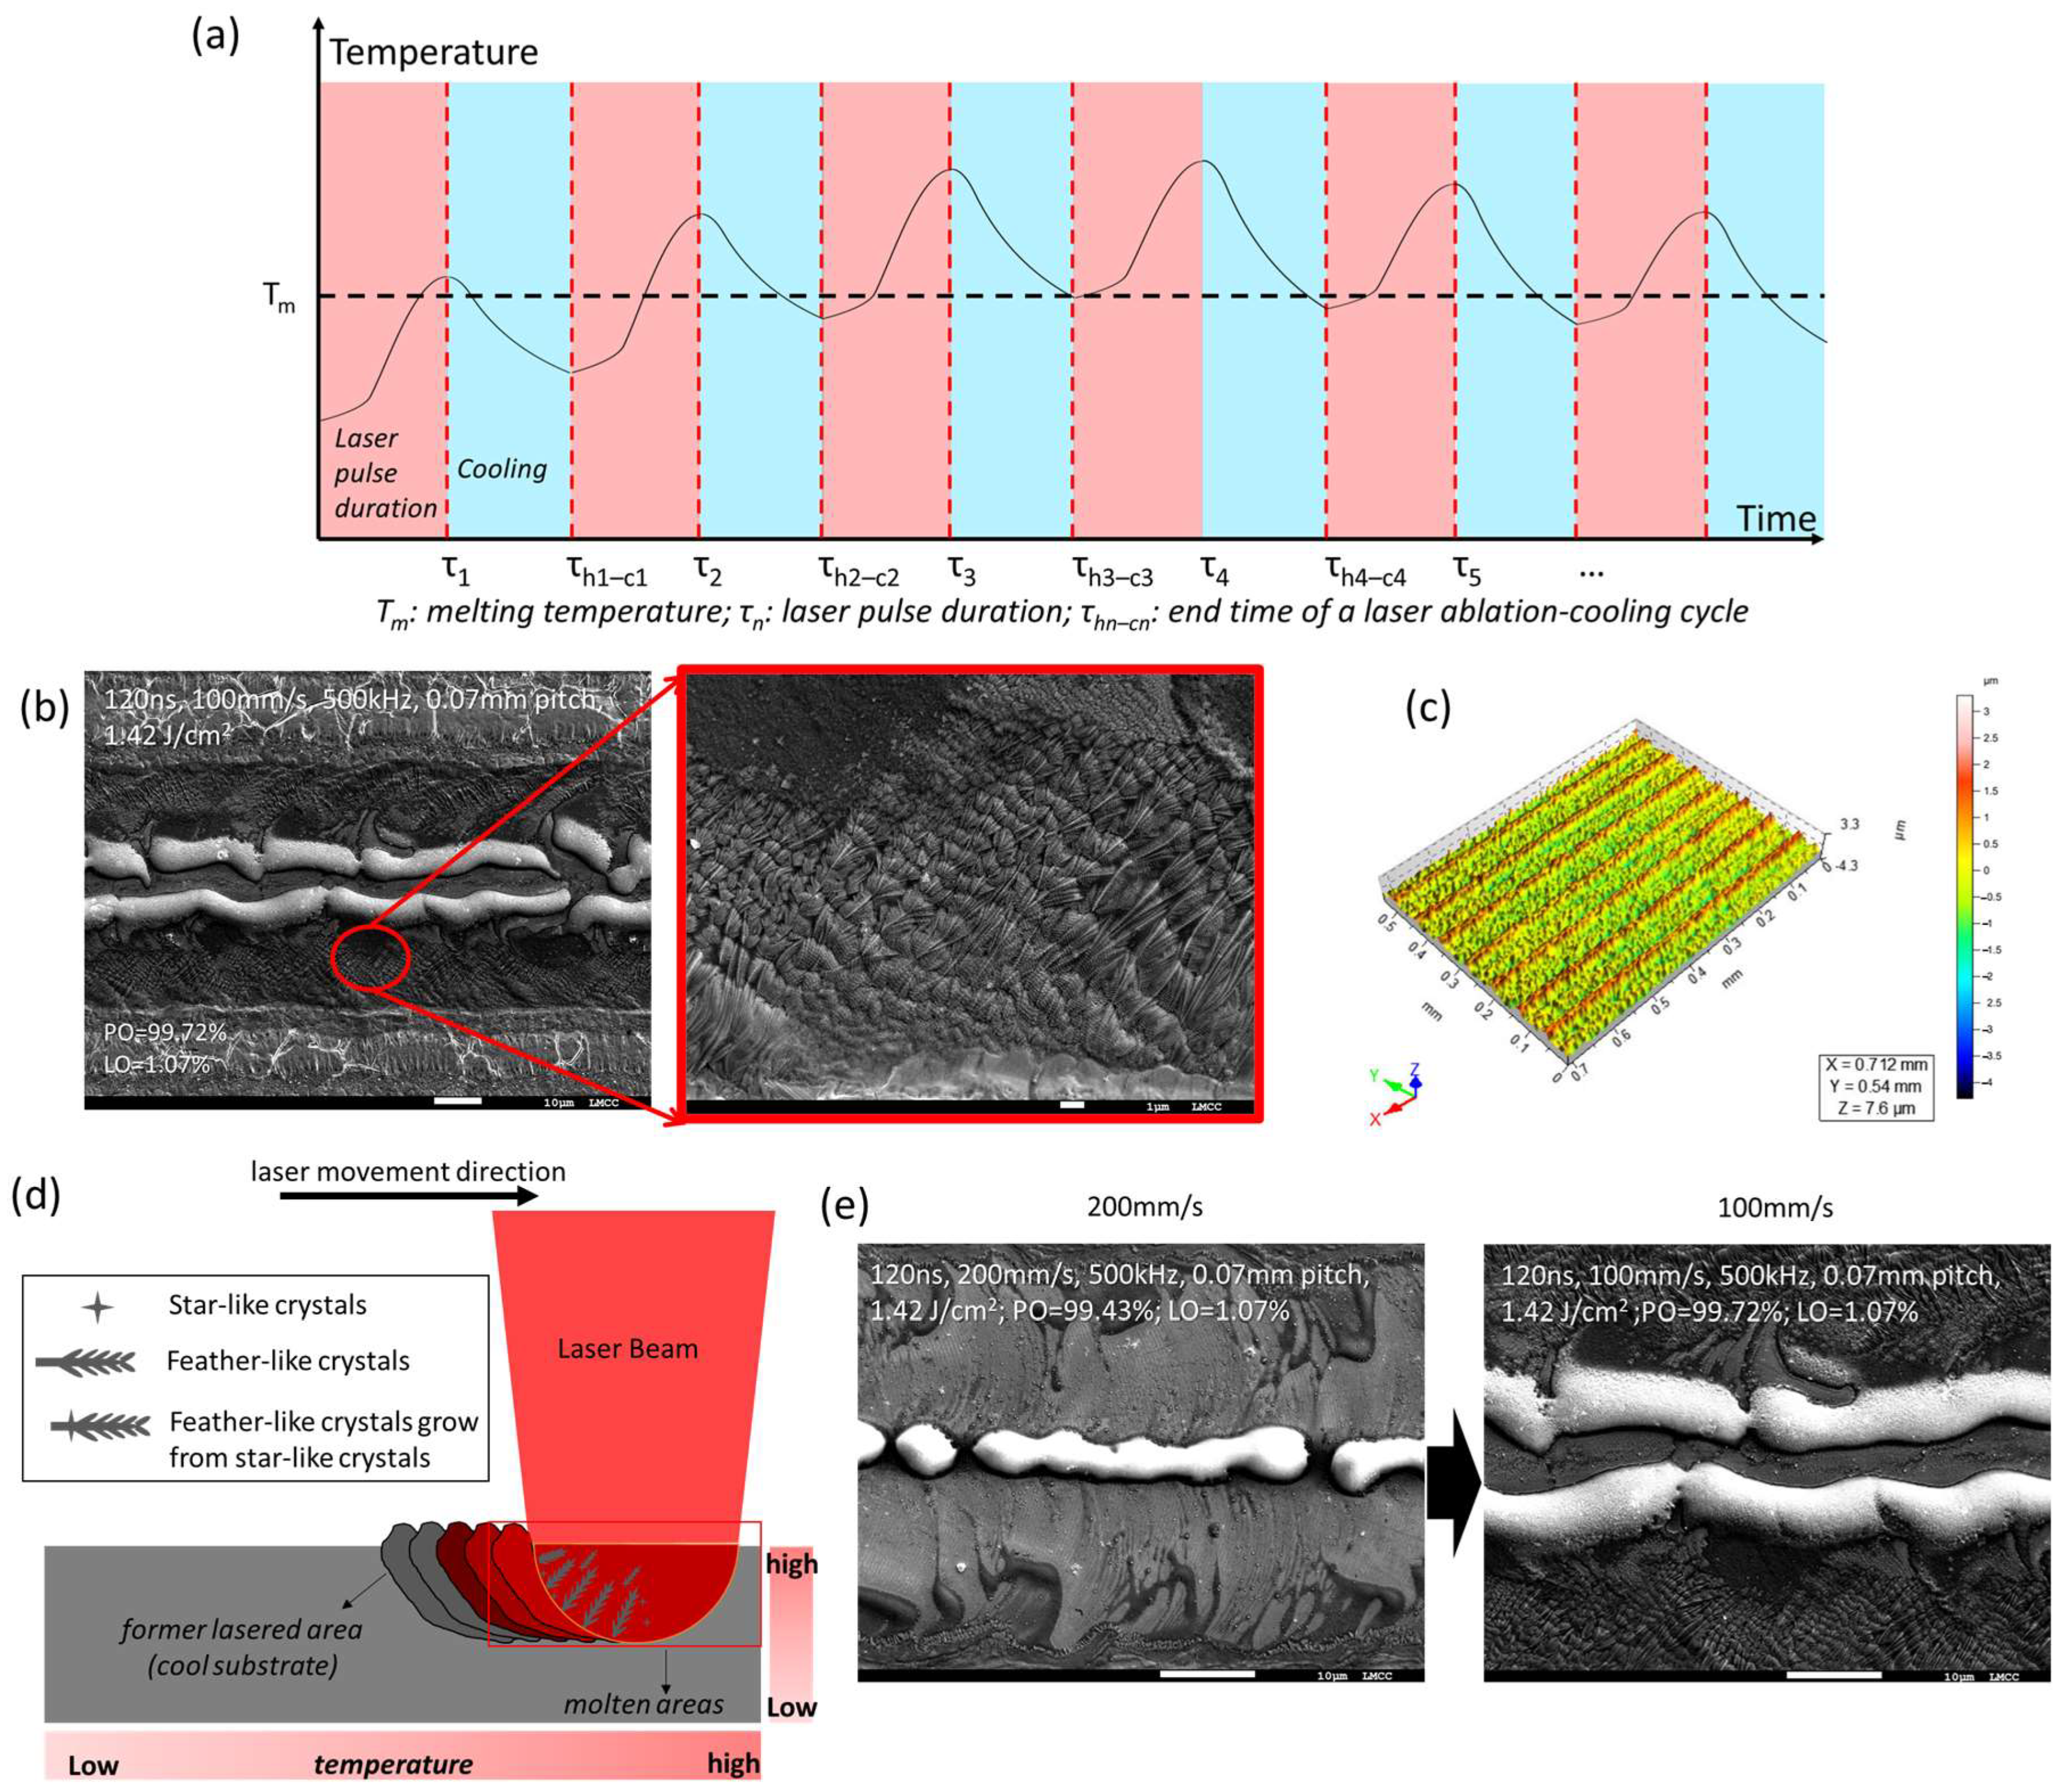
Feather-like dendrites textures (see Figure 20b) were also observed in the current study with extremely high pulse overlap, which is >99% at 500 kHz and 100 mm/s for S19, as shown in Table 2. It was possible that these feather-like textures were a dendrite crystalline structure, which is commonly observed in casting [36], additive manufacturing [37] and welding processes [55] and is rarely observed in laser texturing processes. Increasing the frequency from 20 to 500 kHz decreases the intermediate time between the adjacent pulse from 50 to 2 µs, greatly increasing the disturbance of the cooling process of previous laser irradiation by the following laser irradiation, as shown by the temperature–time curve in Figure 20a. Decreasing single-pulse fluence at a high frequency led to a reduction in the energy irradiated on the surface. This further reduced the ablation intensity and plasma formation. The low fluence further limited the rate of temperature increase in each laser irradiation. Because the temperature of the materials increased with laser irradiation, the extremely high pulse overlapping for S19 at an extremely high frequency kept the same areas in a higher range of temperature. As a result, firstly, the materials were kept at a higher temperature range, and the cooling rate was slowed down; secondly, fewer materials were pressed out of the ablated area and the resulting grooved structures were shallow (Figure 20c); thirdly, the Marangoni flow of materials was enhanced by high temperatures. These surface conditions favoured the crystallisation shown in Figure 20b. Because the crystals started to grow along a positive temperature gradient [56,57], the feather-like crystals grew from the edge of each melting pool (i.e., the edge of each pulse ablation and each groove) in the laser beam moving direction (Figure 20d). Marangoni flow also enhanced crystal growth because the Marangoni flow was in the same direction as crystal growth. Additionally, the crystallisation at an extremely high frequency could be enhanced with the reduced feed speed, as Figure 20e shows. This is because the reduced feed speed further increased the pulse overlap according to Equation (3) (Table 2).
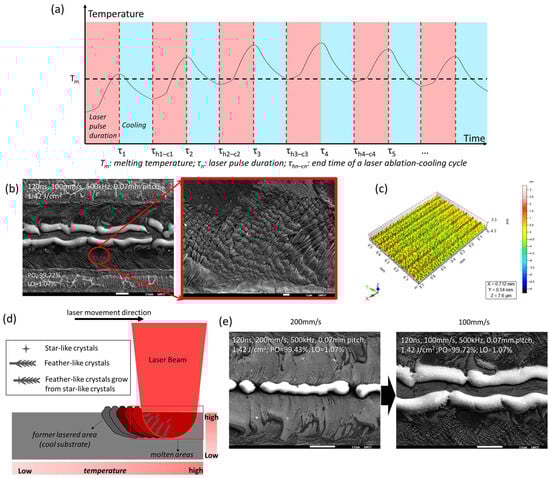
Figure 20.
Feather-like dendrites texture-covered textures: (a) temperature–time curve at extremely high frequency; (b) SEM images of F sample S19; (c) surface 3D structure of S19; (d) formation of dendrites; (e) morphology change while reducing feed speed from 200 mm/s (S18) to 100 mm/s (S19).
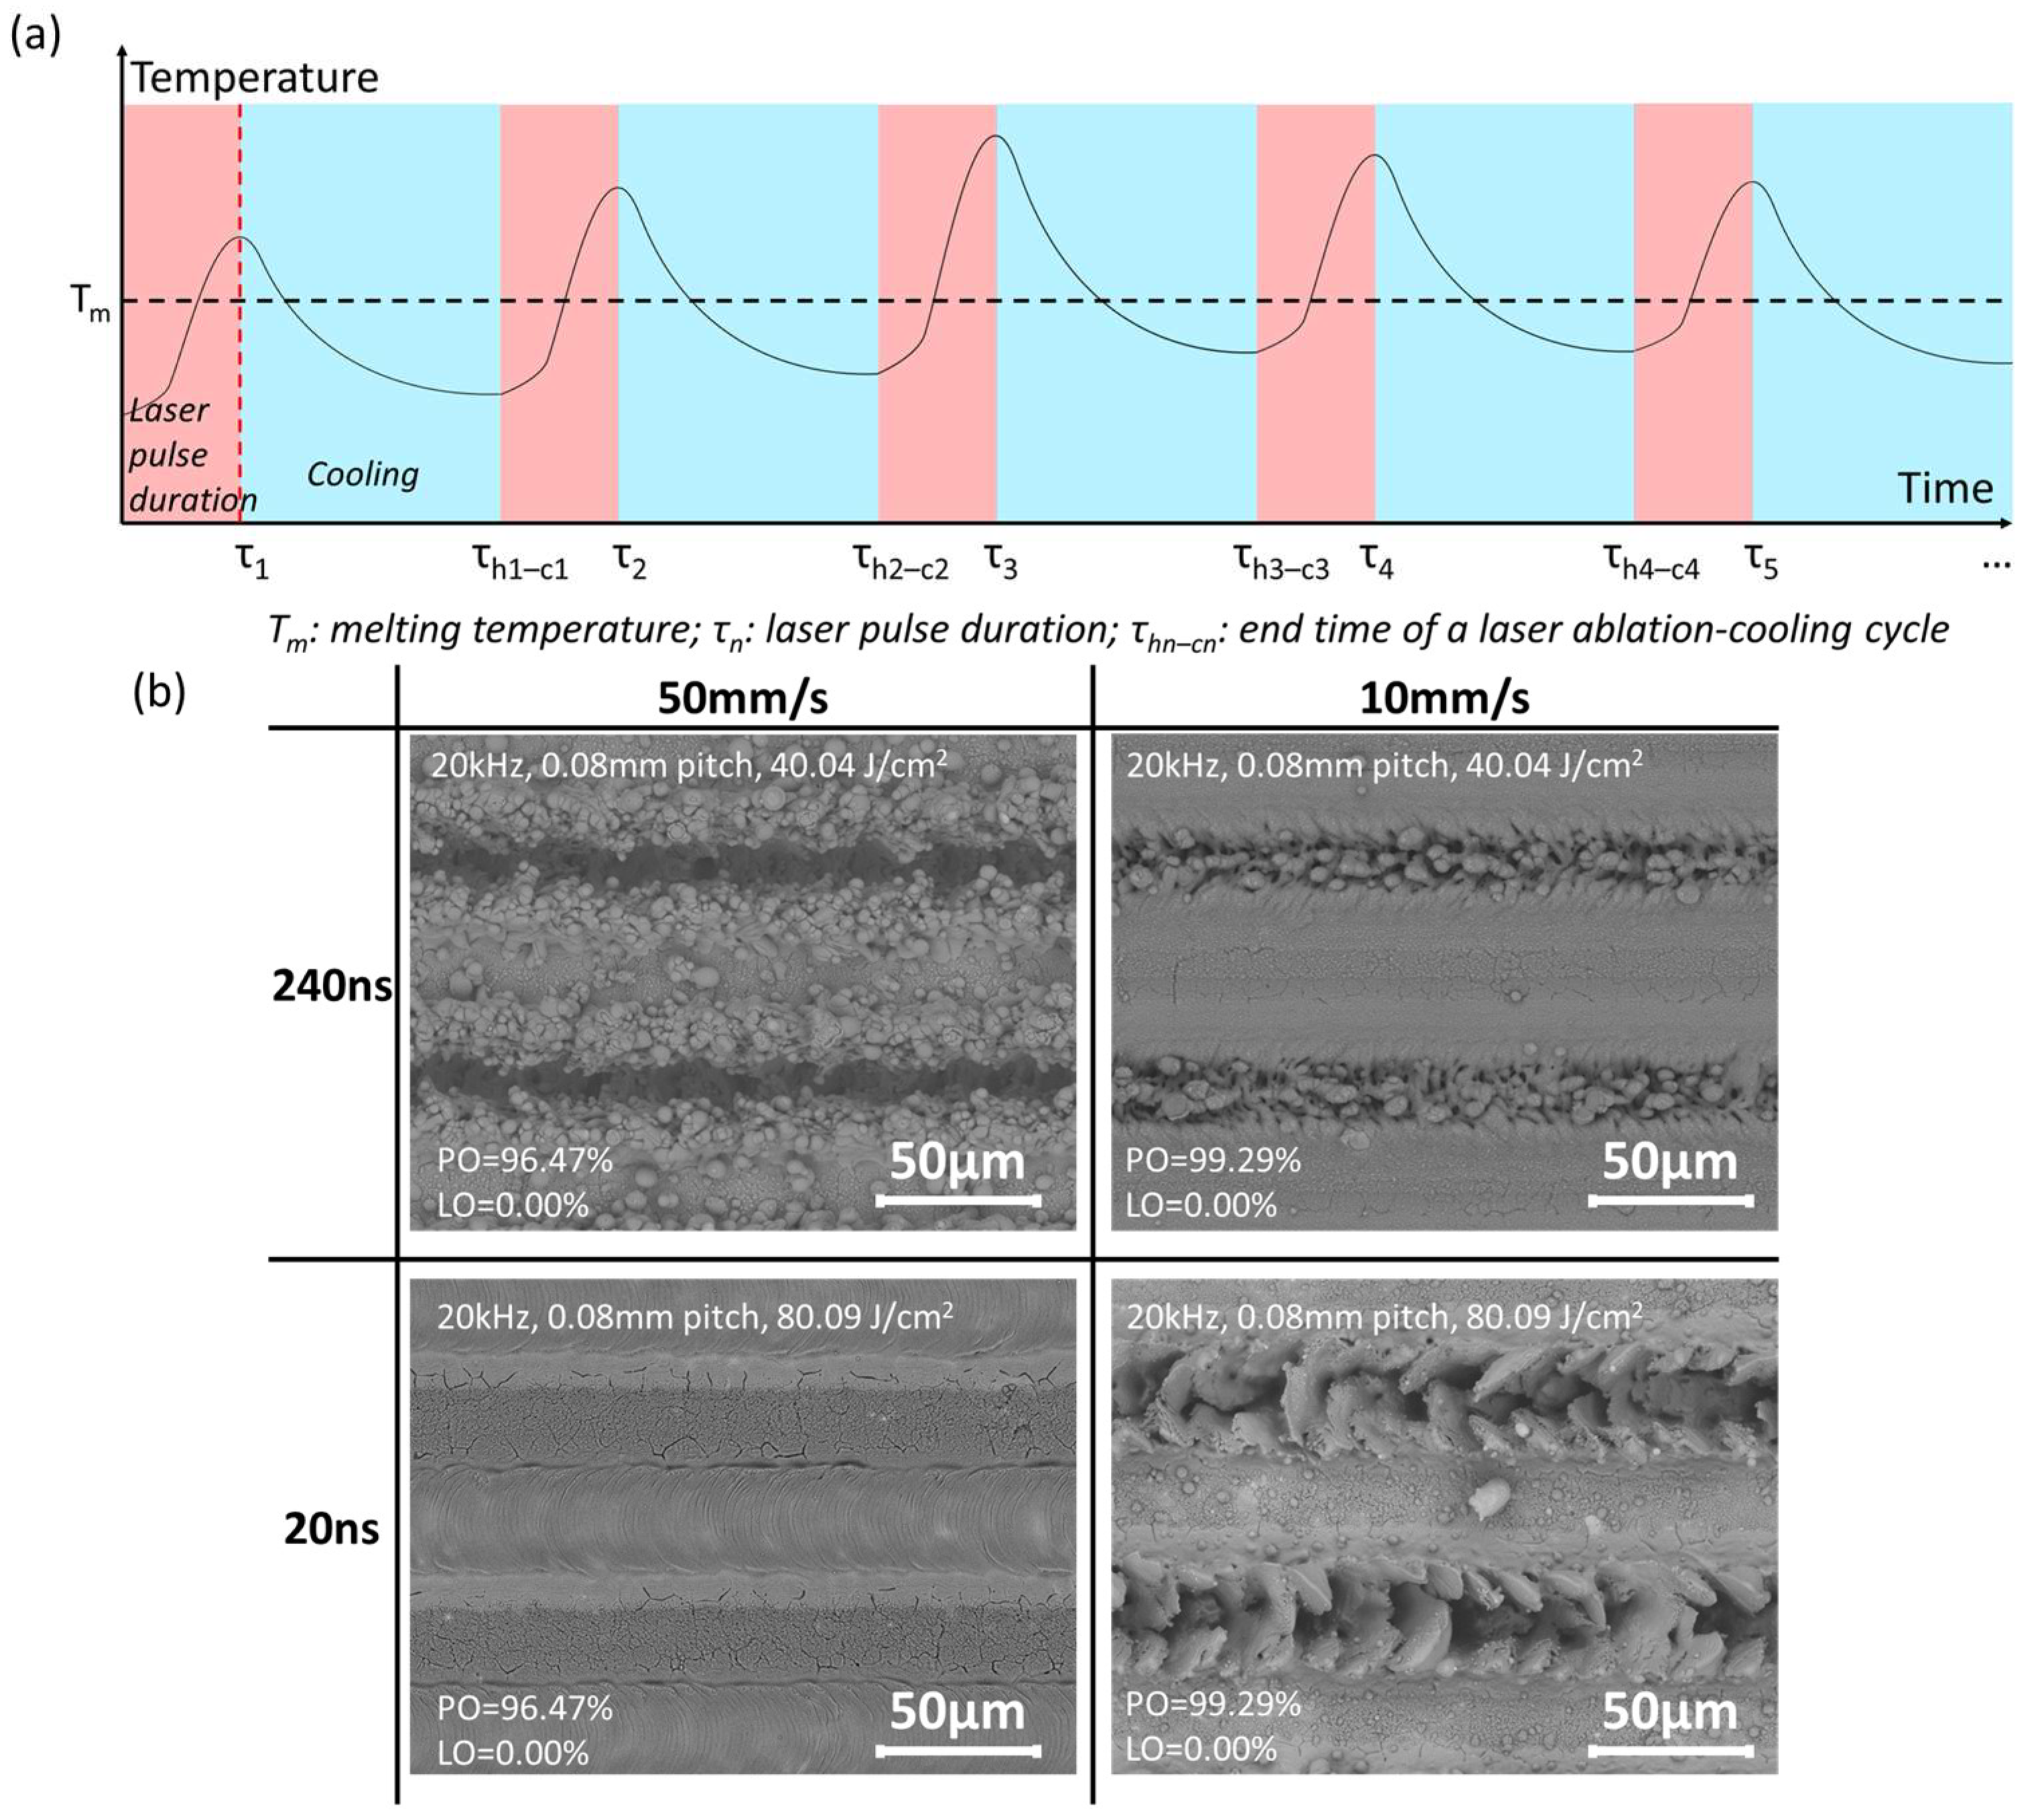
Unlike increasing frequency, reduced feed speed could increase the pulse overlap independently without changing the single-pulse fluence. The reduction in feed speed increased the laser overlap and, thus, laser energy irradiated in the same areas. If a low pulse frequency is used (<20 kHz), the intermediate time between two pulses is long (>50 μs), and each laser pulse ablation process is not affected by adjacent pulse ablation. Because of the high pulse overlap at a low feed speed, the same area was heated and ablated by multiple pulses, and the corresponding temperature change is shown in Figure 21a. Since increasing pulse overlaps did not reduce the single-pulse fluence through decreasing feed speed, as that happened during the increasing frequency, the highest temperature in each heating–cooling cycle was high, and the heating–cooling rate remained high. Due to the long intermediate time between two pulses, the surfaces had more time for cooling during each cycle compared with Figure 20a, and the temperature fluctuation was large. Even with a similar high pulse overlap, the heating effects and ablation of laser processing at a low feed speed were more dramatic than at a high frequency. Suppose high energy and/or long pulse width are used; in that case, the excessive heating from repeated irradiation in the same areas can create excessive heating marks entangled with each other, leading to porous structure formation (240 ns samples in Figure 21b). If a short pulse width is used, non-thermal ablation dominates the process, and the surface explodes because of the enhanced non-thermal ablation (20 ns samples in Figure 21b). These results could be further explained with keyhole effects, as stated in Section 3.2. The low feed speed and inward Marangoni flow enhanced the keyhole effects and left more poles and holes inside the molten materials [47]. These pores and holes remained after solidification.
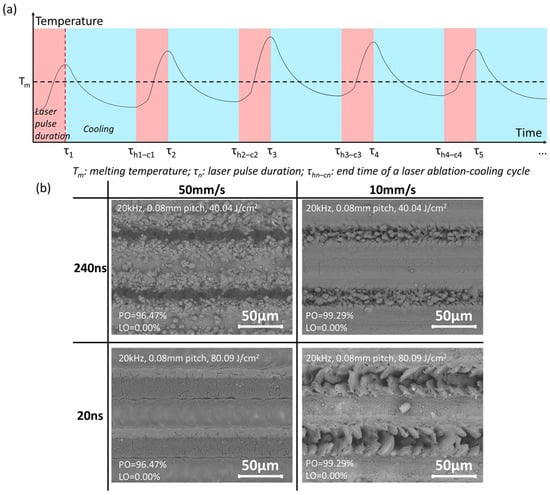
Figure 21.
Surface textures at low feed speed: (a) temperature–time curve at extremely low feed speed; (b) SEM images of samples with various feed speeds and pulse widths, frequency 20 kHz, pitch 0.08, fluence 40.04 J/cm2 for 240 ns samples, fluence 80.09 J/cm2 for 240 ns samples.
Collectively, laser parameters can be fine-tuned to control the effects of laser ablation to produce various types of surface textures. High fluence or energy density directly increased the energy irradiated to the surface. A large pulse width increased the energy absorption time and thus increased the energy absorbed. The decrease in feed speed and pitch reduced the pulse overlap and line overlapping, respectively, while increasing the repetition of all laser ablation steps in the same areas; increasing the frequency also increased the pulse overlap but with a decrease in fluence due to the pre-set waveform in the experiments. Hence, a nanosecond pulse width and infrared wavelength laser can be applied to fabricate various topographic features and surface patterns on micro and nanoscales.
3.4. Wettability Modification
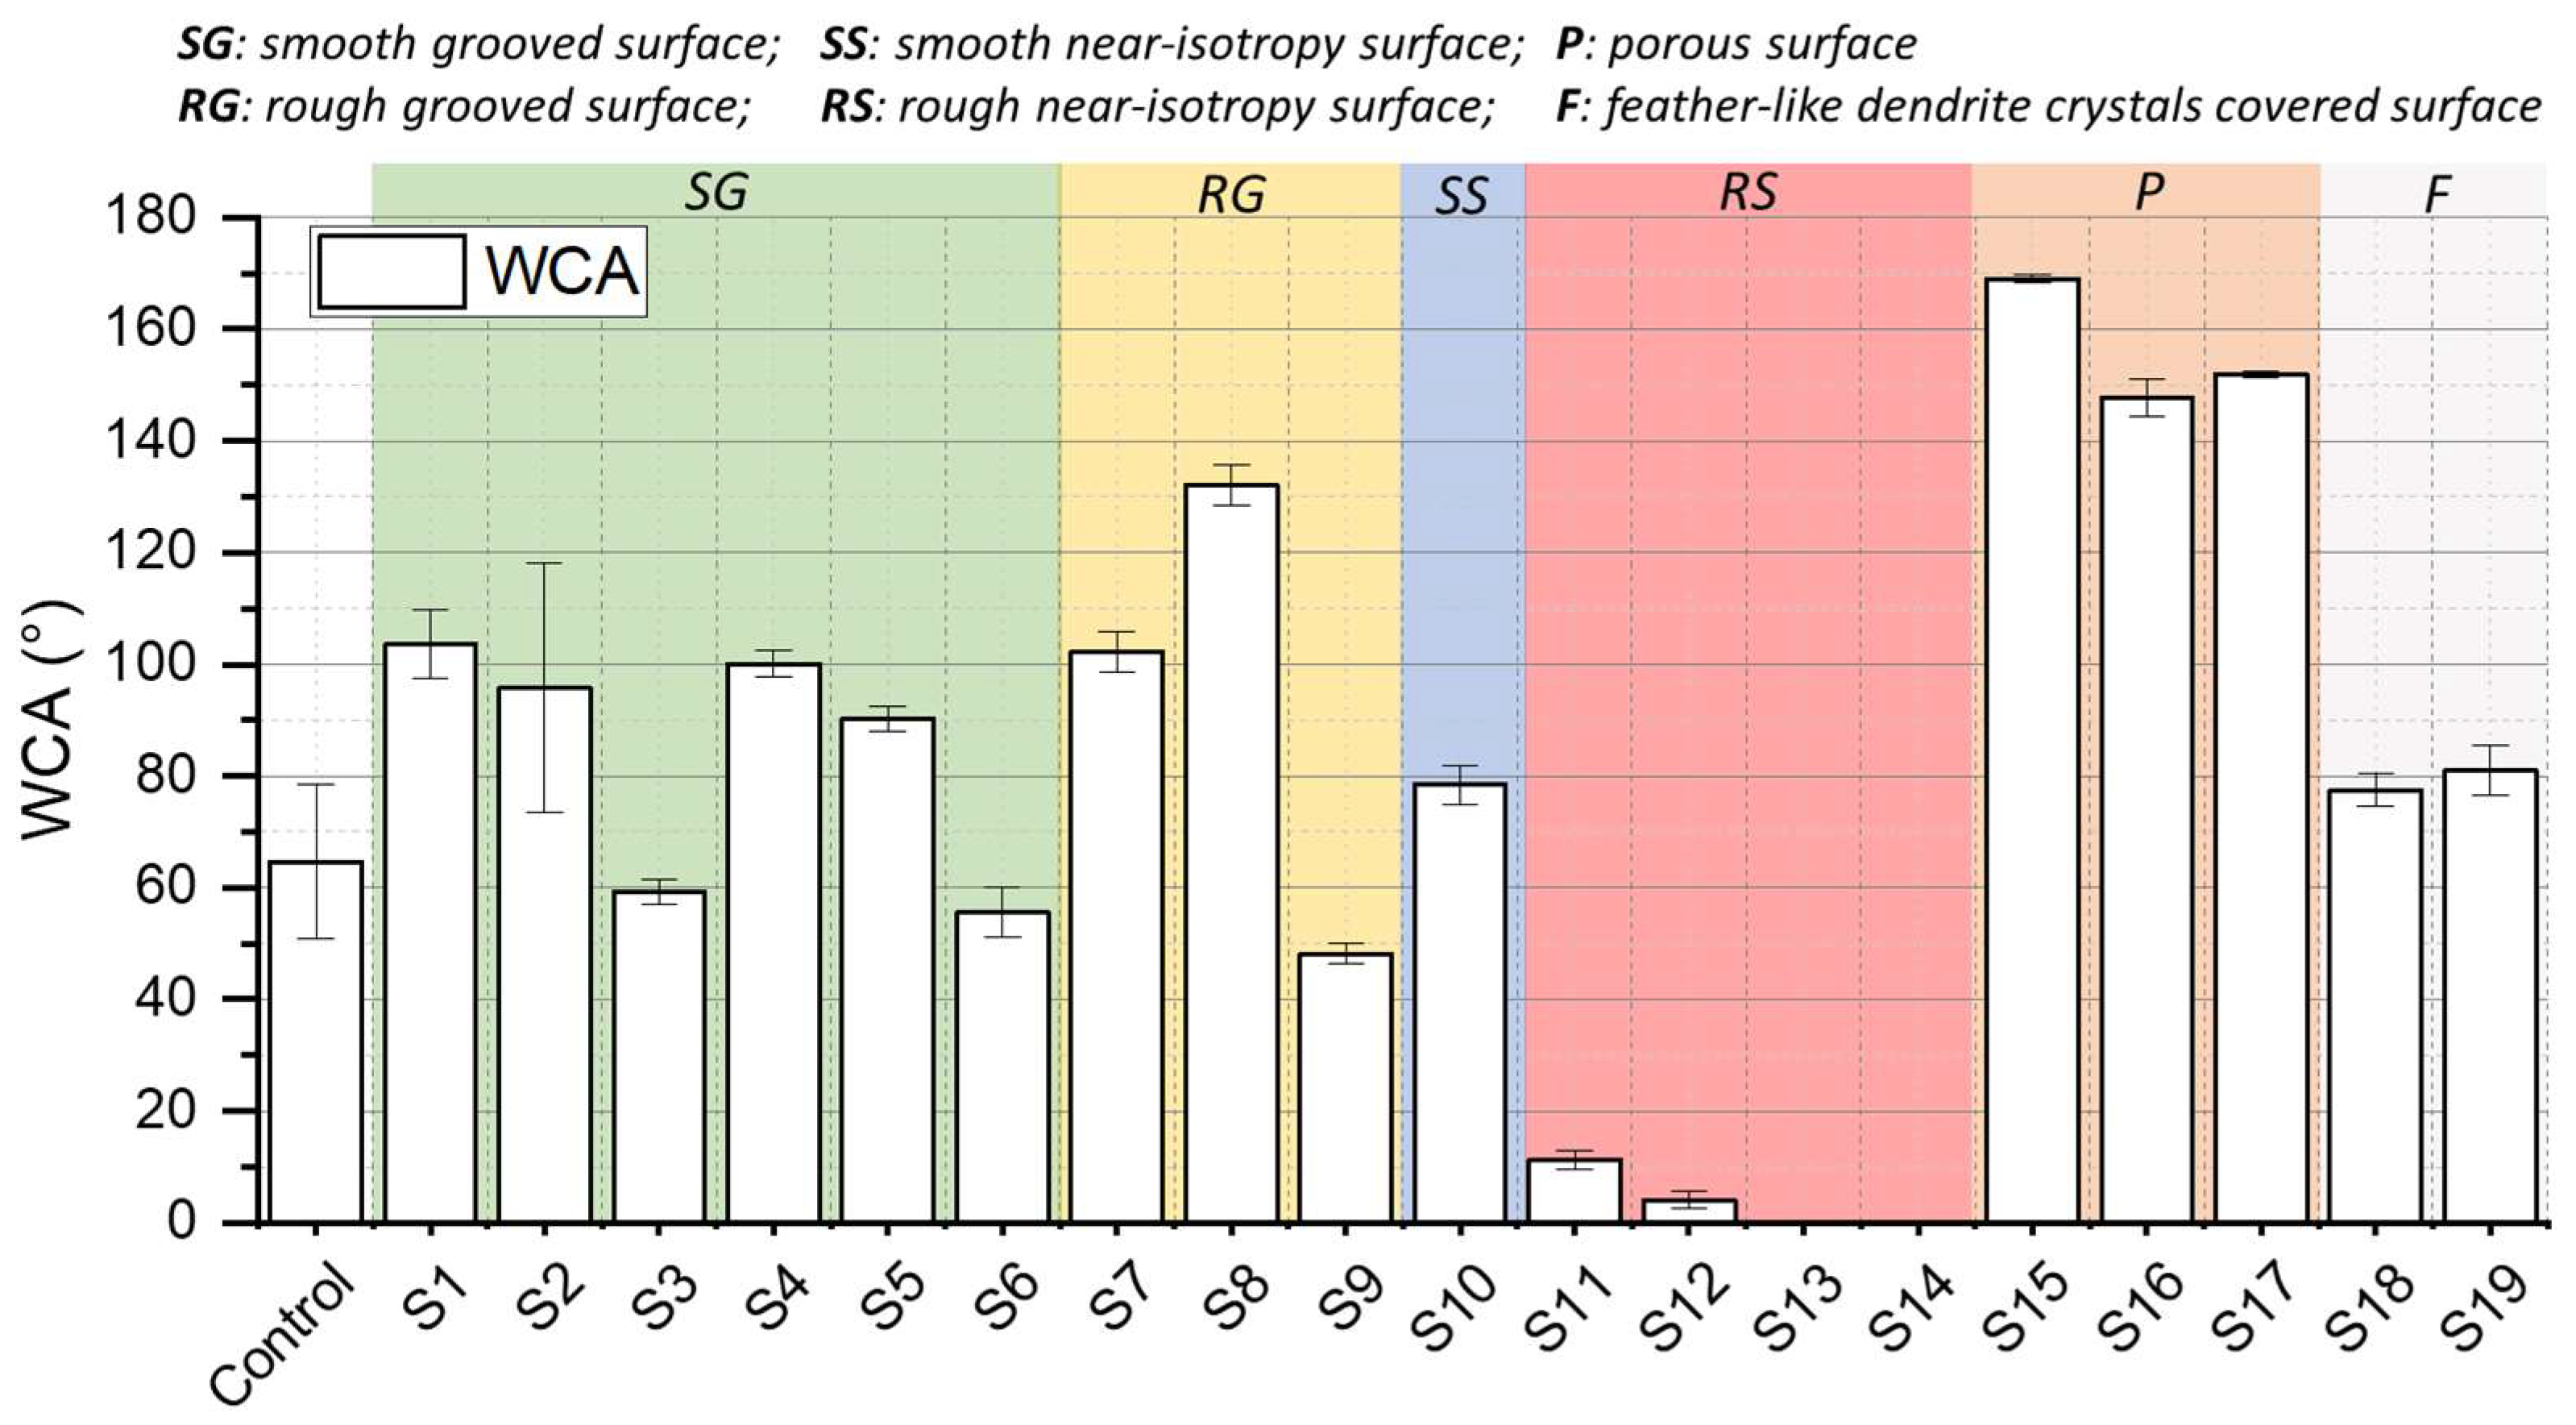
After discussing the morphology and fabrication mechanism of different types of textures, the application of wettability control has been tested and further discussed. In the current study, the wettability of different types of surface textures is shown in Figure 22, with WCA ranging from 0 to around 170 degrees.
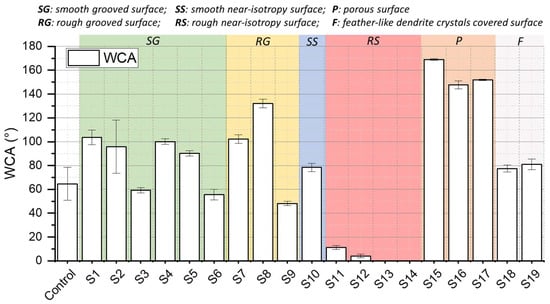
Figure 22.
WCA of samples with their classifications, plus the control sample (untreated surface).
Two theories are accepted in the literature to explain the effects of surface topographic features on WCA change: the Wenzel model [58] and the Cassie–Baxter model [59]. The Wenzel model is applied when the surface is hydrophilic, and the wettability of the original untreated surface is enhanced by the surface roughness. The Cassie–Baxter model is used to predict the WCA of surface porosity effects to a hydrophobic surface when water on the surface is supported by air trapped between the pores. An intermediate condition was further established by Giacomello et al. [60], considering size effects of air bubbles in porous structures. A critical air bubble size was identified, above which surfaces transform to Cassie–Baxter conditions and below which surfaces stay in the intermediate condition. Samples in the proposed research showed clear trends related to these three conditions: Wenzel, Cassie–Baxter and the intermediate condition.
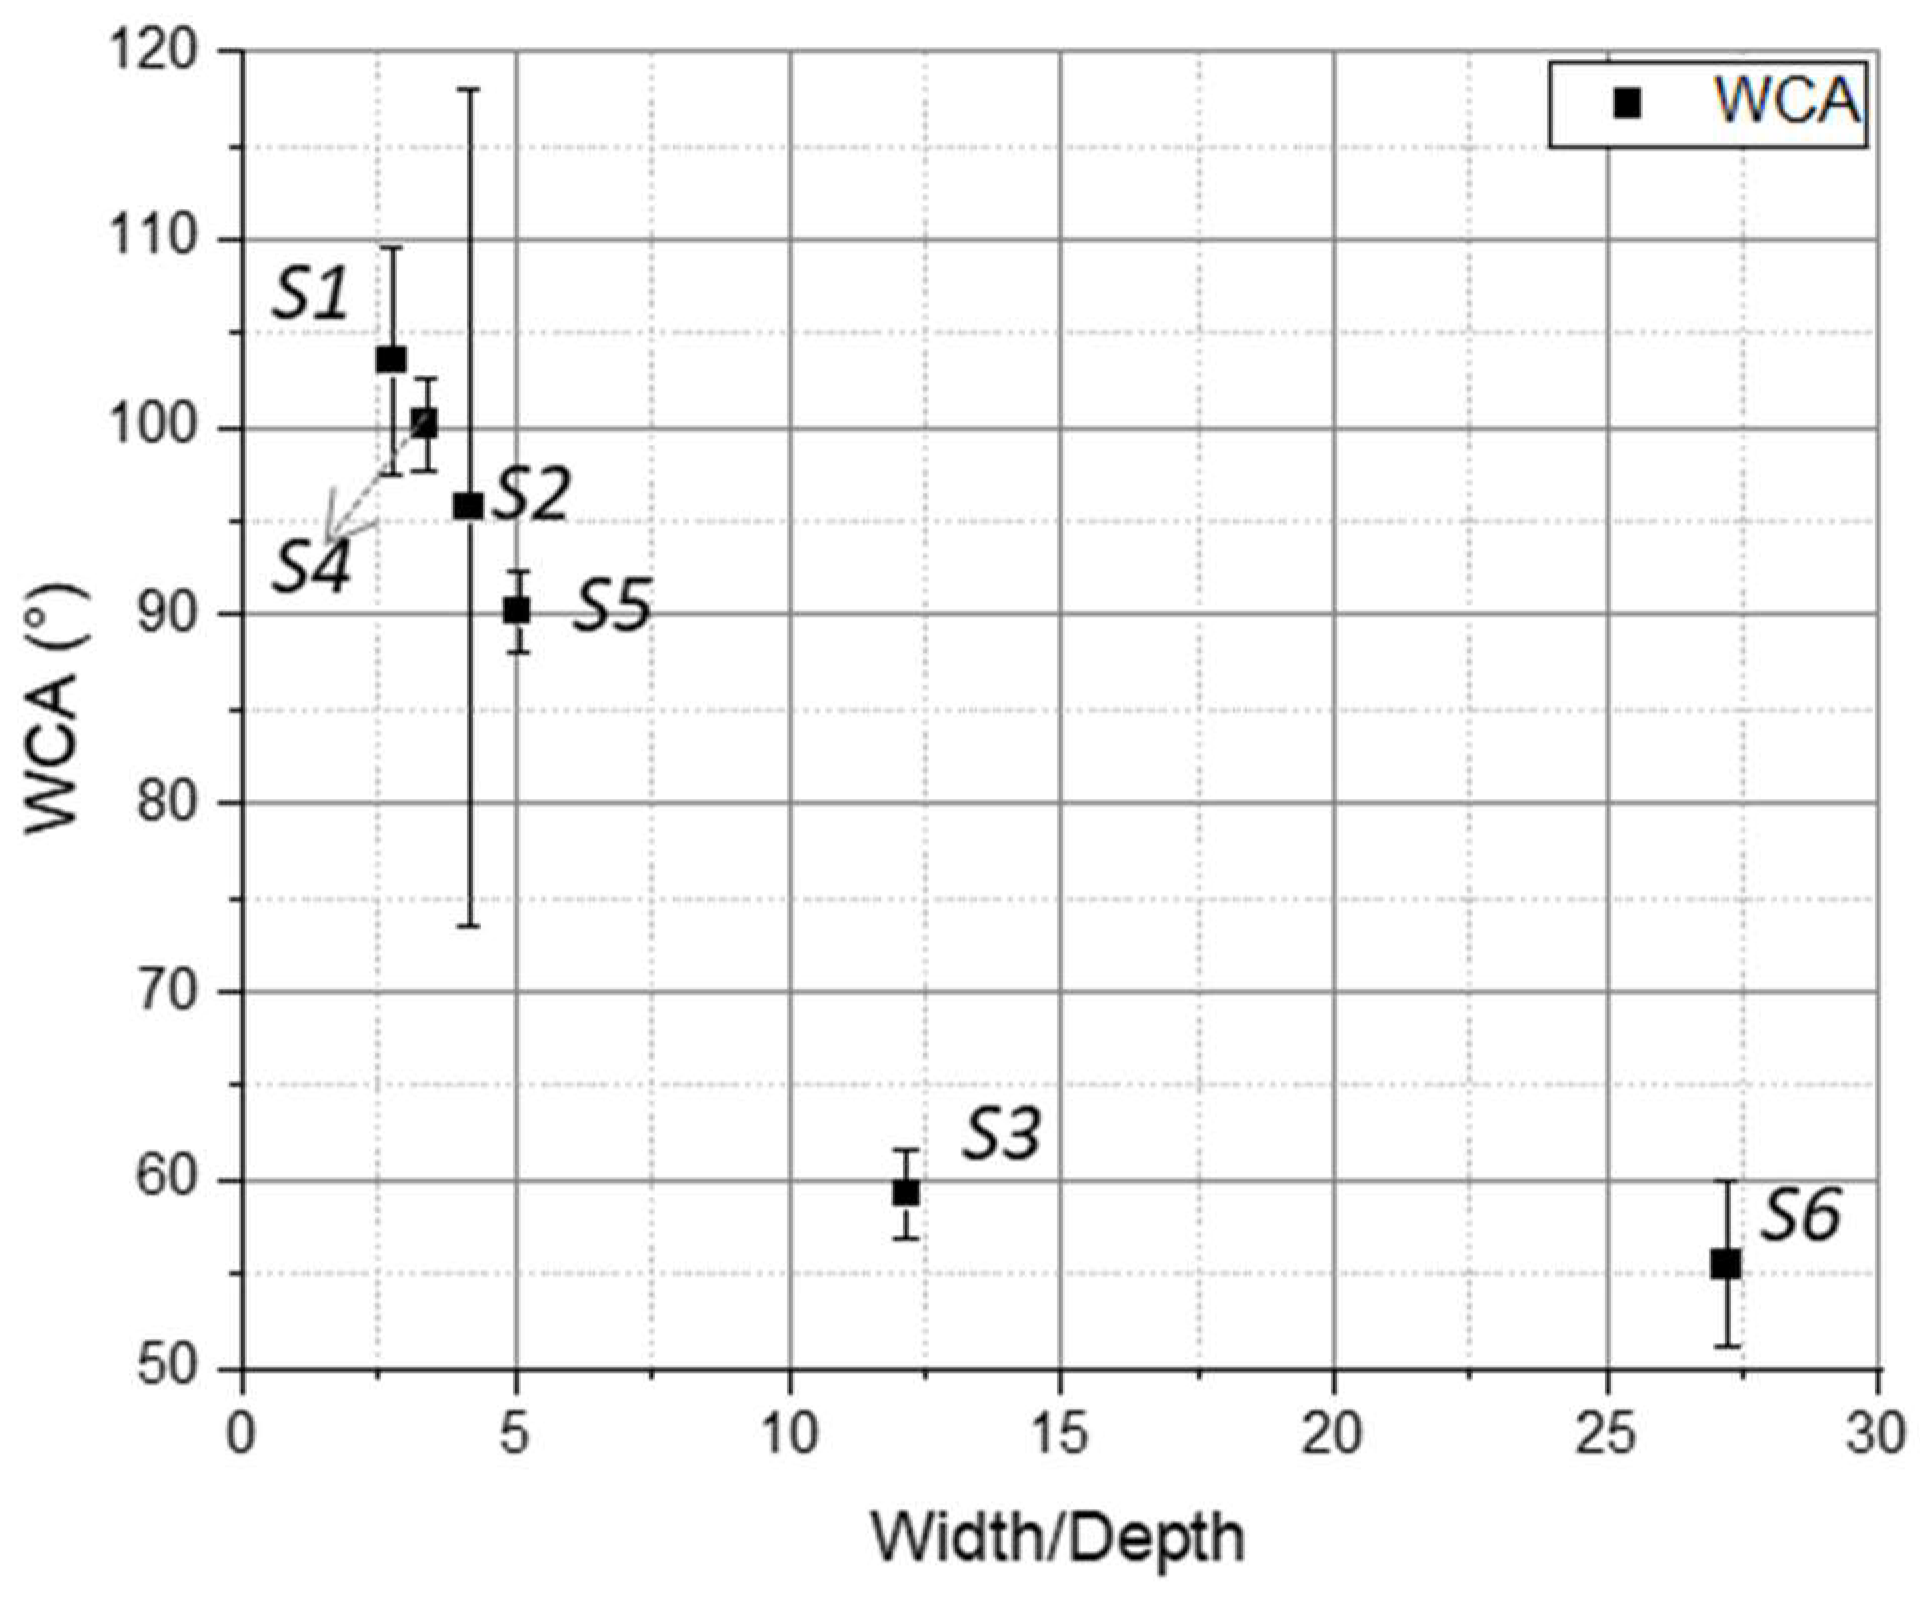
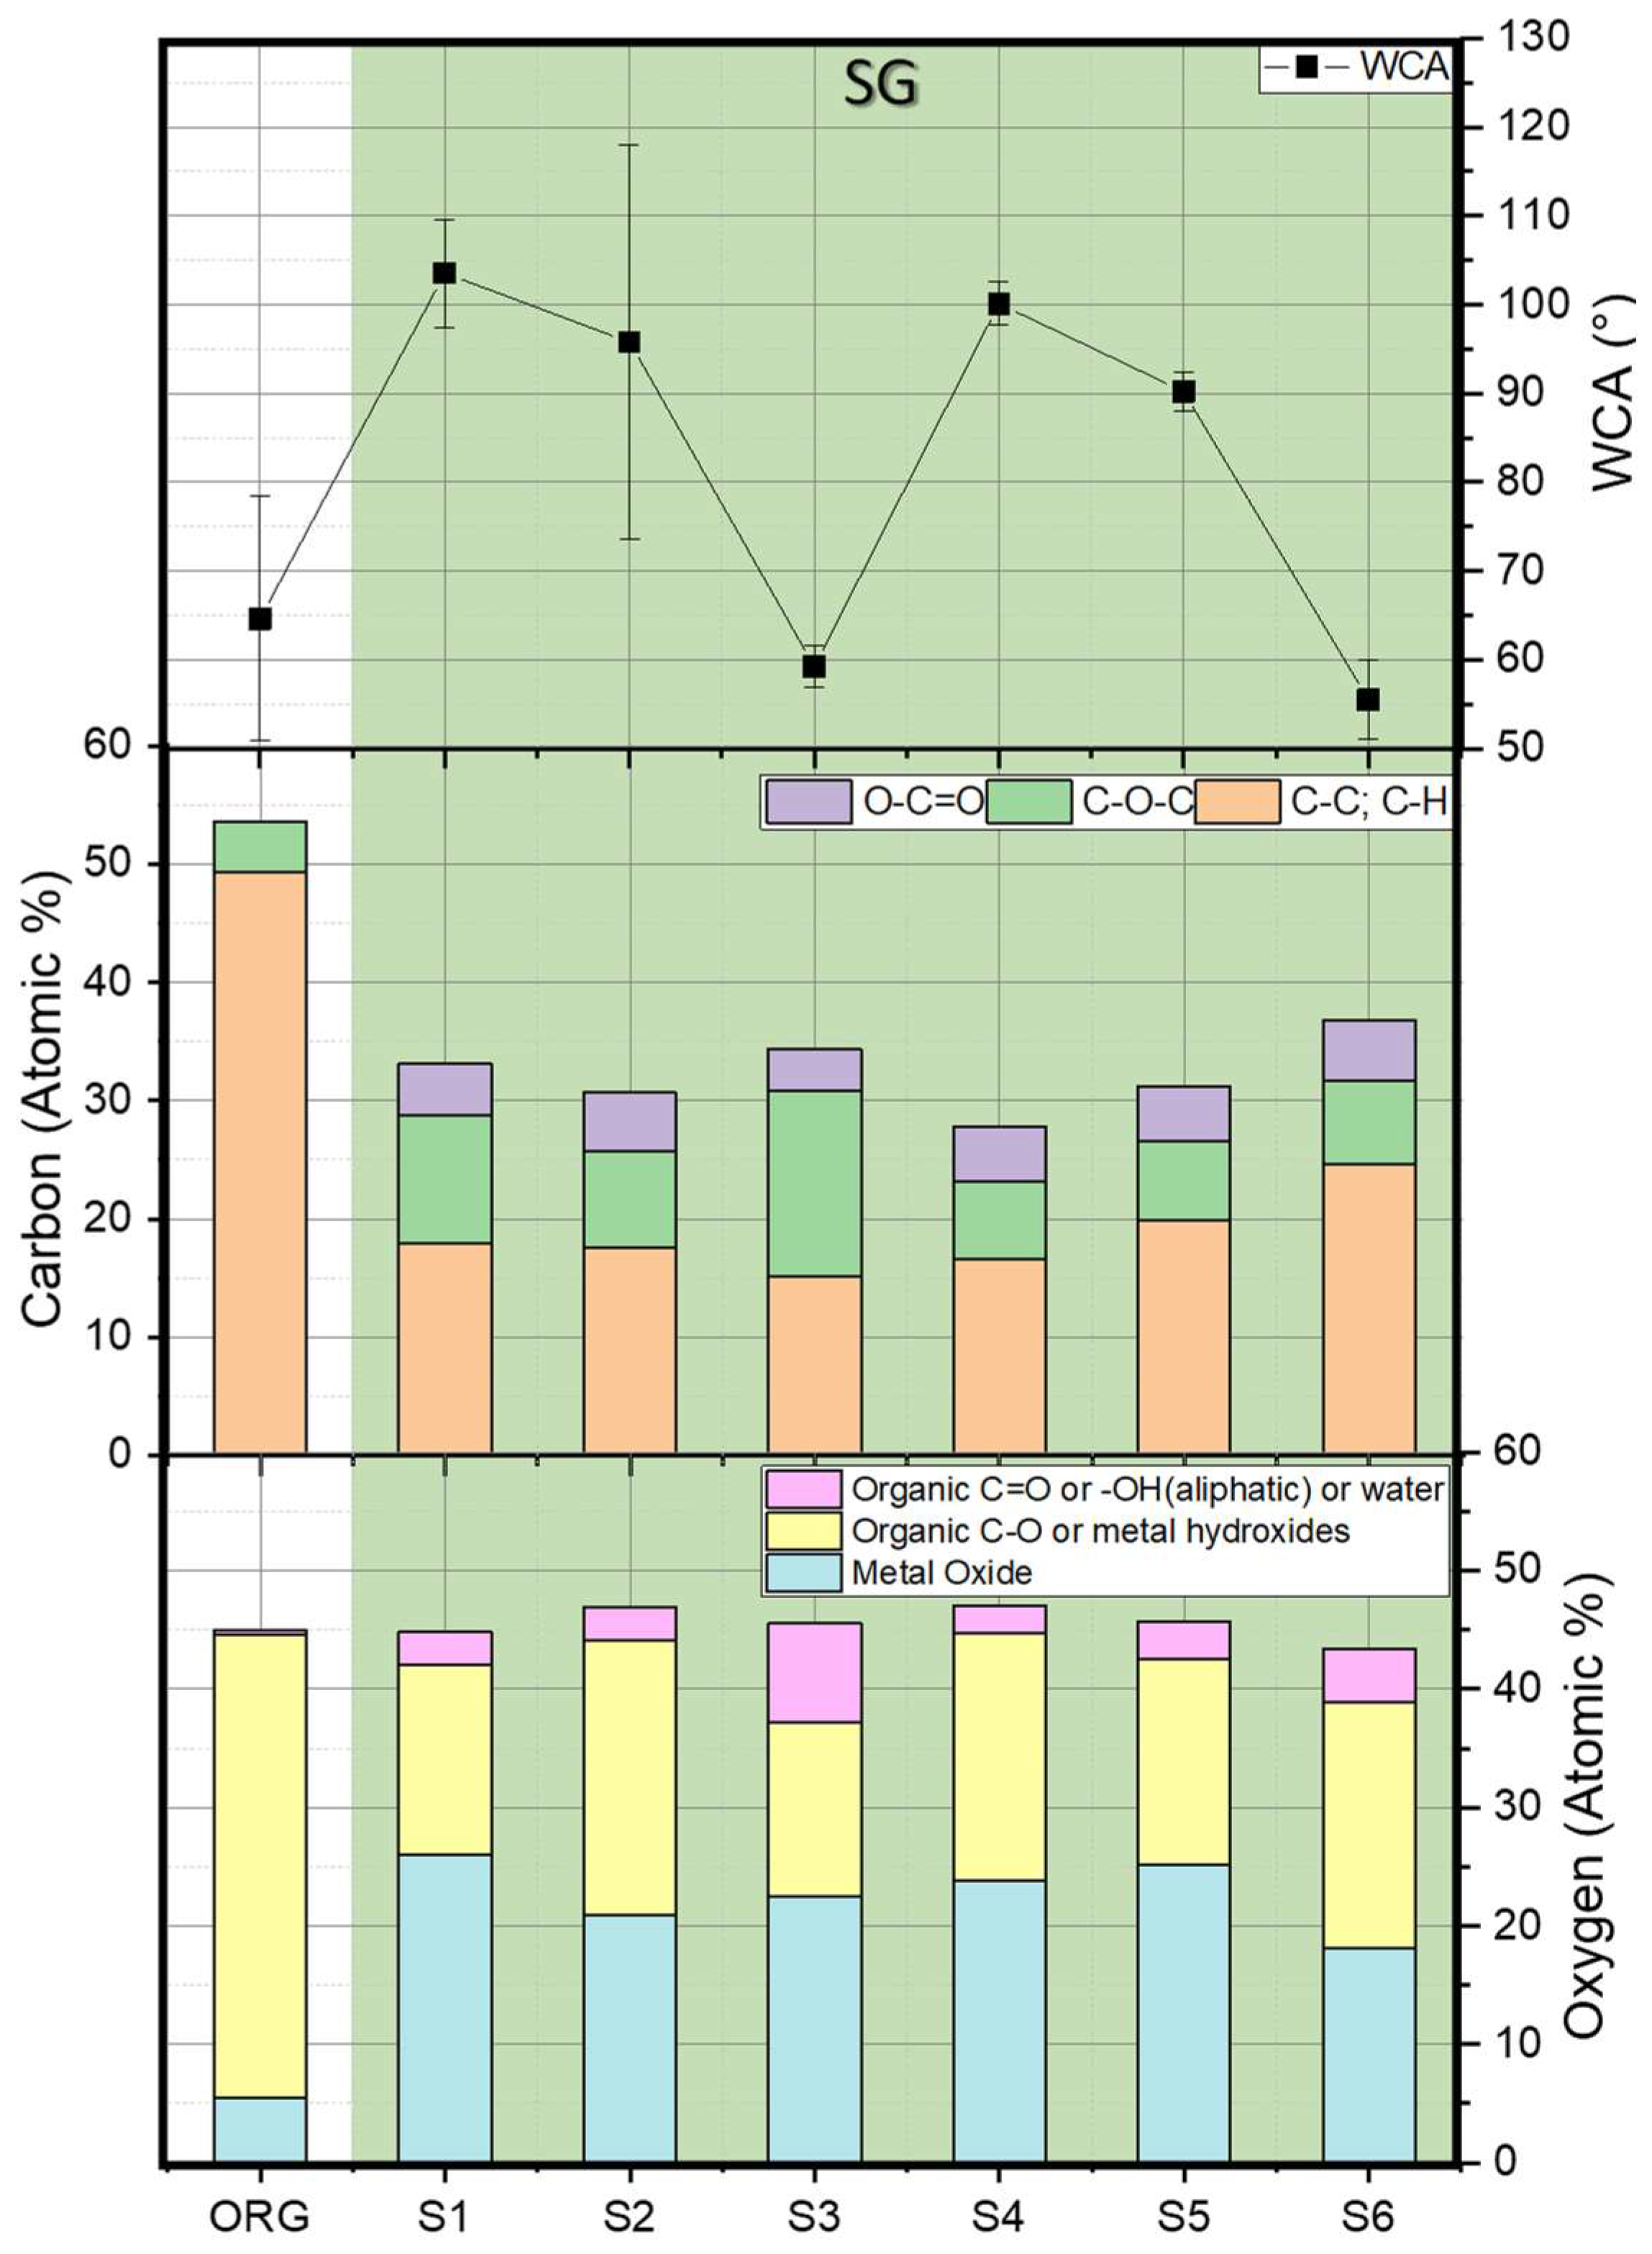
The WCA of SG samples are from 55.53° ± 4.44° to 103.54° ± 6.10° (see Figure 22) and are highly related to the groove width/depth ratio instead of surface carbon or oxygen contents, as shown in Figure 23 and Figure 24. Sample S2 showed a larger standard deviation. It might be because the thin 316 stainless steel plates crimped during LST due to the high temperature, causing a processing error during LST. Except for this large standard deviation, the WCA decreased with an increase in the groove width/depth ratio, which is consistent with the finding from Seemann et al. [61]. According to the ideal gas law [62] and the relationship of force, areas and pressure, due to the larger water–air contact in the textured sample with a large width/depth ratio, the supporting force from the air of samples (e.g., S6) will be smaller than the samples with a smaller width/depth ratio (e.g., S2). RG samples also showed the same trend (see Figure 25). Hence, the WCA of grooved samples should be considered as the intermediate conditions, as the size and shape of groove cavities are crucial to control the WCA of the grooved structure. Another interesting and important finding is that it is hard to find a clear relationship between the WCA and carbon and oxygen contents (Figure 24). For example, samples S1 and S5 have similar carbon and oxygen contents but a different WCA; samples S3 and S6 have a similar WCA but different carbon and oxygen contents. The increased carbon content was mainly from the ageing process and did not reveal an obvious link to the WCA. Ageing has a significant influence on surface wettability due to the possible effects from CO2 deposition [63], or organic compounds [64]. The increased oxygen content was mainly from metal oxidation and organic content, or -OH groups were also found on the surface. These organic contents are possibly absorbed from the ambient environment and due to the reaction between surface and water from the air. Similar oxygen contents and compositions could be found in the existing literature [65,66]. Although all the samples had increased oxygen and carbon content compared with the as-received sample, the content difference between different groups of samples is not clearly related to WCA. This indicated the domination of surface morphology to control the wettability of SG samples in this experiment.
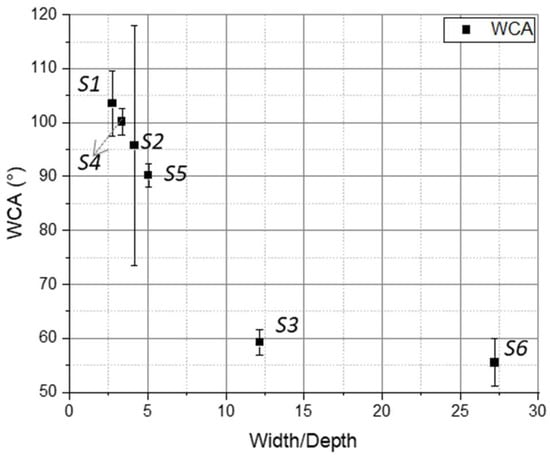
Figure 23.
WCA change with groove width/depth ratio for SG samples.
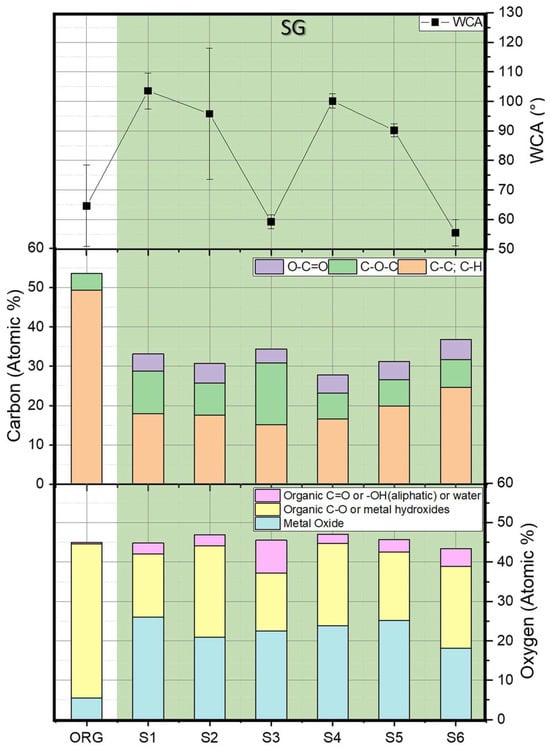
Figure 24.
WCA, carbon contents and oxygen contents of SG samples.
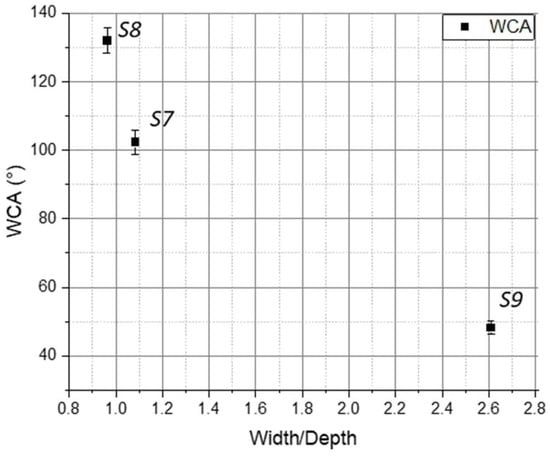
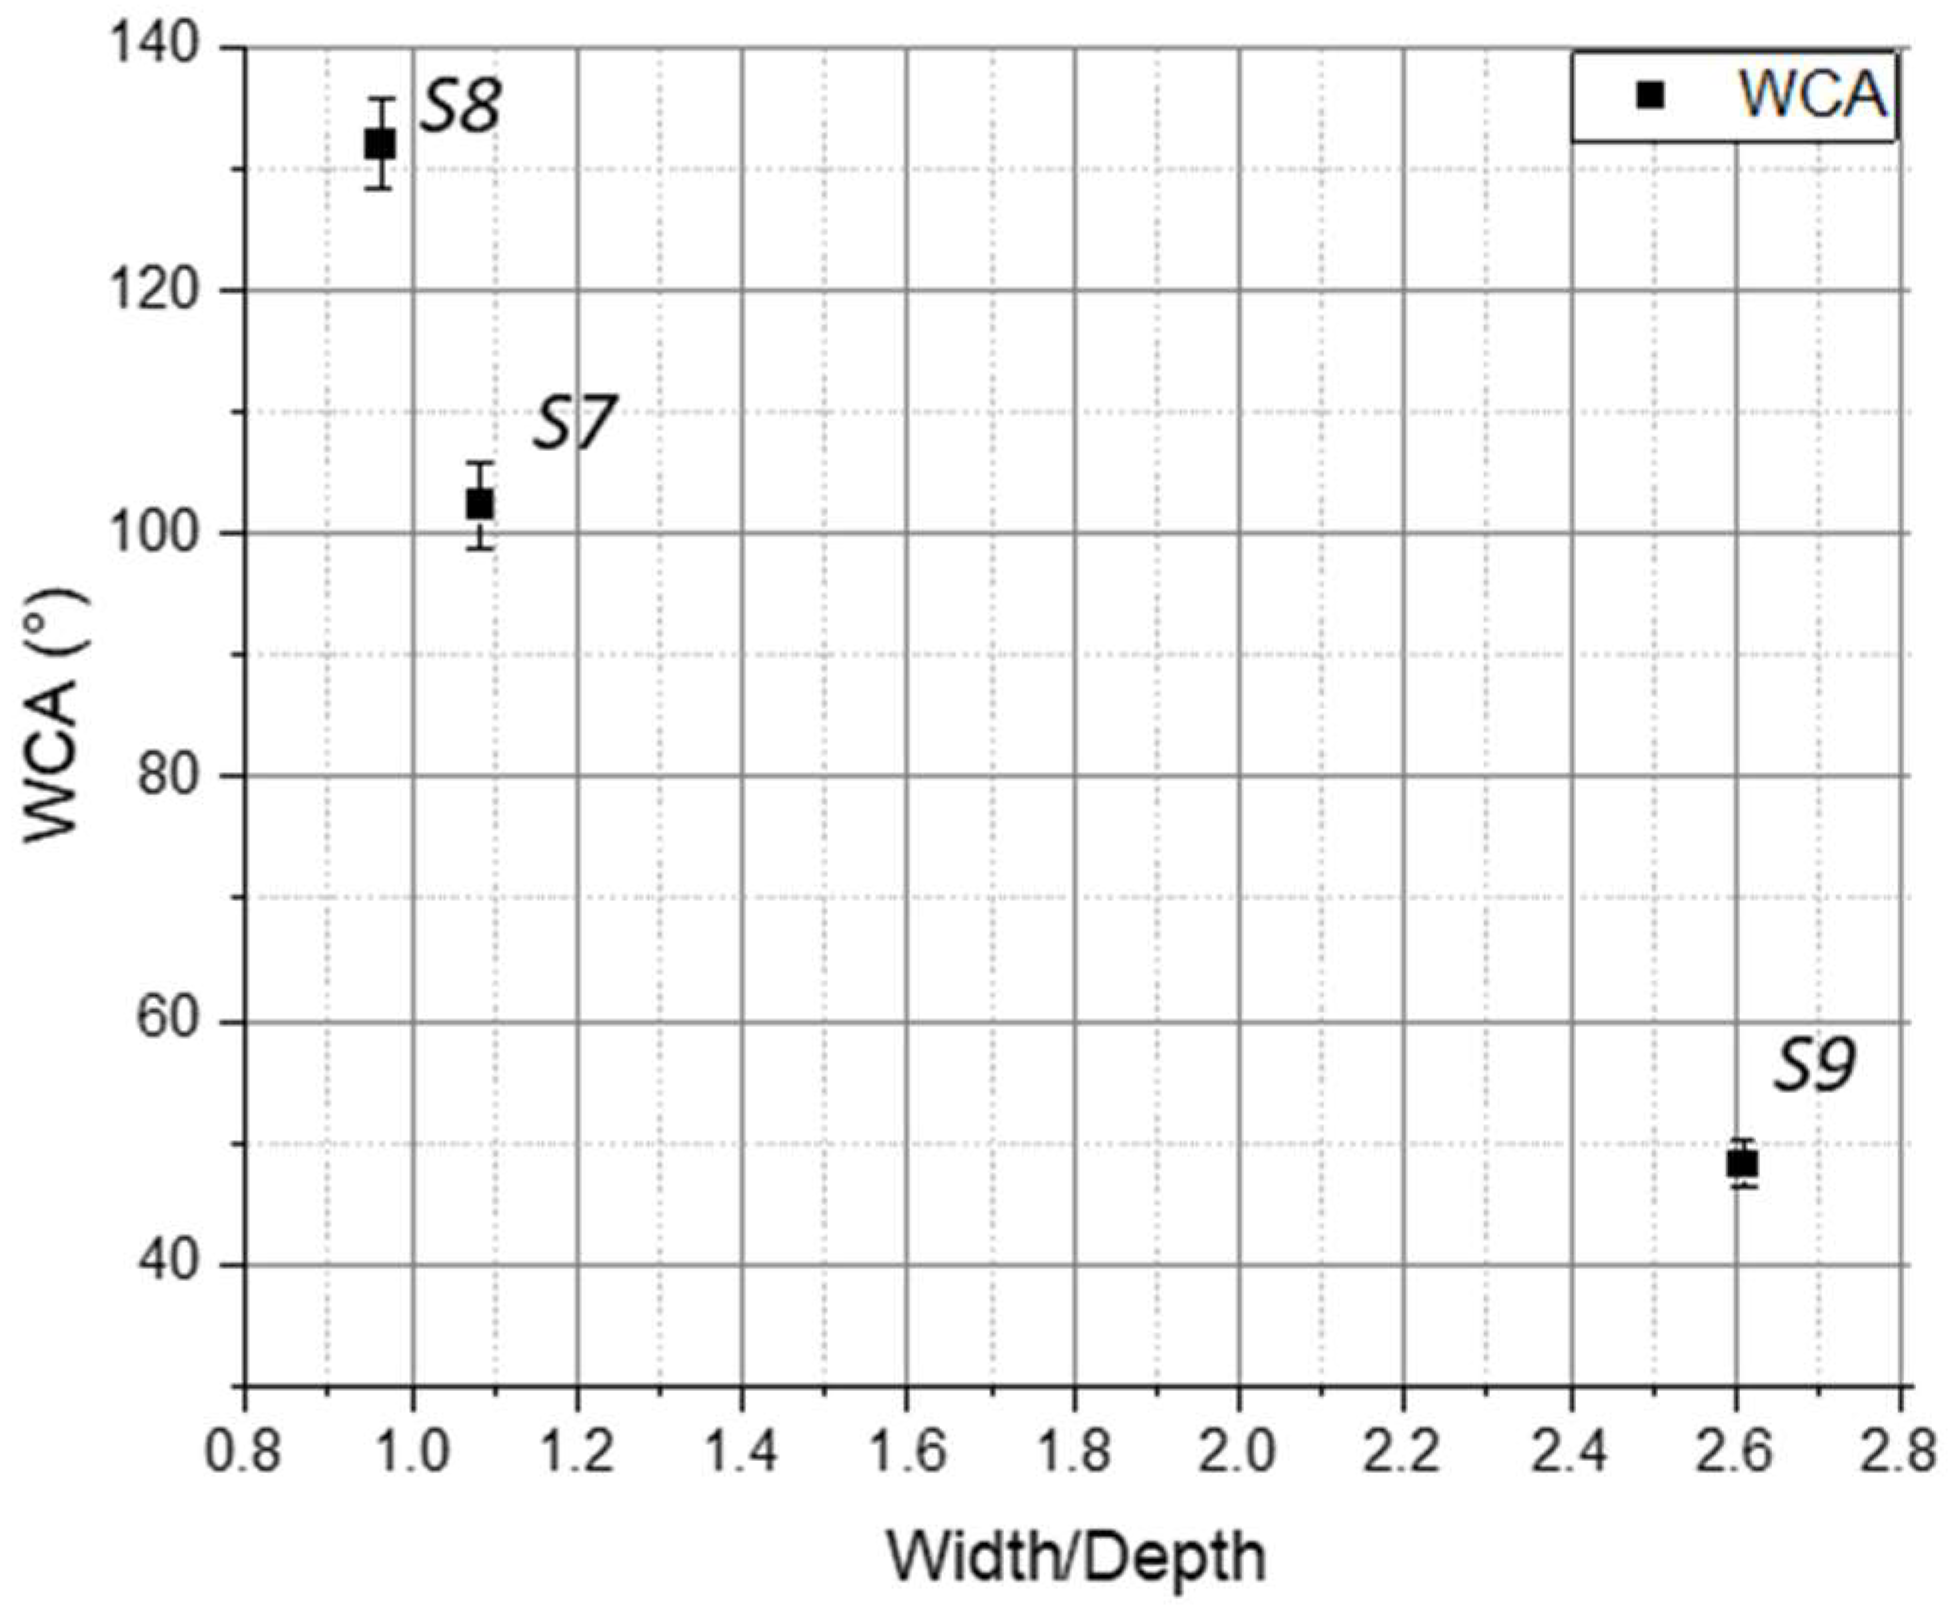
Figure 25.
WCA change with groove width/depth ratio for RG samples.
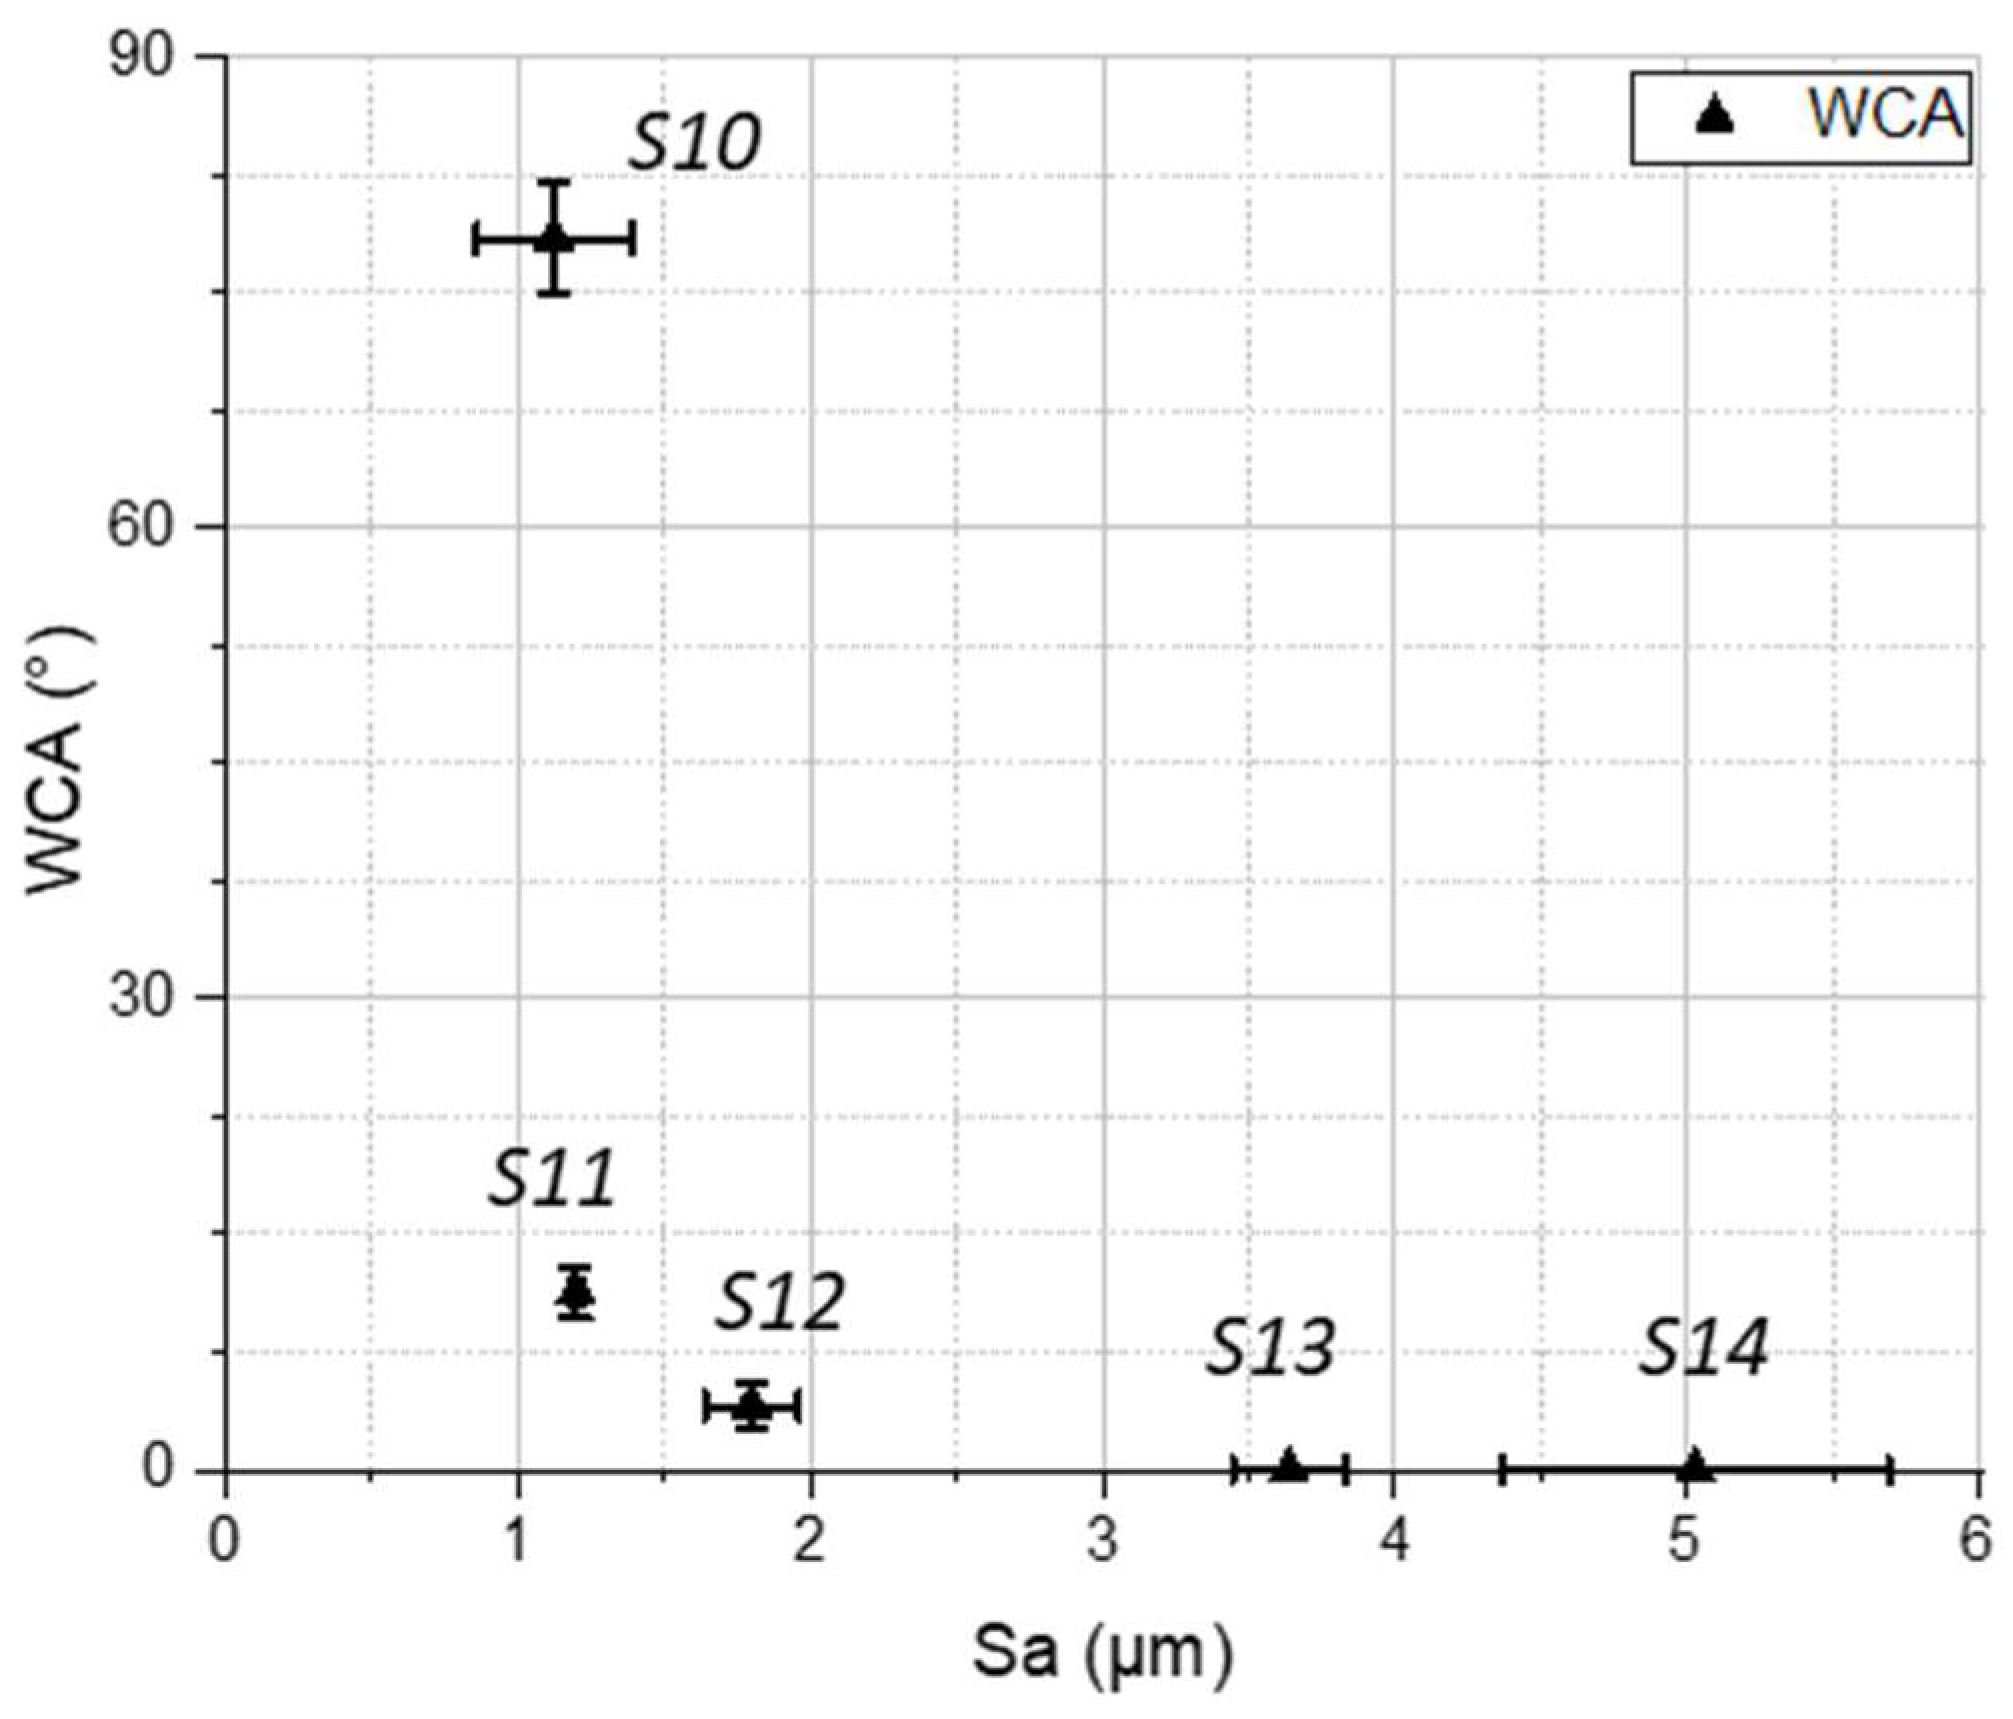
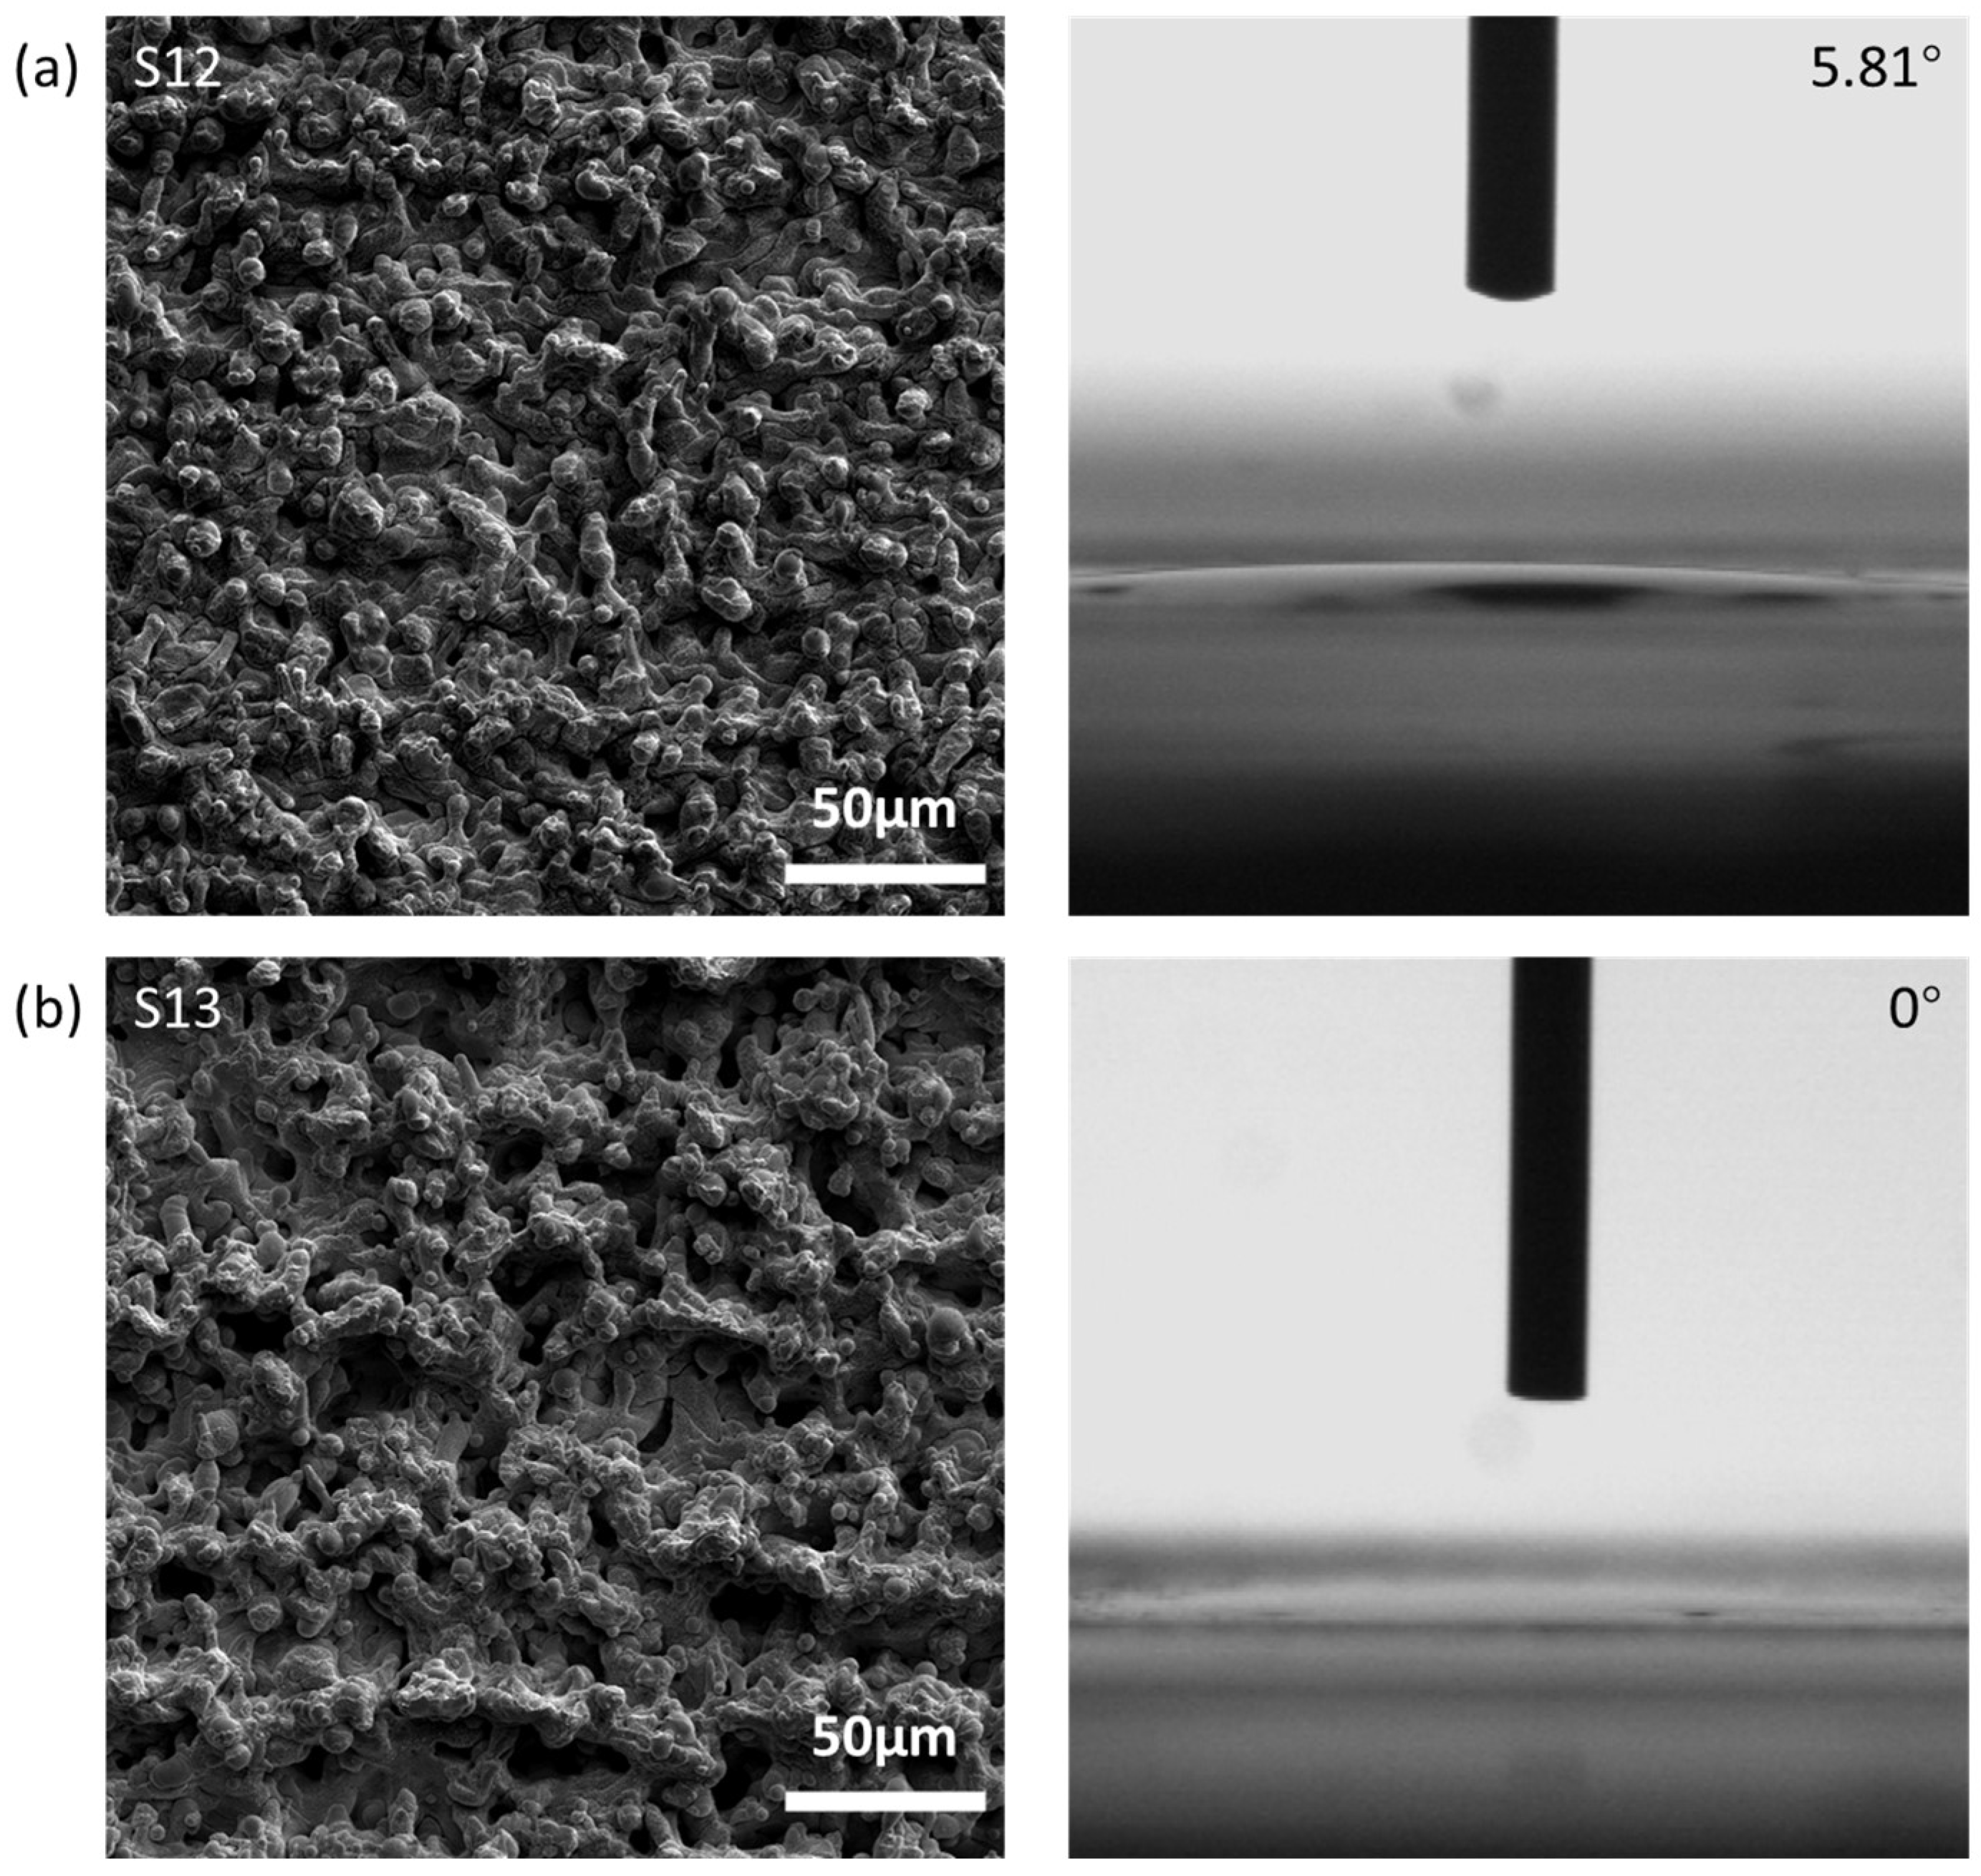
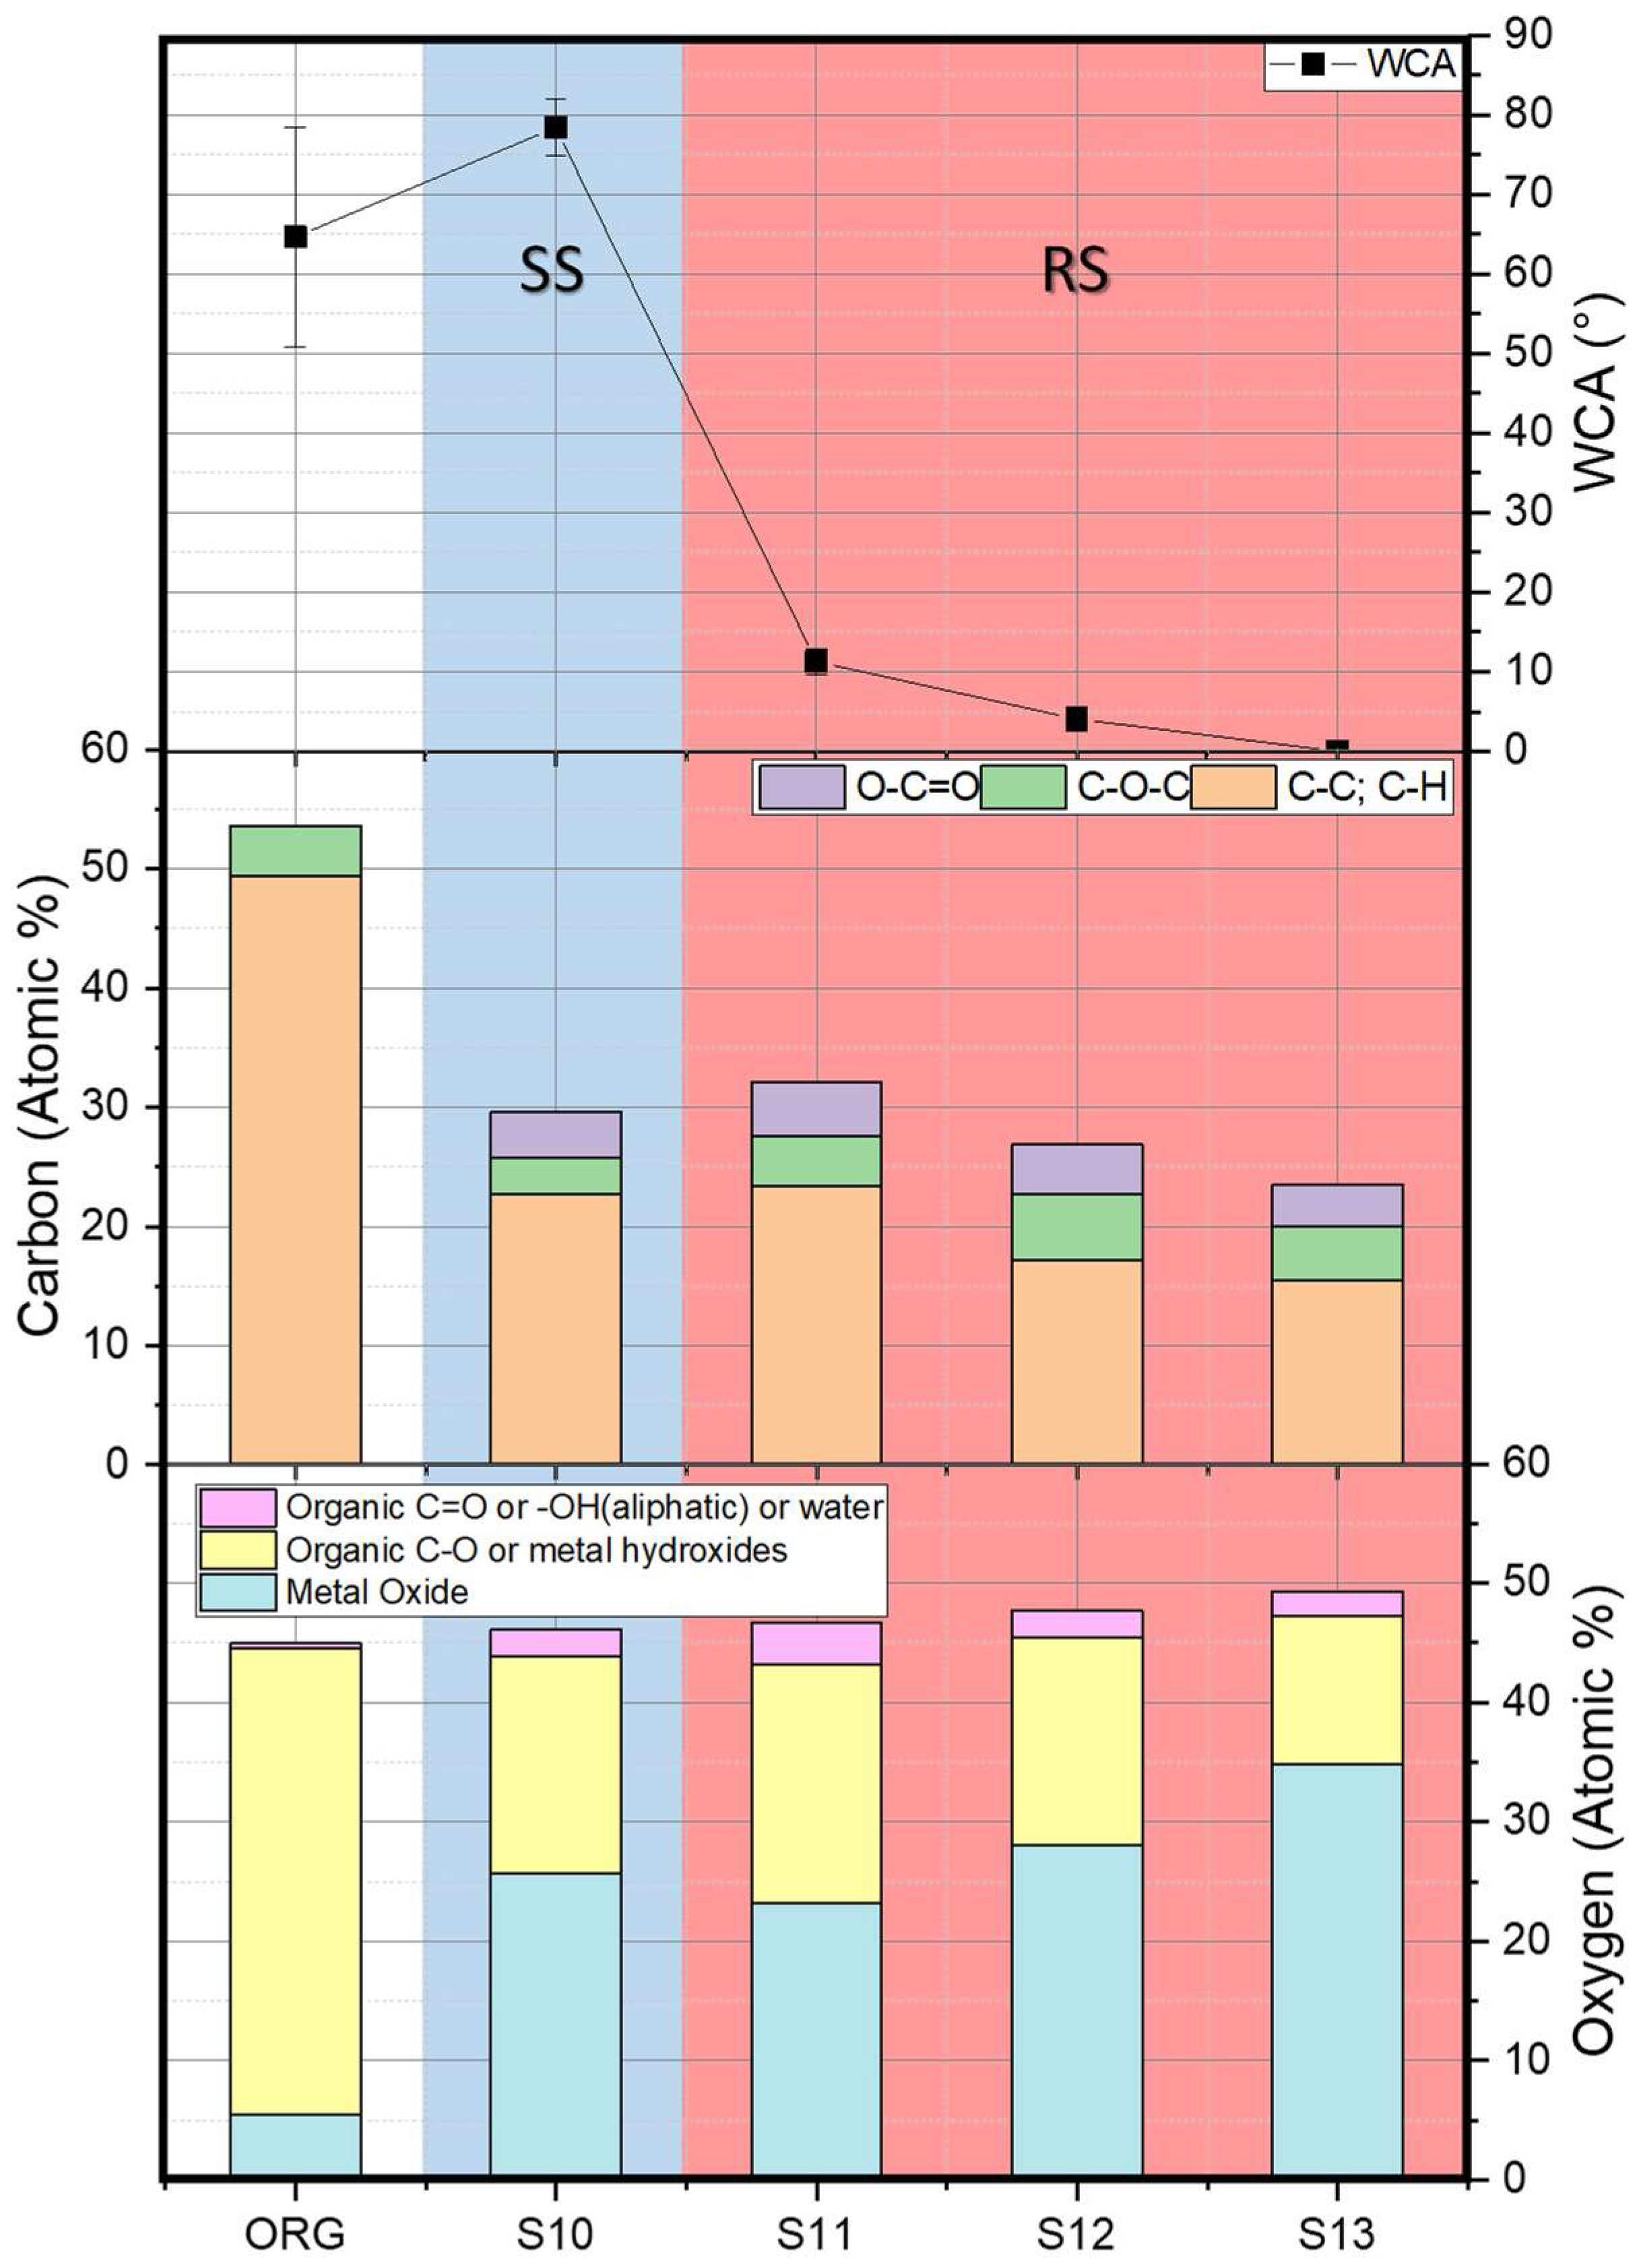
The near-isotropic surfaces fabricated in this study all represent the Wenzel model. The relationship of the WCA and surface roughness of SS and RS is shown in Figure 26, and the trend observed is consistent with the Wenzel theory. Additionally, the shape of the trend shown in Figure 26 is same as that in the research of Nakae et al. [67] Interestingly, Hejazi et al. [68] indicated that the wettability of rough hierarchical surface structures is much more complex than the standard Wenzel and Cassie–Baxter models. However, the hierarchical nano-micron structure of RS samples fabricated in this research provided a great number of porous structures that have pores with sizes small enough to generate capillary force to drag water droplets inside the cavities, resulting in very hydrophilic and even superhydrophilic surfaces (Figure 27). It should be pointed out that the domination of surface morphology on the water contact angle change was still found across SS and RS samples, as shown in Figure 28. Again, all the samples had increased oxygen and carbon content compared with the as-received sample, and the oxygen and carbon composition were the same as those in SG samples. It needs to be pointed out that RS samples S11–S13 have a decreased laser processing speed, decreased carbon content, and increased metal oxide content with a decreased WCA. But considering the overall relationship across all near-isotropic textures, the relationships between the WCA and surface chemistry in Figure 28 are not as clear as those of WCA–Sa (Figure 26).
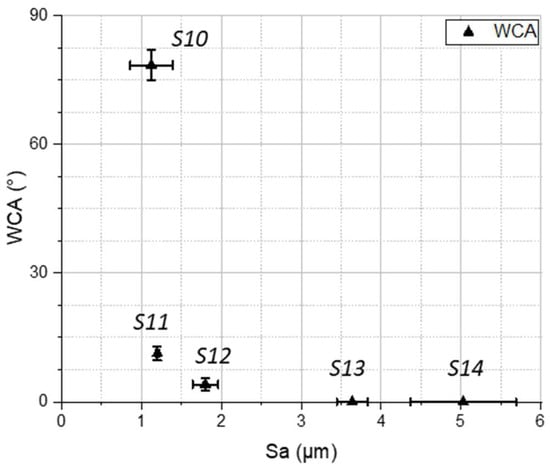
Figure 26.
WCA change with surface roughness for SS and RS samples.

Figure 27.
SEM images of (a) hydrophilic RS samples, (b) superhydrophilic RS samples, with their WCA results.
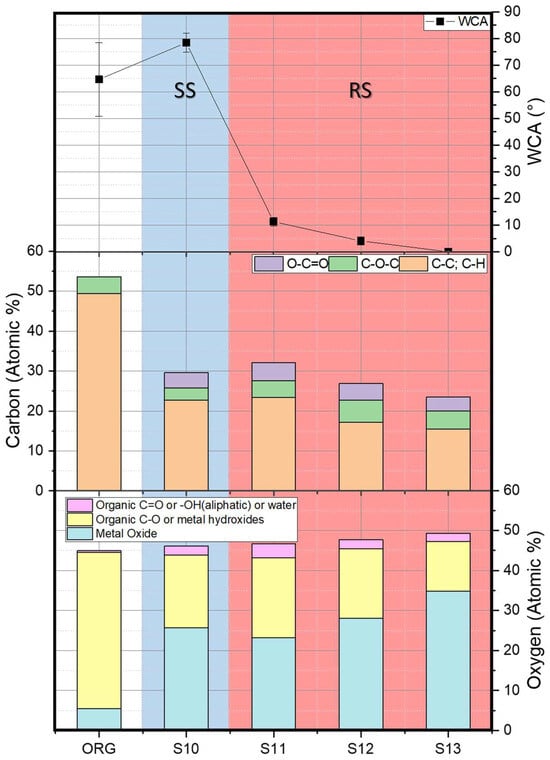
Figure 28.
WCA, carbon contents and oxygen contents of SS, RS samples.
Porous samples (P) are the most hydrophobic and superhydrophobic surfaces (Figure 29). Their hydrophobic properties are similar to those found in the research of Leese et al. [69]. Their research indicated the superhydrophobic properties of porous anodic alumina, with pore diameters ranging from around 100 nm to around 250 nm. The porous structures of P samples in our research are in the range of sub-micrometres, which can provide similar support to the water droplet for a superhydrophobic surface. Feather-like texture-covered grooved samples (F) showed a slightly more hydrophobic surface (77.48° ± 2.88° for S18; 80.97° ± 4.45° for S19) than the original surface (70.04° ± 8.14°). One reason is that F samples are grooved and still follow the trend of the WCA changing with the groove aspect ratio. But the F samples were more hydrophobic with a relatively low groove depth, which could be due to the formation of textures on the surface; therefore, the protrusions in the middle of the grooves made the surface more hydrophobic.
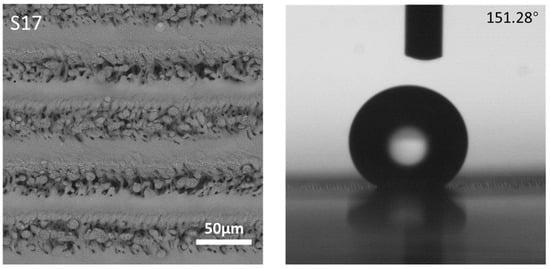
Figure 29.
SEM images of a P sample with WCA result.
In summary, it is possible to control the wettability of stainless steel by surface structuring using a nanosecond infrared laser, which is an environmentally friendly and high-value manufacturing process. The findings from SG, SS, and RS samples proved the domination of surface morphology instead of surface chemistry in wettability control. The topographic effects on surface wettability are important for materials used in medical devices, such as self-clean surfaces. These topographic effects could be combined with the laser effects on topography discussed in Section 3.1 and Section 3.2 to further control the surface wettability. In addition, these surface structures with dramatically increased surface areas have much more potential to be applied in biomedical applications, attributed to the topographic effects on cellular interactions for materials used in medical devices, such as cardiovascular stents [70].
4. Conclusions
In this research, a laser with nanosecond pulse width and infrared wavelength has been applied for LST on 316 stainless steels. By changing different laser parameters, various types of surface textures were successfully fabricated, including those with smooth grooves and rough grooves, smooth near-isotropic textures and rough near-isotropic textures, and porous and feather-like textures. Several findings and mechanisms have been discussed in this research:
- Different types of textures were the results of accumulation effects, from single-pulse ablation to single-line scanning and finally to multiple-line scanning. Laser parameters have functions in different laser ablation steps. Laser pulse fluence and pulse width are essential for single-pulse ablation; frequency and feed speed are vital for line ablation; pitch is crucial to achieve isotropic and anisotropic surface textures. The analysis of accumulation effects from single-point to single-line and multiple-line ablation has rarely been found in the other literature. The comprehensive discussion to build up this three-level laser ablation mechanism could reduce the time for initial trials and help control laser surface texturing with a nanosecond laser.
- Feather-like texture-covered grooved textures were successfully manufactured for the first time via laser surface texturing. These are the results of high pulse overlap caused by extremely high frequency. Porous textures were also successfully formed from single-pass laser scanning through simple nanosecond laser direct ablation due to an extremely low feed speed. These have the potential to be used for drug-loading applications.
- Surface morphology contributes more to wettability modification than surface chemistry. Water contact angles of grooved surfaces were more sensitive to the change in groove depth and groove density. Water contact angles of near-isotropic textures were mostly affected by surface roughness. Feather-like textures did not affect the water contact angle, but porous structures increased it largely.
Author Contributions
Conceptualisation, J.D. and M.P.; methodology, J.D.; validation, J.D., M.P. and Y.L.; formal analysis, J.D.; investigation, J.D.; resources, M.P. and Y.L.; writing—original draft preparation, J.D.; writing—review and editing, M.P. and Y.L.; visualisation, J.D., M.P. and Y.L.; supervision, M.P. and Y.L.; project administration, M.P.; funding acquisition, M.P. All authors have read and agreed to the published version of the manuscript.
Funding
This research received no external funding.
Institutional Review Board Statement
Not applicable.
Informed Consent Statement
Not applicable.
Data Availability Statement
Data are available upon request.
Acknowledgments
Special thanks to Liguo Zhao (NUAA, China) for his support of the project. The authors also acknowledge the help from Loughborough Materials Characterisation Centre: Keith Yendall and Sam Davis. Technicians in Loughborough University Wolfson School: Dawn Spencer, Mark Capers, David Britton, Jagpal Singh and David Thompson. And also thanks to the assistance from Blessen Thomas John and Steven Das.
Conflicts of Interest
The authors declare no conflicts of interest.
References
- Baharin, A.F.S.; Ghazali, M.J.; Wahab, J.A. Laser surface texturing and its contribution to friction and wear reduction: A brief review. Ind. Lubr. Tribol. 2016, 68, 57–66. [Google Scholar] [CrossRef]
- Ma, X.; Nie, X.; Zhao, J.; Shrotriya, P.; Zhang, Y.; Cui, Y.; Wang, J. Effect of nanosecond pulsed laser parameters on the color making of 304 stainless steel. Opt. Laser Technol. 2020, 126, 106104. [Google Scholar] [CrossRef]
- Loya, M.C.; Park, E.; Chen, L.H.; Brammer, K.S.; Jin, S. Radially arrayed nanopillar formation on metallic stent wire surface via radio-frequency plasma. Acta Biomater. 2010, 6, 1671–1677. [Google Scholar] [CrossRef] [PubMed]
- Rakesh, K.R.; Bontha, S.; Ramesh, M.R.; Das, M.; Balla, V.K. Laser surface melting of Mg-Zn-Dy alloy for better wettability and corrosion resistance for biodegradable implant applications. Appl. Surf. Sci. 2019, 480, 70–82. [Google Scholar] [CrossRef]
- Schieber, R.; Lasserre, F.; Hans, M.; Fernández-Yagüe, M.; Díaz-Ricart, M.; Escolar, G.; Ginebra, M.; Mücklich, F.; Pegueroles, M. Direct Laser Interference Patterning of CoCr Alloy Surfaces to Control Endothelial Cell and Platelet Response for Cardiovascular Applications. Adv. Healthc. Mater. 2017, 6, 1700327. [Google Scholar] [CrossRef]
- Nayak, B.K.; Gupta, M.C. Self-organized micro/nano structures in metal surfaces by ultrafast laser irradiation. Opt. Lasers Eng. 2010, 48, 940–949. [Google Scholar] [CrossRef]
- Tangwarodomnukun, V.; Kringram, S.; Zhu, H.; Qi, H.; Rujisamphan, N. Fabrication of superhydrophobic surface on AISI316L stainless steel using a nanosecond pulse laser. Proc. Inst. Mech. Eng. B J. Eng. Manuf. 2022, 236, 680–693. [Google Scholar] [CrossRef]
- Li, S.; Cui, Z.; Zhang, W.; Li, Y.; Li, L.; Gong, D. Biocompatibility of micro/nanostructures nitinol surface via nanosecond laser circularly scanning. Mater. Lett. 2019, 255, 126591. [Google Scholar] [CrossRef]
- Le Harzic, R.; Huot, N.; Audouard, E.; Jonin, C.; Laporte, P.; Valette, S.; Fraczkiewicz, A.; Fortunier, R. Comparison of heat-affected zones due to nanosecond and femtosecond laser pulses using transmission electronic microscopy. Appl. Phys. Lett. 2002, 80, 3886–3888. [Google Scholar] [CrossRef]
- Besozzi, E.; Maffini, A.; Dellasega, D.; Russo, V.; Facibeni, A.; Pazzaglia, A.; Beghi, M.G.; Passoni, M. Nanosecond laser pulses for mimicking thermal effects on nanostructured tungsten-based materials. Nucl. Fusion 2018, 58, 036019. [Google Scholar] [CrossRef]
- Ta, D.V.; Dunn, A.; Wasley, T.J.; Kay, R.W.; Stringer, J.; Smith, P.J.; Connaughton, C.; Shephard, J.D. Nanosecond laser textured superhydrophobic metallic surfaces and their chemical sensing applications. Appl. Surf. Sci. 2015, 357, 248–254. [Google Scholar] [CrossRef]
- Boinovich, L.B.; Modin, E.B.; Sayfutdinova, A.R.; Emelyanenko, K.A.; Vasiliev, A.L.; Emelyanenko, A.M. Combination of Functional Nanoengineering and Nanosecond Laser Texturing for Design of Superhydrophobic Aluminum Alloy with Exceptional Mechanical and Chemical Properties. ACS Nano 2017, 11, 10113–10123. [Google Scholar] [CrossRef] [PubMed]
- Zupančič, M.; Može, M.; Gregorčič, P.; Golobič, I. Nanosecond laser texturing of uniformly and non-uniformly wettable micro structured metal surfaces for enhanced boiling heat transfer. Appl. Surf. Sci. 2017, 399, 480–490. [Google Scholar] [CrossRef]
- Pacquentin, W.; Caron, N.; Oltra, R. Nanosecond laser surface modification of AISI 304L stainless steel: Influence the beam overlap on pitting corrosion resistance. Appl. Surf. Sci. 2014, 288, 34–39. [Google Scholar] [CrossRef]
- Wang, Y.; Ke, C.; Wu, T.; Zhao, X.; Wang, R. Nanosecond laser texturing with hexagonal honeycomb micro-structure on Titanium for improved wettability and optical properties. Optik 2019, 192, 162953. [Google Scholar] [CrossRef]
- Long, J.; Chu, P.; Li, Y.; Lin, J.; Cao, Z.; Xu, M.; Ren, Q.; Xie, X. Dual-scale porous/grooved microstructures prepared by nanosecond laser surface texturing for high-performance vapor chambers. J. Manuf. Process. 2022, 73, 914–923. [Google Scholar] [CrossRef]
- Seid Ahmed, Y.; DePaiva, J.M.; Amorim, F.L.; Torres, R.D.; de Rossi, W.; Veldhuis, S.C. Laser surface texturing and characterization of austenitic stainless steel for the improvement of its surface properties. Int. J. Adv. Manuf. Technol. 2021, 115, 1795–1808. [Google Scholar] [CrossRef]
- Razi, S.; Madanipour, K.; Mollabashi, M. Laser surface texturing of 316L stainless steel in air and water: A method for increasing hydrophilicity via direct creation of microstructures. Opt. Laser Technol. 2016, 80, 237–246. [Google Scholar] [CrossRef]
- Tran, N.G.; Chun, D.-M. Simple and fast surface modification of nanosecond-pulse laser-textured stainless steel for robust superhydrophobic surfaces. CIRP Ann. 2020, 69, 525–528. [Google Scholar] [CrossRef]
- Cai, Y.; Chang, W.; Luo, X.; Sousa, A.M.; Lau, K.H.A.; Qin, Y. Superhydrophobic structures on 316L stainless steel surfaces machined by nanosecond pulsed laser. Precis. Eng. 2018, 52, 266–275. [Google Scholar] [CrossRef]
- Gregorčič, P.; Šetina-Batič, B.; Hočevar, M. Controlling the stainless steel surface wettability by nanosecond direct laser texturing at high fluences. Appl. Phys. A 2017, 123, 766. [Google Scholar] [CrossRef]
- Jothi Prakash, C.G.; Prasanth, R. Approaches to design a surface with tunable wettability: A review on surface properties. J. Mater. Sci. Technol. 2021, 56, 108–135. [Google Scholar] [CrossRef]
- Mantel, M.; Wightman, J.P. Influence of the surface chemistry on the wettability of stainless steel. Surf. Interface Anal. 1994, 21, 595–605. [Google Scholar] [CrossRef]
- Zhang, L.; Lin, N.; Zou, J.; Lin, X.; Liu, Z.; Yuan, S.; Yu, Y.; Wang, Z.; Zeng, Q.; Chen, W.; et al. Super-hydrophobicity and corrosion resistance of laser surface textured AISI 304 stainless steel decorated with Hexadecyltrimethoxysilane (HDTMS). Opt. Laser Technol. 2020, 127, 106146. [Google Scholar] [CrossRef]
- Kedia, S.; Bonagani, S.K.; Majumdar, A.G.; Kain, V.; Subramanian, M.; Maiti, N.; Nilaya, J.P. Nanosecond laser surface texturing of type 316L stainless steel for contact guidance of bone cells and superior corrosion resistance. Colloid Interface Sci. Commun. 2021, 42, 100419. [Google Scholar] [CrossRef]
- Li, L.; Mirhosseini, N.; Michael, A.; Liu, Z.; Wang, T. Enhancement of endothelialisation of coronary stents by laser surface engineering. Lasers Surg. Med. 2013, 45, 608–616. [Google Scholar] [CrossRef] [PubMed]
- Liang, C.; Hu, Y.; Wang, H.; Xia, D.; Li, Q.; Zhang, J.; Yang, J.; Li, B.; Li, H.; Han, D.; et al. Biomimetic cardiovascular stents for in vivo re-endothelialization. Biomaterials 2016, 103, 170–182. [Google Scholar] [CrossRef] [PubMed]
- ASTM A240; Standard Specification for Chromium and Chromium-Nickel Stainless Steel Plate, Sheet, and Strip for Pressure Vessels and for General Applications. ASTM International: West Conshohocken, PA, USA, 2004; Volume I, p. 12.
- Ghosh, P.; Pacella, M.; Cox, C.; Mohammad-Pour, M.; Roy, A. Unprecedented hardness of polycrystalline diamond via laser surface engineering. Surf. Coat. Technol. 2021, 419, 127302. [Google Scholar] [CrossRef]
- Stalder, A.; Kulik, G.; Sage, D.; Barbieri, L.; Hoffmann, P. A snake-based approach to accurate determination of both contact points and contact angles. Colloids Surf. A Physicochem. Eng. Asp. 2006, 286, 92–103. [Google Scholar] [CrossRef]
- Law, K.-Y. Definitions for hydrophilicity, hydrophobicity, and superhydrophobicity: Getting the basics right. J. Phys. Chem. Lett. 2014, 5, 686–688. [Google Scholar] [CrossRef]
- Kuršelis, K.; Kiyan, R.; Chichkov, B.N. Formation of corrugated and porous steel surfaces by femtosecond laser irradiation. Appl. Surf. Sci. 2012, 258, 8845–8852. [Google Scholar] [CrossRef]
- Ling, E.J.Y.; Saïd, J.; Brodusch, N.; Gauvin, R.; Servio, P.; Kietzig, A.-M. Investigating and understanding the effects of multiple femtosecond laser scans on the surface topography of stainless steel 304 and titanium. Appl. Surf. Sci. 2015, 353, 512–521. [Google Scholar] [CrossRef]
- Tsujino, I.; Ako, J.; Honda, Y.; Fitzgerald, P.J. Drug delivery via nano-, micro and macroporous coronary stent surfaces. Expert Opin. Drug Deliv. 2007, 4, 287–295. [Google Scholar] [CrossRef]
- Kato, K.; Yamamoto, A.; Ochiai, S.; Wada, M.; Daigo, Y.; Kita, K.; Omori, K. Cytocompatibility and mechanical properties of novel porous 316 L stainless steel. Mater. Sci. Eng. C 2013, 33, 2736–2743. [Google Scholar] [CrossRef]
- Li, J.-M.; Jiang, M.-F.; Ning, J.-X.; Zhai, J. Effect of casting speed on dendrite arm spacing of Mn13 steel continuous casting slab. J. Iron Steel Res. Int. 2020, 27, 665–672. [Google Scholar] [CrossRef]
- Yuan, D.; Sun, X.; Sun, L.; Zhang, Z.; Guo, C.; Wang, J.; Jiang, F. Improvement of the grain structure and mechanical properties of austenitic stainless steel fabricated by laser and wire additive manufacturing assisted with ultrasonic vibration. Mater. Sci. Eng. A 2021, 813, 141177. [Google Scholar] [CrossRef]
- Leitz, K.-H.; Redlingshöfer, B.; Reg, Y.; Otto, A.; Schmidt, M. Metal ablation with short and ultrashort laser pulses. Phys. Procedia 2011, 12, 230–238. [Google Scholar] [CrossRef]
- Hamad, A.H. Effects of Different Laser Pulse Regimes (Nanosecond, Picosecond and Femtosecond) on the Ablation of Materials for Production of Nanoparticles in Liquid Solution. In High Energy and Short Pulse Lasers; InTech: London, UK, 2016. [Google Scholar] [CrossRef]
- LaHaye, N.L.; Harilal, S.S.; Diwakar, P.K.; Hassanein, A. The effect of laser pulse duration on ICP-MS signal intensity, elemental fractionation, and detection limits in fs-LA-ICP-MS. J. Anal. At. Spectrom. 2013, 28, 1781–1787. [Google Scholar] [CrossRef]
- He, H.; Wang, C.; Zhang, X.; Ning, X.; Sun, L. Facile fabrication of multi-scale microgroove textures on Ti-based surface by coupling the re-solidification bulges derived from nanosecond laser irradiation. Surf. Coat. Technol. 2020, 386, 125460. [Google Scholar] [CrossRef]
- Gaudiuso, R. Laser-induced breakdown spectroscopy in cultural heritage science. In Spectroscopy, Diffraction and Tomography in Art and Heritage Science; Elsevier: Amsterdam, The Netherlands, 2021; pp. 209–251. [Google Scholar] [CrossRef]
- Limmaneevichitr, C.; Kou, S. Visualization of Marangoni convection in simulated weld pools. Weld. J. 2000, 79, 126–135. [Google Scholar]
- Tsotridis, G.; Rother, H.; Hondros, E. On modelling of marangoni convection flows in simulated plasma disruptions. Fusion Eng. Des. 1991, 15, 155–162. [Google Scholar] [CrossRef]
- Gupta, K.; Kolwankar, K.M.; Gore, B.; Dharmadhikari, J.A.; Dharmadhikari, A.K. Laser-driven Marangoni flow and vortex formation in a liquid droplet. Phys. Fluids 2020, 32, 121701. [Google Scholar] [CrossRef]
- Siao, Y.-H.; Wen, C.-D. Examination of molten pool with Marangoni flow and evaporation effect by simulation and experiment in selective laser melting. Int. Commun. Heat Mass Transf. 2021, 125, 105325. [Google Scholar] [CrossRef]
- Madison, J.D.; Aagesen, L.K. Quantitative characterization of porosity in laser welds of stainless steel. Scr. Mater. 2012, 67, 783–786. [Google Scholar] [CrossRef]
- Bertoli, U.S.; Wolfer, A.J.; Matthews, M.J.; Delplanque, J.-P.R.; Schoenung, J.M. On the limitations of Volumetric Energy Density as a design parameter for Selective Laser Melting. Mater. Des. 2017, 113, 331–340. [Google Scholar] [CrossRef]
- Schnell, G.; Duenow, U.; Seitz, H. Effect of laser pulse overlap and scanning line overlap on femtosecond laser-structured Ti6Al4V surfaces. Materials 2020, 13, 969. [Google Scholar] [CrossRef] [PubMed]
- Kittiboonanan, P.; McWilliams, J.; Taechamaneesatit, P.; Ratanavis, A. Effects of Laser Pulse Overlap using Nanosecond Fiber Lasers for Structuring of AA6061-T6 Surfaces. Lasers Manuf. Mater. Process. 2023, 10, 190–203. [Google Scholar] [CrossRef]
- Cocean, A.; Cocean, I.; Cocean, G.; Postolachi, C.; Pricop, D.A.; Munteanu, B.S.; Cimpoesu, N.; Gurlui, S. Study of Physico-Chemical Interactions during the Production of Silver Citrate Nanocomposites with Hemp Fiber. Nanomaterials 2021, 11, 2560. [Google Scholar] [CrossRef]
- Wu, M.; Guo, B.; Zhao, Q. Laser machining micro-structures on diamond surface with a sub-nanosecond pulsed laser. Appl. Phys. A Mater. Sci. Process. 2018, 124, 170. [Google Scholar] [CrossRef]
- Xie, F.; Yang, J.; Ngo, C.-V. The effect of femtosecond laser fluence and pitches between V-shaped microgrooves on the dynamics of capillary flow. Results Phys. 2020, 19, 103606. [Google Scholar] [CrossRef]
- Winterton, R.H.S.; Interton, R.H.S.W. Newton’s law of cooling. Contemp. Phys. 1999, 40, 205–212. [Google Scholar] [CrossRef]
- Fu, Z.; Yang, B.; Shan, M.; Li, T.; Zhu, Z.; Ma, C.; Zhang, X.; Gou, G.; Wang, Z.; Gao, W. Hydrogen embrittlement behavior of SUS301L-MT stainless steel laser-arc hybrid welded joint localized zones. Corros. Sci. 2020, 164, 108337. [Google Scholar] [CrossRef]
- Rappaz, M.; Gandin, C.-A. Probabilistic modelling of microstructure formation in solidification processes. Acta Metall. Mater. 1993, 41, 345–360. [Google Scholar] [CrossRef]
- Do-Quang, M.; Amberg, G. Simulation of free dendritic crystal growth in a gravity environment. J. Comput. Phys. 2008, 227, 1772–1789. [Google Scholar] [CrossRef]
- Wenzel, R.N. Resistance of solid surfaces to wetting by water. Ind. Eng. Chem. 1936, 28, 988–994. [Google Scholar] [CrossRef]
- Cassie, A.B.D.; Baxter, S. Wettability of porous surfaces. Trans. Faraday Soc. 1944, 40, 546–551. [Google Scholar] [CrossRef]
- Giacomello, A.; Meloni, S.; Chinappi, M.; Casciola, C.M. Cassie-baxter and wenzel states on a nanostructured surface: Phase diagram, metastabilities, and transition mechanism by atomistic free energy calculations. Langmuir 2012, 28, 10764–10772. [Google Scholar] [CrossRef] [PubMed]
- Seemann, R.; Brinkmann, M.; Kramer, E.J.; Lange, F.F.; Lipowsky, R. Wetting morphologies at microstructured surfaces. Proc. Natl. Acad. Sci. USA 2005, 102, 1848–1852. [Google Scholar] [CrossRef] [PubMed]
- Clapeyron, E. Mémoire sur la puissance motrice de la chaleur. J. De L’école Polytech. 1834, XIV, 153–190. Available online: https://gallica.bnf.fr/ark:/12148/bpt6k4336791/f157.table (accessed on 10 April 2024).
- Žemaitis, A.; Mimidis, A.; Papadopoulos, A.; Gečys, P.; Račiukaitis, G.; Stratakis, E. and Gedvilas, M. Controlling the wettability of stainless steel from highly-hydrophilic to super-hydrophobic by femtosecond laser-induced ripples and nanospikes. RSC Adv. 2020, 10, 37956–37961. [Google Scholar] [CrossRef]
- Long, J.; Zhong, M.; Zhang, H. and Fan, P. Superhydrophilicity to superhydrophobicity transition of picosecond laser microstructured aluminum in ambient air. J. Colloid. Interface Sci. 2015, 441, 1–9. [Google Scholar] [CrossRef] [PubMed]
- Pou, P.; del Val, J.; Riveiro, A.; Comesaña, R.; Arias-González, F.; Lusquiños, F.; Bountinguiza, M.; Quintero, F. and Pou, J. Laser texturing of stainless steel under different processing atmospheres: From superhydrophilic to superhydrophobic surfaces. Appl. Surf. Sci. 2019, 475, 896–905. [Google Scholar] [CrossRef]
- Karthik, N.; Chandrasekaran, S.; Edison, T.N.J.I.; Atchudan, R.; Choi, S.T. Effect of femtosecond laser-texturing on the oxygen evolution reaction of the stainless-steel plate. Mol. Catal. 2023, 541, 113072. [Google Scholar] [CrossRef]
- Nakae, H.; Inui, R.; Hirata, Y.; Saito, H. Effects of surface roughness on wettability. Acta Mater. 1998, 46, 2313–2318. [Google Scholar] [CrossRef]
- Hejazi, V.; Moghadam, A.D.; Rohatgi, P.; Nosonovsky, M. Beyond Wenzel and Cassie-Baxter: Second-order effects on the wetting of rough surfaces. Langmuir 2014, 30, 9423–9429. [Google Scholar] [CrossRef] [PubMed]
- Leese, H.; Bhurtun, V.; Lee, K.P.; Mattia, D. Wetting behaviour of hydrophilic and hydrophobic nanostructured porous anodic alumina. Colloids Surf. A Physicochem. Eng. Asp. 2013, 420, 53–58. [Google Scholar] [CrossRef]
- Dong, J.; Pacella, M.; Liu, Y.; Zhao, L. Surface engineering and the application of laser-based processes to stents—A review of the latest development. Bioact. Mater. 2022, 10, 159–184. [Google Scholar] [CrossRef]


Disclaimer/Publisher’s Note: The statements, opinions and data contained in all publications are solely those of the individual author(s) and contributor(s) and not of MDPI and/or the editor(s). MDPI and/or the editor(s) disclaim responsibility for any injury to people or property resulting from any ideas, methods, instructions or products referred to in the content. |
© 2024 by the authors. Licensee MDPI, Basel, Switzerland. This article is an open access article distributed under the terms and conditions of the Creative Commons Attribution (CC BY) license (https://creativecommons.org/licenses/by/4.0/).