


Calculation and Experimental Verification of Zn–Al–Mg Phase Diagram

Abstract
1. Introduction
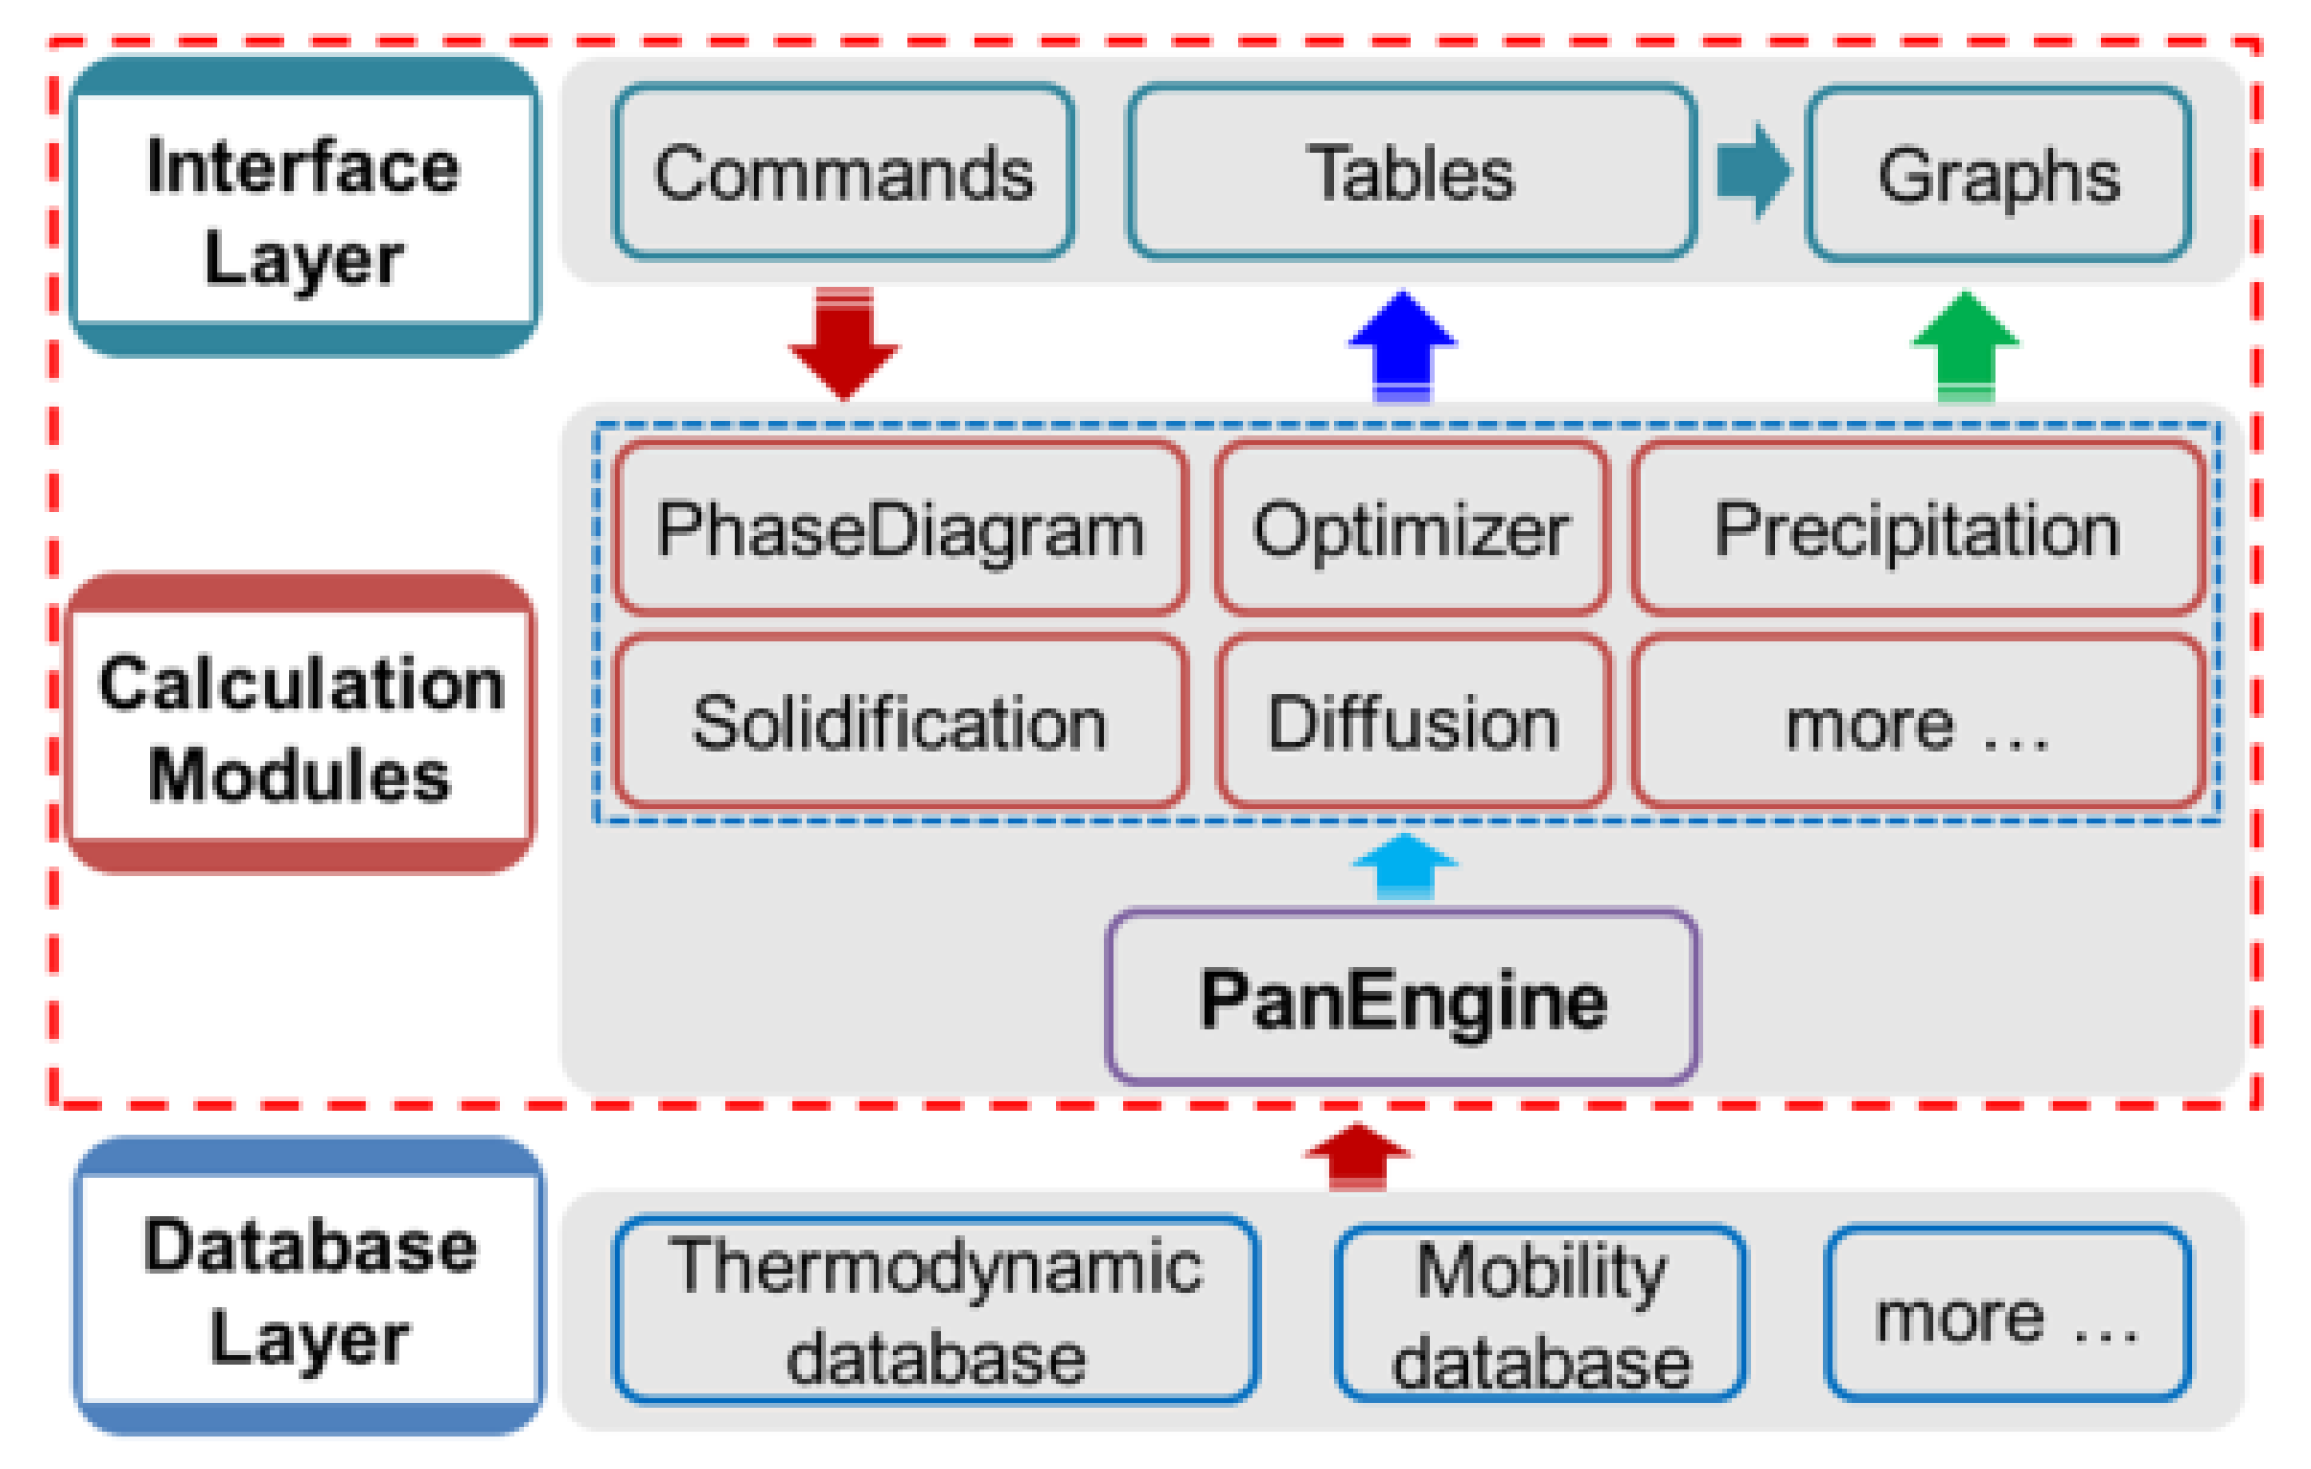
2. Pandat
2.1. Pandat Basics
2.2. Establishment of Thermodynamic Model
2.3. Zn–Al–Mg Thermodynamic Parameters
3. Phase Diagram Calculation
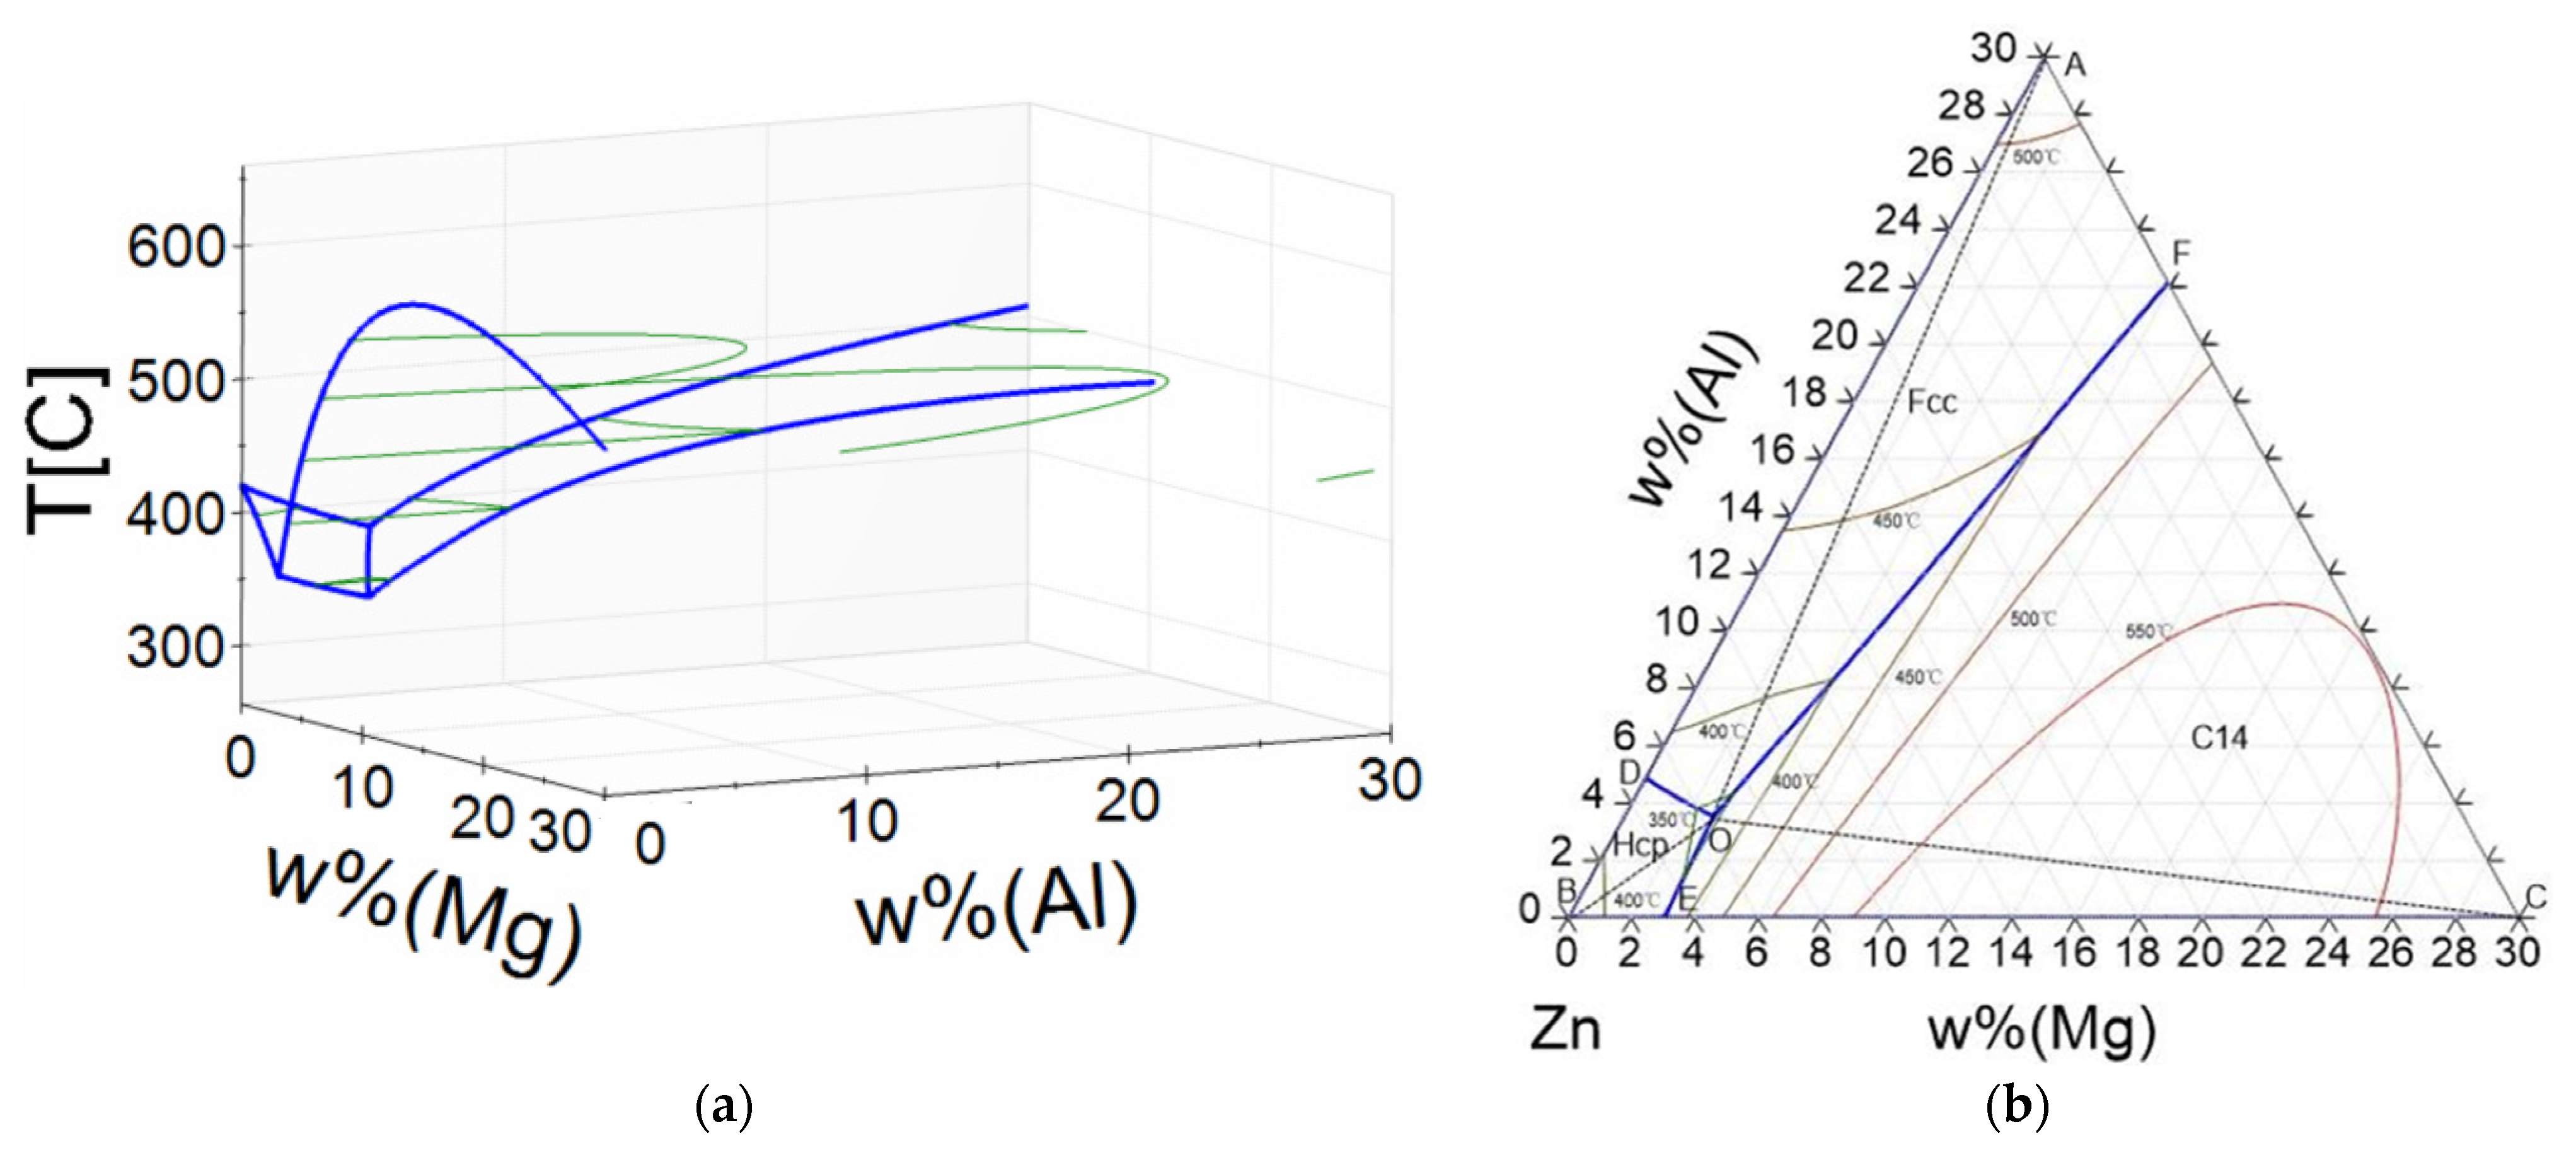
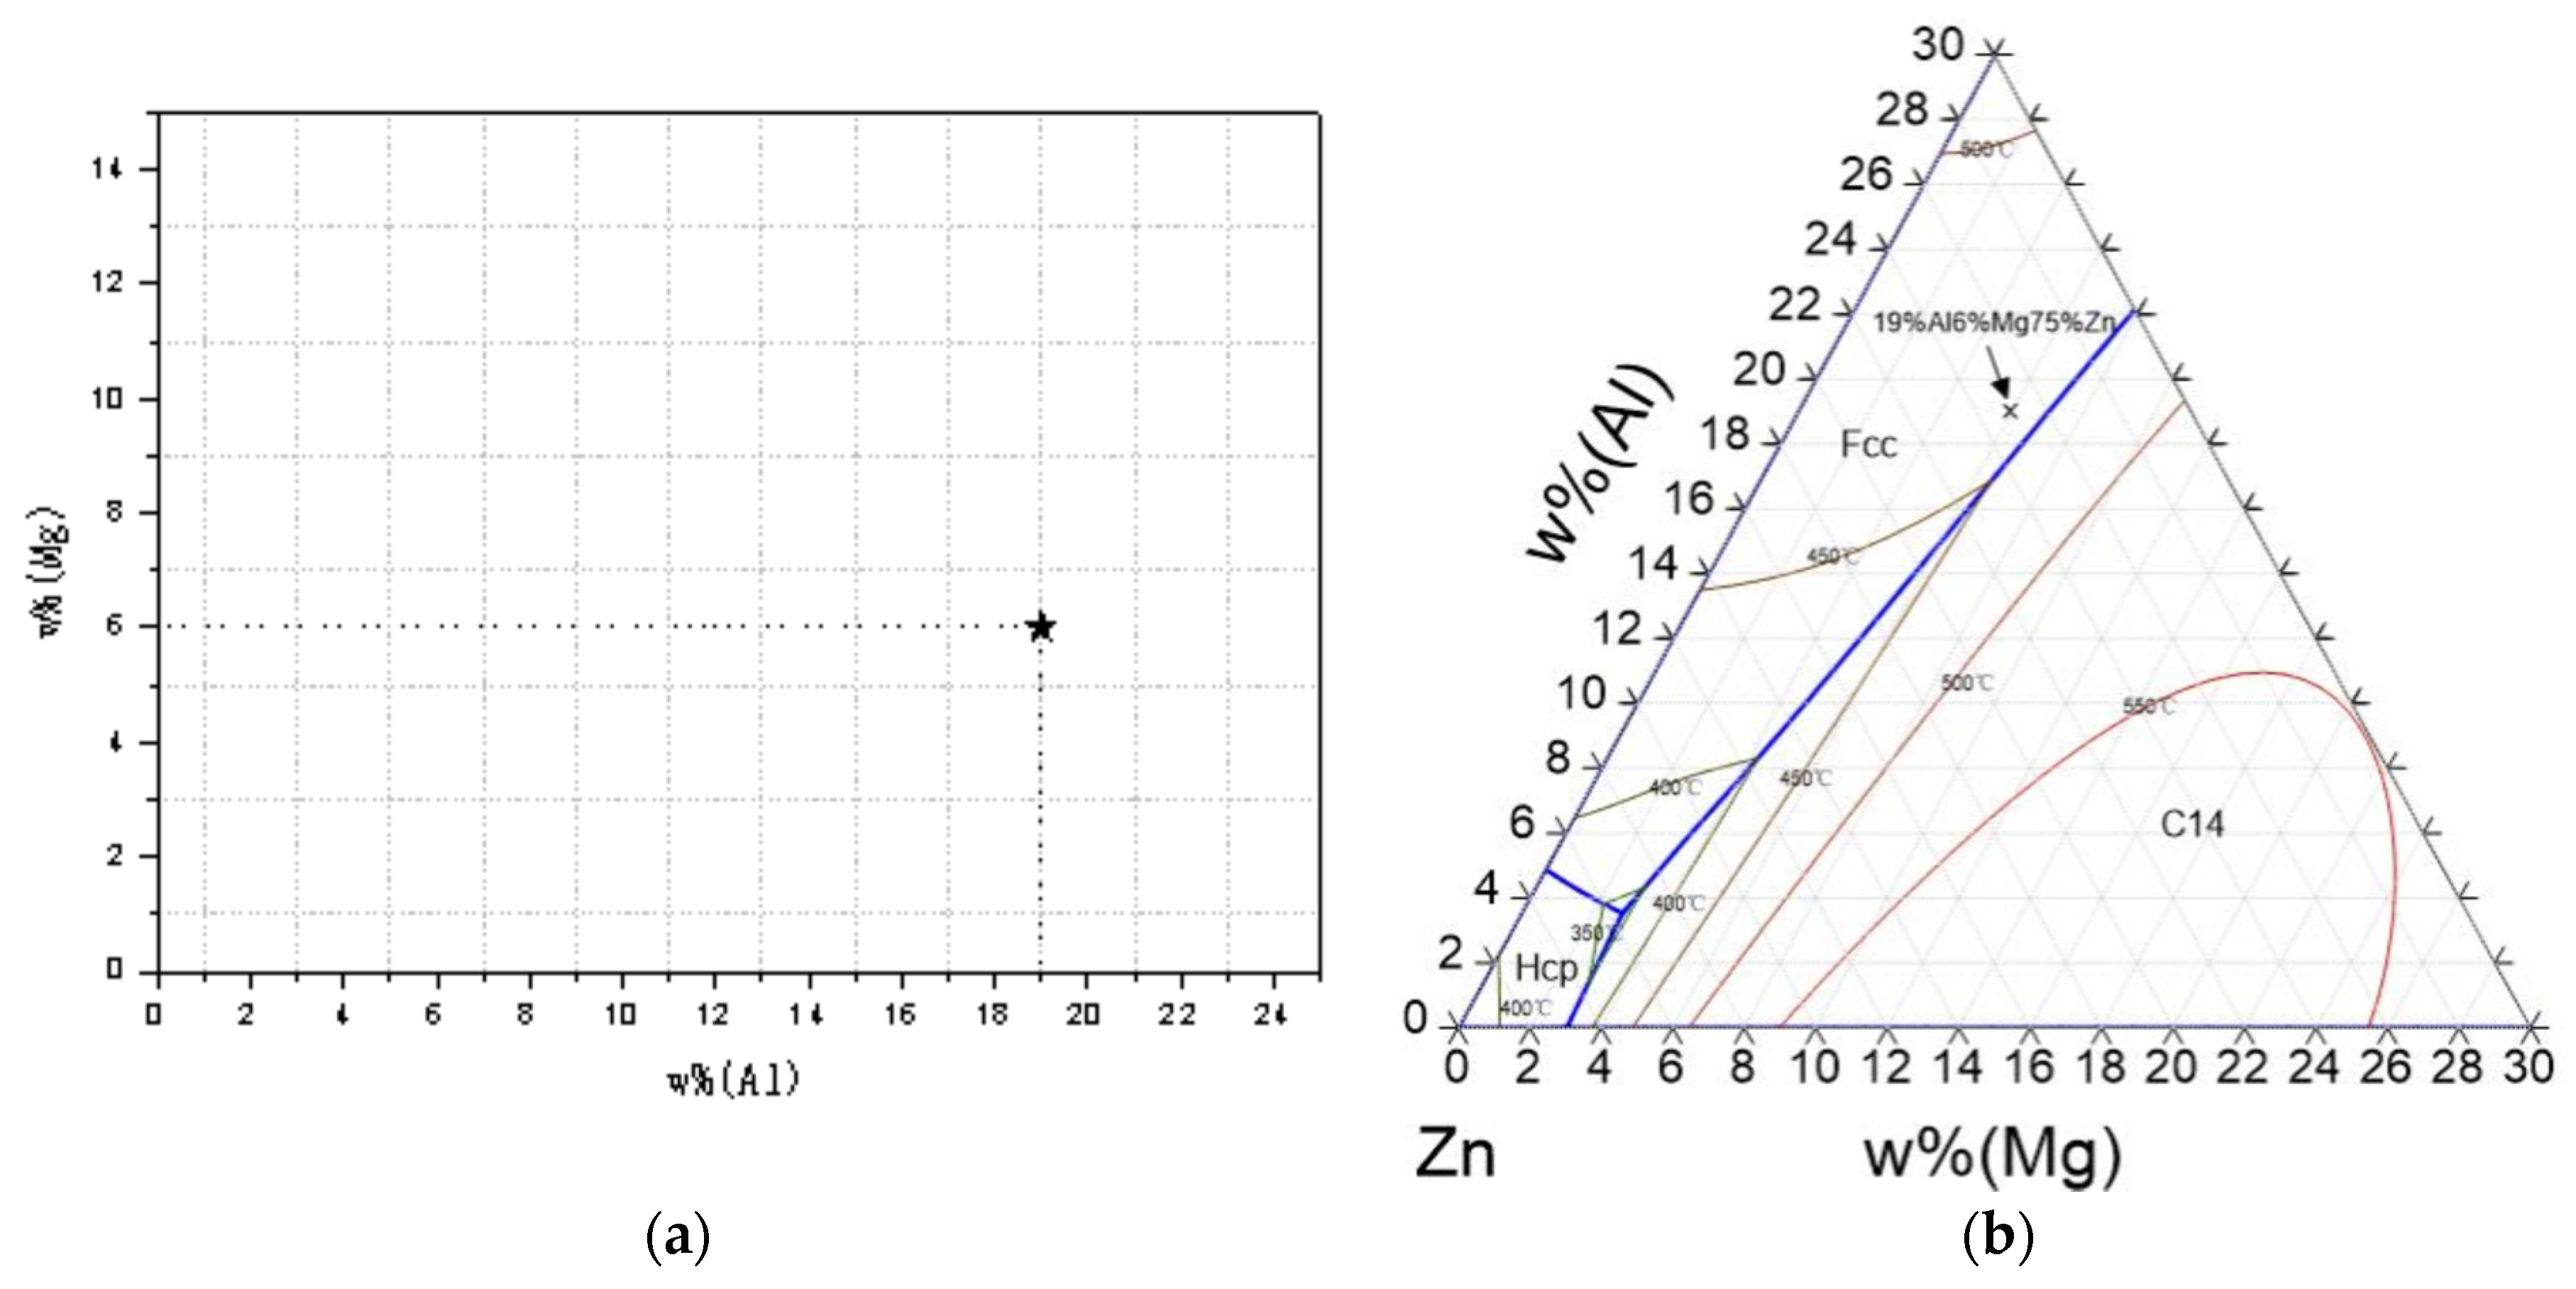
3.1. Ternary Phase Diagram and Liquidus Surface Projection of the Zn–Al–Mg System
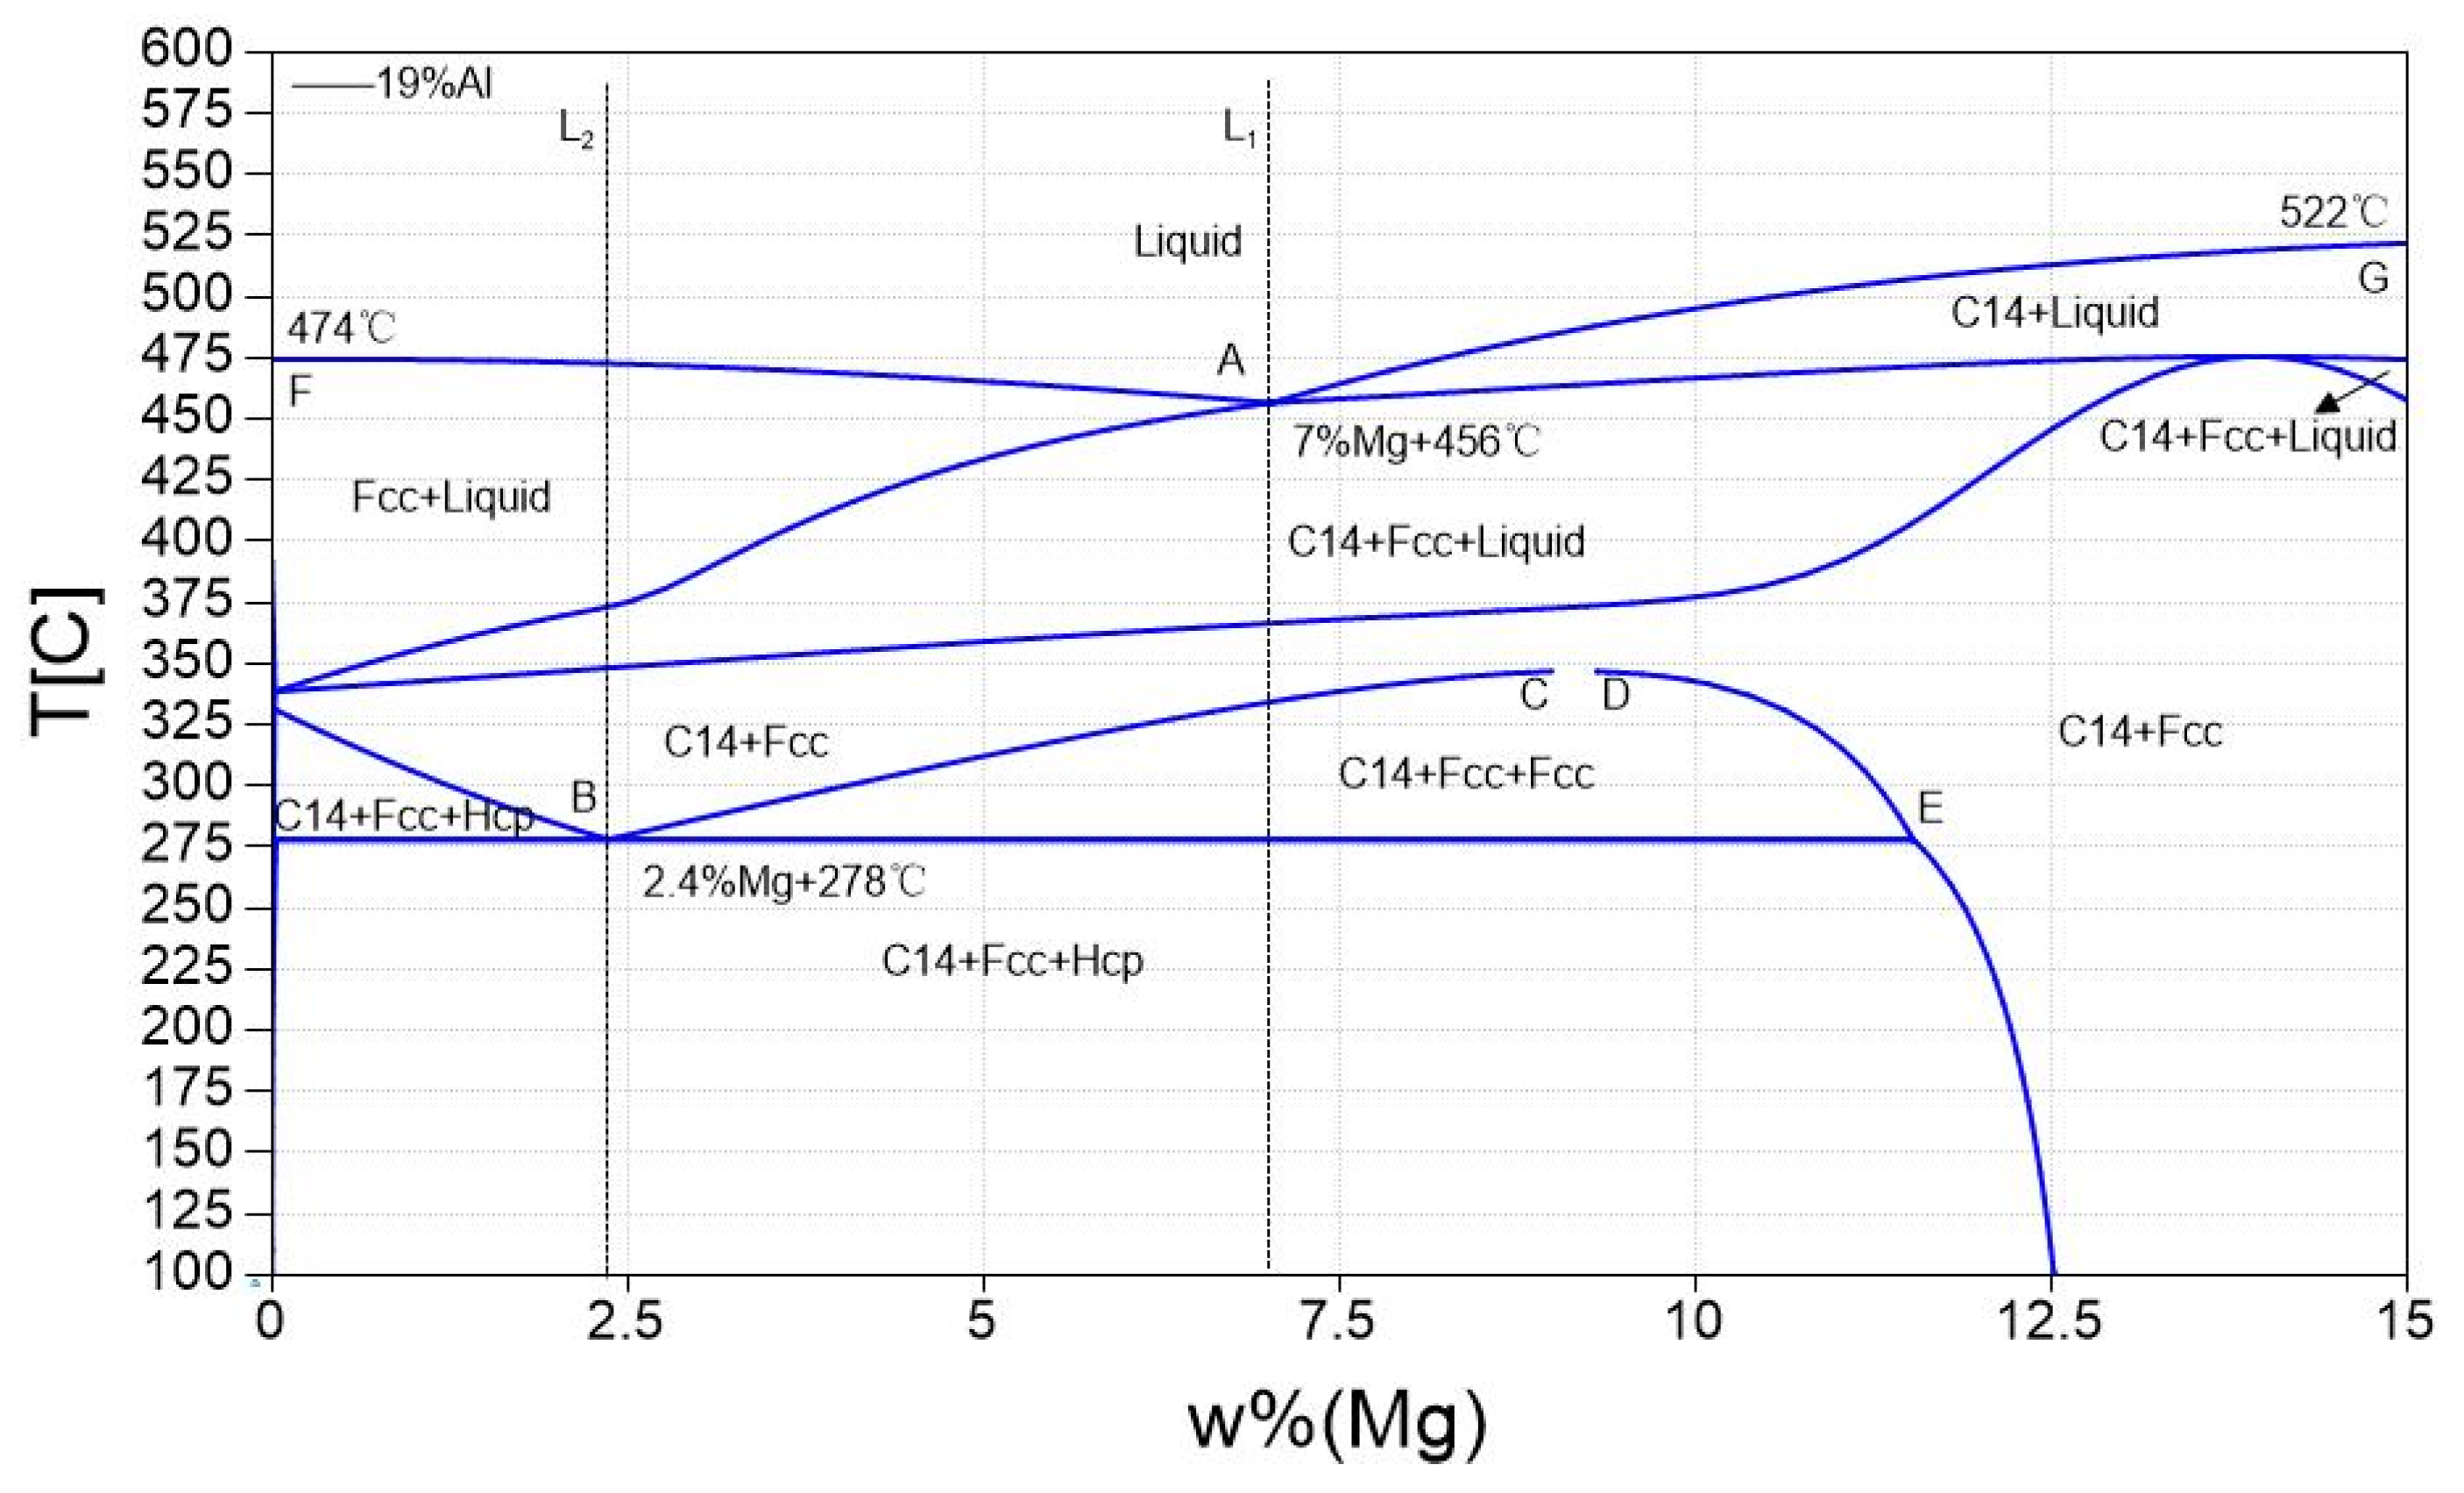
3.2. Zn-19%Al-x%Mg Vertical Section
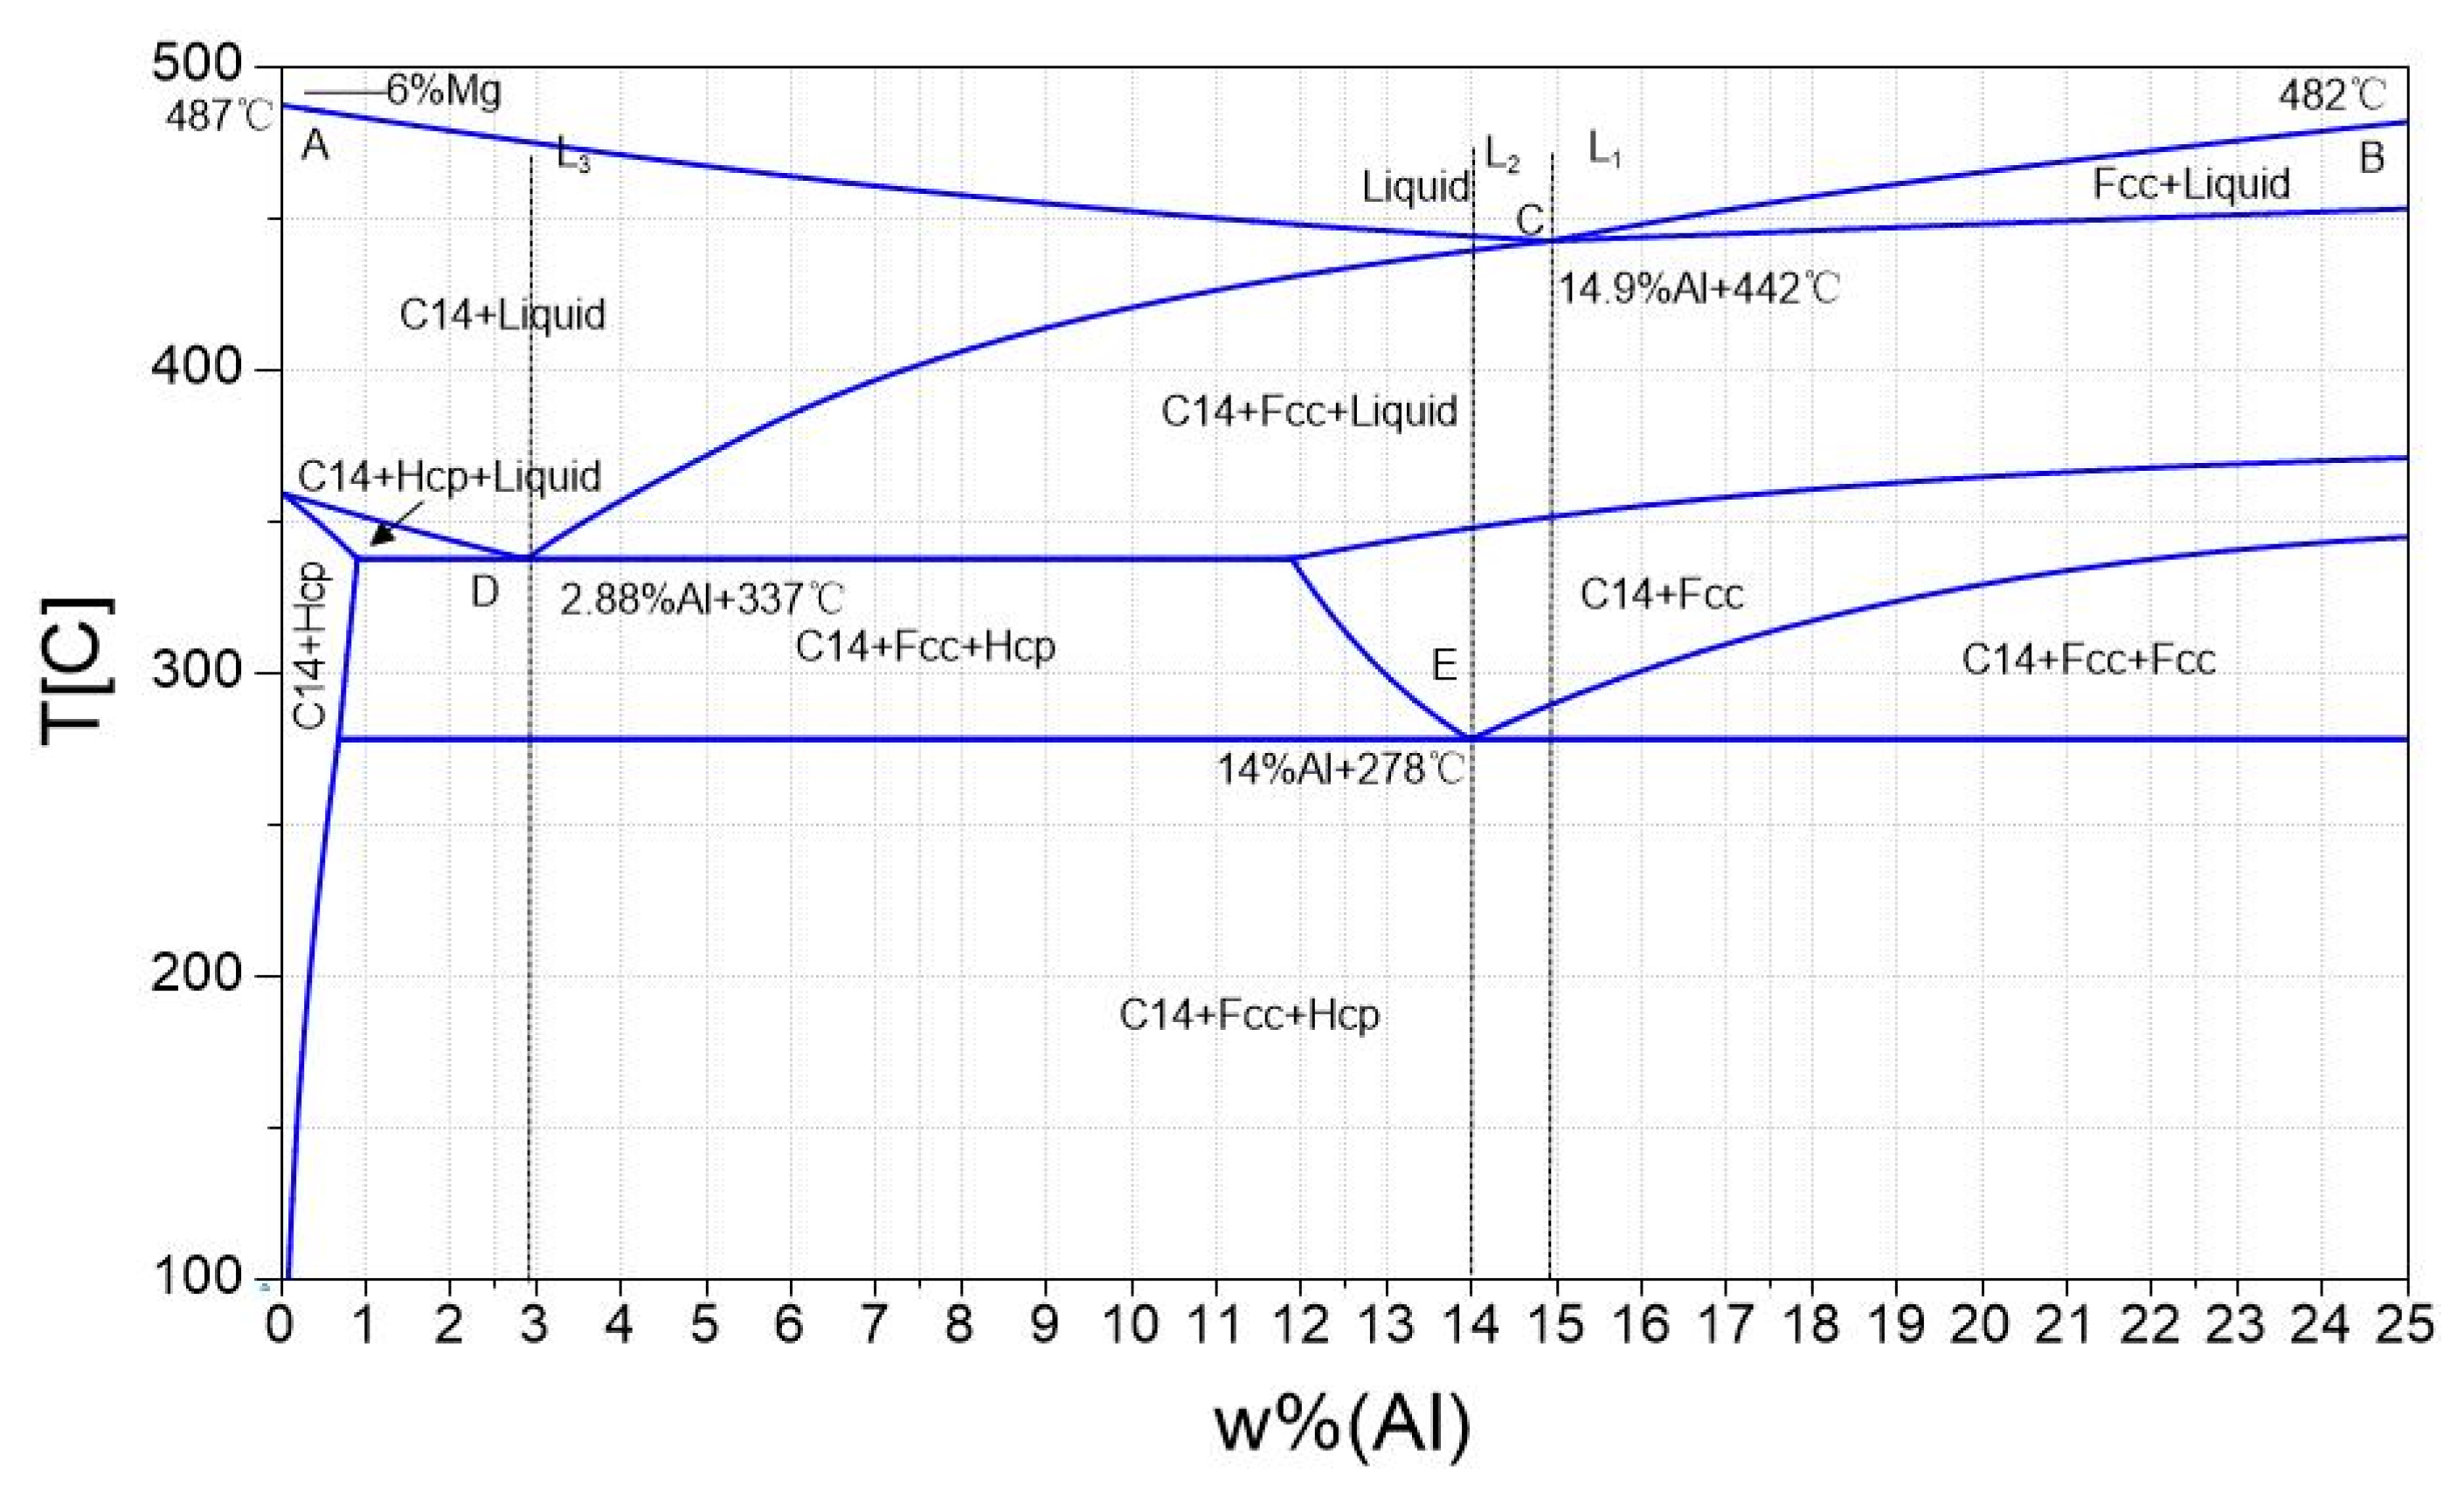
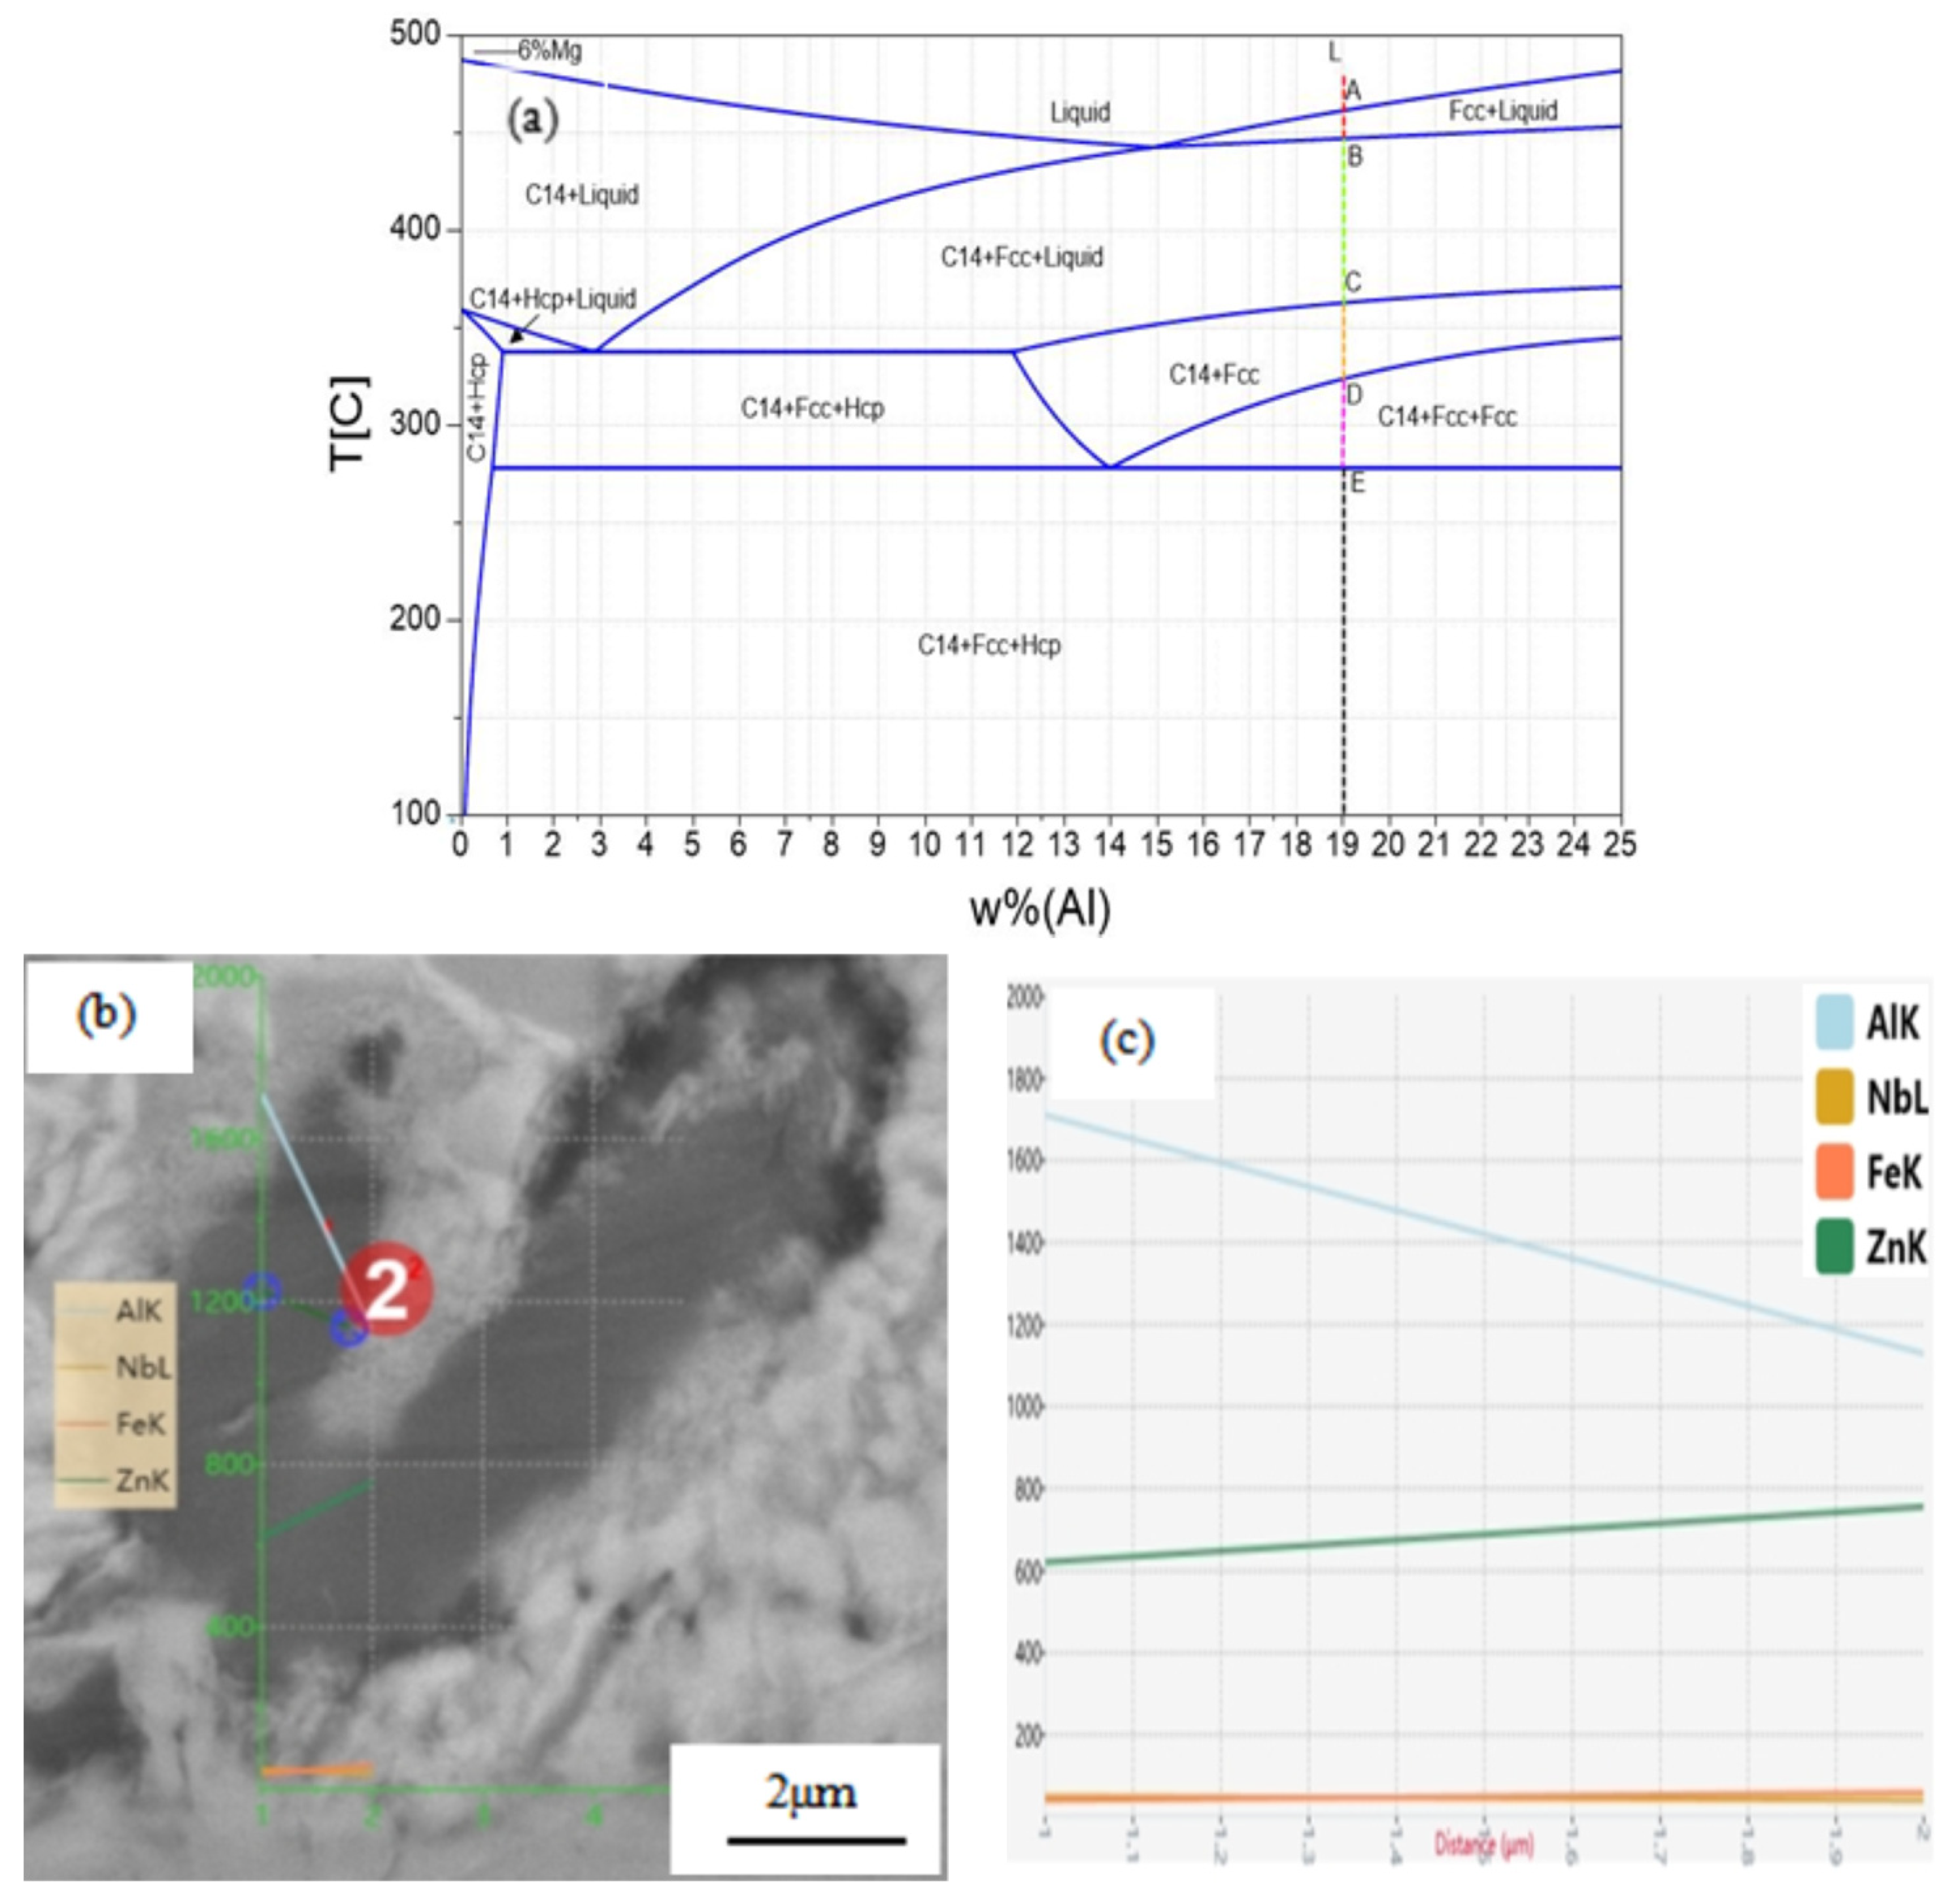
3.3. Zn–x%Al–6%Mg Vertical Section
4. Experimental Verification
4.1. Experimental Procedure
4.2. Results and Analysis
5. Conclusions
- The solidification structure of the 75%Zn–19%Al–6%Mg coating and the solidification process of the alloy calculated by phase diagram software (Pandat) are consistent with the experimental results.
- This paper used the Pandat software to calculate the ternary phase diagram and composition section of Zn–Al–Mg. The results of the phase diagram calculations can provide theoretical support for laboratory research and large-scale industrial production.
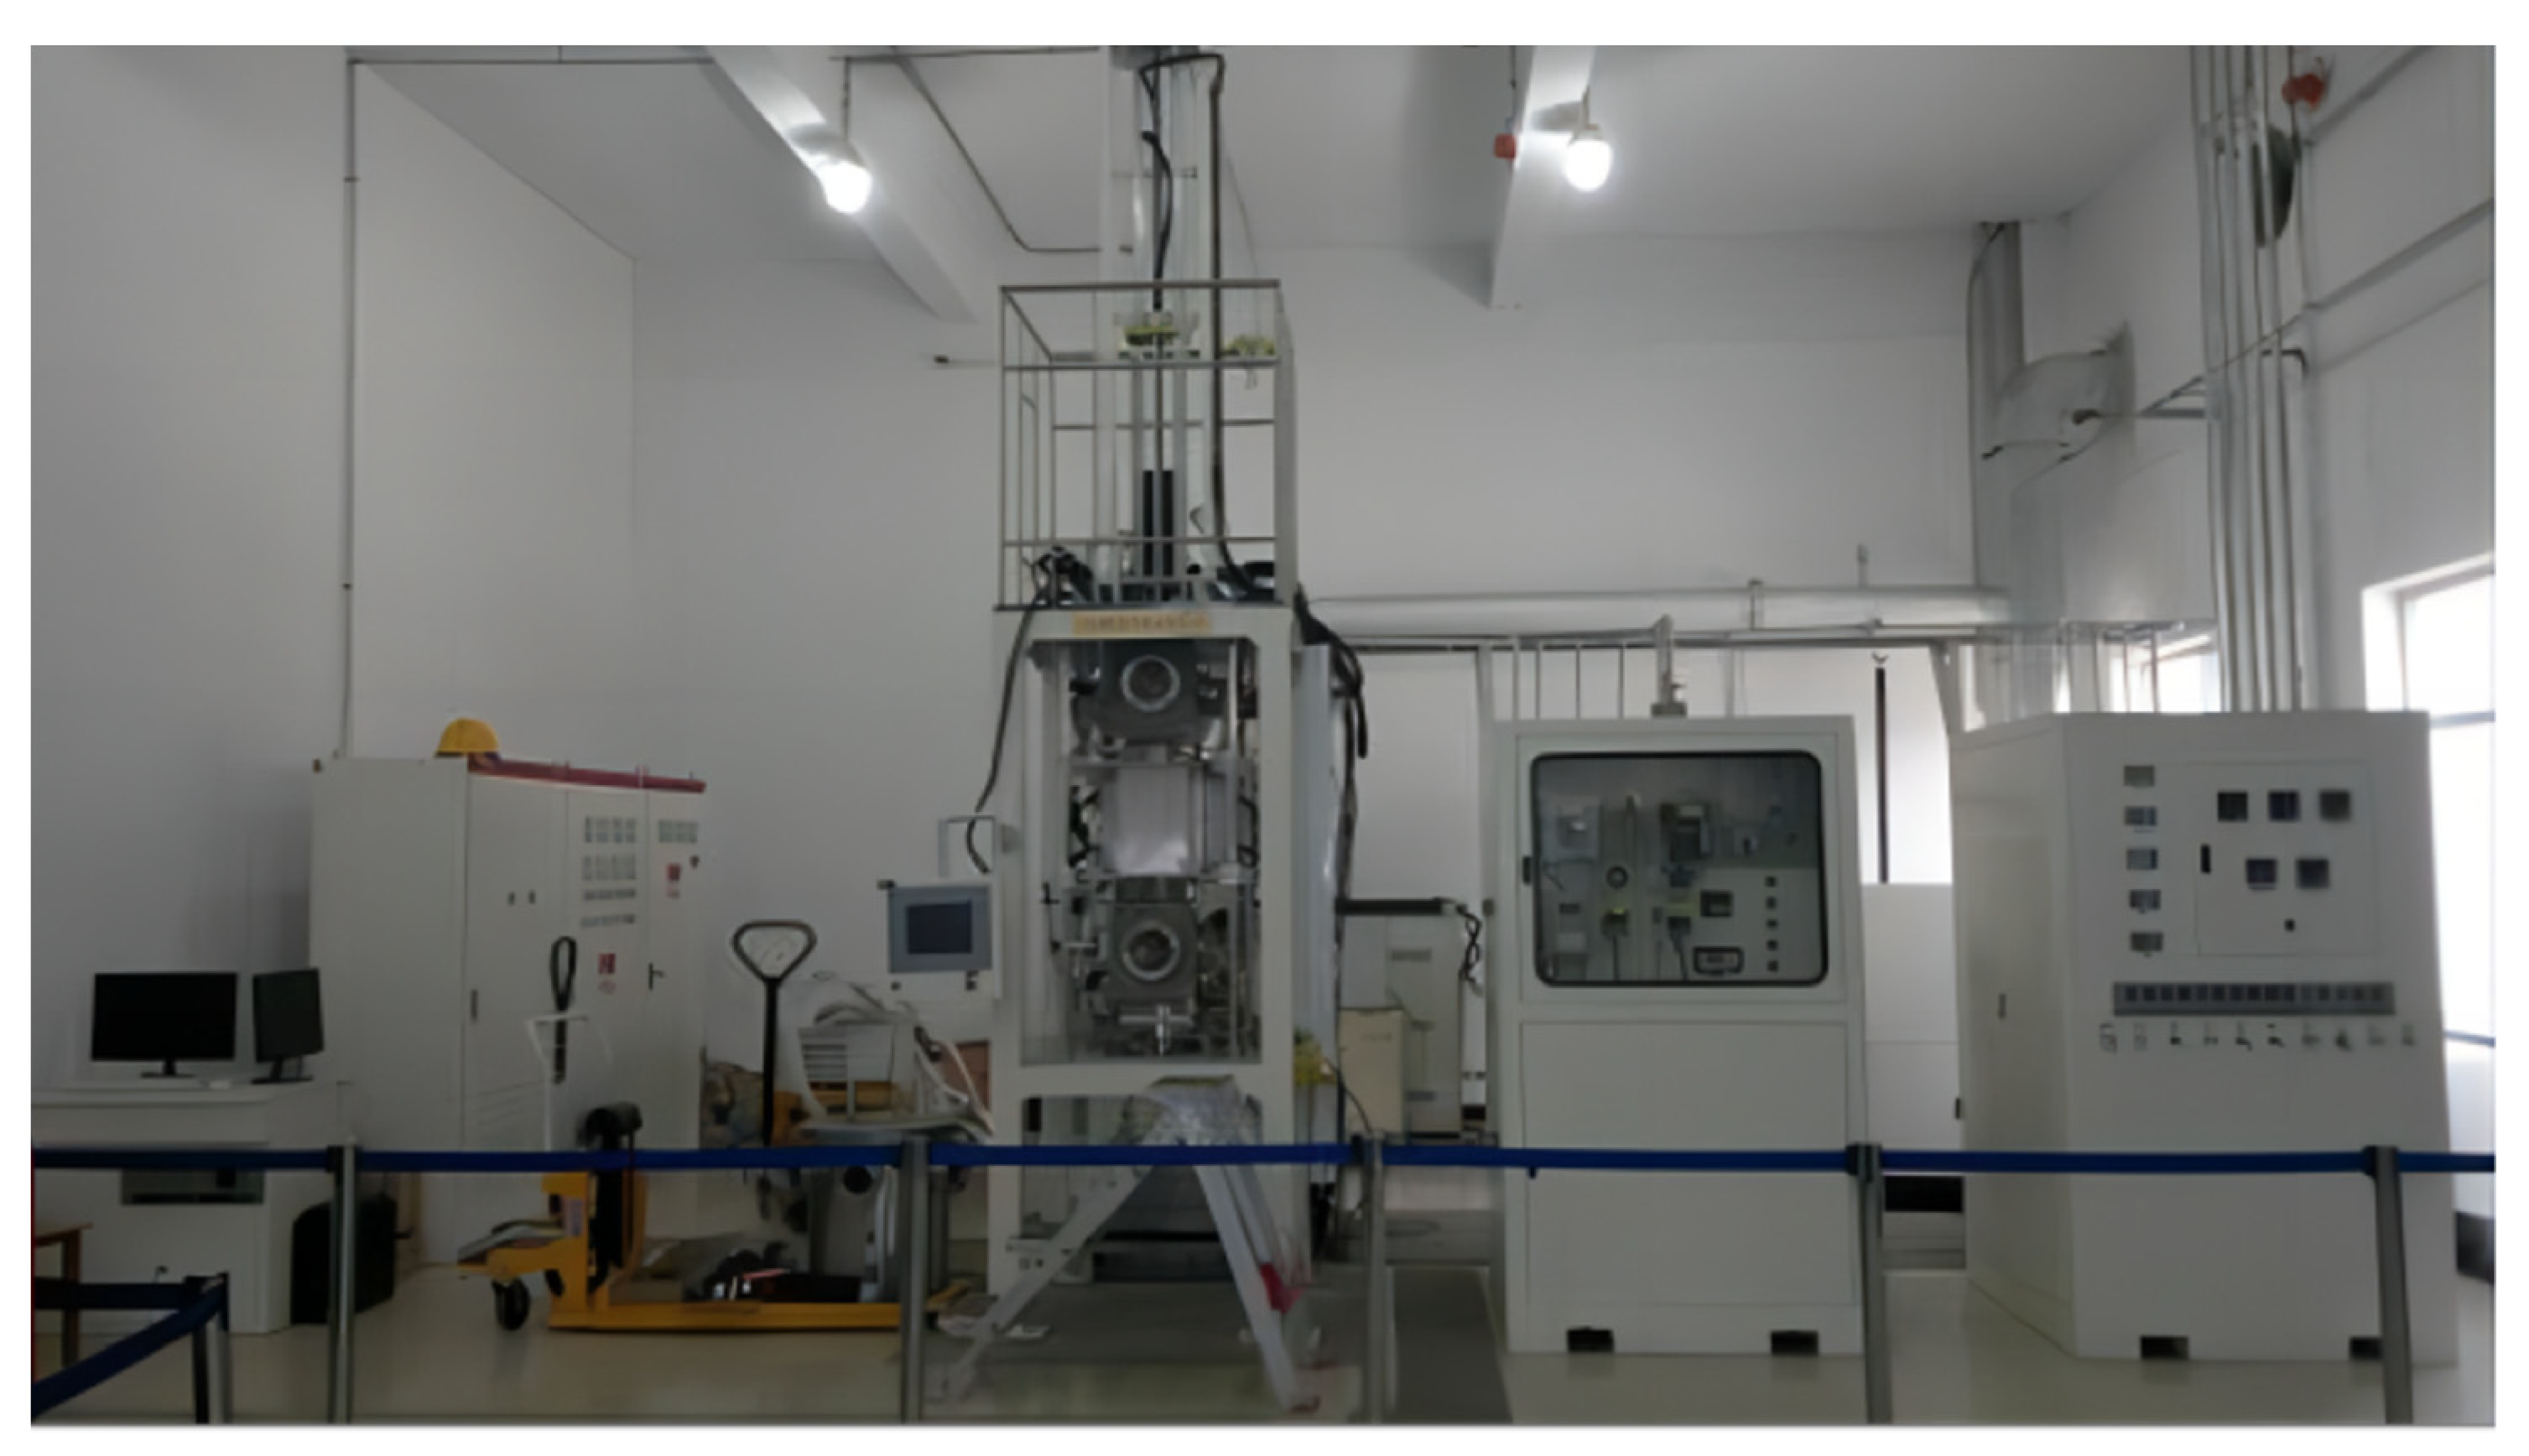
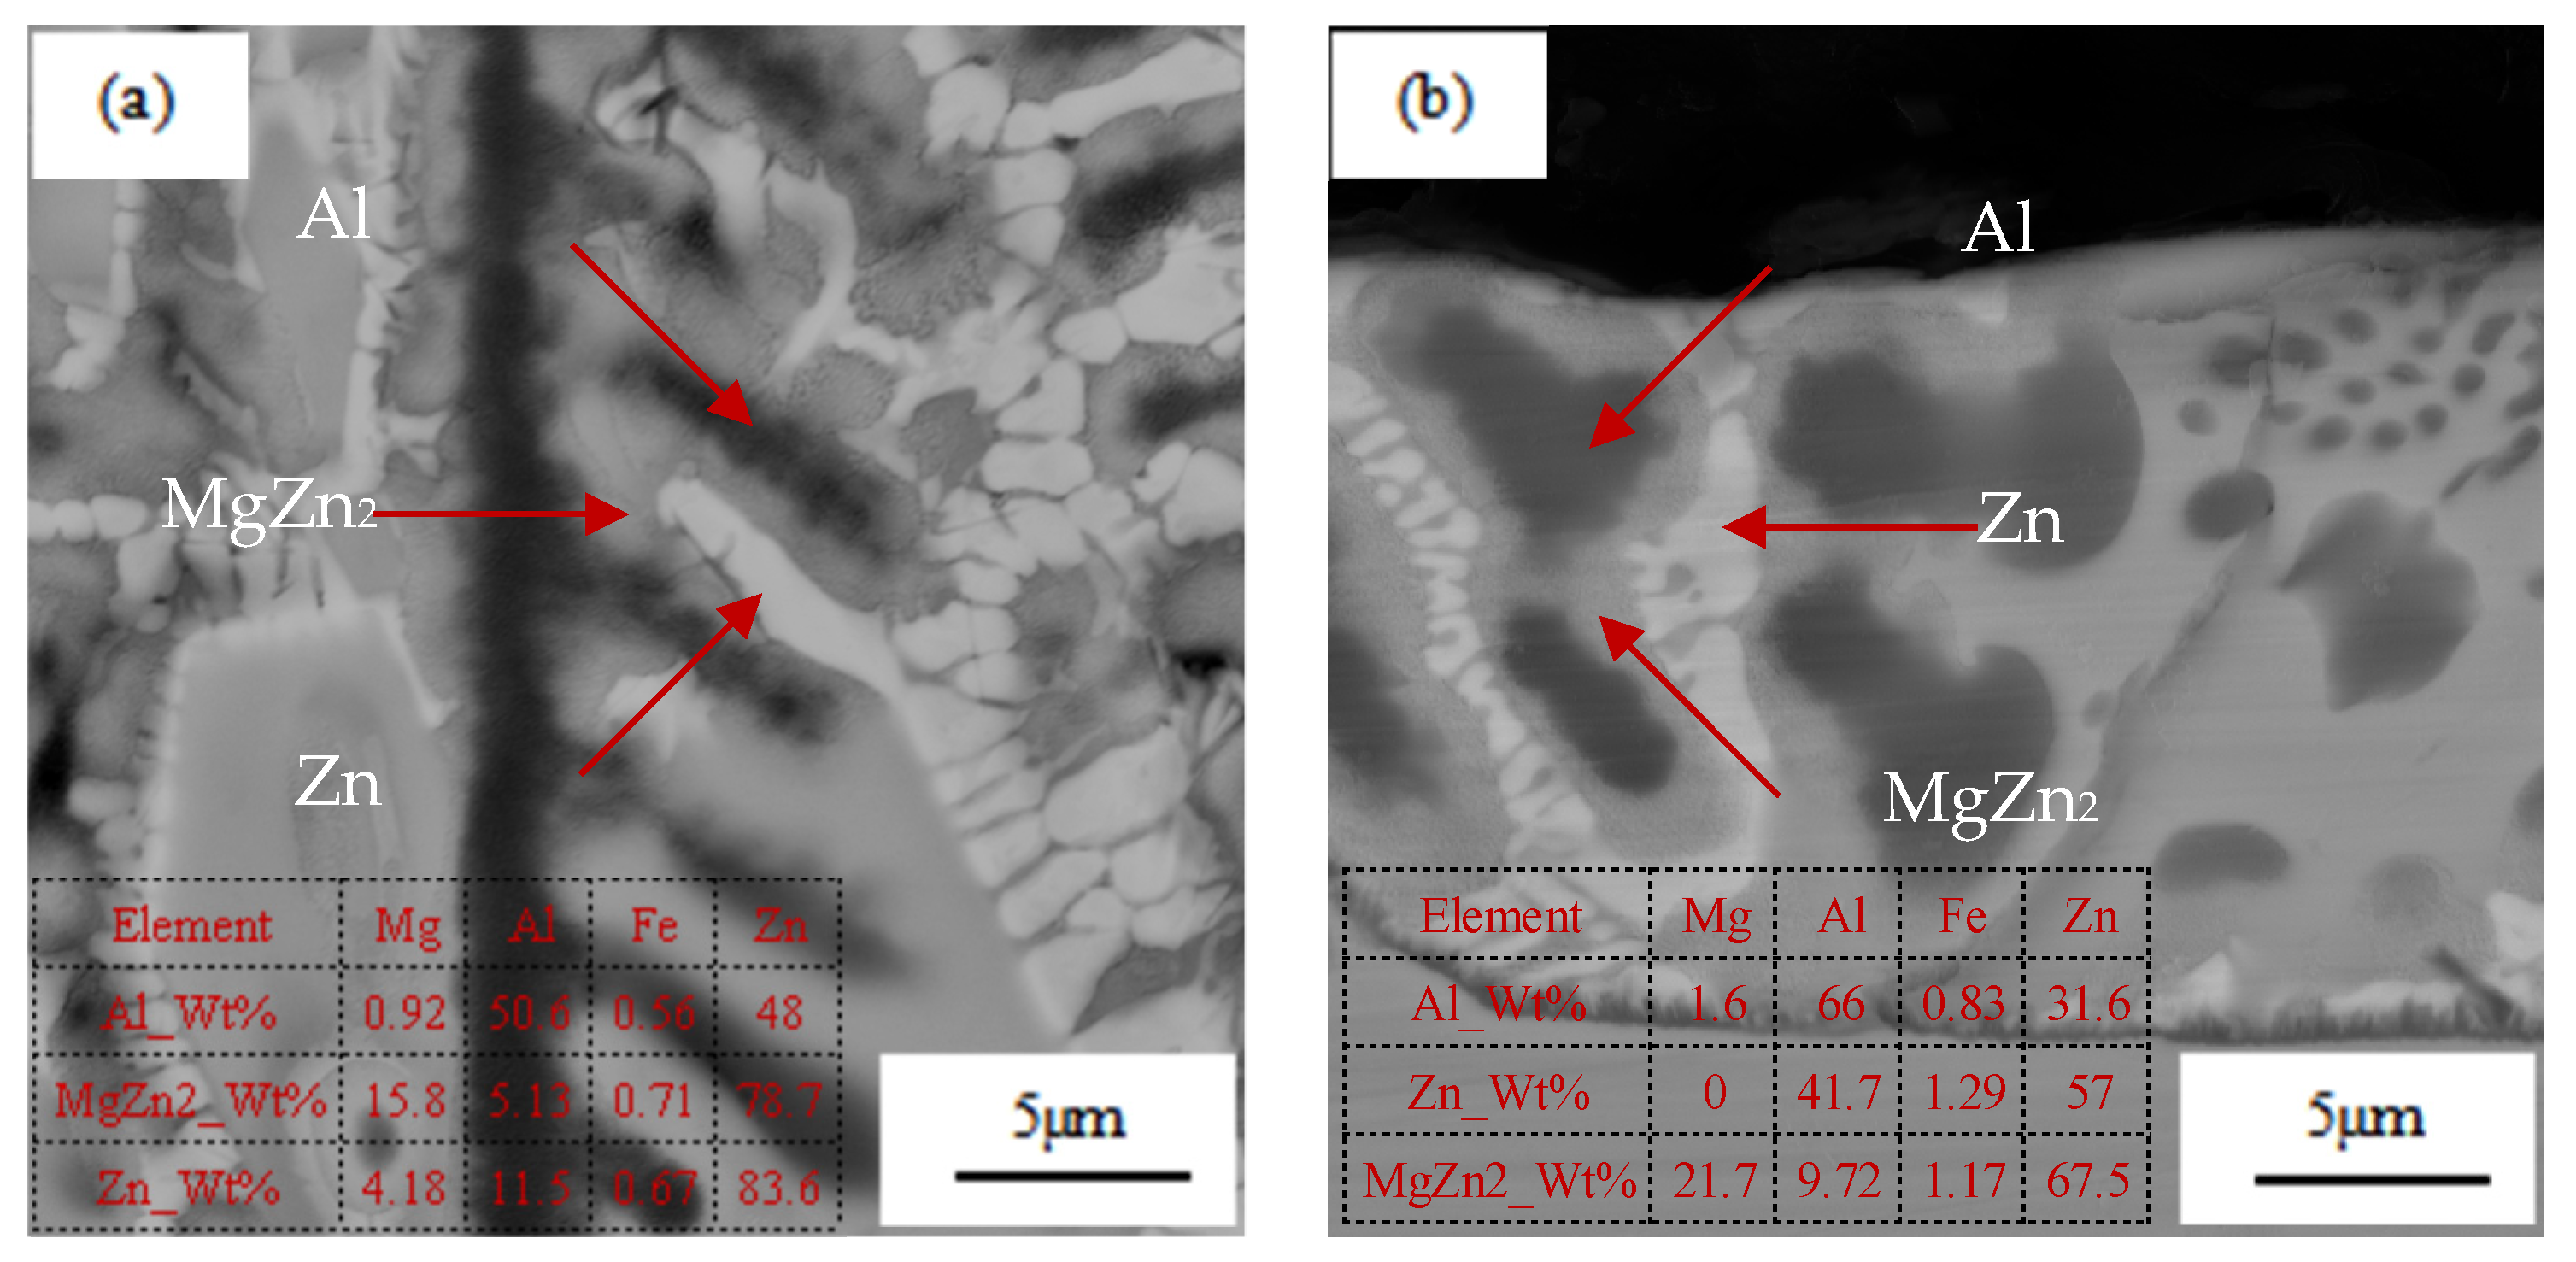
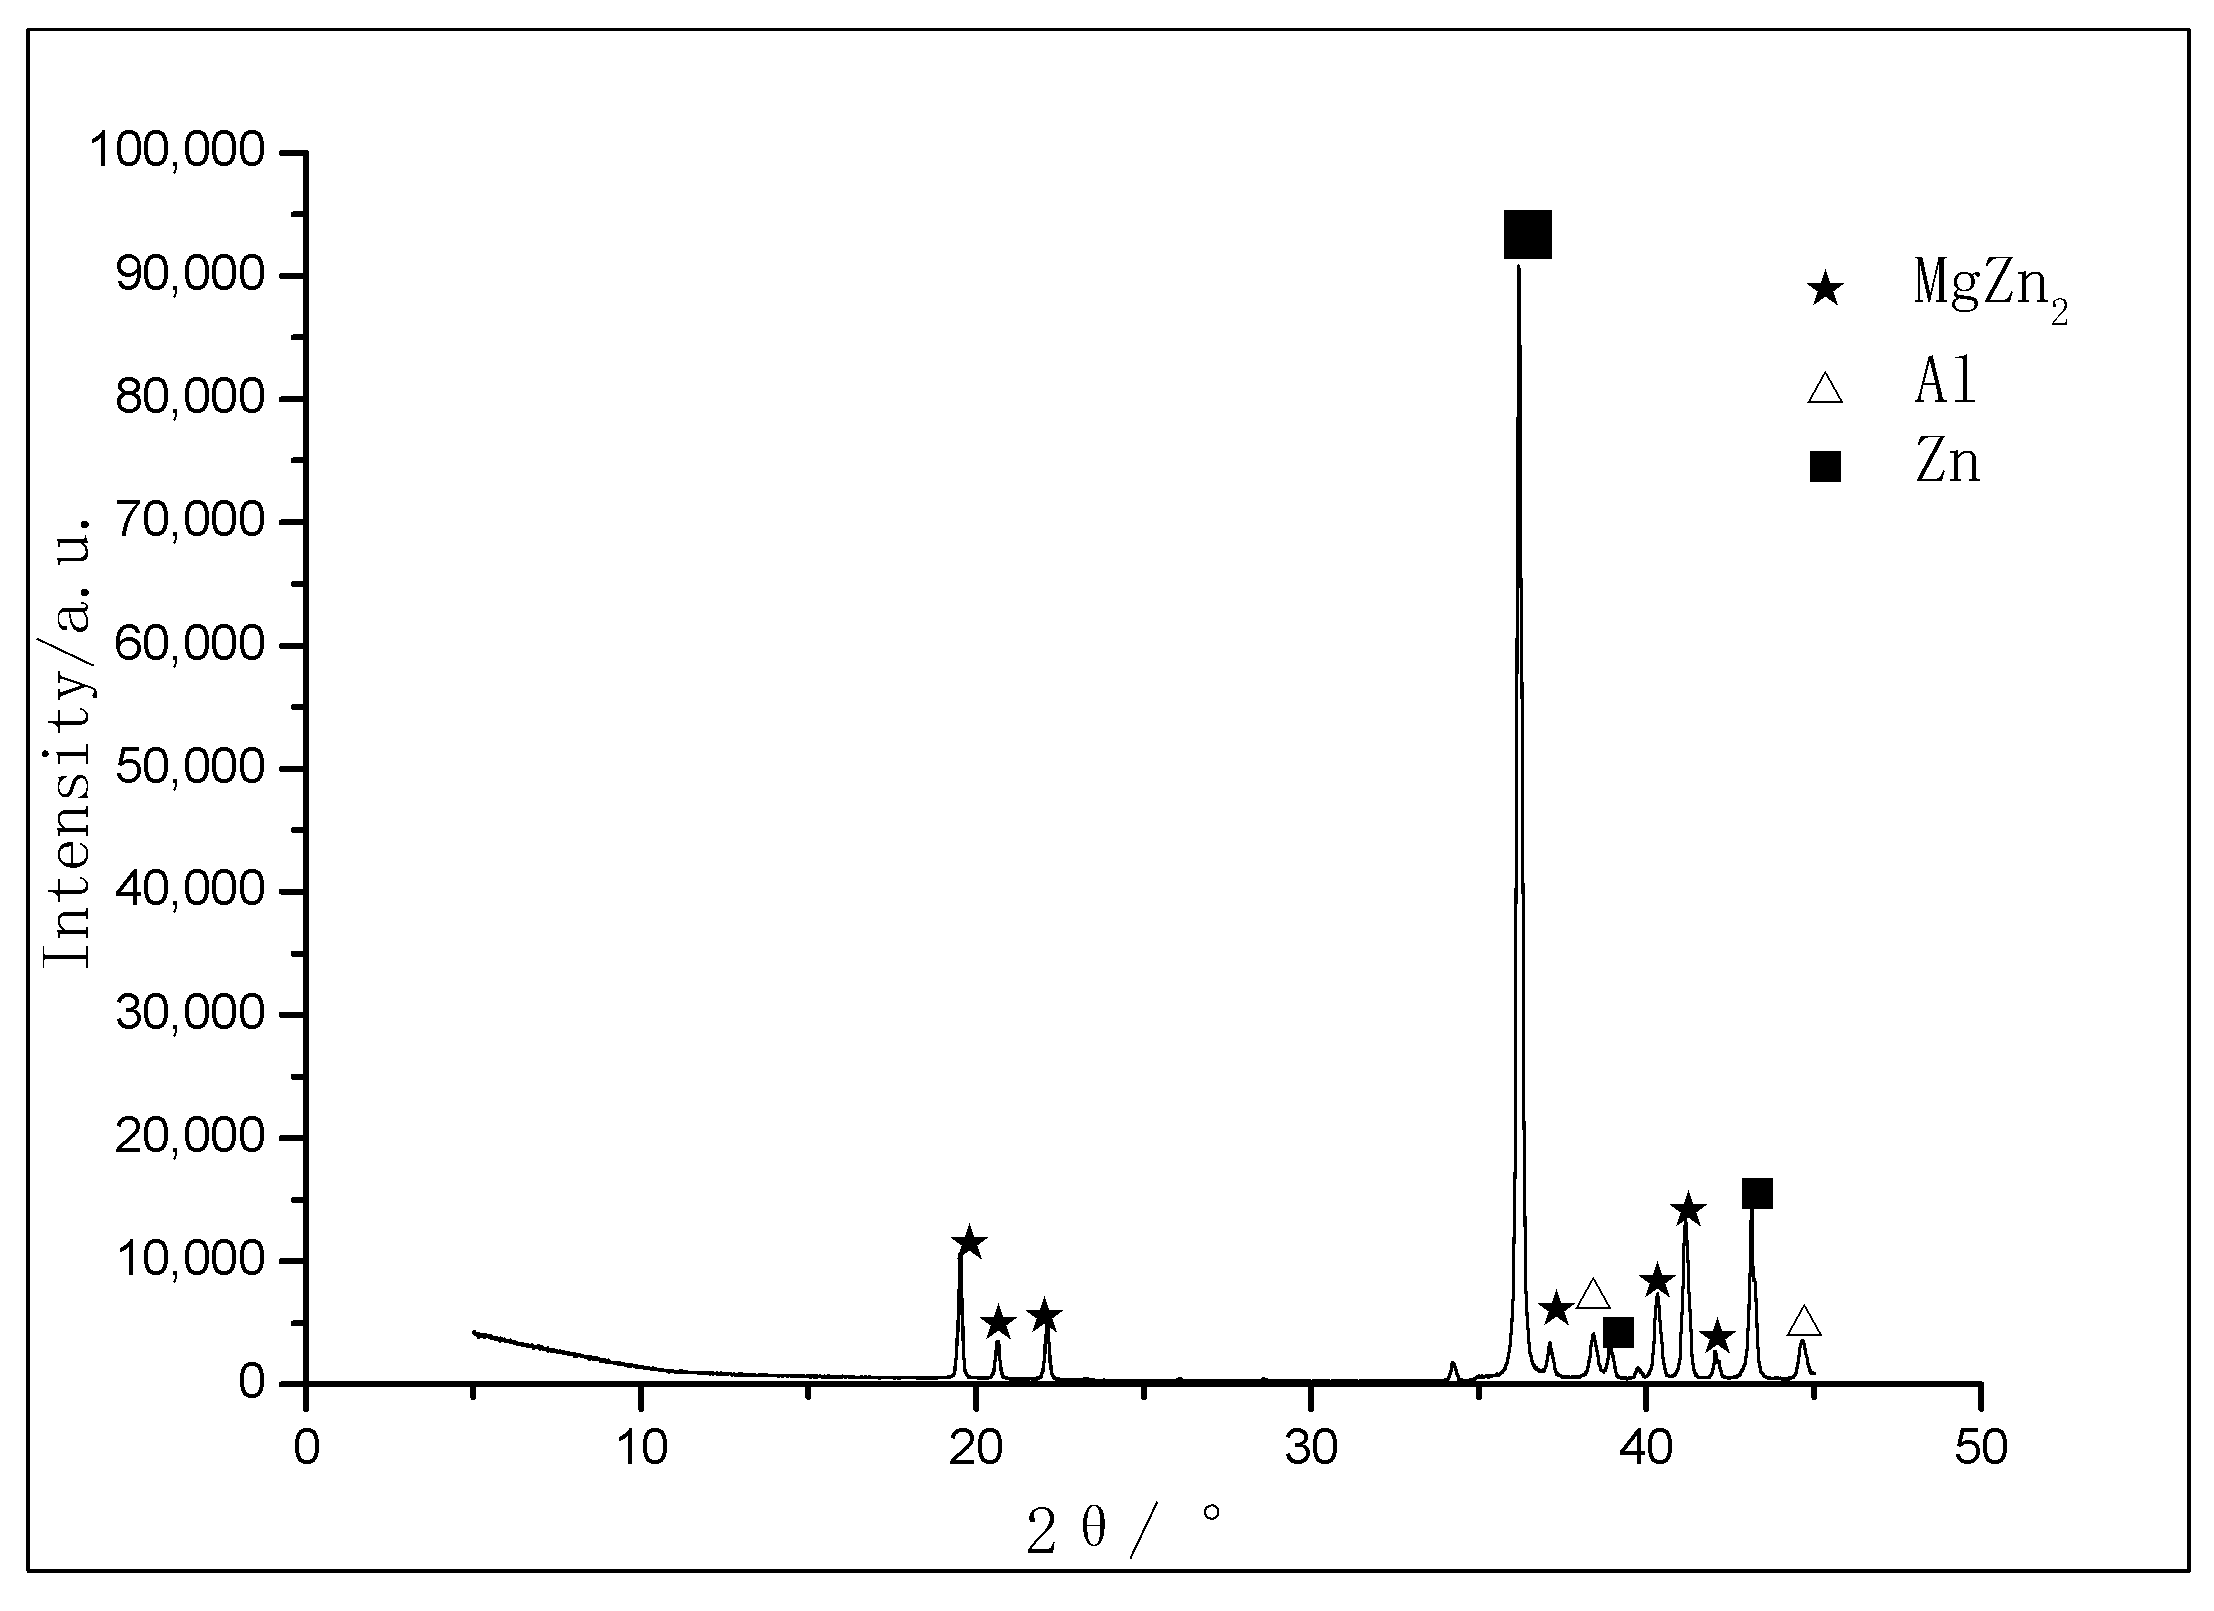
- In the laboratory, 75%Zn–19%Al–6%Mg coating was produced by the CGA-2010 multifunctional galvanizing process simulation equipment. The solidification structure of this alloy is the primary Al dendrite phase + MgZn2 intermetallic compound + Zn-rich phase. There is no ternary eutectic structure in the coating microstructure. The Al dendrites grew on the surface of the coating, without the presence of Al dendrites on the cross-section.
- The phase diagram calculation results show that the solidification sequence of 75%Zn–19%Al–6%Mg is L→L + Al→L + Al + MgZn2→Al + MgZn2 + Zn. Adding different contents of Al and Mg elements to the Zn-based plating solution changes the melting point of the solution. The element Al contributes little to the melting point of the solution, but with the increase in Mg concentration, the melting point of the solution rises. As the Mg content increases from 0% to 15%, the melting point of the plating solution increases by 48 °C.
Author Contributions
Funding
Institutional Review Board Statement
Informed Consent Statement
Data Availability Statement
Conflicts of Interest
References
- Gu, T.; Liu, Y.; Peng, C.; Zhang, P.; Wang, Z. The inhibition effect of ultraviolet illumination on a simulated extremely cold atmospheric corrosion for zinc-aluminum-magnesium coating. J. Mater. Res. Technol. 2023, 22, 3319–3330. [Google Scholar] [CrossRef]
- Koll, T.; Ullrich, K.; Faderl, J.; Hagler, J.; Spalek, A. Properties and Potential Applications of ZnMg Alloy Coatings on steel sheet by PVD. In Proceedings of the Galvatech’ 04, 6th International Conference on Zinc and Zinc Alloy Coated Steel, Chicago, IL, USA, 4–7 April 2004. [Google Scholar]
- Thierry, D.; Prosek, T.; Le Bozec, N.; Diller, E. Corrosion protection and corrosion mechanisms of continuous galvanised steel sheet with focus on new coatings alloys. In Proceedings of the Galvatech’ 11, 8th International Conference on Zinc and Zinc Alloy Coated Steel, Genoa, Italy, 21–25 June 2011. [Google Scholar]
- Yu, Z.; Hu, J.; Meng, H. A Review of Recent Developments in Coating Systems for Hot-Dip Galvanized Steel. Front. Mater. 2020, 7, 74. [Google Scholar] [CrossRef]
- Koch, G.H.; Brongers, M.P.; Thompson, N.G.; Virmani, Y.P.; Payer, J.H. Corrosion Cost and Preventive Strategies in the United States; Federal Highway Administration: Washington, DC, USA, 2002. [Google Scholar]
- LeBozec, N.; Thierry, D.; Persson, D.; Stoulil, J. Atmospheric Corrosion of Zinc-Aluminum Alloyed Coated Steel in Depleted Carbon Dioxide Environments. J. Electrochem. Soc. 2018, 165, C343. [Google Scholar] [CrossRef]
- Thierry, D.; Le Bozec, N.; Persson, D. Corrosion of Hot-Dip-Galvanized Steel and Zinc Alloy-Coated Steel in Ammonia and Ammonium Chloride. Mater. Corros. 2020, 71, 1118–1124. [Google Scholar] [CrossRef]
- Available online: https://computherm.com/software (accessed on 21 January 2024).
- Chou, K.C.; Austin Chang, Y. A study of Ternary Geometrical Models. Ber. Bunsenges. Phys. Chem. 1989, 93, 735–741. [Google Scholar] [CrossRef]
- Muggianu, Y.M.; Gambino, M.; Bros, J.P. Enthalpies of formation of liquid alloys bismuth-gallium tin at 723k-choice of an analytical representation of integral and partial thermodynamic functions of mixing for this ternary system. Chim. Phys. 1975, 72, 83–88. [Google Scholar] [CrossRef]
- Ansara, I. Comparison of methods for thermodynamic calculation of phase diagrams. Int. Metal Rev. 1979, 24, 20–53. [Google Scholar]
- Ansara, I.; Sundman, B.; Willemin, P. Thermodynamic modeling of ordered phases in the Ni-Al system. Acta Metall. 1988, 36, 977–982. [Google Scholar] [CrossRef]
- Oates, W.A.; Wenzl, H. The bond-energy model for ordering in a phase with sites of different coordination numbers. Calphad 1992, 16, 73–78. [Google Scholar] [CrossRef]
- Chen, S.L.; Kao, C.R.; Chang, Y.A. A generalized quasi-chemical model for ordered multi-component, multi-sub-lattice inter-metallic compounds with anti-structure defects. Intermetallics 1995, 3, 233–242. [Google Scholar] [CrossRef]
- Tokuda, K.; Maki, J.; Goto, Y.; Mitsunobu, T. Coated Steel Product: United States. U.S. Patent 2019/0390303 A1, 26 December 2019. [Google Scholar]
- Saito, M.; Goto, Y.; Ishizuka, K. Plated Steel Material: European. EP Patent 4 060 075 A1, 21 September 2022. [Google Scholar]


| Name | Structure | Atomic Number | Atomic Weight/g | H298/J/mol | S298/J/K·mol |
|---|---|---|---|---|---|
| Al | Fcc | 13 | 26.982 | 4540 | 28.300 |
| Mg | Hcp | 12 | 24.305 | 4998 | 32.671 |
| Zn | Hcp | 30 | 65.390 | 5657 | 41.630 |
Disclaimer/Publisher’s Note: The statements, opinions and data contained in all publications are solely those of the individual author(s) and contributor(s) and not of MDPI and/or the editor(s). MDPI and/or the editor(s) disclaim responsibility for any injury to people or property resulting from any ideas, methods, instructions or products referred to in the content. |
© 2024 by the authors. Licensee MDPI, Basel, Switzerland. This article is an open access article distributed under the terms and conditions of the Creative Commons Attribution (CC BY) license (https://creativecommons.org/licenses/by/4.0/).
Share and Cite
Li, Z.; Li, Y.; Jiang, S.; Zhang, J.; Liu, X.; Zhang, Q.; Liu, Q. Calculation and Experimental Verification of Zn–Al–Mg Phase Diagram. Coatings 2024, 14, 468. https://doi.org/10.3390/coatings14040468
Li Z, Li Y, Jiang S, Zhang J, Liu X, Zhang Q, Liu Q. Calculation and Experimental Verification of Zn–Al–Mg Phase Diagram. Coatings. 2024; 14(4):468. https://doi.org/10.3390/coatings14040468
Chicago/Turabian StyleLi, Zhao, Yuanpeng Li, Sheming Jiang, Jie Zhang, Xin Liu, Qifu Zhang, and Qiuyuan Liu. 2024. "Calculation and Experimental Verification of Zn–Al–Mg Phase Diagram" Coatings 14, no. 4: 468. https://doi.org/10.3390/coatings14040468
APA StyleLi, Z., Li, Y., Jiang, S., Zhang, J., Liu, X., Zhang, Q., & Liu, Q. (2024). Calculation and Experimental Verification of Zn–Al–Mg Phase Diagram. Coatings, 14(4), 468. https://doi.org/10.3390/coatings14040468