Article

Approach to Heterogeneous Surface Roughness Evaluation for Surface Coating Preparation

1
Department of Production Engineering, Faculty of Technology, Tomas Bata Univerzity in Zlín, Vavrečkova 5669, 760 01 Zlín, Czech Republic
2
Department of Plastics and Rubber, Institute of Polymer Materials, Faculty of Chemical and Food Technology, Slovak University of Technology in Bratislava, Radlinského 9, 811 07 Bratislava, Slovakia
3
Institute of Production Technologies, Faculty of Materials Technology Based in Trnava, Slovak Technical University in Bratislava, Jána Bottu 8857/25, 917 24 Trnava, Slovakia
*
Author to whom correspondence should be addressed.
Coatings 2024, 14(4), 471; https://doi.org/10.3390/coatings14040471
Submission received: 20 March 2024 / Revised: 9 April 2024 / Accepted: 11 April 2024 / Published: 12 April 2024
(This article belongs to the Special Issue Trends in Coatings and Surface Technology, 2nd Edition)

Abstract

:
This paper focuses on evaluating the roughness of heterogeneous surfaces, aiming to interpret data effectively for thorough assessment. Previous research highlights the significant impact of surface roughness on final coatings. Beam-cutting machining generates surfaces with position-dependent roughness parameter changes. However, there is inconsistency in the methods for investigating roughness in such surfaces, leading to the loss of crucial information and potentially inaccurate results. This could result in flawed coating preparation and subsequent defects. This paper proposes a suitable evaluation method involving an optical 3D profilometer and a stabilizing support system for reliable measurements. It provides a detailed description of the materials and methods used. The objective is to establish a more consistent and accurate approach to assessing roughness for coating preparation. Technical applications demonstrate up-to-fivefold fluctuations in surface topography parameters, as illustrated in this manuscript. Overall, this paper seeks to address these challenges and provide a robust framework for evaluating roughness in heterogeneous surfaces, thereby enhancing surface coating preparation processes.

Graphical Abstract

1. Introduction

With the development of science and technology, more pressure has been put on the durability and resistance of materials. Therefore, coating technology has been developed. Coatings play a key role in increasing the durability of materials by providing protection against corrosion, wear, and other environmental factors, as well as improving their mechanical properties and providing insulation [1]. Therefore, in order to meet the increasing needs of the industry, it is necessary to continuously develop coating technology.
The roughness of the coating substrate plays a major role not only in the development but also in the practical application of coating technology. A rough substrate surface can lead to poor adhesion between the coating and the substrate, resulting in reduced coating durability. For example, a roughness value exceeding a certain limit may result in the cracking of the coating layer [2] or reducing its adhesion to the substrate surface [3]. In the case of coated machining tools, it may even reduce wear resistance [3]. Higher roughness may also lead to increased porosity of the coating, which may compromise its corrosion resistance and mechanical properties. In addition, surface roughness can affect the thickness and uniformity of the coating, with rougher surfaces often resulting in thicker and less uniform coatings [4]. Overall, maintaining a smooth and uniform substrate surface is critical to achieving a high-quality and durable coating, and therefore, it is very important to know its attributes.
However, problems can arise when determining roughness values. Nowadays, technologies using an energy beam method as a machining element are increasingly being used [5]. As the machining principle of these technologies differs considerably from conventional ones, a virtually new surface characteristic is created. In this paper, the resulting surface characteristic is referred to as a heterogeneous surface [6,7]. This surface is specific in the variation in the roughness parameter values depending on the measurement location. As a rule, the surface roughness increases in the direction of the depth of the cut due to the weakening of the cutting energy beam method, as it transmits its energy into the cutting process [8,9].
In scientific practice, there is a lack of consistency in the methods for investigating the roughness of heterogeneous surfaces formed in this way, and in the majority of research, the evaluation of surface roughness is limited to a single value—at best, to a few units of values [10,11,12,13,14]. Inappropriately chosen methods of statistical evaluation of the roughness of heterogeneous surfaces can cause such a distortion of data that after their subsequent processing, the results will be inaccurate or misleading, and thus, there is a risk of errors in the resulting determination of the roughness value. In other words, there is a risk of an erroneous conclusion, thus compromising the quality of the resulting coating.
Therefore, this paper focuses on finding a way to determine the roughness of a heterogeneous surface for coating purposes.
In our research, we aimed to approach the understanding of surface roughness of heterogeneous surfaces for the preparation of coatings. In confronting this issue, we have encountered a number of challenges. One of these is the complexity of evaluating the surface roughness of the beam-cut surfaces and their effect on the quality of the coatings. Our research findings suggest that commonly used surface roughness evaluation methods may fail to capture variations with depth of cut. For this reason, we have focused on mathematical methods of data evaluation, such as linear and non-linear regressions, which are necessary to provide a comprehensive understanding of the evolution of surface roughness. The results of the non-linear regression show more accurate modeling of the data than linear approaches, suggesting that the exponential model is more appropriate to describe these data. In addition, we have identified a region of data noise that is not significant for the purpose of coating preparation. We emphasize that the proposed method is more suitable for scientific applications where understanding the overall nature of the surface is more important. However, in practice, there is still a need for a relatively cheap and fast way to check the surface quality. Therefore, it is necessary to find a compromise between sophisticated analytical methods and the practical needs of industrial applications. Sample macrophotography highlights the need to understand the surface treatment process and its influence on the final result. This highlights the need for continuous development and optimization of surface evaluation methods to meet the requirements of industrial and scientific applications. A summary of the research shows that with the increasing use of non-conventional machining technologies using the energy beam as a cutting element, the need for coatings, in general, is increasing. Surface quality plays a key role in determining the quality of coatings. This paper presents an analytical method that could improve the quality of coatings on heterogeneous surfaces in both practical and research environments.

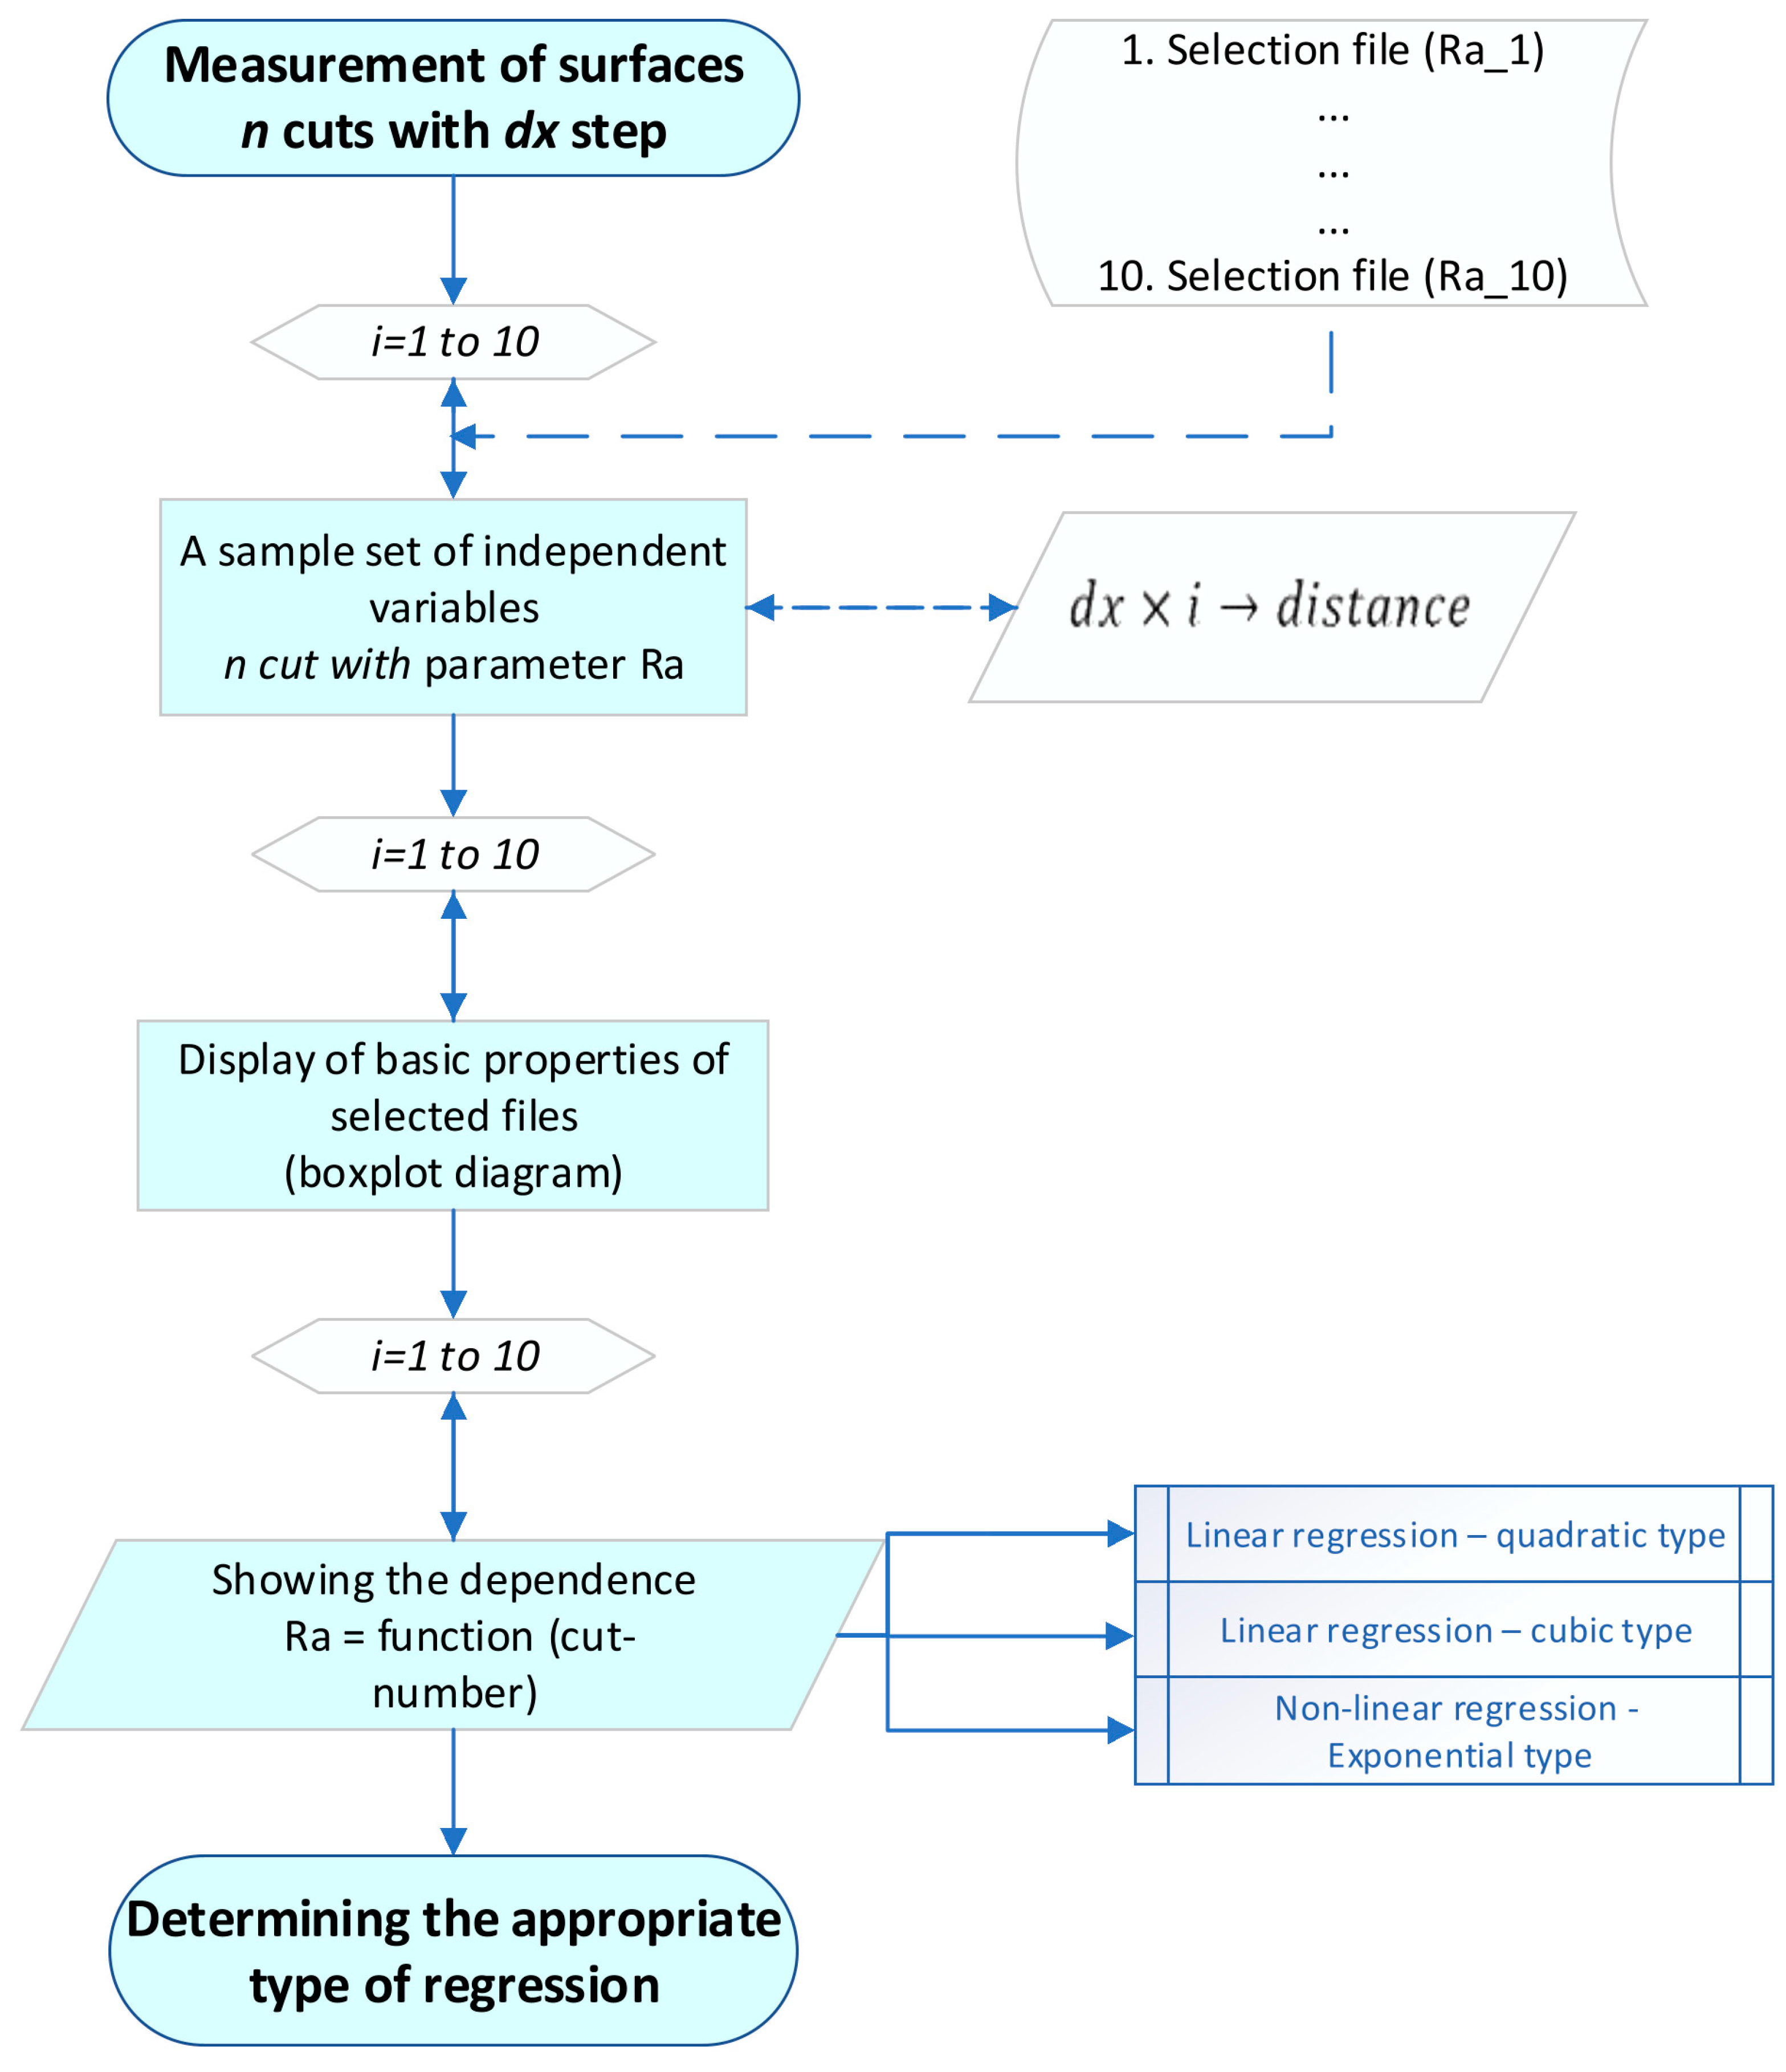
2. Materials and Methods

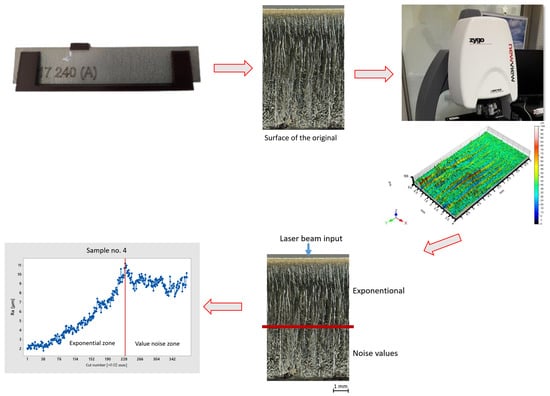
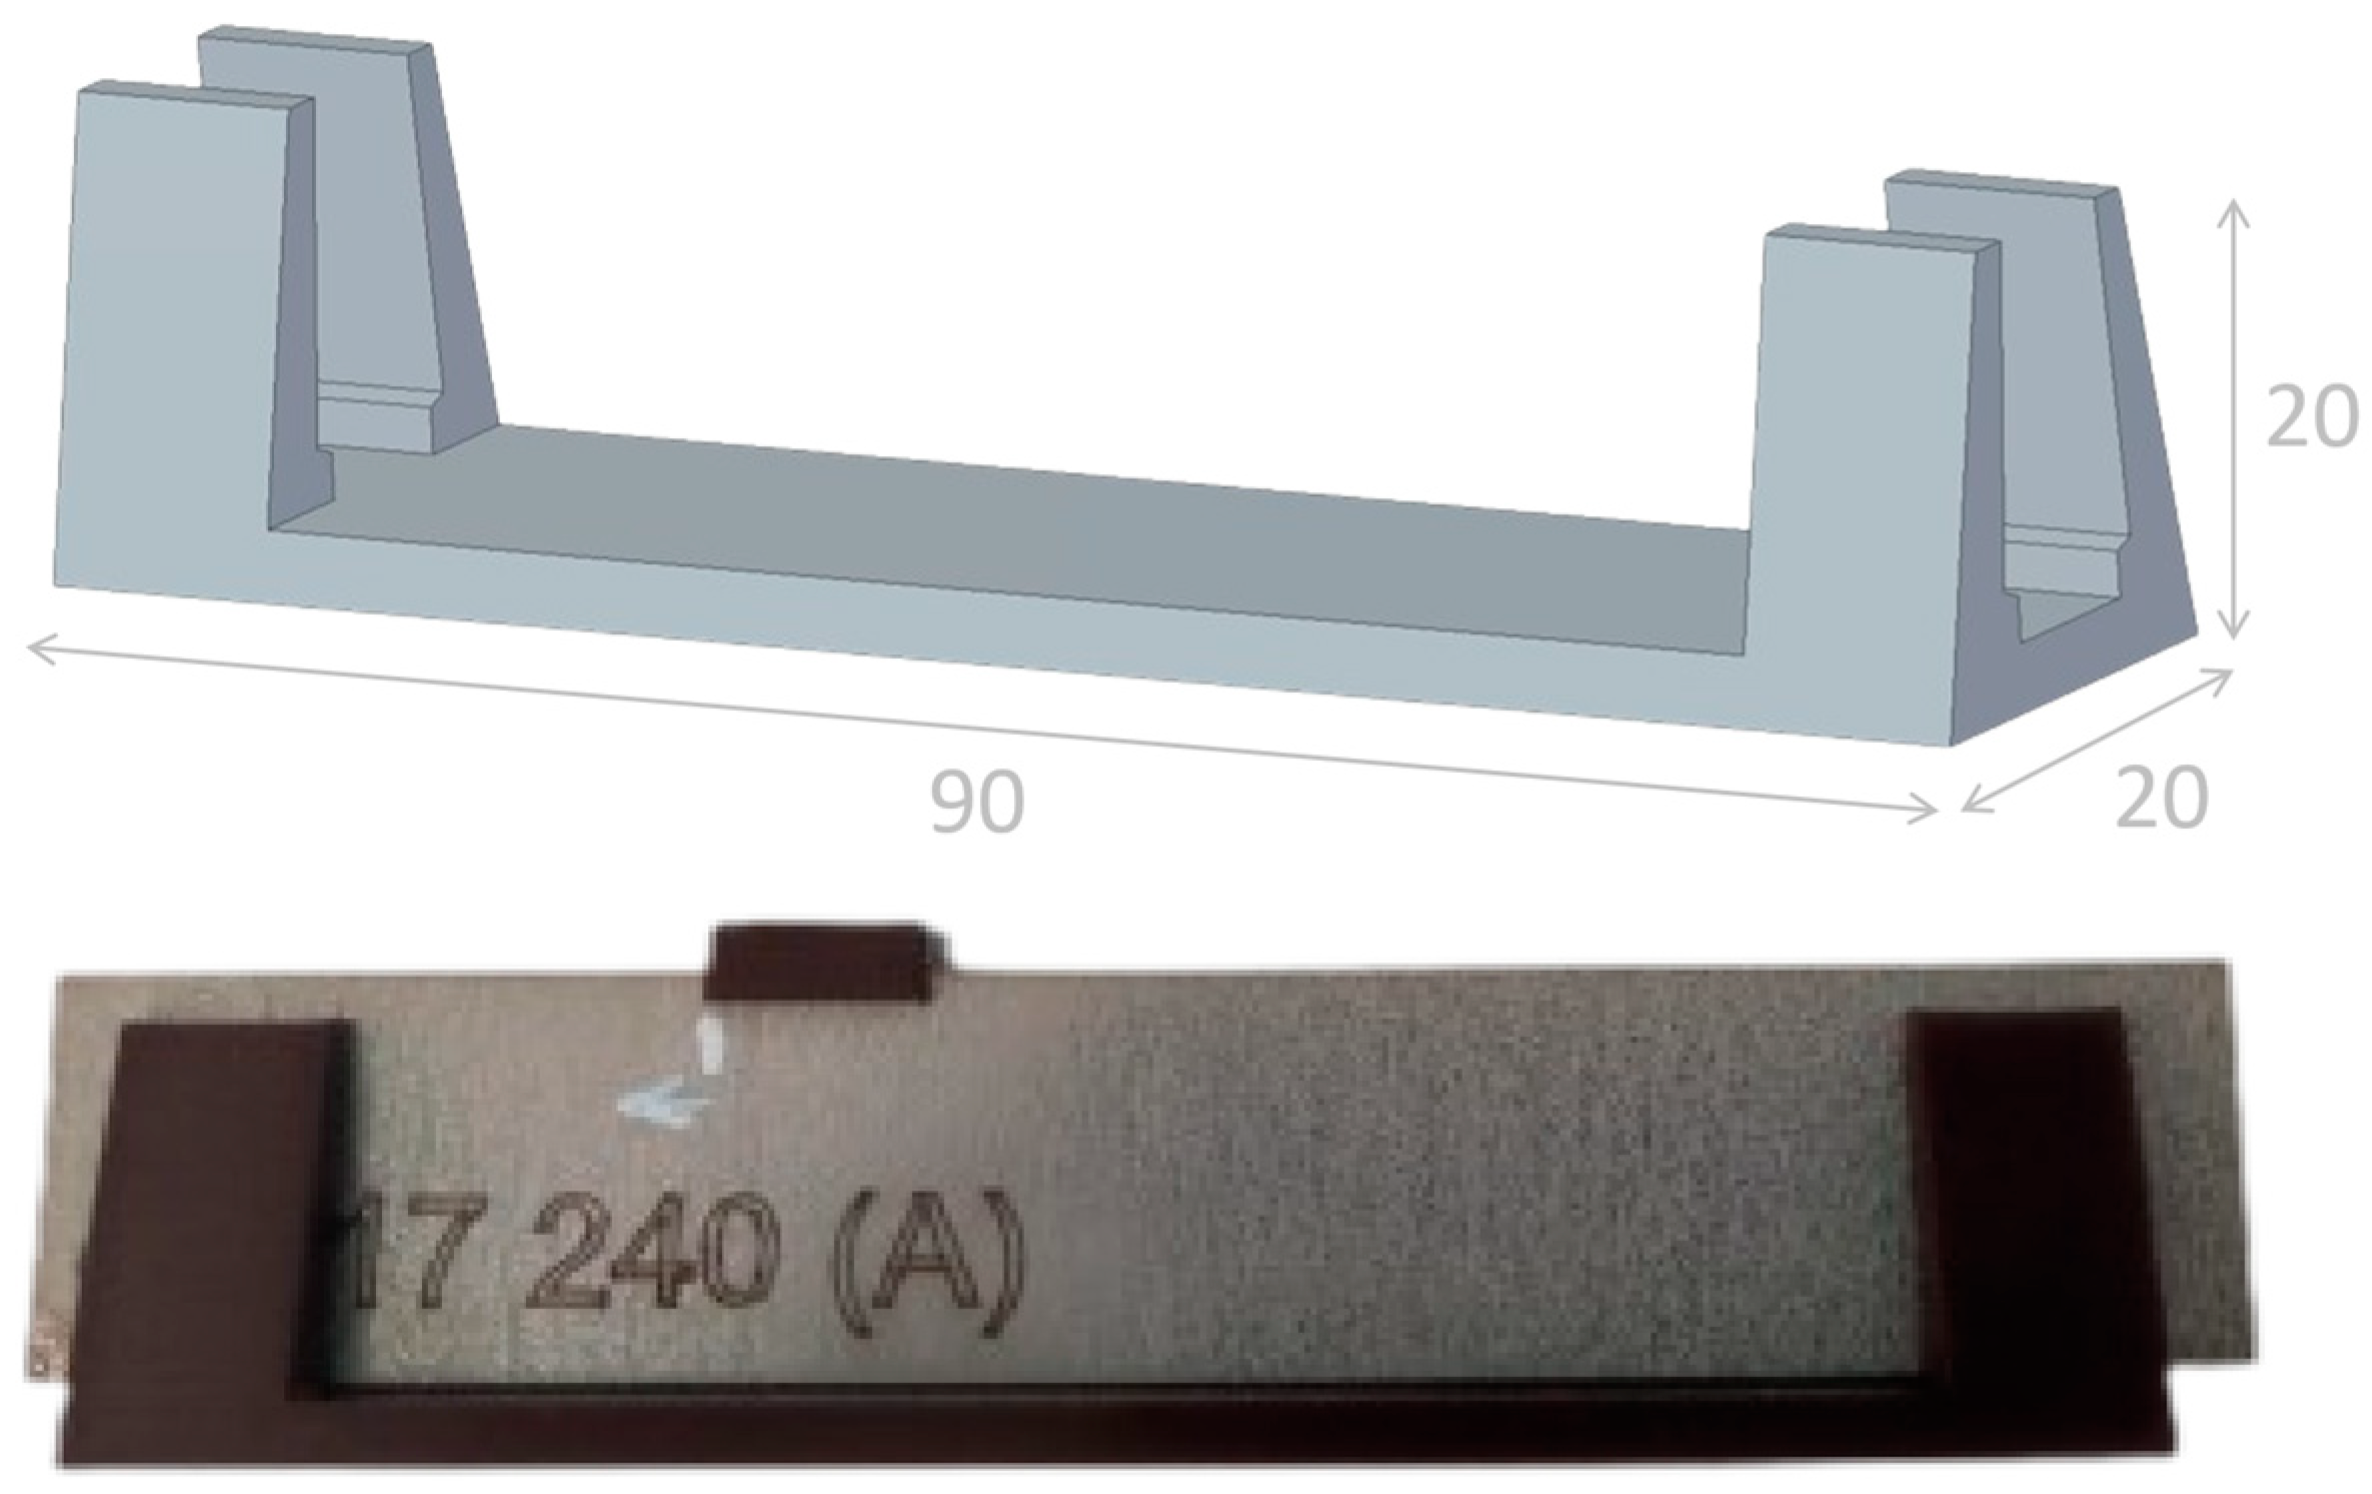
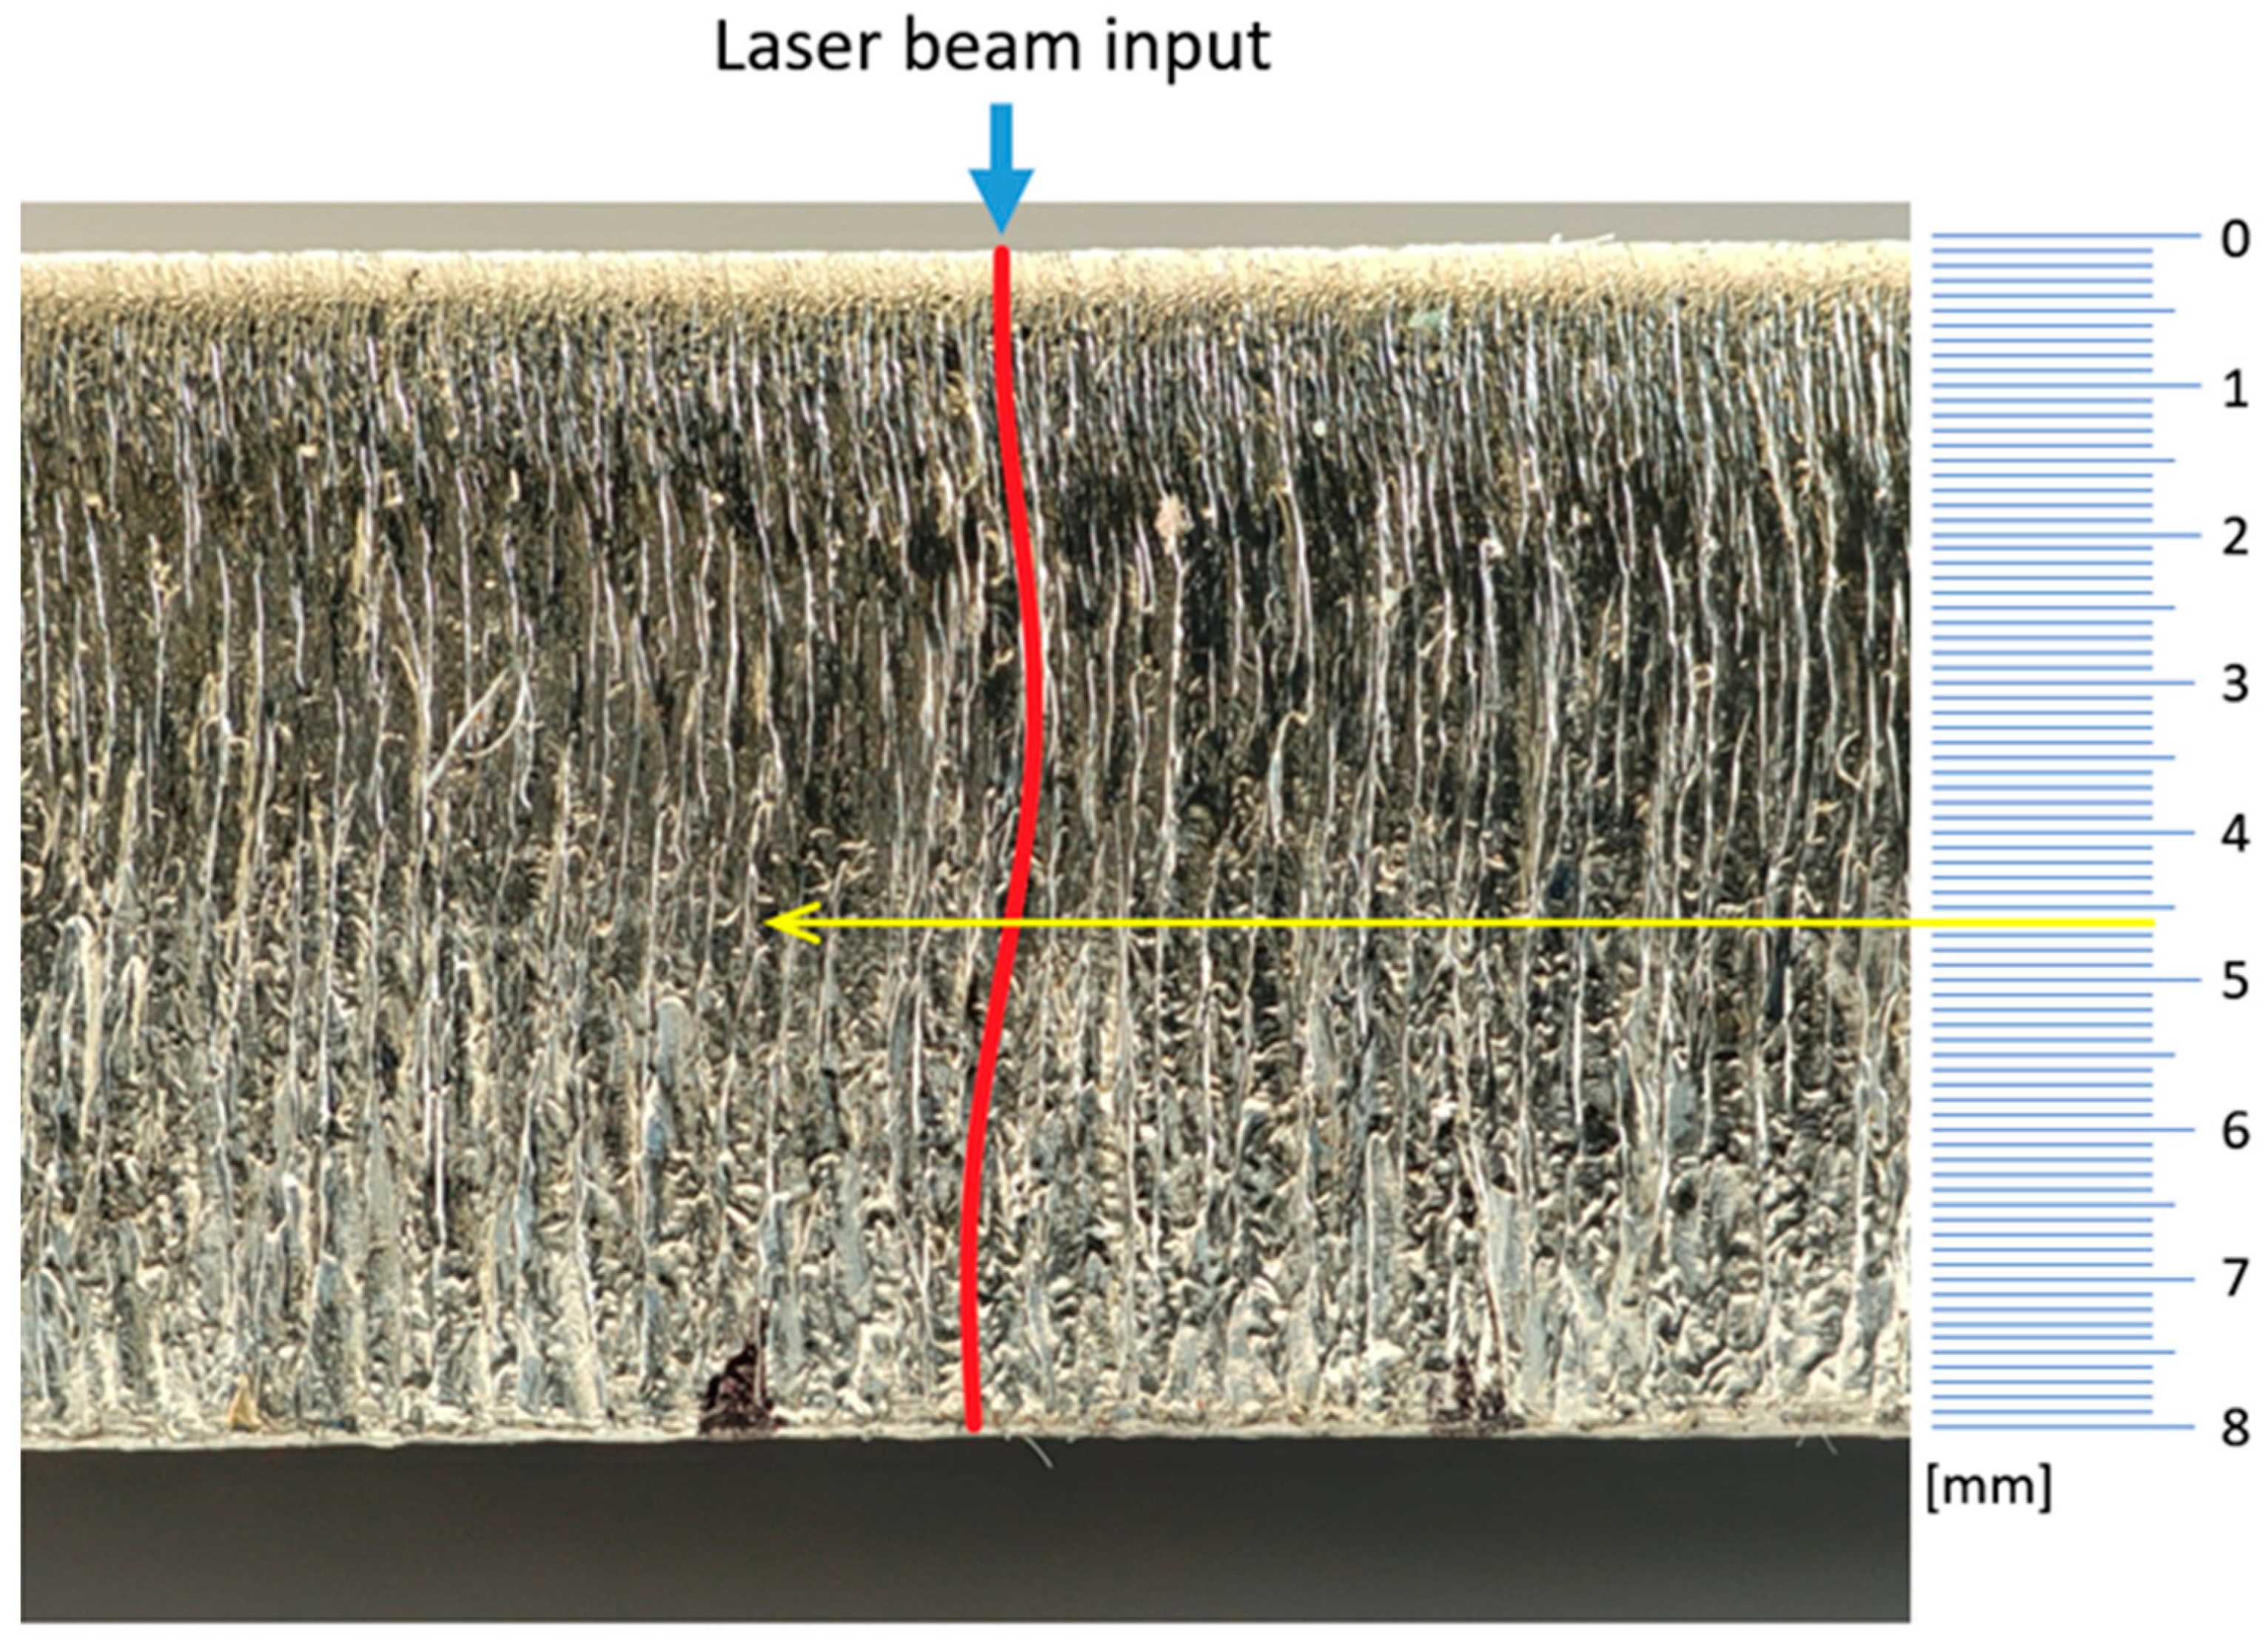
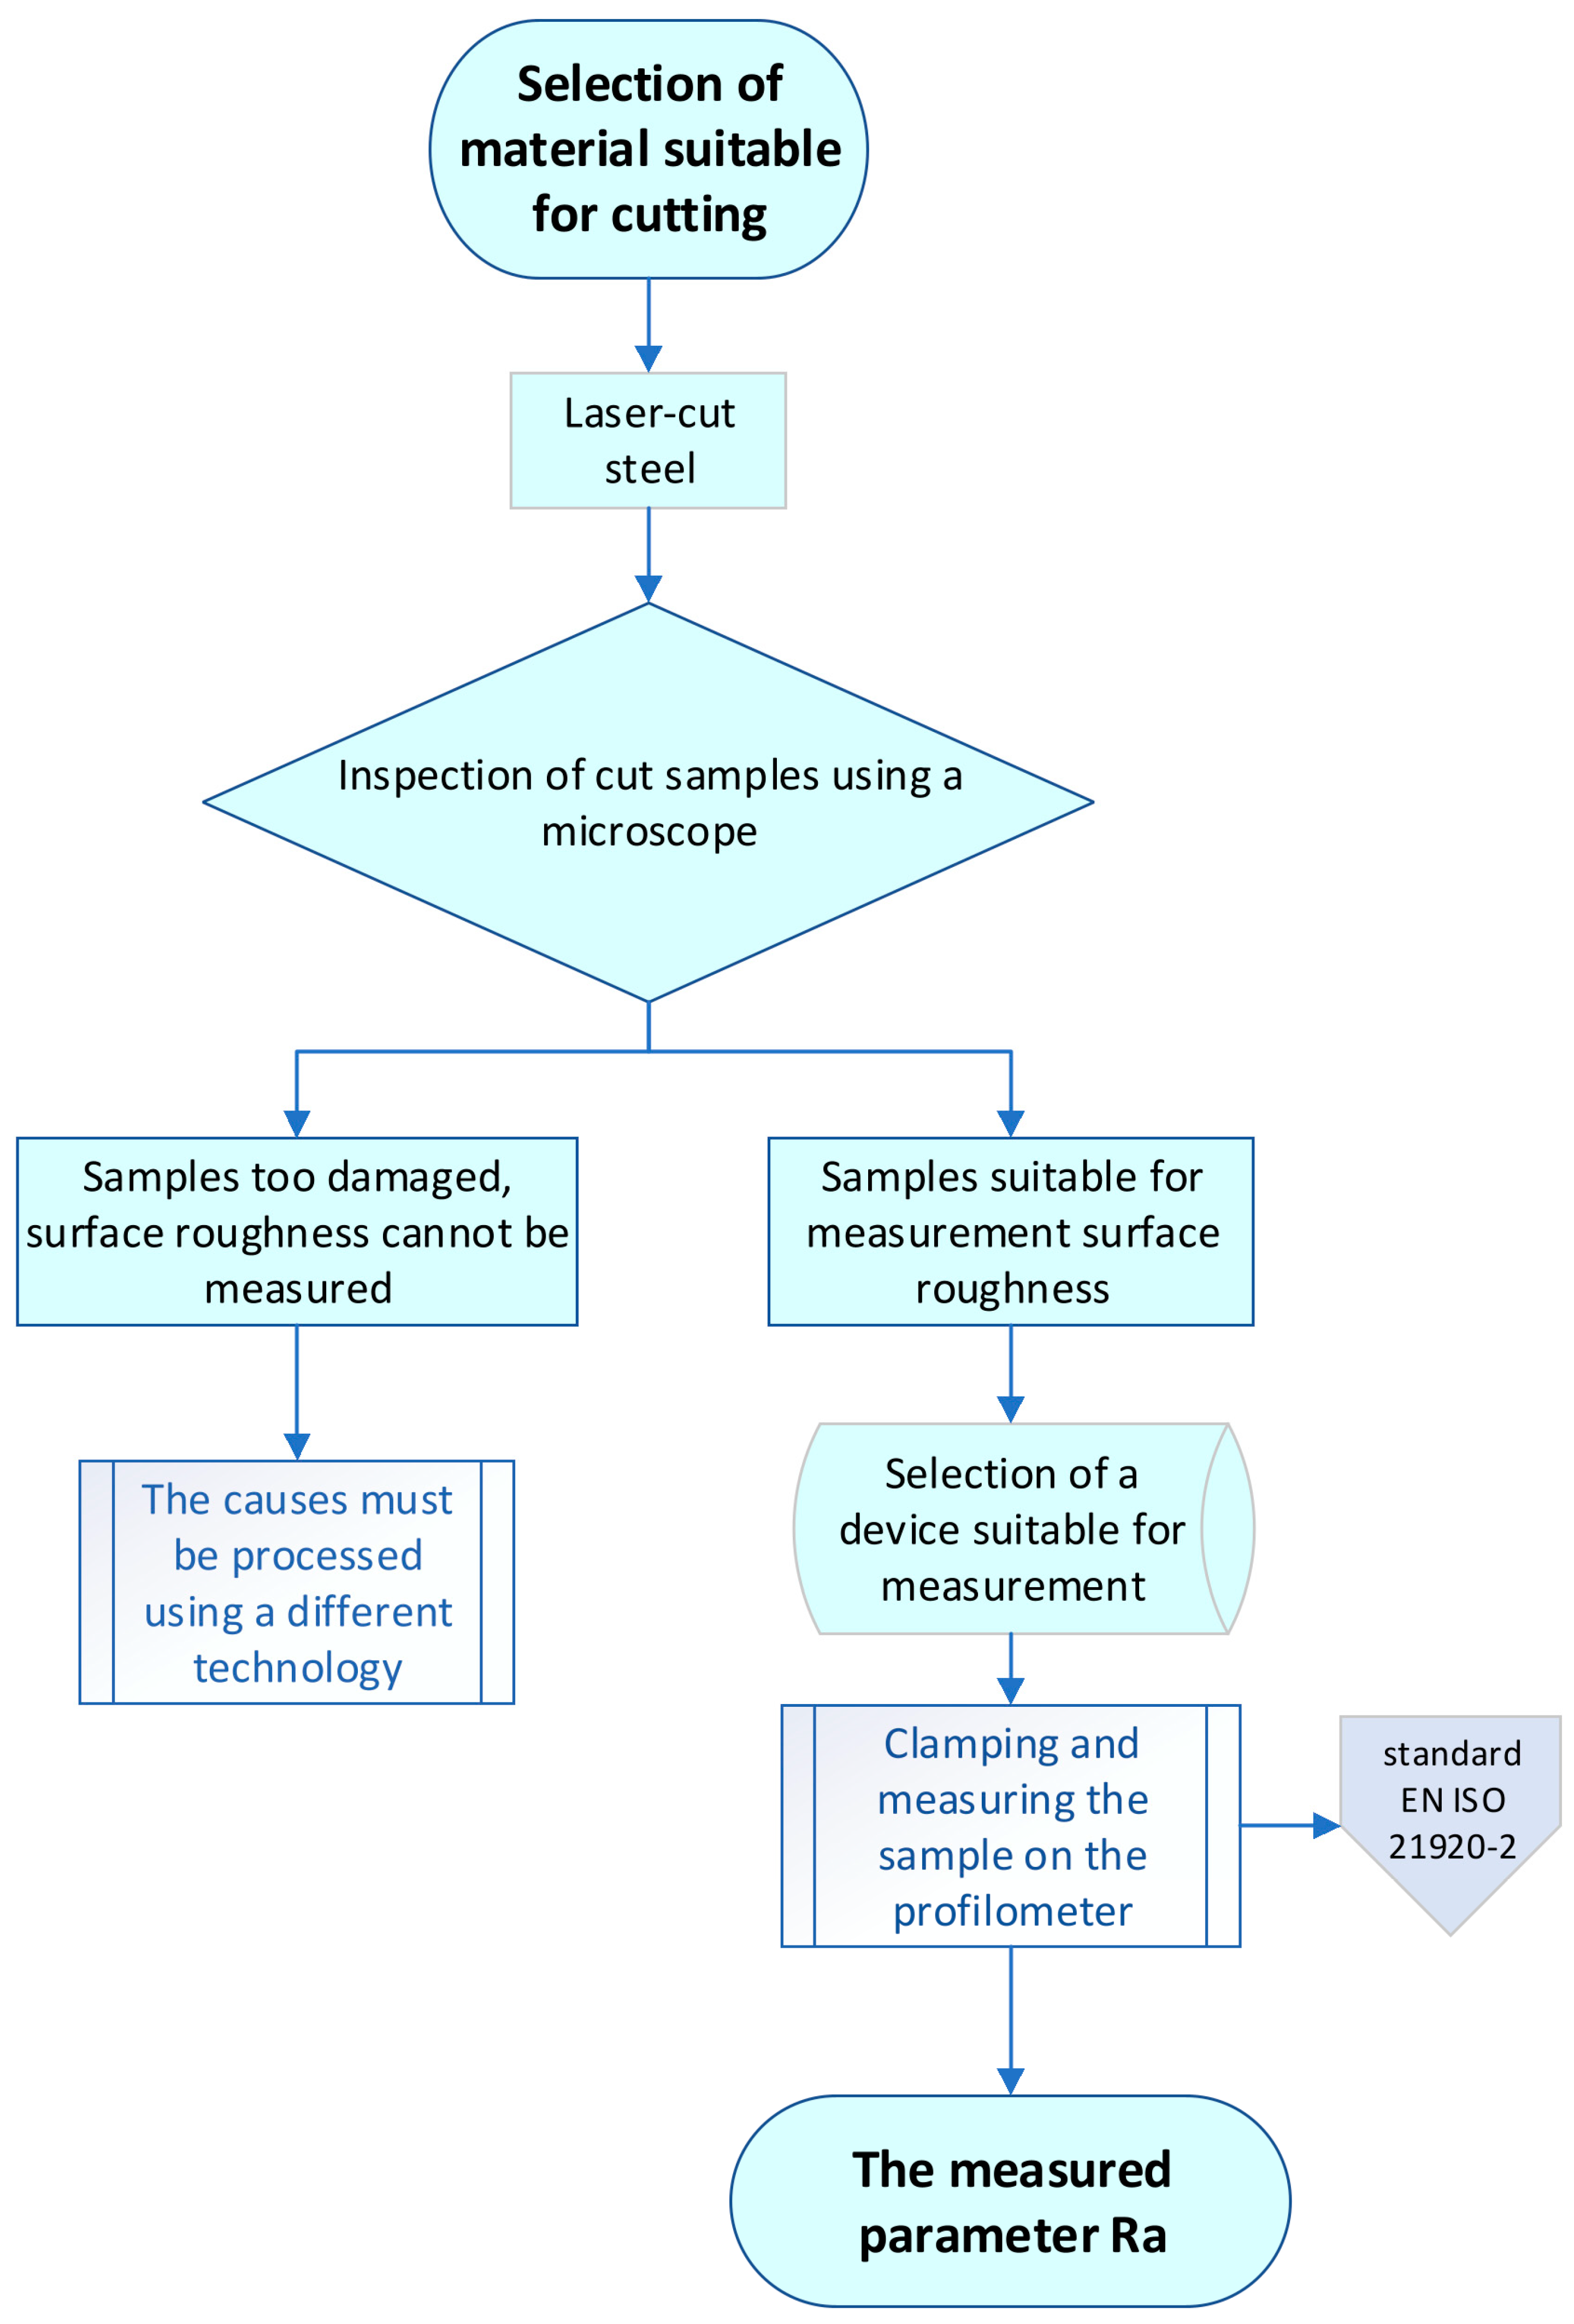
2.1. Sample Preparation for Measurement

Ten samples of laser-cut steel plates with typical heterogeneous surfaces were selected. Specifically, they were made of DIN EN 1.4301/AISI 304 stainless tool steel [15]. This type of material is often used in practice, and therefore, efforts are made in collaboration with materials engineers to try to increase its adhesion. For further research, the AISI 304 material will then undergo a blacking after laser machining [16].
The samples were measured on a Zygo NewView 8000 optical 3D profilometer (Figure 1) (ZYGO™ Middlefield, Middlefield, CT, USA). Prior to each measurement, the surface was inspected for possible impurities or inhomogeneities by an optical microscope, Leica DMI 3000 M (Leica Microsystem GmbH, Wetzlar, Germany), at 100× magnification. These might have been introduced during the manufacturing process and might have adversely affected the measurement; affected samples were excluded from measurement.
Due to the shape of the samples and the resulting instability, it was necessary to develop a stabilizing support that would ensure stability during the measurement. A model of the support was created in Catia V6 software (IBM, New York, NY, USA), optimized for material saving, and then printed on a TRILAB DeltiQ 2 3D printer (Trilab, Hradec Králové, Czech Republic). Figure 2 shows the support model with the dimensions in millimeters.
Along with the support, cover caps were made to prepare the operating field for measurements, which helped to consistently locate the measured area on the samples. The area was set up to 30 mm from the left edge of a sample. Figure 2 shows an example of the preparation of the operating field using the manufactured caps.

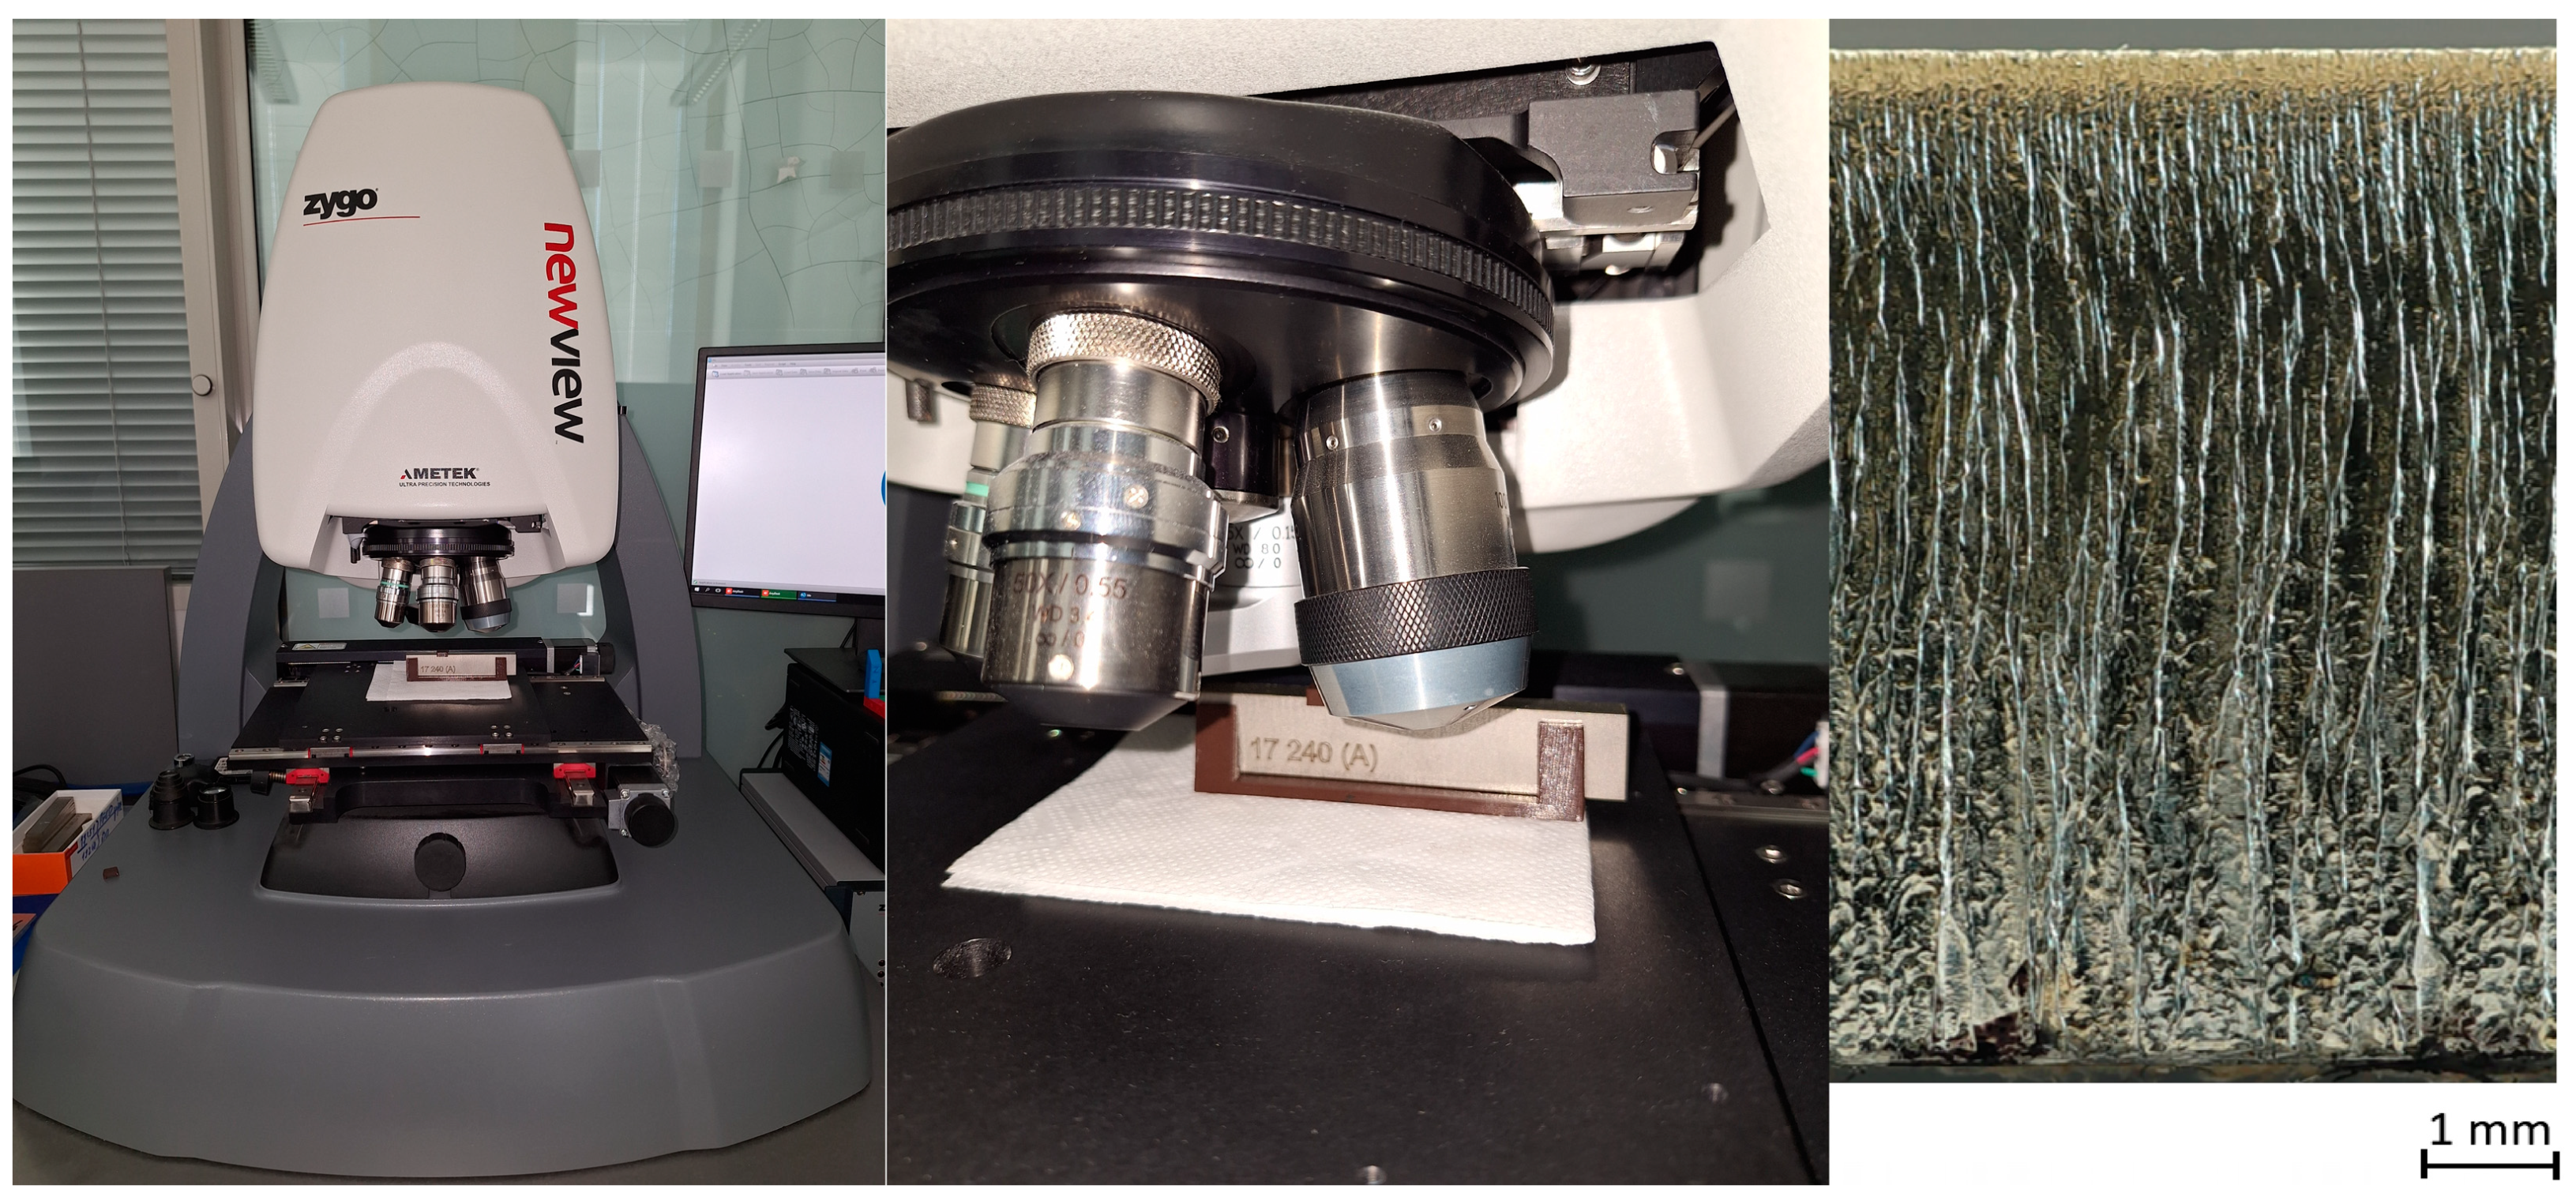
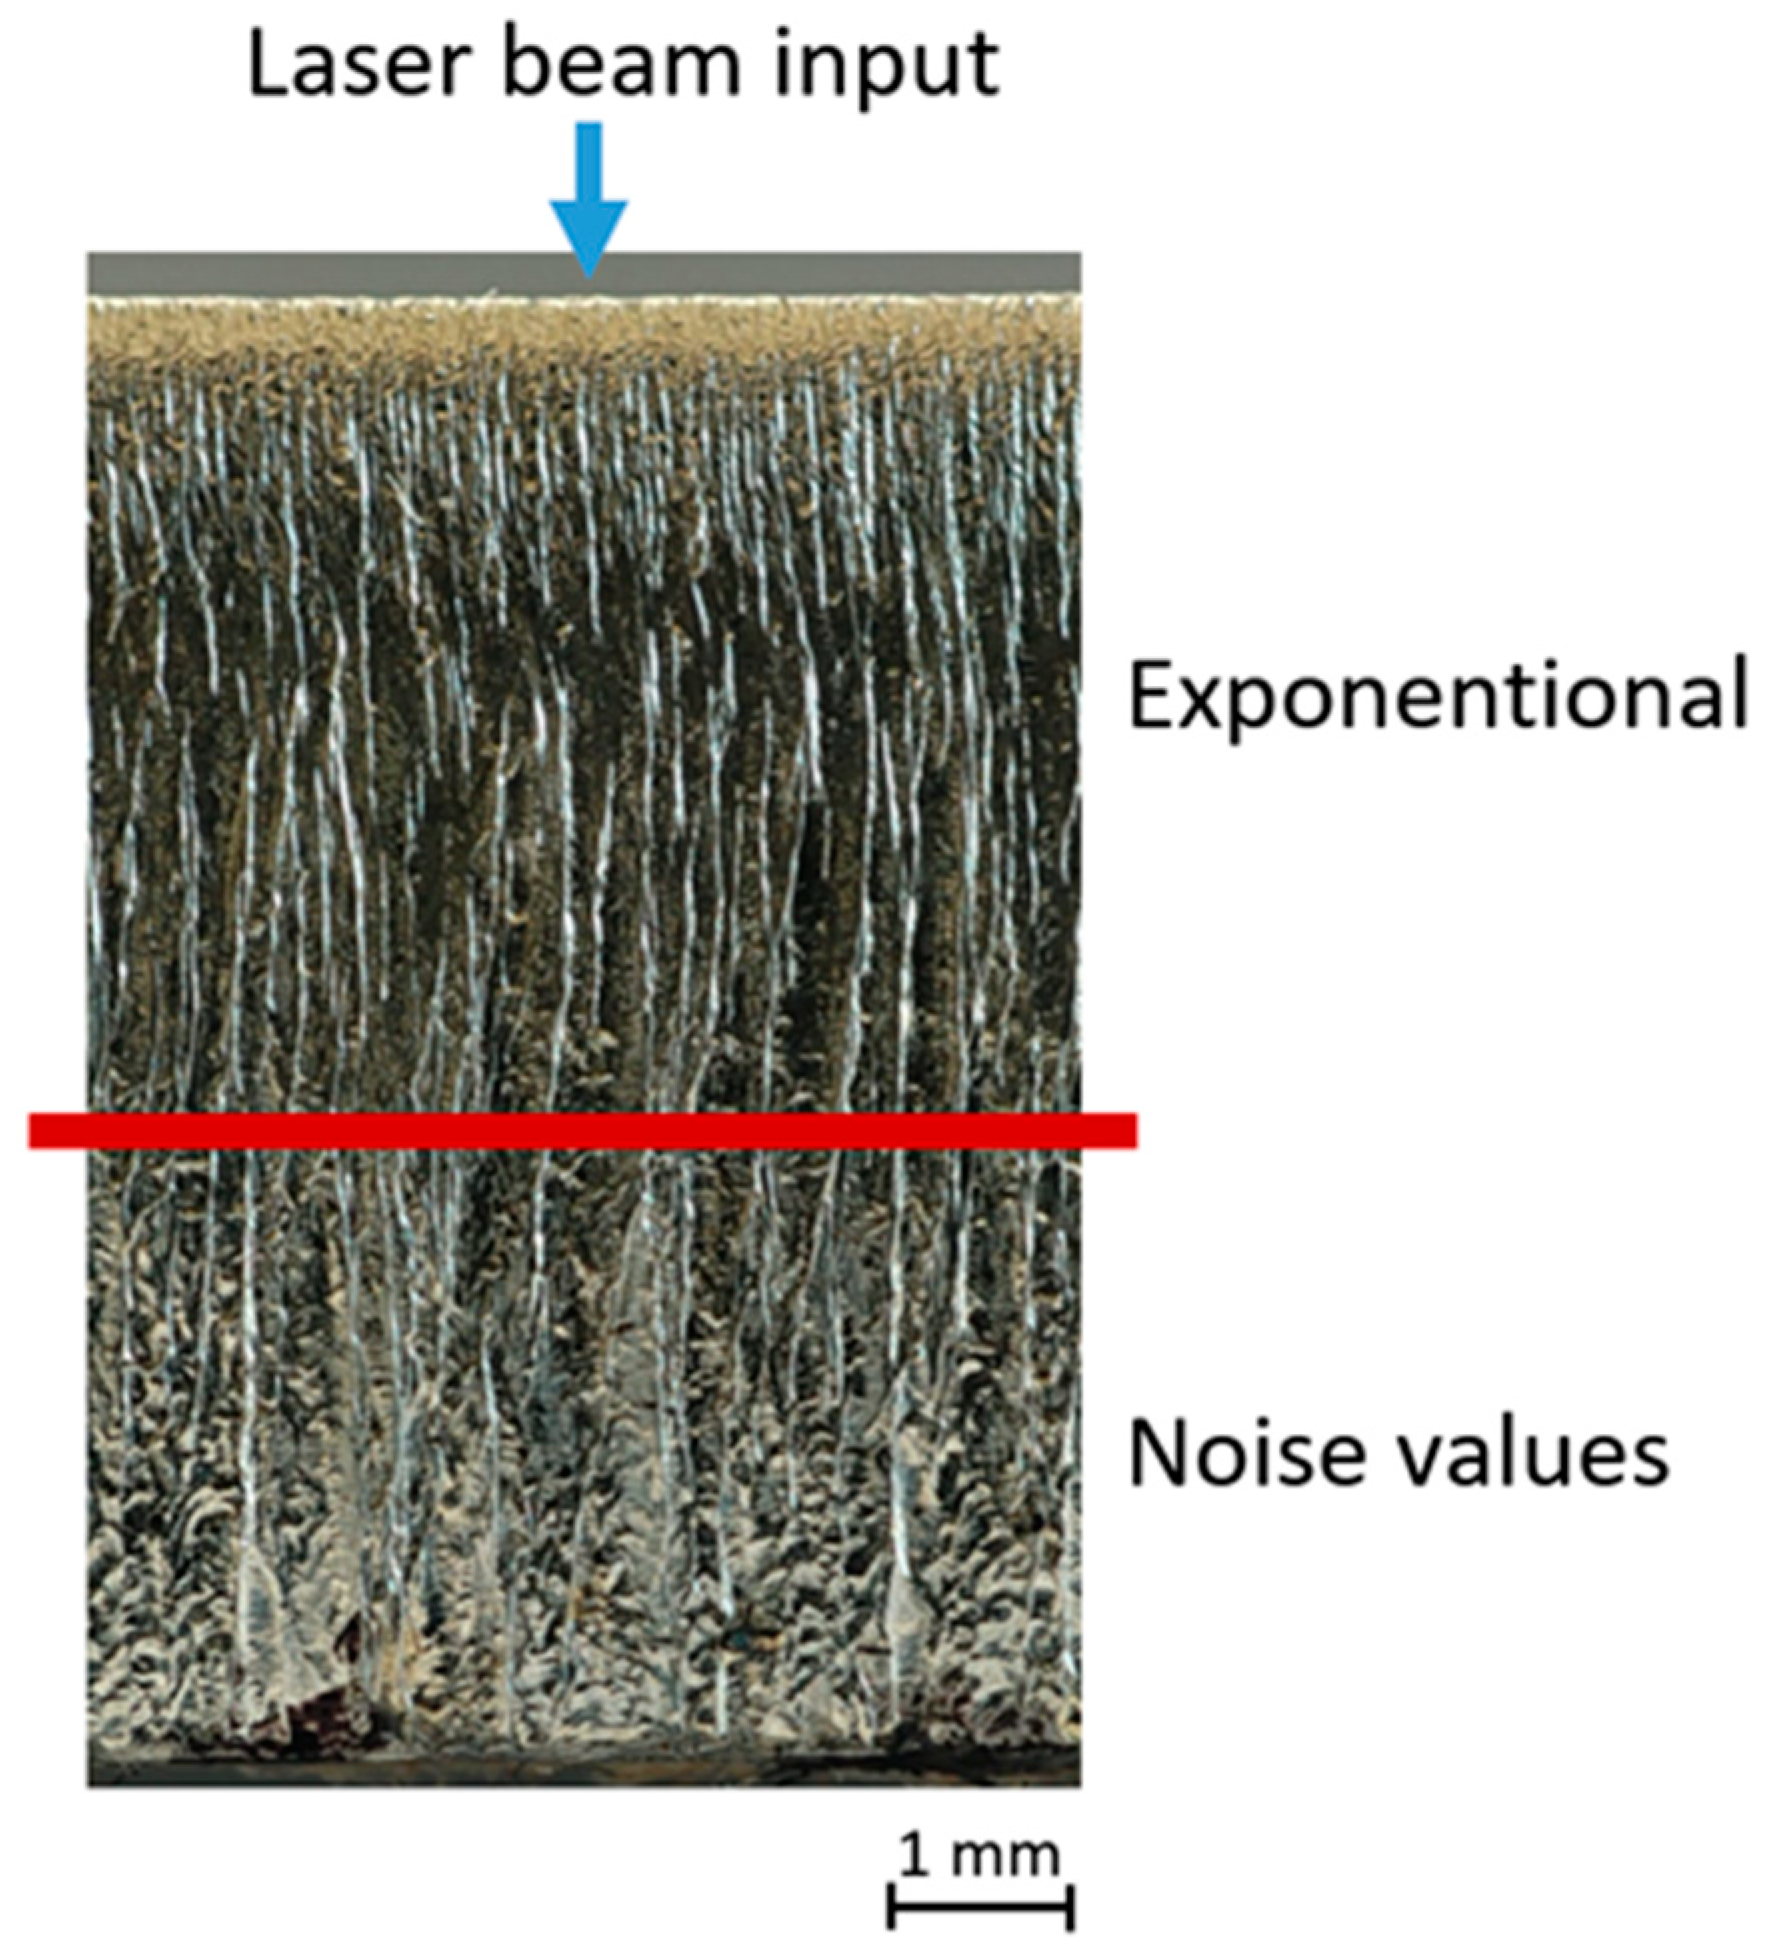
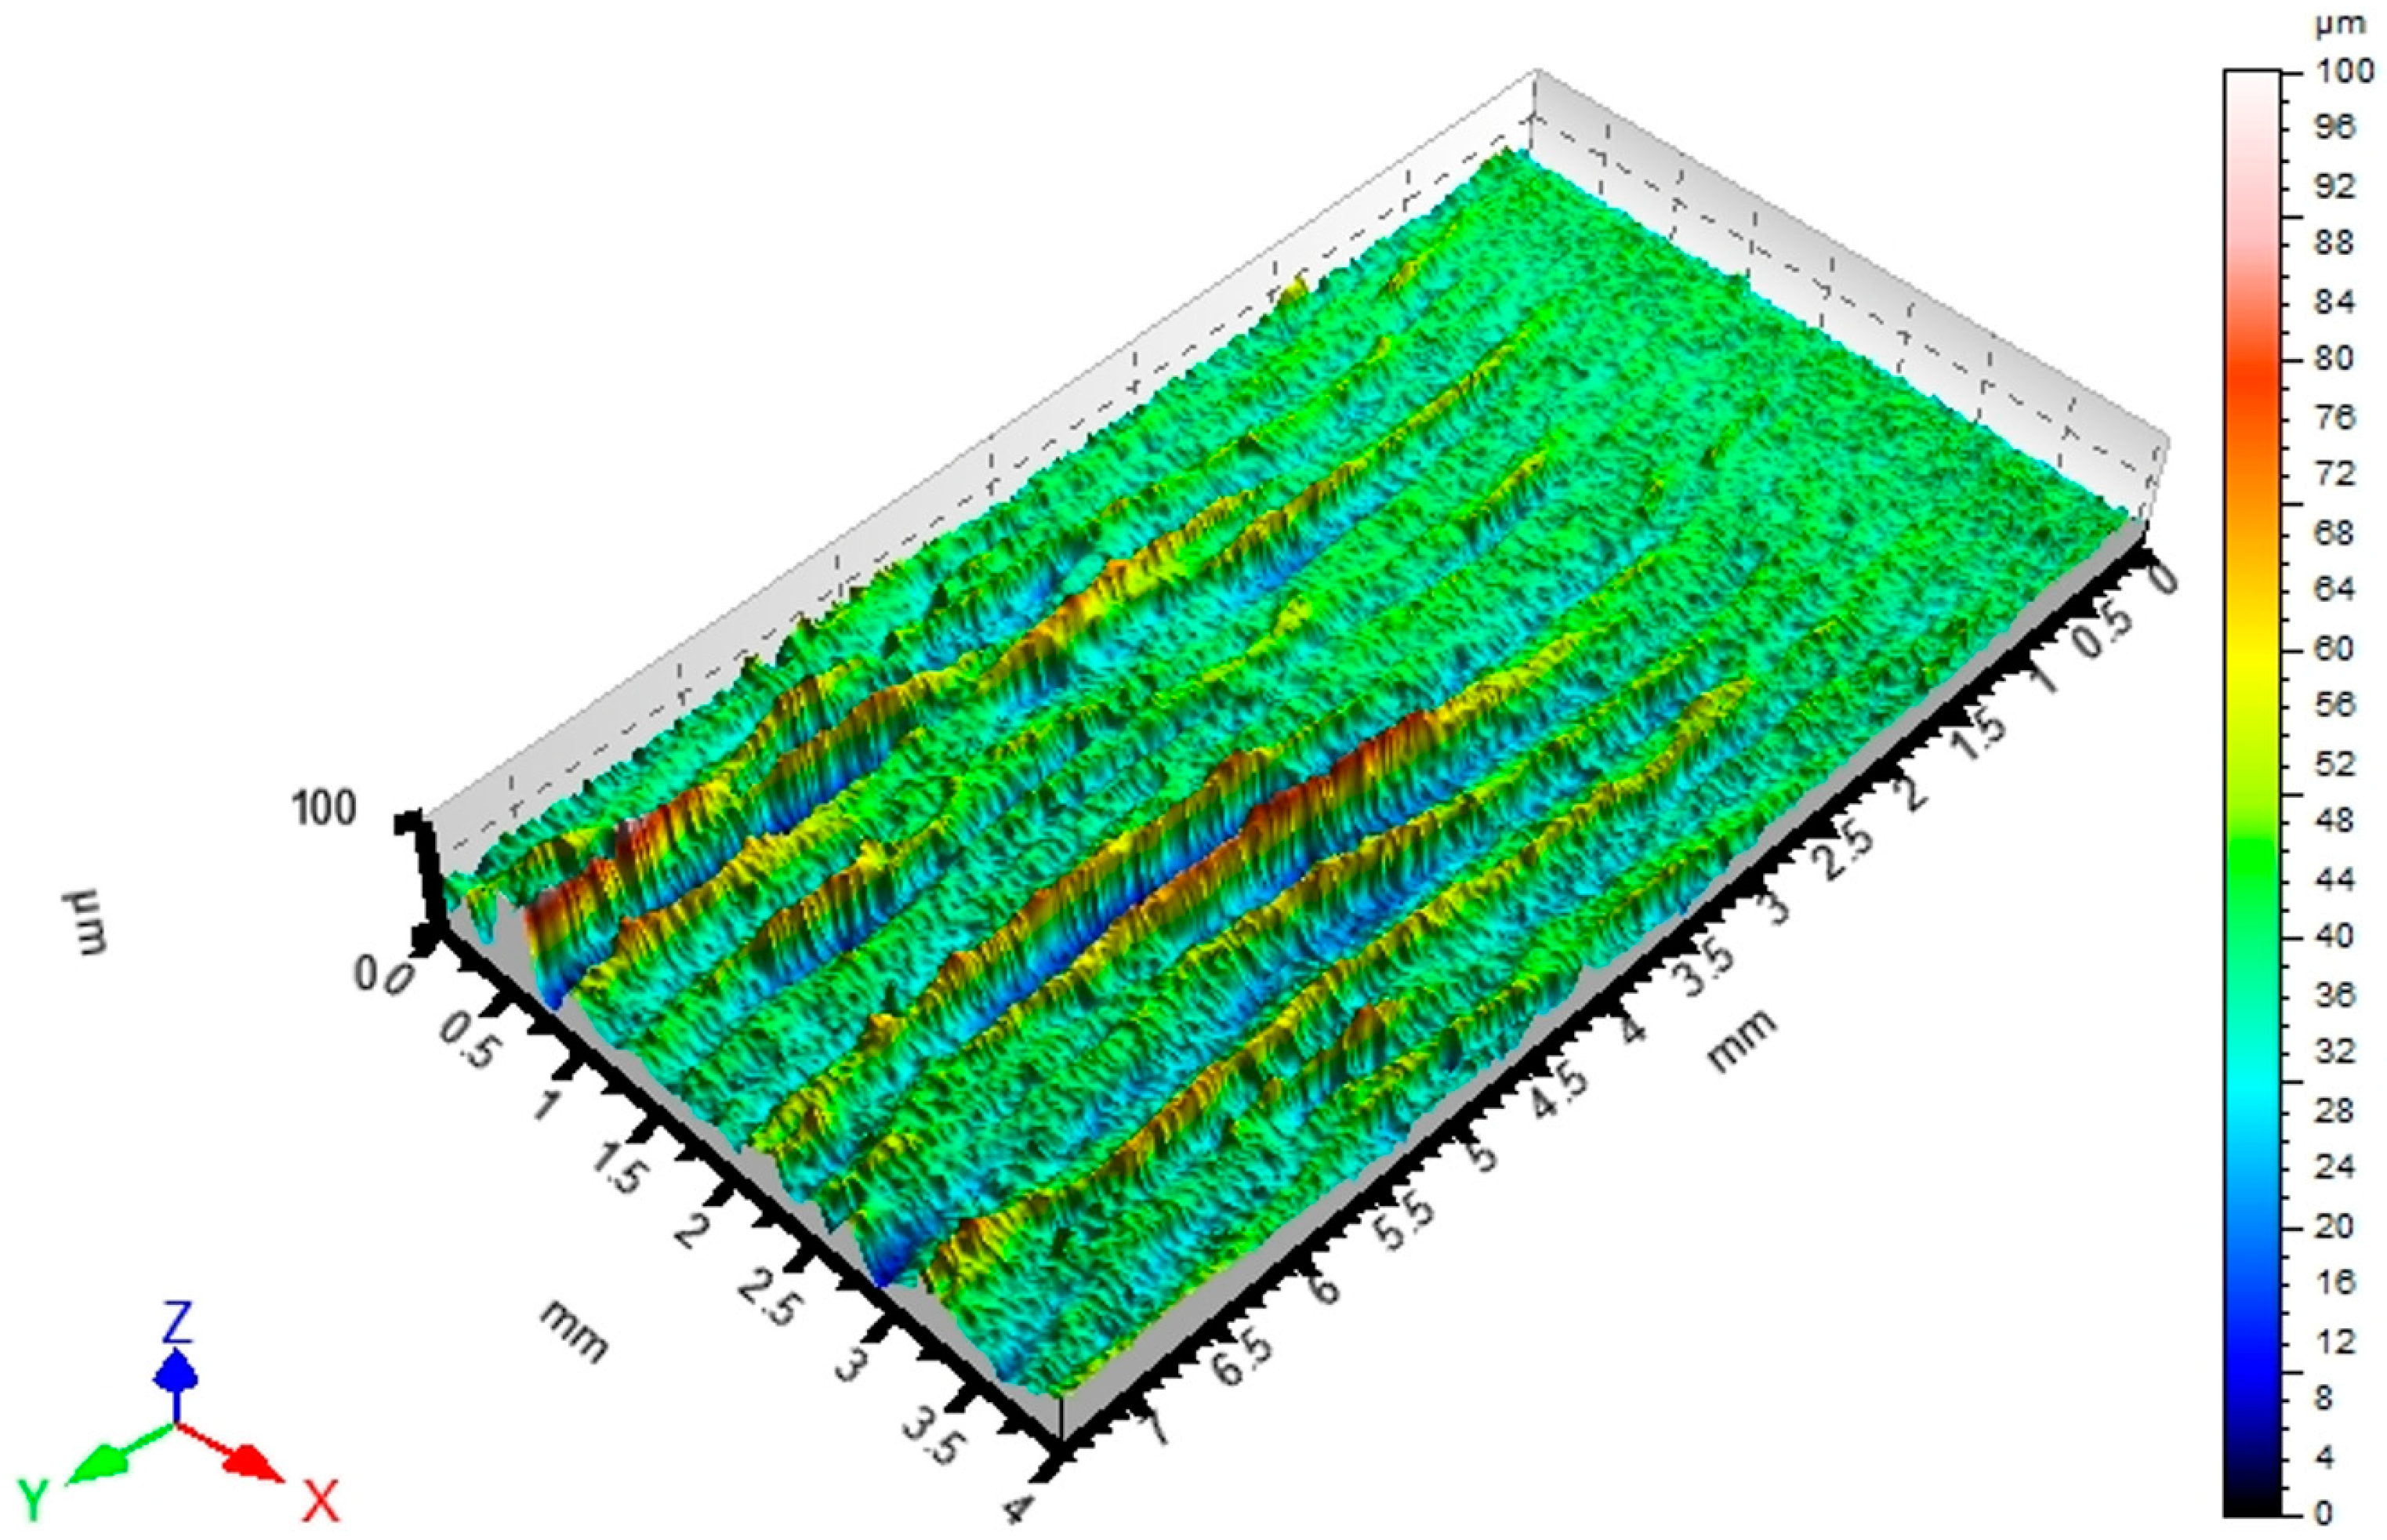
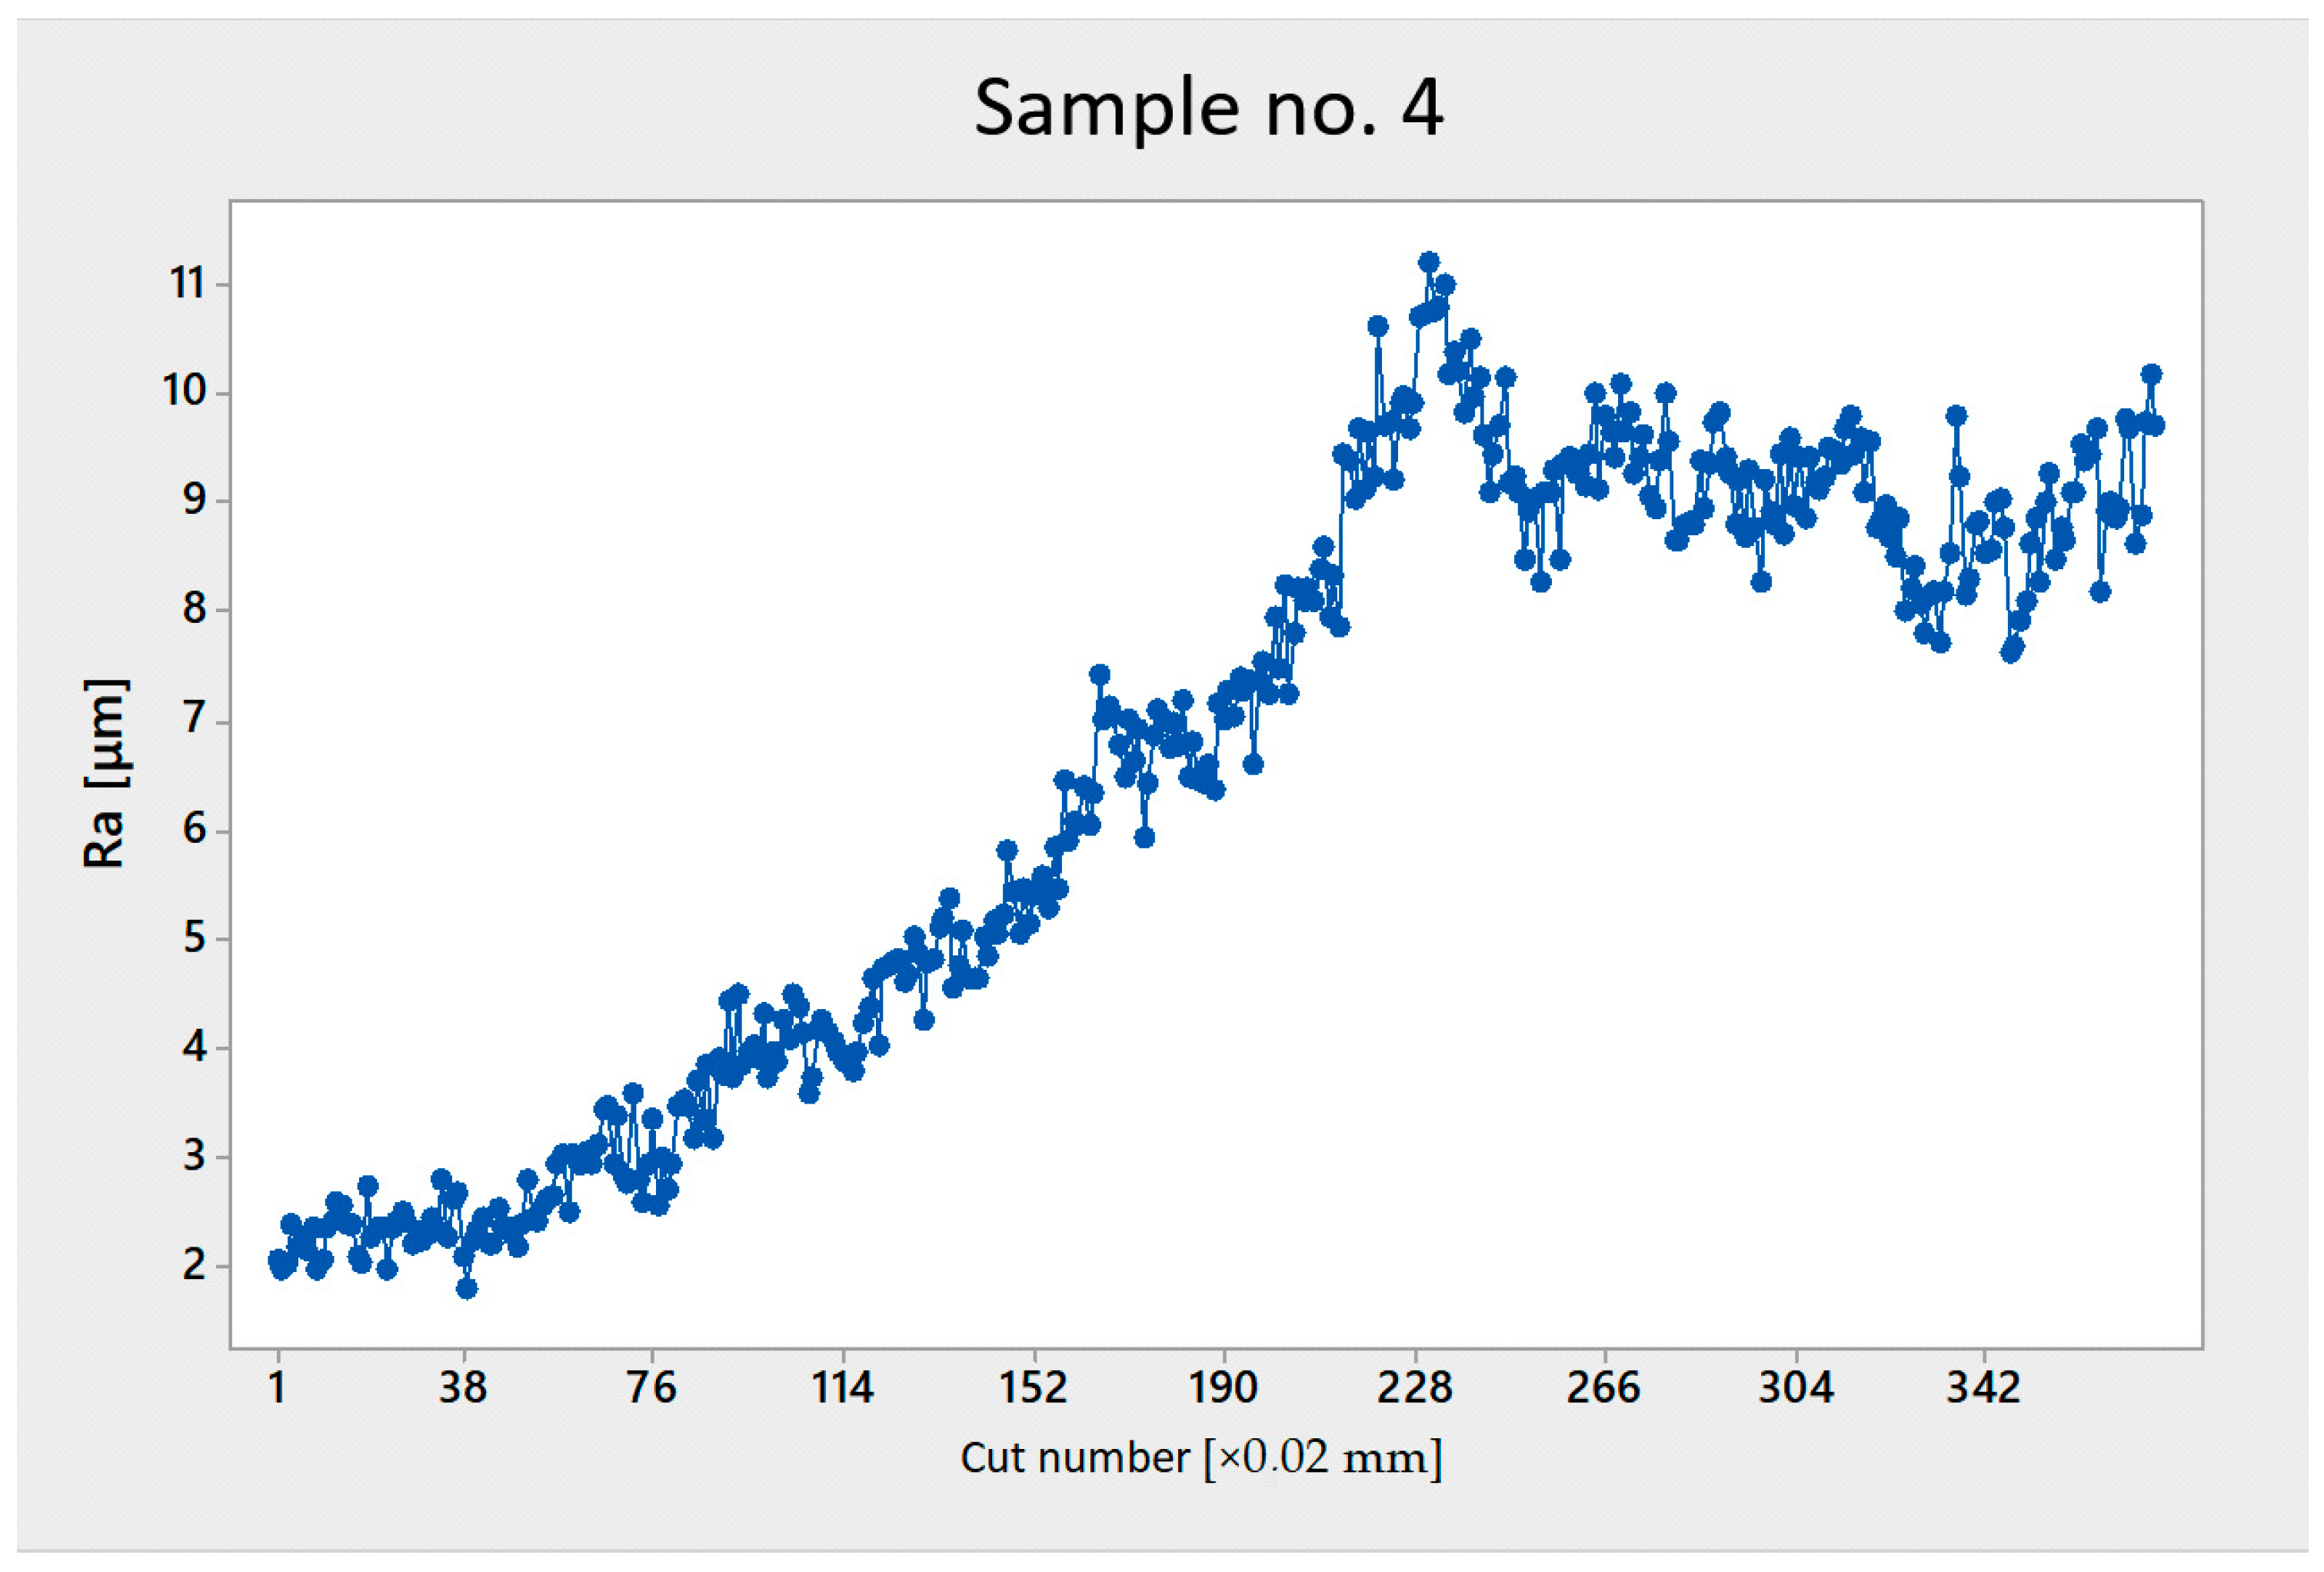
2.2. Data Obtainment

The measurements of all ten samples were carried out in a secure laboratory environment in as short a time as possible, including configuring the number of individual sections to be measured and setting up the measurement process in the associated software, all to ensure repeatability (Figure 3).
The area of 4 × 7.5 mm on a sample surface was measured, and then, 376 cuts were made perpendicularly to the direction of the laser beam; the distance between each cut was 20 μm. From each cut, the roughness parameter Ra was obtained, which is the arithmetic mean of the differences between peaks and valleys on the surface (ČSN EN ISO 21920-2) [17].
Figure 4 shows a flow chart of the preparation of the experiment and sample measurement.

3. Results

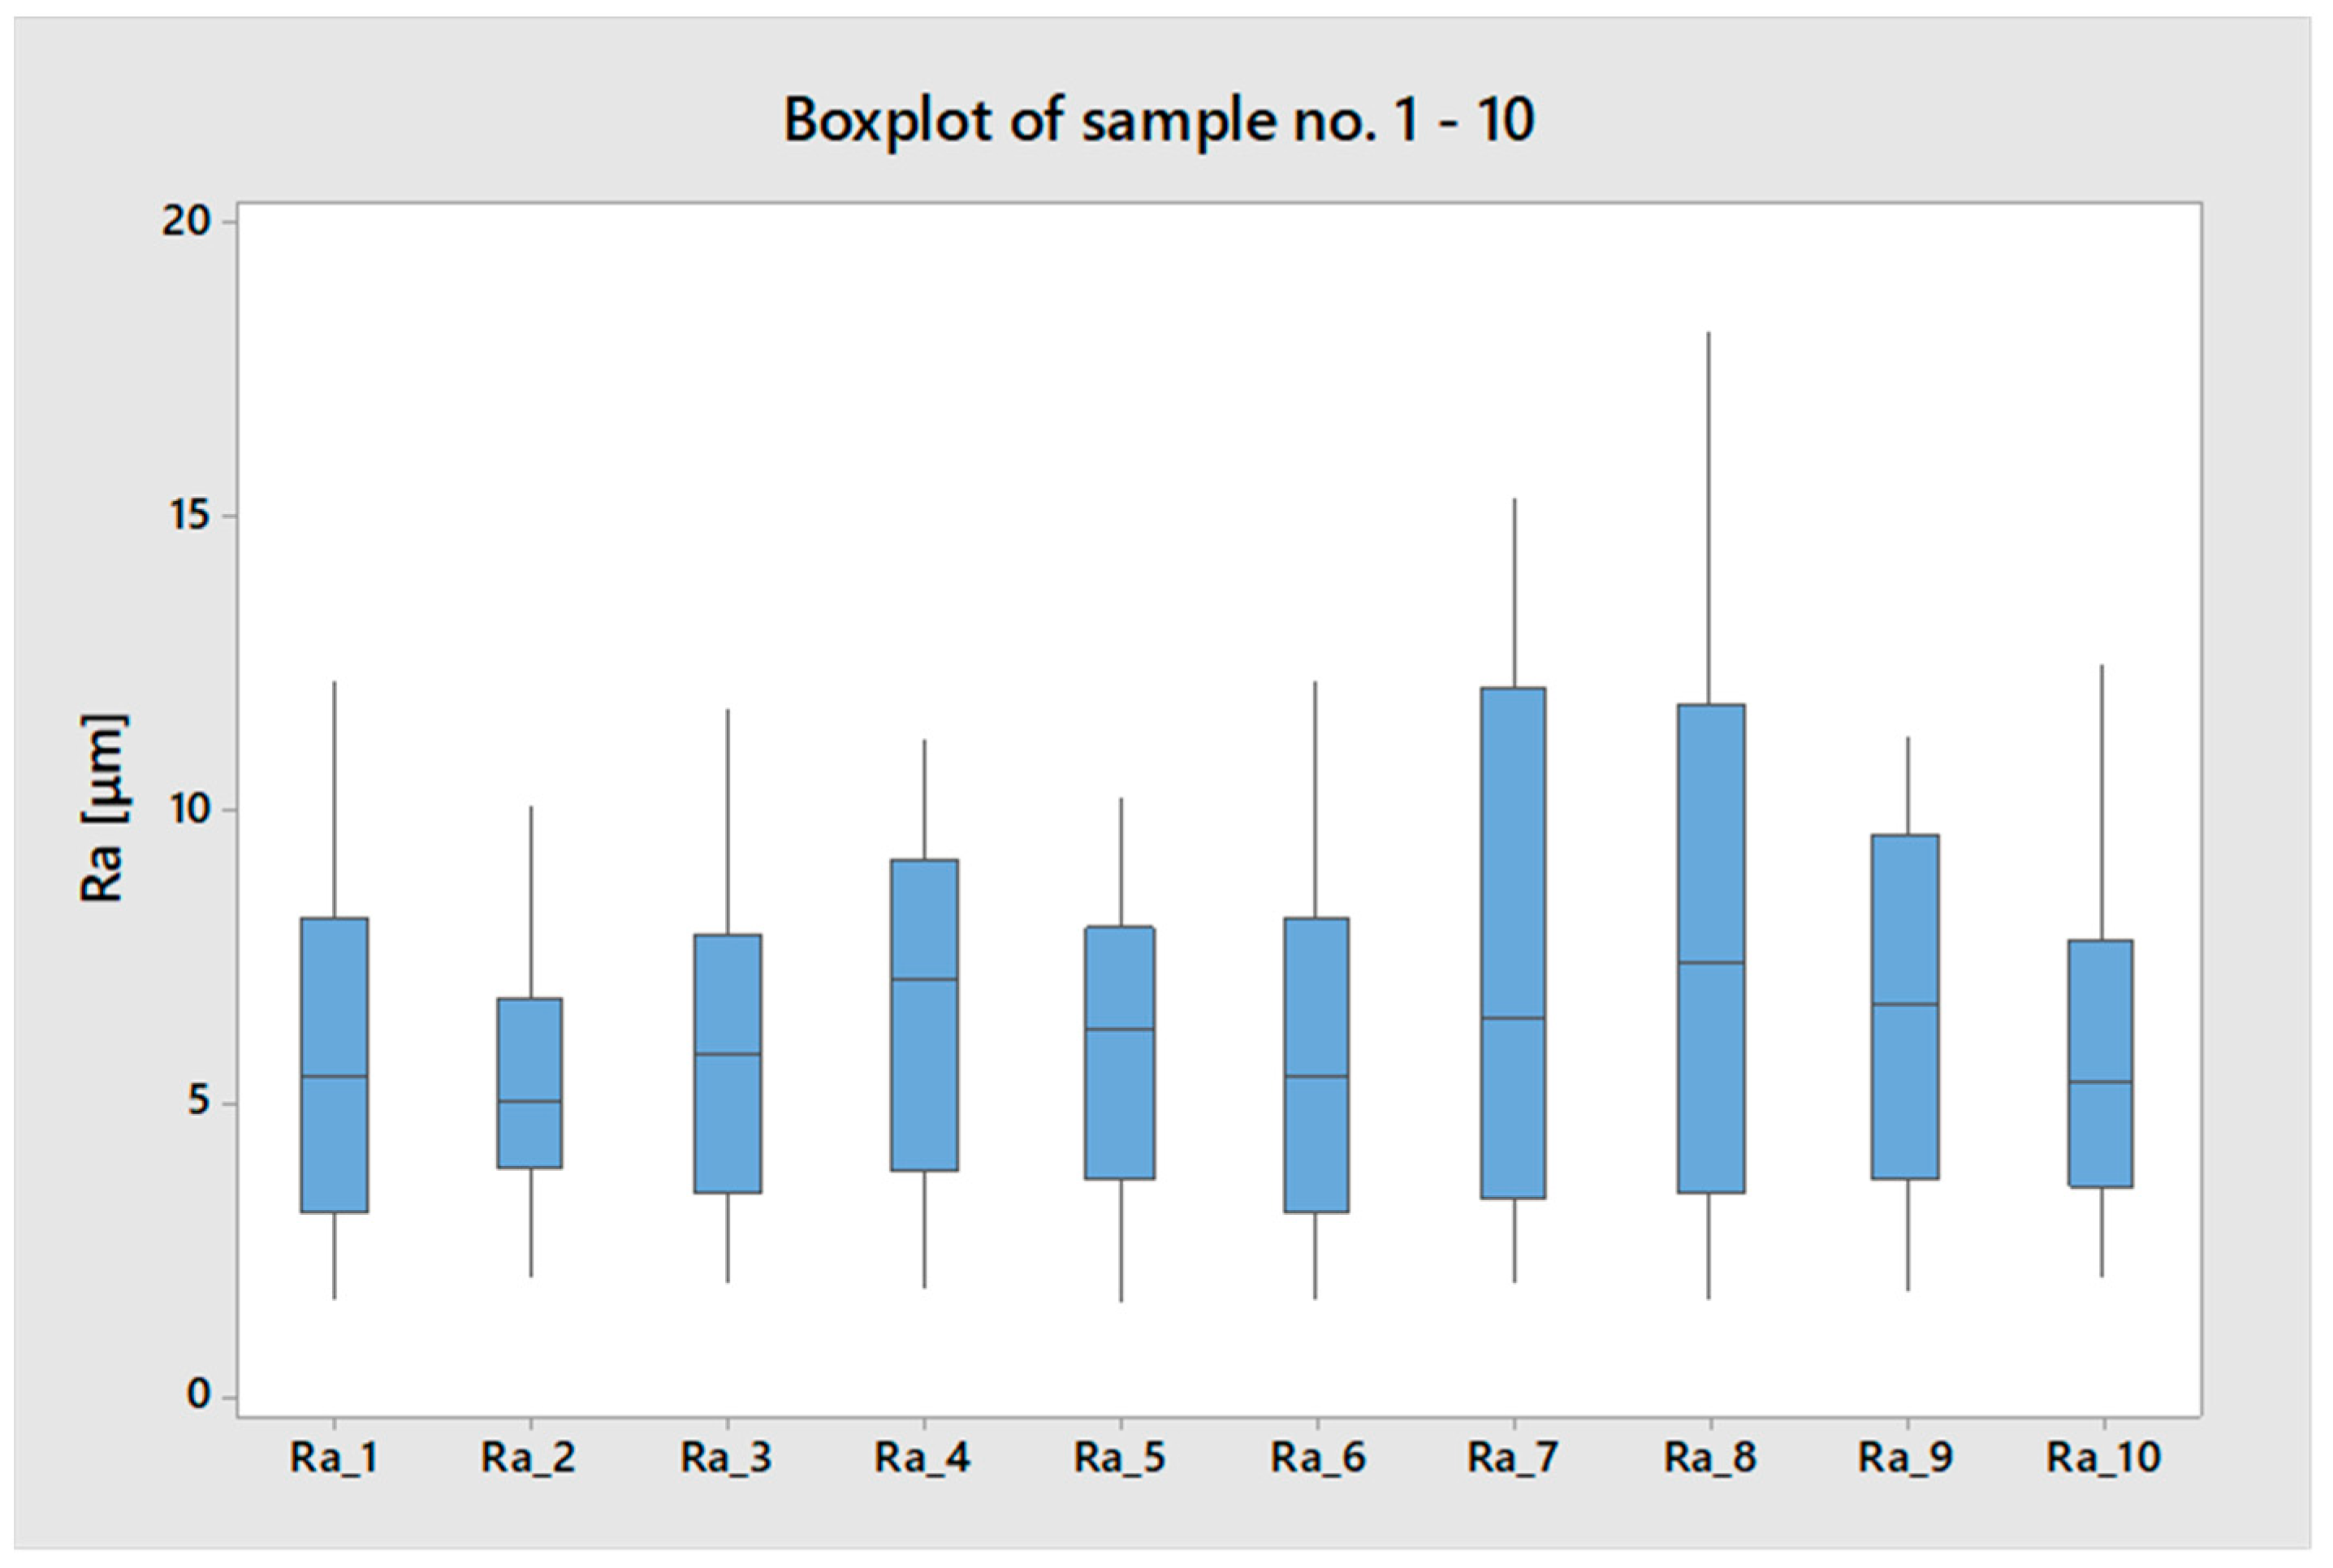
3.1. Exploratory Data Analysis (EDA)

The output was a data set of 376 values, which was further processed using the Exploratory Data Analysis (EDA) methodology. After obtaining the roughness parameters from the surface cuts, a cursory verification of the correctness of the functional dependence theory of the roughness parameters on the distance from the cutting beam entrance was carried out. A plot of the dependence of the Ra parameter on the distance from the cutting beam entrance for sample 4 is shown in Figure 5. The Ra parameter was chosen because it is the most evaluated and most important parameter in the field of surface roughness evaluation [17,18].
The dependence of the value of the roughness parameter Ra on the distance from the cutting beam entrance can be clearly seen in the graph.
The EDA method was used to test whether or not the data had a normal distribution. The result was that none of the roughness data sets had a normal distribution. Next, the data were examined for the presence of outliers. A boxplot (Figure 6) was created to accurately interpret the data, which confirmed the absence of outliers for all samples examined.
If further processing of these data were conducted using classical methods typically employed for evaluating surface roughness data, the resulting values from this analysis would not only be meaningless but would also lead to the loss of all information regarding roughness. For example, the results from the descriptive statistics of sample no. 4’s roughness are shown in Table 1.
According to a classical approach, when obtaining the mean and standard deviation, the resulting description of roughness would be described as follows:
x ¯ ± s = 7.343 ± 4.263   μ m
If the Gaussian normal probability is applied, there is a 95% chance that the values will be in the interval [−1.183; 15.869]. The roughness value cannot be below zero—it is not possible. Even if the interval was above zero, due to the variance in these results, it cannot be used to evaluate surface roughness for coating applications. This demonstrates why the classical approach cannot be used to evaluate heterogeneous surfaces—the reason is the assumption of normal distribution.

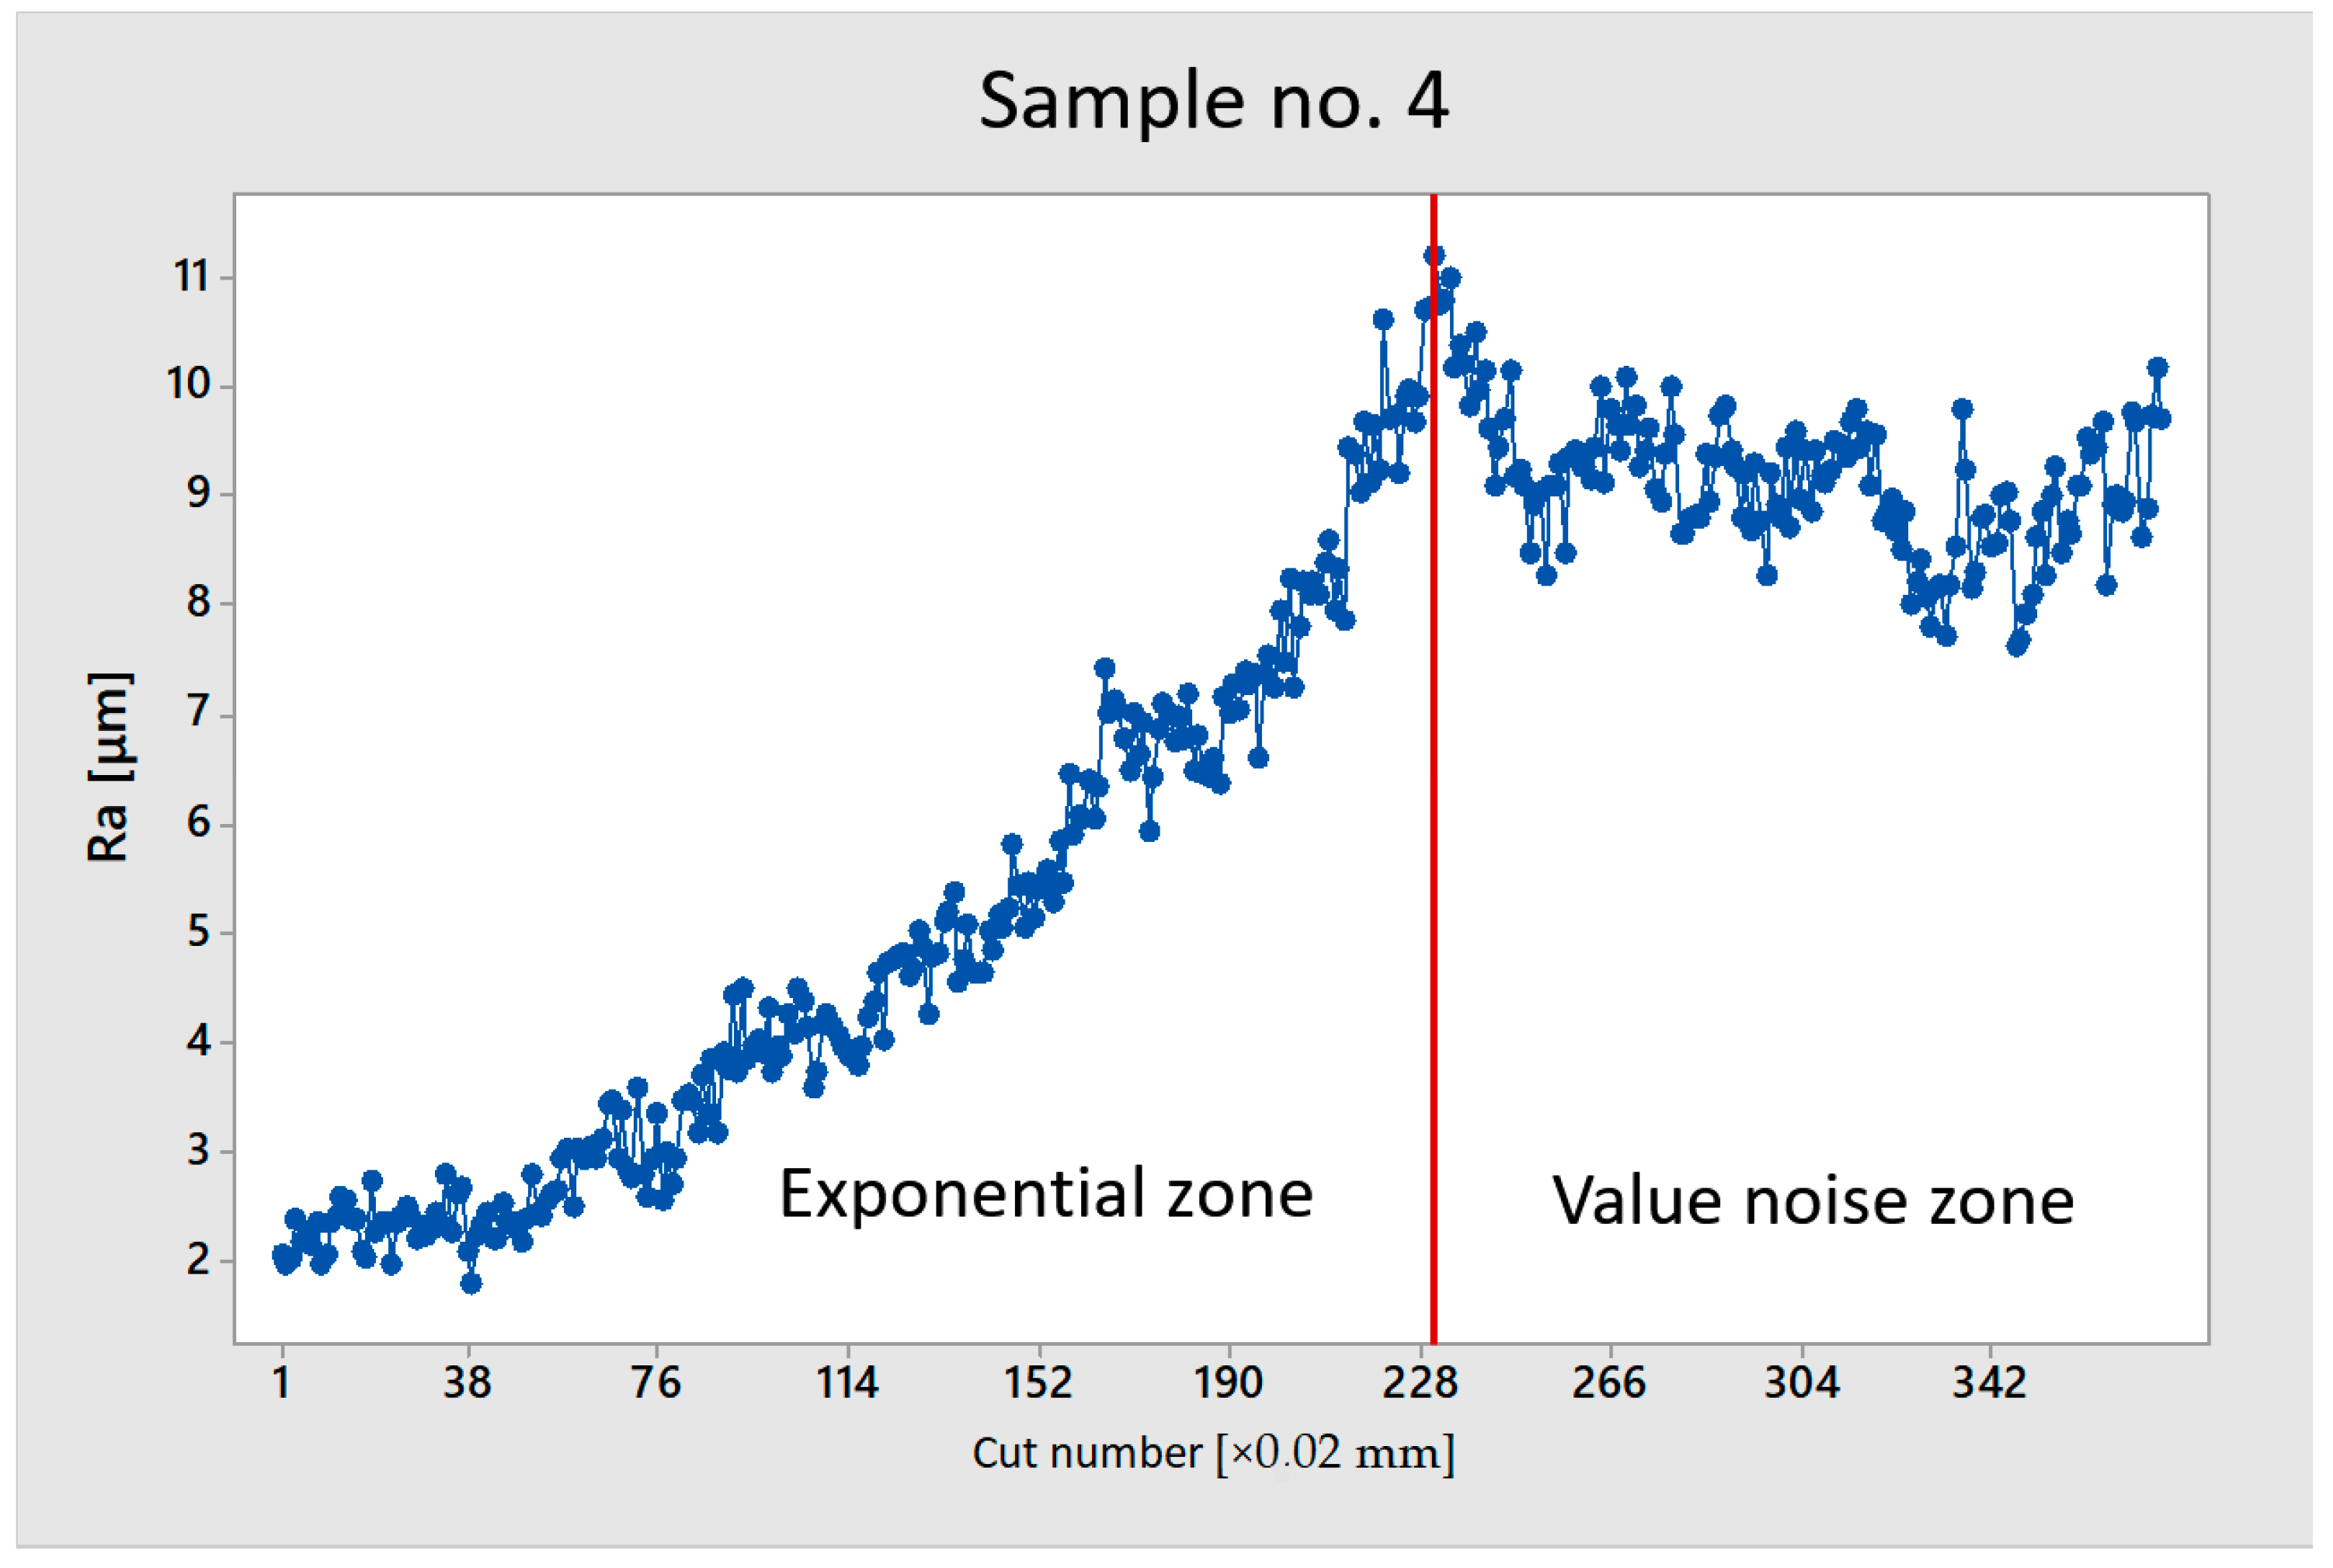
3.2. Further Data Exploration

The graph in Figure 7 shows an exponential increase in roughness as a function of the depth of the cut until a global maximum is reached, and then, an apparent randomness of values is observed.
To evaluate the surfaces for coating purposes, the partitioning of the heterogeneous surface into two zones has been proposed. The first zone contains the data growing in an apparent exponential growth and, after the global maximum, a zone of “noise” data, as can be seen in Figure 8.
Due to the exponential growth of the data in the first zone, linear regression was proposed to describe it. For clarification—linearity is not meant in the sense of a progression (straight line), but in mathematical terms—a quadratic or cubic type of linear regression model is used. The aim, therefore, is to fit the data progression with a function curve that best describes the waveform being studied. It is then decided whether or not the model is significant. Further analysis is performed with exponential zone values only. The reason is that the maximum roughness value is important for coating purposes [2].

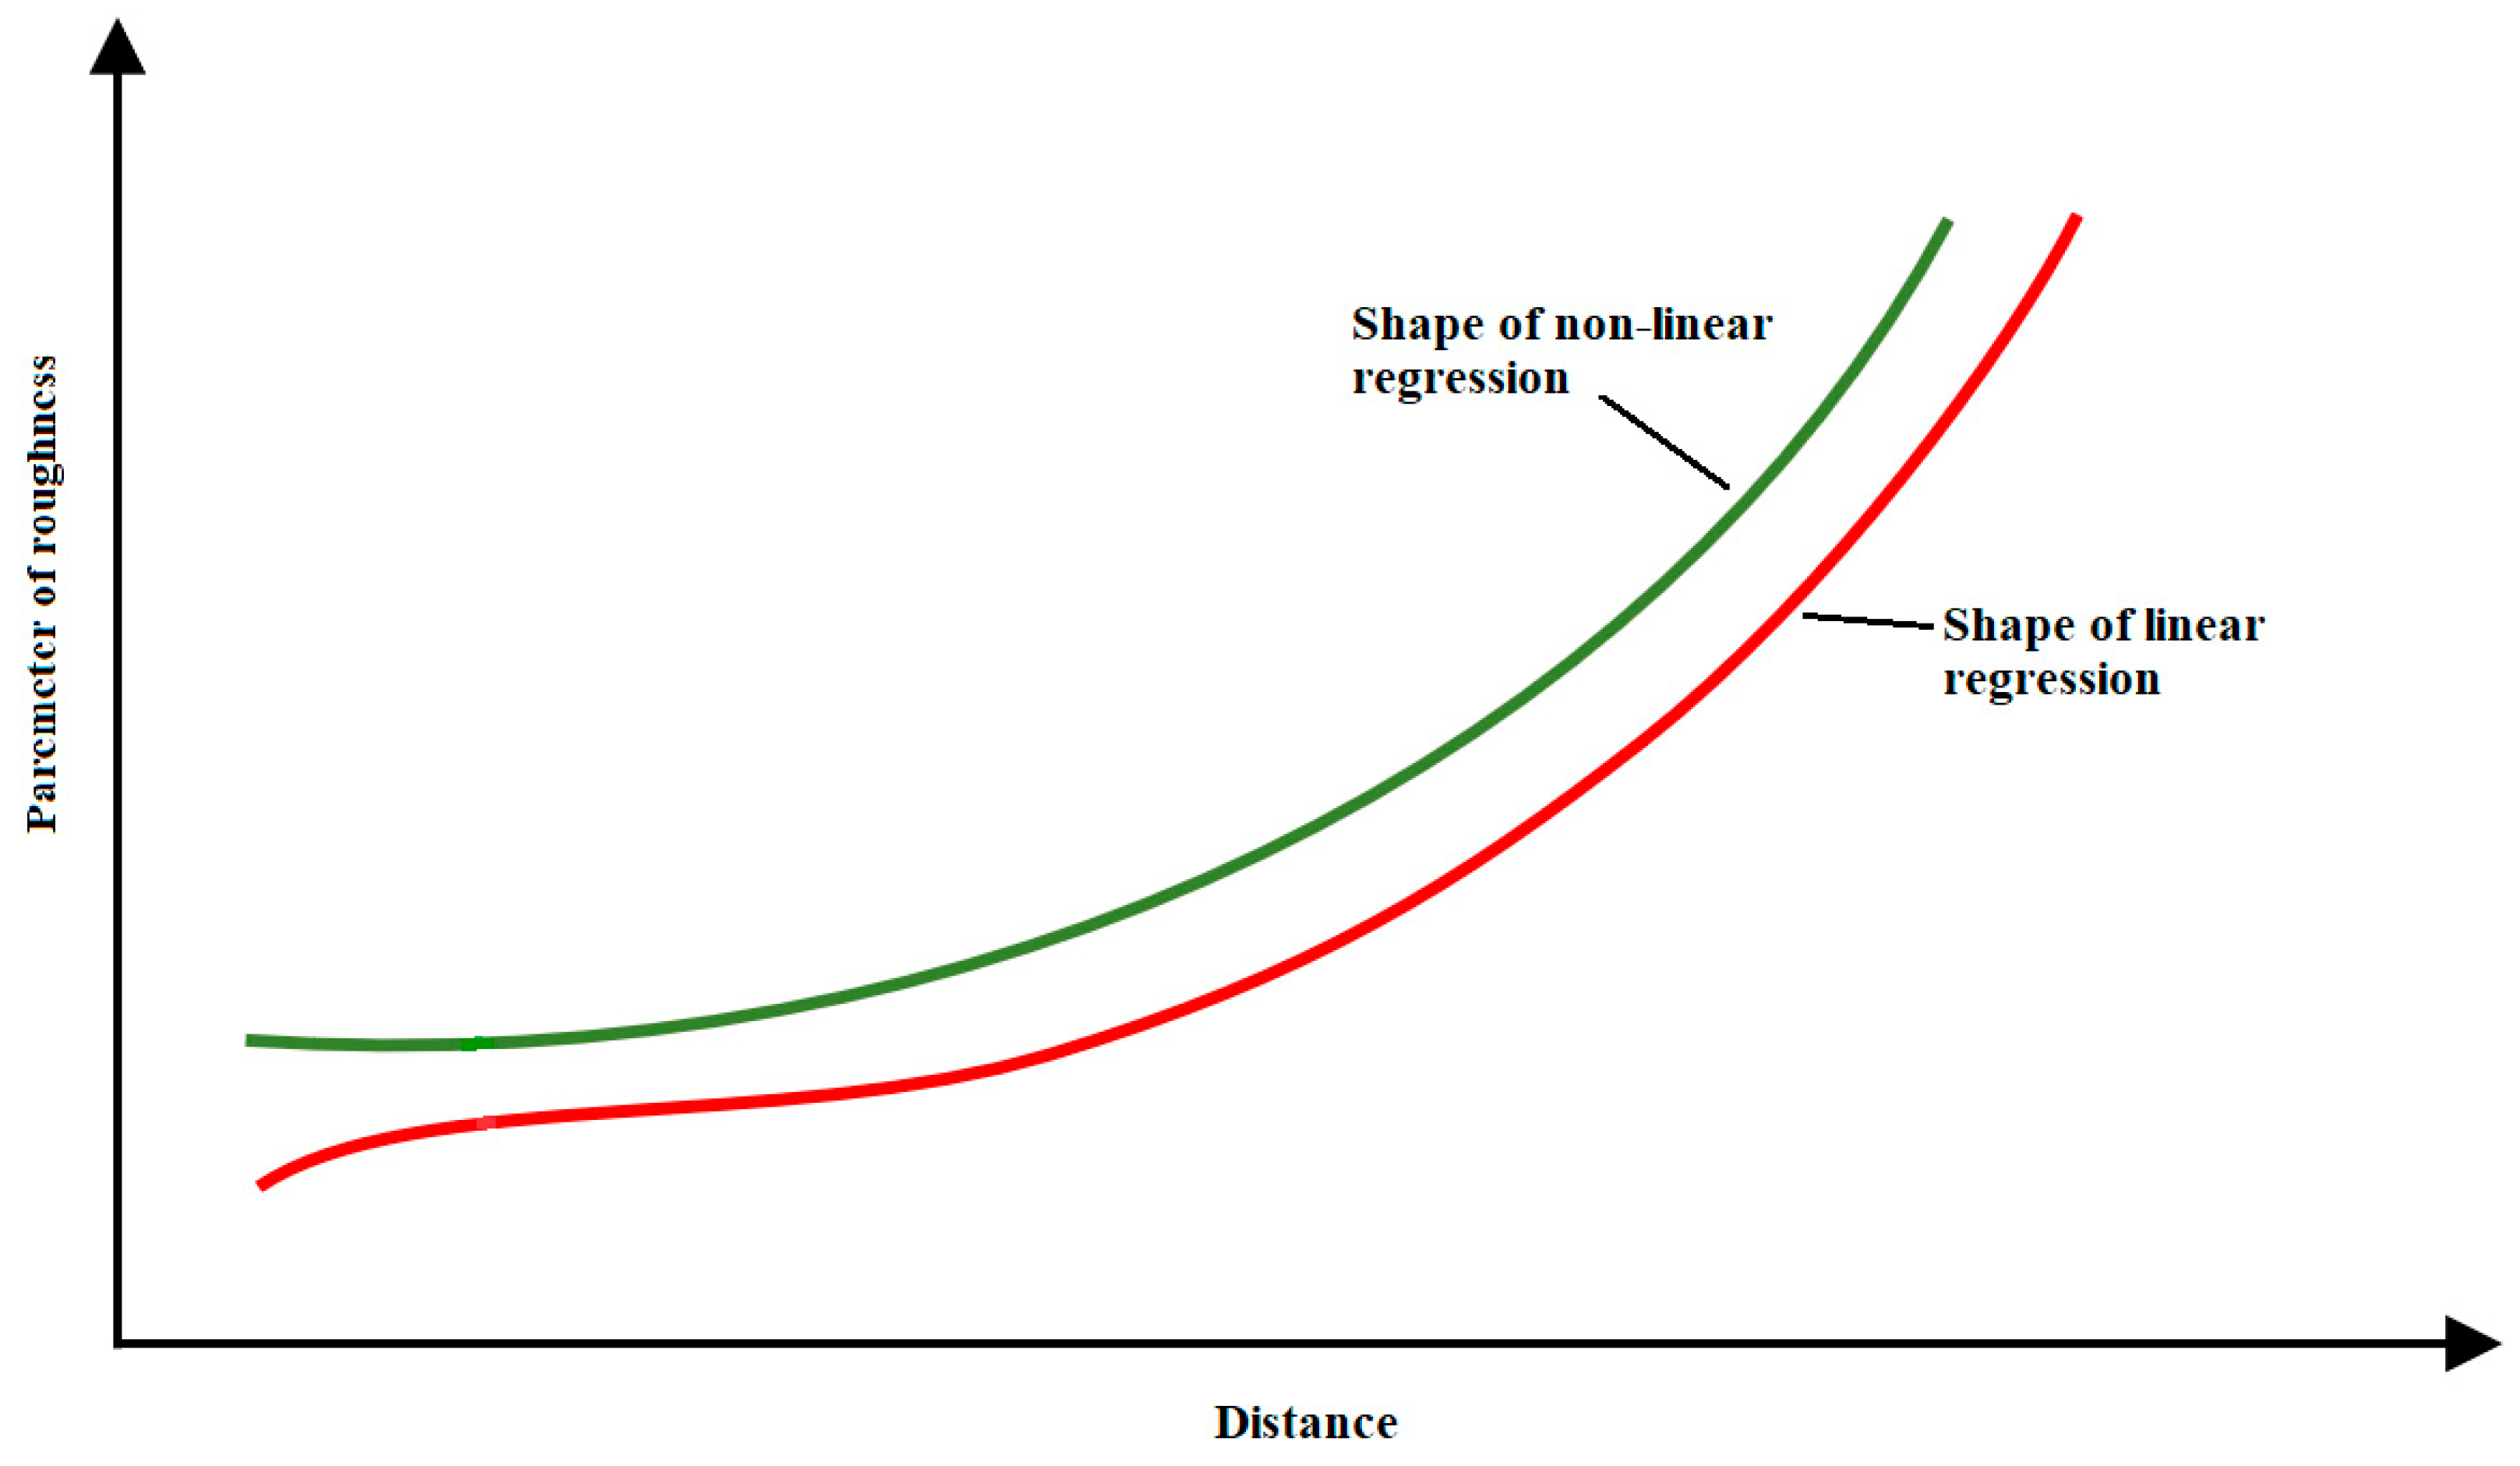
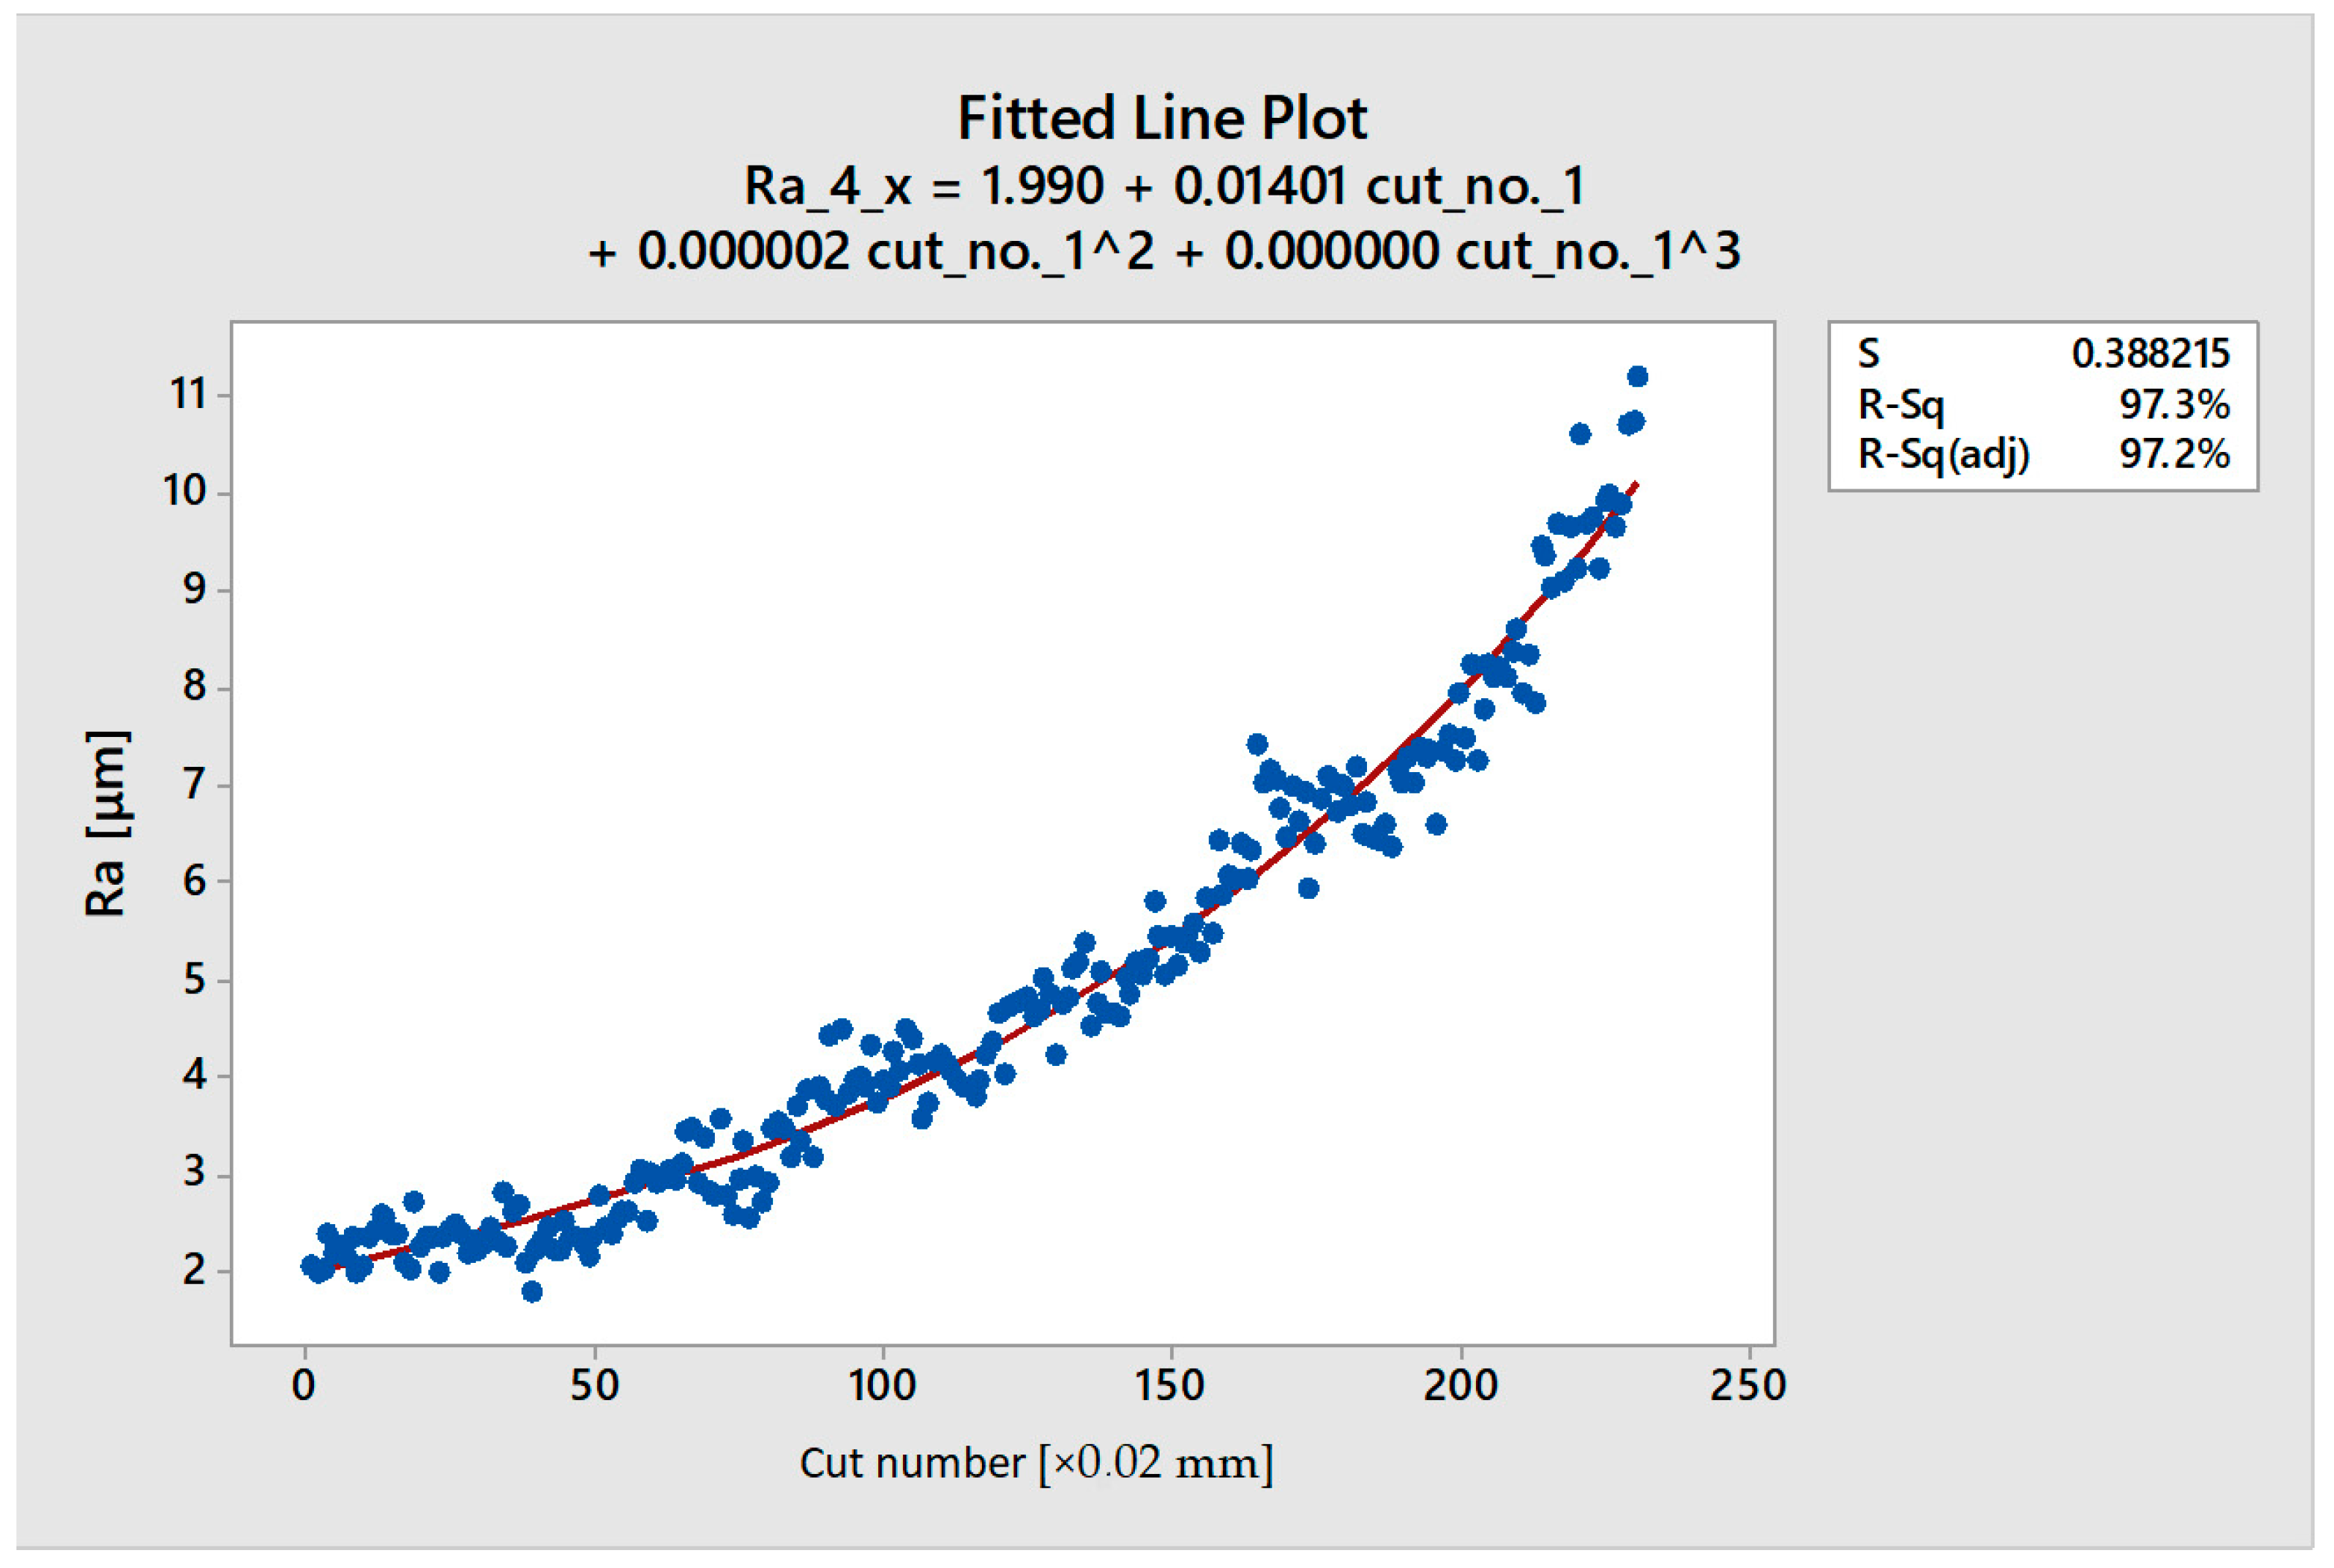
3.3. Linear Regression

The regression analysis was performed using Minitab® 17 software (Minitab Inc., State College, PA, USA). First, a quadratic type of linear regression model (polynomial of degree two) was selected, and the result is shown in Figure 9.
The evaluation of the data fit by the regression curve can be assessed by the values of the coefficient of determination—R-Sq(adj)—a corrected goodness-of-fit (model accuracy) measure for linear models. It identifies the percentage of variance in the target field that is explained by the input or inputs of the regression curve found. The closer this value is to 100%, the better the fit obtained. Although a value of 97.1% is relatively high, the cubic-type regression model will still be applied.
The coefficient of the determination result for cubic-type regression (Figure 10) was only 0.1% higher than that for quadratic-type regression. From a practical point of view, they can be considered equivalent in this case. Further information on the models is necessary. QC Expert 3.3 software (TriloByte Statistical Software, s.r.o., Pardubice, Czech Republic) was used for this purpose. The results obtained from the software show that all the models used are significant. From Table 1, it can be seen that the cubic model has larger values of R-Sq(adj) (Table 2).

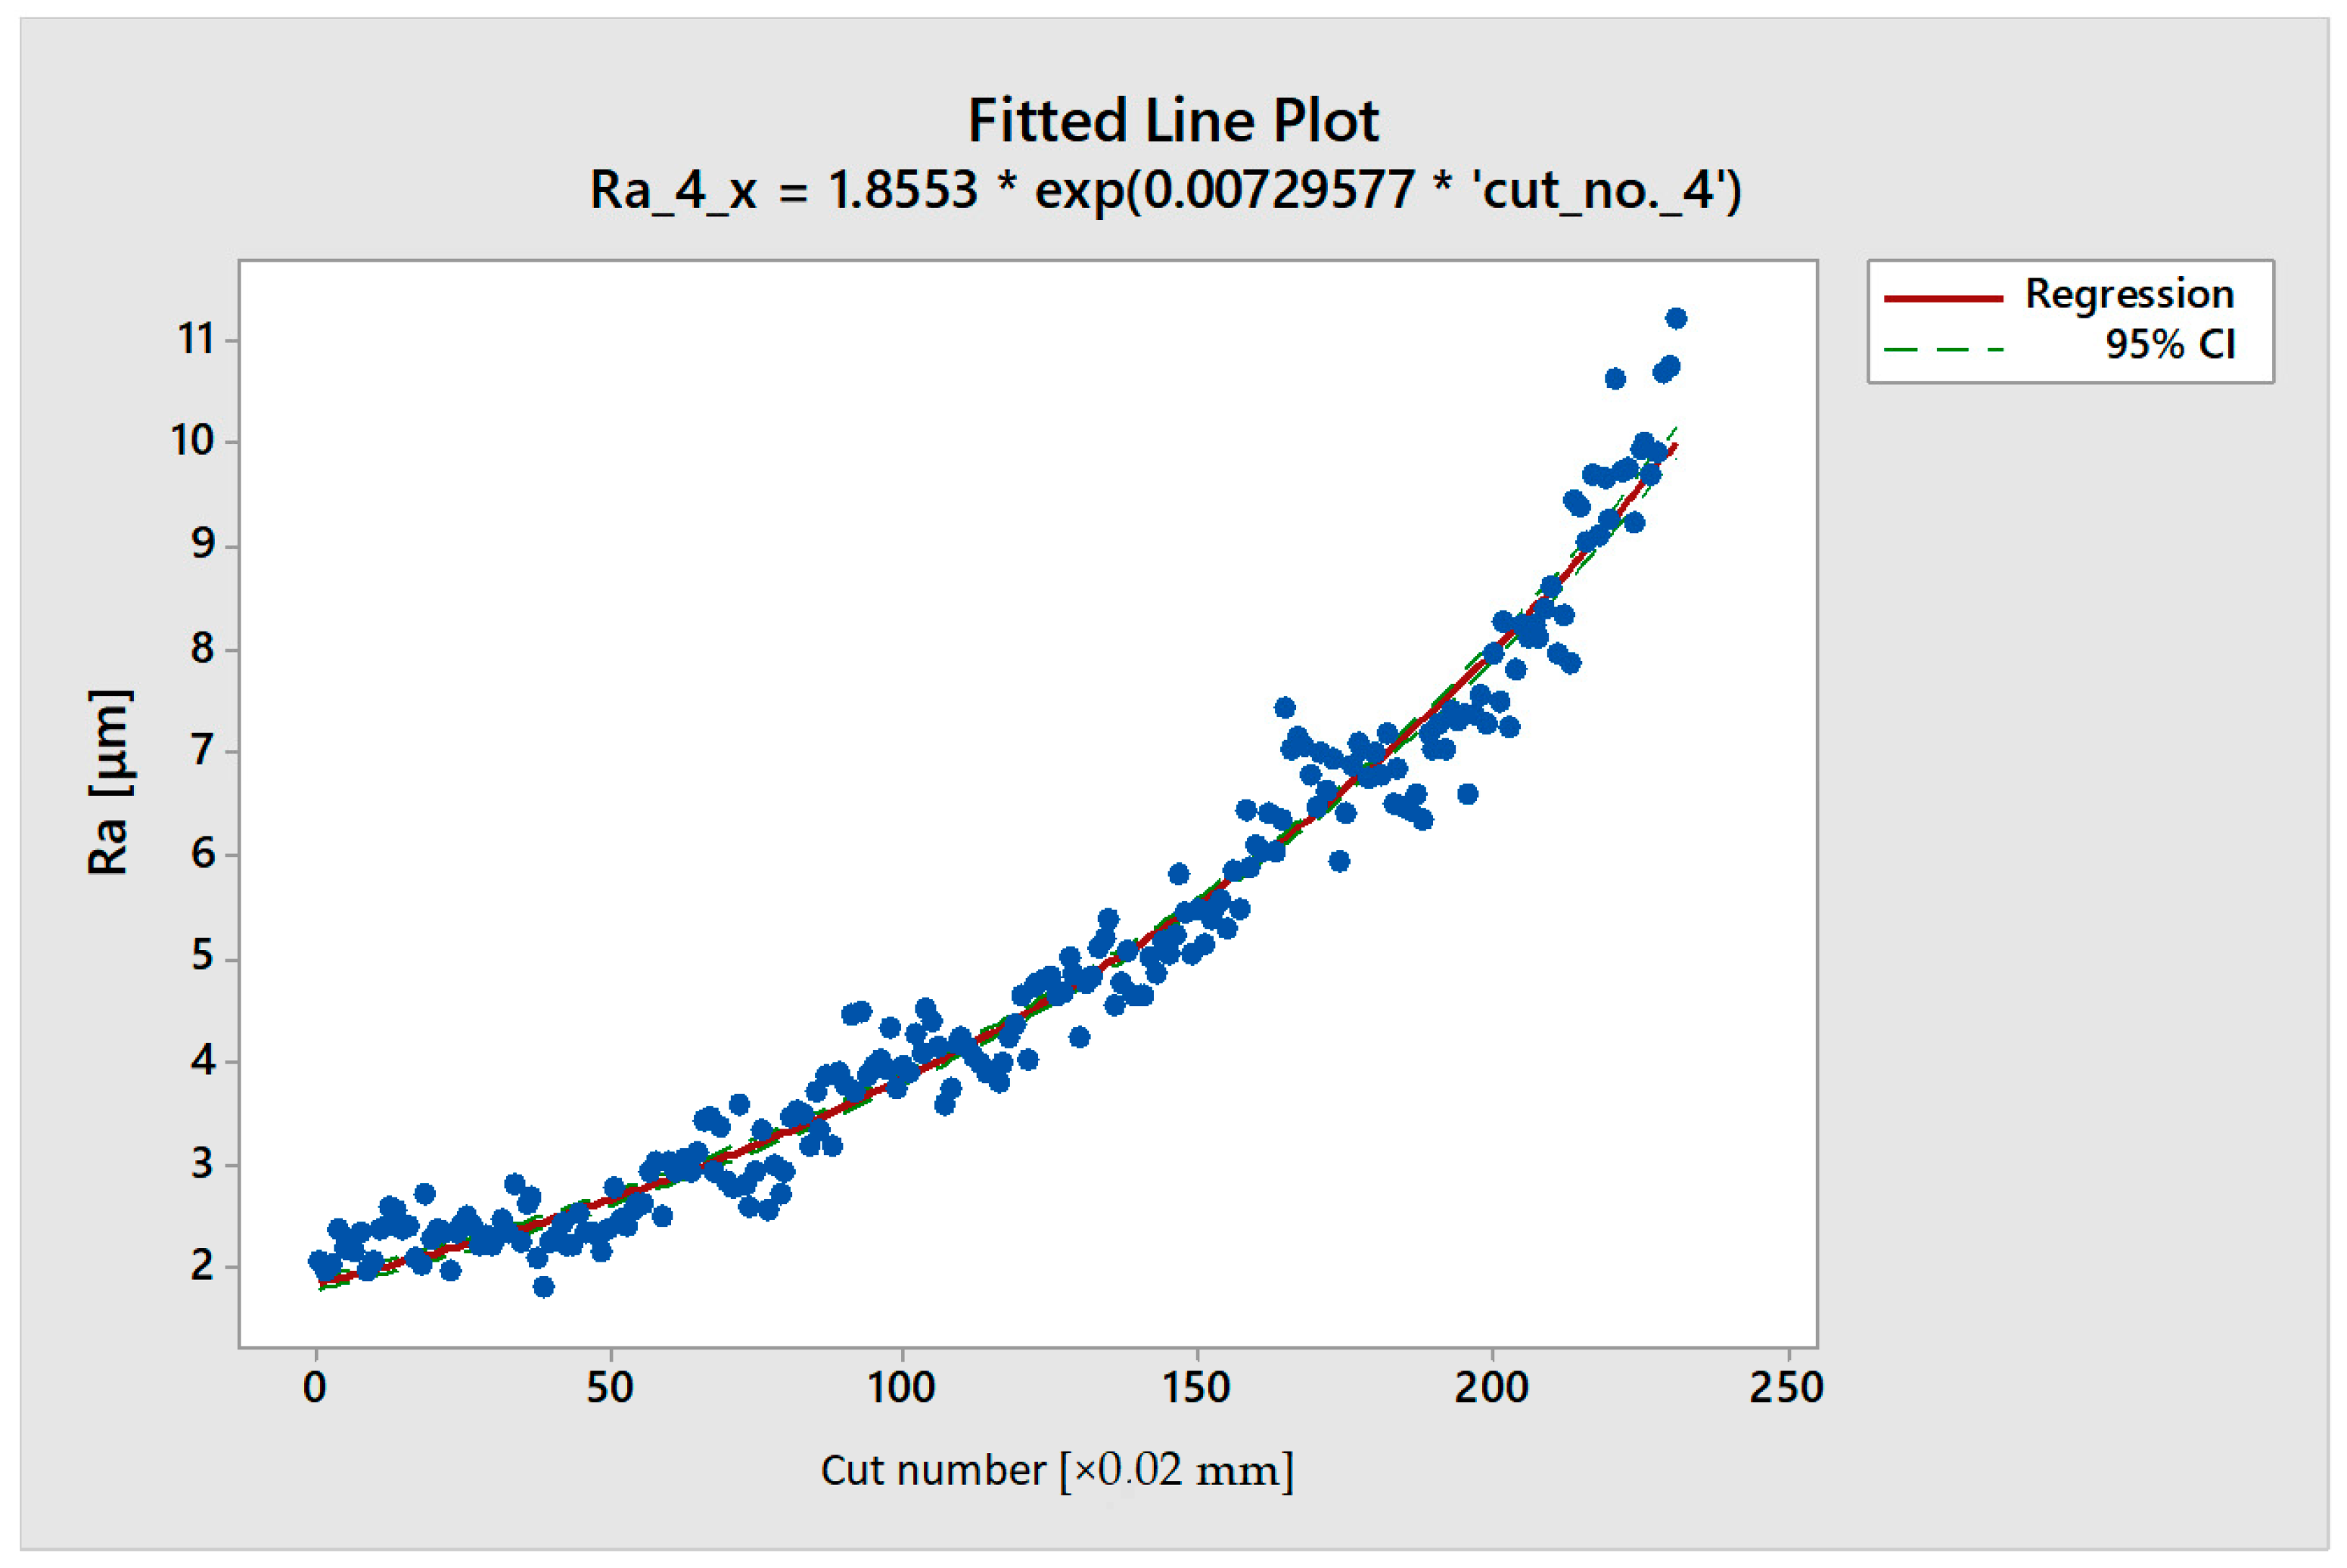
3.4. Non-Linear Regression

Next, non-linear regression was applied; the exponential model was used. The Levenberg–Marquardt method was selected. The maximum number of iterations was set to 200, and the initial values were set as follows: Theta1 = 50; Theta2 = −0.5. The convergence tolerance was set to 0.00001. The result is shown in the graph below (Figure 11).
The MSE error value was 0.15; the S error was 0.39, all with an iteration count of 17. Table 3 shows the values for the other samples:
The MSE and S-error are close to zero and the number of iterations is also at a lower level, which means that the exponential function fits the data very well. The test based on the Fisher–Snedecor criterion also confirmed that all the exponential models used were significant. Figure 12 shows a flow chart of the statistical evaluation process of the obtained data.
As can be seen, beam-machined surfaces have to be treated differently in order to obtain as much information as possible about surface roughness. This is essential in the field of surface treatment because of the fact that the surface roughness can dramatically affect the quality of a coating.
It is clear from our measurement results that the roughness on this type of surface varies depending on the measurement position, and therefore, the methods commonly used today for roughness assessment are insufficient in practice, and this problem of surface roughness variation over the entire depth of cut seems insoluble.
However, during the process of the statistical investigation, certain zones of the surfaces showed similarities. All the examined samples were united by an almost exponential increase in roughness up to a point of global maximum, and it was, therefore, decided that the similarity and significance of this phenomenon should be investigated.
Linear regression in the form of second- and third-degree polynomials was applied. The results show that the model describes the data robustly, as the data fit with the curve. The coefficients of the determination values are mostly above 90%, in some cases approaching almost 100%, which is a very good result, and the linear regression can describe the data sufficiently.
However, if we focus on the overall shape of the linear model, there is a local minimum in the region of the origin of the linear regression curve. This minimum does not occur in the data. A comparison of the linear and non-linear models is shown in Figure 13. A and B are the dependent and independent variable models. The figure shows two different types of functions describing the progression of the dependence of the two theoretical variables mentioned. This is a model example of non-linear exponential and linear cubic regression progression.
The data are closer to an exponential model rather than a linear model. The results of the non-linear regression analysis clearly show that it fits with very low error. The conclusion of QC Expert software confirmed the significance of the model. Due to the absence of a local minimum in the data, it is recommended to use non-linear regression with an exponential function.
As for the second zone of the data—data noise—its investigation is not necessary for the surface preparation of coatings. This is because the highest roughness value is important for surface preparation, and the data analysis shows that all measured values beyond the global extreme value are always smaller [2]. This is due to the re-solidification of the laser-melted material on the cut surface, thereby smoothing the surface.
In the field of coating research, it is important to have an understanding of the overall surface characteristic, and therefore, the method presented in this article is more suitable for scientific applications—not only because of the time required but also because of the high cost of the equipment.
In practice, however, it is important to have a relatively cheap and quick way of checking surface quality. The macro photographs of the sample show that the paths along the laser beam are not straight but follow a curve. In this case, it is a curve with three bends; this is because of the sufficient depth of the cut material and the chance for the beam to reach a phase of the re-solidification of the material.
Figure 14 shows sample no. 4. The maximum roughness value was obtained from cut no. 230. The cuts were made every 20 μm, starting from the beam entrance. In the figure, cut no. 230 is shown, and it is at a depth of 4.6 mm. It can be seen that at a depth of 4.6 mm, there is a transition between concavity and convexity in the laser beam path. In other words, the line with the highest roughness intersects the second inflection point in the beam path curve. This was observed for all the samples. Considering the price and speed requirements, the simplest solution is to measure the surface roughness at the inflection point area. The suggested solution is to obtain three values and consider the highest value only, if there is no significant difference in the measured values that could affect the quality of a coating.
In the other cases, when the laser path does not reach the described “second inflection point” area, it is suggested to measure the roughness at the very end of the laser path—the area with the highest possible roughness value.

4. Conclusions

Due to the complexity of beam-cut surfaces and their impact on coating quality, it is essential to select appropriate surface roughness evaluation methods. Our research suggests that commonly used methods may fail to capture variations in surface roughness with the depth of the cut. Mathematical data evaluation methods, such as linear and non-linear regression, are essential to provide a comprehensive understanding of the evolution of surface roughness. The results from non-linear regression show more accurate modeling of the data than linear approaches, suggesting that the exponential model is more appropriate to describe these data.
Additionally, a zone of data noise was identified, which is not significant for the purposes of surface preparation for coatings.
It is important to emphasize that the proposed method is more suitable for scientific applications where understanding the overall characteristics of the surface is more important. In practice, however, there is still a need for a relatively inexpensive and quick method for surface quality control. A compromise must, therefore, be found between sophisticated analytical methods and the practical needs of industrial applications. Macro photography of the sample highlights the need to understand the surface treatment process and its influence on the final result. This highlights the need for continuous development and the optimization of surface evaluation methods to fulfill the requirements of industrial and scientific applications.
In summary, with the increasing use of non-conventional machining technologies using a beam as a cutting element, the need for coatings, in general, is growing. Surface quality plays a crucial role in determining coating quality. This paper presents an analysis method that could enhance coating quality on heterogeneous surfaces in both practical and research settings.

Author Contributions

H.V.: writing—original draft and resources; M.K.: conceptualization and methodology; V.P.: formal analysis and software; J.K.: investigation and data curation; J.J.: writing—review and editing; B.B.: software analysis and visualization. All authors have read and agreed to the published version of the manuscript.

Funding

This work and the project were realized with financial support from the internal grant of TBU in Zlin No. IGA/FT/2024/002, funded by the resources of specific university research.

Institutional Review Board Statement

Not applicable for studies not involving humans or animals.

Informed Consent Statement

Not applicable for studies not involving humans or animals.

Data Availability Statement

Data are contained within the article.

Conflicts of Interest

The authors declare no conflicts of interest.

References

  1. Nazarpour, S. Introduction: What Are Coatings? In Thin Films and Coatings in Biology; Biological and Medical Physics, Biomedical Engineering; Springer: Dordrecht, The Netherlands, 2013; pp. 1–9. ISBN 978-94-007-2591-1. [Google Scholar]
  2. Pedroso, A.F.V.; Sousa, V.F.C.; Sebbe, N.P.V.; Silva, F.J.G.; Campilho, R.D.S.G.; Sales-Contini, R.C.M.; Jesus, A.M.P. A Comprehensive Review on the Conventional and Non-Conventional Machining and Tool-Wear Mechanisms of Inconel®. Metals 2023, 13, 585. [Google Scholar] [CrossRef]
  3. Xu, Y.; Jiang, Y.; Xie, J.; Xu, Q.; Fei, H.; Lu, Y.; Gong, J. Effect of Temperature, Vacuum Condition and Surface Roughness on Oxygen Boost Diffusion of Ti–6Al–4V Alloy. Coatings 2024, 14, 314. [Google Scholar] [CrossRef]
  4. Mičietová, A.; Neslušan, M.; Florková, Z.; Čilliková, M. Analysis of the Coating Delamination after Laser Beam Cutting. Manuf. Technol. 2023, 23, 670–675. [Google Scholar] [CrossRef]
  5. Bohdal, Ł.; Schmidtke, D. Effect of Fiber and CO2 Lasers Parameters on the Cut Surface Quality of Rvs 1.4301 Stainless Steel. J. Mech. Eng. Sci. 2022, 16, 8862–8872. [Google Scholar] [CrossRef]
  6. Wala, T.; Lis, K. Influence of Selected Diagnostic Parameters on the Quality of Awj Cutting Surface. Adv. Sci. Technol. Res. J. 2022, 16, 129–140. [Google Scholar] [CrossRef] [PubMed]
  7. Basmacı, G.; Kayacan, M.Y.; Ay, M.; Etyemez, A. Optimization of Cutting Forces and Surface Roughness via Anova and Grey Relational Analysis in Machining of In718. Open Chem. 2023, 21, 129–140. [Google Scholar] [CrossRef]
  8. Bautista, A.; Sáez-Maderuelo, A.; Monrrabal, G.; Ruiz-Lorenzo, M.L.; Perosanz, F.J.; Maffiotte, C.; Volpe, L.; Scenini, F.; Maurotto, A.; Halodová, P.; et al. Surface Characterization and Electrochemical Behavior of Aisi 316L Stainless Steel Machined with Green Supercritical CO2 Coolant. J. Mater. Eng. Perform. 2023, 21, 129–140. [Google Scholar] [CrossRef]
  9. Chmielewski, T.; Hudycz, M.; Krajewski, A.; Sałaciński, T.; Skowrońska, B.; Świercz, R.; Volpe, L.; Scenini, F.; Maurotto, A.; Halodová, P.; et al. Structure Investigation of Titanium Metallization Coating Deposited onto Aln Ceramics Substrate by Means of Friction Surfacing Process. Coatings 2019, 9, 129–140. [Google Scholar] [CrossRef]
  10. Patel, P.; Nakum, B.; Abhishek, K.; Rakesh Kumar, V. Machining Performance Optimization during Plasma Arc Cutting of Aisi D2 Steel: Application of Fis, Nonlinear Regression and Jaya Optimization Algorithm. J. Braz. Soc. Mech. Sci. Eng. 2018, 40, 240. [Google Scholar] [CrossRef]
  11. Anghel, C.; Gupta, K.; Jen, T.C. Analysis and Optimization of Surface Quality of Stainless Steel Miniature Gears Manufactured by CO2 Laser Cutting. Optik 2020, 203, 164049. [Google Scholar] [CrossRef]
  12. Kechagias, J.D.; Ninikas, K.; Petousis, M.; Vidakis, N. Laser Cutting of 3D Printed Acrylonitrile Butadiene Styrene Plates for Dimensional and Surface Roughness Optimization. Int. J. Adv. Manuf. Technol. 2022, 119, 2301–2315. [Google Scholar] [CrossRef]
  13. Kechagias, J.D.; Tsiolikas, A.; Petousis, M.; Ninikas, K.; Vidakis, N.; Tzounis, L. A Robust Methodology for Optimizing the Topology and the Learning Parameters of an Ann For Accurate Predictions of Laser-Cut Edges Surface Roughness. Simul. Model. Pract. Theory 2022, 114, 102414. [Google Scholar] [CrossRef]
  14. Biermann, D.; Steiner, M.; Krebs, E. Investigation of Different Hard Coatings for Micromilling of Austenitic Stainless Steel. Procedia CIRP 2013, 7, 246–251. [Google Scholar] [CrossRef]
  15. ISO 21920-2:2021; Specifications, Geometrical Product. “Surface Texture: Profile—Part 2: Terms, Definitions and Surface Texture Parameters”. International Organization for Standardization: Geneva, Switzerland, 2021. Available online: https://www.iso.org/standard/72226.html (accessed on 10 March 2024).
  16. Marek, M.; Novák, M.; Šramhauser, K. The Impact of Changes in Infeed Rate on Surface Integrity after Chrome Plate Grinding by Microcrystalline Corundum. Manuf. Technol. 2019, 19, 461–468. [Google Scholar] [CrossRef]
  17. Timárová, Ľ.; Breznická, A.; Kopiláková, B. Application of the Method of Planned Experiment for the Evaluation of the Surface Roughness Parameter Ra. Manuf. Technol. 2023, 23, 348–353. [Google Scholar] [CrossRef]
  18. Allen, T.T.; Sui, Z.; Akbari, K.; Silva, F.J.G.; Campilho, R.D.S.G.; Sales-Contini, R.C.M.; Jesus, A.M.P. Exploratory Text Data Analysis for Quality Hypothesis Generation. Qual. Eng. 2018, 30, 701–712. [Google Scholar] [CrossRef]
Figure 1. Laser-cut sample with heterogeneous surface.
Coatings 14 00471 g001
Figure 2. Prepared sample with cover caps [mm].
Coatings 14 00471 g002
Figure 3. The 3D surface topography.
Coatings 14 00471 g003
Figure 4. A flow chart of the preparation of the experiment and sample measurement.
Coatings 14 00471 g004
Figure 5. Plot of dependence of parameter Ra and cut number.
Coatings 14 00471 g005
Figure 6. Boxplot diagrams of all samples.
Coatings 14 00471 g006
Figure 7. Partitioning of data.
Coatings 14 00471 g007
Figure 8. Surface partitioning into two zones.
Coatings 14 00471 g008
Figure 9. Linear regression—quadratic type.
Coatings 14 00471 g009
Figure 10. Linear regression—cubic type.
Coatings 14 00471 g010
Figure 11. Exponential regression.
Coatings 14 00471 g011
Figure 12. A flow chart of the statistical evaluation process of the obtained data.
Coatings 14 00471 g012
Figure 13. Comparison of linear and non-linear regression curves models.
Coatings 14 00471 g013
Figure 14. Laser beam paths in heterogeneous surface/inflex point area.
Coatings 14 00471 g014
Table 1. Descriptive statistics: Ra.
N376
Mean7.343 [μm]
Se Mean0.220 [μm]
St. Dev. [σ]4.263 [μm]
Minimum1.943 [μm]
Q13.368 [μm]
Median6.457 [μm]
Q312.052 [μm]
Maximum15.264 [μm]
Table 2. Coefficient of determination for quadratic and cubic regression.
R-Sq(adj) [%]
QuadraticCubic
Ra_195.497.7
Ra_281.690.6
Ra_384.287.5
Ra_497.197.2
Ra_589.990.3
Ra_695.497.7
Ra_797.197.9
Ra_897.898.0
Ra_996.696.9
Ra_1093.896.5
Table 3. Exponential regression attributes.
Exponential Reg. Model
MSESIterations
Ra_10.380.6123
Ra_20.740.8618
Ra_30.870.9419
Ra_40.150.3917
Ra_50.390.6221
Ra_60.380.6123
Ra_70.260.5219
Ra_80.310.5622
Ra_90.210.5621
Ra_100.540.7320
Disclaimer/Publisher’s Note: The statements, opinions and data contained in all publications are solely those of the individual author(s) and contributor(s) and not of MDPI and/or the editor(s). MDPI and/or the editor(s) disclaim responsibility for any injury to people or property resulting from any ideas, methods, instructions or products referred to in the content.

