3.1. Microstructures
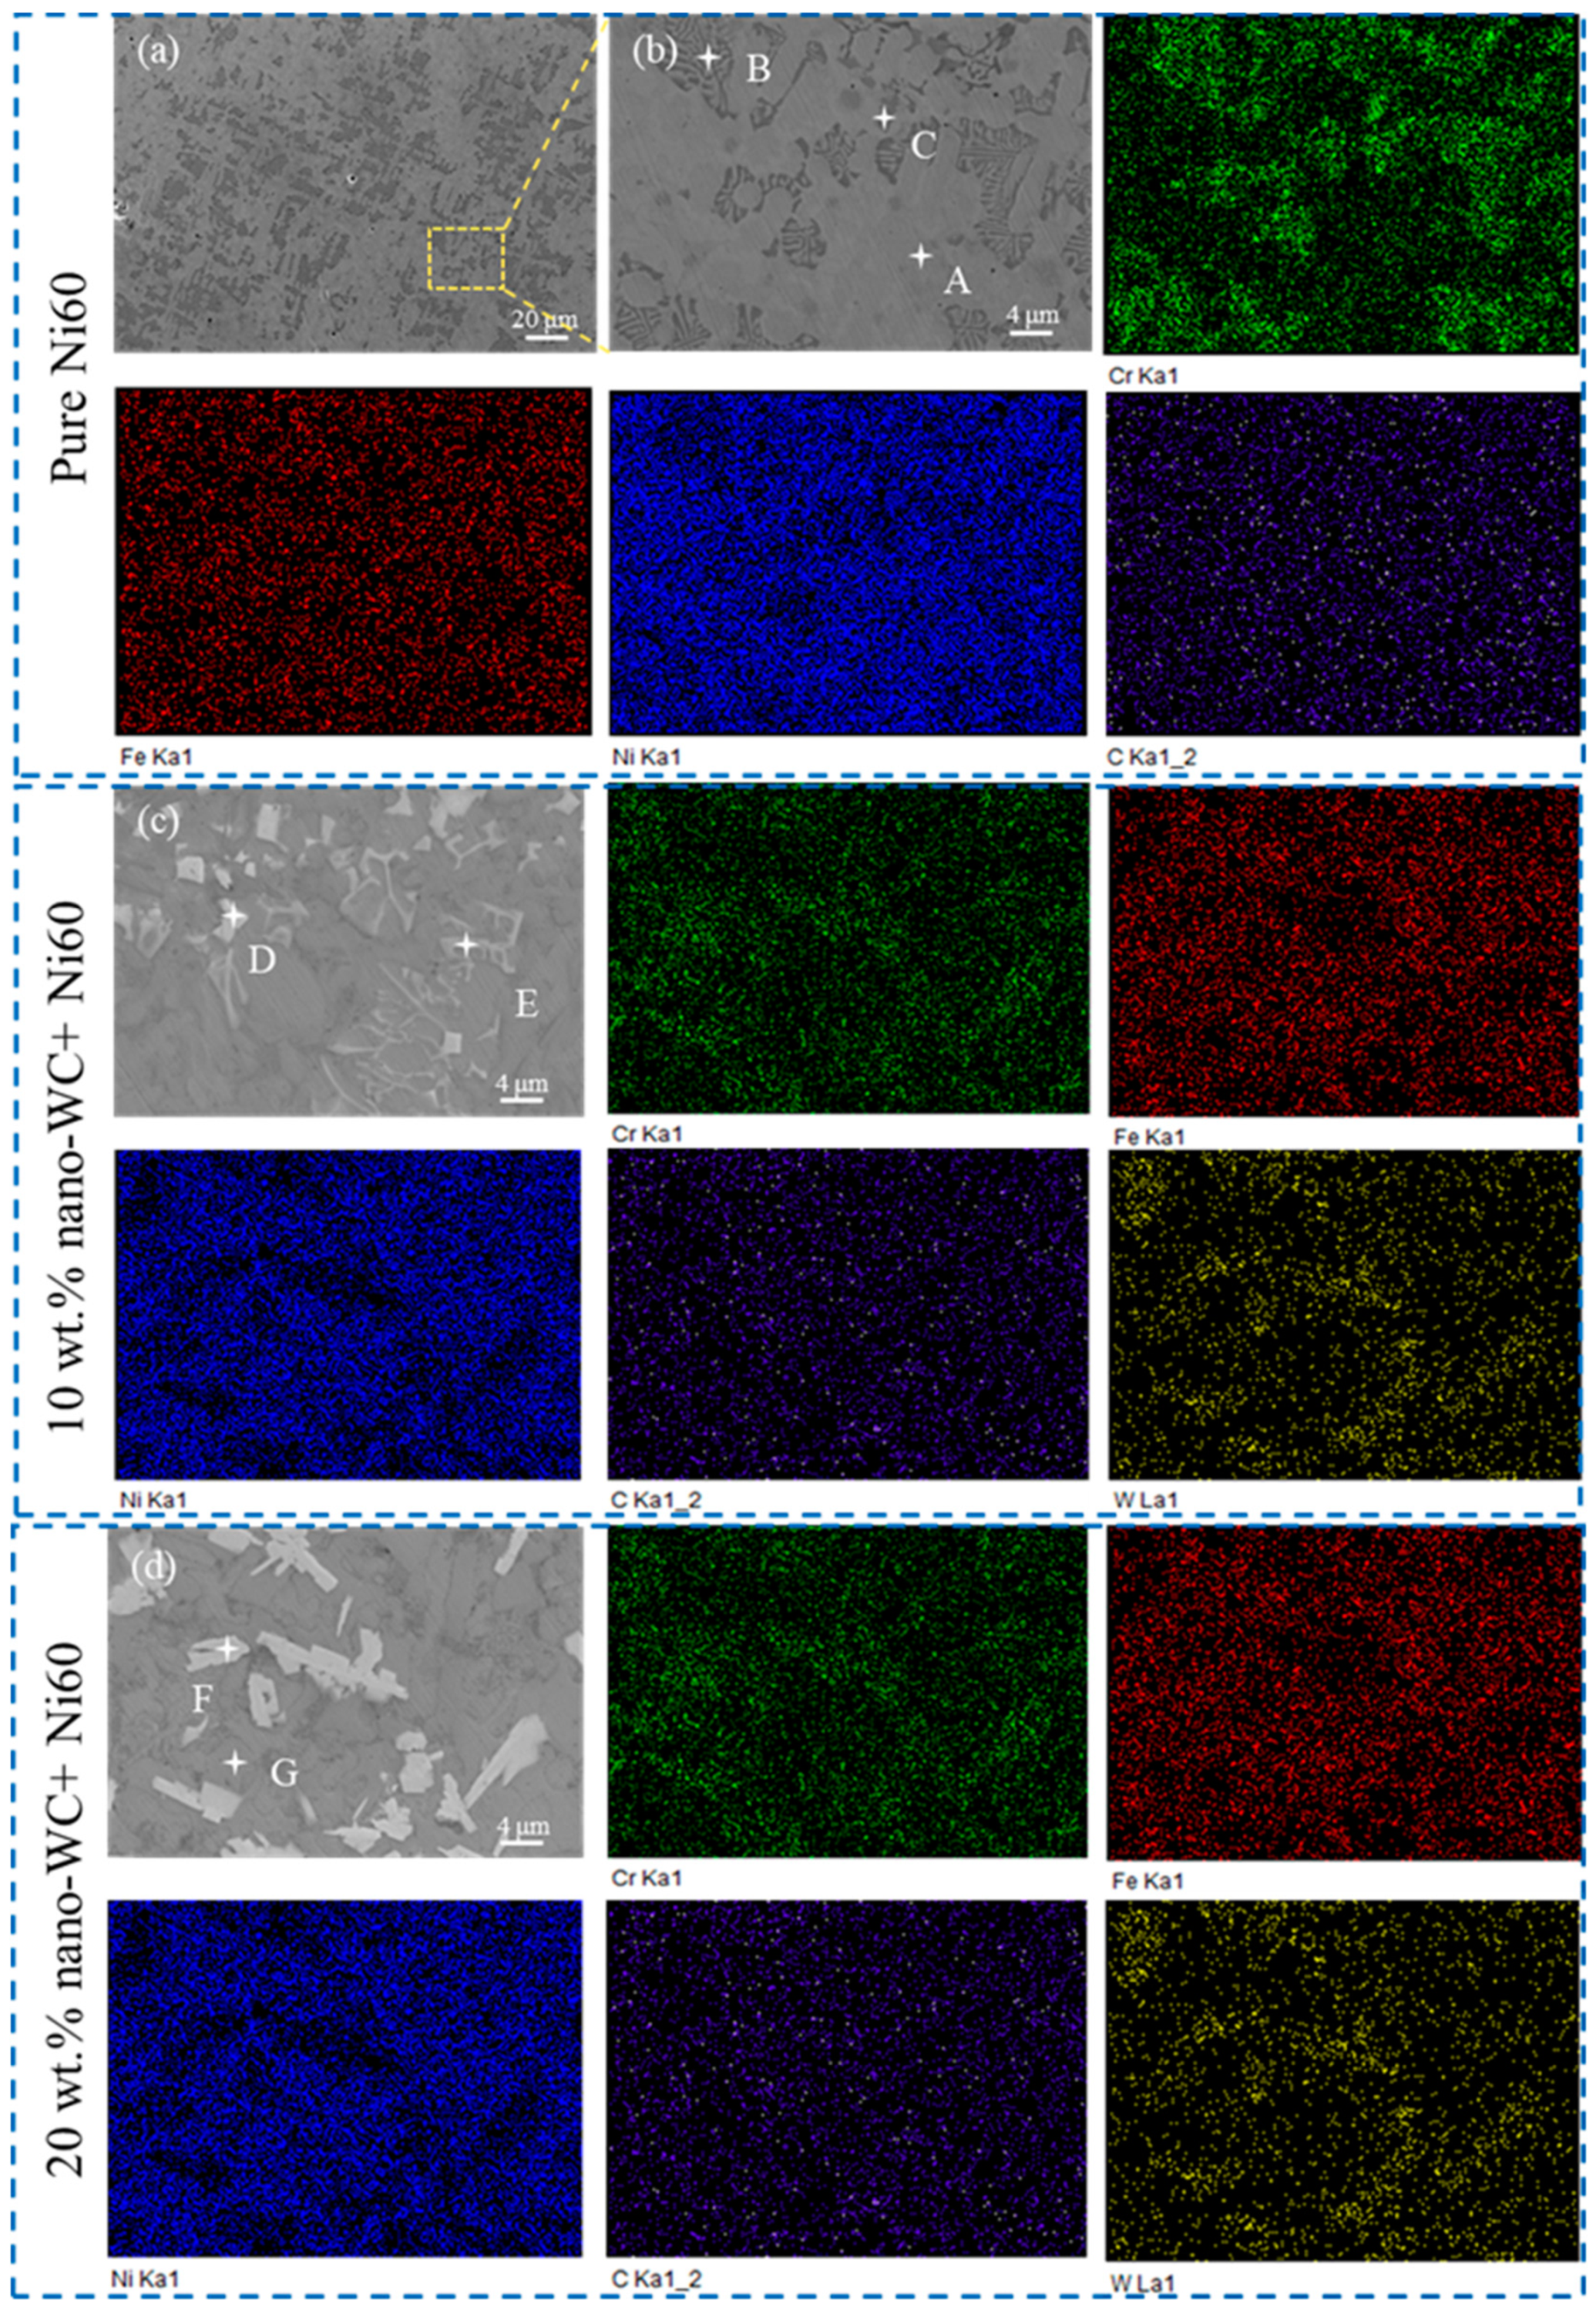
The microstructure observed by SEM and elemental distribution obtained by EDS of the pure Ni60 coating and the composite coating with nano-WC added to Ni60 are depicted in
Figure 2. As can be seen from
Figure 2a,b, the pure Ni60 is mainly composed of the matrix phase (location A), the lamellar eutectic structure located between dendrites (location B), and some scattered dark grey polygon blocks (location C). Analysis of the elemental distribution reveals that the lamellar eutectic structure exhibits high levels of Cr while being deficient in Ni. The microstructure and elemental distribution of the composite coating with 10 wt.% nano-WC added to Ni60 are presented in
Figure 2c. Compared to
Figure 2b, a notable distinction in
Figure 2c is observed, wherein the lamellar eutectic structure situated amidst dendrites transforms into rod and block precipitates upon the addition of 10 wt.% nano-WC to Ni60, with these precipitates exhibiting an abundance of Cr and W. With the content of nano-WC increased to 20 wt.%, the microstructure and elemental distribution of the composite coating are depicted in
Figure 2d. Compared to the microstructure of the sample to which 10 wt.% nano-WC is added shown in
Figure 2c,d, the 20 wt.% sample exhibits a reduced presence of rod-shaped precipitates while showcasing an augmented occurrence of block-shaped precipitates between dendrites. Even when certain rod-shaped precipitates are observed, their dimensions appear coarser. Regarding elemental distribution, these precipitates are enriched in Cr and W, with higher W content detected in block-shaped precipitates compared to rod-shaped ones.
To compare the composition differences of the aforementioned microstructures, EDS analysis was conducted on the designated points. The results are presented in
Table 5. It is important to note that light elements such as B and C were excluded from the analysis due to inherent inaccuracies in their EDS measurements. Point A is located in the matrix dendrite stem of the pure Ni60 coating, with a Ni content of 71.12 wt.% and Cr content of 13.92 wt.%. B contains 57.83 wt.% Ni and 28.94 wt.% Cr; this means the lamellar eutectic structure contains a Cr-enriched component phase, and the EBSD and TEM results below show that this phase is a carbide named M
23C
6, where M mainly represents the Cr element. The dark grey block phase marked by point C exhibits a higher Cr content (67.81 wt.%) compared to points A and B, which can be identified as CrB based on EBSD results. Points D, E, and F correspond to white grey block and rod phases observed in composite coatings with nano-WC additions at concentrations of 10 wt.% and 20 wt.%. Notably, these points exhibit equivalent levels of Cr content and can be also identified as M
23C
6 carbides rich in both Cr and W according to corroborating evidence from the EBSD analysis below. Moreover, it can be deduced that with the increase in Cr and W content, the rod M
23C
6 carbides tend to change into blocks.
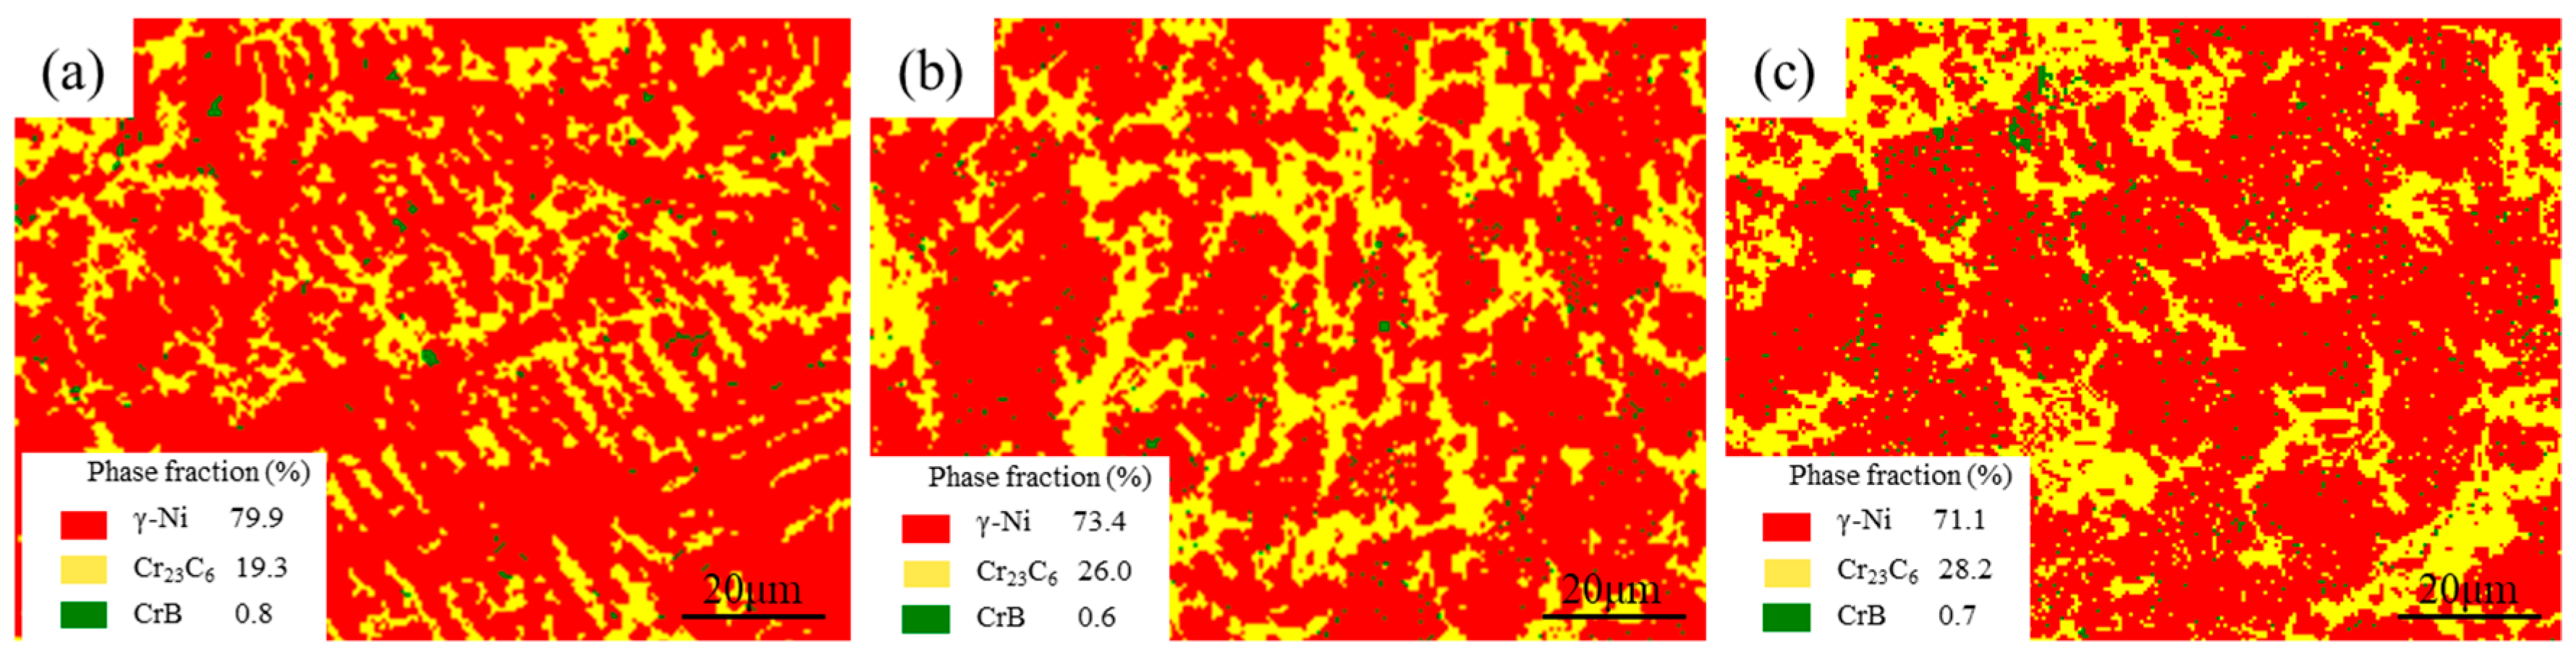
To support the above inference about the phases, phases calibration and distribution detection were conducted by EBSD; the results shown in
Figure 3. In particular,
Figure 3a–c correspond to the laser coatings with 0 wt.% (pure Ni60), 10 wt.%, and 20 wt.% nano-WC addition, respectively. In these figures, the red phase represents γ, yellow corresponds to Cr
23C
6, and green indicates CrB phase. The morphology and distribution of these phases revealed by EBSD confirm the previously mentioned inference regarding the phase composition. It can be seen from
Figure 3 that the increase in nano-WC addition leads to a gradual decrease in the content of matrix phase γ in the coating from 79.9% to 71.7%, and its grains gradually change from dendritic to equiaxed. At the same time, the content of M
23C
6 type carbide gradually increases from 19.3% to 28.2%, and its shape gradually transforms from lamellar to rod and block. Furthermore, in the Ni60/nano-WC composite coating, the size of CrB particles is obviously reduced, and the distribution is more dispersed and uniform.
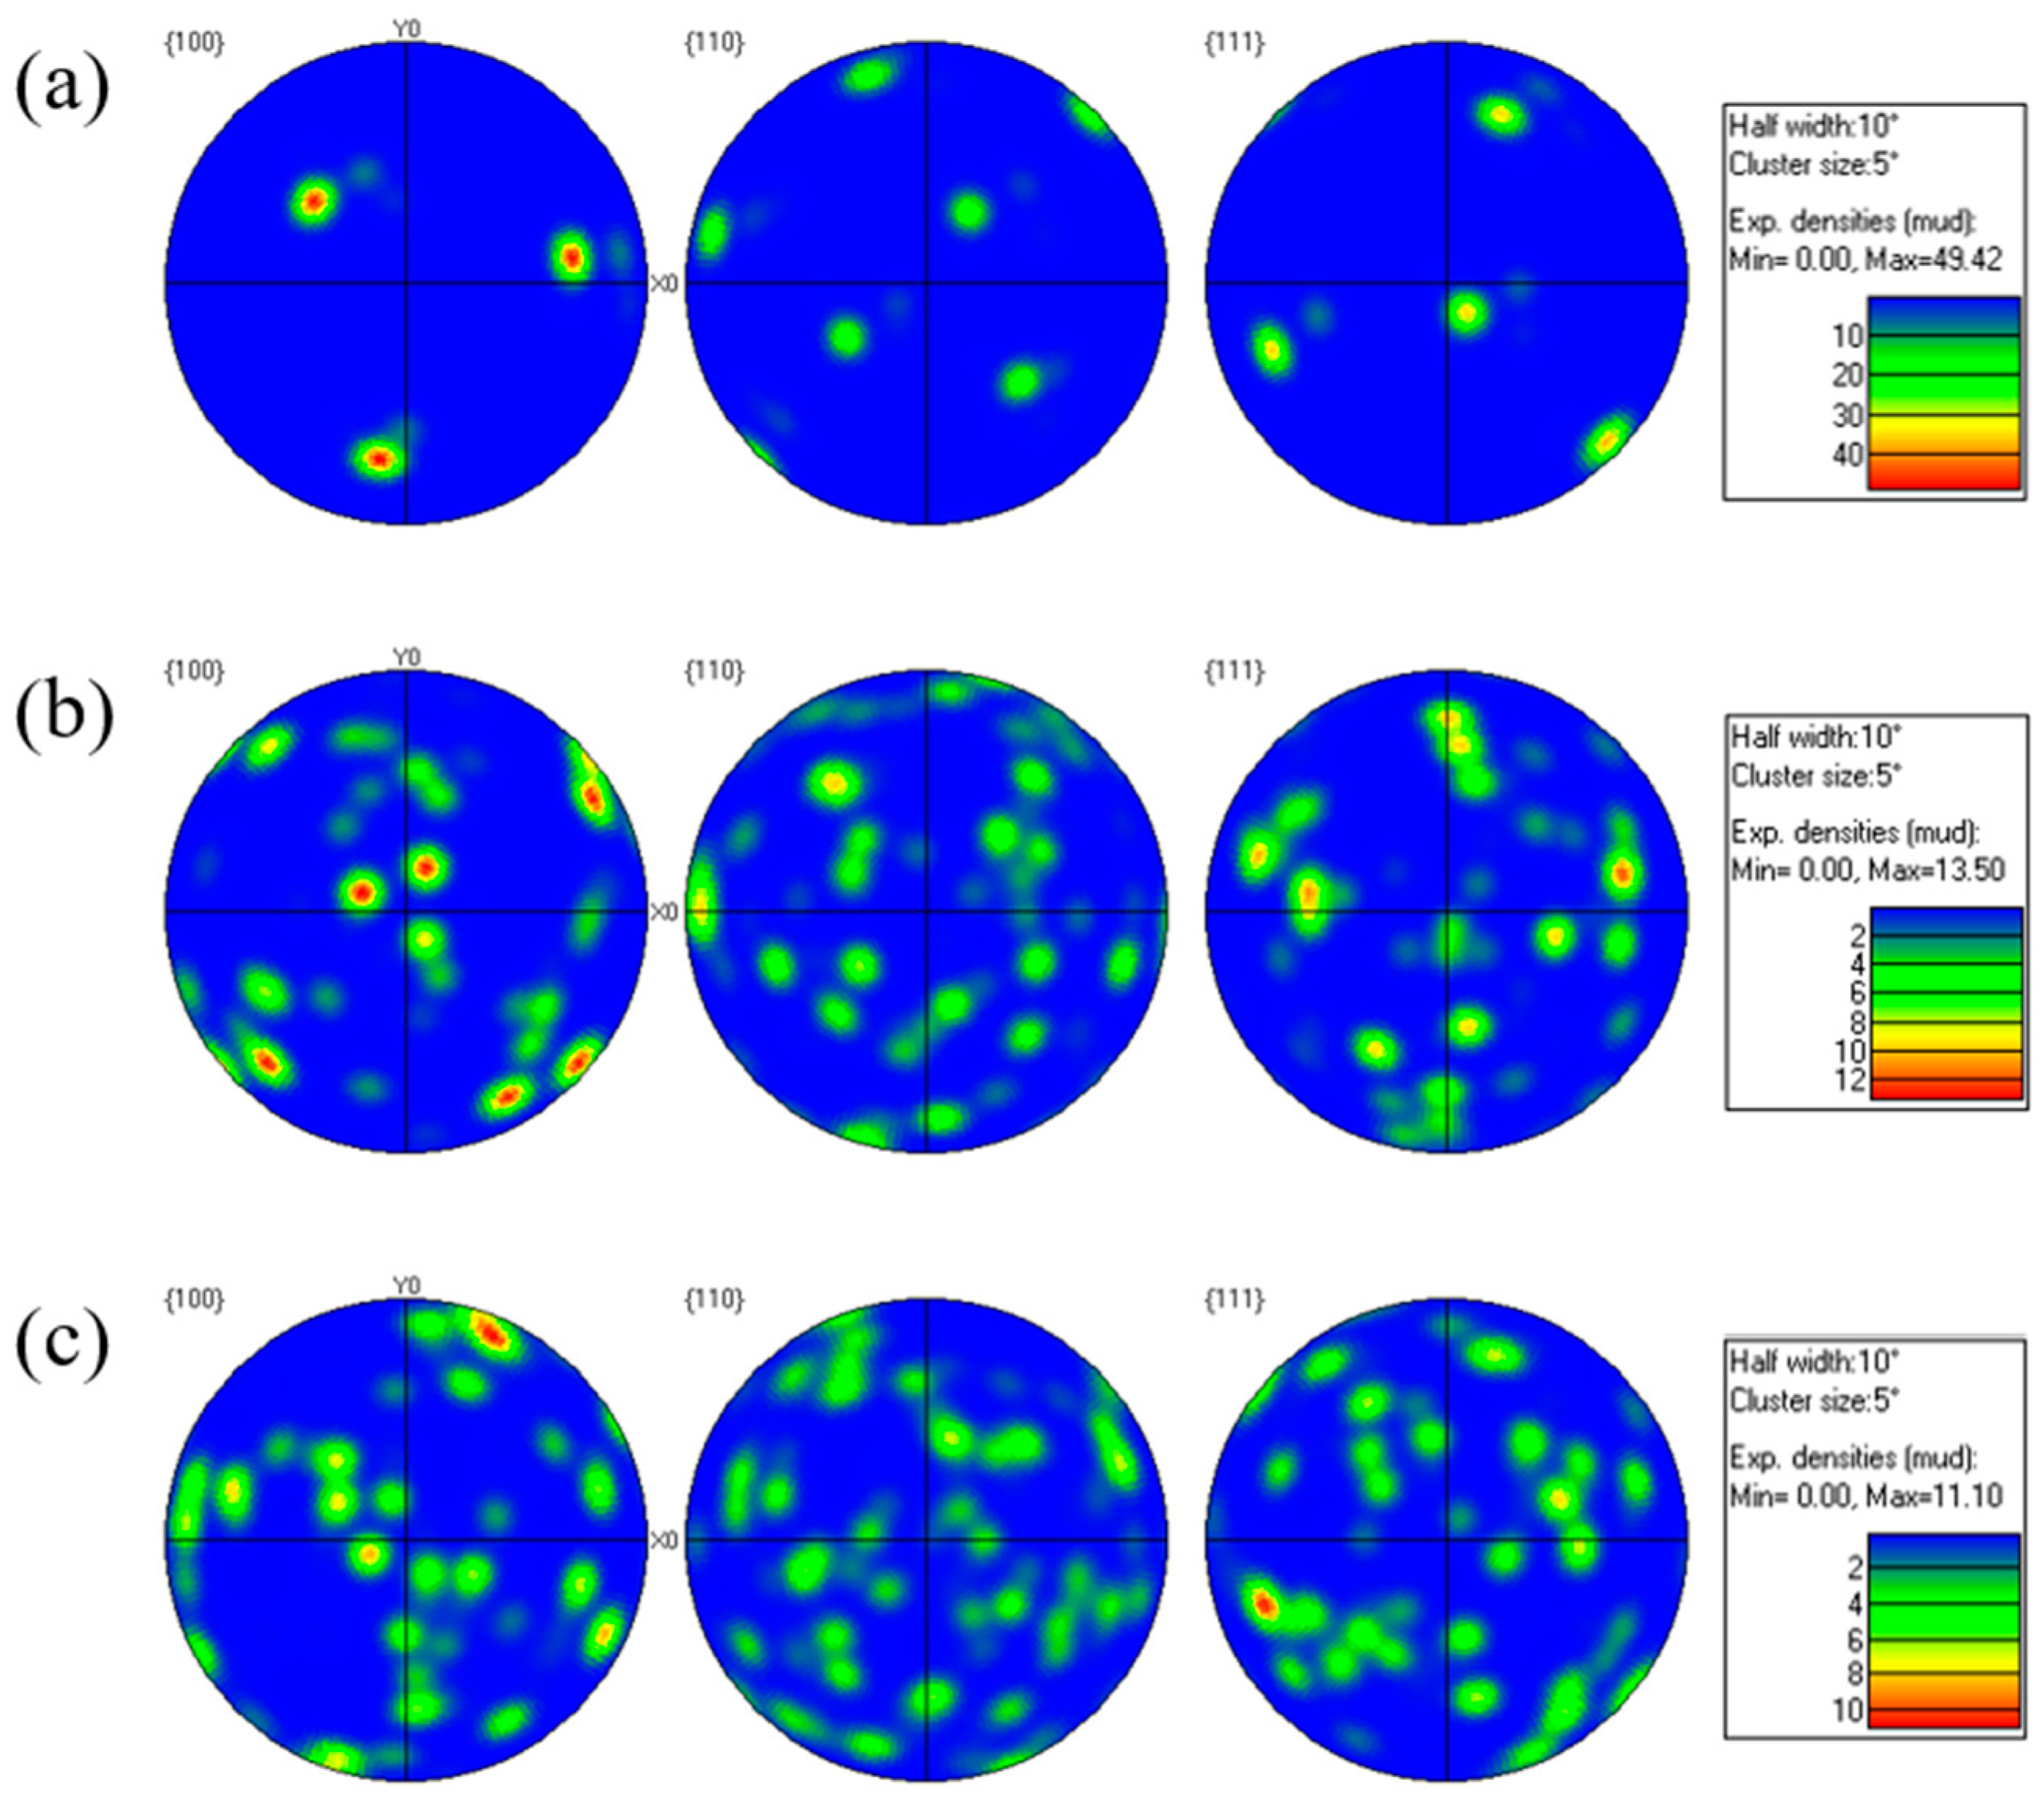
The pole figures of matrix γ are presented in
Figure 4, depicting the coatings with 0 wt.%, 10 wt.%, and 20% nano-WC additions as shown in
Figure 4a,
Figure 4b, and
Figure 4c, respectively. The results indicate a decrease in the maximum texture densities of matrix γ from 49.42 to 11.10 with an increasing amount of nano-WC added. The maximum of the texture densities serves as a credible index to describe the texture strength, and if this index exceeds 1, it signifies the presence of texture within the material. Therefore, it can be inferred that the incorporation of nano-WC reduces the strength of the coating’s texture or equivalently deteriorates the growth orientation of matrix γ grains. The increase in nano-WC addition leads to a reduction in the texture strength of γ crystal and an enhancement in grain orientation diversity within the same test area, thereby providing evidence for a decrease in grain size.
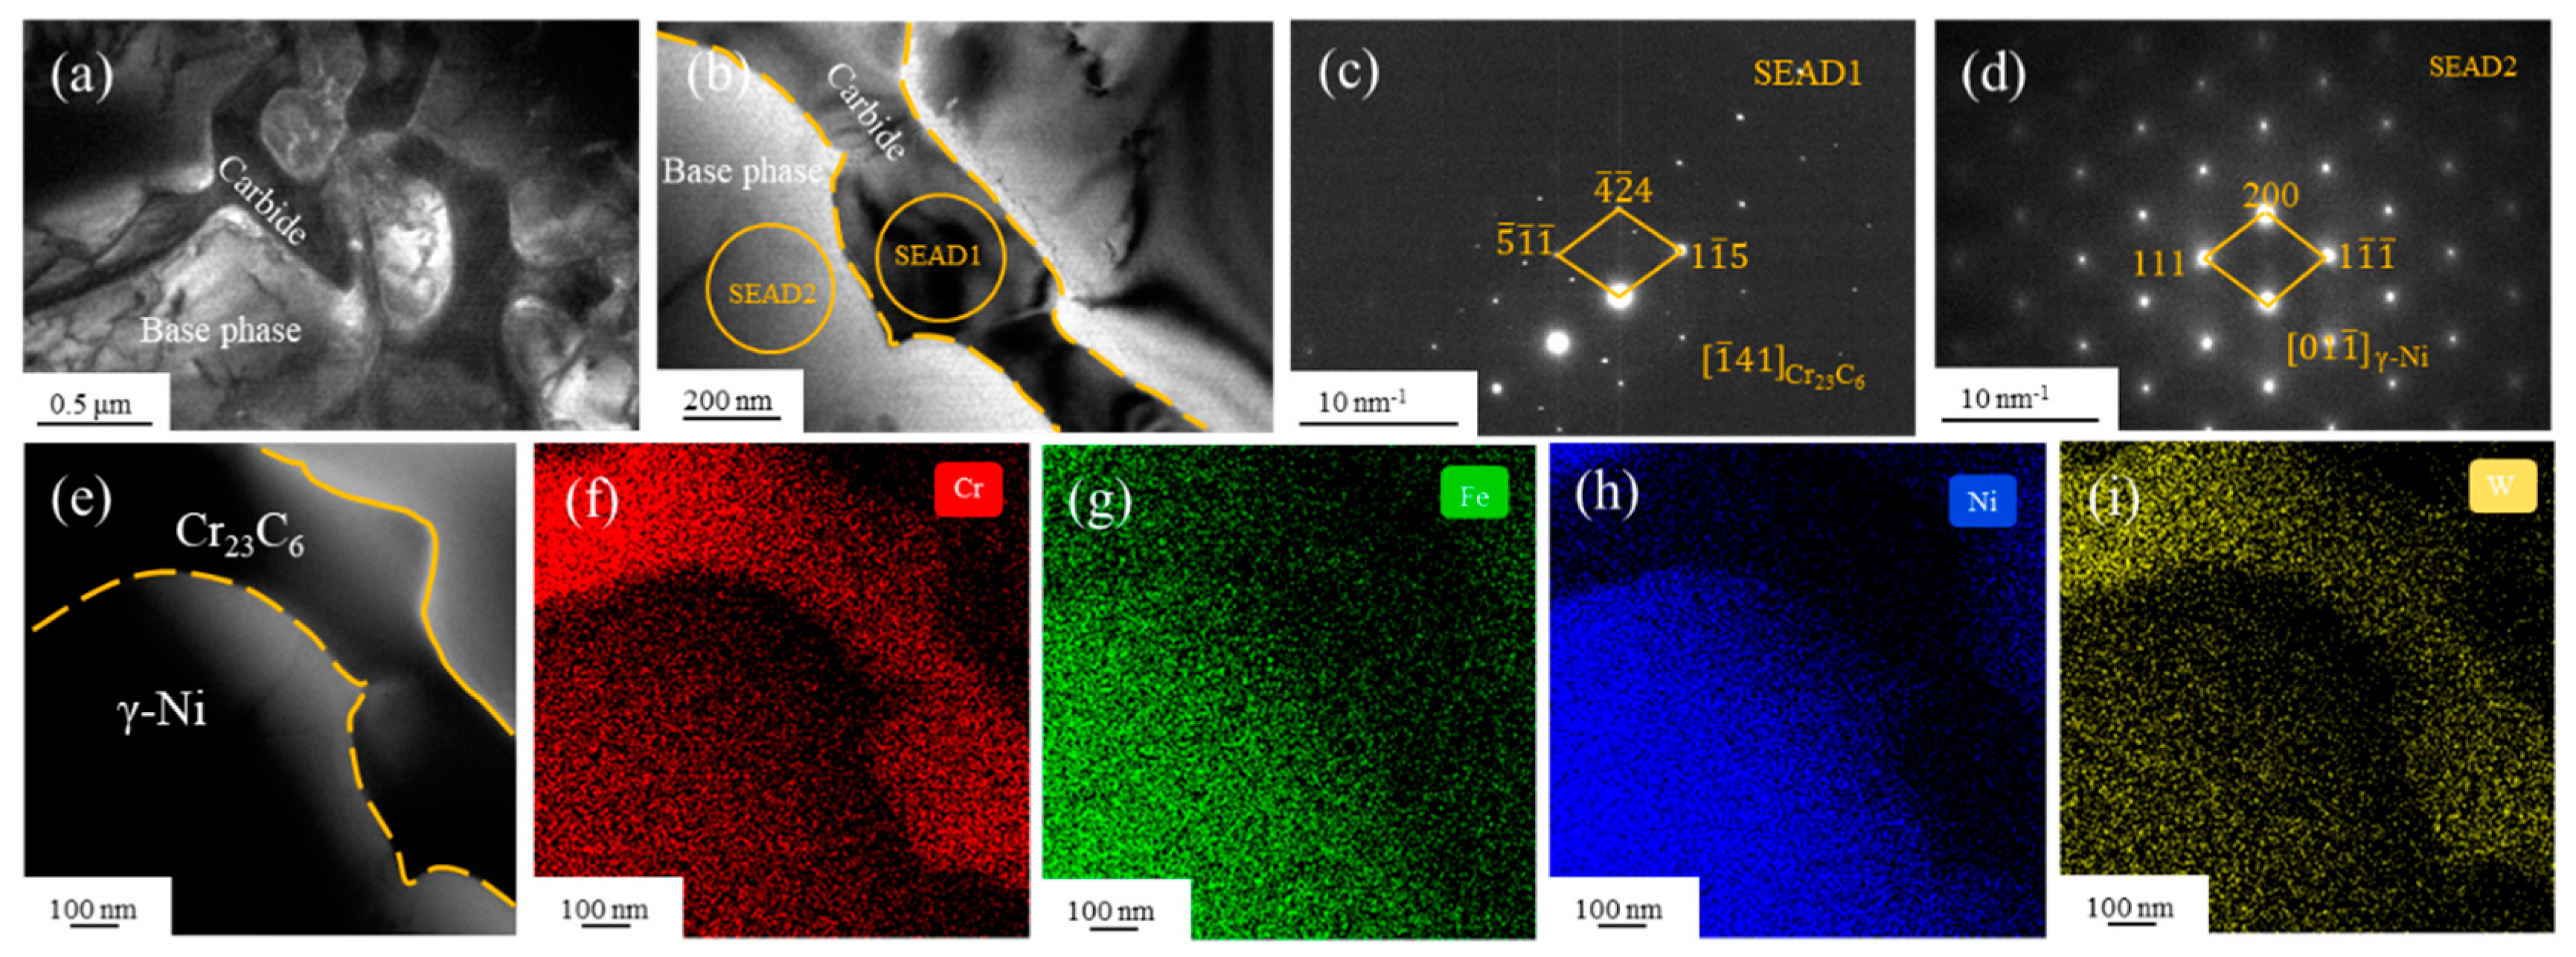
For a more in-depth analysis of phase structure and composition when nano-WC is added, the microstructure of Ni60 + 20 wt.% nano-WC coating was analyzed by TEM; the results can be seen in
Figure 5.
Figure 5a,b show the bright field (BF) images at different magnification scales,
Figure 5c,d show the selected area electron diffraction (SAED) results of the marked zones in
Figure 5b,
Figure 5e shows the zone selected for EDS analysis, and the EDS results are shown in
Figure 5f–i. The SAED results further confirmed that the abundant rod- or block-shaped precipitates in the texture are M
23C
6 carbides, which are rich in Cr and W.
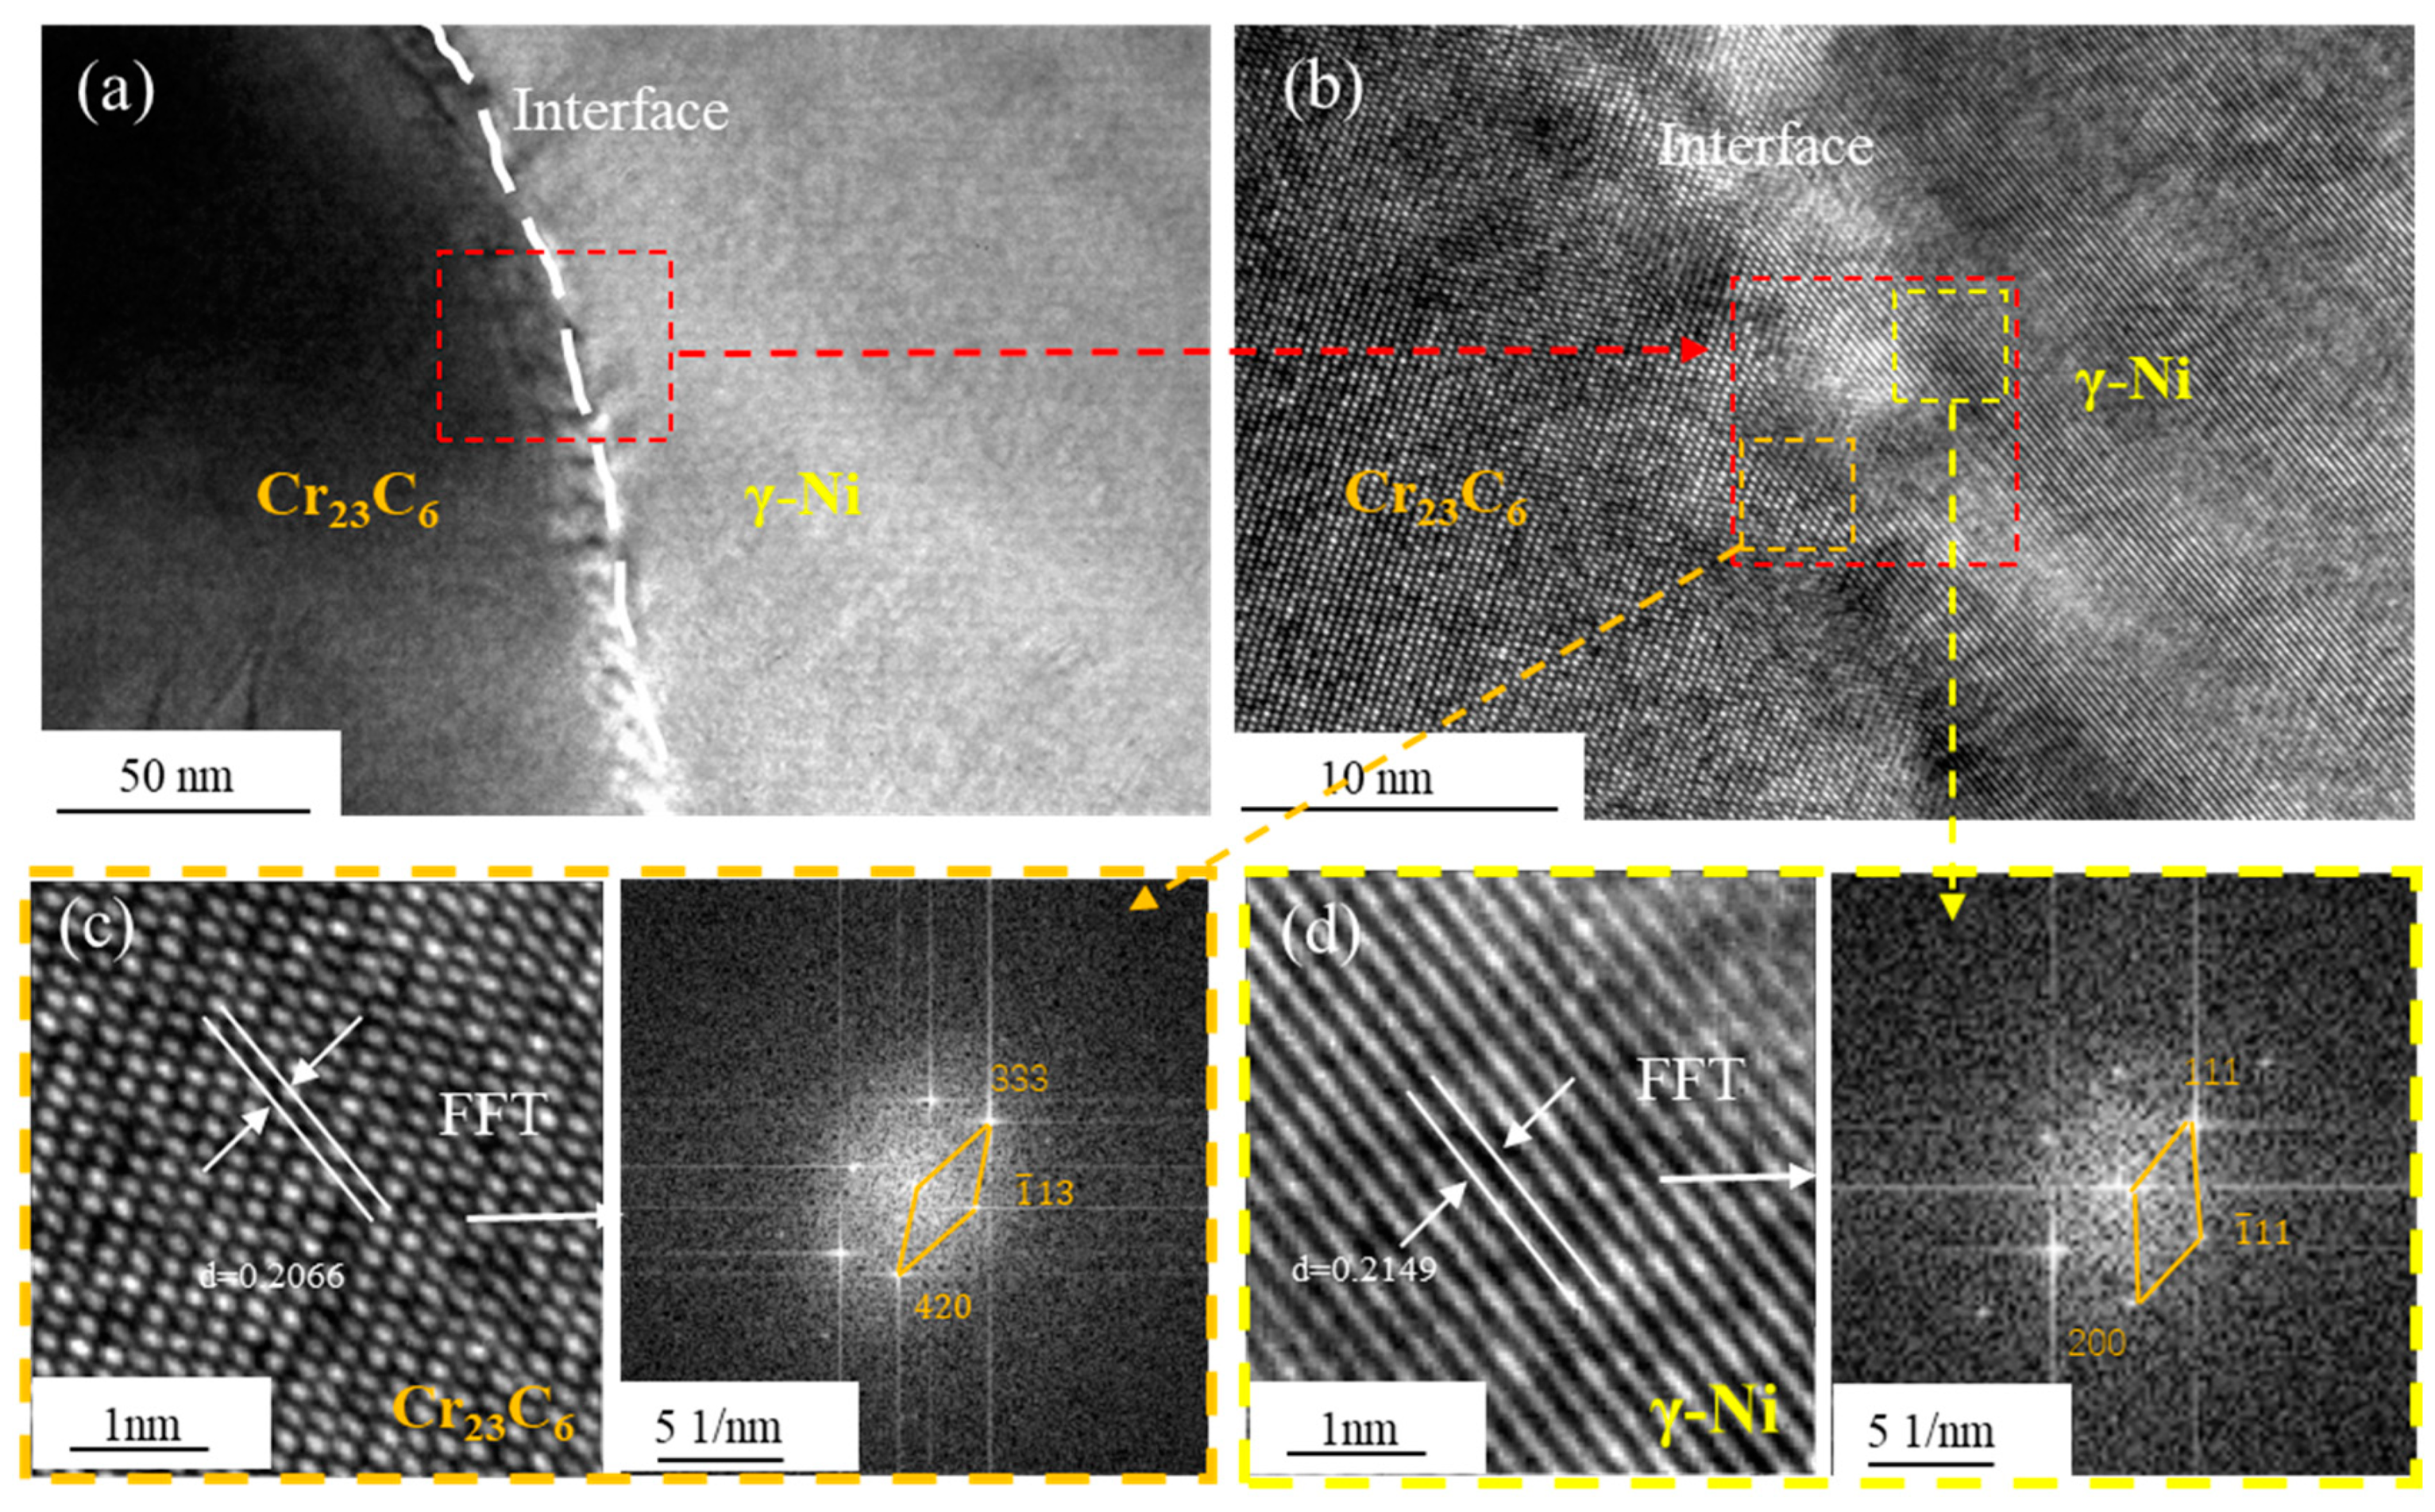
The high-resolution analysis results at the interface between M
23C
6 and γ-Ni are shown in
Figure 6.
Figure 6a shows that there is a clear boundary between M
23C
6 and the γ-Ni interface, and the microstructure on both sides is different.
Figure 6b shows the high-resolution amplification map at the interface between M
23C
6 and γ-Ni, and clear lattice fringes are observed at the interface and on both sides. The Fourier transform (FFT) of γ-Ni (
Figure 6c) shows that the lattice fringes are mainly along the [0
1] γ-Ni crystal axis and the inverse Fourier transform (IFFT) shows that the crystal plane spacing d
(111) = 0.2149 nm. The FFT of M
23C
6 (
Figure 6d) shows that the lattice fringes are mainly along the [1
1] M
23C
6 crystal axis and the IFFT shows that the interplanar spacing d
(333) = 0.2066 nm. It is found that there is a certain phase relationship between M
23C
6 and γ-Ni, in which (111)
γ-Ni∥(333)
Cr23C6. The interface strength between M
23C
6 and γ-Ni is related to the mismatch caused by the difference in lattice constants [
13]. According to the results of the IFFT, the mismatch between (111)
γ-Ni and (333)
M23C6 was calculated by the following formula:
where
dα is the interplanar spacing of (111)
γ-Ni, and
dβ is the interplanar spacing of (333)
M23C6. The calculated mismatch
is 3.9%, which is less than 6%, indicating strong interface strength between M
23C
6 and γ-Ni. This is also one of the reasons why carbides can be precipitated in large quantities. Furthermore, this strong interface strength makes it difficult for the M
23C
6 to separate from the matrix under stress, which is conducive to reducing the cracking sensitivity of the cladding layer. Moreover, the lower mismatch
means that the internal stress caused by M
23C
6 precipitation is lower, which is also conducive to crack suppression.
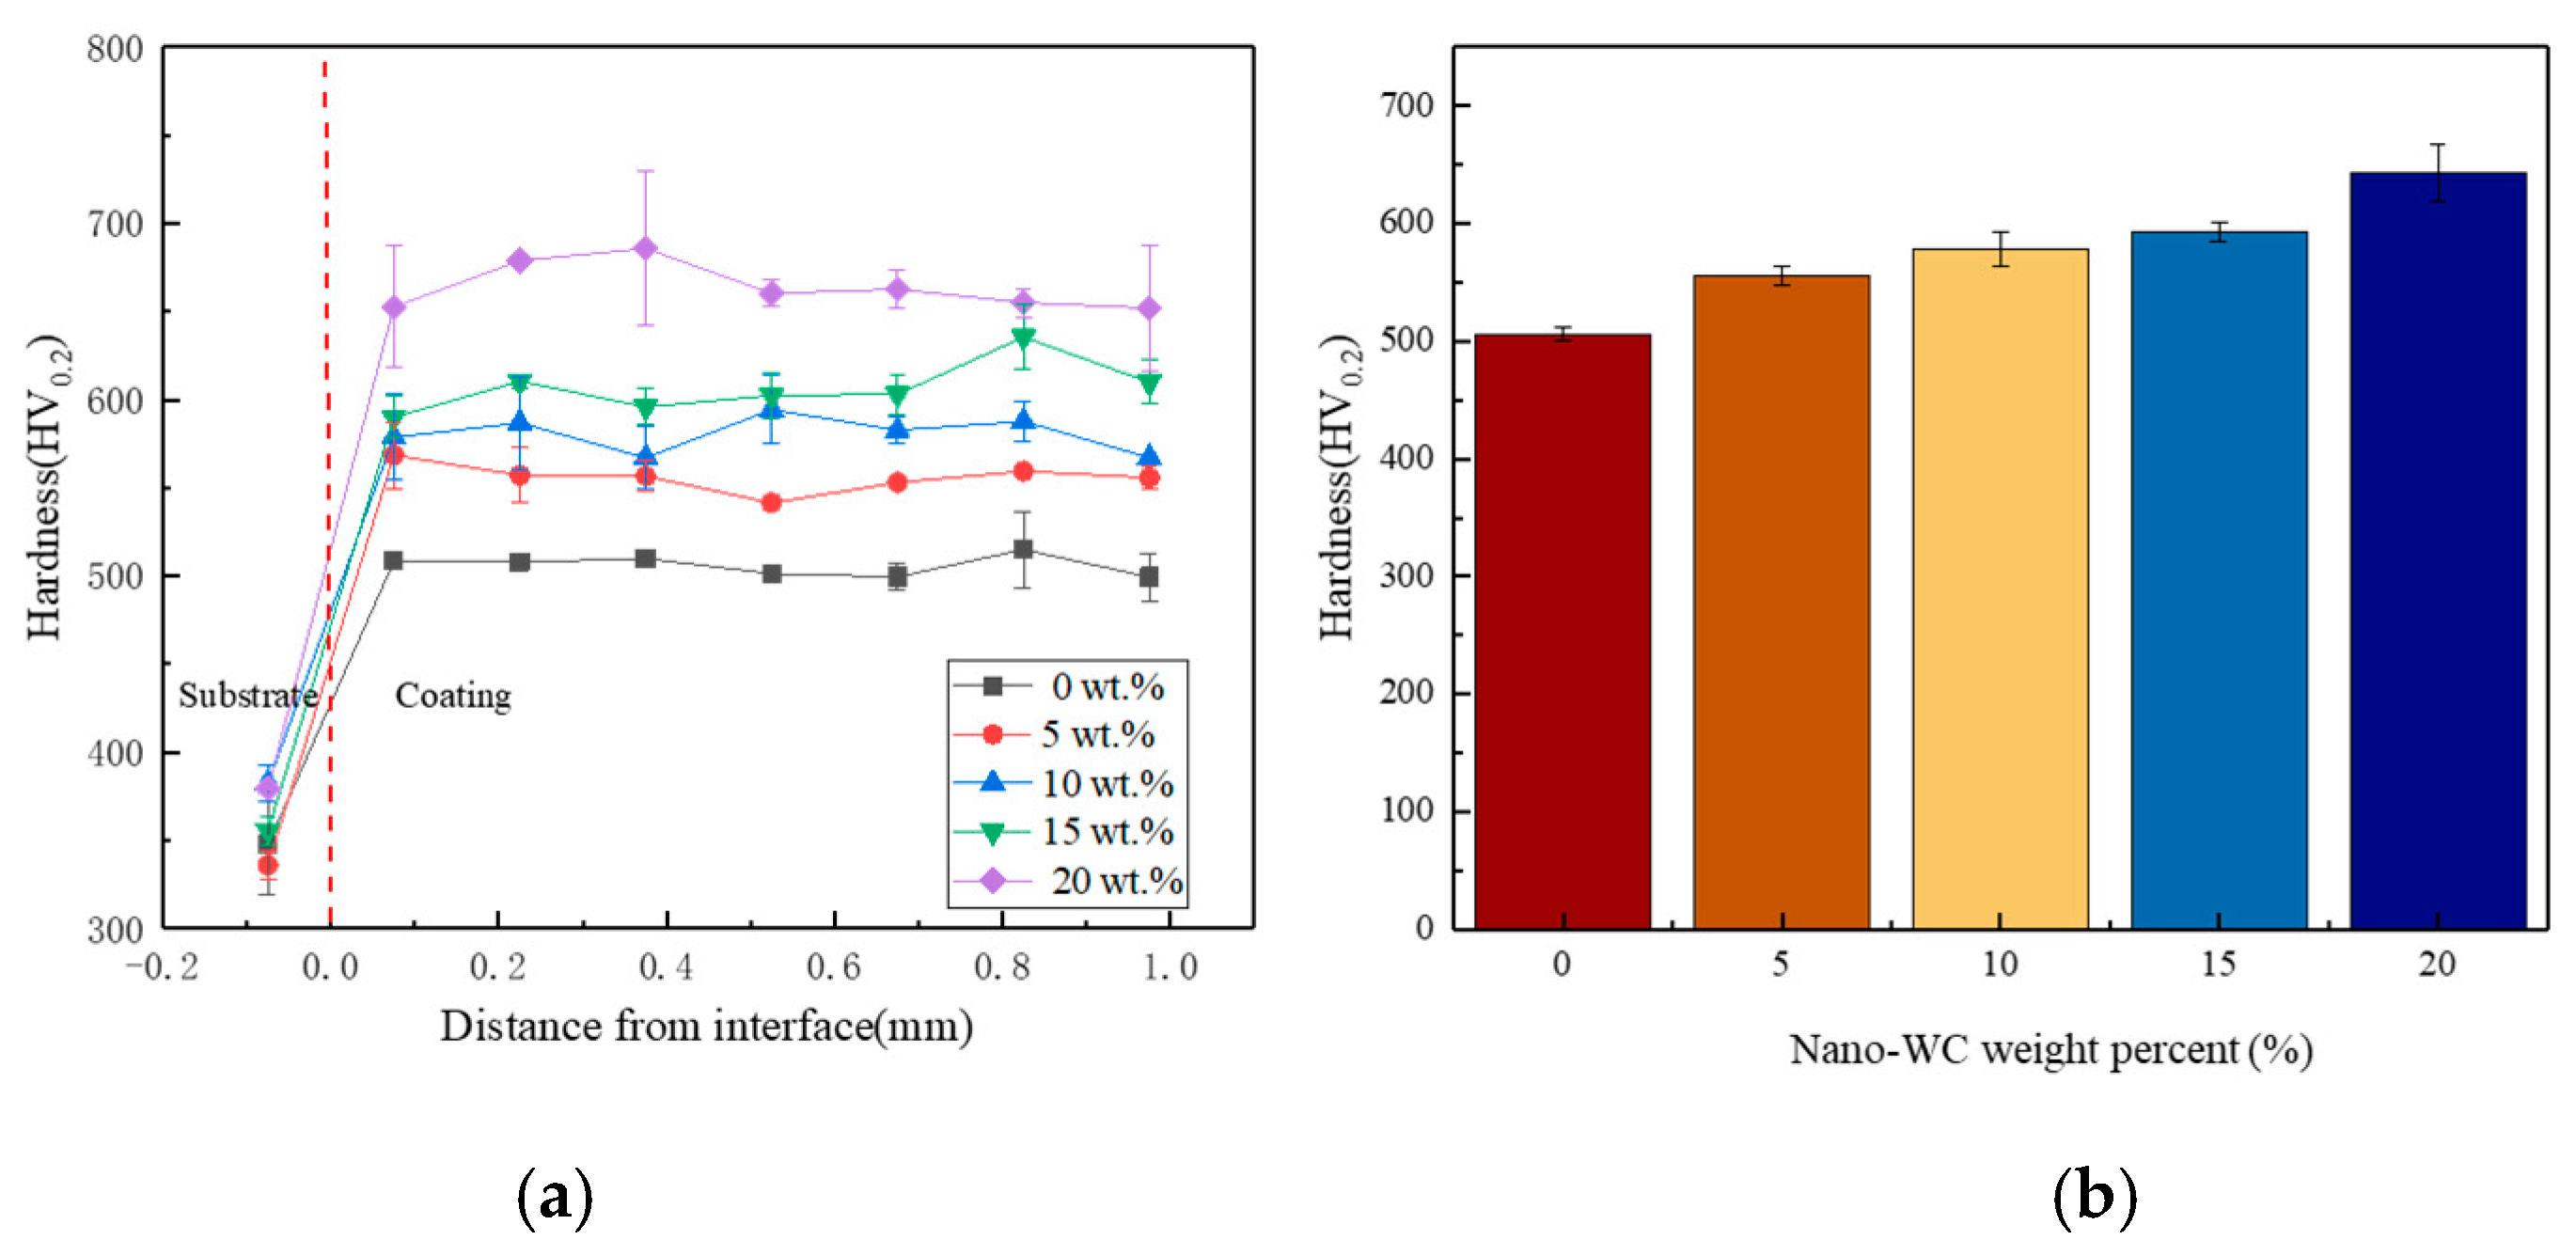
3.2. Microhardness
Figure 7 shows the cross-sectional microhardness distribution of coatings with different amounts of nano-WC added. It can be seen from
Figure 7a that the hardness quickly increases from 350 HV
0.2 of the matrix to 500~700 HV
0.2 of the laser claddings. This means the dilution rates of coatings on the substrate made of 17-4PH martensitic stainless steel are all very low. Moreover, the hardness curves in the coating section are relatively stable, indicating that the microstructure of the coating is relatively uniform at the macro level.
Figure 7b is the average microhardness of the coatings with different contents. The microhardness of the coatings gradually increases with an increase in nano-WC content. For pure Ni60 coating (nano-WC weight percent is 0), the average hardness of the coating is measured at 506 HV
0.2. With a 5 wt.% increase in nano-WC content, the average hardness of the coating reaches 556 HV
0.2, representing a relative increase of 9.9%. Further increasing the nano-WC content to 10 wt.% results in an average hardness of the coating of 578 HV
0.2, showing a relative increase of 14.4%. A subsequent rise in nano-WC content to 15 wt.% leads to an average microhardness value for the coating of 593 HV
0.2, demonstrating a relative increase of approximately 17.3%. Finally, when nano-WC reaches a 20 wt.% content, the average microhardness of the coating reaches 643 HV
0.2, resulting in an increase of approximately 27.1%.
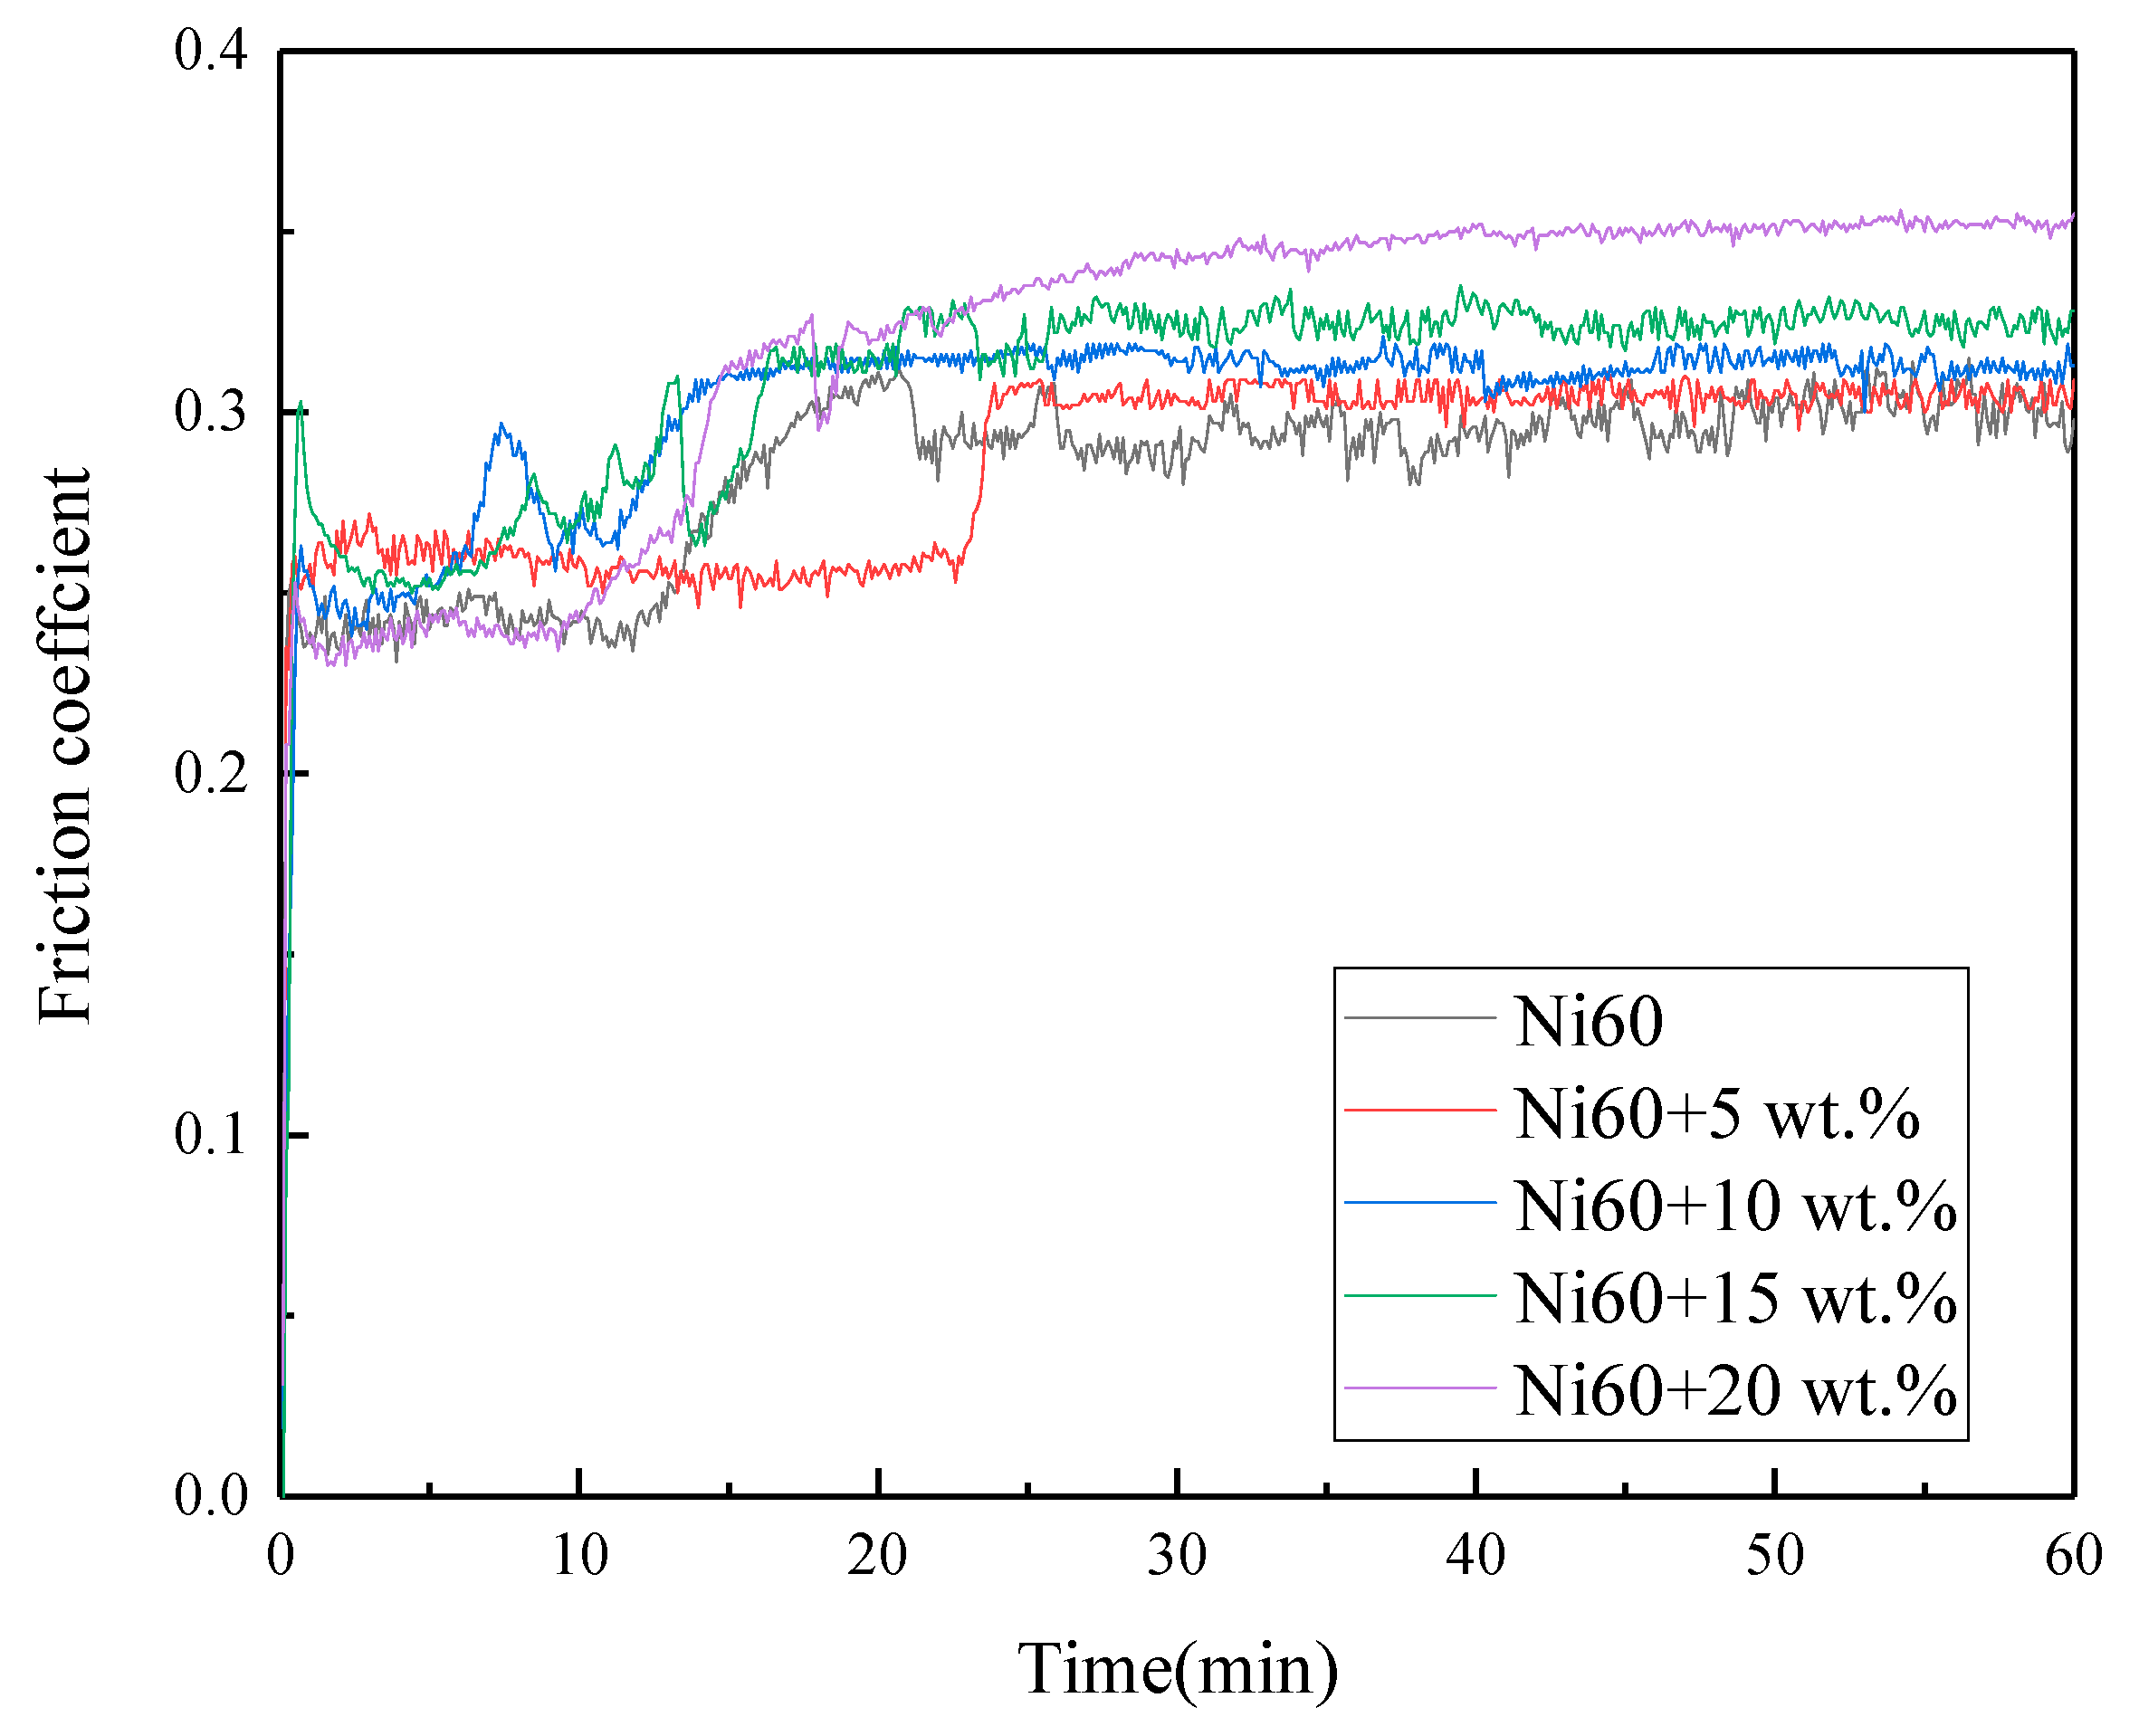
3.3. Tribological Properties
The friction and wear tests of coatings containing varying amounts of nano-WC were conducted at ambient temperature. The obtained friction coefficient curves are shown in
Figure 8, in which it is evident that the friction coefficients of various coatings undergo a running-in stage of approximately 20 min, followed by a stable wear stage for all the tests. During the running-in stage, the contact between the grinding head and sample surface exhibited significant instability, resulting in substantial fluctuations in the friction coefficient. Subsequently, a relatively stable wear stage ensued with a consistent friction coefficient. The average friction coefficient of the stable wear stage is shown in
Table 6. It can be found that the friction coefficient exhibits an increasing trend with the addition of nano-WC content. Notably, the pure Ni60 coating demonstrates the lowest friction coefficient at 0.296, while the 20 wt.% nano-WC-added composite coating exhibits the highest friction coefficient, reaching 0.348. The friction coefficient serves as a crucial indicator for evaluating the level of adhesion between the coating surface and the grinding material under dry sliding friction conditions. An increase in the friction coefficient enhances the adhesion wear resistance of the coating under such conditions. The main reason for the friction coefficient increasing is that there is a higher proportion of carbide particles in the composite coating, which increases the roughness of the friction surface. The findings of Qing Z et al. [
20] align with this perspective, suggesting that the incorporation of composite phases in the coating can exert an influence on surface roughness. Overall, the friction coefficient of pure Ni60 and nano-WC+Ni60 is in the range of 0.30–0.35, indicating that the change in friction coefficient is not significant.
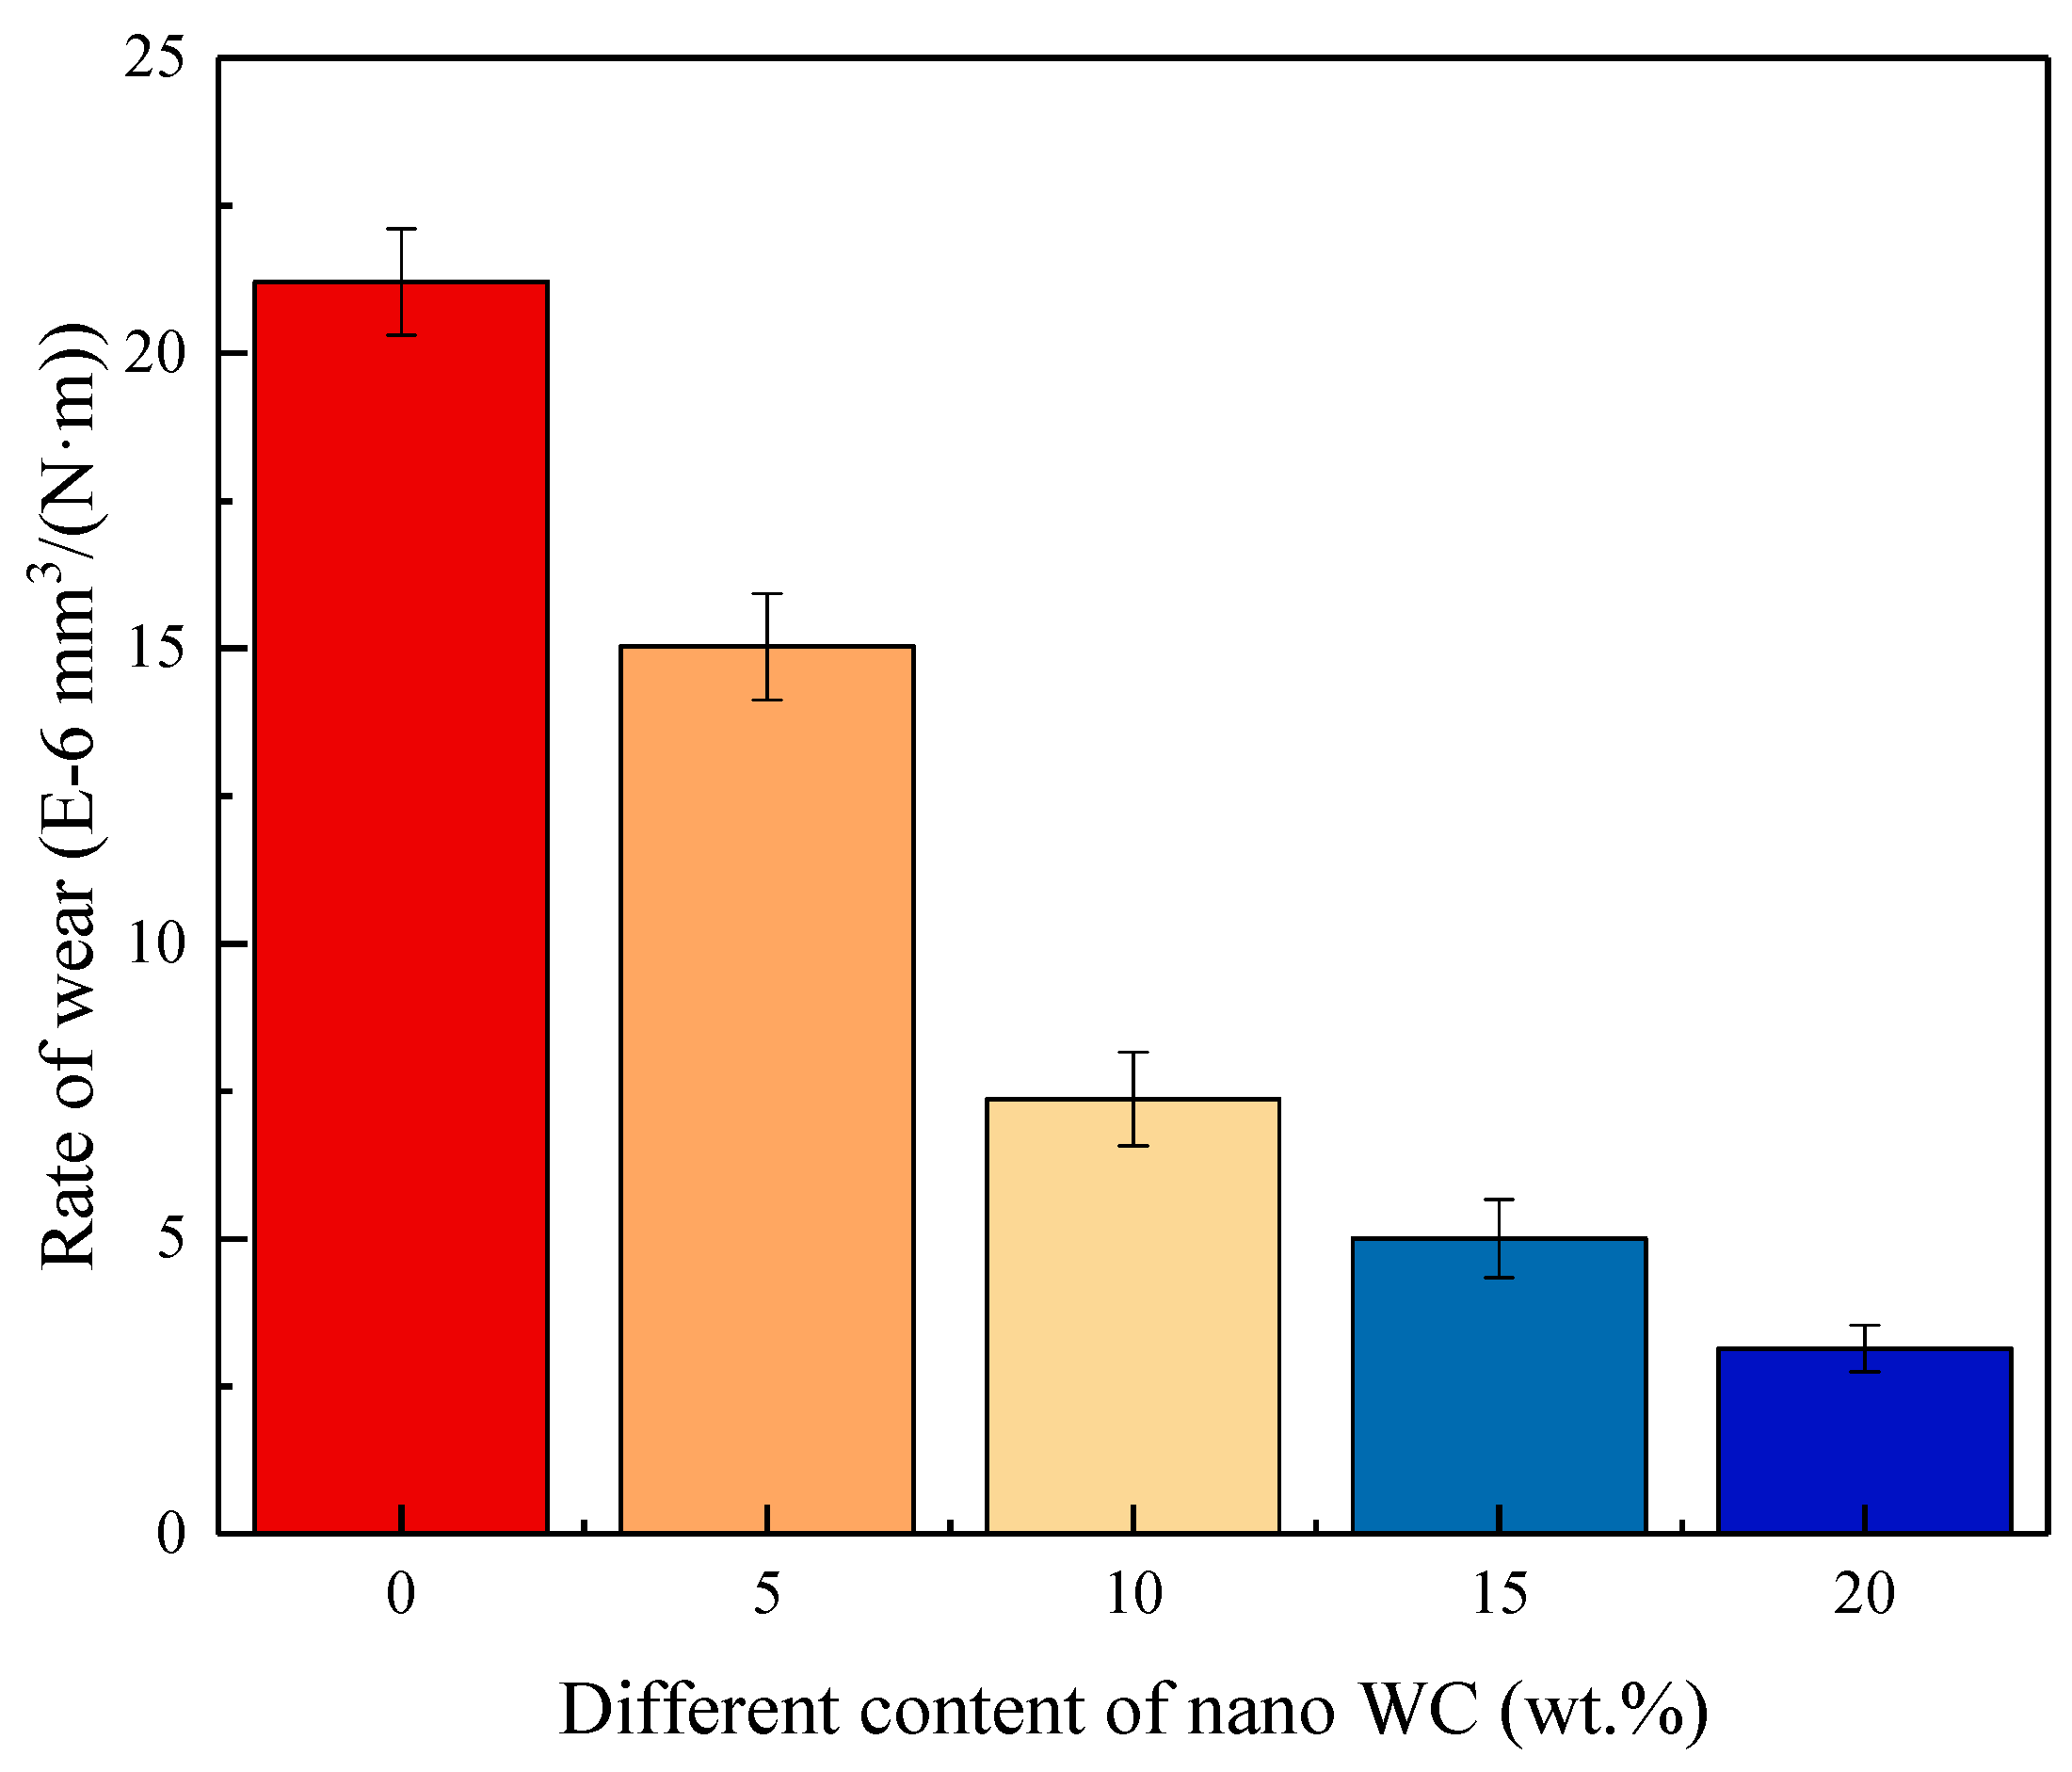
The wear rate of coatings with different nano-WC contents is shown in
Figure 9. It can be found that the wear rate of the coating gradually decreases with the increase in nano-WC content. For the pure Ni60 coating, the wear rate is the highest, reaching 2.12 × 10
−5mm
3/(N·m). With 5 wt.%, 10 wt.%, 15 wt.%, and 20 wt.% nano-WC, this decreases to 1.50× 10
−5 mm
3/(N·m), 7.37× 10
−6 mm
3/(N·m), × 10
−6 mm
3/(N·m), and × 10
−6mm
3/(N·m), respectively, which are 29.25%, 65.24%, 76.37%, and 85.19% lower than that of the pure Ni60 coating. The results indicate that the wear resistance of the coating has been significantly improved with nano-WC added. According to the microstructure analysis, it can be found that nano-WC is more likely to decompose, and the formation of M
23C
6-type carbides, which are rich in Cr and W, can be deduced. These carbides are widely distributed in the matrix and have higher hardness, thus reducing the rolling and cutting effect of the asperities on the surface of the grinding ball on the cladding coating.


