
Establishment of a Uniaxial Tensile Fracture Inversion Model Based on Fracture Surface Reconstruction (FRASTA)
Abstract
1. Introduction
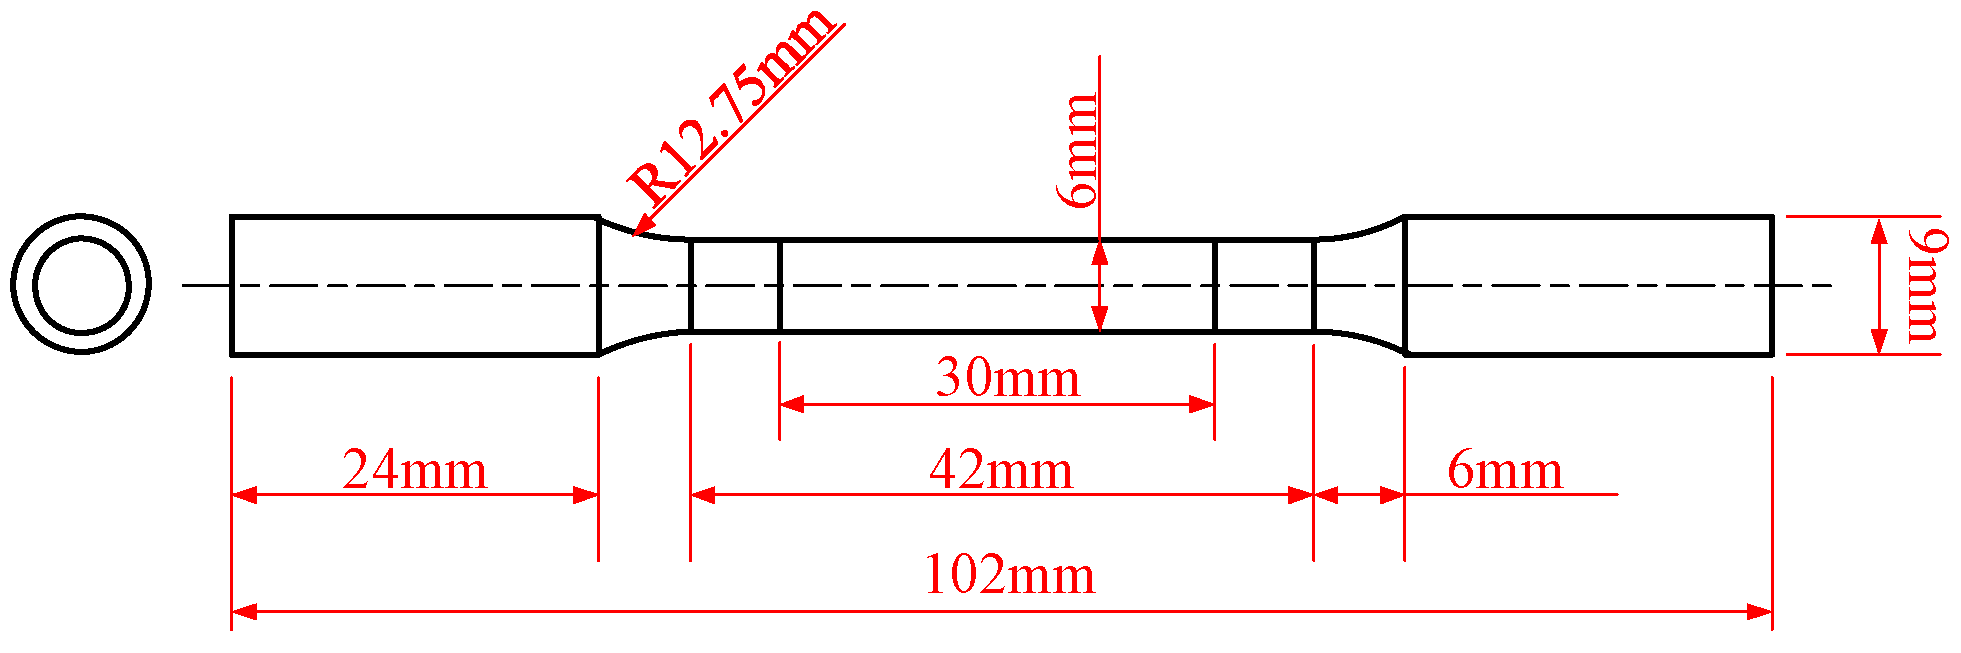
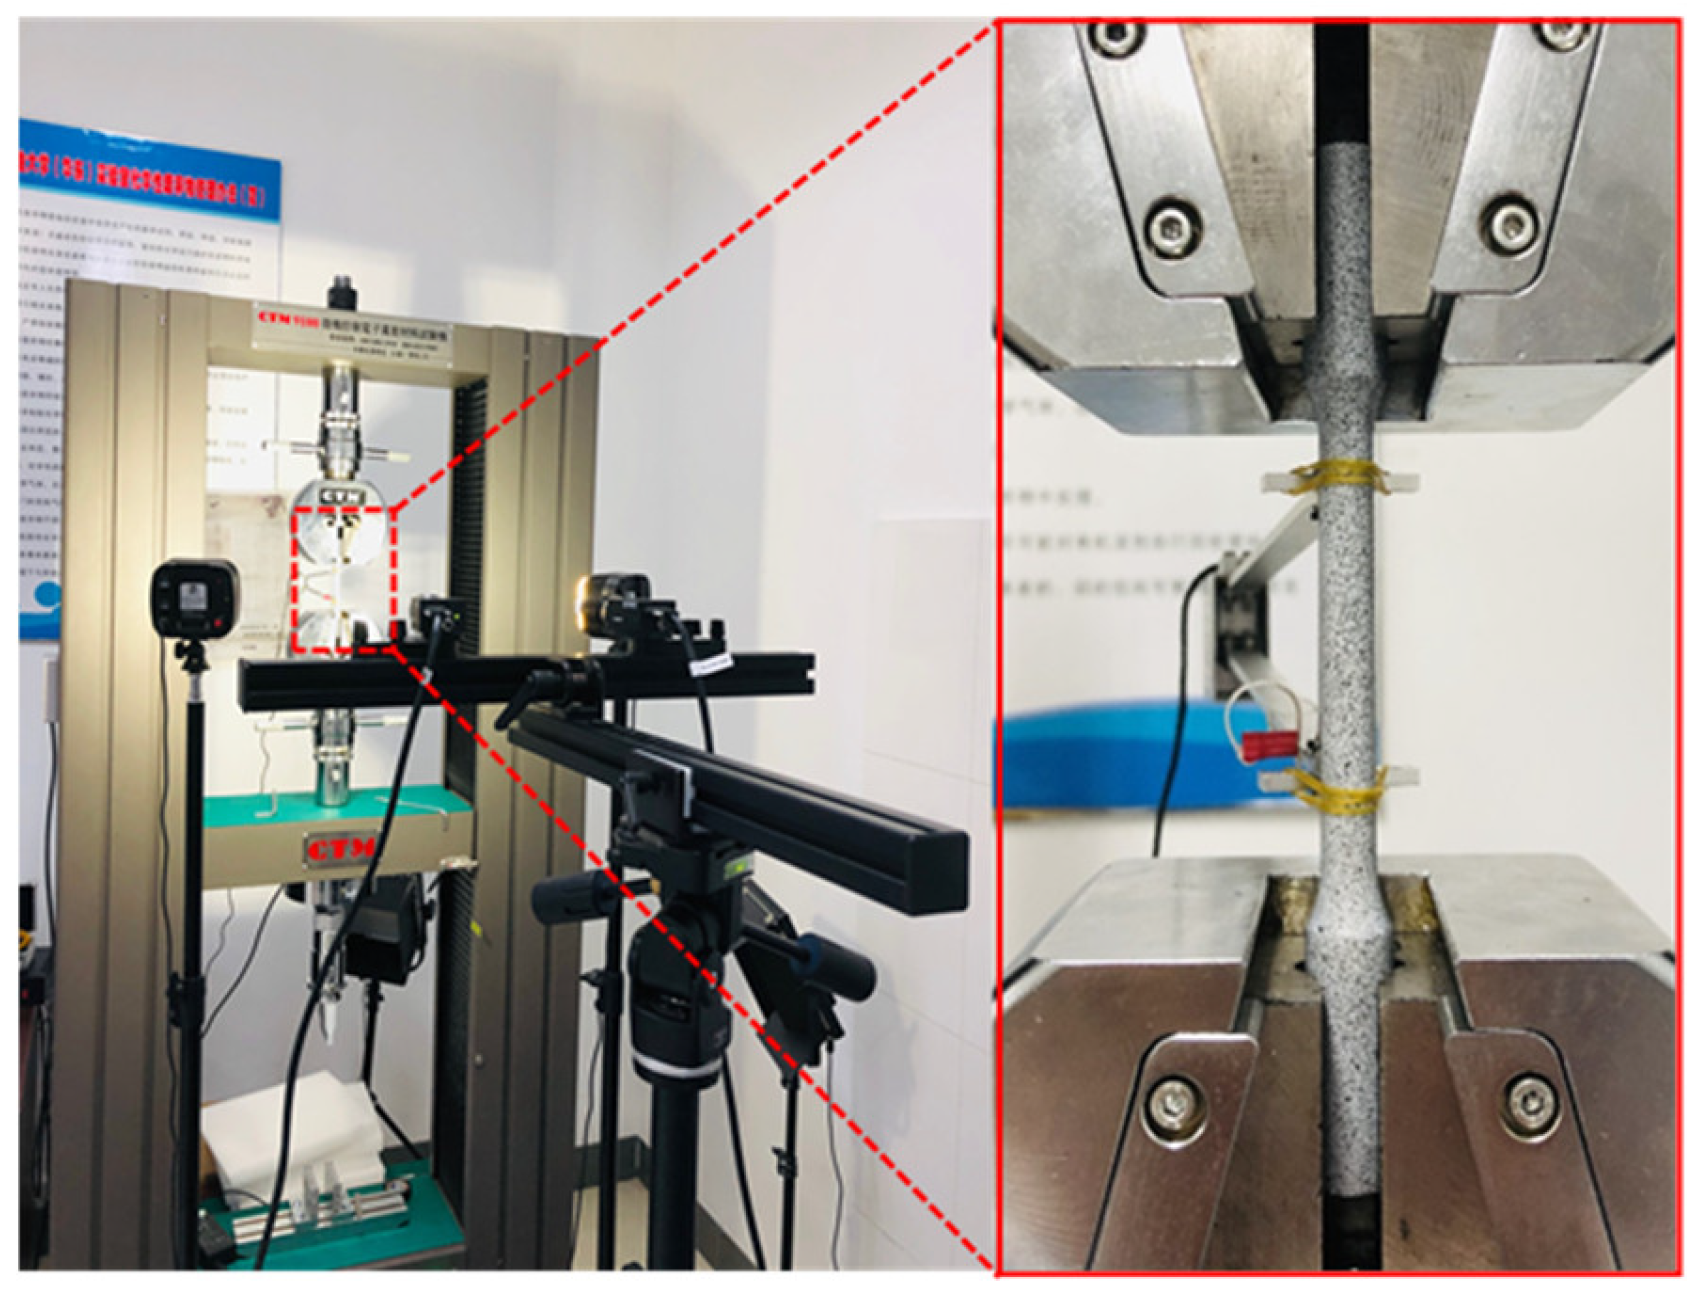
2. Experiment
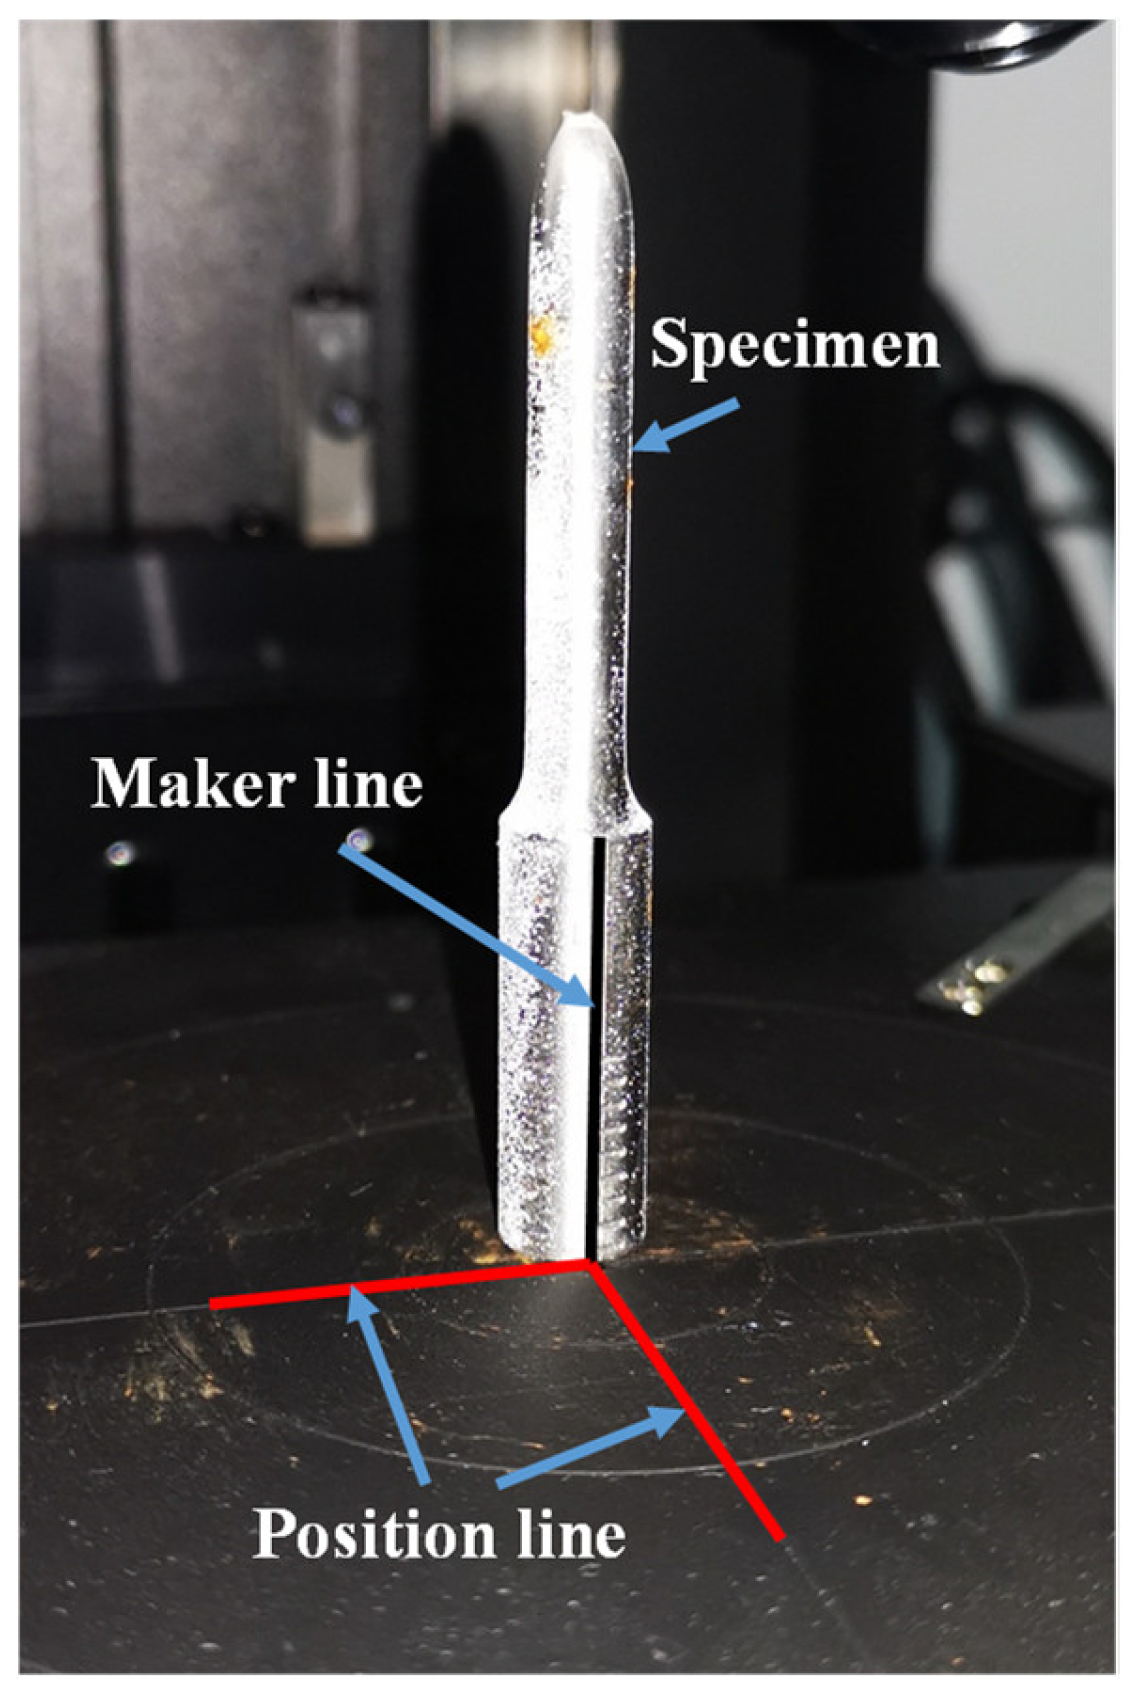
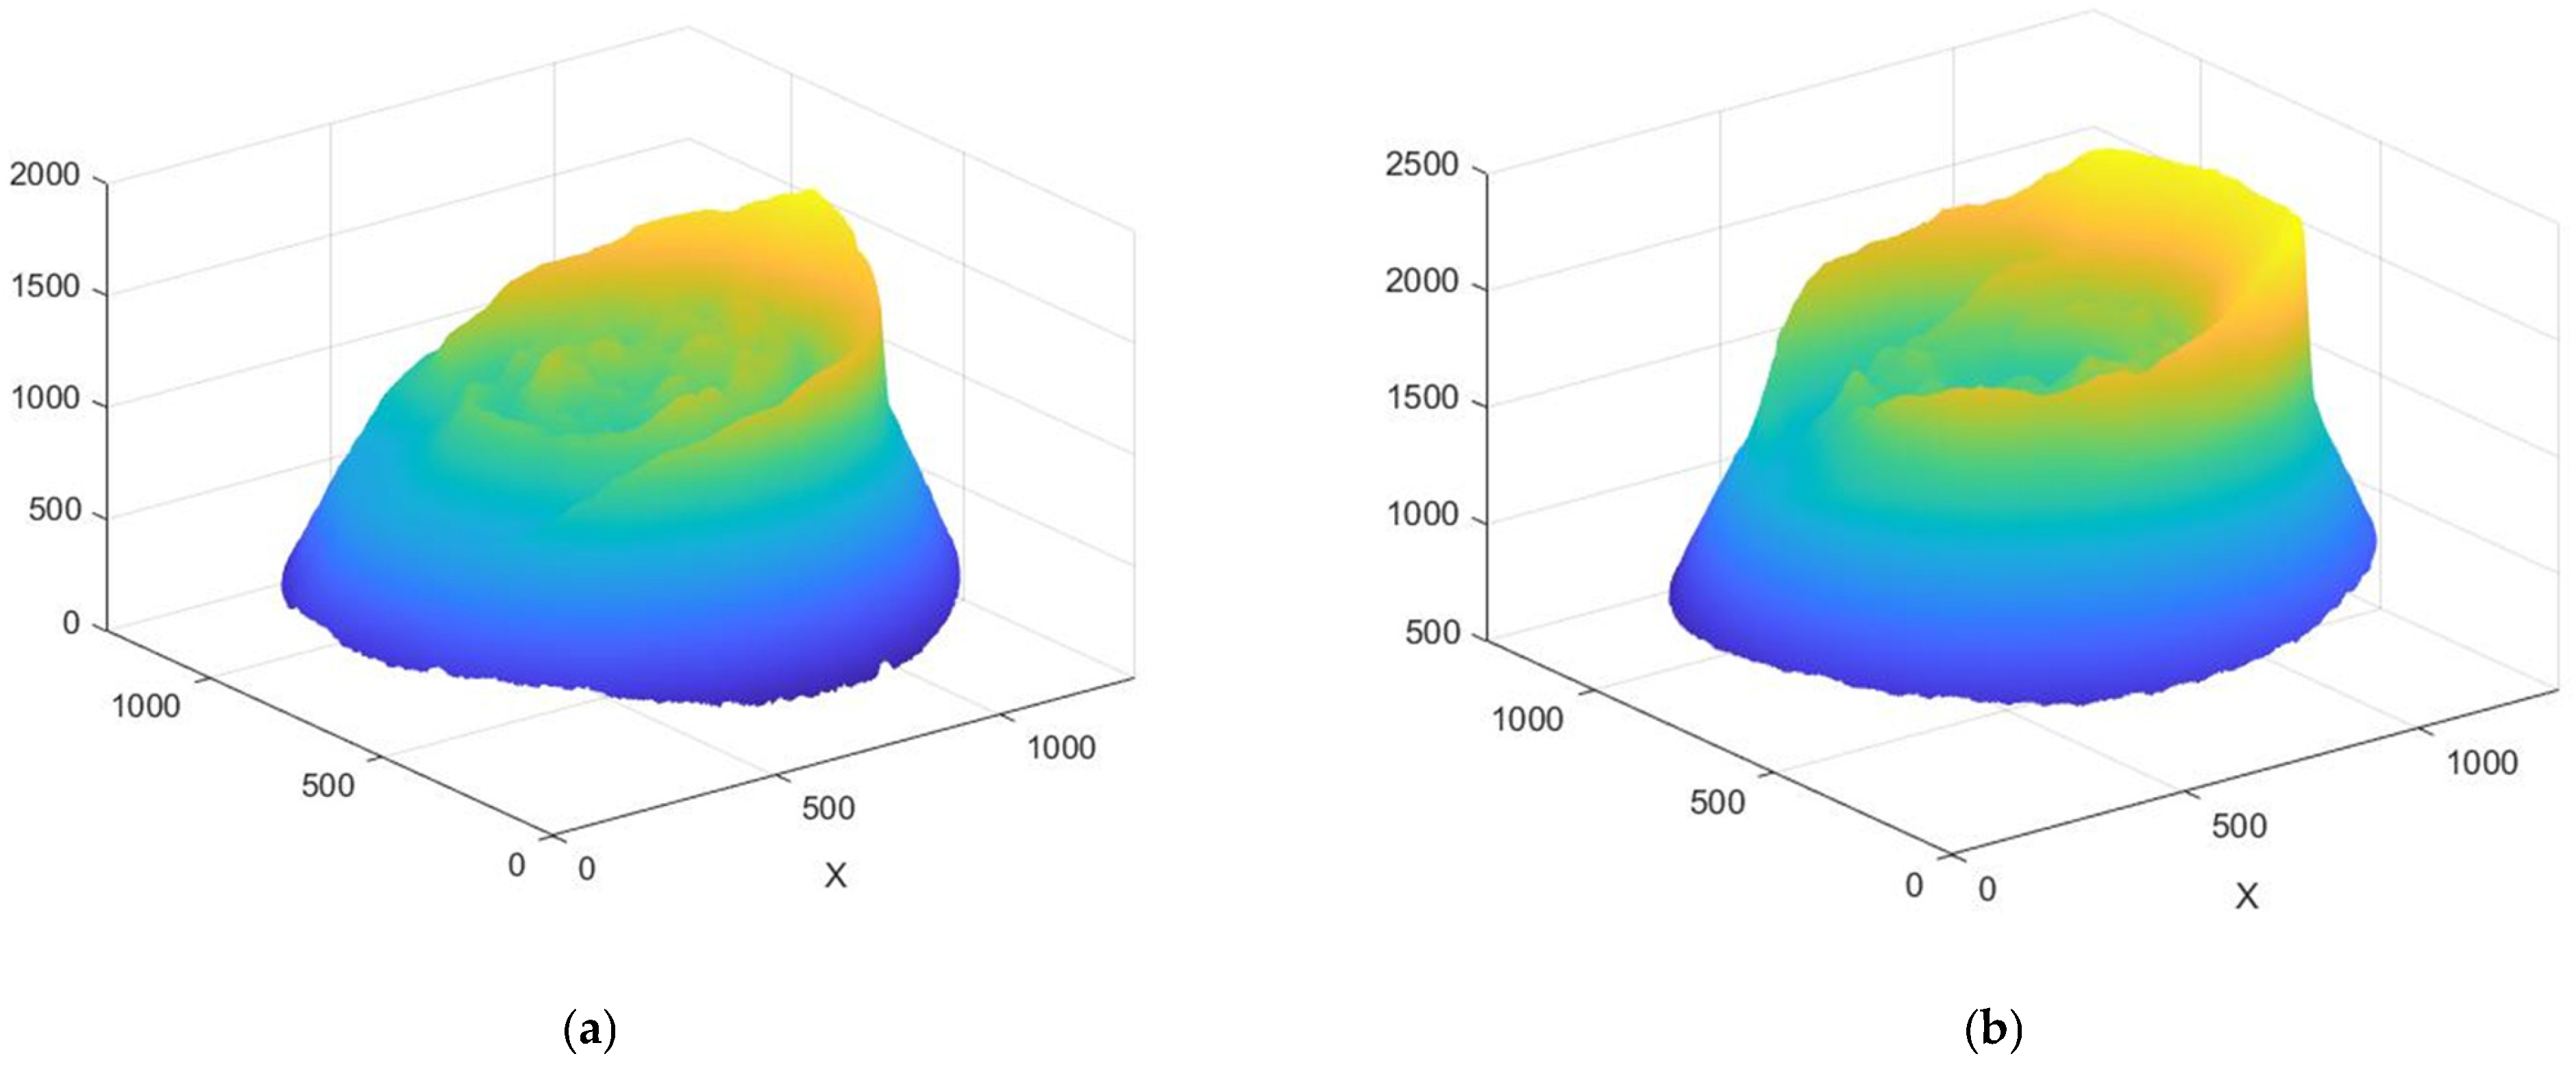
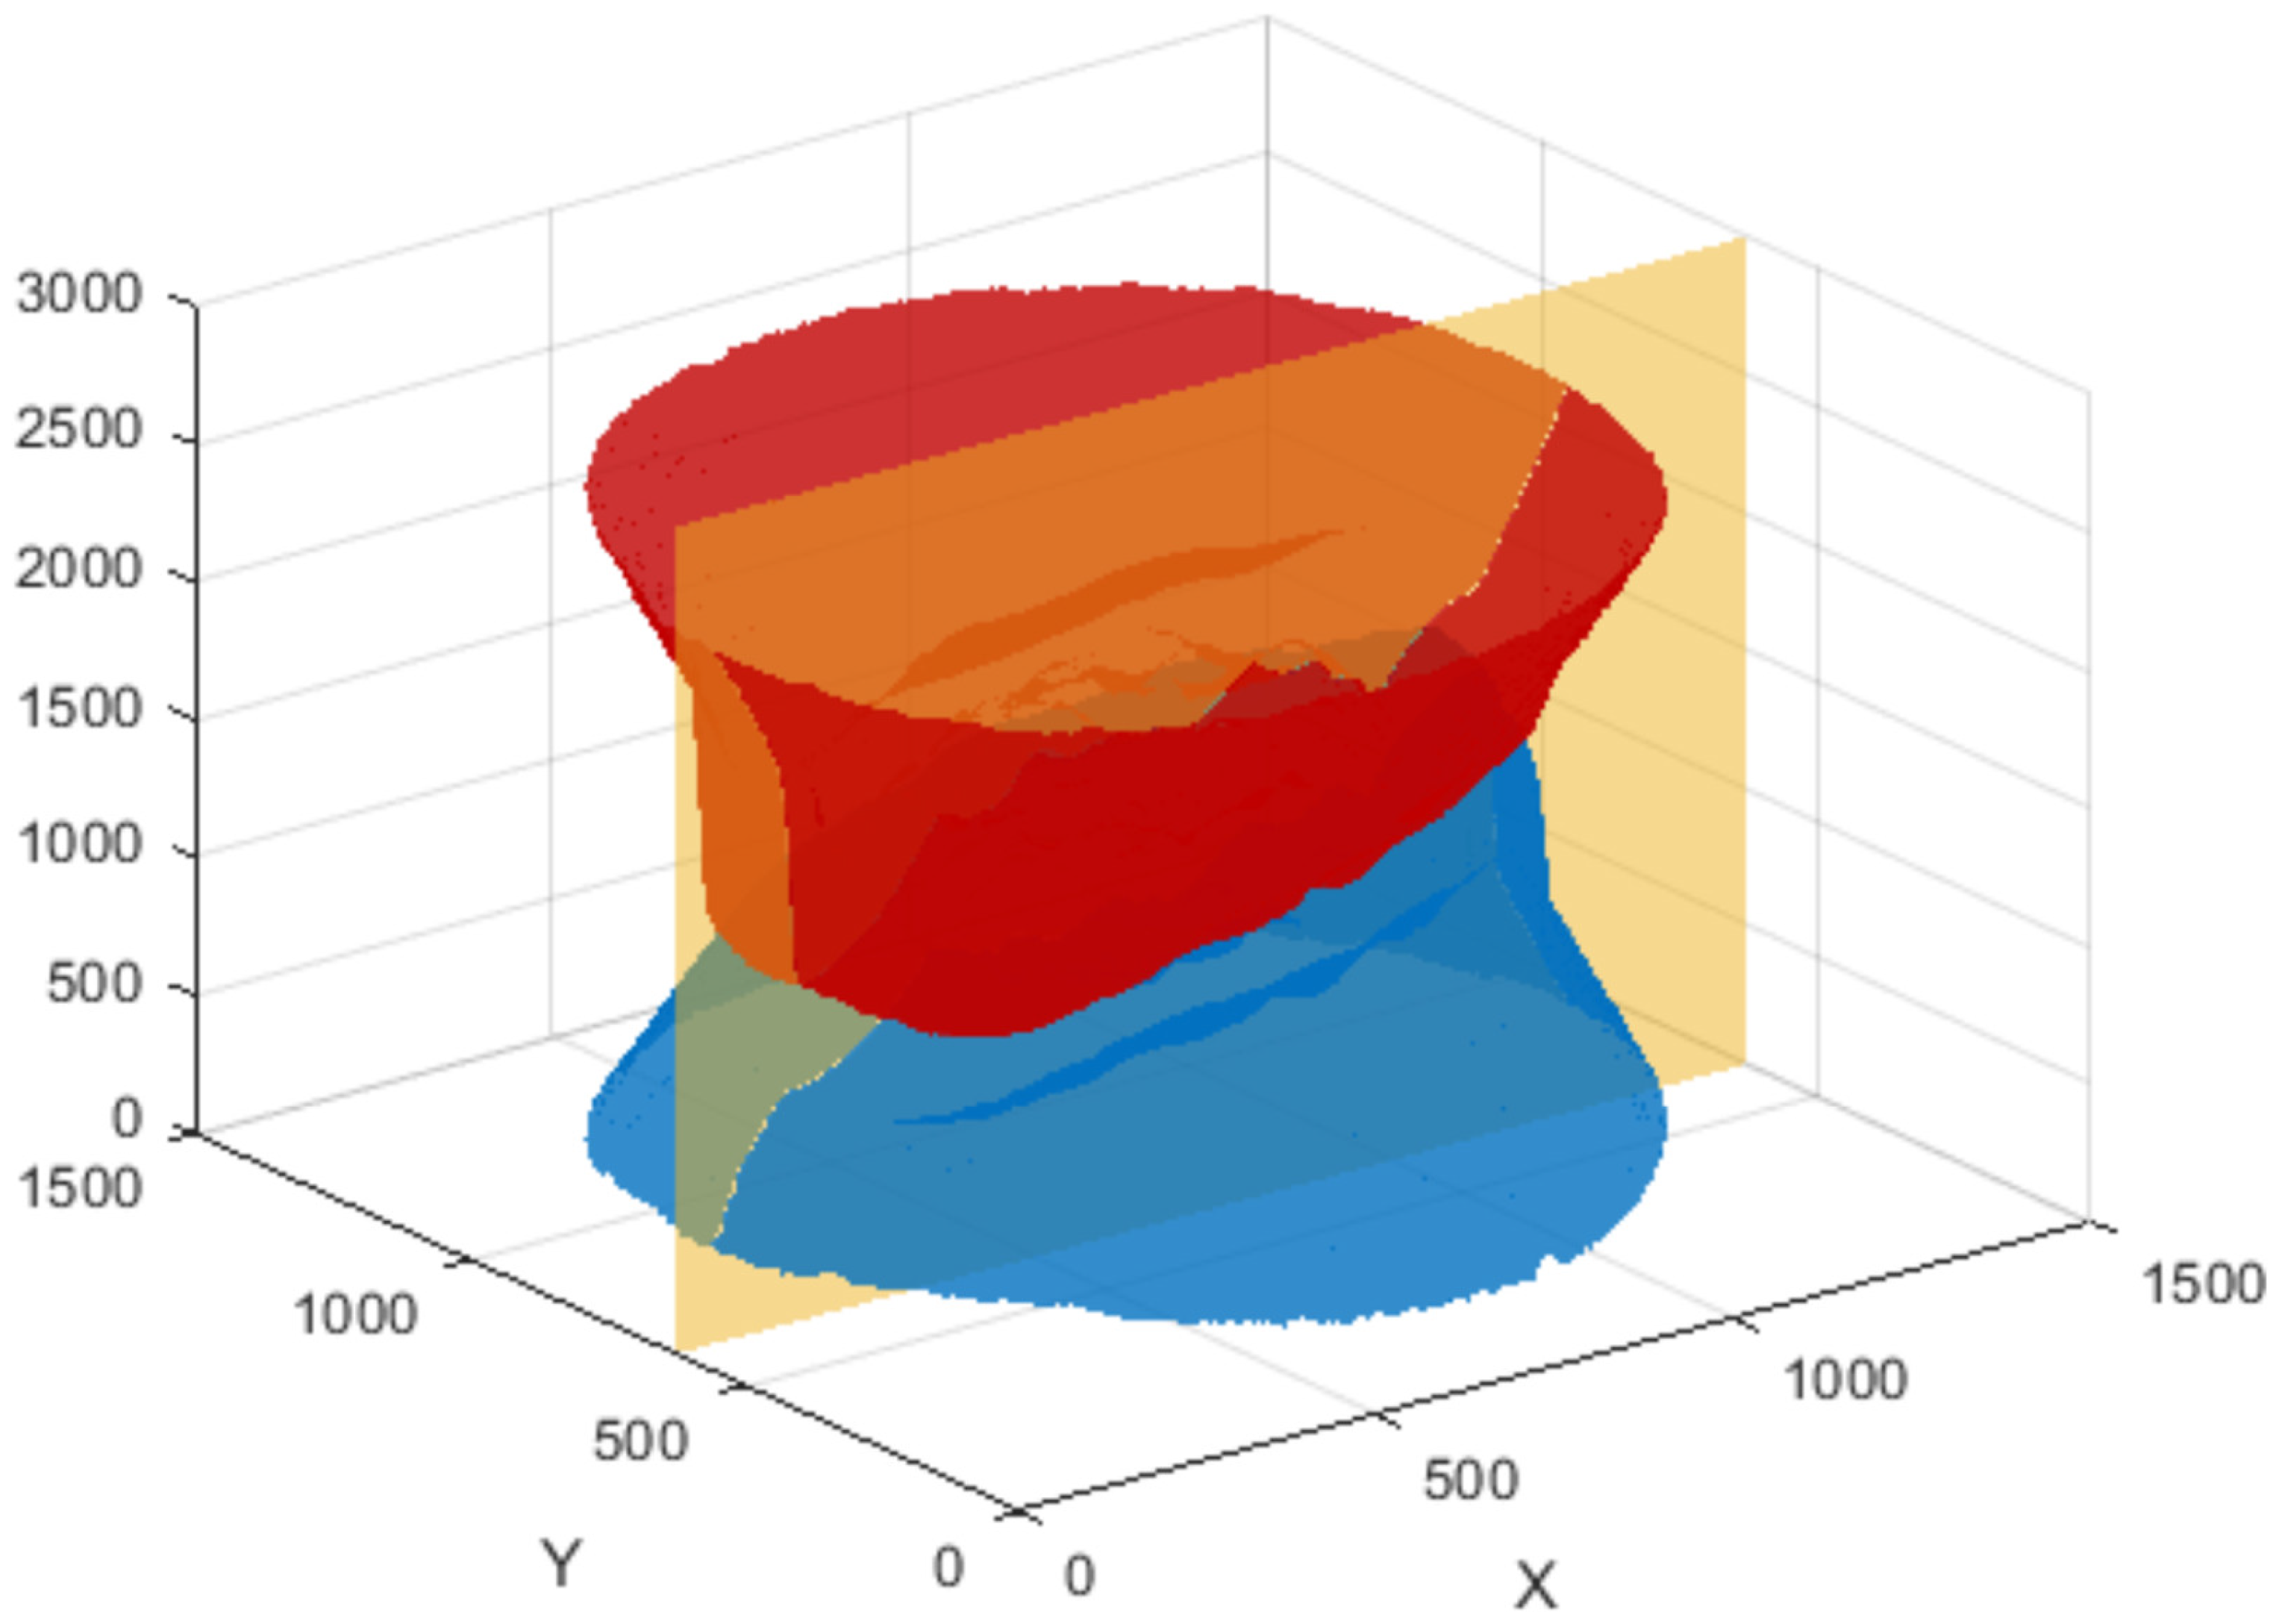
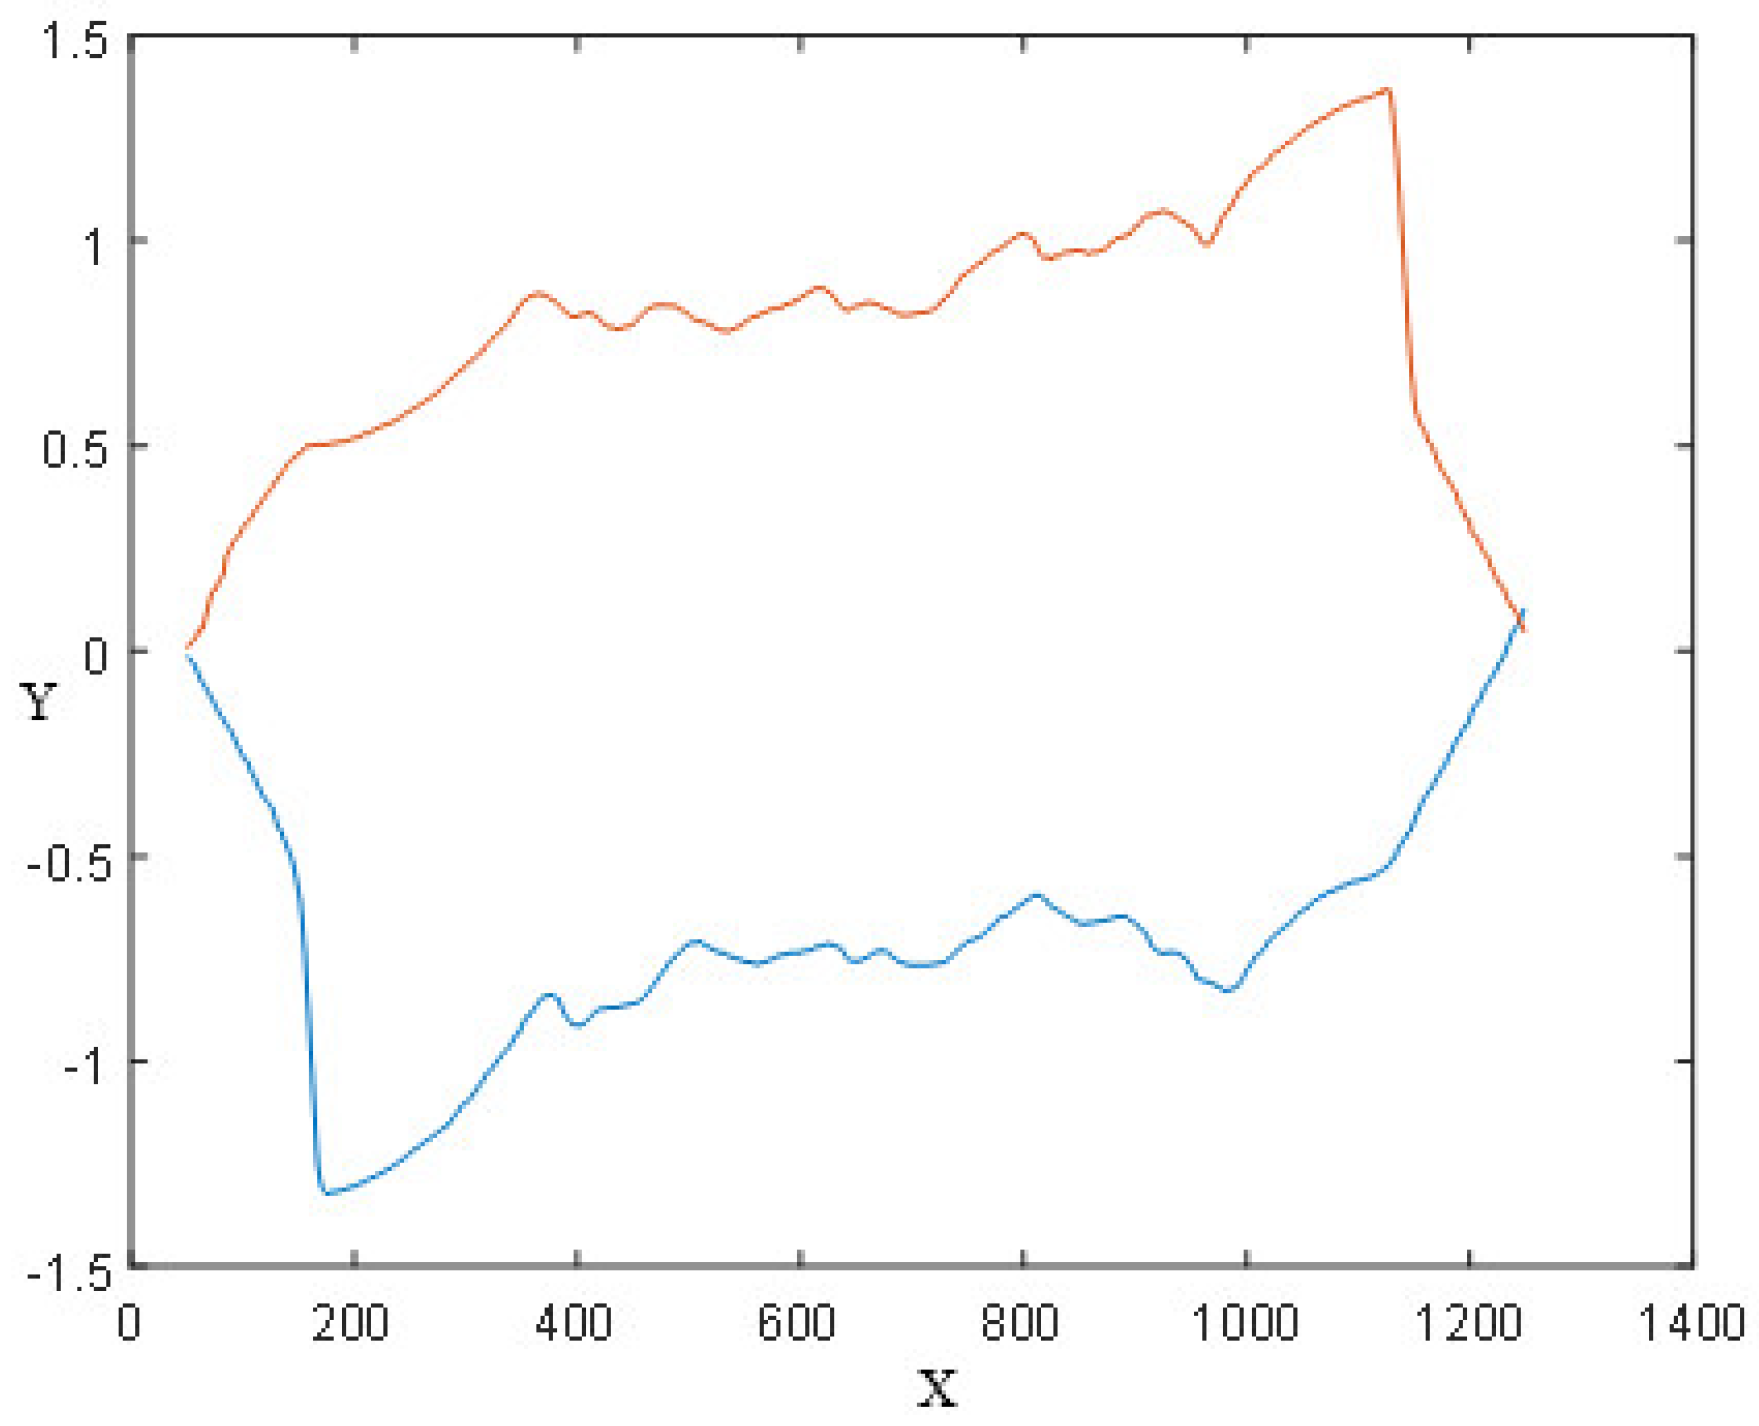
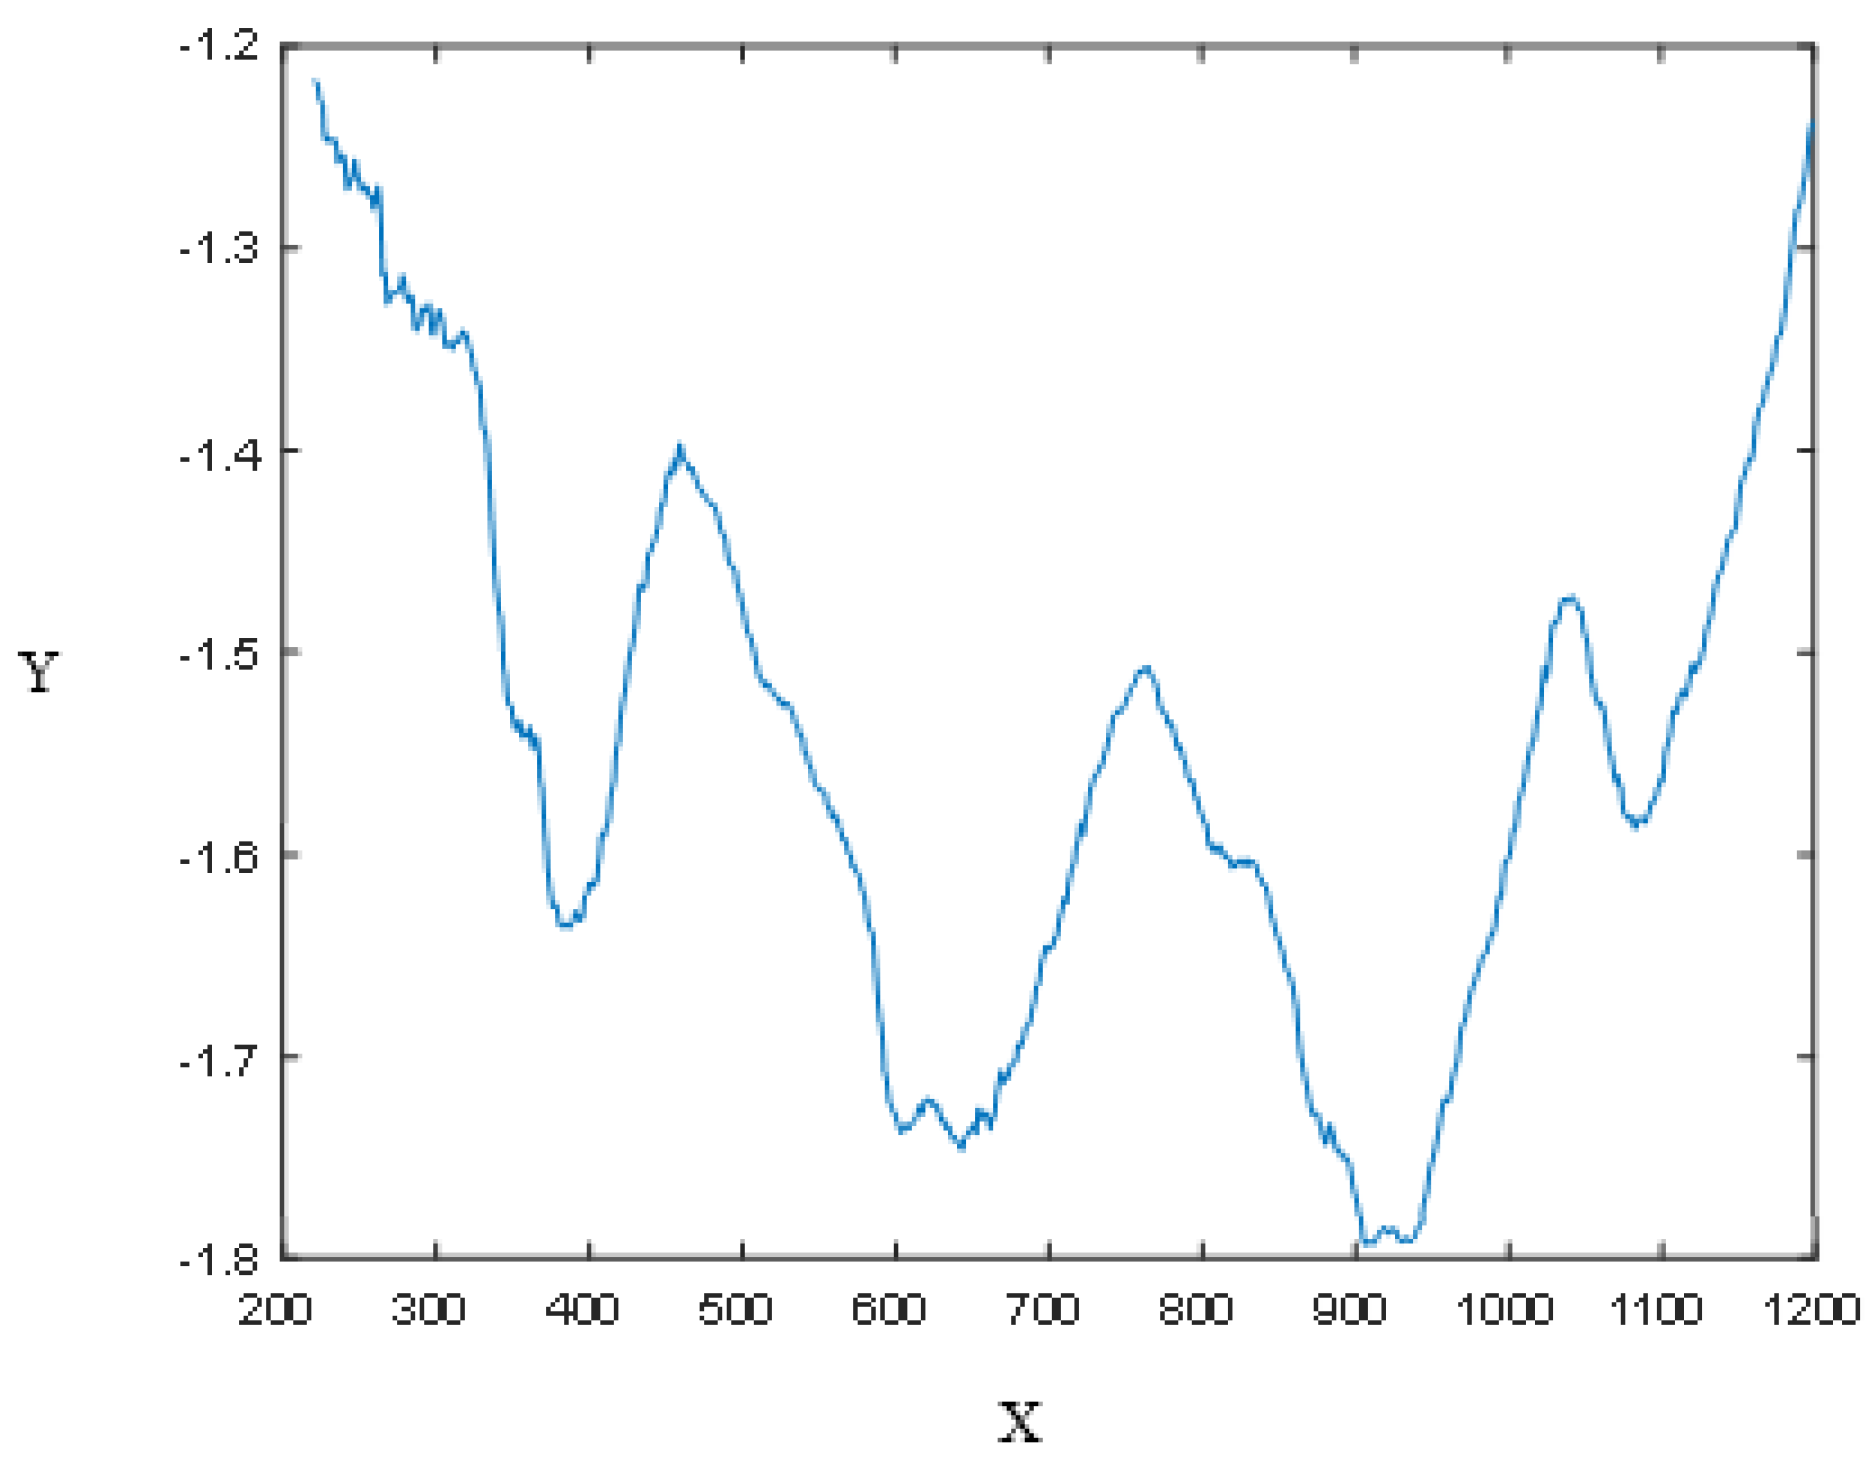
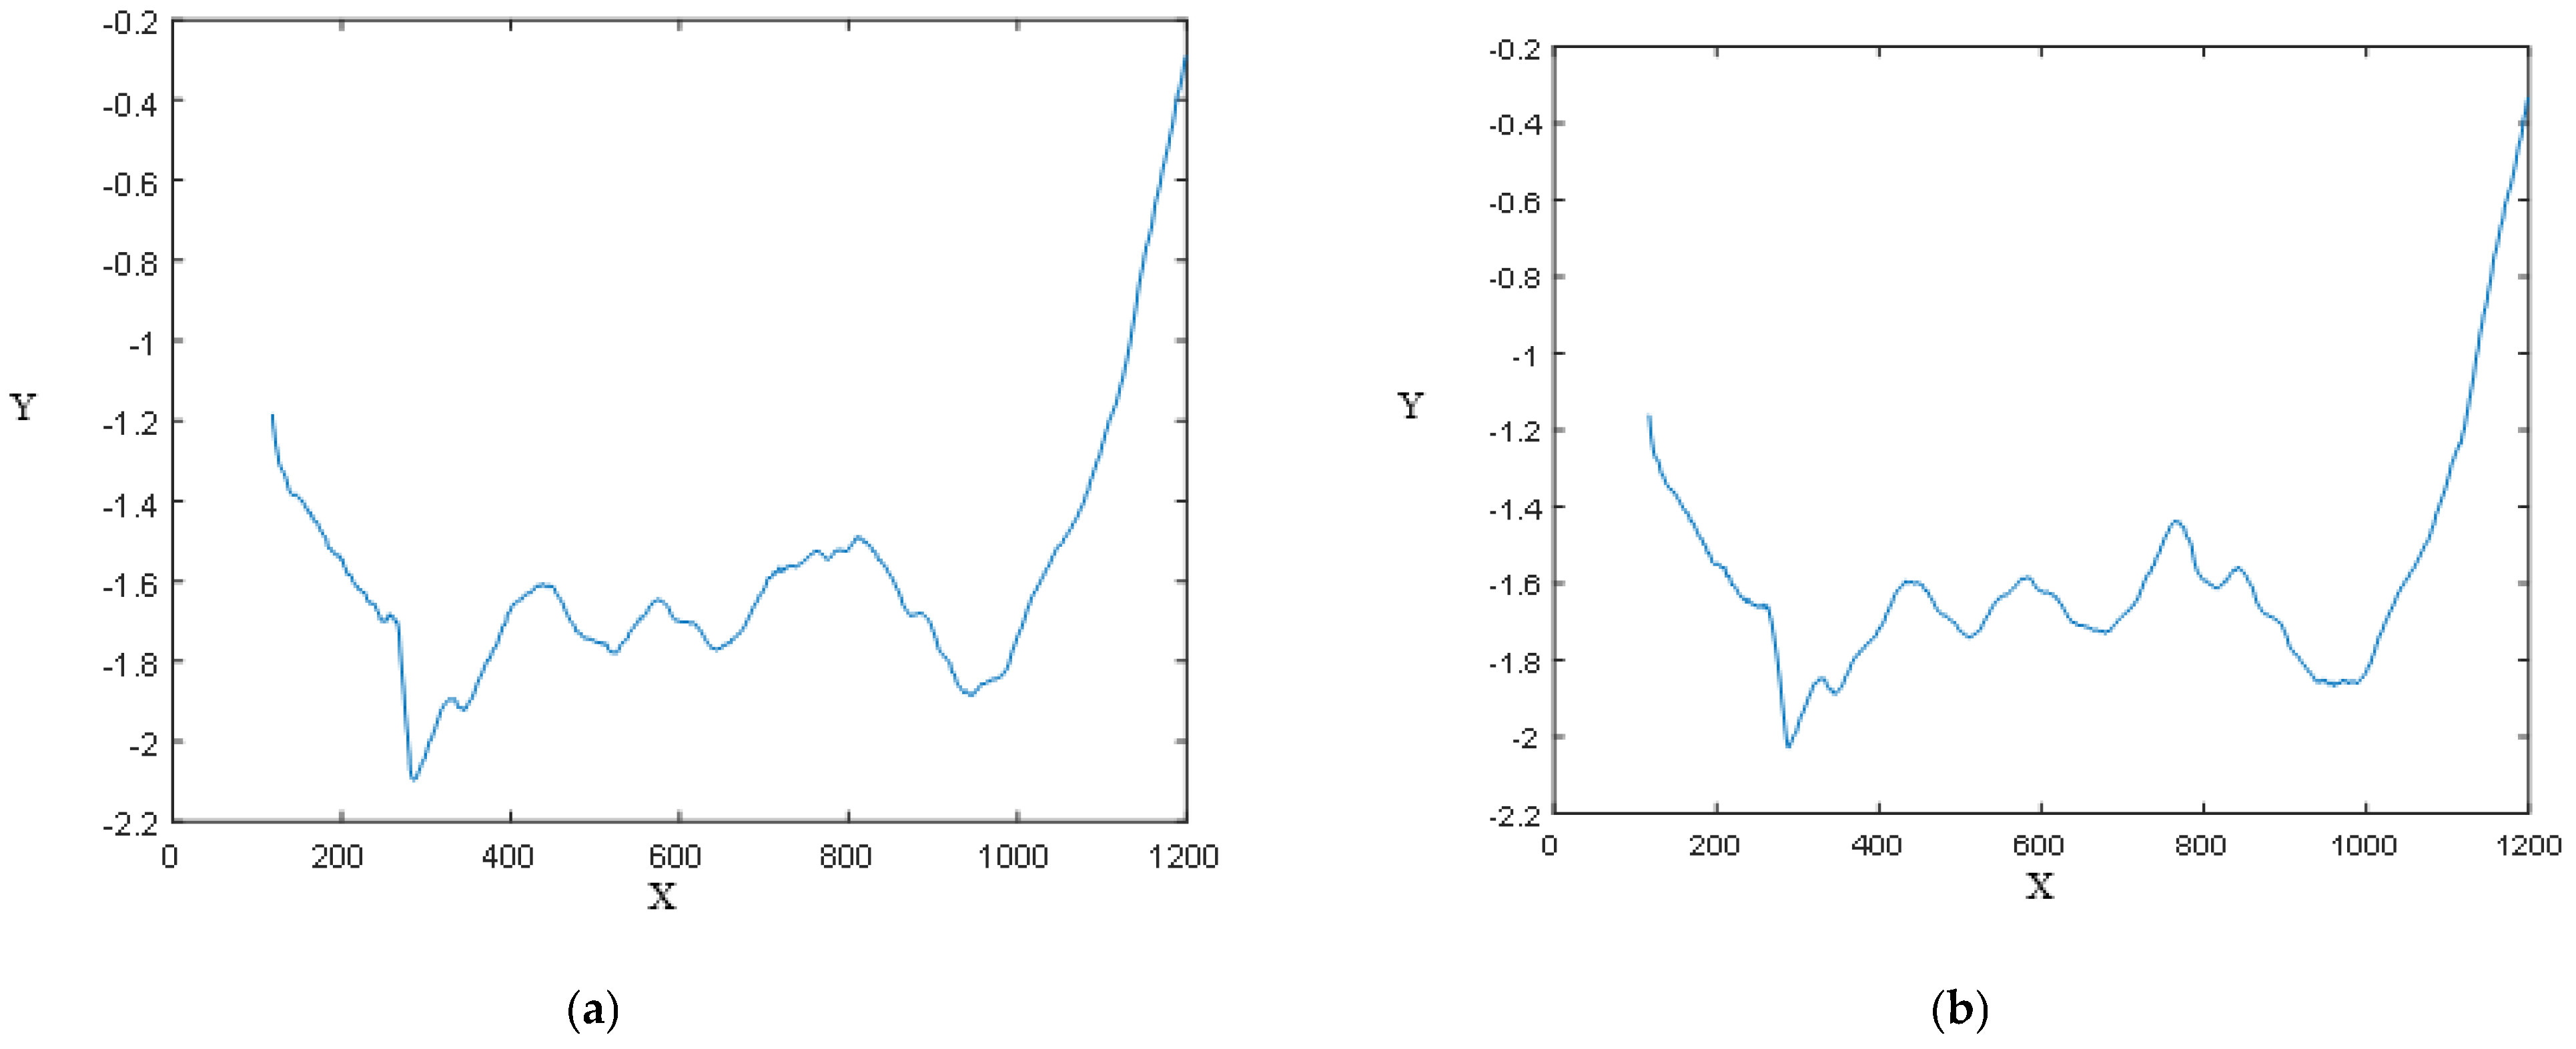
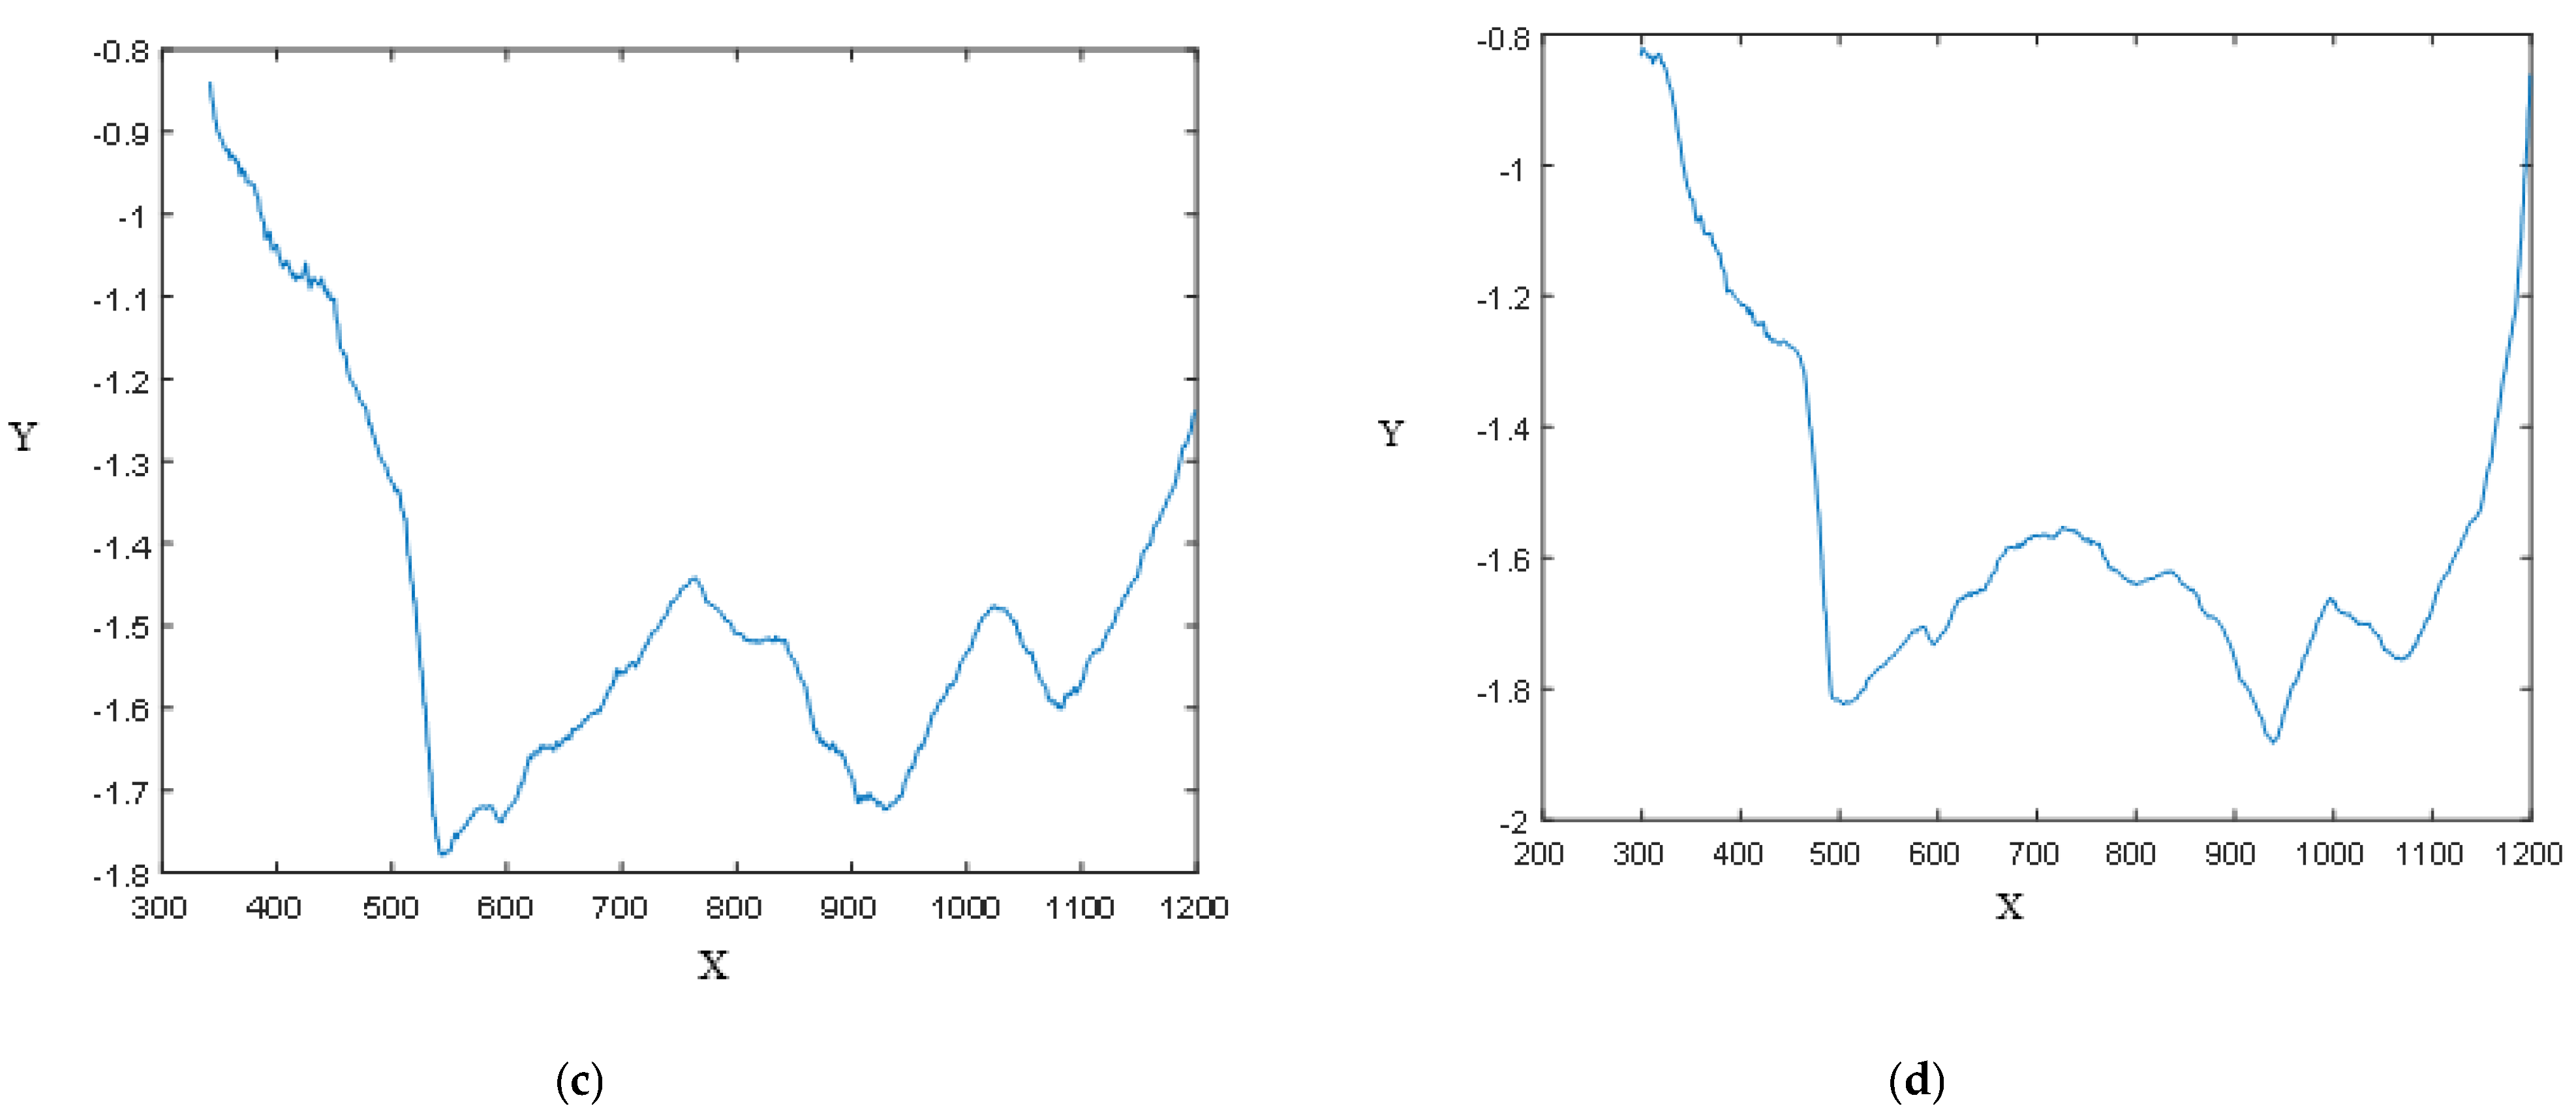
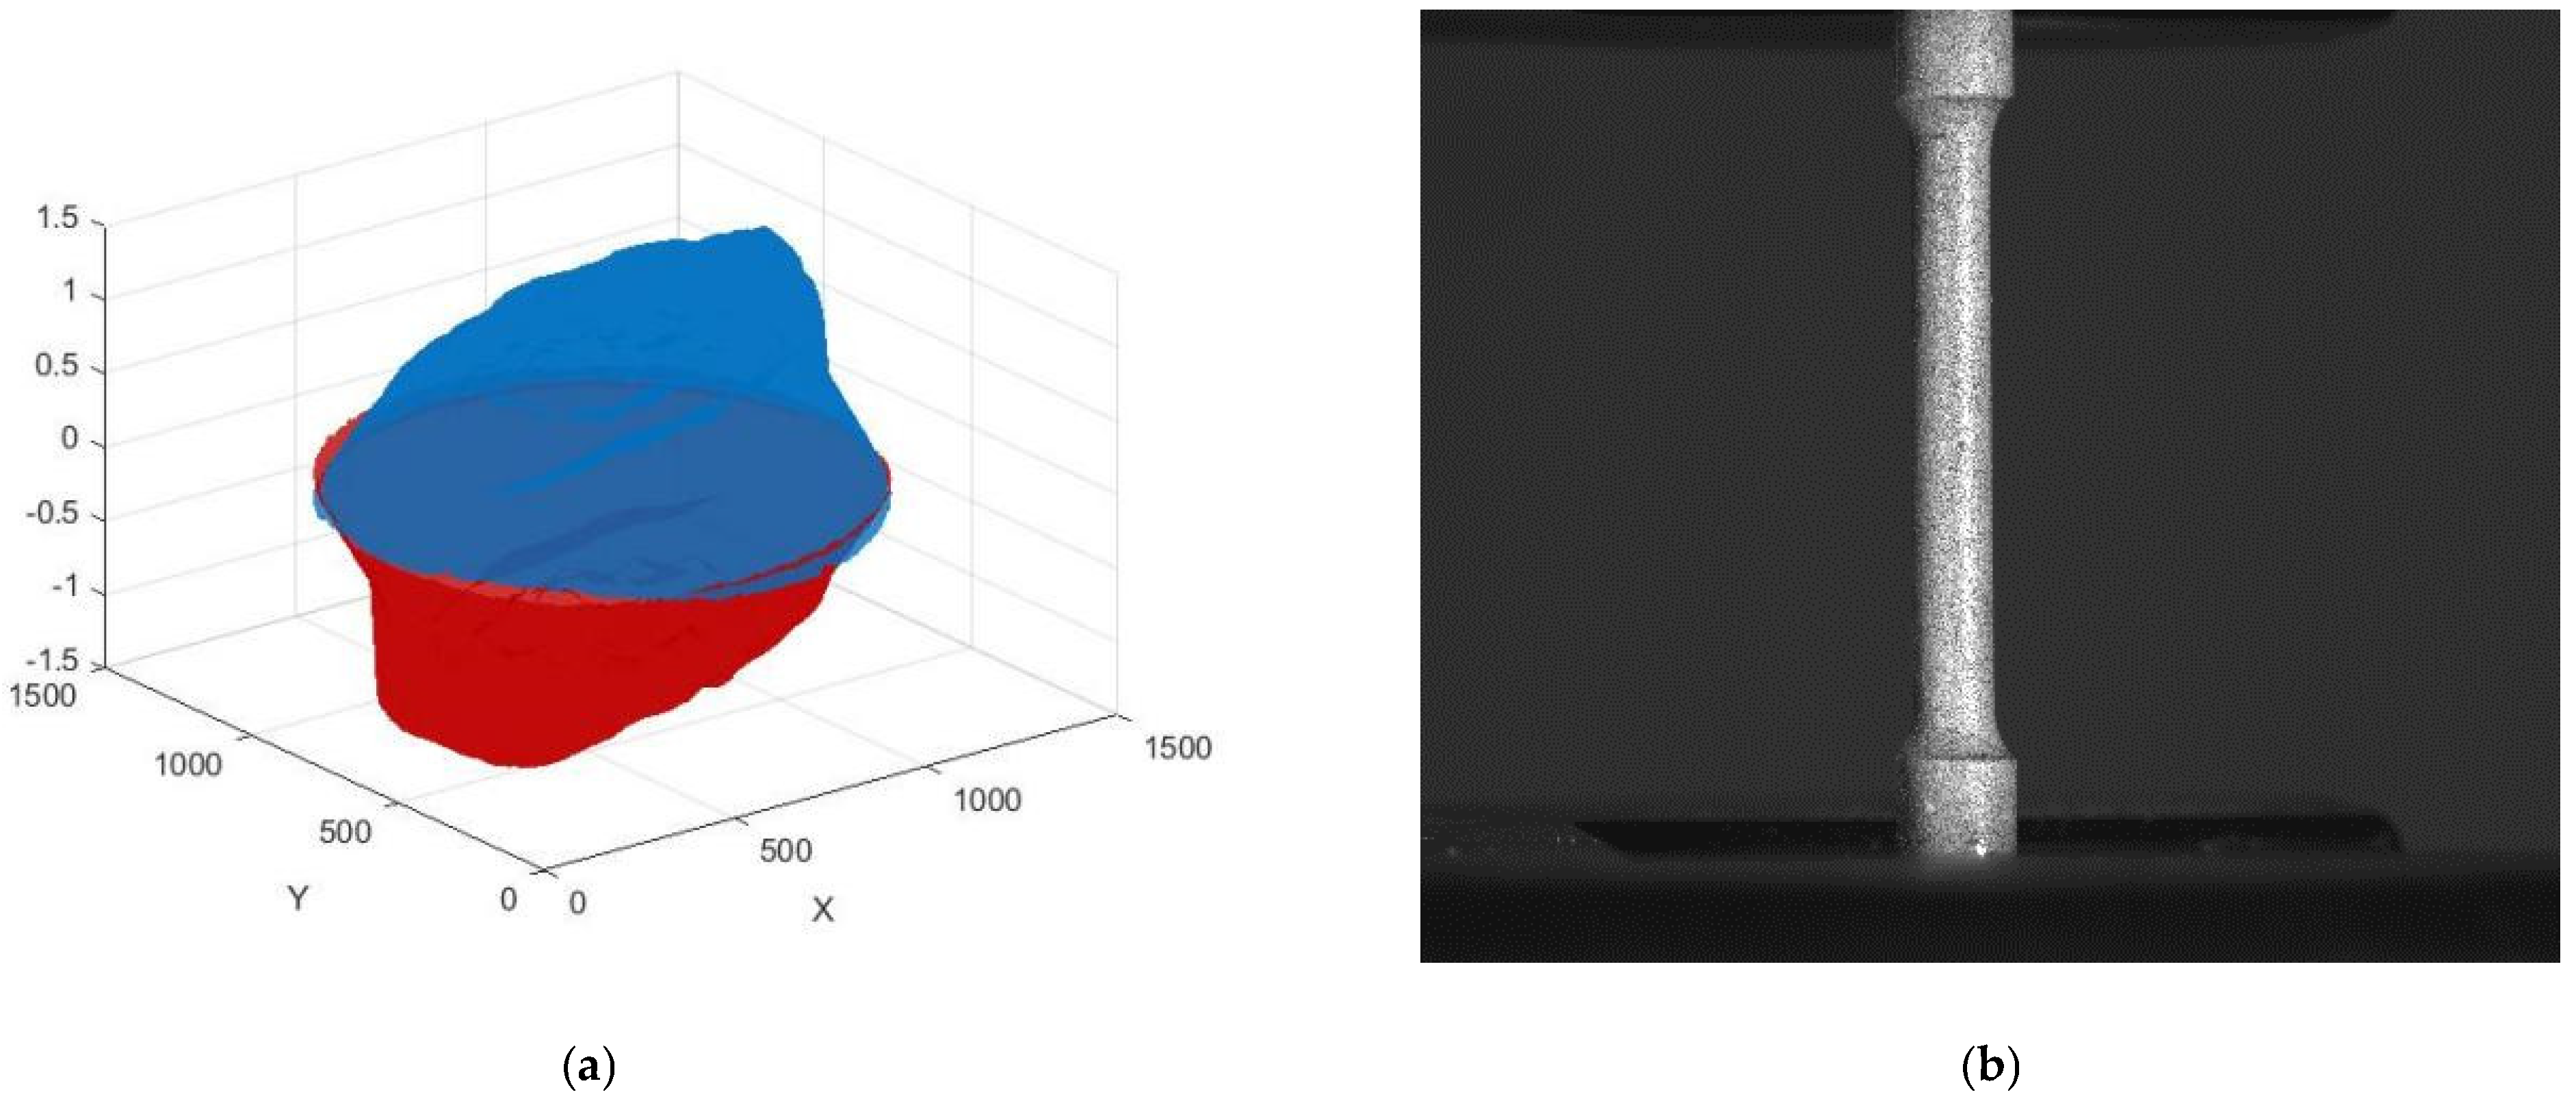
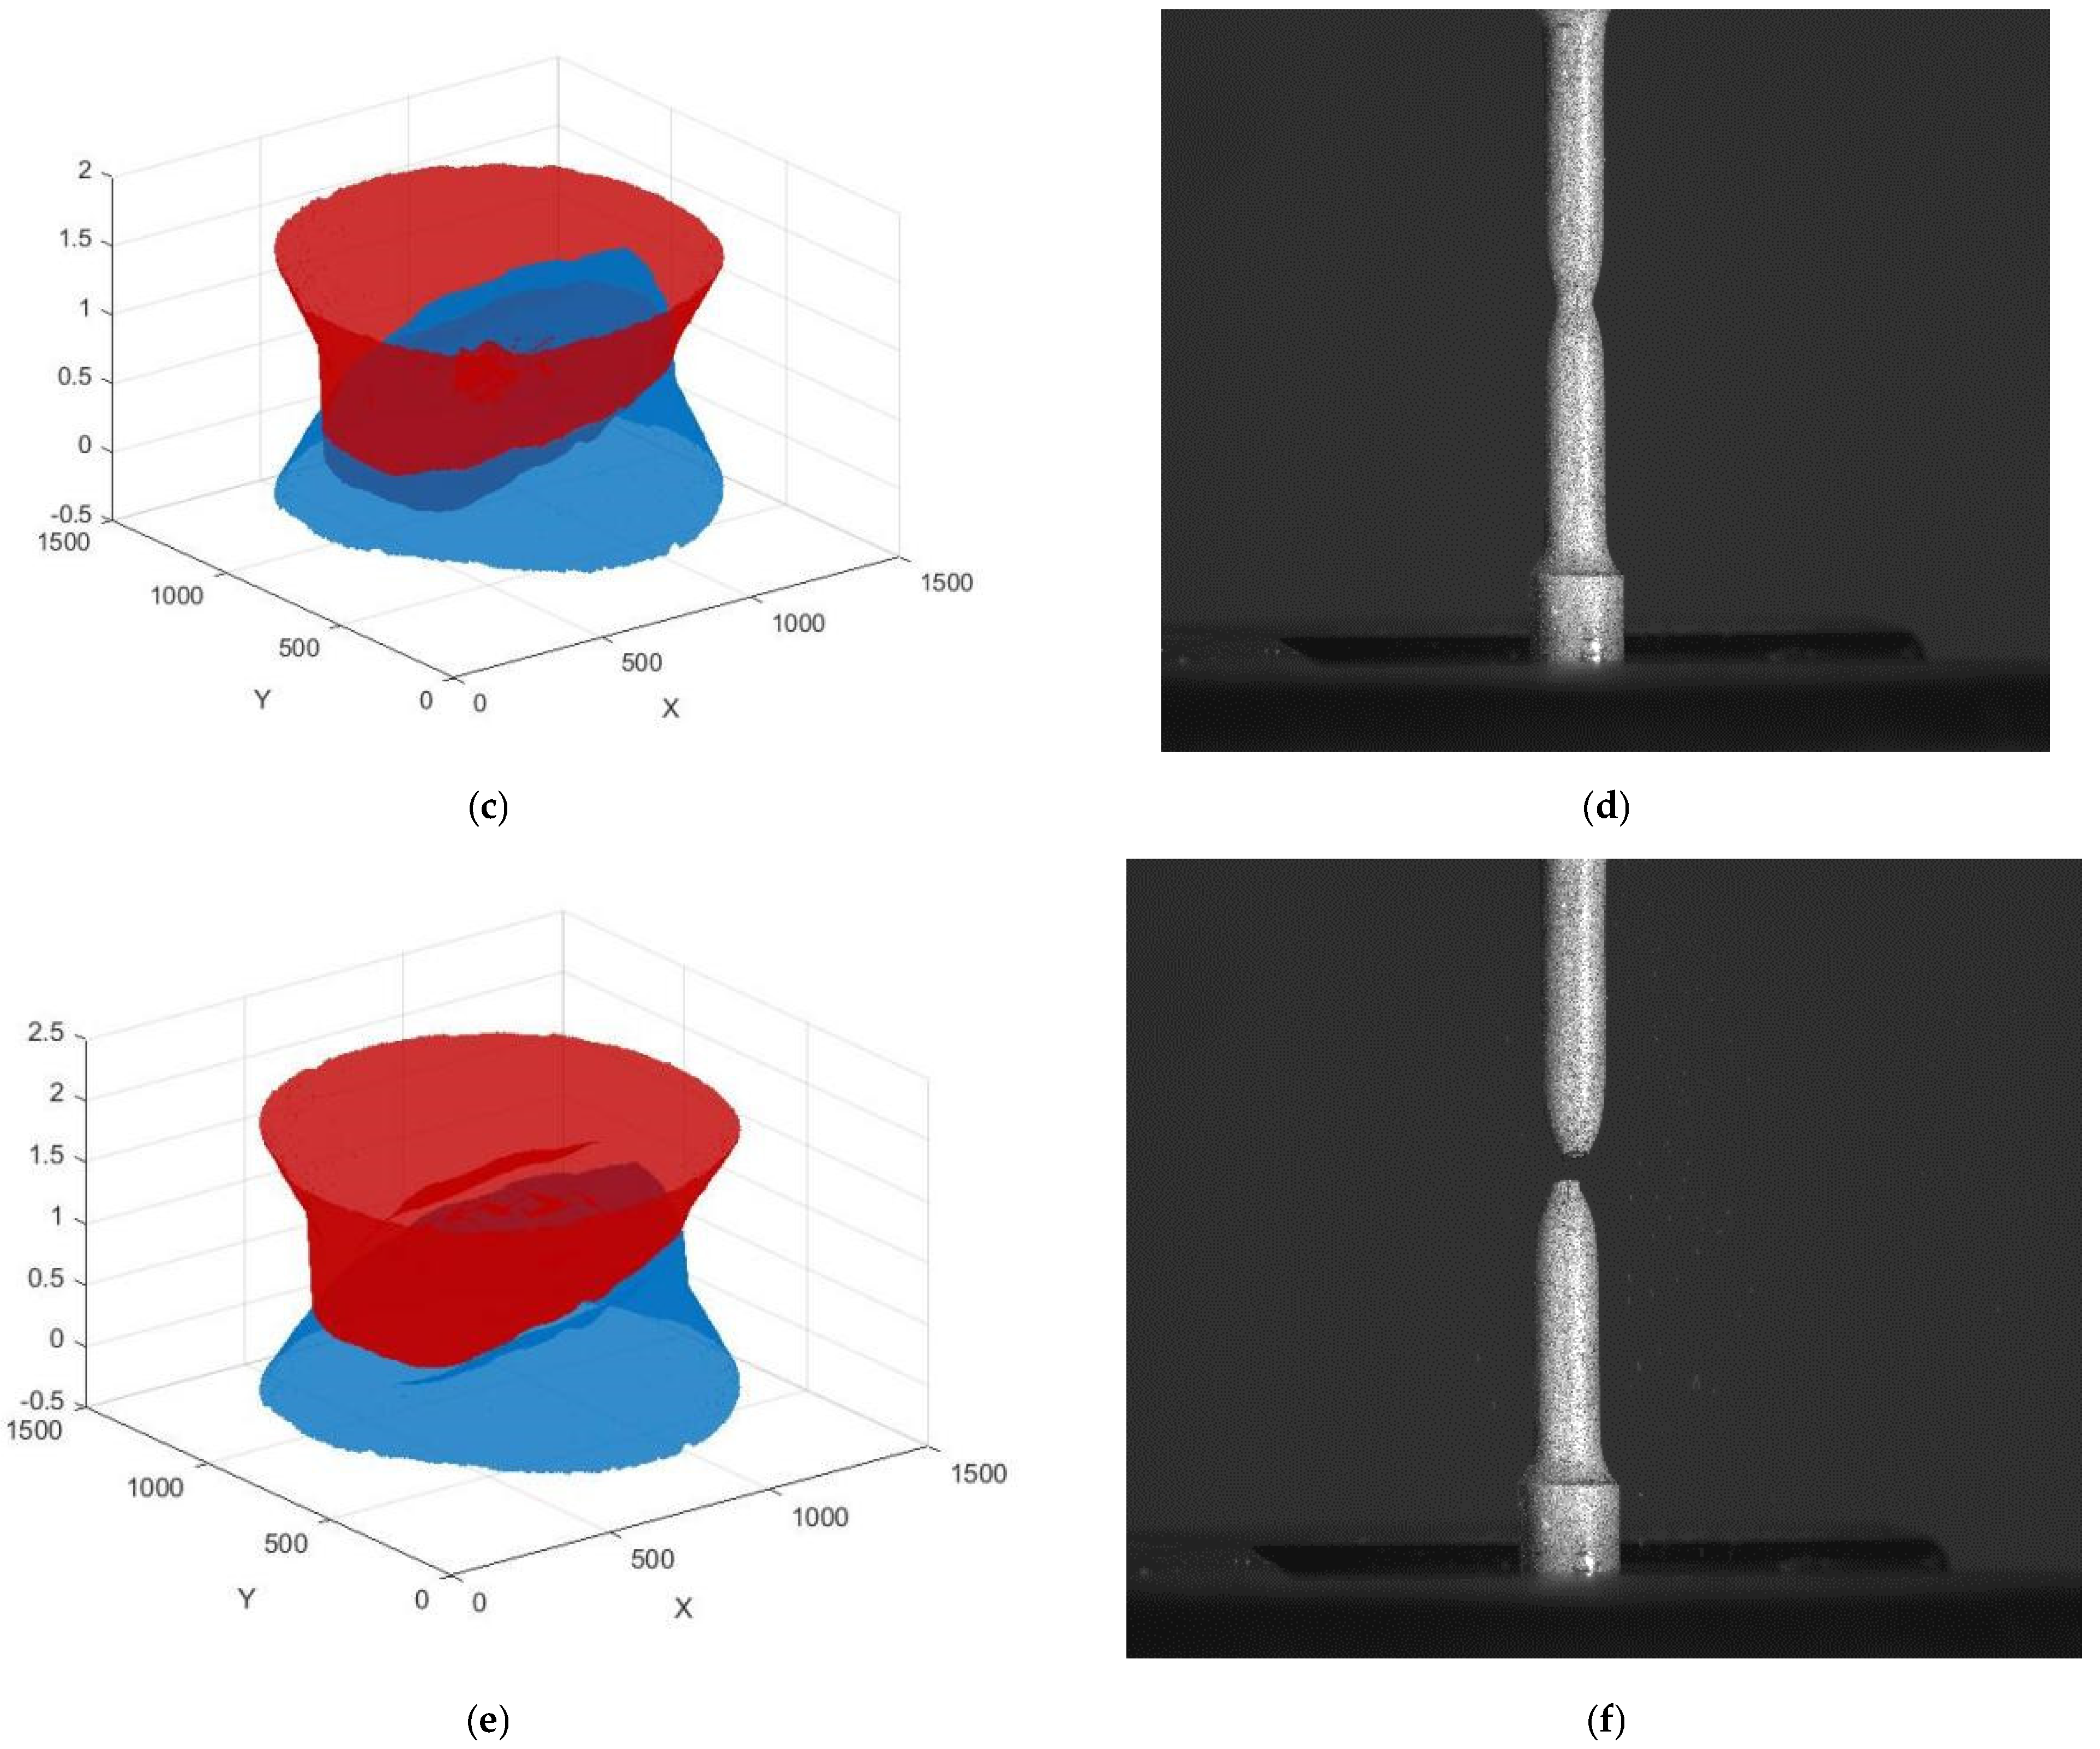
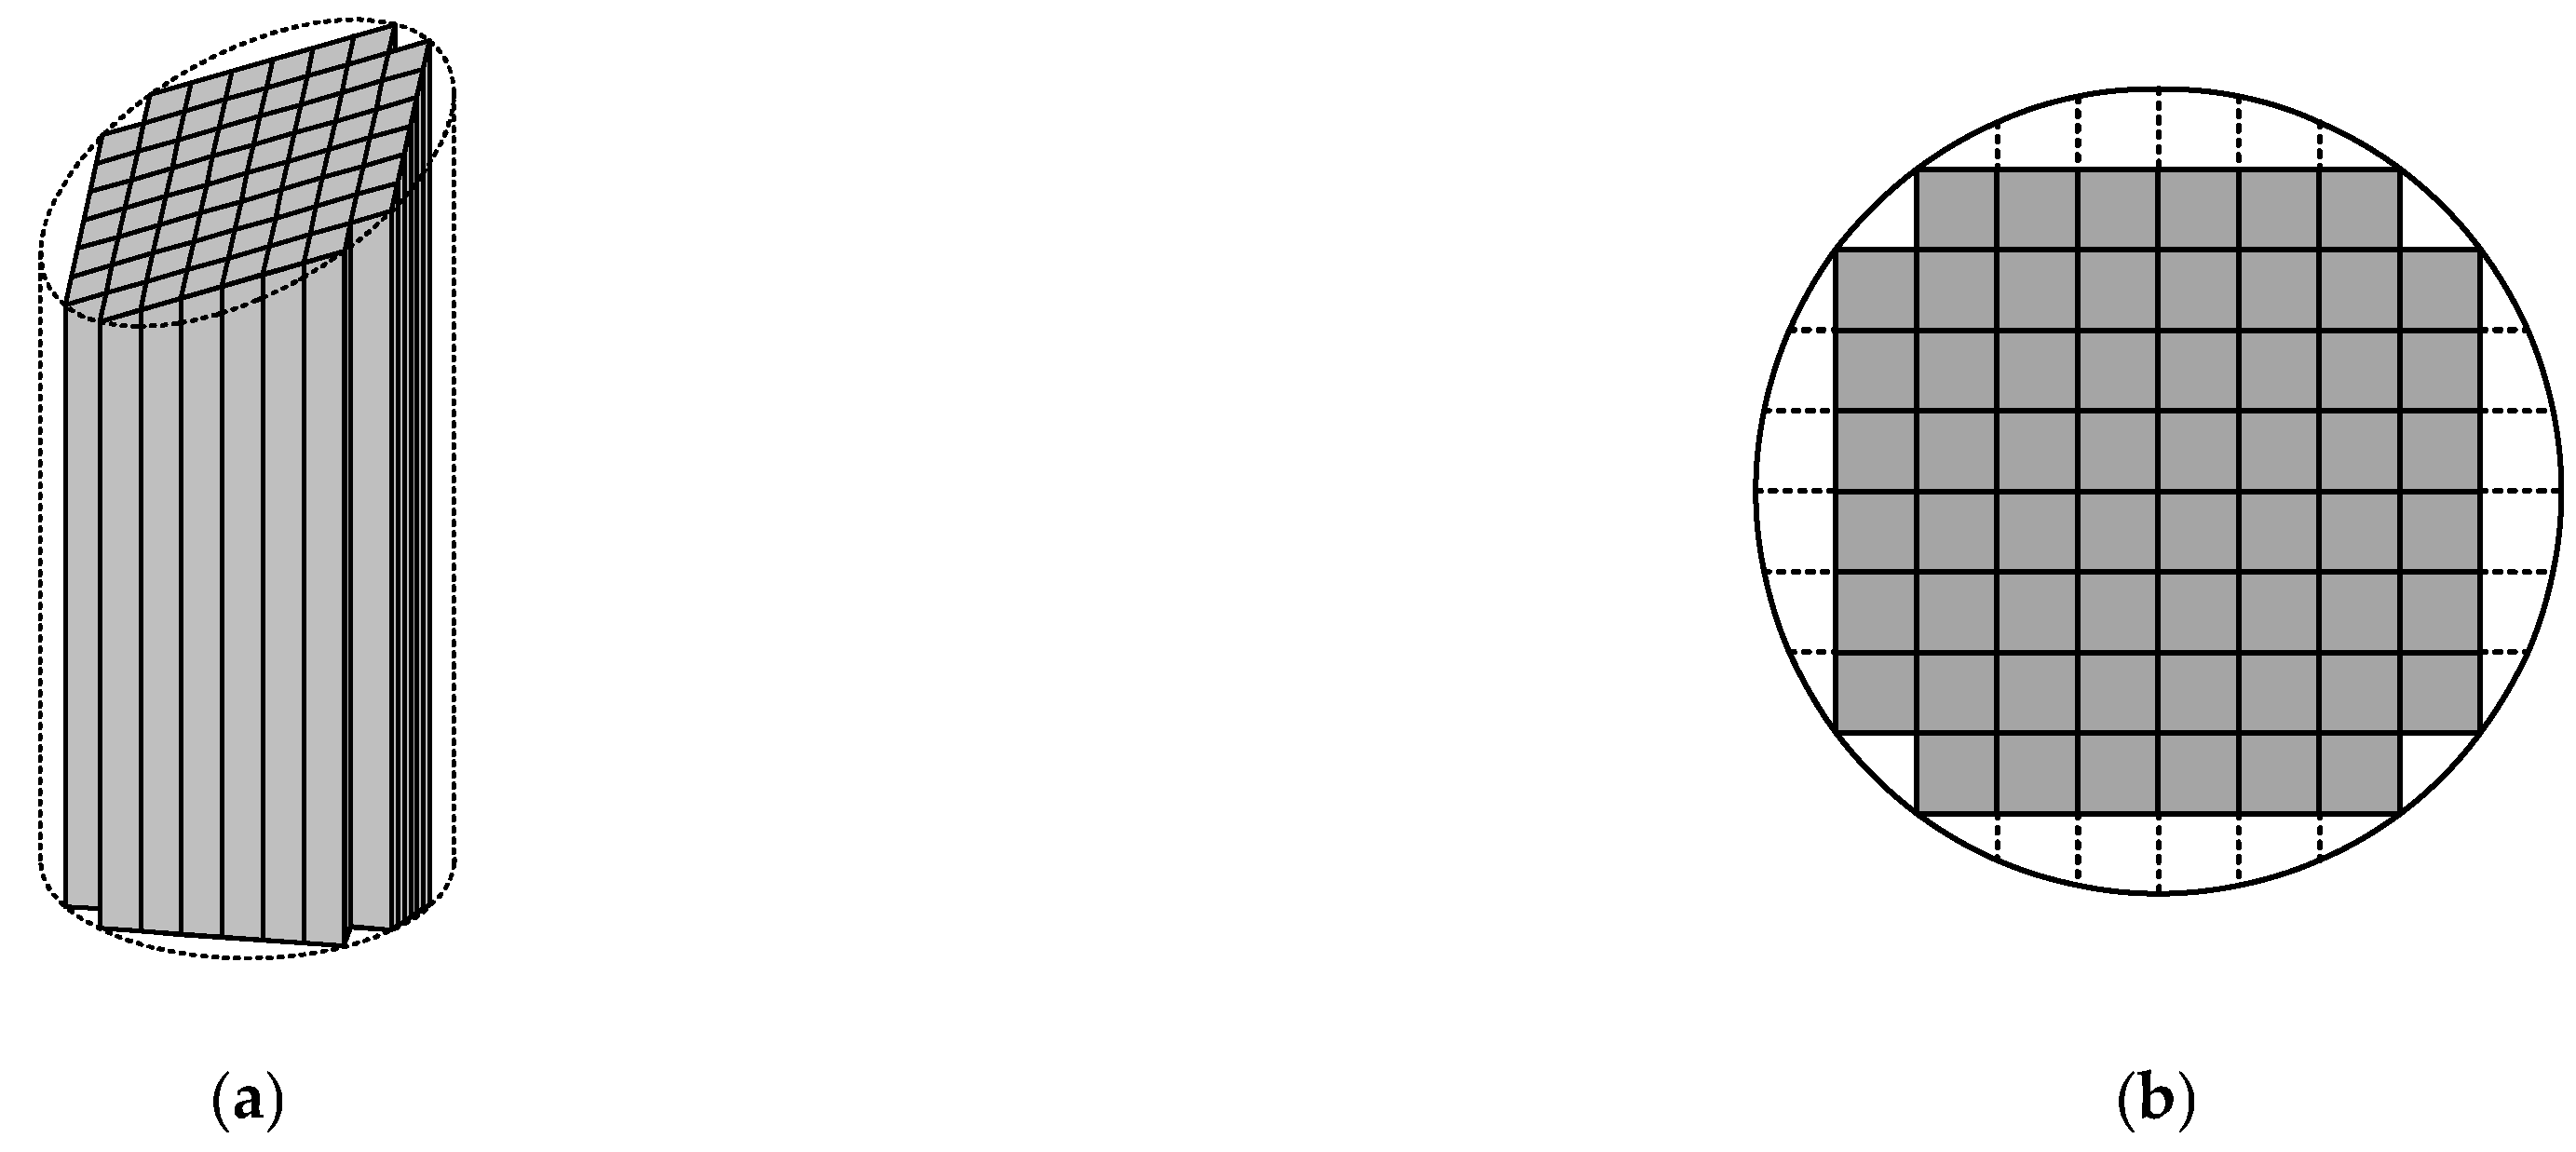
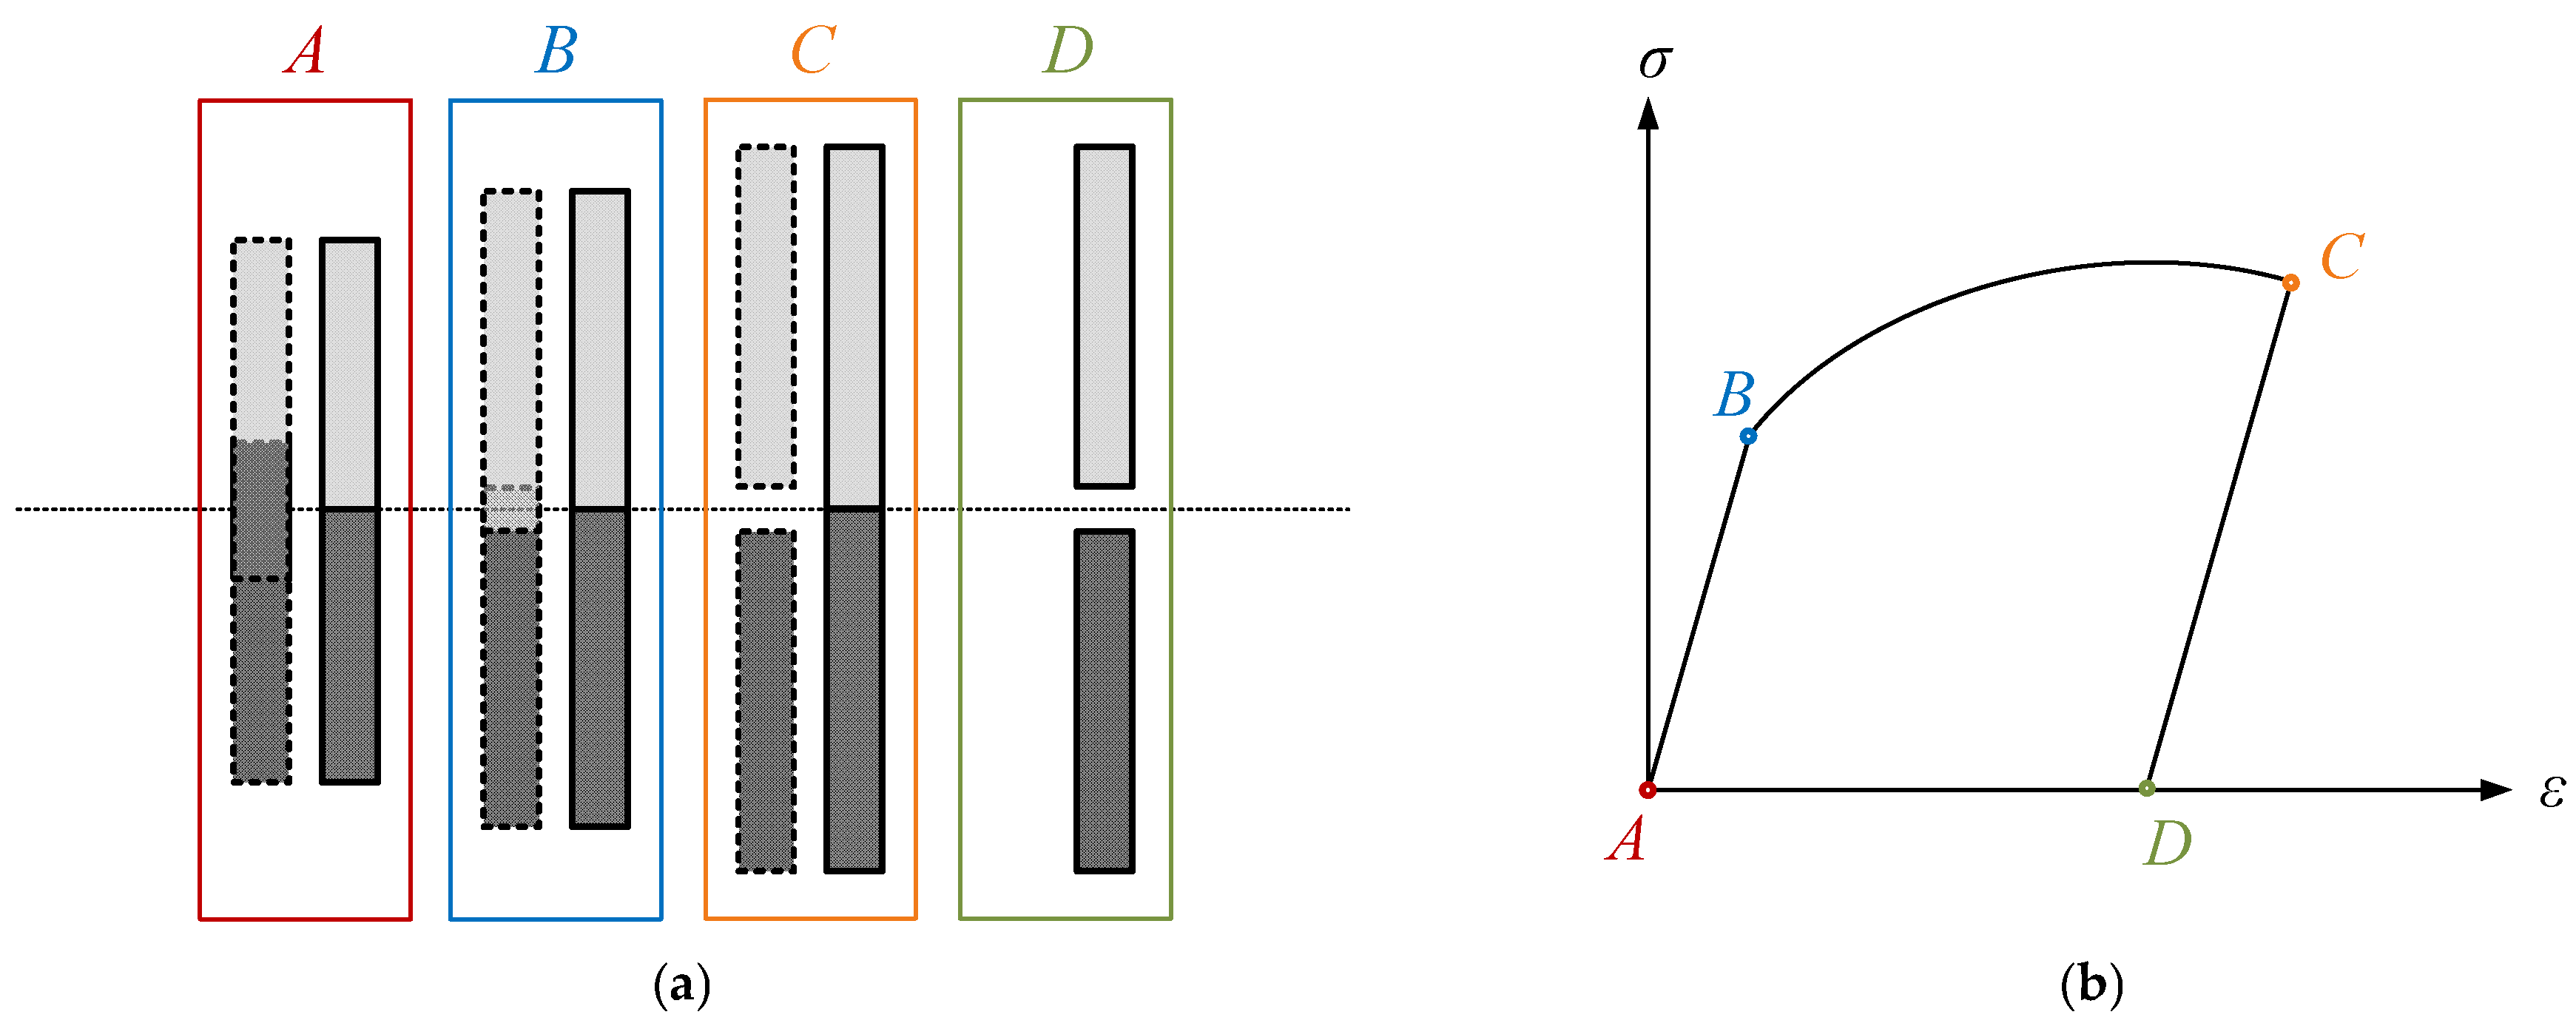
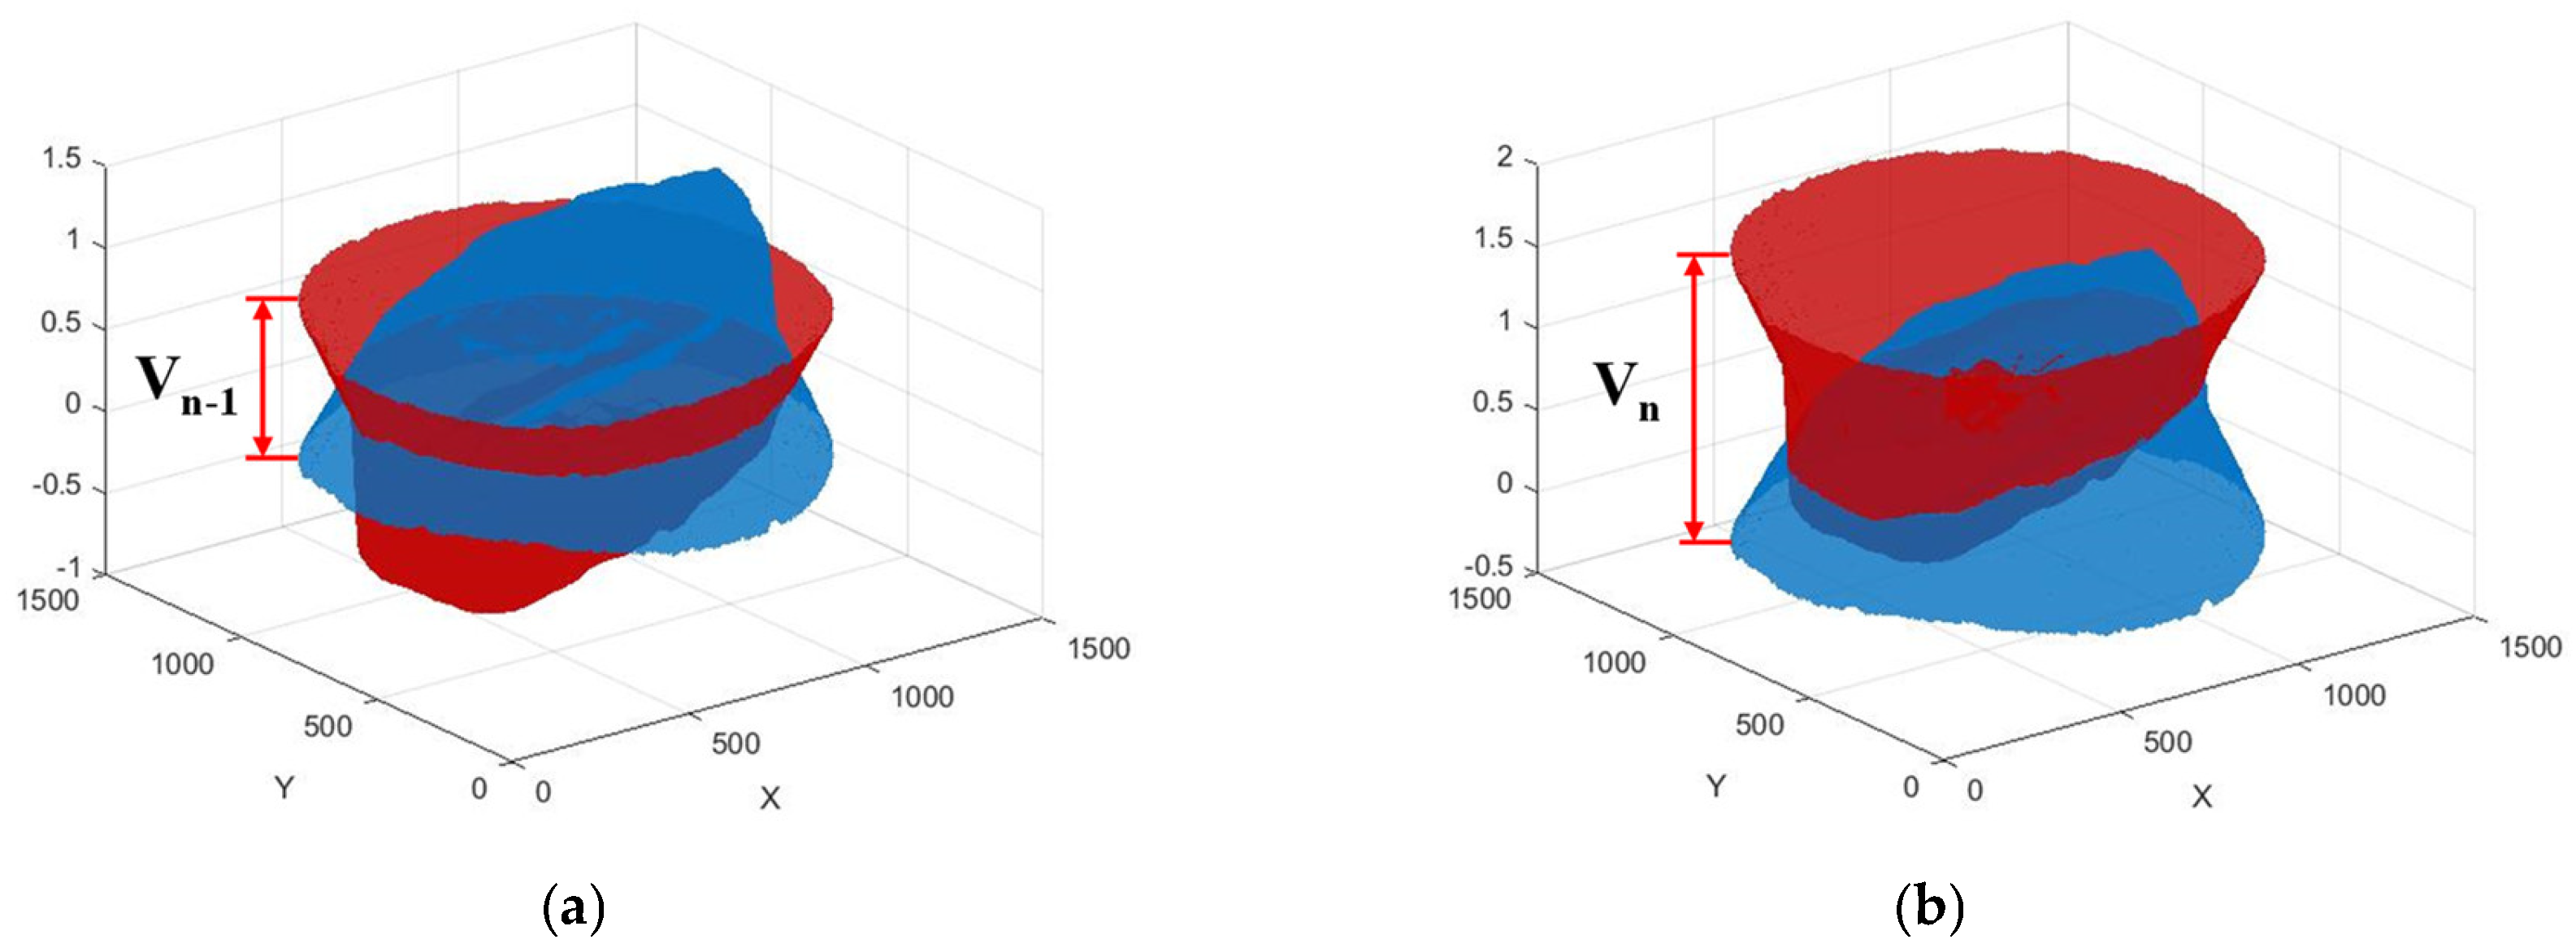
3. Reconstruction of Fracture Surface and Inversion of Fracture Process
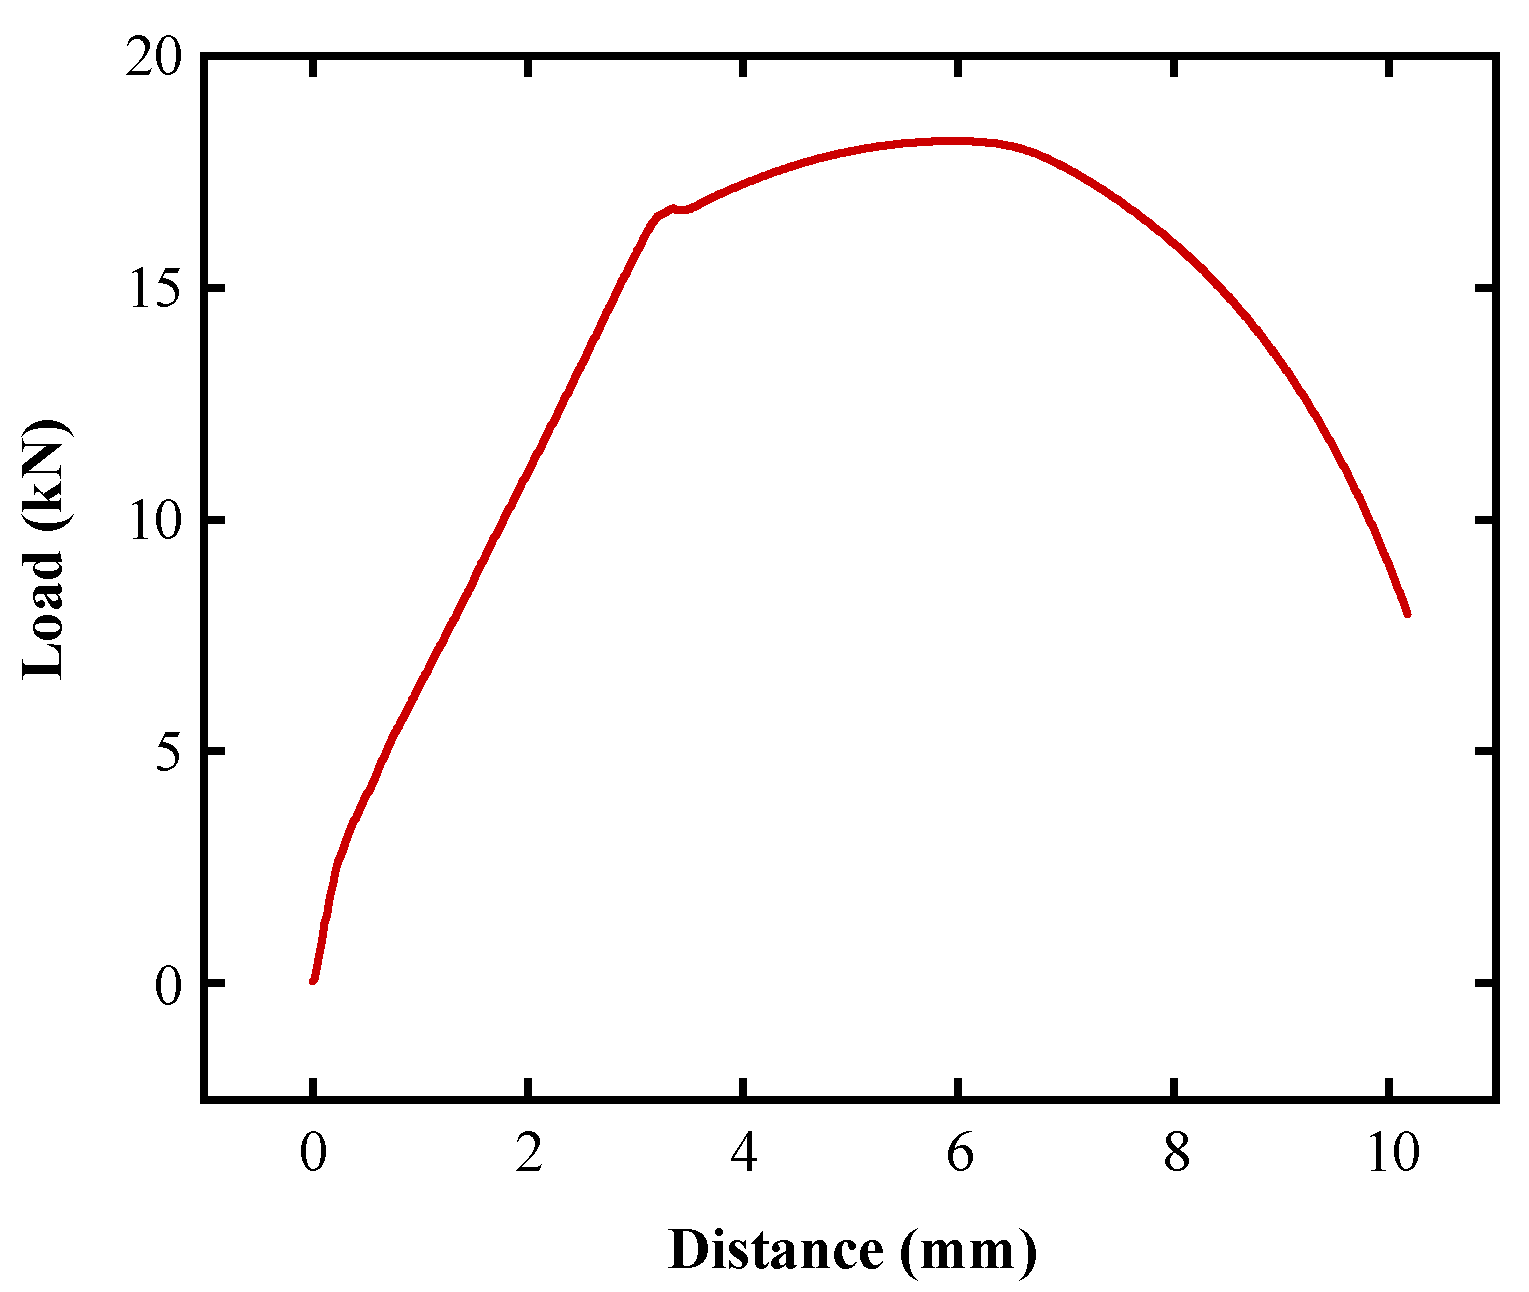
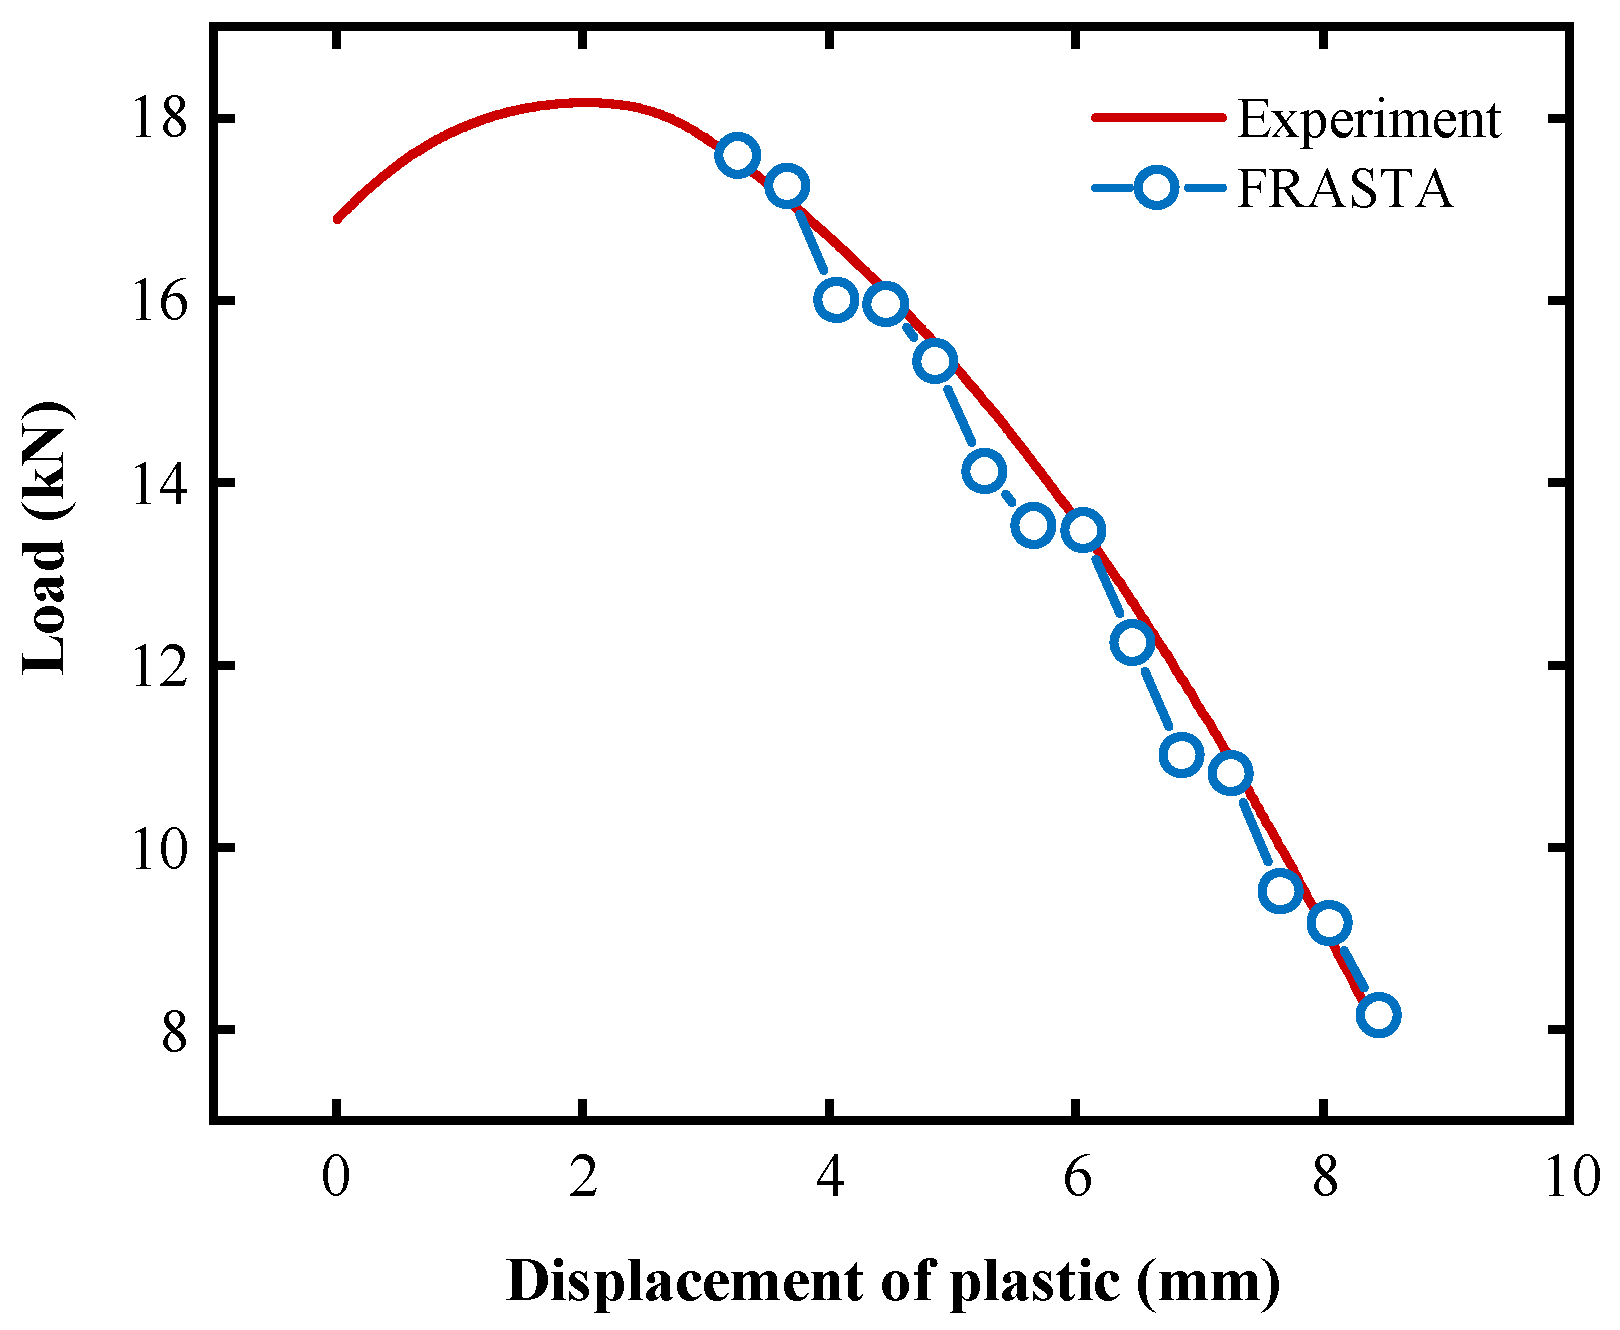
4. Load Measurement
5. Conclusions
Author Contributions
Funding
Institutional Review Board Statement
Informed Consent Statement
Data Availability Statement
Conflicts of Interest
References
- Chen, M.T.; Cai, A.; Pandey, M. Mechanical properties of high strength steels and weld metals at arctic low temperatures. Thin-Walled Struct. 2023, 185, 110543. [Google Scholar] [CrossRef]
- Basso, A.; Sikora, J.; Martinez, R. Analysis of mechanical properties and its associated fracture surfaces in dual-phase austempered ductile iron. Fatigue Fract. Eng. Mater. Struct. 2013, 36, 650–659. [Google Scholar] [CrossRef]
- Li, C.J.; Liu, K.; Wang, H.R. Study on Determination of Mechanical Properties of Metal by Indentation Test. In Proceedings of the 4th IEEE Information Technology, Networking, Electronic and Automation Control Conference 2020, Chongqing, China, 12–14 June 2020; pp. 1961–1965. [Google Scholar]
- Bozca, M. Influence of core hardness on bending strength of tooth in cylindrical gears under quasistatic loading conditions. Fatigue Fract. Eng. Mater. Struct. 2008, 31, 902–910. [Google Scholar] [CrossRef]
- Li, J.B.; Zhong, R.; Shen, X.W. Ultrasonic Nondestructive Testing Method for Mechanical Properties of Metallic Nanomaterials. In Proceedings of the 2020 Asia Conference on Geological Research and Environmental Technology, Kamakura, Japan, 10–11 October 2020; Volume 632, p. 052094. [Google Scholar]
- Raju, N.; Kim, S.; Rosen, D.W. A characterization method for mechanical properties of metal powder bed fusion parts. Int. J. Adv. Manuf. Technol. 2020, 108, 1189–1201. [Google Scholar] [CrossRef]
- Xu, T.D.; Wang, K.; Song, S.H. Measurement Uncertainty and Representation of Tensile Mechanical Properties in Metals. Metals 2021, 11, 1733. [Google Scholar] [CrossRef]
- Matsuoka, S. Fractal Character of Fracture Surfaces on Metals. Zairyo-to-Kankyo 2009, 40, 498–505. [Google Scholar] [CrossRef][Green Version]
- Tanaka, M.; Kimura, Y.; Kayama, A. Fractal analysis of three-dimensional fracture surfaces in metals and ceramics. ISIJ Int. 2004, 44, 1250–1257. [Google Scholar] [CrossRef]
- Tanaka, M.; Kato, R.; Fujita, T. Review of fractal analysis of fracture surfaces in various materials using three-dimensional images reconstructed by stereo matching method. Strength Fract. Comp. 2020, 12, 143–162. [Google Scholar] [CrossRef]
- Zhao, J.H.; Yin, L.M.; Guo, W.J. Influence of three-dimensional roughness of rock fracture on seepage characteristics based on the digital image technology. Arab. J. Geosci. 2019, 11, 778. [Google Scholar]
- Kobayashi, T.; Shockey, D.A.; Schmidt, C.G. Assessment of fatigue load spectrum from fracture surface topography. Int. J. Fatigue 1997, 19, 237–244. [Google Scholar] [CrossRef]
- Ammann, J.J.; Hein, L.R.; Nazar, A.M. Three-Dimensional Reconstruction of Fracture surface. Mater. Charact. 1996, 36, 379–386. [Google Scholar] [CrossRef]
- Abell, A.B.; Lange, D.A. Fracture mechanics modeling using images of fracture surfaces. Int. J. Solids Struct. 1993, 35, 4025–4033. [Google Scholar] [CrossRef]
- Carlos, G.; Edgar, R.; Virgilio, G. Fracture surface of plastic materials: The roughness exponent. Polymer 2002, 43, 6683–6693. [Google Scholar]
- Zhou, H.W.; Xie, H. Anisotropic characterization of rock fracture surfaces subjected to profile analysis. Phys. Lett. 2004, 35, 355–362. [Google Scholar] [CrossRef]
- Yamamoto, T.; Odette, G.R.; Lucas, G.E.; Matsui, H. Confocal microscopy-fracture reconstruction and finite element modeling characterization of local cleavage toughness in a ferritic/martensitic steel in subsized Charpy V-notch impact tests. J. Nucl. Mater. 2000, 283, 992–996. [Google Scholar] [CrossRef]
- Kuroda, T.; Keuchi, K.; Nakade, K. Three-dimensional reconstruction of cleavage fracture surface for duplex stainless steel. Vacuum 2002, 65, 541–546. [Google Scholar] [CrossRef]
- Bocaccini, A.R.; Winkler, V. Fracture surface roughness and toughness of A12O3-platelet reinforced glass matrix composites. Compositres 2002, 33, 125–131. [Google Scholar]
- Lopez, P.; Riss, J.; Archambault, G. An experimental method to link morphological properties of rock fracture surface to their mechanical properties. Int. J. Rock Mech. Min. Sci. 2003, 40, 947–954. [Google Scholar] [CrossRef]


| C | Si | Mn | P | S | Cr | Mo | Ni | Nb | V | Ti | Cu |
|---|---|---|---|---|---|---|---|---|---|---|---|
| 0.04 | 0.23 | 1.87 | 0.01 | 0.003 | 0.025 | 0.27 | 0.23 | 0.06 | 0.006 | 0.017 | 0.13 |
| Rotation Angle | −1° | −0.5° | 0° | 0.5° | 1° |
| Difference range | 1.804 | 1.695 | 0.576 | 0.938 | 1.062 |
Disclaimer/Publisher’s Note: The statements, opinions and data contained in all publications are solely those of the individual author(s) and contributor(s) and not of MDPI and/or the editor(s). MDPI and/or the editor(s) disclaim responsibility for any injury to people or property resulting from any ideas, methods, instructions or products referred to in the content. |
© 2024 by the authors. Licensee MDPI, Basel, Switzerland. This article is an open access article distributed under the terms and conditions of the Creative Commons Attribution (CC BY) license (https://creativecommons.org/licenses/by/4.0/).
Share and Cite
Jia, H.; Jiao, Z.; Dai, L.; Que, Y.; Feng, Q.; Yang, M.; Cao, Y. Establishment of a Uniaxial Tensile Fracture Inversion Model Based on Fracture Surface Reconstruction (FRASTA). Coatings 2024, 14, 489. https://doi.org/10.3390/coatings14040489
Jia H, Jiao Z, Dai L, Que Y, Feng Q, Yang M, Cao Y. Establishment of a Uniaxial Tensile Fracture Inversion Model Based on Fracture Surface Reconstruction (FRASTA). Coatings. 2024; 14(4):489. https://doi.org/10.3390/coatings14040489
Chicago/Turabian StyleJia, Haidong, Zhenghao Jiao, Lianshuang Dai, Yongbin Que, Qingshan Feng, Ming Yang, and Yuguang Cao. 2024. "Establishment of a Uniaxial Tensile Fracture Inversion Model Based on Fracture Surface Reconstruction (FRASTA)" Coatings 14, no. 4: 489. https://doi.org/10.3390/coatings14040489
APA StyleJia, H., Jiao, Z., Dai, L., Que, Y., Feng, Q., Yang, M., & Cao, Y. (2024). Establishment of a Uniaxial Tensile Fracture Inversion Model Based on Fracture Surface Reconstruction (FRASTA). Coatings, 14(4), 489. https://doi.org/10.3390/coatings14040489