Article

Simulation of Preload Relaxation of Bolted Joint Structures under Transverse Loading

College of Nuclear Science and Technology, Naval University of Engineering, Wuhan 430030, China
*
Author to whom correspondence should be addressed.
Coatings 2024, 14(5), 538; https://doi.org/10.3390/coatings14050538
Submission received: 29 March 2024 / Revised: 20 April 2024 / Accepted: 23 April 2024 / Published: 26 April 2024
(This article belongs to the Special Issue Friction and Wear Behaviors in Mechanical Engineering)

Abstract

:
In this study, based on the Iwan model, the connection interface of the bolted joint structure subjected to lateral loads was simulated and comparatively analyzed. Commercial finite element software was used to model the bolted joint structure. Monotonic lateral loads and cyclic displacement loads were applied to the model. The changes in the preload force of the bolted connection structure, as well as the changes in the sticking zone and stress state of the connection interface, were analyzed, and the loading results of monotonic load and cyclic displacement load were compared. The results show that the contact interface stress decreases with the increase in displacement load, and this increase is also a nonlinear relationship, which is approximately in phase with the trend of the contact surface slip curve. The amount of contact surface stress loss and the amount of preload loss are not directly related to the magnitude of the initial preload, regardless of the loading conditions. The contact surface is also circular under any form of displacement loading, whether it is stressed or slipped. The amount of preload loss is proportional to the amount of bolt compression for that variable.

1. Introduction

Bolted connection structures are widely used in engineering fields. They play an important role in carrying static and dynamic loads of structures such as machinery, buildings and bridges [1]. In practical engineering applications, the preload force of bolted structures [2] is one of the key factors to ensure the reliability of the connection and the stability of the structure. Due to changes in the external environment and working conditions, the preload of bolted connection structures often relaxes, leading to structural failure and damage and reducing the reliability and safety of the structure. Therefore, it is of great theoretical and practical significance to accurately predict and evaluate the preload relaxation phenomenon of bolted structures under transverse load [3].
Over the past decades, many scholars and engineers have conducted extensive studies on preload relaxation in bolted structures. In the study of lateral loading [4,5], the mechanism of bolt loosening under lateral vibration is due to the accumulation of local slip on the thread surface [6,7,8,9,10]. Chen found that the process of bolt self-loosening is similar to the form of “creep slip” under lateral loading by analyzing the velocity of movement of each point of the outer ring of the bolt head, which indirectly indicates that the mechanism of loosening is indirect, as the mechanism of loosening is the accumulation of localized slip. Recently, Ding and Gong [11,12] proposed an improved Iwan model to theoretically analyze the mechanism of self-loosening due to the accumulation of local slip. It was found that the force along the radial direction was the main reason for the accumulation of localized slip on the thread surface, on the basis of which some new anti-loosening threads were designed to verify the theory. Their study also pointed out that the reduction in tension at the initial stage is due to stress relief and stress redistribution by finite element analysis and experimental studies on different bolt threads with and without helix angle. On the other hand, Kasei [13] concluded that the driving force for the reduction in bolt tension is the restoring force of the elastic torsional deformation of the bolt stem under low vibration. In addition, Zhang [14] investigated the evolution of wear curves of threaded surfaces under transverse loading using the user subroutine UMESHMOTION in ABAQUS. They explored the mechanisms and laws of the influence of various factors on the preload relaxation of bolted joint structures by means of experiment, simulation and theoretical analysis. Yang [15] gives a simplified method for numerical simulation of bolted joint structures. The method can give theoretical guidance on the accuracy of the simulation simplification. Ranjan and Pandey [16] integrated the proposed hysteresis loop in the pinning process into the Iwan model to better understand the response of bolted joints under vibration/shock loads. However, due to the complexity and variability of bolted joint structures, there are still some shortcomings and challenges in the current research on the preload relaxation of bolted joint structures under transverse loading.

2. Materials and Methods

2.1. Structural Dynamics Modeling of Complex Equipment Connection Interfaces

In the structural dynamic problems, the nonlinear problems existing at the connection interface should be treated and optimized because of the existence of a large number of connection interfaces in the complex equipment structure, which will cause the hysteresis nonlinear behavior of the structure, as well as the stiffness softening and energy dissipation power series and other characteristics [17]. Wu Xinyue et al. [18] analyzed the modeling method of bolted joint structure in modal calculation by the finite element method, which provided theoretical support for the dynamic analysis of bolted joint structure. Traditionally, the connection interface is generally treated by the equivalent linearization method, or the nonlinear part is directly ignored, but this kind of method, because of ignoring the nature of the interface nonlinearity, often results in large experimental errors or fails to predict the structural dynamics behaviors of the calibrated model under certain experimental conditions [19]. The essence of equivalent linearization is to model the nonlinear connection interface with linear equivalent stiffness and linear equivalent damping. However, these methods are not sufficient to deal with the structural dynamic’s problems, so the image-only based mathematical model is proposed as a better-fitting model to solve the structural dynamics problems.
The image-only mathematical model is used to fit the stick–slip friction behavior of the joint interface. Some of the major models are the Iwan model [20,21], Lugre [22] model, Valanis [23] model, etc., as shown in Figure 1. In Figure 1a, F is the total force at initial loading, and u is the displacement. Each Jenkin’s element consists of a linear spring with stiffness, k, in series with a coulomb or slip damper which has a maximum allowable force, qn, where n is the total number of elements. In Figure 1b, v is the velocity of the upper plane slip, and φ is the angle of deformation of the upper brush after contact between the two brushes. In Figure 1c, E0 is the stiffness of contact interface at the sticking condition, Et is the slope of hysteresis loop in slip motion, and κ controls the transition of the hysteresis loop from stick to slip.
The essence of the Lugre mode [22] is to consider the contact interface at the microscopic level as a large number of elastic bristles with random behavior. Mathematical modeling is based on the average deformation of the bristles to equate the interface nonlinearity. The Valanis model [23] is a nonlinear dynamical model used by Michael Valanis to describe nonlinear stress–strain relationships in solid materials. The Valanis model is based on the spring-sheet model. The model treats the material as a mesh of springs and dampers. The model puts the basic elements of the model in terms of a coupled nonlinear partial differential equation. This equation can be solved numerically. Therefore, it can also be used for simulation of finite element models. The Iwan model is a spring–slider system consisting of springs and sliders with Jenkins cells connected in series or in parallel. A probability density function is then introduced to characterize the distribution of the critical slip force for each cell. An image-only model for restoring the force–displacement relationship is established based on the force balance equations established from the force analysis. After comparing several types of models, it is found that the Iwan model is able to better describe the hysteresis nonlinearity phenomenon of the connection interface.
The classical Iwan model [20,21] is used to describe the nonlinear local slip behavior at the interface between the upper and lower plate. It consists of a series of parallel springs–sliders, as shown in Figure 2. The springs are connected in series with the sliders (called spring sliders). Each slider corresponds to a small contact region on the contact interface. The number of springs–sliders is N; that is, the contact interface is divided into N small regions. All spring coefficients are the same and equal to k (k1, k2... kN). The slider has no mass and is subjected to a normal force, FPi. The subscripted letter I indicates the index of the slider, ranging from 1 to n. The fork symbol on the slider indicates the direction of the normal force. All coefficients of friction between the sliders and the plane are the same, denoted by m. Therefore, the critical friction, fi*, that causes sliding for each slider can be calculated as follows:
f i * = F P i * u
The critical friction forces, fi*, are not the same due to differences in the normal force, FPi. Moreover, f is the total lateral force applied to the Iwan model, and u is the resulting displacement. As the total transverse force gradually increases, sliders experiencing smaller critical friction forces will slip first, followed by sliders experiencing larger critical friction forces. At some point, the slip occurs only in some of the sliders, similar to the localized slip behavior at the contact interface. Formula (2) shows the relationship between F and u. Finitial is the total transverse force when the synthetic displacement moves from zero to a maximum value of u0. Fd is the total transverse force when the synthetic displacement moves from u0 to −u0, and Fl is the total transverse force when the synthetic displacement moves from −u0 to u0. Mathematically, the finiteness associated with the initial displacement, u, is given by the following equation:
F i n i t i a l ( u ) = 0 k u f * ρ ( f ) d f * + k u k u ρ ( f * ) d f *
where ρ ( f * ) is the population density of the critical friction, f * is the critical friction, k is the number of elements, and u is the displacement. Based on Masing’s assumptions, Fd(u) and Fl(u) can be derived from the following equation:
D = k ( u u 0 ) 2
F d ( u ) = F i n i t a t ( u 0 ) 2 0 D f ρ ( f ) d f + 2 D D ρ ( f ) d f
F l ( u ) = F i n i t a l ( u 0 ) + 2 0 D f ρ ( f ) d f + 2 D D ρ ( f ) d f
The greater the total lateral force during a complete cycle of vibration, the smaller the slope indicating the relationship between F and u. The greater the total lateral force, the smaller the slope. The smaller the slope, the more sliding sliders are indicated. In the following case, all sliders slip. The slope is horizontal. Therefore, the slope of the relationship curve can indicate the size of the sliding area at the contact interface. Therefore, the nonlinear local sliding behavior at the contact interface can be represented by the Iwan model.

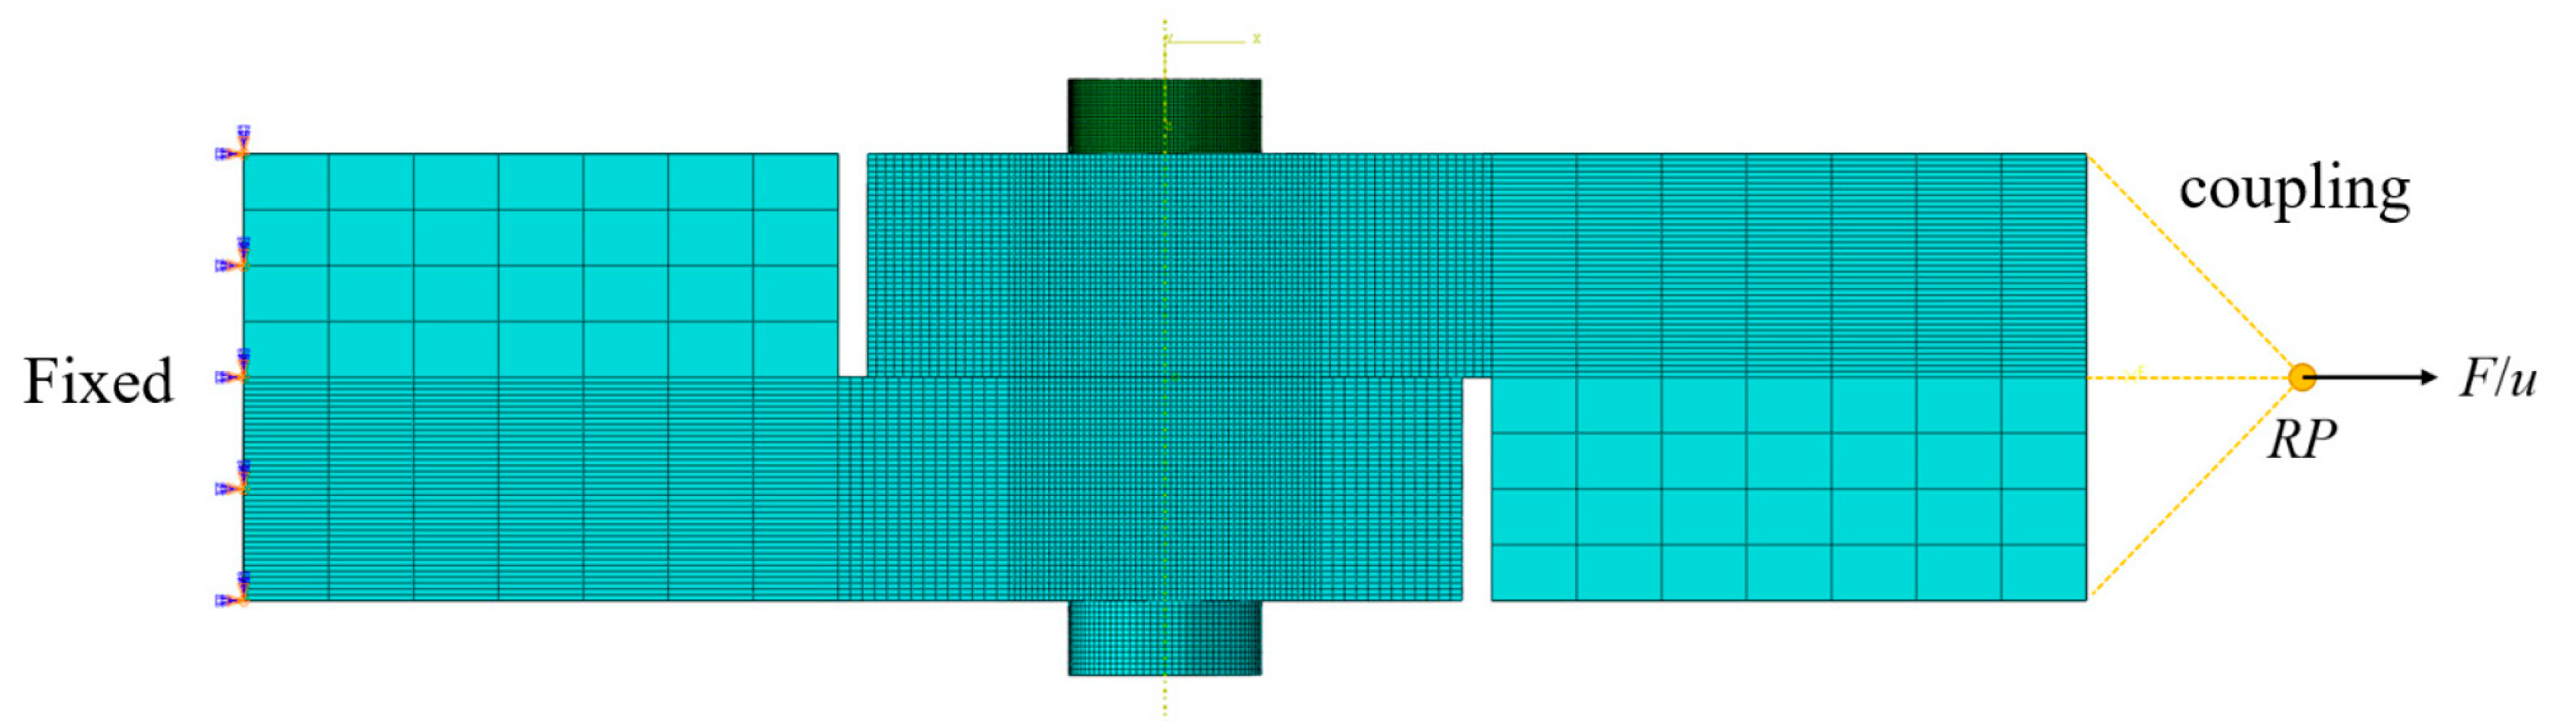
2.2. Finite Element Model Simulation

After establishing the theoretical model to be used, a finite element model was built for simulation, and the results were statistically and post-processed.
When studying the loosening of threaded structures under the action of transverse vibration, it is impossible to use the axisymmetric model of threads for calculation, and it is necessary to take into account the influence of the angle of rise of threads on it. In order to be able to accurately calculate the relative displacement and contact area between the threads under the actual working conditions, it is necessary to determine a suitable coordinate system first, i.e., to adopt a new method to deal with this problem.
In this paper, a simplified geometric model of the bolted connection structure is established according to the parameters of each component of the bolted joint structure [25], which has a bolt, a nut and two identical flat plates, as shown in Figure 3.
Due to the bolt connection structure with threads after meshing, the threads will generate a large number of grid cells and nodes, greatly increasing the amount of computation and greatly reducing the computational efficiency. Not only does it consume computational resources, but it is also time-consuming, for the subsequent calculations bring a lot of inconvenience, coupled with the study of bolts and flat plate connection of the slip of the influence of the small, so this model was optimized to a certain extent, the screw with the removal of threaded lines of cylindrical design. Jin Jing [26] proposed a method of loading the prestressing of bolted joint structures jointly using the local cooling method and the equivalent friction method to simulate the distribution of stress in the pretensioned bolted structures, thus providing a new method for the simulation of bolted joint structures.
The finite element model consists of a bolt, a nut and two identical flat plates. The bolts are made with round bolt heads. The diameter of the head is 13 mm, the thickness of the head is 5 mm, the diameter of the screw is 8 mm and the length of the screw is 30 mm.
Two identical flat plates are used as connected parts for computational analysis. Each plate has a hole in the center of the design, and the diameter of the hole is set to 9 mm.
The thickness of the flat plate is 30 mm, the length of the flat plate is 82 mm, the width of the flat plate is 40 mm, the thickness of the nut is 5 mm and the inner diameter of the nut is 8 mm.
The bolts were made of 40CrMn steel, with the modulus of elasticity set to 2.1 × 10⁵ and Poisson’s ratio set to 0.3; the material used for the flat plate of the connected part was Q235B, with a Young’s modulus of 2.06 × 10⁵ and Poisson’s ratio set to 0.29; and the yield limit of the material was set to 235 MPa.
The nut is threaded, and the diameter of the hole in the connecting plate is larger than the diameter of the screw. The established high-quality model of the bolt and nut is shown in Figure 3a. The mesh of the bolt cross-section and the nut hole is asymmetric with respect to the axis due to the angle of the thread leading angle. In the simplified model, the nut is a hollow cylinder. The difference between the simplified model and the threaded model is that the simplified model simulates a threaded connection by adhesive contact.
The bolt preload is simulated by defining the internal cross-section of the screw, as well as the direction and amplitude of the preload, as shown in Figure 4.
As shown in Figure 5, the tangential load is applied on the reference point (RP) coupled to the right surface of the upper plate, and the left surface of the lower plate is fixed. The coefficient of friction of steel usually ranges from 0.42 to 0.78, and in this paper, the coefficient of friction is 0.6 for all contact surfaces [27].
In this finite element simulation and analysis experiment of the bolted structure model, the analysis step is set as two steps in total.
In the first step, constraints are set on the left end face of the bolted structure model to fix it, and the constraints are completely fixed. At the same time, a constraint is placed on the nut so that it can rotate only in two degrees of freedom, U1 and U2. In the first analysis step, a load is applied to the bolt so that it is tightened by a preload force.
In the second step, a transverse monotonic displacement load is applied to the right end face of the connected flat plate, at which time the bolt connection structure relaxes, and when the preload force reaches a certain level, the localized slip at the connection interface gradually accumulates, which then produces a macroscopic slip. At the same time, the parameters, such as pressure, stress and preload, at the connection interface are changing.

3. Results

3.1. Simulation Results with Monotonic Load Applied

3.1.1. Variation in Preload Force When Applying Different Monotonic Displacement Loads

Firstly, the preload force changes with time when monotonic displacement load is applied and analyzed.
The control variable method is used to control the initial compression of the bolt unchanged, and the type of load monotonically increases the monotonic displacement load, that is, in the case of the same size of the initial preload force, under the action of the same type of load to study the preload relaxation curves corresponding to the different sizes of monotonous displacement loads, respectively. At this time, we take the initial compression of the bolt as 0.1 mm and set the size of the initial preload force as 23,238.2 N, as shown in Figure 6.
Then, the preload relaxation at the maximum different monotonic displacement load is analyzed in comparison. By observing the curve at the end of the 2 s preload magnitude, the results of applying monotonic displacement load and loss of preload can be observed, as shown in Table 1. And it can be seen that the loss of preload force increases with the increase in monotonic displacement load.

3.1.2. Variation in Stress Maxima at Contact Surfaces with Different Initial Preloads

Taking the monotonic displacement load of 0.5 mm applied when the initial compression of the bolt is 0.3 mm as an example, with the continuous application of the load, the bolt connection structure begins to relax, and the preload begins to drop. At the same time, along with the drop of the preload, the contact stress of the bolt connection interface also decreases with the application of the load, and at this time, the stress generated on the contact surface during the whole process reaches a minimum at the end of the Step-2 The contact stress generated at the contact surface during the whole process is minimized at the end of Step-2. As shown in Figure 7 below, it can be observed via the stress cloud diagram of the contact surface that, although the shape of the contact surface is rectangular, the stress generation is continuously spreading outward in an approximate circle, which is related to the viscous region described above. At the same time, it can be observed from the graph that the value of stress is larger the closer to the screw hole, and the value of stress is larger the closer to the surface of the screw hole, and as the depth of the screw hole becomes larger, the stress becomes smaller and smaller.
1.
Step-2, Maximum Stress at Initial Stage
At the time when the tightening load is applied, the monotonic displacement load is not yet applied, i.e., the initial stage of Step-2, and the monotonic displacement load is 0.5 mm, the relationship between the maximum value of the contact surface stress and the initial compression of the bolt is as follows second item. The variation of the maximum stress at the initial contact surface in Step 2 is shown in Table 2.
2.
Maximum Stress at the End of Step-2 Stage
At the end of the Step-2 stage, the variation in contact surface stresses after monotonic displacement loading was investigated; the specific data are shown in Table 3.
3.
Effect of initial preload on stress change during relaxation
Step-2 at the beginning of the monotonic displacement load is not yet applied, and the Step-2 end of the monotonic displacement load effect is completed; this whole process completed the relaxation of stress, so the study of the difference between the above stresses can be investigated preload in regard to the relaxation process of the effect of stress change. Its falling data statistics are shown in Table 4.
Our observation of the data shows that, regardless of the initial compression of the bolts, under the same monotonic displacement loading condition, the change in the loss of contact surface stress is very small; it increases with the increase in the initial compression, but the increase is very small. This proves that the loss of contact surface stress is not much affected by the size of the initial preload. Regardless of how large or small the initial preload force is, after the same loading condition, the value of stress reduction at the contact interface is basically the same. Considering the relationship between the preload force and the stress further, since the area and shape of the viscous region generated at the contact interface under different conditions are basically the same, and the region subjected to the force is basically the same, it can be learned that the amount of the preload reduction is also independent of the magnitude of the initial preload force.

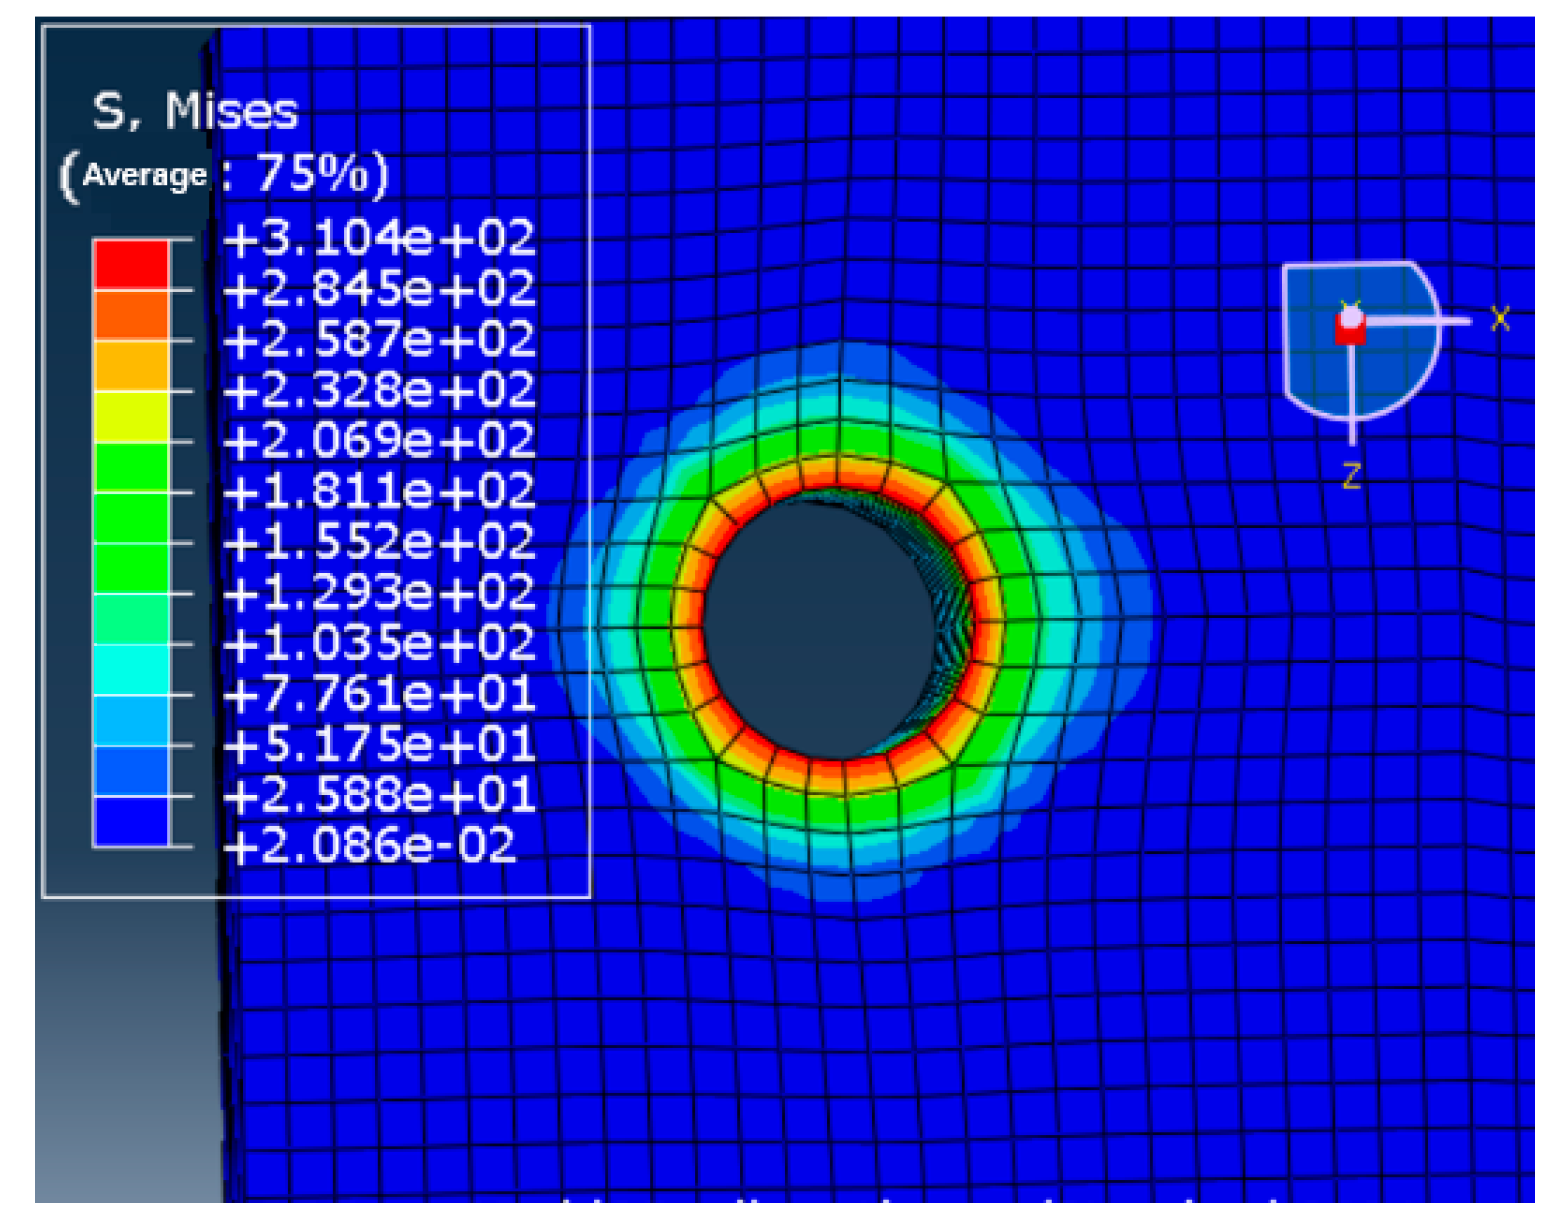
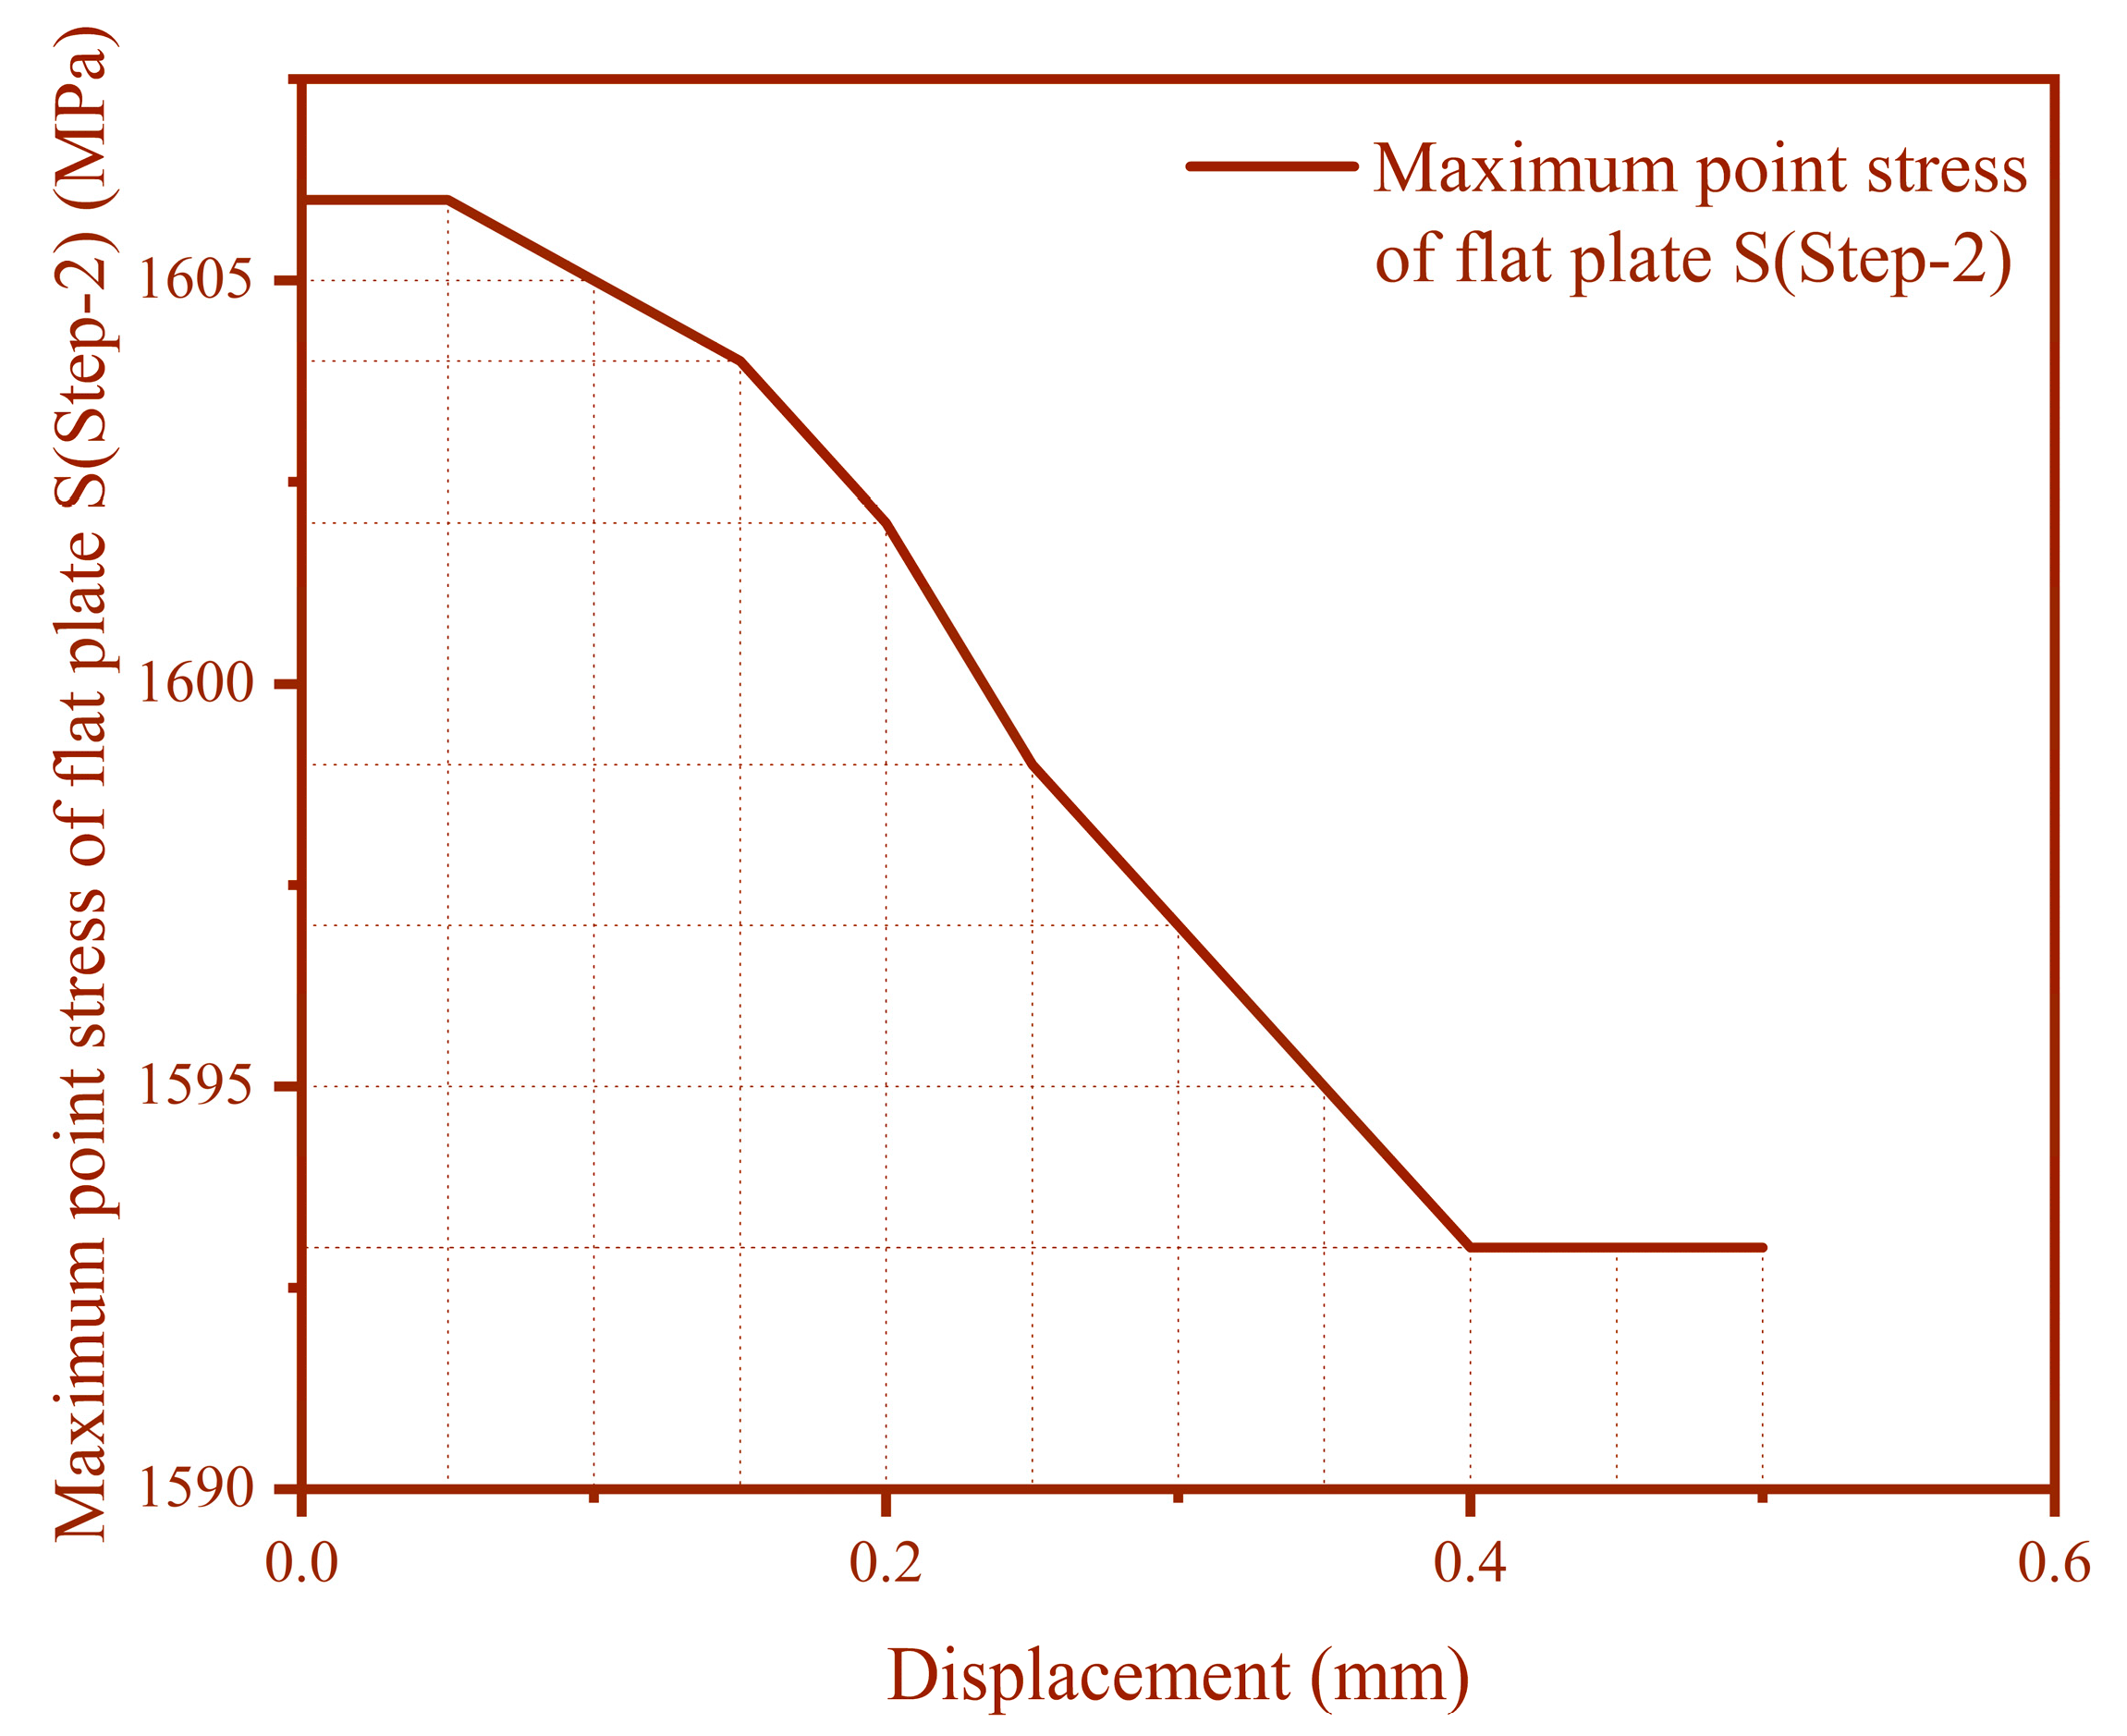
3.1.3. Variation in the Maximum Stress at the Contact Surface

From the data, it can be seen that the contact interface stress decreases with the increase in monotonic displacement load, and this increase is also a nonlinear relationship. The data in Table 5 are transformed into a line graph in Figure 8. The figure gives a clearer view of the relationship between the variation in the stress and the displacement at the maximum point stress of the flat plate. As the displacement increases, the maximum point stress initially decreases insignificantly. After reaching an extreme point, the maximum point stress begins to decrease. In the process of decreasing, the absolute value of the slope of the curve becomes larger and then smaller. Finally, it tends to stabilize. Combined with the Iwan model and the previous analysis, it is found that this is approximately the same as the trend of the slip curve of the contact surface, which also proves that the relaxation of the stress is a major cause of slip generation, and the two are closely related.

3.2. Simulation Results of Applied Cyclic Displacement Load

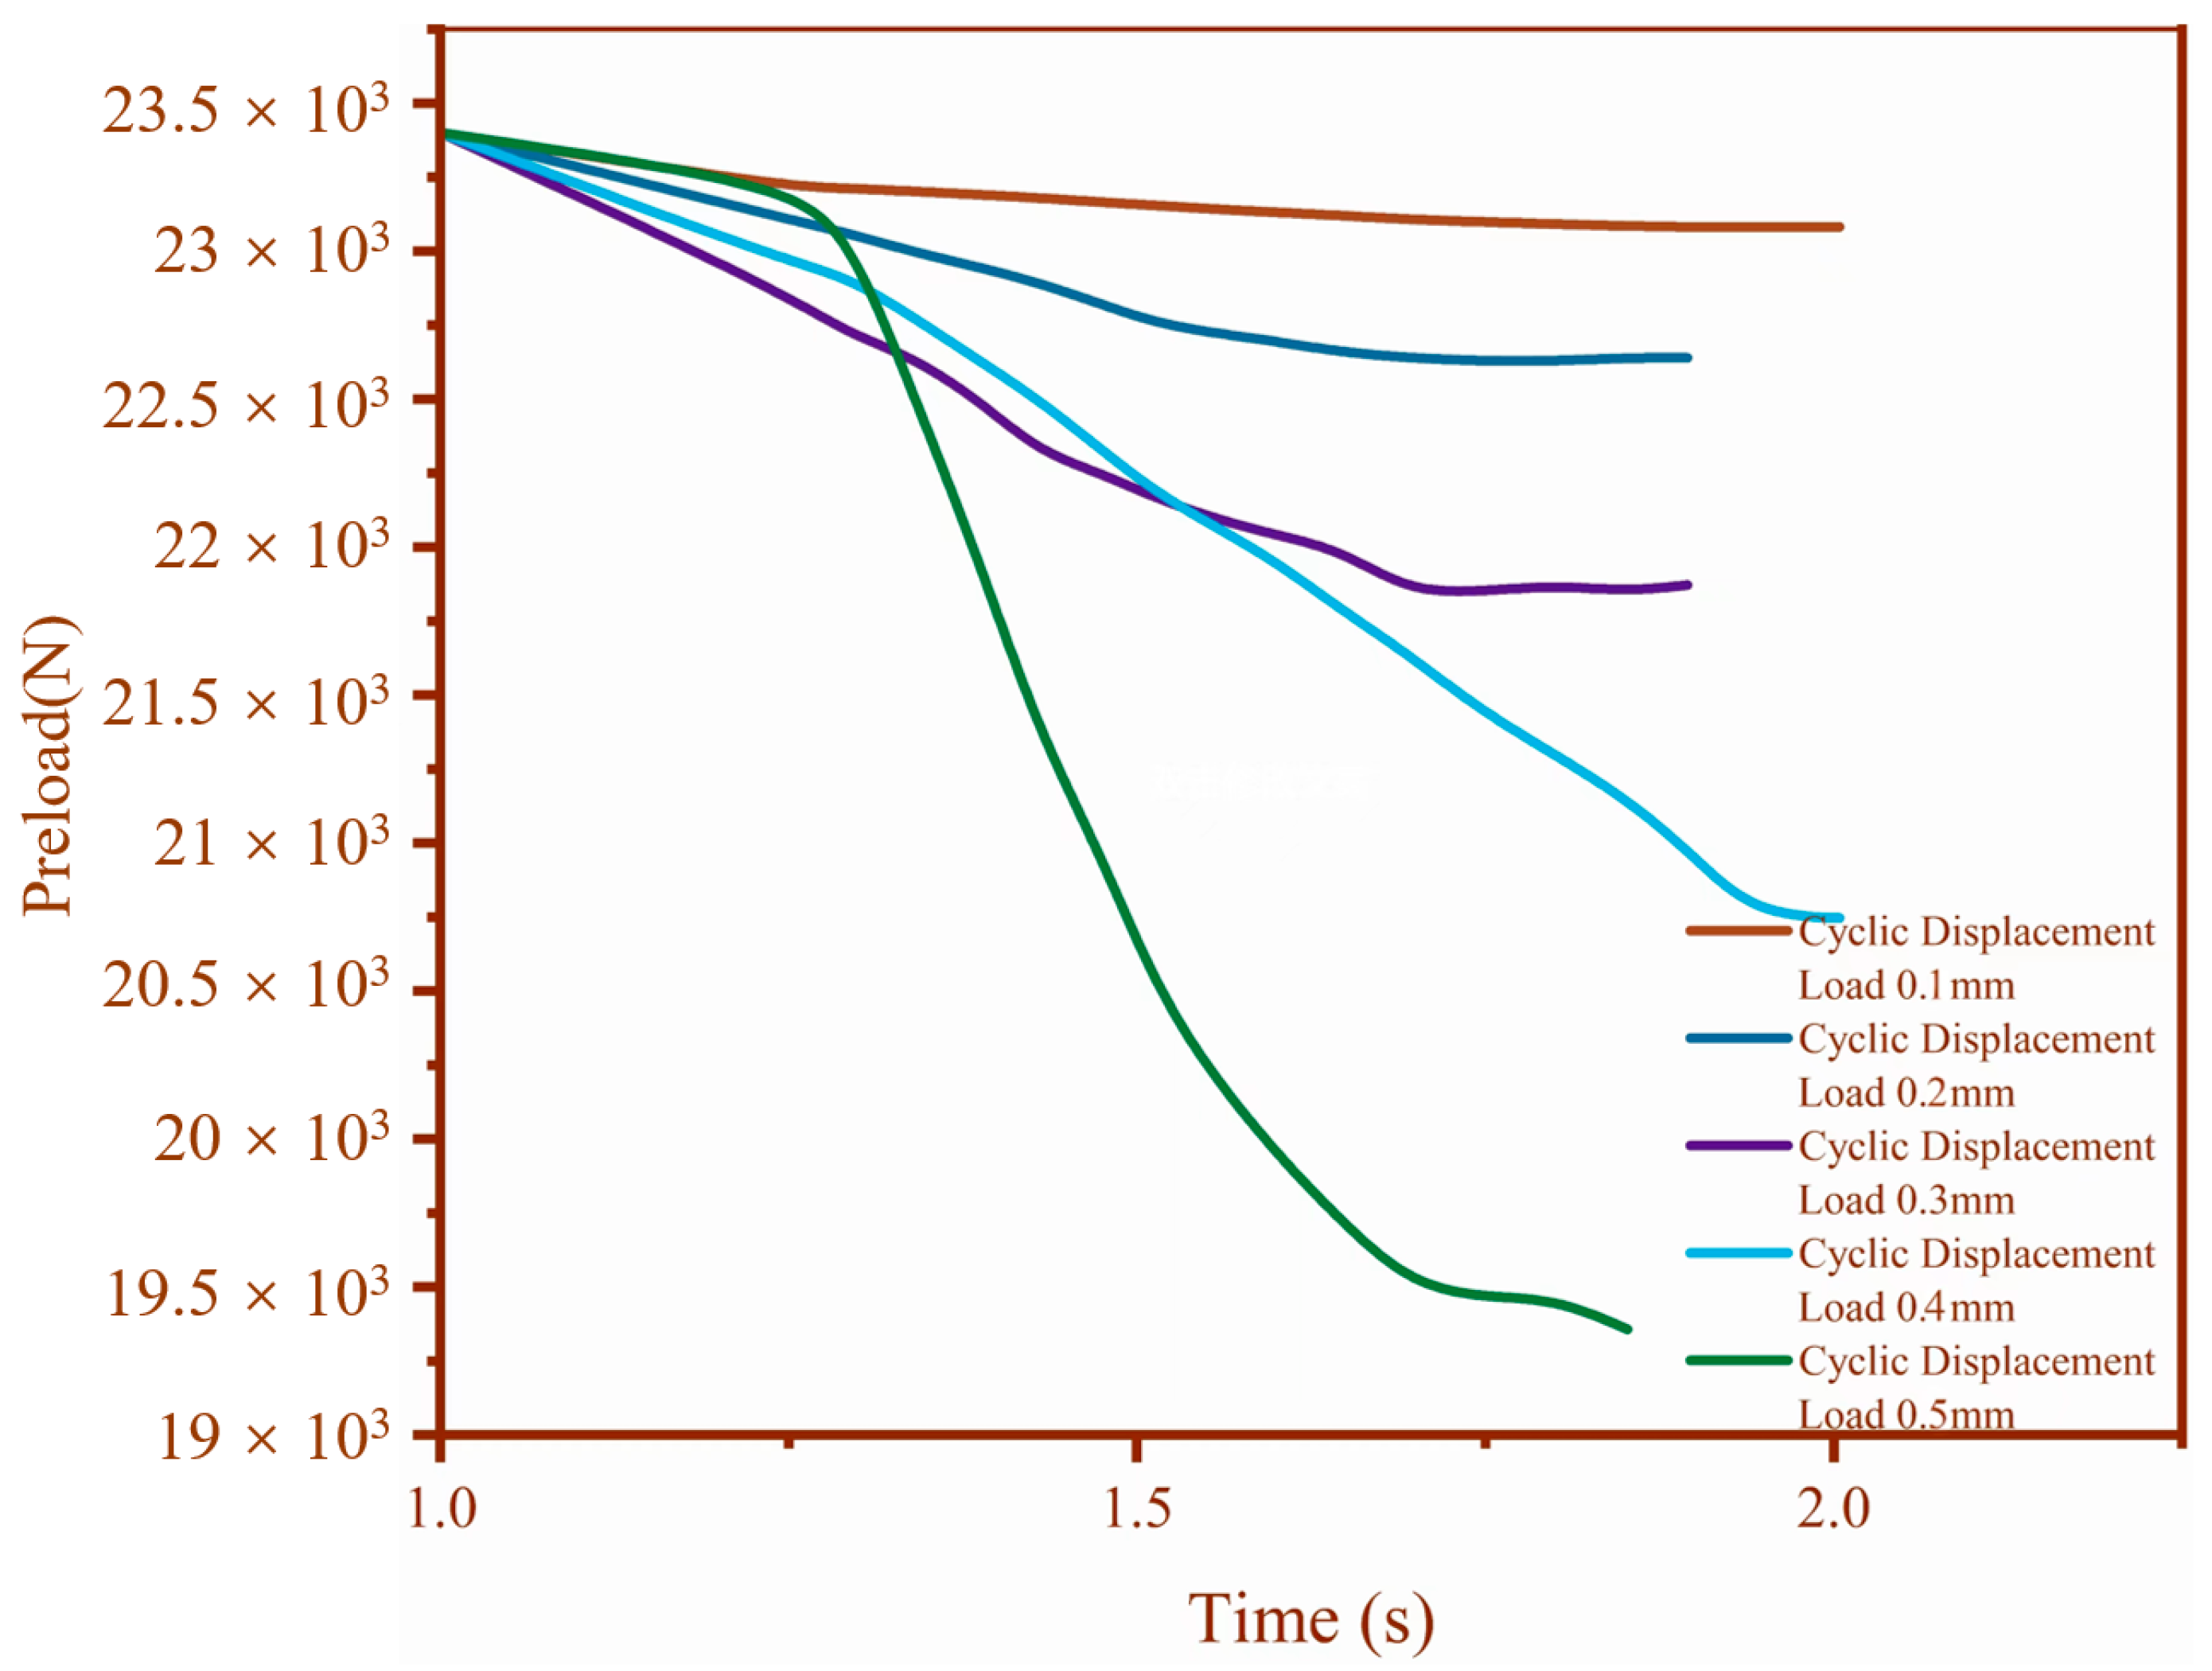
3.2.1. Variation in Preload Force When Applying Different Cyclic Displacement Loads

(1)
Variation in preload force with time when cyclic displacement load is applied
Using the control variable method, the initial compression of the bolt is controlled to be unchanged, i.e., in the case of the same size of the initial preload, the preload relaxation curves corresponding to different sizes of cyclic displacement loads are investigated under the same type of loads.
At this time, we take the initial compression of the bolt as 0.1 mm. Different cyclic displacement loads corresponding to the preload curve, as shown in Figure 9, correspond to the cyclic displacement load as follows: 0.5 mm, 0.4 mm, 0.3 mm, 0.2 mm and 0.1 mm.
When the initial compression of the bolt is 0.1 mm, the initial preload is controlled and unchanged to study the effect of different cyclic displacement load on the preload relaxation. An analysis of the Figure 9 shows that the trend of the preload relaxation with the application of monotonic displacement load is approximately the same, the first slow increase in the rapid increase, and finally the trend tends to stabilize, and once again, this verified the preload relaxation law: that is, the preload relaxation will first lead to the sliding surface of the Jenkinson unit force into the viscous state, there is a microscopic local slippage, the material undergoes elastic deformation, and at the same time produces a drag force; the preload will reduce a certain degree of obstruction, so the trend is slower at the beginning; with the increasing load, more and more small slider units began to slip, local slip continues to accumulate, the material continues to move toward plastic deformation, and it finally reaches a certain level that is manifested in the macro-slip, the occurrence of stress relaxation, resulting in a rapid decrease in the preload, so with the increase in the load preload is rapidly reduced; and with the accumulation of plastic deformation, the plastic deformation region continues to accumulate, and the material is elastic deformation. With the accumulation of plastic deformation, the region of plastic deformation increases, the internal stress field inside the material slowly tends to stabilize and finally the curve gradually tends to stabilize.
(2)
Comparison of preload relaxation at maximum load for different cyclic displacements
Observing Figure 10 and Table 6, we can see that the relaxation and loss of preload force trends and patterns are approximately the same as when monotonic displacement loads are applied. While observing the table, it can be observed that the decrease in the preload force is not linear, and it is known that the loss of preload force increases with the increase in the displacement load through curve fitting, and the relationship between the two is a high degree and polynomial. The amount of preload loss is a curvilinear increase. The slope of the curve increases with the increasing displacement. The larger the displacement, the faster the preload decreases.

3.2.2. Variation in the Maximum Value of Contact Surface Stress under Different Initial Preloads

This simulation is based on the mechanism of preload generation, and the preload generation is observed to be related to the compression amount, and the initial preload is applied by applying the compression amount on the bolts of the bolted joint structure. Here, we control the amplitude of the cyclic displacement load at 0.5 mm; change the initial compression of the bolt, i.e., change the initial preload force of the bolt; analyze the maximum stress of the initial contact surface at Step-2 and the maximum stress of the contact surface at the end of Step-2 through the simulation results and calculate the difference between the two, i.e., the decrease in the preload force of the contact surface, to analyze the effect of the initial preload force on the change in the stress of the contact surface after the cyclic loading condition. The effect of initial preload on the change in contact surface stress after cyclic loading condition is analyzed.
Through the observation of the Table 7, combined with the stress change in the contact surface under monotonic displacement load, and compared with the change under monotonic displacement load, it is found that the trend of the curves plotted by the two is basically the same. The plotted curves are shown in Figure 11. The conclusions obtained in the previous section can be further expanded to make them more universal; that is, regardless of the load conditions and the amount of stress loss in the contact surface, the amount of loss of preload is not directly related to the size of the initial preload. Figure 8 reveals that, regardless of the initial compression of the bolts, the change in the loss of contact surface stresses for the same monotonic displacement loading condition is very small. It increases with the increase in initial compression, but it increases very little. This proves that the loss of contact surface stress is not much affected by the size of the initial preload. Regardless of how large or small the initial preload is, the value of stress reduced at the contact interface is essentially the same after the same loading condition applied. Considering further the mathematical and physical relationship between preload and stress, we can see that the area and shape of the viscous region generated at the contact interface under different conditions are basically the same, and the region under stress is basically the same. The amount of preload reduction is also independent of the magnitude of the initial preload.

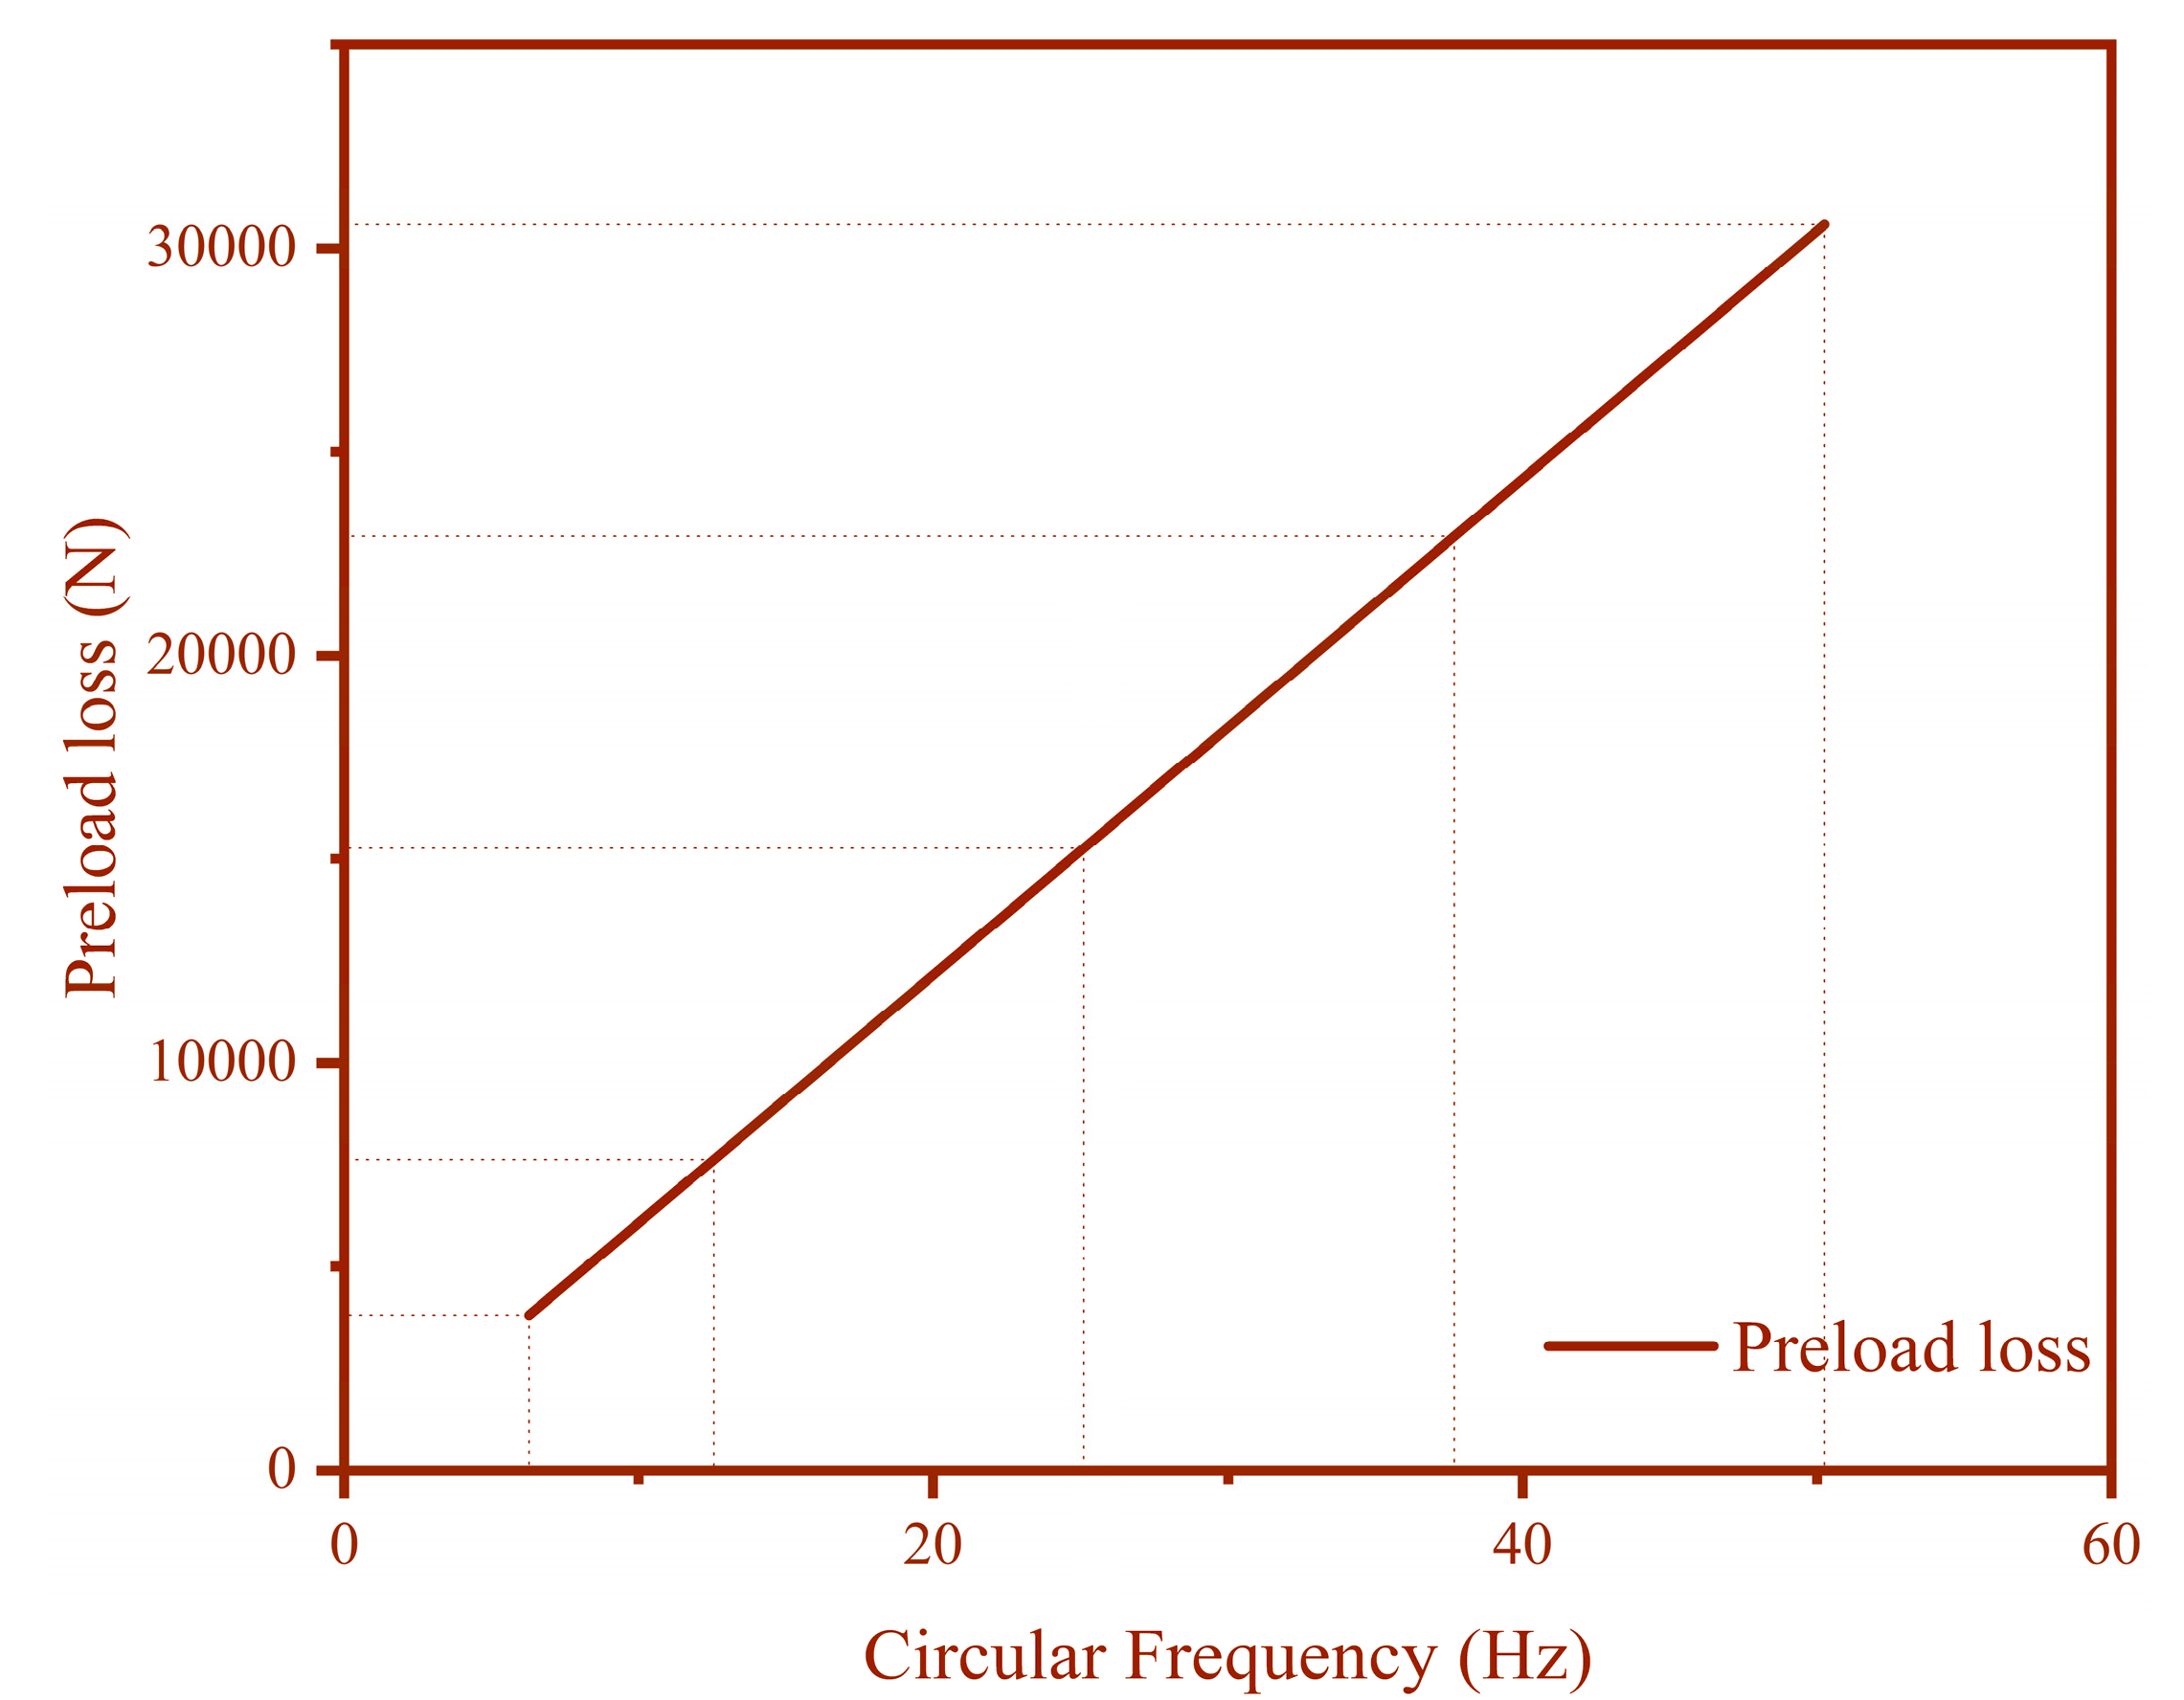
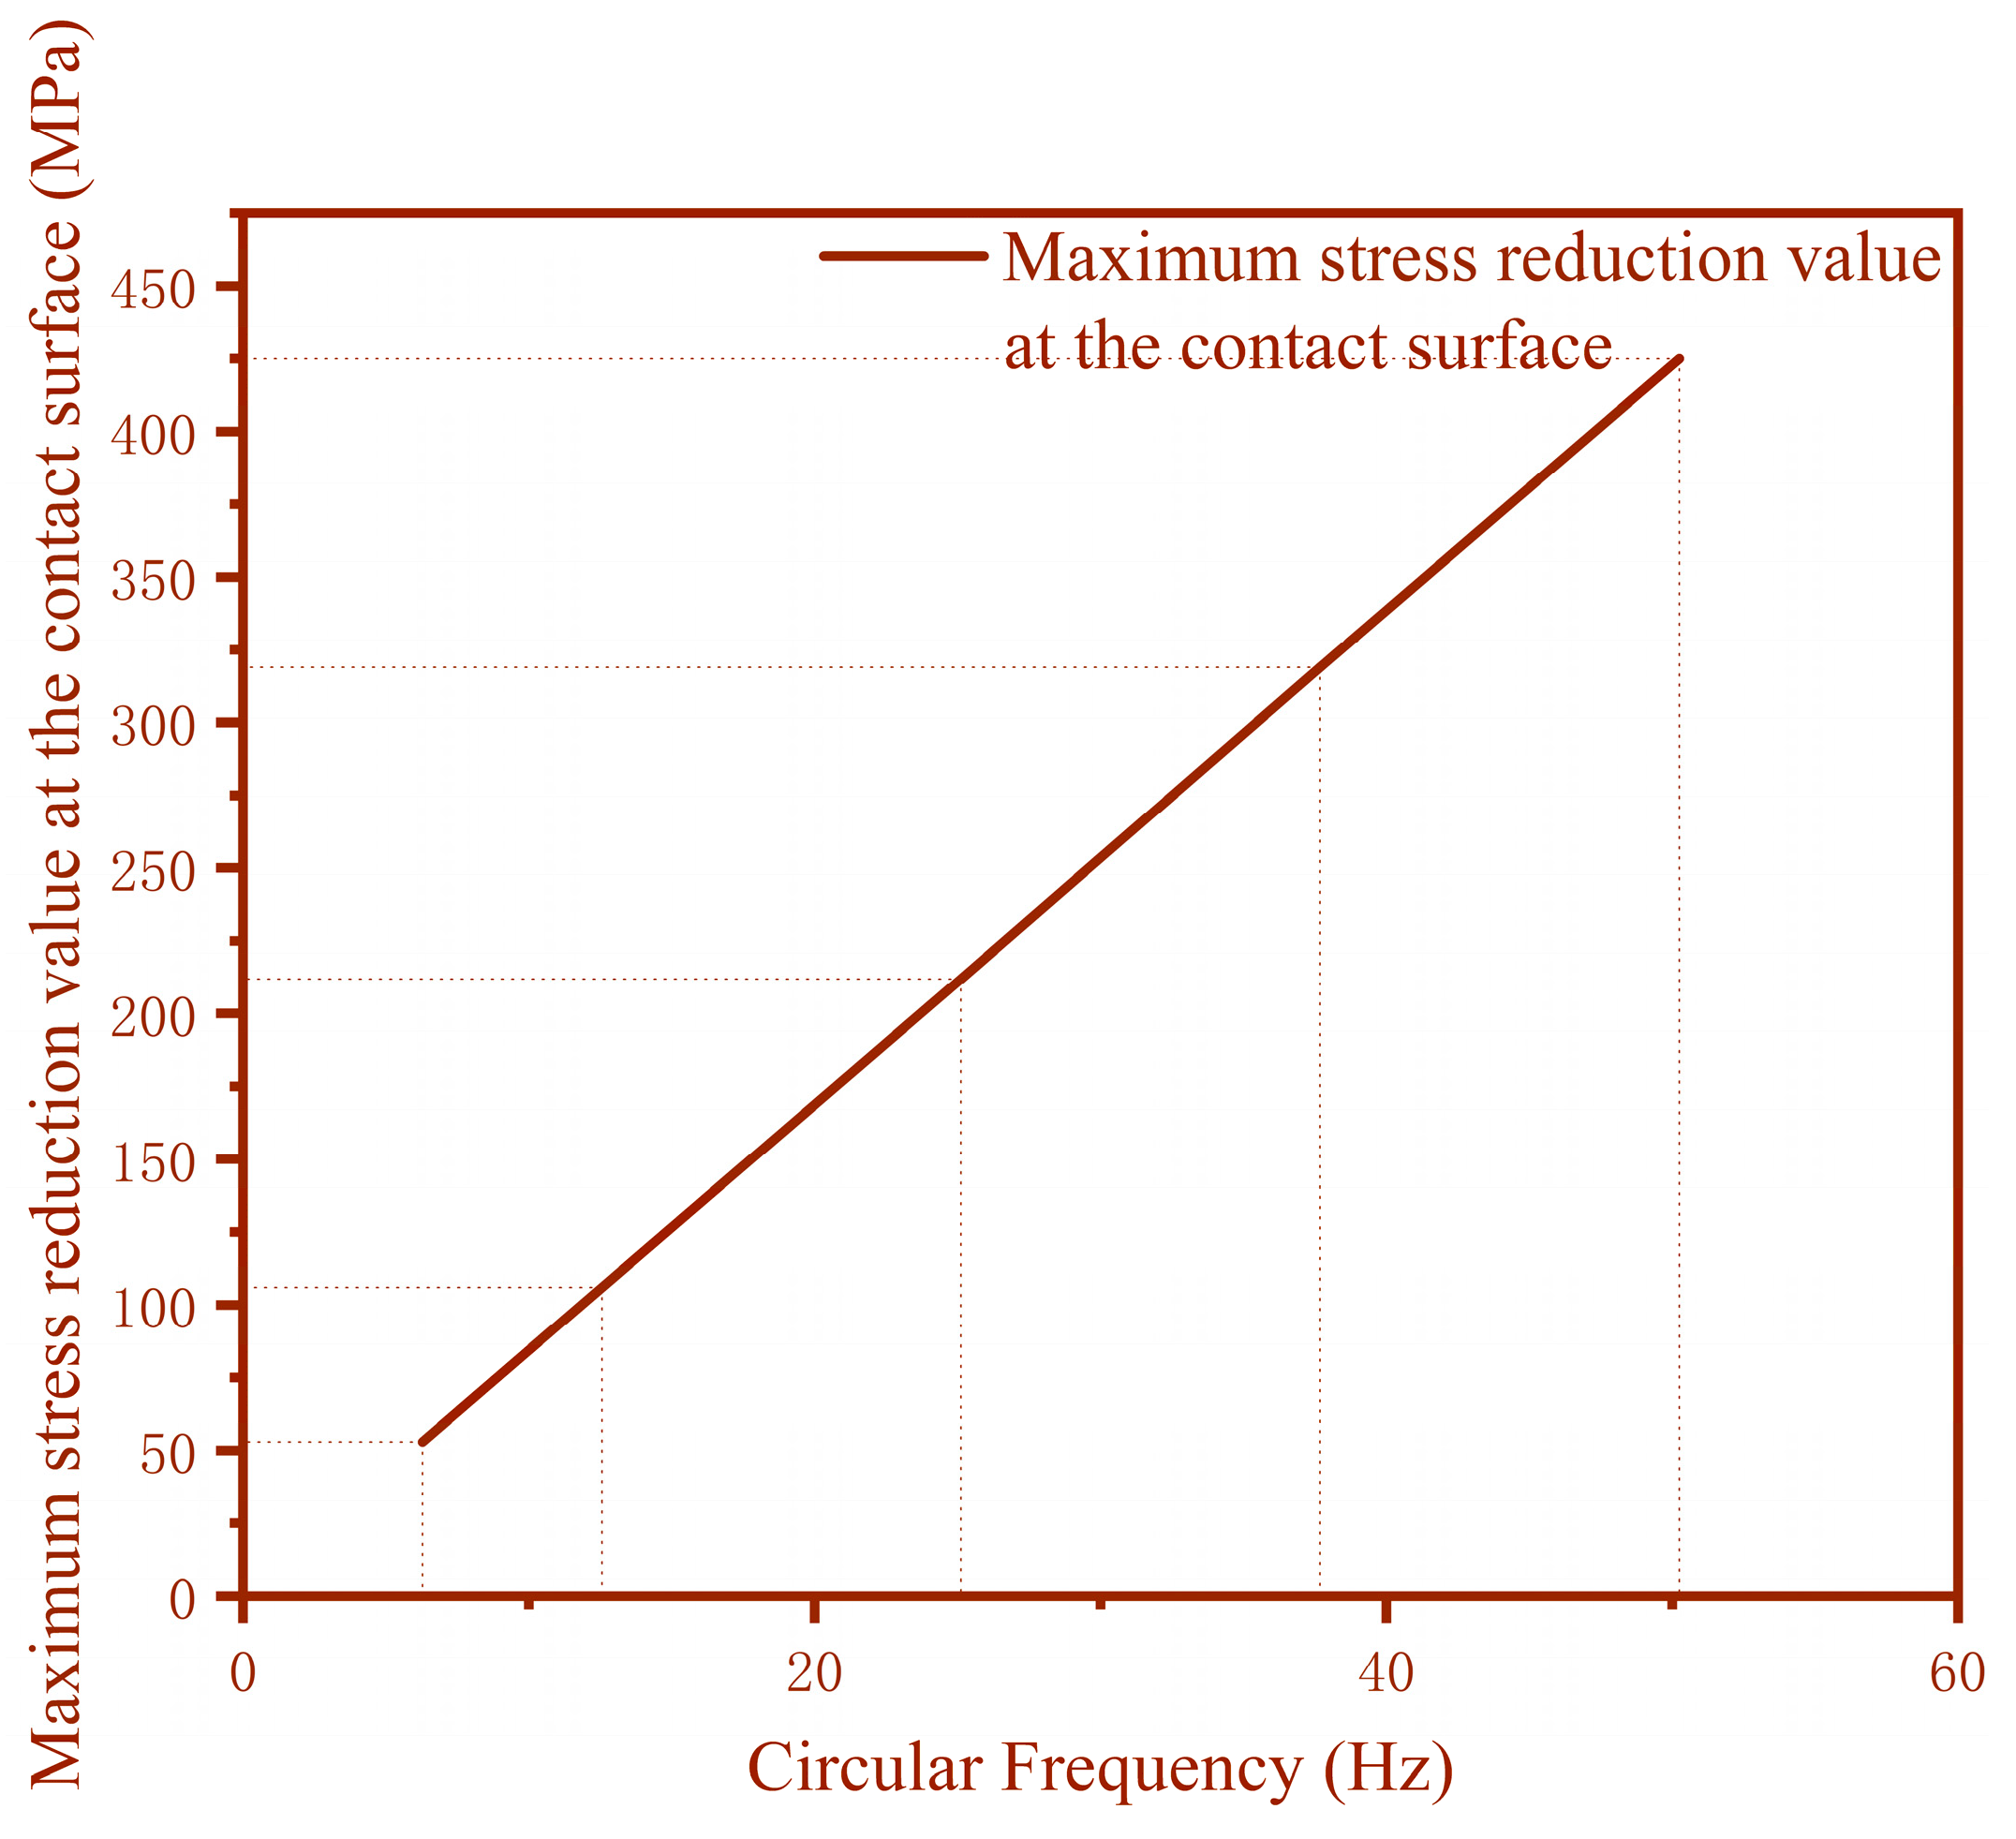
3.2.3. Effect of Frequency Variation in Applied Cyclic Displacement Loads

(1)
Effect of frequency variation on preload relaxation
Through the theoretical analysis, it can be observed that the change in cyclic load frequency will also have an important effect on the relaxation of the preload force, so we need to explore the effect of the change in cyclic load frequency on the relaxation of the preload force and to compare the change in the preload force relaxation under the action of cyclic loads of different frequencies. The amplitude of the cyclic displacement load is uniformly set to 0.5 mm, the initial compression of the bolt is uniformly set to 0.5 mm, and the following figure shows the frequency settings of several cyclic displacement loads. The circular frequency of Figure 12 (a) is 6.28, (b) is 12.56, (c) is 25.12, (d) is 37.68 and (e) is 50.24. The change in preload force with frequency is based on the data obtained from the experiment and is shown in Table 8 below.
The change in preload force with frequency is based on the data obtained from the experiment, as shown in Figure 13 below. Our analysis shows that the amount of loss of preload force is proportional to the circular frequency.
(2)
Effect of frequency variation on preload relaxation
Based on the previous theory, we know that the change in cyclic load frequency will also have an important effect on the contact surface stress relaxation, so we investigate the effect of the change in cyclic load frequency on the contact surface stress relaxation in the following and compare the change in the contact surface stress relaxation under the action of cyclic load with different frequencies. The amplitude of the cyclic displacement load is set to 0.5 mm, and the initial compression of the bolt is set to 0.5 mm. Figure 14 and Table 9 below show the changes in the contact surface stress under the cyclic displacement load with different frequencies.
The analysis shows that the decrease value of the contact surface stress is proportional to the frequency of cyclic loading.

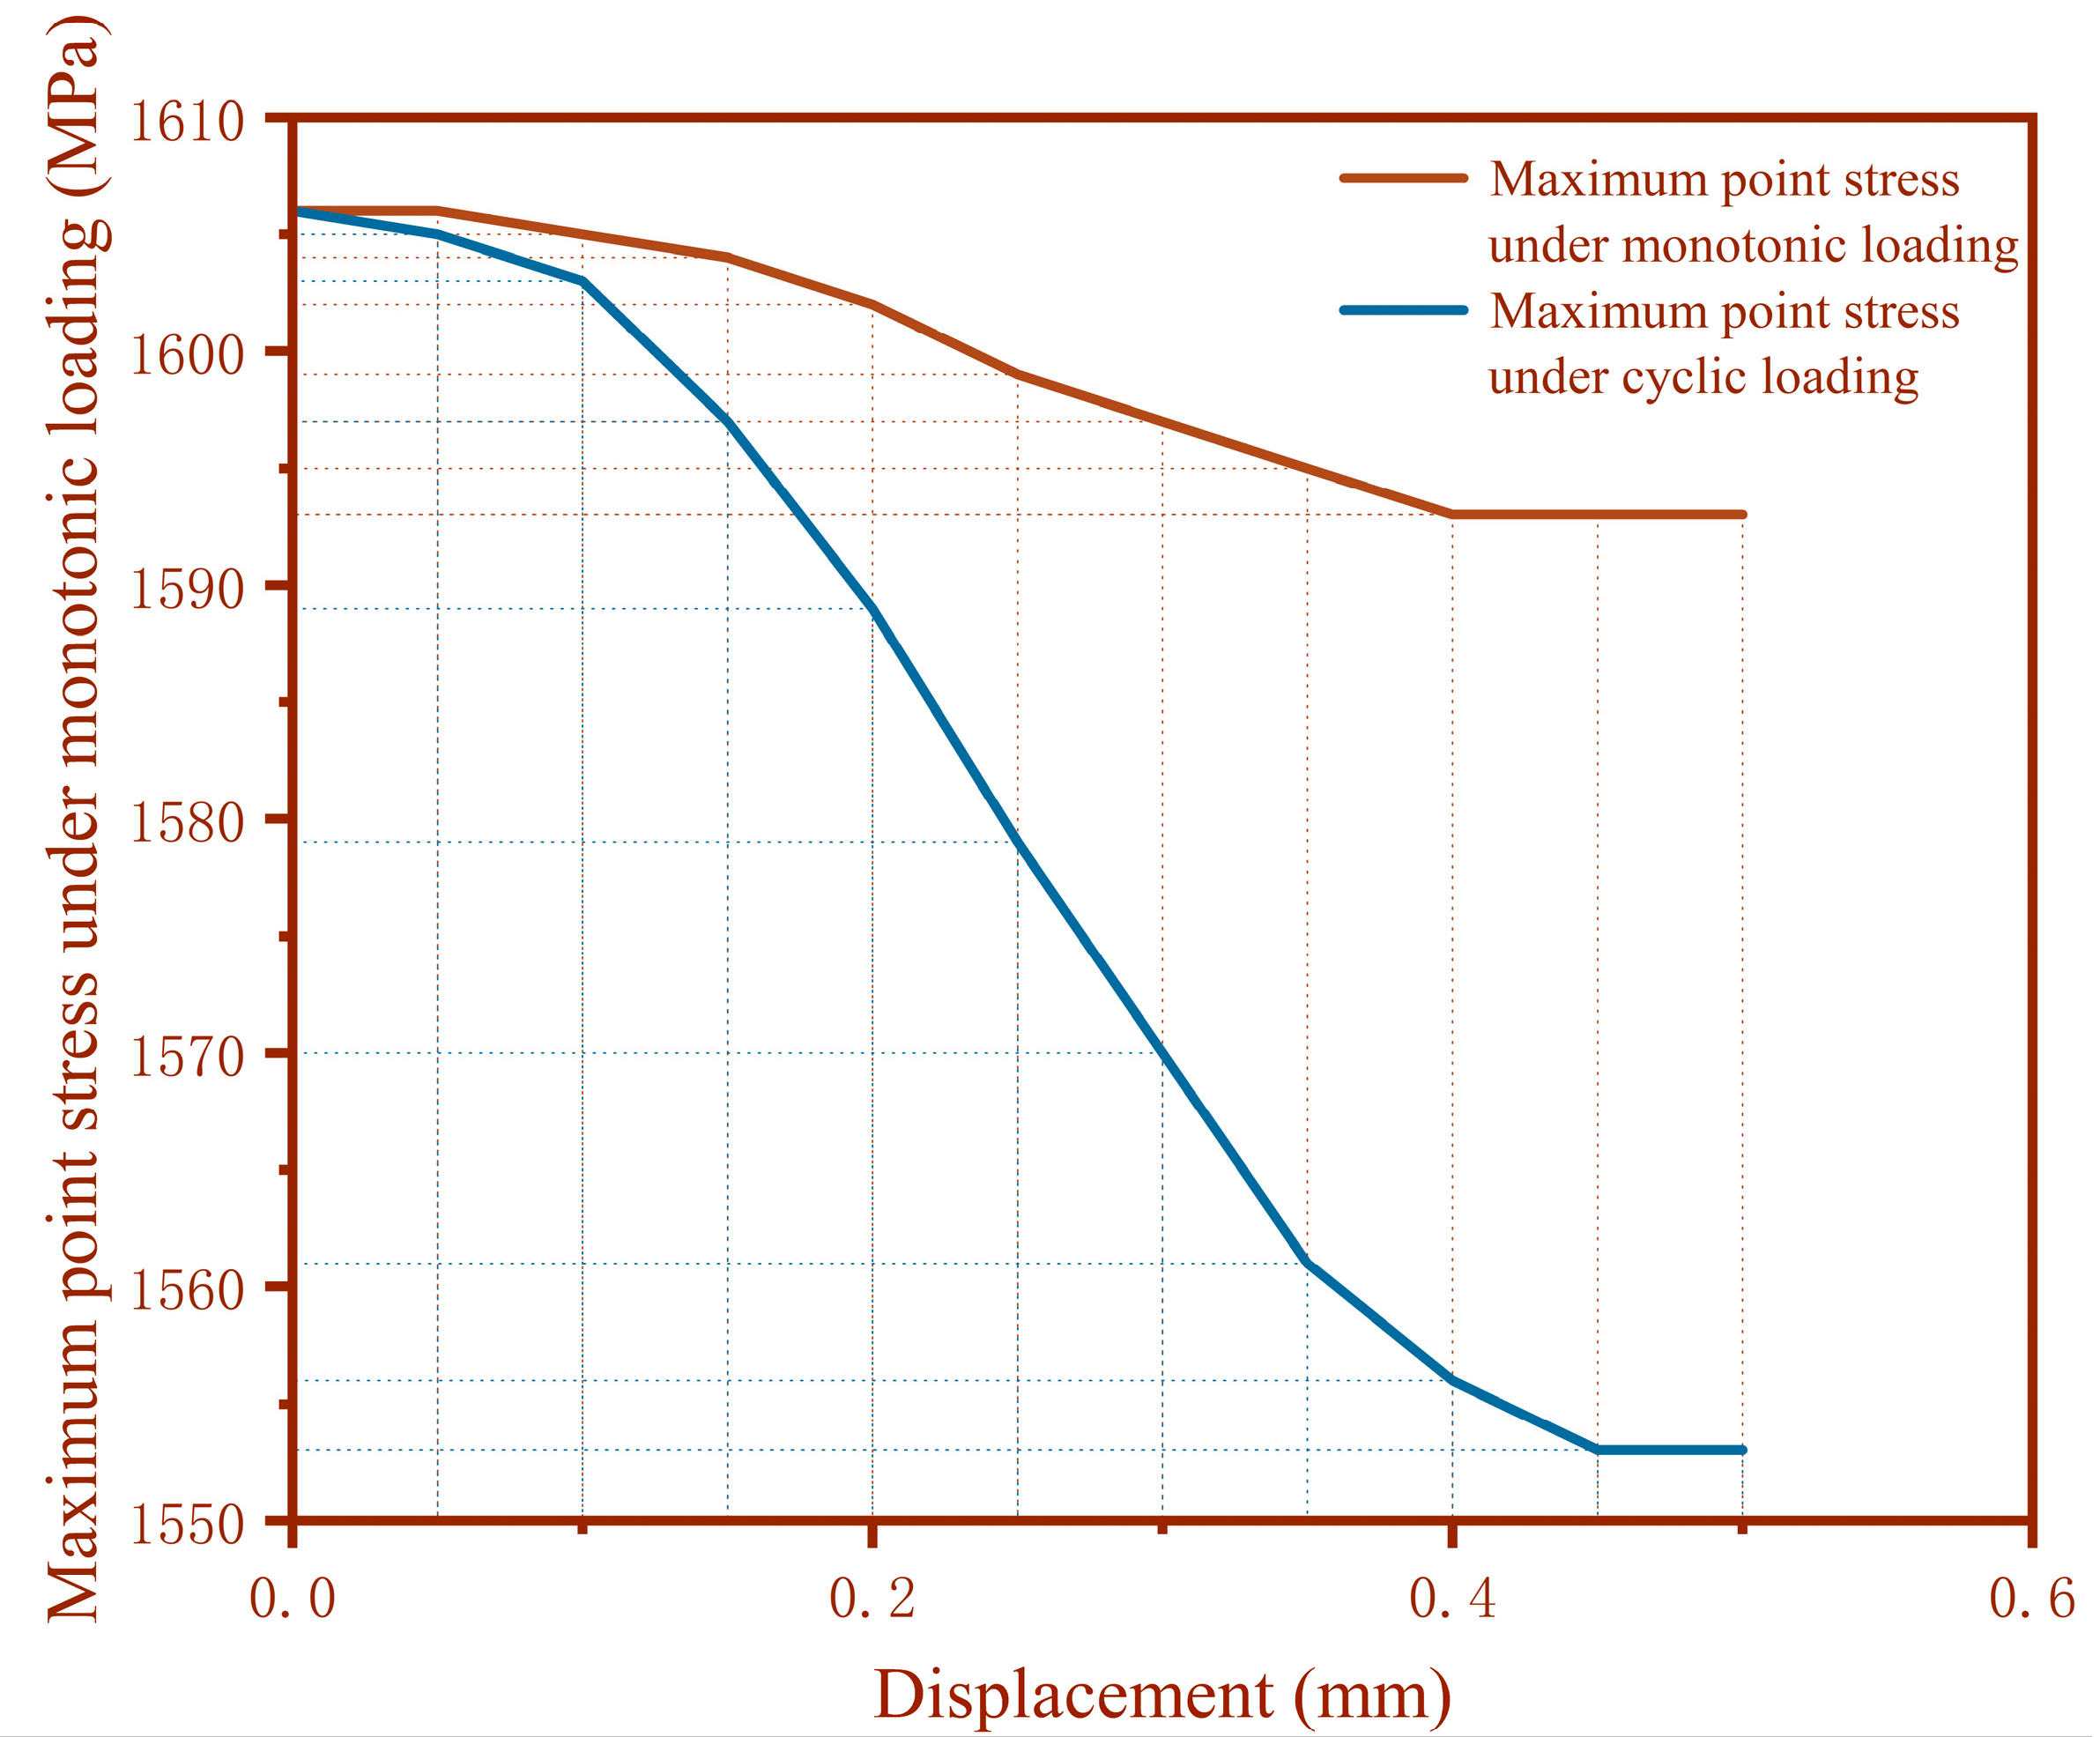
3.3. Comparison of Cyclic Displacement Loading Results with Monotonic Displacement Loading Results

3.3.1. Effect of Frequency Variation in Applied Cyclic Displacement Loads

For the same amplitude of monotonic displacement load and cyclic displacement load, the cyclic displacement load is taken to have a circular frequency of 6.28 and a period of 1 s. The total amount of displacement produced by the cyclic displacement load is four times as much as that of the monotonic displacement load, as shown in Figure 15.
The time of one analysis step is 1 s. Comparing the two loads, we see that a cyclic load with a circular frequency of 2π and the same amplitude as the displacement load produces four times as much displacement in 1 s as the monotonic displacement load. The essence of the preload generated is due to the compression of the connection, and the essence of the relaxation of the preload is also due to the recovery of the preload compression. The reason for the relaxation of the bolt preload under external load is also due to the displacement of the interface of the connecting member under external load, and the tightening material is stretched, resulting in the relaxation of the internal preload. Therefore, if the relaxation of the bolt under monotonic displacement load with amplitude of 0.5 mm is b, while the displacement under cyclic load with circular frequency of 2π and amplitude of 0.5 mm is 2 mm, the relaxation of the bolt is 4b.

3.3.2. Comparison of the Effect of Two Displacement Loads on Preload Force

The loss of preload under load is not directly related to the magnitude of initial preload. In order to make the results more accurate and correct, the value of the change in preload force with the amplitude of displacement load is selected for both loads when the initial compression of the bolt is 0.1 mm. Comparison of preload loss under two displacement loads is shown as Table 10. The data throughout the table will be clearer when plotted as a graph. The graph is shown in Figure 16.
By observing the two load movements, it can be seen that the bolt compression caused by the two at the same amplitude is a 4-fold relationship. Through the calculation and analysis of the above experimental data, it can be seen that the relationship between cyclic displacement load and monotonic displacement load on the loss of preload force is also a 4-fold relationship. Therefore, it can be concluded that the amount of preload loss is proportional to this variable of bolt compression. It is further deduced that the amount of loss of preload is also proportional to the amount of displacement produced by the external load.
This conclusion can facilitate and simplify future calculations. For example, if the amount of preload reduction due to a monotonic displacement load of a certain amplitude is known and the cycle of motion of a cyclic load is known, the amount of loss of preload under this cyclic load can be quickly calculated by using this relationship. Because most of the daily working conditions of the equipment load for the vibration load can simulate the same vibration load but there are difficulties, but simulating the monotonic displacement load is very easy, we can gain the vibration load amplitude and cycle easily through the specialized instruments we use to measure them. Therefore, we can calculate the loss of preload by simulating a monotonic load of the same amplitude. Using the obtained relationship, the loss of preload under cyclic loading is solved. This conclusion can provide great convenience for engineering calculations.
When the applied displacement load is 0.5 mm, the monotonic displacement load is the same as the cyclic displacement load in the contact surface to produce the stress with the displacement of the load varies as follows. Comparison of contact surface stress changes under two displacement loads is shown in Table 11. The data throughout the table will be clearer when plotted as a graph. The graph is shown in Figure 17.
From the tabular data and images, it can be seen that the contact surface stress, regardless of the load, with the displacement of the change in the first slowly reduced and then quickly reduced, and finally the rate of reduction tended to slow again. The trend is the same as the preload force with load displacement. The reason is the same as analyzed above, which is caused by the change in contact state of the contact surface and the change in material from elastic deformation to plastic deformation.

4. Discussion

In this study, the preload degradation law of the bolted joint structure was obtained by applying monotonic load and cyclic load to the bolted joint structure. Overall, our studies establish the relation equation with application significance by comparing the simulation results under different loads.
The changes in the preload force of the bolted connection structure, as well as the changes in the sticking zone and stress state of the connection interface, were analyzed, and the loading results of the monotonic load and cyclic displacement load were compared.
In addition, our results show that the contact interface stress decreases with the increase in displacement load, which is approximately the same trend as the slip curve of the contact surface. This also proves that the relaxation of stress is a major and important cause of slip generation, and the two are closely related. The results of the study can provide a strong theoretical support for the maintenance and protection of bolted structures of large equipment.
Physical experiments can be designed for this problem in the future to supplement the validation of the simulation results. The experimental and simulation results are compared and verified with each other, making the whole preload relaxation theory completer and more accurate.

5. Conclusions

This paper establishes the finite element model of bolted structure based on commercial finite element software ABAQUS 2022, and after exploring the effects of monotonic displacement load and cyclic displacement load on the preload and stress of bolted structure by setting up different loading conditions, the following conclusions are drawn:
(1)
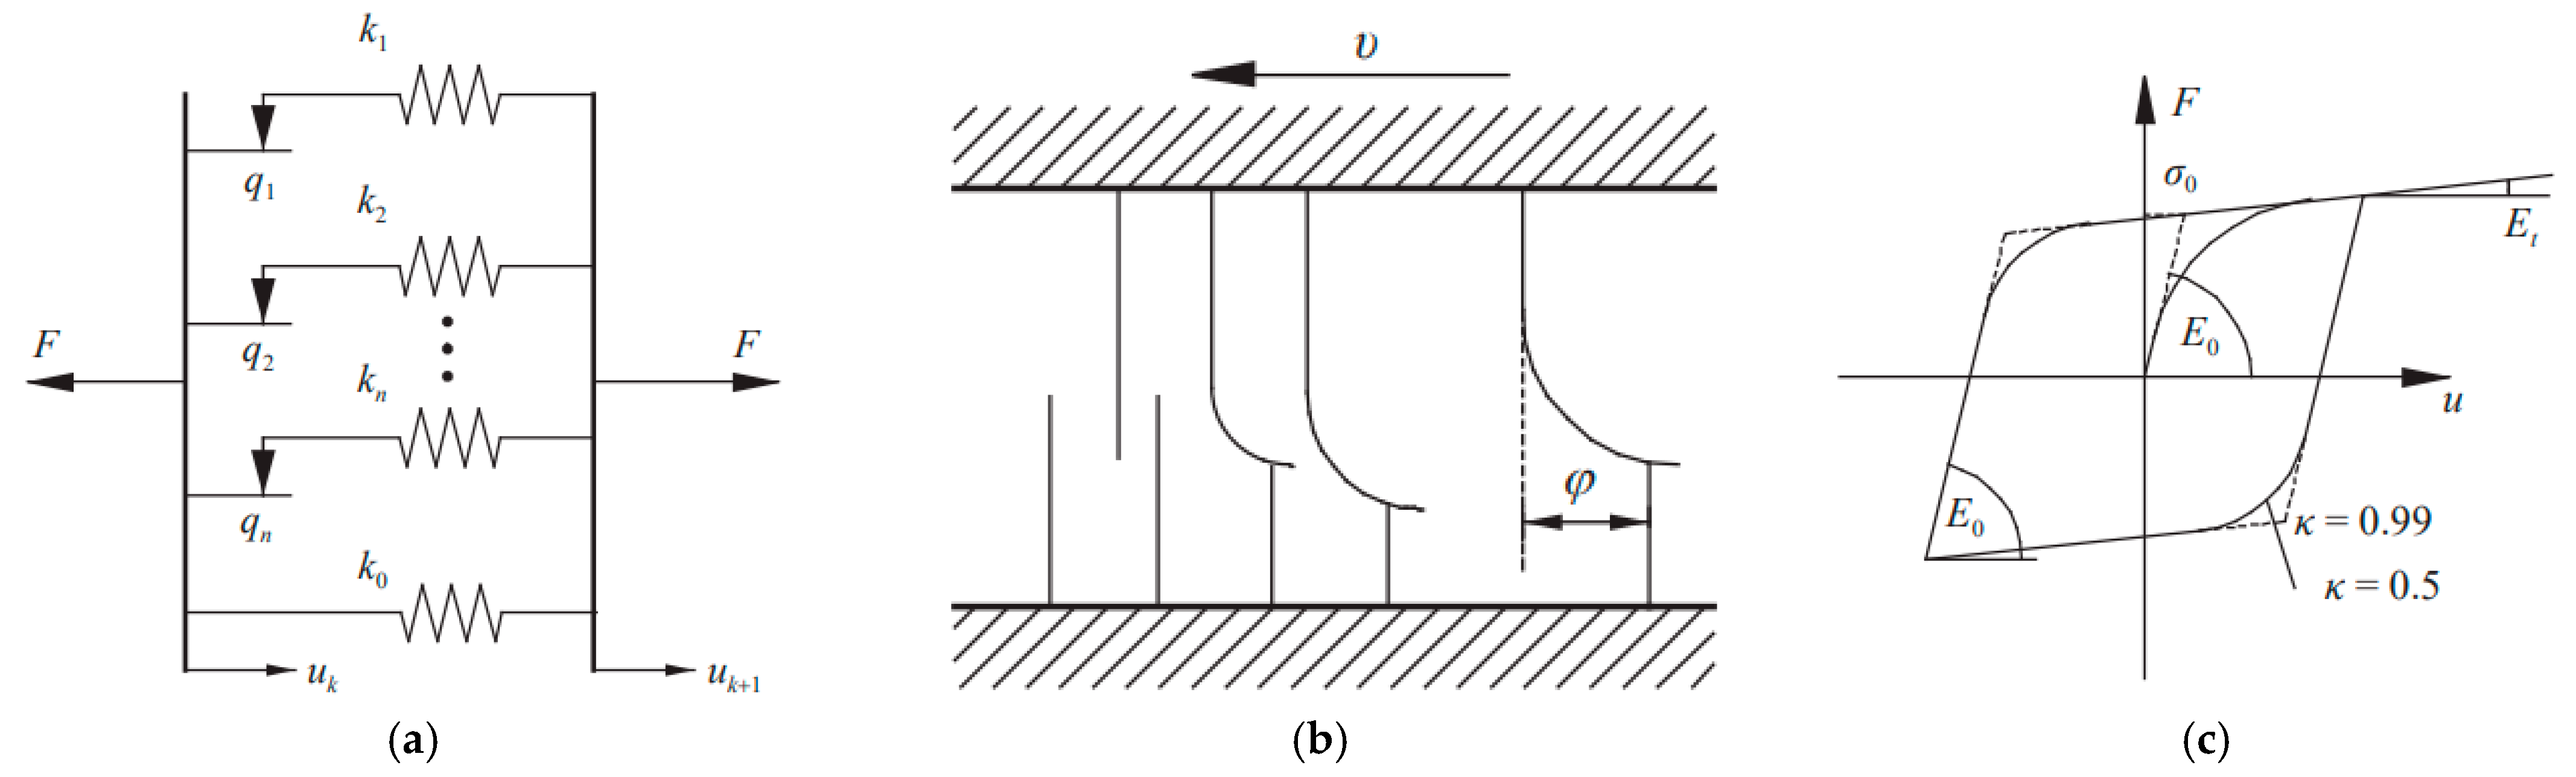
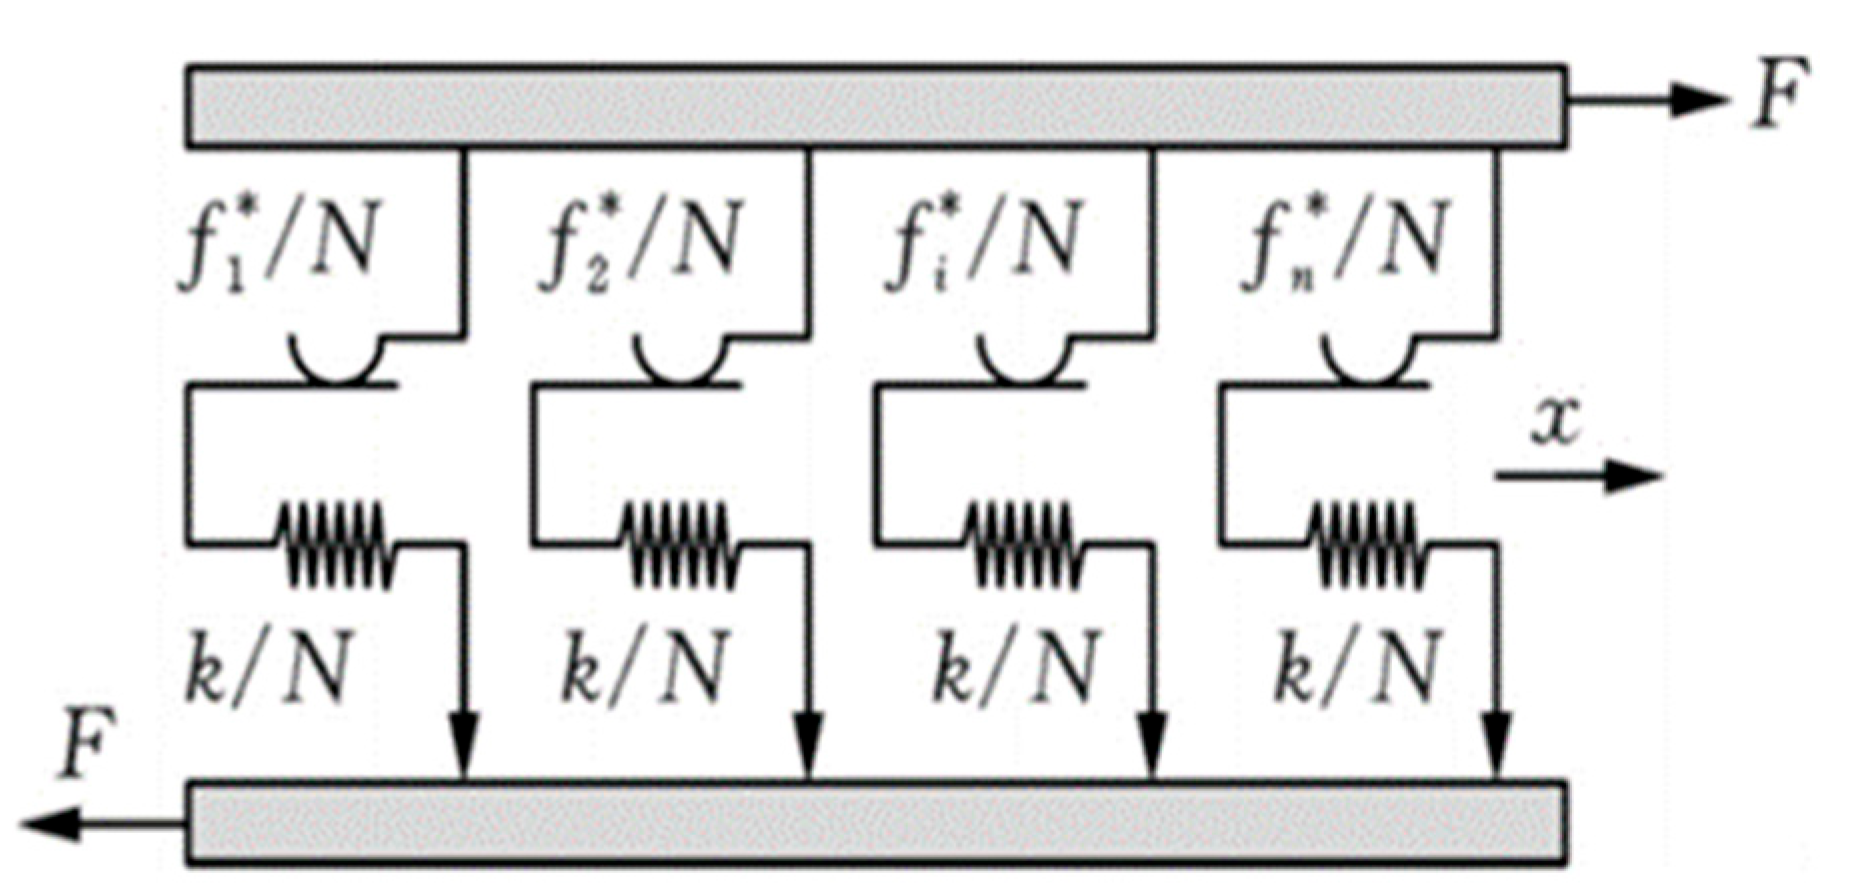
The relaxation process of preload: The relaxation of the tightening force will first cause the force on the slip surface of the Jenkinson unit to enter a viscous state, microscopic local slip and elastic deformation of the material, and at the same time produce resistance, which produces a certain degree of impediment to the reduction of preload, so the trend is slower in the beginning. With the increasing load, more and more small slider units begin to slip, the local slip accumulates, and then the plastic deformation of the material continuously occurs. When it finally reaches a certain level, it is manifested as a macro-slip, and stress relaxation occurs, resulting in a rapid decrease in the preload, so with the increase in load, the preload is rapidly reduced. With the accumulation of plastic deformation, plastic deformation occurs in more and more areas, the internal stress field inside the material slowly tends to stabilize and finally the curve gradually tends to be stable.
(2)
The contact interface stress decreases with the increase in displacement load, and this increase is also a nonlinear relationship. Combined with the Iwan model described in the previous section and the previous analysis, it is found that this is approximately the same as the trend of the slip curve of the contact surface, which also proves that the relaxation of stress is a major cause of the slip, and the two are closely related.
(3)
Regardless of the load conditions, the amount of stress loss on the contact surface and the amount of loss of preload are not directly related to the size of the initial preload.
(4)
The loss of preload is proportional to the change in bolt compression, and by further inference, the loss of preload is also proportional to the displacement generated by the external load.

Author Contributions

Y.L. and M.Z. conceived and designed the project; X.L. performed the simulation and analyzed the data; S.W. wrote and edited the manuscript; Z.L. reviewed and edited the manuscript. All authors have read and agreed to the published version of the manuscript.

Funding

This research received no external funding.

Institutional Review Board Statement

Not applicable.

Informed Consent Statement

Not applicable.

Data Availability Statement

Data are contained within the article.

Conflicts of Interest

The authors declare that they have no conflicts of interest.

References

  1. Luan, Y.; Guan, Z.Q.; Cheng, G.D.; Liu, S. A simplified nonlinear dynamic model for the analysis of pipe structures with bolted flange joints. J. Sound Vib. 2012, 331, 325–344. [Google Scholar] [CrossRef]
  2. Ling, Y.; Chen, X.B.; Xiao, T.L.; Chen, S.Y. Research on torque stability and anti-loosening performance of differential bolt assembly. Automob. Parts 2023, 6, 63–68. [Google Scholar]
  3. Chen, H.L.; Sun, J.; Zhang, S.J. Analysis of bolted joint loosening under transverse vibration. Mach. Build. Autom. 2023, 52, 48–50. [Google Scholar]
  4. Song, G.D. Research and Simulation of Inclined Shaft Running Car Recognition Technology Based on Noise Suppression. Comput. Simul. 2023, 40, 316–319+367. [Google Scholar]
  5. Yang, F.H.; Zhou, F. Analysis of bolted joint loosening under transverse alternating loads. Modul. Mach. Tool Autom. Manuf. Tech. 2022, 11, 115–118. [Google Scholar] [CrossRef]
  6. Dinger, G.; Friedrich, C. Avoiding self-loosening failure of bolted joints with numerical assessment of local contact state. Eng. Fail. Anal. 2011, 18, 2188–2200. [Google Scholar] [CrossRef]
  7. Izumi, S.; Kimura, M.; Sakai, S. Small Loosening of Bolt-nut Fastener Due to Micro Bearing-Surface Slip: A Finite Element Method Study. J. Solid Mech. Mater. Eng. 2007, 1, 1374–1384. [Google Scholar] [CrossRef]
  8. Zumi, S.; Yokoyama, T.; Iwasaki, A.; Sakai, S. Three-dimensional finite element analysis of tightening and loosening mechanism of threaded fastener. Eng. Fail. Anal. 2005, 12, 604–615. [Google Scholar]
  9. Pai, N.G.; Hess, D.P. Three-dimensional finite element analysis of threaded fastener loosening due to dynamic shear load. Eng. Fail. Anal. 2002, 9, 383–402. [Google Scholar] [CrossRef]
  10. Pai, N.G.; Hess, D.P. Experimental study of loosening of threaded fasteners due to dynamic shear loads. J. Sound Vib. 2002, 253, 585–602. [Google Scholar] [CrossRef]
  11. Gong, H.; Liu, J.; Ding, X. Thorough understanding on the mechanism of vibration-induced loosening of threaded fasteners based on modified Iwan model. J. Sound Vib. 2020, 473, 115238. [Google Scholar] [CrossRef]
  12. Gong, H.; Liu, J.; Ding, X. Study on local slippage accumulation between thread contact surfaces and novel anti-loosening thread designs under transversal vibration. Tribol. Int. 2021, 153, 106558. [Google Scholar] [CrossRef]
  13. Kasei, S. A Study of Self-Loosening of Bolted Joints Due to Repetition of Small Amount of Slippage at Bearing Surface. J. Adv. Mech. Des. Syst. Manuf. 2007, 1, 358–367. [Google Scholar] [CrossRef]
  14. Zhang, M.Y.; Zeng, D.F.; Lu, L.T.; Zhang, Y.B.; Wang, J.; Xu, J.M. Finite element modelling and experimental validation of bolt loosening due to thread wear under transverse cyclic loading. Eng. Fail. Anal. 2019, 104, 341–353. [Google Scholar] [CrossRef]
  15. Yang, M. A simplified numerical simulation method for bolted structures. Mach. Des. Manuf. 2012, 7, 165–167. [Google Scholar]
  16. Ranjan, P.; Pandey, A.K. Modeling of pinning phenomenon in Iwan model for bolted joint. Tribol. Int. 2021, 161, 107071. [Google Scholar] [CrossRef]
  17. Gong, M.G.; Liu, W.G.; Yang, Y. Analysis of interface hysteresis behavior of bolted joints. Mech. Sci. Technol. Aerosp. Eng. 2023, 42, 1416–1422. [Google Scholar]
  18. Wu, X.Y.; Zhu, S.J. Rational modeling of bolted coupling structure in FE modal calculation. J. Nav. Eng. Univ. 1998, 1, 67–71. [Google Scholar]
  19. Wang, D.; Xu, C.; Hu, J.; Wan, Q.; Chen, Y.H. Nonlinear Mechanical Modeling of Contact Interfaces of Connected Structures. Chin. J. Theor. Appl. Mech. 2018, 50, 44–57. [Google Scholar]
  20. Iwan, W.D. A Distributed-Element Model for Hysteresis and Its Steady-State Dynamic Response. J. Appl. Mech. 1966, 33, 893–900. [Google Scholar] [CrossRef]
  21. Iwan, W.D. On a Class of Models for the Yielding Behavior of Continuous and Composite Systems. J. Appl. Mech. 1967, 34, 612–617. [Google Scholar] [CrossRef]
  22. Luo, D.B.; Ji, W.J. A study of friction modeling in mechanical systems. Henan Sci. Technol. 2014, 5, 124. [Google Scholar]
  23. Valanis, K. Fundamental Consequences of a New Intrinsic Time Measure Plasticity as a Limit of the Endochronic Theory. Arch. Mech. 1980, 32, 68. [Google Scholar]
  24. Gaul, L.; Nitsche, R. The role of friction in mechanical joints. Appl. Mech. Rev. 2001, 54, 93–106. [Google Scholar] [CrossRef]
  25. Gao, Y.; Wang, X.W.; Yang, Z.Q. A study of the effect of bolting uncertainty on the dynamic characteristics of the magazine. Mach. Build. Autom. 2023, 52, 37–40. [Google Scholar]
  26. Jin, J.; Wu, X.Y.; Zheng, J.H. Study on the improvement of prestressing application method for bolted joints. J. Nav. Eng. Univ. 2010, 22, 20–24. [Google Scholar]
  27. Simulia. Abaqus 6.10—Abaqus/CAE User’s Manual; Simulia: Johnston, RI, USA, 2010. [Google Scholar]
Figure 1. A typical “phenomenological” model of the connection structure. (a) Iwan Model. (b) Lugre Model. (c) Valanis Model [24].
Coatings 14 00538 g001
Figure 2. Classical Iwan model [20].
Coatings 14 00538 g002
Figure 3. Finite element model of bolted joint structure. (a) Finite element model of bolt. (b) Finite element model of nut. (c) Finite element model of plate-fix. (d) Finite element model of plate-move. (e) Finite element model of entire structure.
Coatings 14 00538 g003
Figure 4. Schematic diagram of bolt preload.
Coatings 14 00538 g004
Figure 5. Initial and boundary conditions.
Coatings 14 00538 g005
Figure 6. Variation in preload with time when monotonic displacement load is applied.
Coatings 14 00538 g006
Figure 7. Contact surface stress.
Coatings 14 00538 g007
Figure 8. Variation in the maximum stress of the contact surface.
Coatings 14 00538 g008
Figure 9. Change in preload under cyclic displacement load.
Coatings 14 00538 g009
Figure 10. Loss of preload under cyclic displacement load.
Coatings 14 00538 g010
Figure 11. Stress variation in contact surface.
Coatings 14 00538 g011
Figure 12. Circular frequencies of cyclic displacement loads with different circular frequencies. (a) Circular frequency is 6.28. (b) Circular frequency is 12.56. (c) Circular frequency is 25.12. (d) Circular frequency is 37.68. (e) Circular frequency is 50.24. The vertical coordinate is the magnitude scale, and the horizontal coordinate is the loading cyclicality time/s.
Coatings 14 00538 g012
Figure 13. Relation between preload loss and circular frequency.
Coatings 14 00538 g013
Figure 14. Relation between contact surface stress drop and cyclic load circular frequency.
Coatings 14 00538 g014
Figure 15. Comparison of two displacement loads. The vertical coordinate is the magnitude scale, and the horizontal coordinate is the loading cyclicality time/s. (a) Applied Cyclic load. (b) Applied monotonic load.
Coatings 14 00538 g015
Figure 16. Comparison of preload loss under two displacement loads.
Coatings 14 00538 g016
Figure 17. Comparison of contact surface stress changes under two displacement loads.
Coatings 14 00538 g017
Table 1. Changes in preload loss with displacement load.
Load Displacement/mmLoss of Preload/N
0.138.7
0.2154.7
0.3348
0.4618.7
0.5966.8
Table 2. Changes in maximum stress on the initial contact surface of Step-2.
Initial Bolt Compression/mmMaximum Stress on Contact Surface/MPa
0.1323.4
0.2645.7
0.3966.9
0.41287
0.51606
0.72240
1.03183
Table 3. The maximum stress on the final contact surface of Step-2 changes with the initial compression amount.
Initial Bolt Compression/mmMaximum Stress on Contact Surface/MPa
0.1310
0.2632.3
0.3953.5
0.41274
0.51593
0.72227
1.0 3170
Table 4. Stress reduction of contact surface.
Initial Bolt Compression/mmMaximum Stress Reduction Value at the Contact Surface/MPa
0.113.4
0.213.4
0.313.4
0.413
0.513
0.713
1.0 13
Table 5. Maximum stress at plate point.
Displacement/mmMaximum Point Stress of Flat Plate S (Step-2)/MPa
01606
0.051606
0.11605
0.151604
0.21602
0.251599
0.31597
0.351595
0.41593
0.451593
0.51593
Table 6. Loss of preload under cyclic displacement load.
Cyclic Displacement Load Amplitude/mmStep-2 Initial Preload/NStep-2 End Preload/NPreload Loss Value/N
0.123,238.223,083.3154.9
0.223,238.222,619.5618.7
0.323,238.221,846.91391.3
0.423,238.220,763.22475
0.523,238.219,370.83867.4
Table 7. Stress reduction in contact surface under cyclic displacement load.
Cyclic
Displacement Load/mm
Initial Bolt
Compression/mm
Step-2 Maximum Stress on Initial Contact
Surface/MPa
Step-2 Maximum Stress at End Contact
Surface/MPa
Maximum Stress
Reduction Value at the Contact Surface/MPa
0.50.1323.4269.653.8
0.50.2645.7592.153.6
0.50.3966.9913.553.4
0.50.41287123453
0.50.51606155353
0.50.72240218852
0.51.03183313152
Table 8. Changes in preload with circular frequency of cyclic displacement load.
Circular Frequency/HzInitial Preload Force/NStep-2 End Preload/NPreload Loss/N
6.28115,407111,5923815
12.56115,407107,7757632
25.12115,407100,13415,273
37.68115,40792,482.222,924.8
50.24115,40784,826.130,580.9
Table 9. Changes in contact surface stress under cyclic displacement loads with different circular frequencies.
Initial Bolt
Compression/mm
Cyclic Load Circle Frequency/HzInitial Stress on Contact
Surface/MPa
Step-2 Maximum Stress at End Contact Surface/MPaMaximum Stress
Reduction Value at the Contact
Surface/MPa
0.56.281606155353
0.512.5616061500106
0.525.1216061394212
0.537.6816061287319
0.550.2416061181425
Table 10. Comparison of preload loss under two displacement loads.
Cyclic Displacement Load Amplitude/mmLoss of Preload under
Monotonic Displacement Loading/N
Loss of Preload under Cyclic Displacement Loading/NProportionality
0.1154.938.74.0026
0.2618.7154.73.9993
0.31391.33483.9979
0.42475618.74.0003
0.53867.4966.84.0002
Table 11. Comparison of contact surface stress changes under two displacement loads.
Displacement/mmMaximum Point Stress under Monotonic Loading/MPaMaximum Point Stress
under Cyclic Loading/MPa
Difference
0160616060
0.05160616051
0.1160516032
0.15160415977
0.21602158913
0.251599157920
0.31597157027
0.351595156134
0.41593155637
0.451593155340
0.51593155340
Disclaimer/Publisher’s Note: The statements, opinions and data contained in all publications are solely those of the individual author(s) and contributor(s) and not of MDPI and/or the editor(s). MDPI and/or the editor(s) disclaim responsibility for any injury to people or property resulting from any ideas, methods, instructions or products referred to in the content.

