1. Introduction
Wudang Mountain was listed as a World Cultural Heritage Site by UNESCO in 1994. Taoist buildings on this mountain were built as an organized complex during the Ming Dynasty (1368–1644). As a royal official Taoist site during the Ming Dynasty, it exemplifies the pinnacle of Chinese art and architecture. Many sculptures from the Ming and Qing dynasties have been found near Wudang Mountain, predominantly depicting Taoist deities, which vividly demonstrate the traditional craftsmanship of local sculptures.
The Ming Dynasty’s artisans were able to utilize a rich variety of pigments. In addition to drawing on traditional Chinese pigments, they also had access to pigments imported from outside of the Empire. Vivid colors created using mineral, and synthetic pigments [
1,
2] were also used at the time. Natural minerals and artificial pigments have always been an indispensable part of ancient palettes. After the production of the chromatic sculptures was completed during the Ming Dynasty, they were regularly repaired during the subsequent dynasties using materials unique to or popular during those periods. Therefore, the analysis of pigments used in the painted artifacts serves only as a basis for determining the original painting age and restoration history of artifacts, and it helps us better understand the production technology and painting techniques of that time.
Some relevant sources [
3,
4,
5] showed that these clay-based sculptures were essentially made using similar methods. A wooden skeleton was made for each sculpture based on its general shape; this skeleton was then wrapped with reed poles fixed with hemp ropes, and then an initial layer made of a mixture of clay, sand, and fiber was applied as a base. The surface was then whitened and painted, with complex mineral pigments used to produce the exquisite patterns and decoration. However, research on China’s polychrome sculpture process is mainly concentrated in Shanxi [
4,
5,
6] and Gansu [
7,
8,
9,
10], and mostly related to Buddhist statues, Arhat, and the god generals. During the Ming Dynasty, Wudang Mountain boasted a wealth of polychrome sculptures, which were the pinnacle of the art form at the time. However, up until now, the research into the material production of these exquisite Taoist statues has been nonexistent.
This research focuses on the two iconic polychrome sculptures housed within the Five-Dragon Palace. In the northwest of Hubei Province, Wudang Mountain is one of China’s most famous Taoist holy mountains (
Figure 1a). The Five-Dragon Palace was built by Emperor Zhenzong Zhao Heng during the Song Dynasty (AD 998−1022). Subsequently, the Five-Dragon Palace became the center of Wudang Taoism during the Yuan Dynasty (AD 1271−1368). Tragically, it was destroyed by fire towards the end of the Yuan Dynasty. In 1412, the tenth year of Zhu Di’s reign, the Emperor undertook extensive efforts to revitalize Wudang Mountain, resulting in the large-scale reconstruction of the Five-Dragon Palace. During the Jiajing period, 1522–1566, of the Ming Dynasty, the Five-Dragon Palace underwent further expansion, eventually comprising 850 buildings. The remaining Five-Dragon Palace now encompasses the main palace area, consisting of the Central Palace, the South Palace, and the North Palace, along with the 180 m-long walkway between Zhenguan Hall and the Palace Gate. The remaining strucures include the Mountain Gate, alleyway, screen wall, burning silk furnace, stone pavilion, Dragon and Tiger Hall (
Figure 1b).
The primary objective of this study is to examine the composition of the painting materials utilized in the sculptures of the Five-Dragon Palace, which represent the official technique of the master craftsman for applying pigments and creating Taoist sculptures. The present study endeavors to analyze the pigment production technique through in situ research and the micro-damage sampling of areas exhibiting typical color degradation, which also serves as the foundation for scientific and technical analysis for dating and future conservation purposes.
2. Materials and Methods
2.1. The Sculpture
In the Dragon and Tiger Hall, there are two colossal and colored sculptures serving as the guardians of the Five-Dragon Palace, named Qinglong (Azure Dragon) God and Baihu (White Tiger) God (
Figure 2a,b). These two clay sculptures epitomize the pinnacle of regional artistic techniques. Nevertheless, the precise age of these two sculptures is still unclear [
11].
2.2. In Situ Investigation with Portable X-ray Fluorescence (p-XRF)
An Oxford X-MET7500 portable XRF analyzer fitted with an X-ray tube (Rh anode) and a high-performance semiconductor detector was used for in situ experiments. In mining mode, a 45 kV voltage with a 50 μA current was used for 10.5 s to acquire the spectra.
2.3. Sampling Materials and Methods
In this research, samples with different tones were chosen to study. However, in order to reduce damage to the surface during the sampling, the size of the samples was limited and some areas were out of bounds to the samplers. The sampling locations are labeled in
Figure S1, and enlarged images of the sampling locations, photographs of the samples, and descriptions of their appearance are shown in
Table 1.
2.3.1. Optical and Ultraviolet Microscopic Observation
The samples were embedded and polished to form a cross-sectional surface in cold inlay epoxy resin, ground with Si–C paper from 1000# to 7000#, and polished with Micro−mesh® (Micro-Surface Finishing Products Inc., Wilton, CT, USA) polishing cloths to achieve 12,000# mesh. The final round of polishing was performed using a 0.06 μm SiO2 suspension (liquid), and then the basic characteristics were measured with optical microscopy using a Sop-top RX 50M (Ningbo, China) microscope with 365 nm ultraviolet (UV) radiation light.
2.3.2. Micro-Raman Spectroscopy
A micro-Raman spectroscope (DXR 2xi μ-Raman analyzer, Waltham, MA, USA) equipped with an EM-CCD detector was used. A 532 nm laser was used before embedding to qualitatively analyze the composition of the blue and green pigments. A 785 nm laser was used to analyze the red pigments. The Raman shift range was 100–3300 cm−1, it took 2–10 s to acquire the data, and this was performed 3–5 times with 0.1–2 mW power.
2.3.3. Scanning Electron Microscopy and Energy Dispersive X-ray Spectroscopy (SEM-EDS)
Scanning electron microscopy (PhenomTM XL G2 SEM, Thermo Fisher Scientific, Eindhoven, The Netherlands) coupled with energy-dispersive X-ray spectroscopy (EDS) and a backscattering detector (BSE) was used to analyze the microstructure of the paint layers and semi-quantitatively analyze the major elements in the pigment minerals of different layers. Analysis was carried out in a low-vacuum environment (60 Pa), with a scanning voltage of 15 kV, and at a working distance of 7 mm.
2.3.4. X-ray Diffraction (XRD)
An X-ray diffractometer (SmartLab 9 KW, Rigaku, Tokyo, Japan) was used to identify the different mineral phases using Cu Kα radiation (λ = 1.5054 Å) at room temperature, operating at 40 kV with a scan rate of 5°/min. The identification of the crystalline phase was performed based on the powder diffraction files from the International Centre for Diffraction Data using Jade 6.5 software.
2.3.5. Micro-FTIR Spectroscopy (μ-FTIR)
Specific points on the cross-sectional surface were analyzed using a Thermo Scientific™ Nicolet™ iS50 FTIR spectrometer in external reflection mode. The wavenumber range was 800–4000 cm−1, with 32 scans and a 4 cm−1 resolution.
2.3.6. Pyrolysis-Gas Chromatography/Mass Spectrometry (Py−GC/MS)
Py-GC/MS analysis was conducted on an integrated system consisting of a pyrolyzer (Frontier EGA-PY3030D, Fukushima, Japan) and a gas chromatograph/mass spectrometer (Agilent 7890B/5977B, Santa Clara, CA, USA). The GC system was equipped with an HP-5MS UI capillary column (30 m × 0.25 mm × 0.2 μm) with a quadrupole mass analyzer. The online methylated Py−GC/MS analysis included the following steps: less than 1 mg of sample, together with the methylation reagent (5 μL of 10 wt.% methanolic solution of tetramethylammonium hydroxide (TMAH, Aldrich, Shanghai, China)), was placed in the sample cup on top of the pyrolyzer at near-ambient temperature. Once the furnace temperature and GC/MS system were ready, the sample cup was introduced into the furnace, and the temperature program of the GC oven was initiated. Pyrolysis was performed at 550 °C for 0.2 min. Helium was used as the carrier gas at a flow rate of 1.0 mL/min and with a split ratio of 5:1. The injector and GC/MS transfer line were maintained at 300 °C. The chromatographic conditions for the separation of the pyrolysis products included an initial temperature of 50 °C, which was then isothermal for 2 min, increased by 4 °C/min up to 300 °C, and then was isothermal again for 15.5 min. The MS detector operated at an ionizing voltage of 70 eV, the ion-source temperature was 230 °C, and the quadrupole temperature was 150 °C, with a mass range m/z of 29–550. The NIST Library of Mass Spectra was used to identify the compounds.
3. Results
3.1. In Situ p-XRF Analysis Results
p-XRF spectrometry is a non-destructive method of investigation that enables the accurate and quick identification of inorganic materials. This has been widely used in the study of art objects. To achieve the aims of this study, the investigation was carried out on 10 distinct analysis zones, covering the entire color range, as can be seen in
Figure S2 in the Supplementary Materials. It can be seen that the color composition of the different hues of red always contained mercury (Hg) and lead (Pb). The green areas contained copper (Cu). The blue parts almost always contained Pb, while some of the pigments showed peaks of Cu, and others showed the presence of cobalt (Co) and arsenic (As). In the golden areas, gold (Au) and iron (Fe) were identified. Iron (Fe) and calcium (Ca) were found in the purple areas, so these parts were likely mixed with organic blue dyes. However, because the purple pigment areas were well preserved, sampling was not permitted. P-XRF investigation provides information on the basic elements, which can be used to determine the initial types of pigments, but p-XRF analysis will also detect the underlying elemental information, and it cannot distinguish between pigments that include copper and lead. Therefore, further micro-destructive analysis had to be performed, and the results are listed in the following section.
3.2. Identification of Pigments
3.2.1. Red Pigments
There were three different hues of red, i.e., the brownish dark red of sample #R-1, the bright red of sample #R-2, and the pink of sample #R-3. These hues can be discerned from the optical microscope (OM) images. Samples #R-1 and #R-2 included two layers, indicating that repainting had taken place. Elemental analysis via SEM-EDS showed that one of the top layers of sample #R-1 contained Fe and no other characteristic chromogenic elements. The orange–red color in both the top and bottom layers of sample #R-2 contained lead (Pb), indicating Pb-containing pigments, such as minium (Pb3O4), litharge (β-PbO), and massicot (α-PbO).
Moreover, the surface layer contained elemental mercury (Hg), suggesting the use of cinnabar or vermilion on the surface to control the bright red hue. The pigment layer of sample #R-3 contained both Hg and Pb. According to the optical microscope image illustrated in
Figure 3m, lead was distributed throughout the whole layer and was related to the white region.
Figure 3q,r reveal mercury-rich particles distributed among the lead-containing layer, suggesting the possibility of using HgS as a red pigment mixed with lead white to create a pink tint. As shown in
Figure 3h,n, the pigmented and white layers of #R-1 and #R-2 exhibited strong yellow fluorescence under UV radiation, suggesting that organic materials (especially oil-based ones) were applied with lead-based pigments [
12].
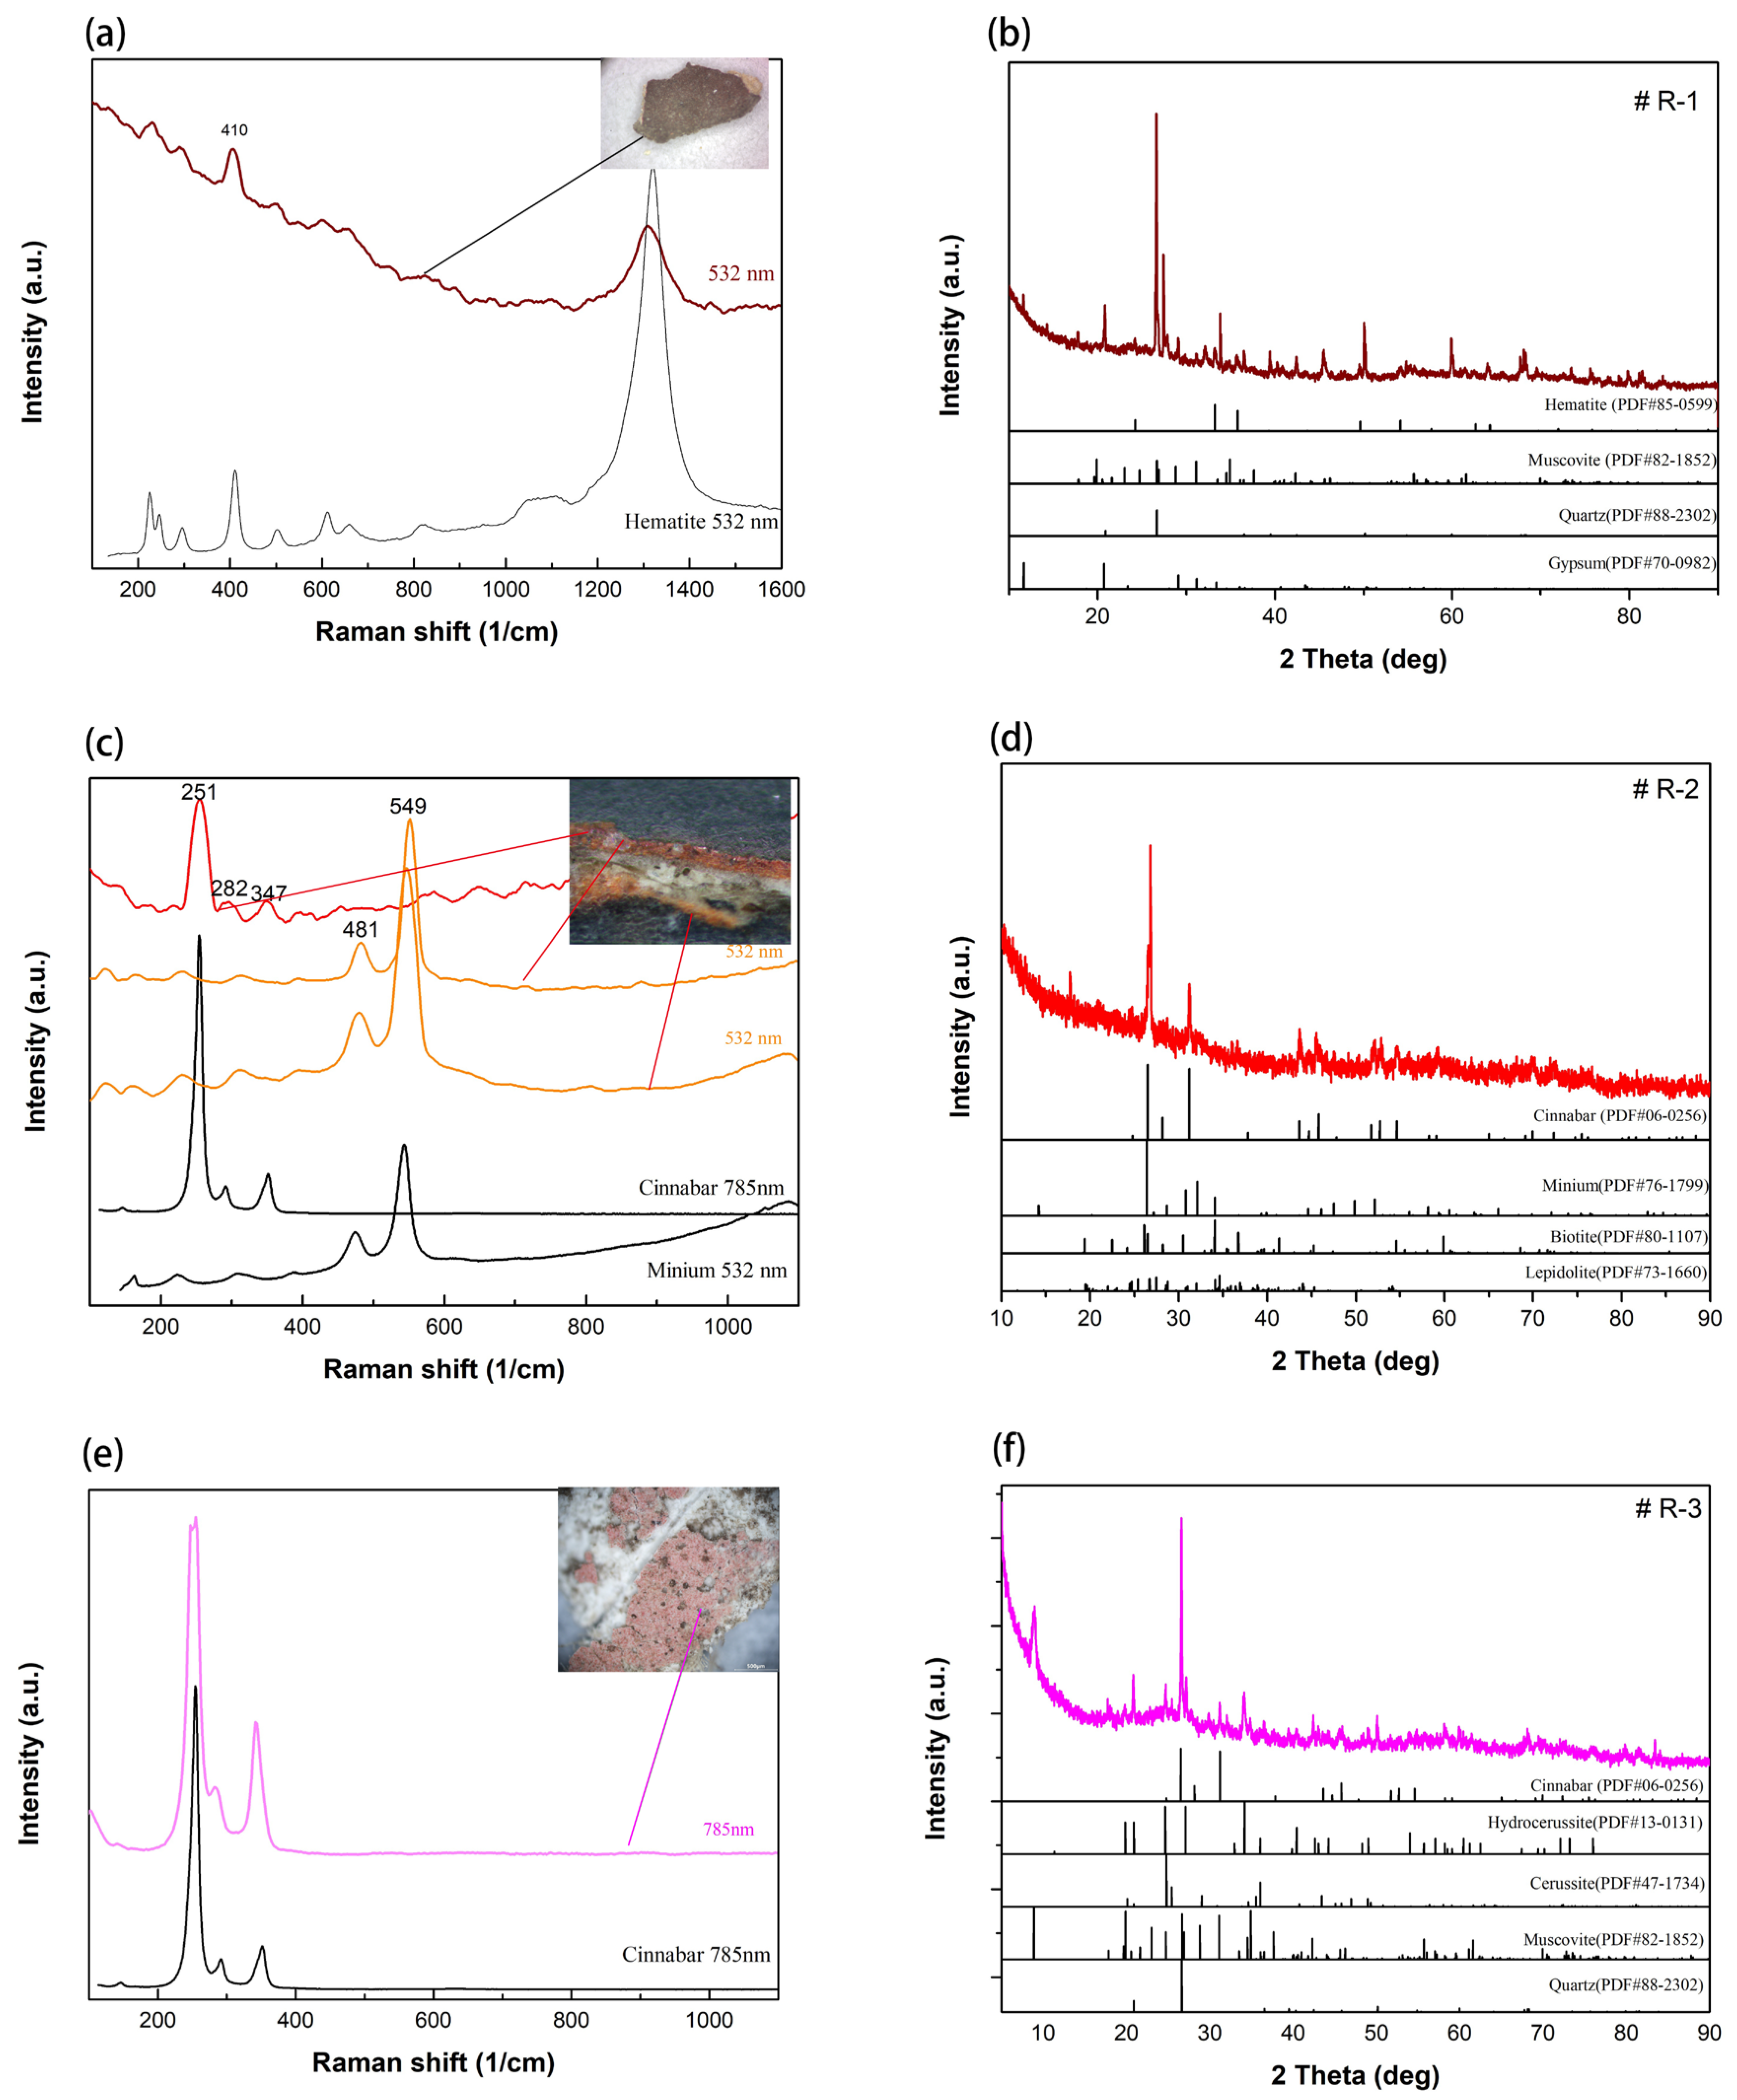
In
Figure 4a, the characteristic Raman band at 410 cm
−1 also indicates the use of hematite (Fe
2O
3) as a red pigment [
13]. The presence of Hg-containing pigments on the surface of sample #R-2 can be attributed to the well-defined peaks located around 251(vs) cm
−1 and a shoulder peak at around 347(m) cm
−1, indicating the use of the cinnabar [
14]. In the middle and bottom orange-Pb containing layers (
Figure 3l), the strong peaks at 481(s) cm
−1 and 549(vs) cm
−1 were detected, which is assigned to the stretching modes of the Pb
IIO
3 pyramids, revealing that lead red (minium, Pb
3O
4) was used in both layers [
15,
16]. The Raman spectrum of the red pigment of sample #R-3 exhibited peaks at around 251(vs) cm
−1, 284(w) cm
−1, and 342(m) cm
−1, which correspond to the stretching vibration of Hg-S [
17]. Red mercury sulfides like metacinnabar and hypercinnabar are the most abundant in natural mercury compounds, but they are difficult to distinguish in the Raman spectra [
18]. Therefore, there is a high probability that synthetic mercury sulfide vermillion was used.
According to the XRD patterns (
Figure 5b,d,f), quartz (SiO
2) mica minerals such as muscovite, biotite, and lepidolite were also detected in all red samples, which may have been due to the aggregation of the plaster substrate. Gypsum was detected in #R-1, while Ca and S can be observed in the SEM-EDS images concentrated in the same place as the white substrate (
Figure 3d,f), suggesting that gypsum may have acted as a binder, mixing quartz with mica minerals. However, calcite (CaCO
3) [
7,
19,
20,
21], which is commonly applied as a white base layer for mural painting and sculpture in North China, was not detected in any of the samples. XRD analysis further confirmed that hematite was used to create the brownish-red parts in sample #R-1, while cinnabar and minium were used in sample #R-2. Additionally, lead white (usually a mixture of hydrocerussite and cerussite) was detected in sample #R-3, indicating that it was mixed with cinnabar or vermilion to achieve a pink hue, which is consistent with the results of EDS (
Figure 3q,r).
3.2.2. Green Pigment
It can be clearly seen from the OM–vis cross-section image (
Figure 5a) that the green color also exists on the two layers, which is consistent with the red pigments in samples #R-1 and #R-2. Underneath the green pigment layer, there is a black-gray layer, which no special elements (like charcoal black) were added. Elemental analysis showed that both the layers contained copper (Cu) and chlorine (Cl), suggesting that they were composed of basic copper chlorides. In addition, the second layer displayed a distinct rounded shape, suggesting that the pigment may have been artificially synthesized rather than extracted from a natural copper mine [
22]. In the base green layer, which was likely the original layer, the particle size was smaller than that in the surface layer.
Pigments containing copper and chlorine are usually identified as basic copper chlorides (Cu
2(OH)
3Cl), which are rarely found in natural deposits [
23,
24] but always develop due to the corrosion of copper, brass, and bronze objects in chlorine-containing environments [
23,
25,
26]. Among the group of basic copper(II) chloride minerals of stoichiometry Cu
2Cl(OH)
3,namely, atacamite, clinoatacamite, and botallackite, atacamite has the most stable phase and has been the most prevalent green pigment in ancient mural paintings and other polychrome objects in China since the fifth century AD [
27,
28]. In addition, paratacamite [(CuM)
2Cl(OH)
3, where M may be Zn, Ni, or Co] can be found with atacamite mineral in Cu-rich environments, and during the synthesis of atacamite [
29,
30], it can also appear as a copper(II) chloride pigment. The XRD analysis (
Figure 5j) showed that, due to the difficulty in distinguishing the overlapping positional crystal planes, all four isomers of basic copper chlorides may exist.
Raman analysis showed that the spectra of the two layers presented the same characteristic bands (
Figure 5g), suggesting the use of the same material during restoration. Compared with the standard spectra from the RRUFF database, it was found that the peaks at 402(vs) cm
−1, 455(s) cm
−1, 896(s) cm
−1, and 857(sh) cm
−1, which were attributed to Cu-Cl stretching and hydroxyl deformation, were very consistent with those of botallackite [
29,
31,
32]. The additional peaks observed at 509 cm
−1 (Cu-O stretching) and at 144 cm
−1 (O-Cu-O bending) indicated the possible presence of atacamite or clinoatacamite. The peaks at 3347(s) cm
−1 and 3324(sh) cm
−1 in
Figure 5k correspond to hydroxyl stretching, suggesting that atacamite was also mixed with botallackite.
Botallackite is rarely used in ancient polychromes [
33]. Through synthetic experiments according to the recipe in the “Mo’e Xiao Lu”(墨娥小录), Li Man found that botallackite could be produced from copper plates with “Lusha” (硇砂, with NH
4Cl as the main phase), alum, and vinegar [
34]. Moreover, botallackite is considered to be the most unstable polymorph and can spontaneously transform into atacamite [
32,
35,
36]. Based on this hypothesis, atacamite may be an alteration of botallackite.
3.2.3. Blue Pigments
On the sculptures of the Azure Dragon God and White Tiger God, two blue tints were observed; one is a brighter blue color with a darkened surface (#B-1), and the other blue was used in one of the reliefs at the lower part of the sculpture (#B-2), which is different from the bright blue of #B-1.
Both the blue samples exhibited a white layer containing lead underneath; this feature was not found in any of the other color samples, indicating an artificial addition. A part of the white layer in both samples emitted fluorescence under UV irradiation. Furthermore, the blue particles in both the samples were relatively larger. EDS analysis showed that the blue particles in #B-1 mainly contained Si, Kalium(K), As, and Co. Conversely, the blue particles in #B-2 contained Cu (
Figure 6q). The Raman spectroscopy analysis of #B-1 (
Figure 6n) showed a peak at 490 cm
−1, corresponding to a tetrahedral SiO
4 bridging vibration, combining with the presence of Co, AS and Si, indicating the presence of smalt [
37,
38]. The layer beneath the dark blue pigment (#B-1) was composed of lead white, showing a slight light blue, but there were no other chromogenic elements, such as Cu or Co, except for Pb.
Figure 6l confirms the presence of muscovite and hydrocerussite, Pb
3(CO
3)
2(OH)
2). The Raman peaks at 1573(vs) cm
−1 and 1360(s) cm
−1 in the Raman spectra suggest the possible use of indigo [
39] mixed with lead white to produce light blue (
Figure 6n). #B-2 clearly corresponds to azurite (2CuCO
3 Cu(OH)
2) due to the presence of copper, as confirmed via EDS. In
Figure 6t, the spectrum with major bands was characteristic of azurite, detected at 240(s) cm
−1, 401(vs) cm
−1, and 1099(s) cm
−1 [
39,
40]. This finding was supported by the XRD measurements, as illustrated in
Figure 6s.
Smalt, a blue pigment that emerged in the 15th century in Europe, is a potassium glass powder with cobalt as the coloring agent [
41]. Smalt was made by melting cobalt minerals (such as erythrite and cobaltite) together [
38,
42]. The elemental composition of the smalt pigment is listed in
Table 2. The presence of K suggests the addition of wood ash, while the presence of As, Fe, bismuth (Bi), and nickel (Ni) can be attributed to the diverse sources of cobalt minerals throughout Germany. During the 16th and 19th centuries AD in Europe, the cobalt ores were mainly obtained from the Saxony, Bohemia, and the Black Forest regions in Germany, and those from these three areas were usually related to Bi
2(CO
3)O
2 [
38,
43,
44]. There is no historical record indicating the production of smalt in ancient China, so it is thought to have been imported during the Ming Dynasty to make blue and white porcelain [
45]. The notion that this blue pigment was mainly used as a pigment in color painting mainly appeared in the early Qing Dynasty [
38,
46]. Therefore, if this blue pigment was indeed utilized in the two sculptures, they can be tentatively dated to the 16th–17th centuries AD.
3.2.4. Gold Gilding
According to the OM–vis image, gold foil was observed to be situated on the top layer (
Figure 7d). Beneath the gold layer lies a red lead layer, followed by a resinous substance referred to as a mordant. The XRD analysis patterns (
Figure 7j) combined with the SEM-EDS mapping results (
Figure 7d–h) can prove that gold (Au) laid on the top, followed by an organic layer, and then a red layer made of minium mixed with quartz, gypsum, and muscovite.
Notably, the mordant exhibits intense fluorescence under UV illumination (
Figure 7b), indicating the presence of organic materials [
47]. The micro-infrared reflectance analysis data presented in
Figure 7i indicates the possible presence of long-chain fatty acids within the mordant layer (adhesives for the gold gildings), corresponding to the ester carbonyl ν(C=O) band in 1735–1730 cm
−1, and the characteristic ν(C-H) bands at 2926–2919 cm
−1 and 2858–2850 cm
−1.
Py-GC/MS techniques were also applied to confirm the μ-FT-IR results and further identify the specific components and kinds of mordant. A total ion chromatogram is shown in
Figure S3, and the analysis results of Py-GC/MS are described in detail in
Table S2. The pyrolysis product of #Glo-1 included a great deal of monocarboxylic fatty acids and dicarboxylic fatty acids. These fatty acids include linear monocarboxylic acids (saturated fatty acids ranging from C10 (peak #14) to C16 (peak #17); unsaturated fatty acids like C18:1 (peak #19), dicarboxylic acid 2C8 (peak #8), and high contents of nonanedioic acid (peak #11, 2C9). These carboxylic acids are suggested as characteristic markers used to identify drying oil in polychrome artworks. The content ratio P/S (relative area of C16/C18) was used to distinguish different types of drying oil [
48]. The value of P/S of #Glo is 0.77, which is close to the reported value of heated tung oil [
49]. The use of bodyheated tung oil is also a very common in ancient gilding techniques and has been elsewhere [
47,
48,
50,
51]. In addition, it was found that L-aspartic acid (peak #3), pyrrolizin-1,7-dione-6-carboxylic acid (peak #6), etc., were detected, suggesting that proteins were used in the underlying pigment layers, most likely in the underlying gold foil layers of the paint.
3.2.5. Black Pigment
For the black samples, only carbon and quartz were confirmed by the XRD patterns (
Figure 8d), as well as by the main typical Raman peaks at 1330 cm
−1 and 1576 cm
−1 in
Figure 8c. A high content of carbon (C) was also detected in #Bla-1 using SEM-EDS, and the results are shown in
Figure 8f. In addition to carbon and oxide, low concentrations of Al, Si, Ca, S, and K were also detected, which likely came from the base layer and surface dust. Therefore, the black color observed can be attributed to the presence of amorphous carbon, which is a common black pigment.
3.3. Organic Materials
The reflection FTIR spectrum (expressed as IR transmittance) of the fibers in #R-2 is shown in
Figure 9. The characteristic peaks are listed as follows: The broad absorption band at 3340 cm
−1 shows the -OH stretching vibration and the band at 1640 cm
−1 shows the -OH bending vibration. The stretching vibration of the C-H group at the band 2996 cm
−1 and the bands at 1423 cm
−1 and 1319 cm
−1 are assigned to CH
2 scissoring vibration. The band at 1058 cm
−1 shows -CH-O-CH
2 stretching, and the band at 1155 cm
−1 is assigned to the asymmetrical C-O-C stretching vibration of cellulose or hemicellulose [
51]. These characteristic peaks of cellulose can be clearly observed in
Figure 9, strongly suggesting that plant fibers like hemp or cotton were likely used in the production of white layers.
Among the binder media, animal glue is the most common material used in Chinese painting and polychromic relics. It is worth noting that animal glue typically does not produce obvious fluorescence under UV illumination, but fluorescence was observed in #R-2, #R-3, #B-2, and #Bla-1. Considering the limitation of the samples, #R-1, #R-2, and #R-3 were selected for Py-GC/MS analysis, aiming to determine whether fluorescence could be attributed to a certain kind of organic binder.
The total ion chromatograms of the samples are displayed in
Figure 10, with detailed information on the pyrolysis products listed in
Tables S3–S5. As shown in
Figure 10b, a high quantity of azelaic acid and a series of monocarboxylic and dicarboxylic fatty acids were detected, along with L-proline, suggesting the application of protein-containing substances. In contrast, the pyrolysis products in sample #R-1 were nitrogenous materials, not mainly fatty acids, suggesting the use of a protein-like material as the binder. In #R-3, a series of fatty acids were also detected, indicating that the drying oils may have caused fluorescence. Oils and fats are mainly used in the production of black color, foils, and lead-containing parts. The P/S ratio of #R-2 was close to 1.1, suggesting the probable application of heated tung oil in red lead pigment.
4. Discussion
The sculptures are exquisitely crafted and employ a variety of pigments. The production process here also has significant differences from that in Dunhuang and other places. Firstly, the white pigment uses white clay-based materials, mainly mica minerals and quartz mixed with gypsum, instead of the more commonly used materials such as lime and chalk [
7,
8,
9,
10]. Only one case in Sichuan province reported the application of gypsum as a binder in the white ground layer of clay sculptures [
6]. Secondly, the detected clay materials in the white layer are mixed with fibers to reduce the shrinkage of the white base layer during drying, thereby increasing the overall pliability of the sculpture. #R-2, #R-3 and #B-2 were all sampled from the relief at the base of the sculpture, suggesting that the plant fibers may have been added during the shaping of specific forms. In addition, no gypsum was detected in any samples with the plant additions. In contrast, when making the traditional polychrome clay sculptures in the Gansu and Shanxi Provinces, the hemp fibers were mixed in the fine clay layer [
6,
52], but not in the white base layer.
In terms of color, the red pigment is also more elaborate, and different pigments and color-mixing techniques were used to obtain different hues. Regarding the blue pigment, some were detected at the same time within the XRF results. As for the green pigment, it is composed of one substance and was not intentionally mixed.
Moreover, to better show the color tones, a multi-layer technique was used when painting the sculptures, with a black layer underneath the green pigment and light blue and white layers underneath the blue and gold pigments (
Figure 11). A multi-layer technique was most likely used to regulate the color development of the different pigment layers. In European murals and oil paintings, black is usually used underneath blue to showcase blue colors [
53,
54], which contrasts this case in the Wudang Mountains. However, using red underneath gold is very common in Chinese objects [
55,
56,
57] and even European gold-plastered works [
4,
6,
50,
58]. Drying oil, especially tung oil, was commonly applied as a mordant for gold foil when decorating the sculptures [
48,
56]. Notably, a black and gray layer beneath the green pigment layer is rarely reported in the traditional sculptures and murals of ancient China. In addition, the use of drying oils to lead-containing pigments strongly indicates that the local craftsmen were aware of the characteristic usage of pigments and binders and used them differently.
This study’s findings help us to understand the dating of the artifacts and reveal further information on the possible use of different craft materials during different eras. The use of smalt suggests a date no earlier than the 16th century. In samples #R-2 and #G-1, repainting was observed, but the types of pigments used in both cases were similar, especially the green color, and botallackite (an uncommon material) was used for painting. These findings indicate that the two periods of painting are close to one another and that the production period of these sculptures may have occurred in the early Qing Dynasty.
5. Conclusions
The two colossal polychrome and clay statues, “Azure Dragon God” and “White Tiger God”, are housed in the Five-Dragon Palace, a royal Taoist temple constructed during the Ming Dynasty. In this study, we examined the pigments and traditional techniques used in their creation. Although the two sculptures were expertly crafted, there is controversy over when they were made and what materials and painting methods were used.
Our analyses revealed that several red pigments were employed to create a range of red hues, namely #R-1, which uses red ochre (hematite), #R-2, which uses cinnabar (or vermilion) coated on red lead, and #R-3, which uses a combination of lead white (hydro cerussite) and vermilion. Si and Al were found in the white base layer, which is primarily composed of quartz and mica minerals with a blend of gypsum or plant fibers.
Green #G-1 is a mixture of atacamite and botallackite with a black and gray layer underneath, and behind the pigments is most likely a blend of gypsum, quartz, muscovite, and amorphous carbon. Despite their double layers, the employment of comparable pigments in #R-2 and #G-1 suggests that their restoration may have been completed at quite similar times. Smalt blue and azurite are two types of blue pigment that were added to the sculptures. Beneath the blue layer is a layer of lead white combined with indigo (#B-1). This creates a, overall vivid color. Heated tung oil was used to attach the gold foil, and underneath is a coating of black carbon and red lead. The employment of several colors to achieve the same hue and the multi-layering process demonstrates the expertise of the artists; this site is known for its blue–white and green–black–gray layering approaches. Another feature of this regional method for creating colorful sculptures is the addition of fibers to the white background. The results of this study offer a foundation for dating the examined sculptures to the late Ming or early Qing Dynasty (17th century), and the materials and procedures analyzed in this study may also be impactful in subsequent restorations.
The object of this study is to gain rare insight into the special techniques used in the production of bases and in the coloring of Taoist statues during the Ming Dynasty. The research can supplement the information on the local craftsmanship of the statue materials of the era, while also providing basic information for any future restoration.
Supplementary Materials
The following supporting information can be downloaded at:
https://www.mdpi.com/article/10.3390/coatings14050540/s1. Figure S1: The sampling locations in Azure God sculpture. Figure S2: Visible light photography with the points analyzed with XRF and the corresponding XRF spectra of selected areas. Figure S3: Total ion chromatograms (TIC) of sample #Glo-1. Table S1: The normalized elemental concentration measure by using p-XRF. Table S2: Information regarding the pyrolysis products of sample #Glo-1. Table S3: Information regarding the pyrolysis products of sample #R-1. Table S4: Information regarding the pyrolysis products of sample #R-2. Table S5: Information regarding the pyrolysis products of sample #R-3.
Author Contributions
Conceptualization, L.S. and Y.K.; methodology, L.S.; software, L.S.; validation, L.S. and Y.K.; formal analysis, L.S.; investigation, L.S.; resources, Y.K.; data curation, L.S.; writing—original draft preparation, L.S. and Q.L.; writing—review and editing, Y.K. and Q.L.; visualization, L.S.; supervision, Y.K.; project administration, Y.K.; funding acquisition, Y.K. All authors have read and agreed to the published version of the manuscript.
Funding
This research was funded by the Conservation Science and Technology Project of Zhejiang Provincial Administration of Cultural Heritage (grant number 2023014). The APC was funded by a project of the Research Foundation for Advanced Talents of Hangzhou City University.
Institutional Review Board Statement
Not applicable.
Informed Consent Statement
Informed consent was obtained from all subjects involved in the study.
Data Availability Statement
Acknowledgments
The authors would like to thank Wei at Anhui University, China, for providing help with the in situ investigation.
Conflicts of Interest
The authors declare no conflicts of interest.
References
- Xia, Y. Micro Analysis of Lagacy Colors—A Study on the Polarized Light Microanalysis of Ancient Chinese Pigments; Science Press: Beijing, China, 2013. (In Chinese) [Google Scholar]
- Yu, F. A Study on the Colors of Chinese Painting; Beijing United Pulishing Company Limited: Beijing, China, 2013. (In Chinese) [Google Scholar]
- Gong, Y.; Qiao, C.; Zhong, B.; Zhong, J.; Gong, D. Analysis and characterization of materials used in heritage theatrical figurines. Herit. Sci. 2020, 8, 13. [Google Scholar] [CrossRef]
- Wang, X.; Zhen, G.; Hao, X.; Tong, T.; Ni, F.; Wang, Z.; Jia, J.; Li, L.; Tong, H. Spectroscopic investigation and comprehensive analysis of the polychrome clay sculpture of Hua Yan Temple of the Liao Dynasty. Spectrochim. Acta Part A Mol. Biomol. Spectrosc. 2020, 240, 118574. [Google Scholar] [CrossRef] [PubMed]
- Bai, X.; Jia, C.; Chen, Z.; Gong, Y.; Cheng, H.; Wang, J. Analytical study of Buddha sculptures in Jingyin temple of Taiyuan, China. Herit. Sci. 2021, 9, 2. [Google Scholar] [CrossRef]
- Shen, J.; Li, L.; Zhang, D.; Dong, S.; Xiang, J.; Xu, N. A Multi-Analytical Approach to Investigate the Polychrome Clay Sculpture in Qinglian Temple of Jincheng, China. Materials 2022, 15, 5470. [Google Scholar] [CrossRef]
- Li, Z. Protection of Grottoes Mural Paintings and Colored Sculptures on the Silk Road; Science Press: Beijing, China, 2005. (In Chinese) [Google Scholar]
- Ma, Q.; Zhou, G.; Cheng, H.; Wang, H.; Wang, S. Analysis and research on colored sculptures and mural pigments in the Bingling temple grottoes. Archaeology 1996, 7, 80–90. (In Chinese) [Google Scholar]
- Li, B. Analysis and research on the production technology and materials of Ming dynasty colored sculptures in Yunya temple grottoes in Zhuanglang county, Gansu province with cave 6 and cave 7 as examples. Spectrosc. Spectr. Anal. 2023, 43, 1501–1507. (In Chinese) [Google Scholar]
- Zhang, W.; Su, B.; Shan, Z.; Yu, Z. Scientific analysis of the Northern Wei mural paintings and colored sculptures in caves 257 and 259 of Mogao grottoes. Relics Museol. 2023, 1, 75–87. (In Chinese) [Google Scholar]
- Shen, W. A study on the green dragon and white tiger statues of Five-dragon palace in Wudang mountain and their production era. Art Res. 2008, 2, 45–51. (In Chinese) [Google Scholar]
- Aceto, M.; Agostino, A.; Fenoglio, G.; Idone, A.; Gulmini, M. Characterisation of colourants on illuminated manuscripts by portable fibre optic UV-visible-NIR reflectance spectrophotometry. Anal. Methods 2014, 6, 1488–1500. [Google Scholar] [CrossRef]
- Bell, I.M.; Clark, R.J.H.; Gibbs, P.J. Raman spectroscopic library of natural and synthetic pigments (pre-1850AD). Spectrochim. Acta A 1997, 53, 2159–2179. [Google Scholar] [CrossRef]
- Pérez-Diez, S.; Bernier, C.; Iñañez, J.G.; Maguregui, M. A Non-Invasive In Situ Spectroscopic Analysis of Cinnabar Minerals to Assist Provenance Studies of Archaeological Pigments. Crystals 2023, 13, 207. [Google Scholar] [CrossRef]
- Marucci, G.; Beeby, A.; Parker, A.W.; Nicholson, C.E. Raman spectroscopic library of medieval pigments collected with five different wavelengths for investigation of illuminated manuscripts. Anal. Methods 2018, 10, 1219–1236. [Google Scholar] [CrossRef]
- Amat, A.; Rosi, F.; Miliani, C.; Sassi, P.; Paolantoni, M.; Fantacci, S. A combined theoretical and experimental investigation of the electronic and vibrational properties of red lead pigment. J. Cult. Herit. 2020, 46, 374–381. [Google Scholar] [CrossRef]
- Souto, J.; Gutiérrez-Vicente, V.; Prieto, A.C. Raman analysis of Gothic wall paintings in the apse of the Santiago Apóstol church in Alcazarén. J. Cult. Herit. 2016, 22, 1061–1065. [Google Scholar] [CrossRef]
- Gliozzo, E. Pigments—Mercury-based red (cinnabar-vermilion) and white (calomel) and their degradation products. Archaeol. Anthrop. Sci. 2021, 13, 210. [Google Scholar] [CrossRef]
- Zou, W. Materials and techniques used in the manufacture of painted sculptures at Fushan Temple (1595–1882 AD), Heyang County, Shaanxi Province, China. J. Adhes. Sci. Technol. 2022, 36, 2213–2229. [Google Scholar] [CrossRef]
- Zhang, Y.; Wang, J.; Liu, H.; Wang, X.; Zhang, S. Integrated Analysis of Pigments on Murals and Sculptures in Mogao Grottoes. Anal. Lett. 2015, 48, 2400–2413. [Google Scholar] [CrossRef]
- Agnew, N. Conservation of Ancient Sites on the Silk Road: Proceedings of the Second International Conference on the Conservation of Grotto Sites PART NINE—Mogao Grottoes Cave 85 Project; Getty Publications: Los Angeles, CA, USA, 2010. [Google Scholar]
- Yong, L. Copper trihydroxychlorides as pigments in China. Stud. Conserv. 2013, 57, 106–111. [Google Scholar] [CrossRef]
- Cao, Y. Origin of paratacamite in the Kuqa Basin, Xinjiang, China: Defined by Cu isotope values. Chem. Geol. 2022, 602, 120902. [Google Scholar] [CrossRef]
- Shan, J.; Wang, J.; Shan, F.; Teng, X.; Fan, Q.; Li, Q.; Qin, Z.; Zhang, X. Origin and circulation of saline springs in the Kuqa Basin of the Tarim Basin, Northwest China. J. Arid Land 2020, 12, 331–348. [Google Scholar] [CrossRef]
- Scott, D.A. A Review of Copper Chlorides and Related Salts in Bronze Corrosion and as Painting Pigments. Stud. Conserv. 2013, 45, 39–53. [Google Scholar] [CrossRef]
- Reich, M.; Palacios, C.; Parada, M.A.; Fehn, U.; Cameron, E.M.; Leybourne, M.I.; Zúñiga, A. Atacamite formation by deep saline waters in copper deposits from the Atacama Desert, Chile: Evidence from fluid inclusions, groundwater geochemistry, TEM, and 36Cl data. Miner. Depos. 2008, 43, 663–675. [Google Scholar] [CrossRef]
- Wang, J.; Wang, J. The use and origin of copper-green pigments in the Dunhuang caves. Dunhuang Res. 2002, 74, 23–28. (In Chinese) [Google Scholar]
- Zhou, Z. A study on the painting pigments from the cave of Kizil Grottoes. J. Zhejiang Univ. (Sci. Ed.) 2022, 49, 726–732. (In Chinese) [Google Scholar]
- Frost, R.L.; Martens, W.; Kloprogge, J.T.; Williams, P.A. Raman spectroscopy of the basic copper chloride minerals atacamite and paratacamite: Implications for the study of copper, brass and bronze objects of archaeological significance. J. Raman Spectrosc. 2002, 33, 801–806. [Google Scholar] [CrossRef]
- Shaerkey, J.B.; Lewin, S.Z. Conditions governing the formation of atacamite and paratacamite. Am. Mineral. Search 1971, 56, 179–192. [Google Scholar]
- Buse, J.; Otero, V.; Melo, M. New Insights into Synthetic Copper Greens: The Search for Specific Signatures by Raman and Infrared Spectroscopy for Their Characterization in Medieval Artworks. Heritage 2019, 2, 1614–1629. [Google Scholar] [CrossRef]
- Coccato, A.; Bersani, D.; Coudray, A.; Sanyova, J.; Moens, L.; Vandenabeele, P. Raman spectroscopy of green minerals and reaction products with an application in Cultural Heritage research. J. Raman Spectrosc. 2016, 47, 1429–1443. [Google Scholar] [CrossRef]
- Fan, Y.; Chen, X.; Li, Z.; Hu, Z. Micro diffraction analysis of the rare green pigment botallackite in ancient wall paintings. J. Lanzhou Univ. 2003, 40, 52–55. (In Chinese) [Google Scholar]
- Li, M.; Xia, Y. Ancient Copper Green Pigment Synthesis Process Exploration. Yellow River Yellow Soil Yellow People 2016, 20, 43–48. (In Chinese) [Google Scholar]
- Bertolotti, G.; Bersani, D.; Lottici, P.P.; Alesiani, M.; Malcherek, T.; Schlüter, J. Micro-Raman study of copper hydroxychlorides and other corrosion products of bronze samples mimicking archaeological coins. Anal. Bioanal. Chem. 2012, 402, 1451–1457. [Google Scholar] [CrossRef] [PubMed]
- Li, M.; Wang, L.; Xia, Y.; Yang, Q. Research on the Spectral Analysis and Stability of Copper Green. Spectrosc. Spectr. Anal. 2013, 33, 3293–3297. (In Chinese) [Google Scholar]
- Cavallo, G.; Riccardi, M.P. Glass-based pigments in painting: Smalt blue and lead–tin yellow type II. Archaeol. Anthrop. Sci. 2021, 13, 199. [Google Scholar] [CrossRef]
- Xia, Y.; Xi, N.; Huang, J.; Wang, N.; Lei, Y.; Fu, Q.; Wang, W. Smalt: An under-recognized pigment commonly used in historical period China. J. Archaeol. Sci. 2019, 101, 89–98. [Google Scholar] [CrossRef]
- Burgio, L.; Clark, R.J. Library of FT-Raman spectra of pigments, minerals, pigment media and varnishes, and supplement to existing library of Raman spectra of pigments with visible excitation. Spectrochim. Acta A Mol. Biomol. Spectrosc. 2001, 57, 1491–1521. [Google Scholar] [CrossRef] [PubMed]
- Mattei, E.; de Vivo, G.; De Santis, A.; Gaetani, C.; Pelosi, C.; Santamaria, U. Raman spectroscopic analysis of azurite blackening. J. Raman Spectrosc. 2008, 39, 302–306. [Google Scholar] [CrossRef]
- Roy, A. Artists’ Pigments—A Handbook of Their History and Characteristics Volume 2; National Gallery of Art, Washington Archetype Publications: London, UK, 1993. [Google Scholar]
- Colomban, P.; Kırmızı, B.; Simsek Franci, G. Cobalt and Associated Impurities in Blue (and Green) Glass, Glaze and Enamel: Relationships between Raw Materials, Processing, Composition, Phases and International Trade. Minerals 2021, 11, 633. [Google Scholar] [CrossRef]
- Giannini, R.; Freestone, I.C.; Shortland, A.J. European cobalt sources identified in the production of Chinese famille rose porcelain. J. Archaeol. Sci. 2017, 80, 27–36. [Google Scholar] [CrossRef]
- Richter, M. Smalt in Polychromy and Painting of German-speaking Countries. In Historical Polychromy: Polychrome Sculpture in Germany and Japan; Hirmer Verlag: Munich, Germany, 2006; pp. 175–203. [Google Scholar]
- Zhao, X. Texual Research on Smaltum During the Early Ming Dynasty. J. Southwest Univ. Sci. Technol. 2007, 1, 64–67. (In Chinese) [Google Scholar]
- Lei, Y.; Chen, X.; Yang, H.; Qu, L.; Wang, S. Study of Smalt in the Architectural Paintings in Jian Fu Gong of the Imperial Palace. Palace Mus. J. 2010, 150, 140–156. (In Chinese) [Google Scholar]
- Song, Y.; Gao, F.; Nevin, A.; Guo, J.; Zhou, X.; Wei, S.; Li, Q. A technical study of the materials and manufacturing process used in the Gallery wall paintings from the Jokhang temple, Tibet. Herit. Sci. 2018, 6, 18. [Google Scholar] [CrossRef]
- Wang, N.; He, L.; Zhao, X.; Simon, S. Comparative analysis of eastern and western drying-oil binding media used in polychromic artworks by pyrolysis–gas chromatography/mass spectrometry under the influence of pigments. Microchem. J. 2015, 123, 201–210. [Google Scholar] [CrossRef]
- Wang, X.; Zhen, G.; Hao, X.; Zhou, P.; Wang, Z.; Jia, J.; Gao, Y.; Dong, S.; Tong, H. Micro-Raman, XRD and THM-Py-GC/MS analysis to characterize the materials used in the Eleven-Faced Guanyin of the Du Le Temple of the Liao Dynasty, China. Microchem. J. 2021, 171, 106828. [Google Scholar] [CrossRef]
- Hao, X.; Schilling, M.R.; Wang, X.; Khanjian, H.; Heginbotham, A.; Han, J.; Auffret, S.; Wu, X. Use of THM-PY-GC/MS technique to characterize complex, multilayered Chinese lacquer. J. Anal. Appl. Pyrol. 2019, 140, 339–348. [Google Scholar] [CrossRef]
- Ramli, S.; Afar, S.M.J.; Sisak, M.A.A.; Zainuddin, N.; Rahman, I.A. Formulation and physical characterization of microemulsions based carboxymethyl cellulose as vitamin c carrier. Malays. J. Anal. Sci. 2015, 19, 275–283. [Google Scholar]
- Liu, L.; Shen, W.; Zhang, B.; Ma, Q. Microchemical Study of Pigments and Binders in Polychrome Relics from Maiji Mountain Grottoes in Northwestern China. Microsc. Microanal. 2016, 22, 845–856. [Google Scholar] [CrossRef][Green Version]
- Gutman Rieppi, N.; Price, B.A.; Sutherland, K.; Lins, A.P.; Newman, R.; Wang, P.; Wang, T.; Tague, T.J. Salvator Mundi: An investigation of the painting’s materials and techniques. Herit. Sci. 2020, 8, 39. [Google Scholar] [CrossRef]
- Philippova, O.S.; Dmitriev, A.Y.; Tsarevskaya, T.J.; Dmitrieva, S.O. Comprehensive study of 12th century wall painting fragments from the St. George Cathedral of the Yuryev Monastery in Veliky Novgorod (Russia) using complementary physico-chemical methods. Herit. Sci. 2022, 10, 49. [Google Scholar] [CrossRef]
- Wang, N.; He, L.; Egel, E.; Simon, S.; Rong, B. Complementary analytical methods in identifying gilding and painting techniques of ancient clay-based polychromic sculptures. Microchem. J. 2014, 114, 125–140. [Google Scholar] [CrossRef]
- Hu, D.; Xue, T.; Wang, J.; Zhang, H. An analytical study of gilding and adhesive materials on the one-thounsand-hand Buddha at Dazu Grotto, Baoding Mountain, Chongqing. Sci. Conserv. Archaeol. 2008, 20, 44–51. (In Chinese) [Google Scholar]
- Yang, J.; Zhou, Z.; Lu, T.; Shen, L. Investigation of Gold Gilding Materials and Techniques Applied in the Murals of Kizil Grottoes, Xinjiang, China. Appl. Sci. 2022, 12, 11202. [Google Scholar] [CrossRef]
- Katsibiri, O.; Boon, J.J. Investigation of the gilding technique in two post-Byzantine wall paintings using micro-analytical techniques. Spectrochim. Acta Part B At. Spectrosc. 2004, 59, 1593–1599. [Google Scholar] [CrossRef]
Figure 1.
(a) Location of the Five−Dragon Palace; (b) layout map of the Five-Dragon Palace.
Figure 1.
(a) Location of the Five−Dragon Palace; (b) layout map of the Five-Dragon Palace.
Figure 2.
(a) Sculptures of Azure Dragon God and (b) White Tiger God.
Figure 2.
(a) Sculptures of Azure Dragon God and (b) White Tiger God.
Figure 3.
Cross-section images of red samples: (a) OM–vis, (b) UV–vis, and (c) BSE images of #R-1, and the corresponding elemental maps of (d) Ca, (e) Fe, and (f) sulfur (S); (g) OM–vis, (h) UV–vis, and (i) BSE images of sample #R-2, and the corresponding elemental maps of (j) silicon (Si) (k) Hg, and (l) Pb; (m) OM–vis image, (n) UV–vis image, and (o) BSE image of sample #R-3, and the corresponding elemental maps of (p) Si, (q) Hg, and (r) Pb.
Figure 4.
Raman spectra and XRD patterns of red pigment samples and reference minerals. (
a) Raman spectrum and (
b) XRD pattern of sample #R-1. (
c) Raman spectrum and (
d) XRD pattern of sample #R-2. (
e) Raman spectrum and (
f) XRD pattern of sample #R-3. Referenced Raman spectra shown in black lines are based on the RRUFF online database (
https://rruff.info/ (accessed on 27 February 2024)).
Figure 5.
Analysis results of green samples. Cross-section of sample #G-1: (a) OM-Vis, (b) OM-UV, and (c) BSE images. Element maps of (e) chlorine (Cl), (d) Si, (f) Cu, (g) Ca, and (h) S. (i) Raman spectra of the two layers of green particles in sample #G-1. (j) XRD pattern and (k) enlarged region of 3000–3500 cm−1 of Raman spectra of sample #G-1 (Reference based on the RRUFF online database).
Figure 6.
Analysis results of blue samples. Cross-section of sample #B-1: (a) OM–vis, (b) OM−UV, and (c) BSE images; (d–k) elemental maps of Co, S, K, As, Ca, Al, Si, and Pb. (l) XRD pattern of sample #B–1. (n) Raman spectra of blue particles and light blue layer under the blue particles in sample #B–1. (m) OM–vis and (o) UV–vis images; (p) BSE image and element maps of Cu (q) and Pb (r) for sample #B-2. (s) XRD pattern of #B-2 and (t) Raman spectra of blue particles and white layer in sample #B-2 with reference spectra.
Figure 7.
Analysis of a cross-section of sample #Glo-1: (a) OM–vis, (b) UV-vis, and (c) BSE images; elemental maps of (d) Ca, (e) Au, (f) S, (g) Pb, and (h) Si. (i) Micro-FTIR spectrum of the mordant layer and enlarged ν(C=O) band (1730–40 cm−1); (j) XRD pattern of sample #Glo-1.
Figure 7.
Analysis of a cross-section of sample #Glo-1: (a) OM–vis, (b) UV-vis, and (c) BSE images; elemental maps of (d) Ca, (e) Au, (f) S, (g) Pb, and (h) Si. (i) Micro-FTIR spectrum of the mordant layer and enlarged ν(C=O) band (1730–40 cm−1); (j) XRD pattern of sample #Glo-1.
Figure 8.
Analysis of cross-section of sample #Bla-1: (a) OM–vis, (b) UV, and (e) BSE image; (c) Raman spectrum of the black particles, (d) XRD pattern and (f) element concentration of sample #Bla-1.
Figure 8.
Analysis of cross-section of sample #Bla-1: (a) OM–vis, (b) UV, and (e) BSE image; (c) Raman spectrum of the black particles, (d) XRD pattern and (f) element concentration of sample #Bla-1.
Figure 9.
FTIR spectrum of the fibers in sample #R-2.
Figure 9.
FTIR spectrum of the fibers in sample #R-2.
Figure 10.
Total ion chromatograms (TIC) of samples (a) #R−1, (b) R−2, and (c) R−3.
Figure 10.
Total ion chromatograms (TIC) of samples (a) #R−1, (b) R−2, and (c) R−3.
Figure 11.
Layering patterns in the two sculptures.
Figure 11.
Layering patterns in the two sculptures.
Table 1.
Sampling location (Azure Dragon sculpture) and appearance information of samples.
Table 2.
Quantification results of the blue pigment of #B-1 by using EDS.
Table 2.
Quantification results of the blue pigment of #B-1 by using EDS.
| Element Name (Symbol) | Atomic Concentration Percentage% |
|---|
| Carbon (C) | 32.21 |
| Oxygen (O) | 48.01 |
| Silicon (Si) | 12.78 |
| Potassium (K) | 4.85 |
| Iron (Fe) | 0.43 |
| Cobalt (Co) | 0.54 |
| Arsenic (As) | 1.09 |
| Bismuth (Bi) | 0.08 |
| Disclaimer/Publisher’s Note: The statements, opinions and data contained in all publications are solely those of the individual author(s) and contributor(s) and not of MDPI and/or the editor(s). MDPI and/or the editor(s) disclaim responsibility for any injury to people or property resulting from any ideas, methods, instructions or products referred to in the content. |
© 2024 by the authors. Licensee MDPI, Basel, Switzerland. This article is an open access article distributed under the terms and conditions of the Creative Commons Attribution (CC BY) license (https://creativecommons.org/licenses/by/4.0/).


