Article

Cobalt Ion-Modified Titanium Oxide Nanorods: A Promising Approach for High-Performance Electrochromic Application

1
School of Chemical Engineering, Yeungnam University, 280 Daehak-ro, Gyeongsan 38541, Republic of Korea
2
Division of Electronics and Electrical Engineering, Dongguk University, Seoul 04620, Republic of Korea
*
Author to whom correspondence should be addressed.
Coatings 2024, 14(6), 707; https://doi.org/10.3390/coatings14060707
Submission received: 8 May 2024 / Revised: 2 June 2024 / Accepted: 3 June 2024 / Published: 4 June 2024
(This article belongs to the Special Issue Thin-Film Synthesis, Characterization and Properties)

Abstract

:
The development of novel cathodic materials with tailored nanostructures is crucial for the advancement of electrochromic devices. In this study, we synthesized cobalt-doped titanium dioxide (Ti-Co) thin films using a facile hydrothermal method to investigate the effects of cobalt doping on their structural, morphological, and electrochromic properties. Comprehensive characterization techniques, including X-ray diffraction and Raman analysis, confirmed the highly crystalline nature of the Ti-Co thin films, with specific Raman bands indicating distinct modifications due to cobalt incorporation. The TiO2 nanorods, optimally doped with cobalt (TC-3), demonstrated enhanced charge transport and mobility, significantly improving the electrochromic performance. Among the various compositions studied, the TC-3 sample exhibited superior lithium-ion accommodation, achieving an optical modulation of 73.6% and a high coloration efficiency of 81.50 cm2/C. It also demonstrated excellent electrochromic stability, maintaining performance for up to 5000 s of coloring/bleaching cycles. These results confirm the beneficial impact of cobalt doping on the structural and functional properties of the host material. Furthermore, the practical effectiveness of the TC-3 thin film was validated through the fabrication of an electrochromic device, which showed efficient coloration and bleaching capabilities. This comprehensive research enhances the understanding and functionality of Ti-Co nanorod architectures, highlighting their promising potential for advanced electrochromic applications.

1. Introduction

Electrochromic (EC) materials represent a class of intelligent substances capable of undergoing color transformations through selective light absorption or transmission upon exposure to electrical impulses [1,2,3]. Given that building energy consumption constitutes a significant portion, 30%–40%, of total global energy usage, the utilization of smart windows incorporating EC materials has garnered increasing attention [4]. These advanced EC smart windows offer the dynamic regulation of solar radiation transmittance, achieved through their ability to selectively absorb or reflect external heat radiation and internal heat diffusion [5,6,7]. Consequently, they contribute to maintaining comfortable indoor temperatures, keeping spaces cool in summer and warm in winter [8].
Moreover, these windows serve a dual purpose by enhancing natural light levels, optimizing shading, and addressing voyeurism concerns. This multifaceted functionality endows them with a wide array of potential applications in energy-efficient buildings, intelligent transportation systems, and various other sectors [9,10,11]. An illustrative example of recent progress is the approval and release by the State Intellectual Property Office of China (CNIPA) of a new design patent for Huawei’s all-in-one design smartphone. This innovative device boasts the ability to swiftly adjust camera glass opacity, enabling a seamless transition to a concealed display effect [12,13,14]. Such advancements underscore the transformative impact of EC technology on modern devices and infrastructure [15].
The categorization of EC materials comprises three main groups: metal oxides, conductive polymers, and inorganic non-oxides. Metal oxides, such as titanium oxide (TiO2), tungsten trioxide (WO3), nickel oxide (NiO), niobium pentoxide (Nb2O5), manganese dioxide (MnO2), and vanadium pentoxide (V2O5), stand as widely utilized options among numerous available alternatives [16]. A multitude of in-depth investigations have been undertaken on TiO2, recognized as a prominent metal oxide owing to its remarkable potential to exhibit excellent EC properties. As a wide-bandgap semiconductor, TiO2 exhibits intriguing EC properties, making it a promising candidate for various optoelectronic devices such as smart windows, displays, and EC mirrors [17,18]. Despite its promising attributes, the practical implementation of TiO2 in EC applications has been hindered by certain challenges, including limited coloration efficiency, slow response times, and poor long-term stability [19]. Addressing these limitations requires a comprehensive understanding of the underlying electrochemical processes and the development of innovative strategies to enhance the EC performance of TiO2-based materials [20,21].
Metal doping is an extensively researched method for improving the EC traits of TiO2. Metal doping in TiO2 for electrochromism has emerged as a promising avenue for enhancing the optical and electrochemical properties of TiO2-based materials [22,23,24]. Through the deliberate introduction of metal ions into the TiO2 lattice, either during synthesis or post-synthesis processes, researchers can tailor the material’s band structure and electronic properties to achieve desired EC behavior [25]. Metal dopants, such as transition metals (e.g., W, Mo, Co, Nb), can facilitate charge transfer processes, improve coloration efficiency, and modulate the optical switching speed of TiO2-based EC devices [26,27]. By carefully selecting dopant types and concentrations, as well as optimizing doping methods, it is possible to engineer metal-doped TiO2 materials with enhanced EC performance, paving the way for their practical application.
Among transition dopants, many studies have focused on cobalt (Co) because Co ions can easily substitute titanium ions in the TiO2 lattice structure, leading to minimal lattice distortion. This seamless integration enables Co to effectively modify the electronic structure of TiO2, enhancing its EC properties without compromising its structural integrity [28]. Additionally, Co doping facilitates the introduction of additional electronic states within the TiO2 bandgap, promoting efficient charge transfer processes essential for electrochromism [29,30]. Cao et al. employed a fluoride-assisted synthesis technique to fabricate Ta-doped TiO2 films, achieving notable EC stability. Their findings revealed that after 2000 cycles, the optical modulation at 550 nm experienced only a minor reduction of 1.3% [31]. Niu et al. utilized a sol–gel approach to create Ce-doped TiO2 films, revealing that doping with 2 mol% Ce yielded optimized EC properties. Notably, under this doping condition, the injection charge density reached a remarkable 15.12 mC cm−2 [32]. Guo et al. conducted a study on W-doped TiO2 EC films, which were deposited using a cosputtering technique. Their research revealed a significant enhancement in the light modulation amplitude at 550 nm, exhibiting an impressive increase of approximately 68% [33]. Zhang et al. investigated the EC properties of TiO2 doped with Co using the sol–gel method. Their study revealed notable improvements in switching time, with Tb (bleaching time) at 2.9 s and Tc (coloring time) at 5.1 s. Additionally, an enhanced coloration efficiency of 18.89 cm2/C was observed [34].
Despite numerous studies, there has been a lack of comprehensive research specifically focused on enhancing EC properties by incorporating Co into TiO2 films. The limited reports on cobalt-doped TiO2 for EC applications may be due to the restricted mobility of cobalt ions within the TiO2 lattice. Therefore, we aimed to investigate the potential of Ti-Co thin films to improve EC properties using a straightforward, one-step hydrothermal method. A thorough examination was conducted on TiO2 thin films with varying levels of Co doping to determine the optimal concentration of Co. This investigation sought to uncover the detailed effects of Co incorporation on the structural, morphological, and EC characteristics of TiO2 thin films.

2. Experimental Section

2.1. Reagents and Materials

All chemicals, including titanium (IV) butoxide (C16H36O4Ti, Sigma–Aldrich, 97%), hydrochloric acid (HCl, DUKSAN 35%–37%), and cobalt (II) chloride hexahydrate (CoCl2·6H2O, Sigma–Aldrich), were of analytical grade and employed without additional purification. The electrolyte comprised lithium perchlorate (LiClO4, Sigma–Aldrich, 99.99%) dissolved in propylene carbonate (PC, Sigma–Aldrich, 99.7%). Fluorine-doped tin oxide (FTO) glass substrates were provided by MTI Co., Ltd., Republic of Korea.

2.2. Synthesis of Ti-Co Thin Films

Initially, FTO glass substrates underwent a thorough chemical treatment, involving sequential immersions in acetone, methanol, and deionized (DI) water, each followed by 15 min of ultrasonication. Subsequently, they were dried under a nitrogen (N2) stream. For the preparation of the Ti-Co precursor solution, a mixture was prepared by combining 20 mL of DI water with an equal volume of concentrated HCl. Following this, 0.5 mL of titanium (IV) butoxide was carefully introduced into the above mixture. Incorporation of cobalt doping, varying from 0.1%, 0.3%, to 0.5%, was achieved by adding an appropriate amount of cobalt chloride to the TiO2 precursor mixture, which was stirred continuously for 20 min. The synthesis of Ti-Co was carried out by the facile hydrothermal method. A clean FTO substrate was positioned vertically within a Teflon container, into which the prepared solution was poured. The entire assembly was enclosed in a stainless-steel autoclave and subjected to a hydrothermal reaction at 150 °C for four hours. Once the reaction was completed, the assembly was allowed to cool to room temperature, and then the Ti-Co deposited FTO was washed with ethanol and DI water. Finally, the films underwent annealing at 500 °C for 30 min. Figure 1 illustrates a streamlined depiction of the potential process involved in the formation of Ti-Co thin films. The samples were abbreviated as TC-1, TC-3, and TC-5 according to their Co content.

2.3. Electrochromic Device Fabrication

This study showcased the practical utilization of Ti-Co thin film within electrochromic devices (ECDs). The device configuration comprised Glass/FTO/TC-3 /LiClO4+PC/FTO/Glass with dimensions of 3 × 4 cm2. The FTO glass substrate served as the counter electrode, while the TC-3 thin film on FTO glass functioned as the active EC layer. A 1 M LiClO4 + PC electrolyte was utilized to encapsulate the active layer deposited on FTO and the bare FTO/glass substrate. The EC assembly was completely sealed using transparent double-sided adhesive tape.

3. Material Characterization

The crystal structure of the samples was analyzed utilizing X-ray diffraction (XRD; PAN analytical) employing Cu-Kα radiation spectroscopy. To investigate the surface morphology, elemental composition, and mapping, field-emission scanning electron microscopy (FE-SEM, S-4800 HITACHI, Ltd., Japan) combined with energy dispersive spectroscopy (EDS) was employed. Furthermore, Raman spectroscopy using an XploRA Plus Raman spectroscope (HORIBA Jobin Yuon S. A. S., France) was carried out to study the chemical composition of Ti-Co. X-ray photoelectron spectroscopy (XPS; K-Alpha, Thermo Scientific, UK) was utilized to explore the chemical state element within the composition. For electrochemical measurements, a three-electrode configuration was adopted, utilizing an (battery cycler, Biologic Instrument-WBCS3000) electrochemical workstation. The electrochromic optical transmittance performance was assessed using a UV–Vis spectrophotometer (Model: S-3100, SCINCO) interconnected with an electrochemical workstation (IVIUM Technologies, COMPACTSTAT.e). These measurements were performed within 1 M LiClO4+PC aqueous electrolyte, where Ti-Co thin films functioned as the working electrode, platinum as the counter electrode, and Ag/AgCl as the reference electrode.

4. Results and Discussion

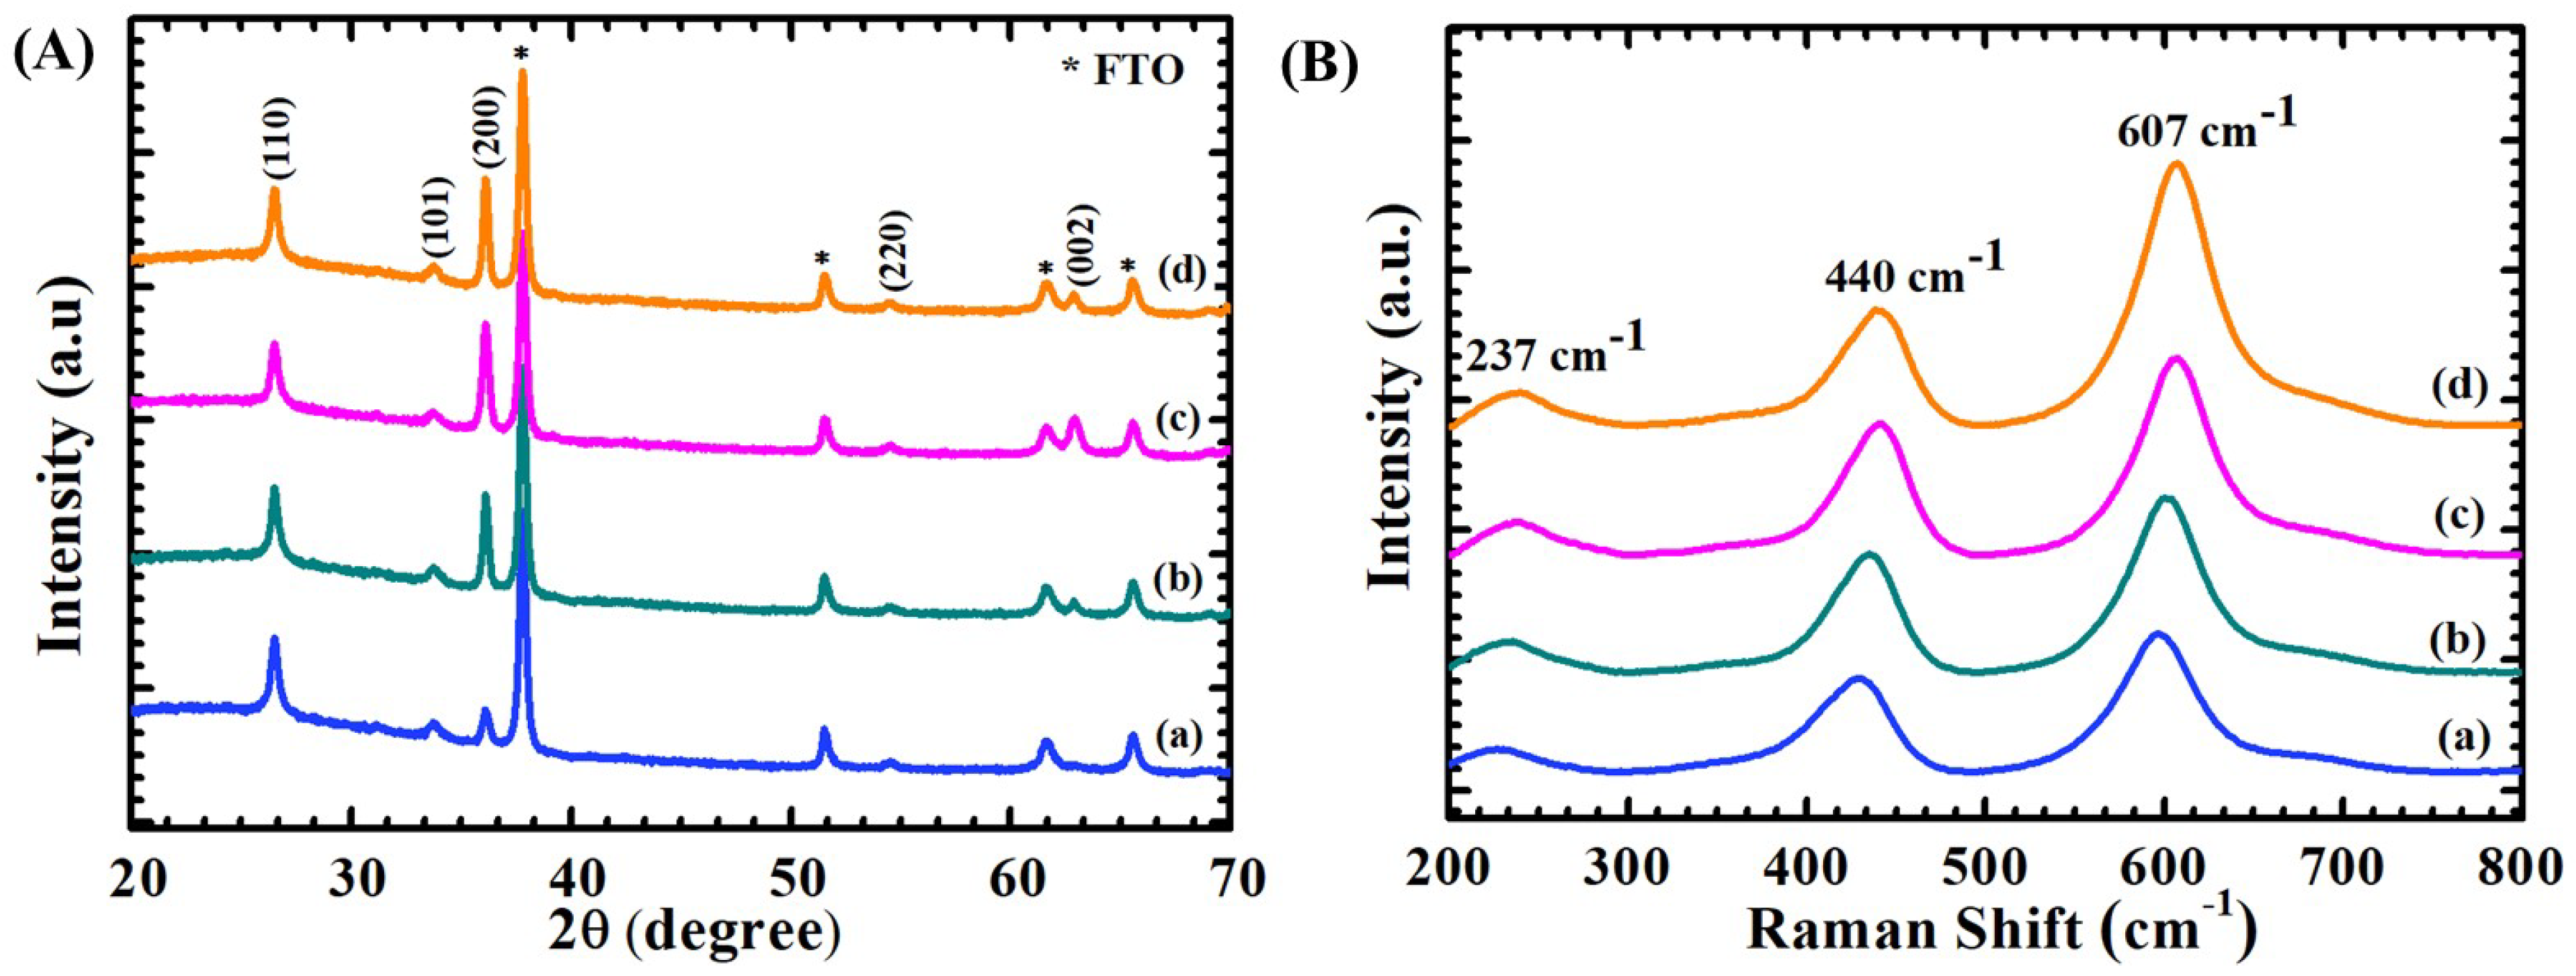
4.1. X-ray Diffraction Elucidation

XRD analysis was conducted to elucidate the structural characteristics and phase purity of deposited thin films. In this study, XRD was employed to probe the structural parameters of undoped and Ti-Co thin films, with cobalt dopant concentrations ranging from 0.1% to 0.5%. The XRD patterns, depicted in Figure 2A, reveal highly crystalline films, exhibiting peak positions consistent with the TiO2 phase, in alignment with the reported data. Specifically, the diffraction peaks observed at 2θ of 26.51°, 33.8°, 36.1°, 54.6°, and 62.8° correspond to the (110), (101), (200), (220), and (002) hkl planes of crystalline rutile TiO2 with a tetragonal crystal structure, and they perfectly match with the JCPDS File No. 88-1175 [35]. Notably, no additional peaks attributable to cobalt or cobalt oxide were detected, affirming that the rutile phase remains immutable by Co doping. Nevertheless, subtle alteration in peak intensity suggests modification in the local structure around Ti4+ ions after Co doping. This shift, coupled with a change in intensity, provides compelling confirmation for the successful incorporation of Co into the TiO2 lattice [36].

4.2. Raman Spectroscopy Analysis

Raman spectroscopy emerges as a vital tool for studying the phase composition and disorder induced by dopant integration with the host lattice. Herein, Raman analysis was employed to probe the phase evolution and disorder ensuing from cobalt doping in TiO2 thin films. The Raman spectra presented in Figure 2B describe features of TiO2 and Co-doped thin films across varying cobalt concentrations. Rutile TiO2, characterized by a tetragonal lattice structure, exhibited three discernible Raman modes centered at 237 cm−1, 440 cm−1, and 607 cm−1, consistent with the reported literature [37]. The two prominent bands at 440 cm−1, and 607 cm−1 correspond to the TiO2 Eg and B1g modes, respectively, attributed to symmetric stretching and bending vibrations of O-Ti-O bonds, respectively. While the band at 237 cm−1 is attributed to the disordered-induced scattering mode of rutile [38]. Intriguingly, upon cobalt doping, a notable shift of Raman bands towards a higher wavenumber is observed, accompanied by peak broadening and intensity raising. Such spectral modifications signify the incorporation of cobalt ions into the TiO2 crystal lattice, leading to structural distortions [39]. In addition, the absence of new Raman peaks in the spectra underscores the detention of the rutile phase of TiO2 upon the doping of cobalt ions.

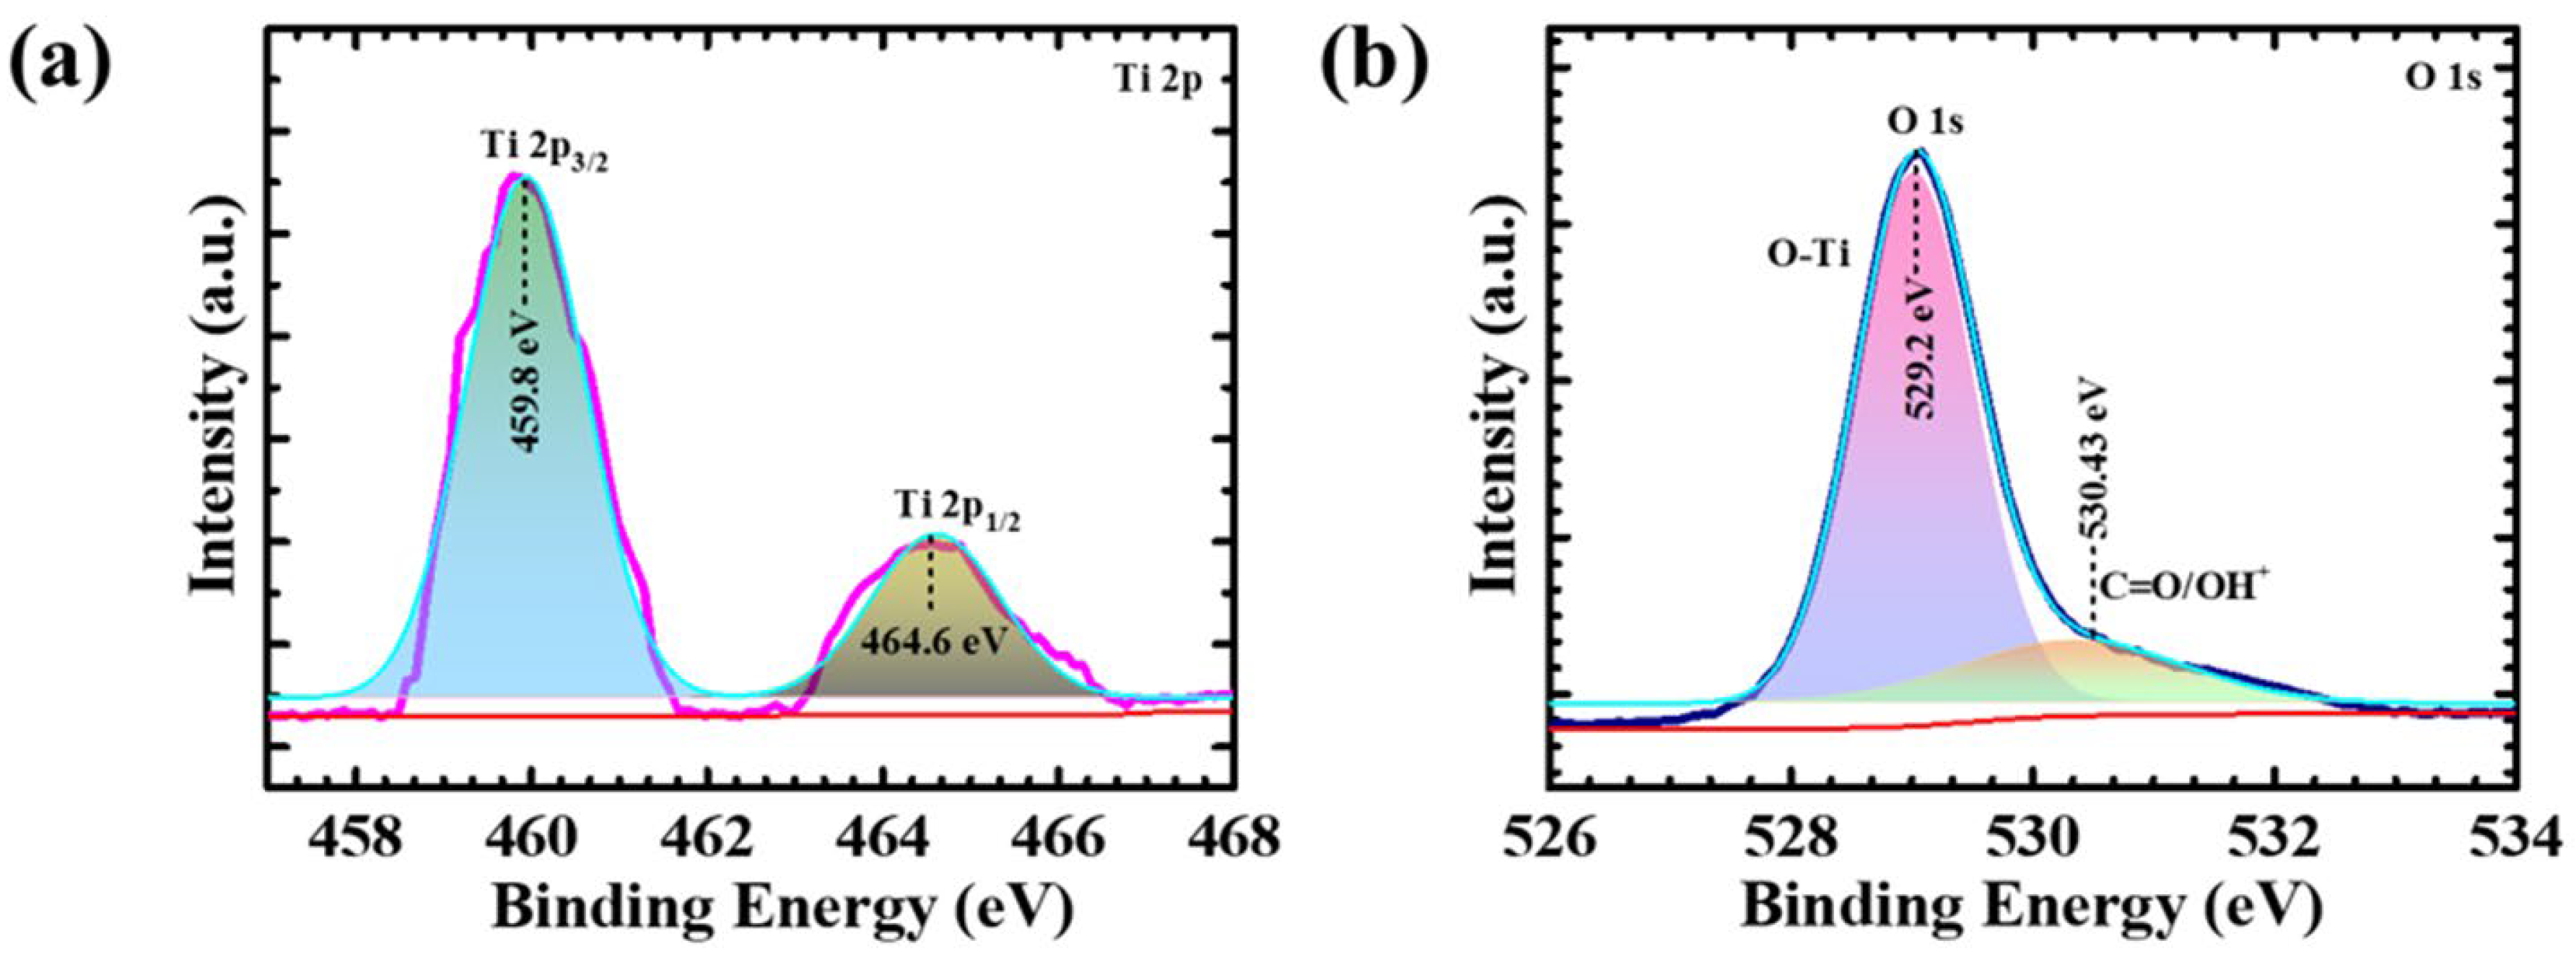
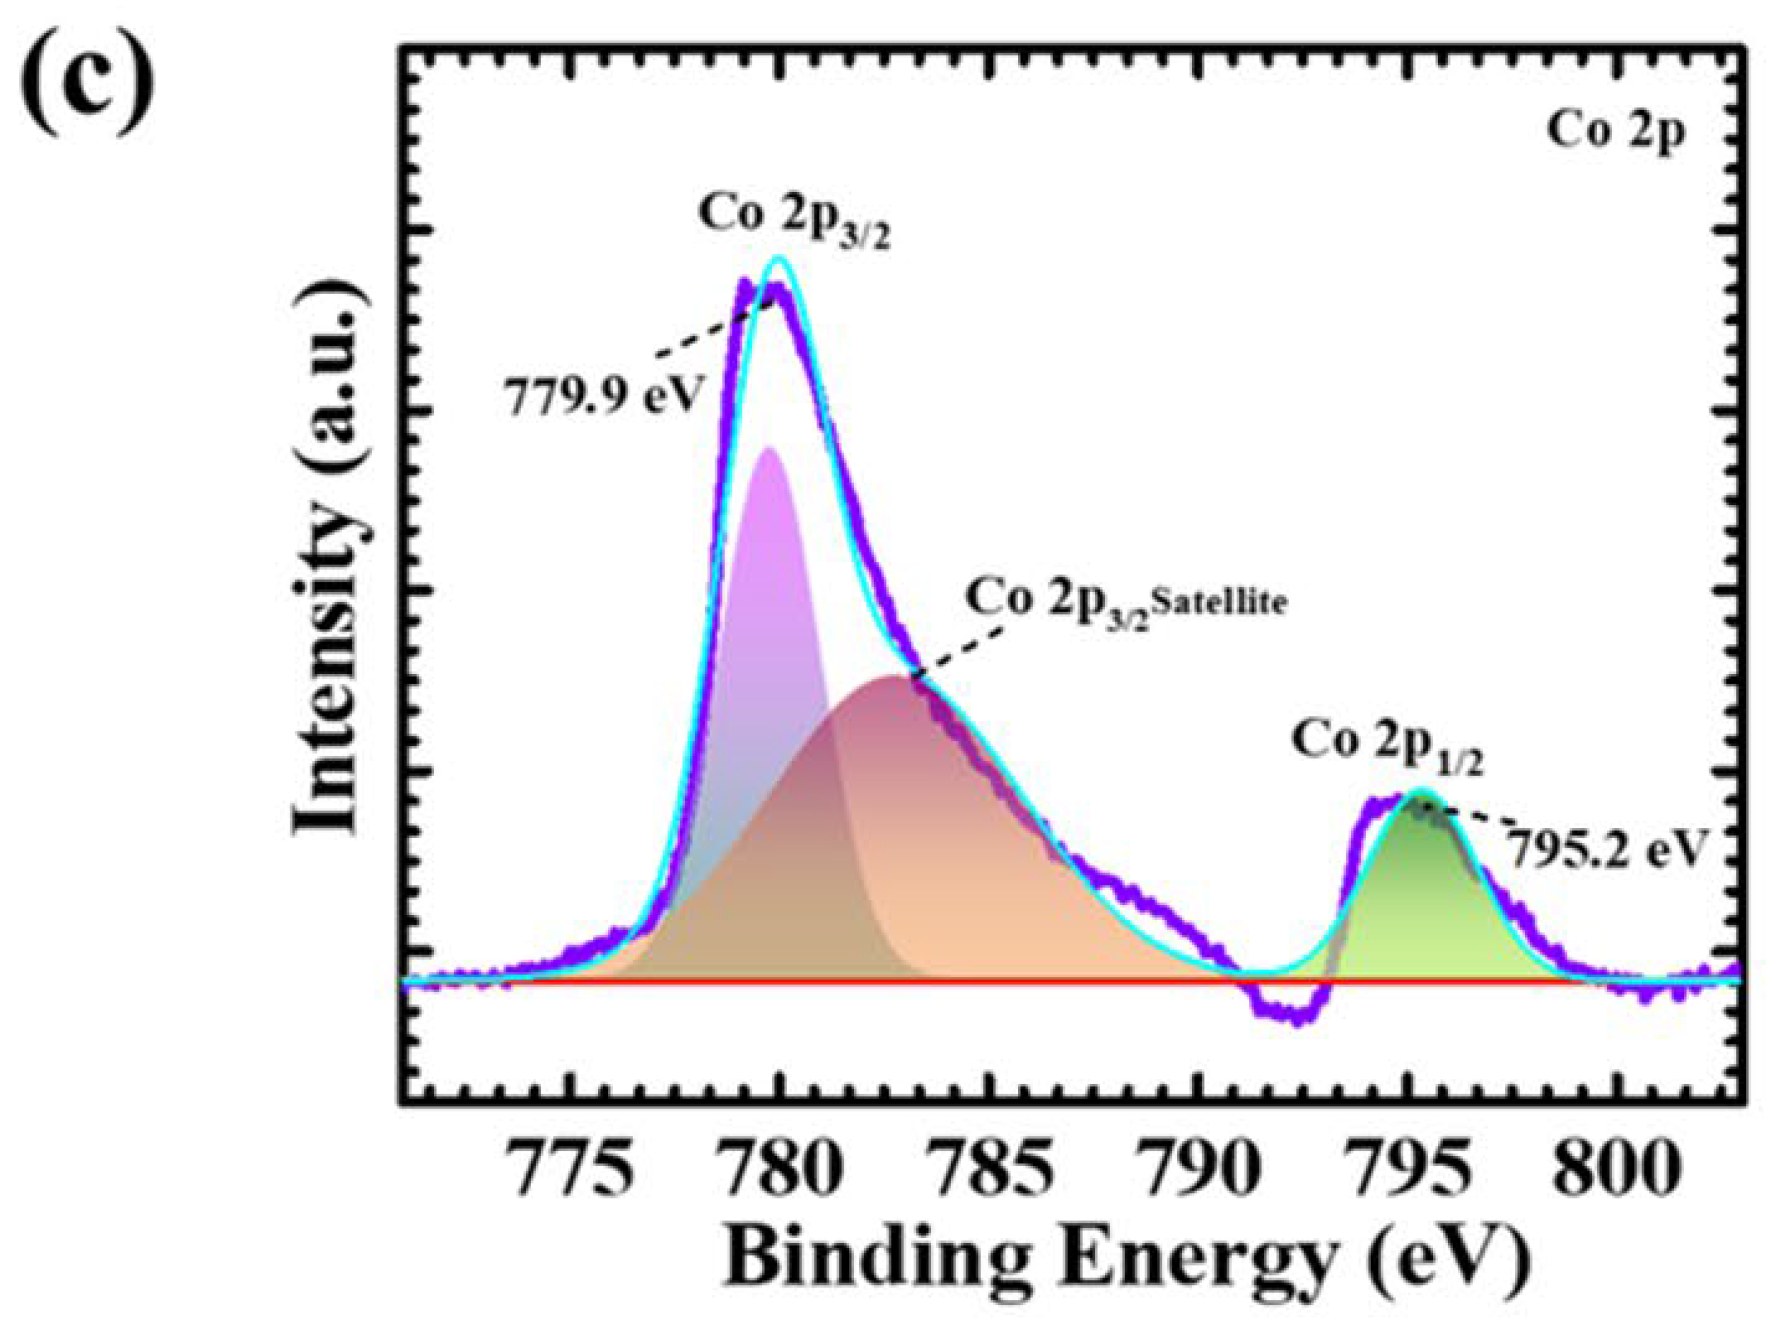
4.3. X-ray Photoelectron Spectroscopy Elucidation

XPS data elucidate the chemical bonding configuration and surface composition of Ti-Co, offering valuable insights into the prepared material. In this study, XPS characterization was conducted on the TC-3 sample, as shown in Figure 3. The high-resolution Ti 2p core level spectrum (Figure 3a) exhibited characteristic peaks at binding energies of 459.8 eV and 464.6 eV, corresponding to the Ti 2p3/2 and Ti 2p1/2 orbitals, respectively [38]. These peaks signify the presence of Ti4+ ions in the rutile phase of TiO2, verifying the results from XRD and Raman analysis. Furthermore, an assessment of the O 1s spectrum (Figure 3b) unveiled two distinct peaks centered at 529 eV and 530.4 eV, indicative of diverse oxygen chemical states. The dominant peak at 529 eV was attributed to lattice oxygen (Ti-O-) within TiO2, while the minor peak signified absorbed oxygen species [40]. Subsequently, examination of the Co 2p spectrum (Figure 3c) revealed the presence of cobalt elements, with two principal peaks observed at 779 eV and 796 eV, emerged by (Co 2p3/2) and (Co 2p1/2) orbital, respectively, supplemented with satellite peaks [41]. This observation provides compelling evidence for the successful incorporation of Co atoms into TiO2 thin film.

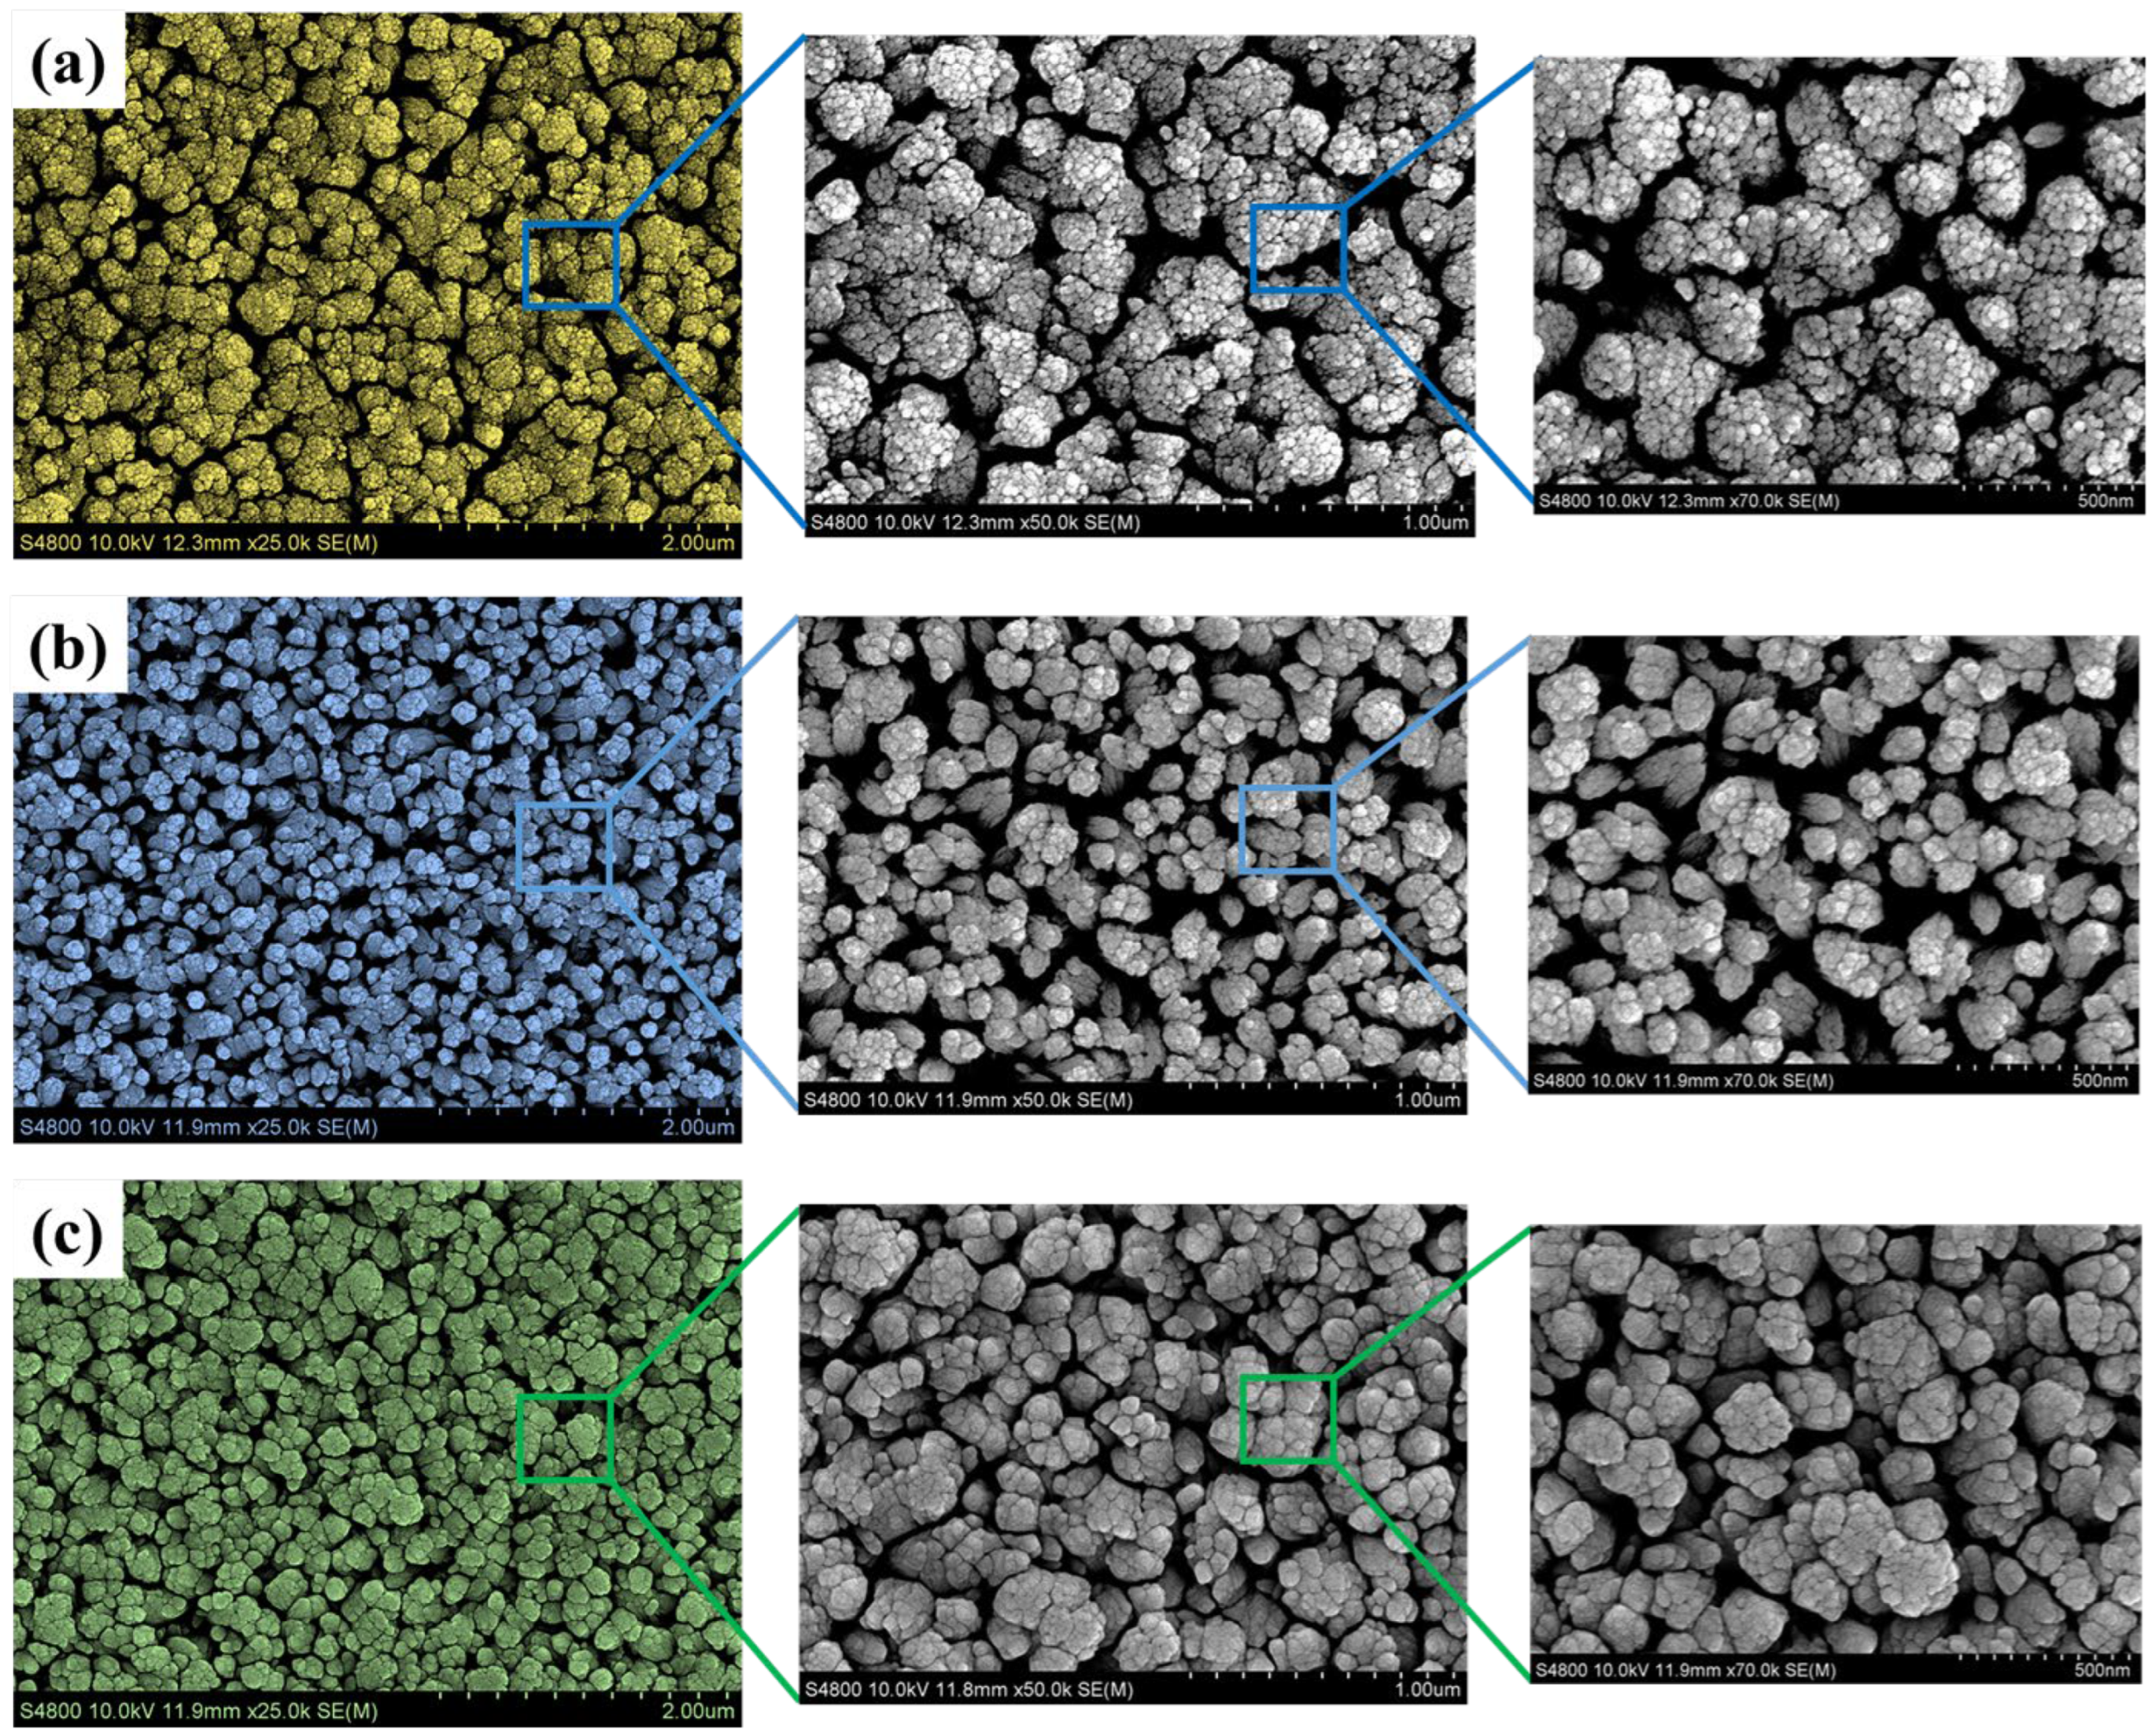
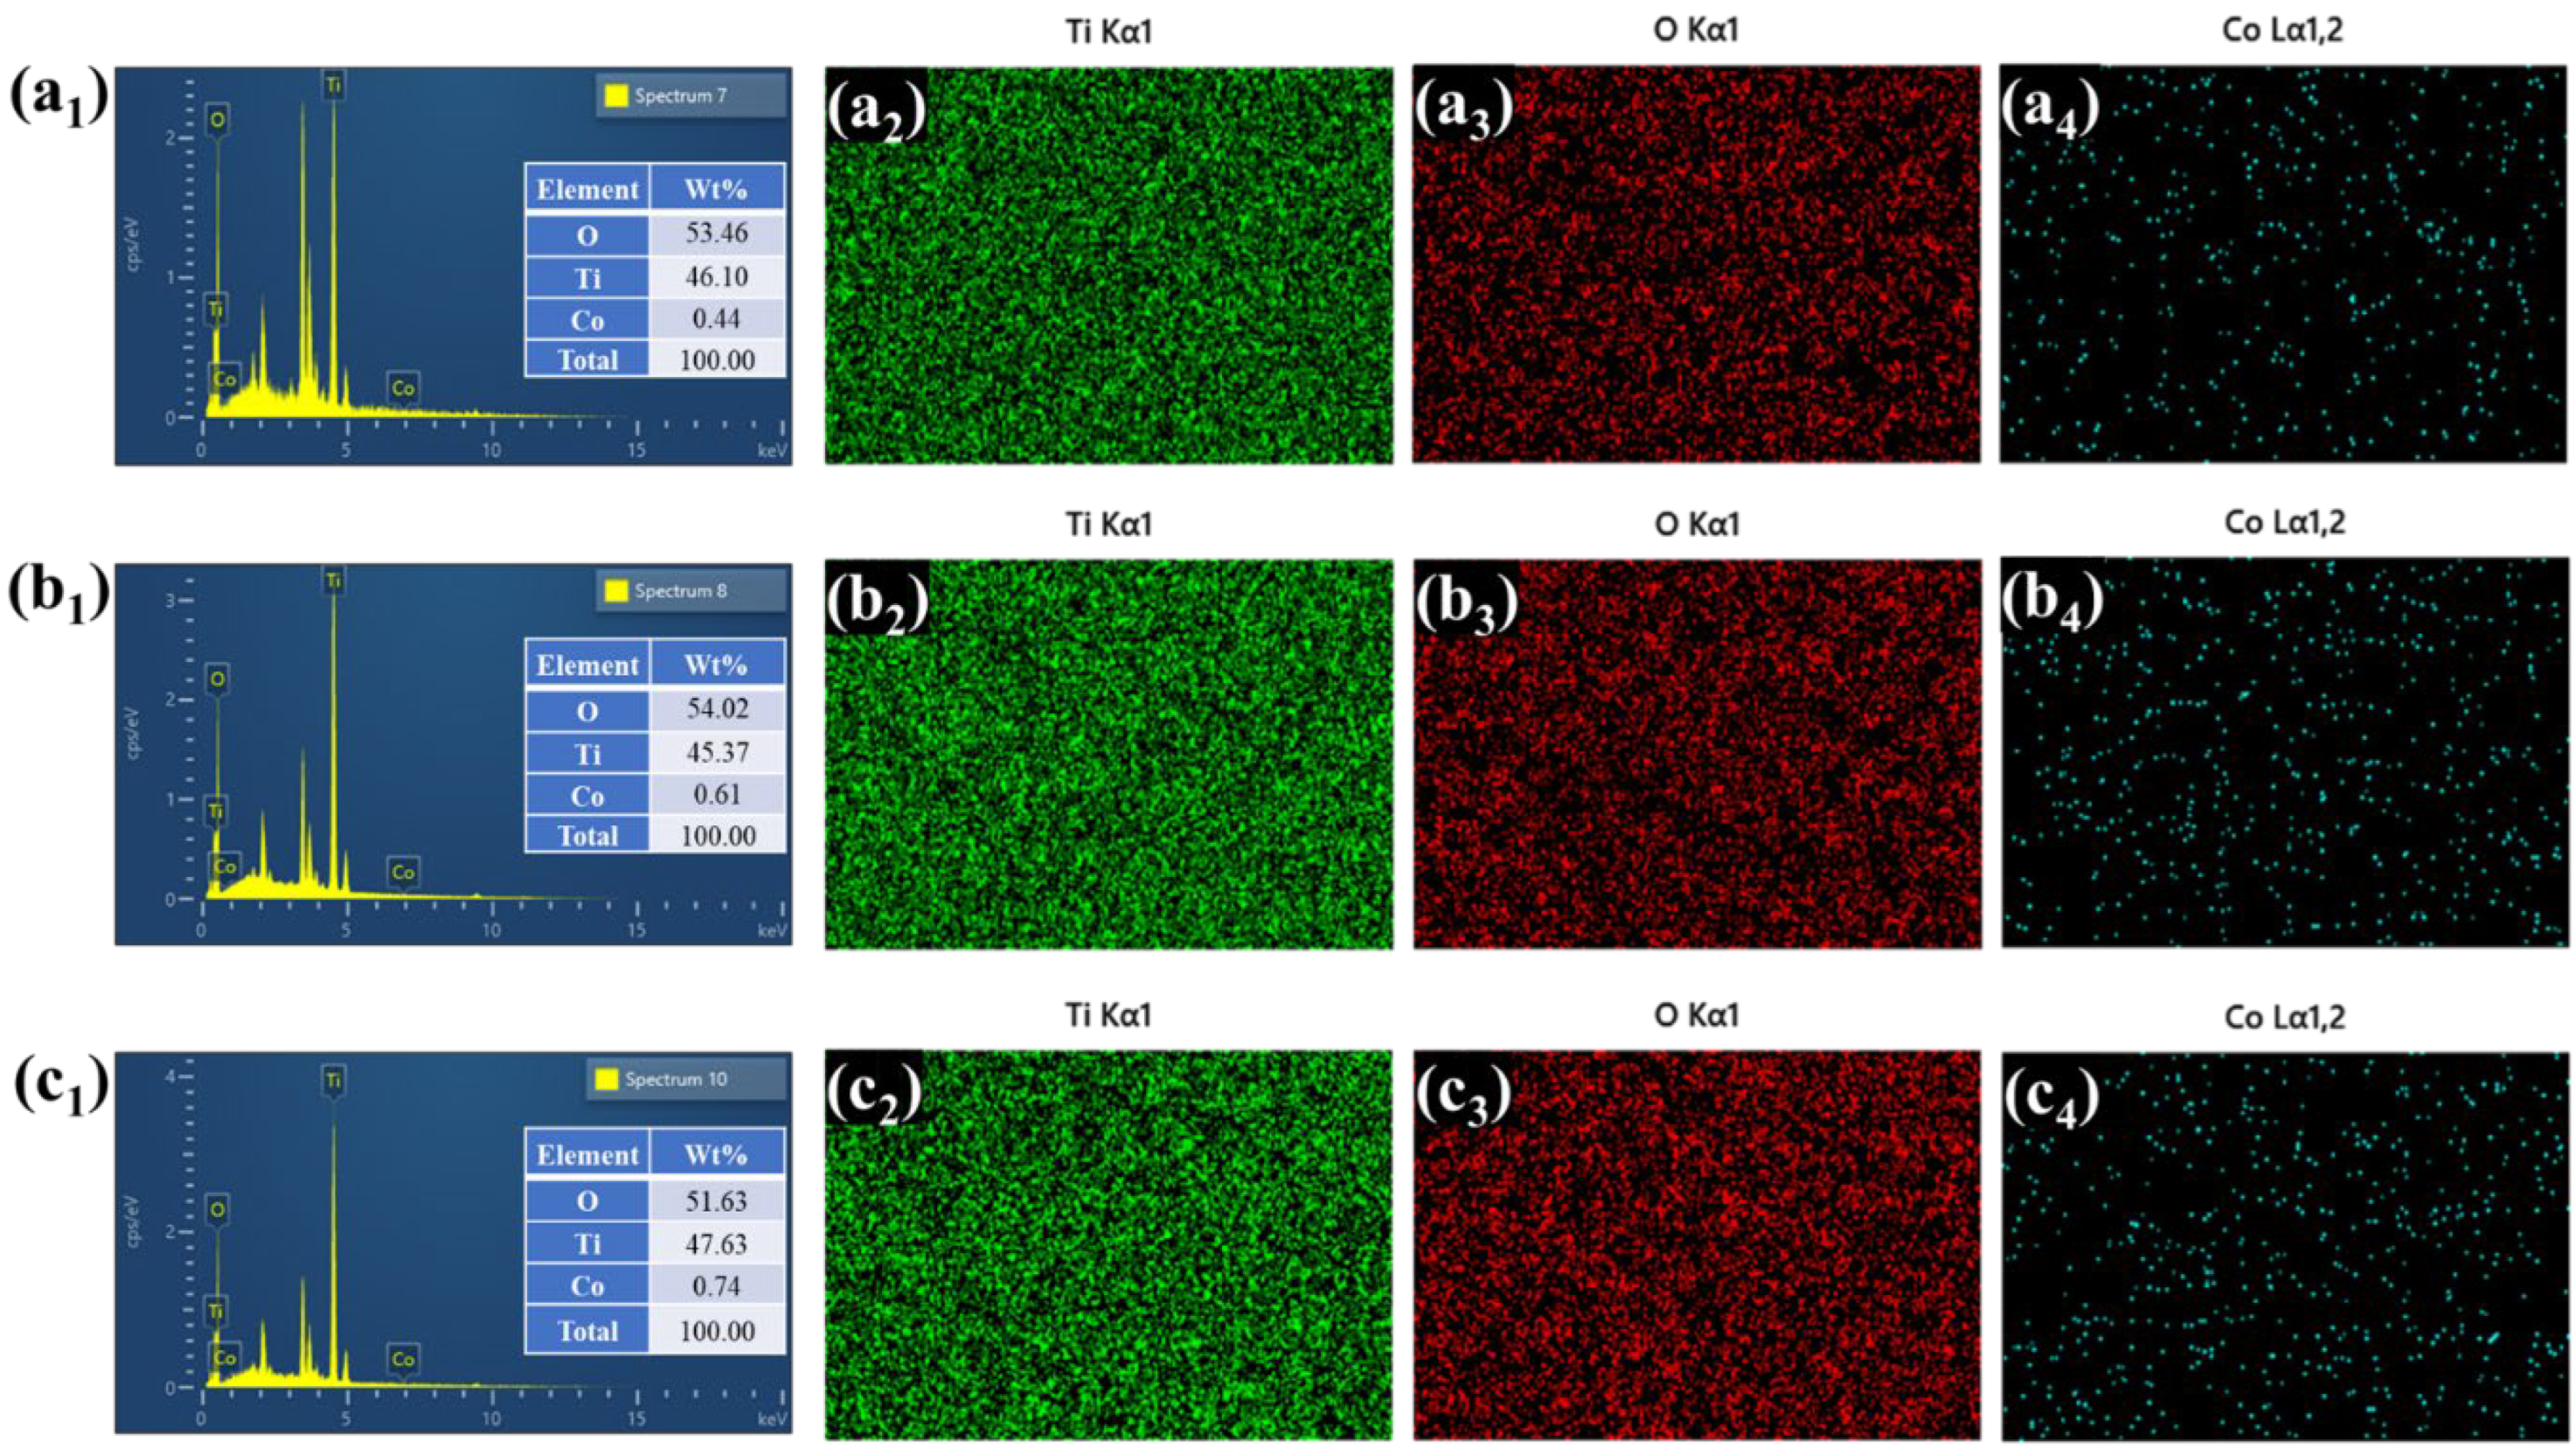
4.4. Morphological and Elemental Compositional Characteristics

The morphology of Ti-Co thin films underwent comprehensive examination through FESEM to elucidate the influence of varying cobalt concentrations on the physio-chemical and EC characteristics of TiO2 thin films. Figure 4 presents surface morphology images of Ti-Co thin films at different magnifications, while Figure S1a shows FESEM images of pristine TiO2 for comparison. Notably, all films exhibited highly uniform TiO2 nanorods perpendicular to the substrate, indicative of successful synthesis. Pristine TiO2 demonstrated characteristic pattern distribution of nanorods across the FTO substrate, with regional accumulation. However, cobalt doping induced notable structural transformations, leading to the formation of small nanospheres on the nanorods (Figure 4a). Even at a low cobalt concertation (TC-1), the nanorod underwent discernible changes, marked by the emergence of aggregated nanospheres decorating the nanorods. This aggregation may hinder ion transport, subsequently decaying EC performance. With increasing cobalt percentage, sample TC-3 (Figure 4b) showed a remarkable evolution in morphology. The gradual augmentation in nanospheres coverage and size, accompanied by a shift towards a more homogeneous distribution cross the substrate. This suggests an intricate interplay between optimum cobalt percentage and the resulting morphology. The observed well-grown surface structure with suitable voids exhibited enhanced surface area conducive to the ion intercalation/deintercalation process. However, as cobalt doping reached a higher percentage, 0.5%, a distinct transition in morphology was evident (Figure 4c). The TiO2 nanorods transformed into a dense and compact structure, due to large nanospheres dominating the surface. The dense structure may limit the availability of reactive sites for charge transportation. These diverse morphological alterations were observed because the cobalt doping introduced changes in the surface energy of TiO2 nanorods, thereby influencing the kinetics of crystal growth. The variation in cobalt amount may lead to modifications in the nucleation and growth rates, ultimately meaning that a higher percentage (0.5%) promotes the aggregation and coalescence of particles [2]. The overall observations underscored the delicate balance between cobalt percentage and resultant morphology, offering valuable insights into the design and optimization of Ti-Co material for EC applications [10,12,21].
Quantitative compositional investigation and elemental mapping of TC-1, TC-3, and TC-5 samples were conducted utilizing EDS, depicted in Figure 5(a1–c4). Additionally, pristine TiO2 elemental analysis and mapping data were measured for parallel assessment and are shown in Figure S1b,c. Figure 5(a1–c4) clearly affirmed the presence of titanium, oxygen, and cobalt in all the Ti-Co samples. The observed wt% of these elements is in good agreement and closely correlated to the expected doping levels of cobalt, underscoring the efficacy of the doping process. Furthermore, elemental mapping provided compelling visual evidence supporting the FESEM results, confirming the uniform distribution of all elements across the substrate [2].

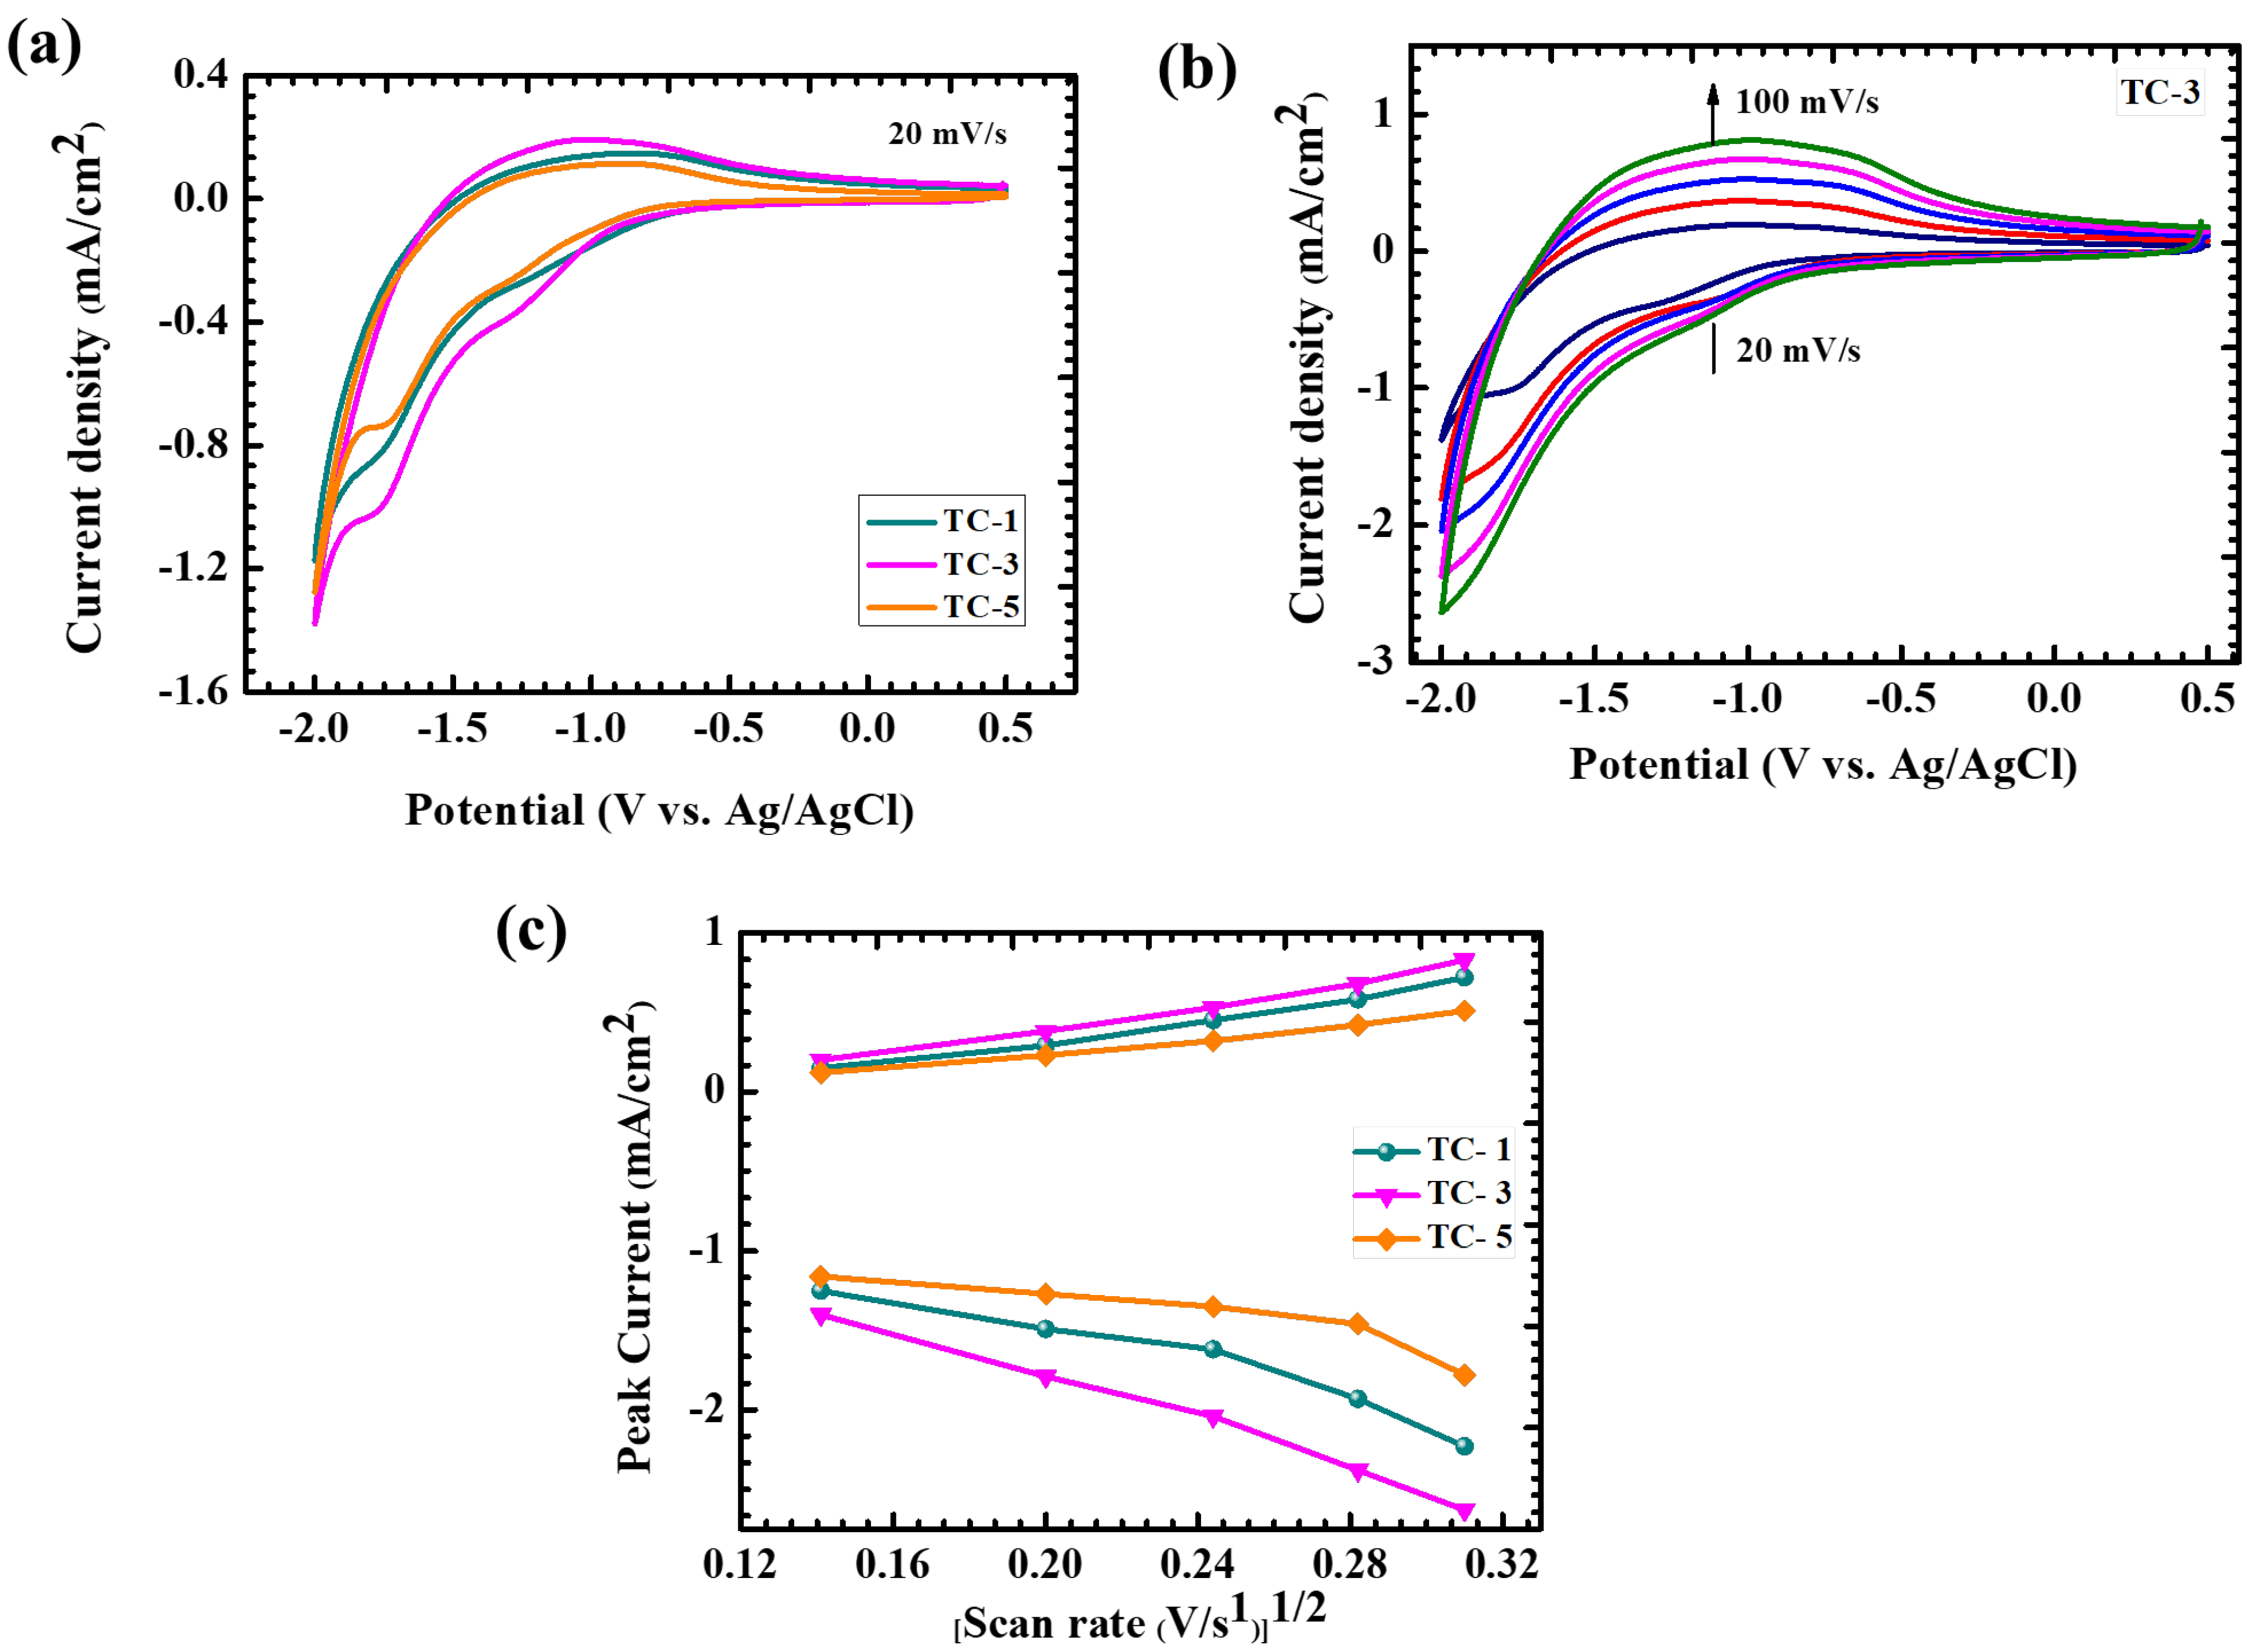
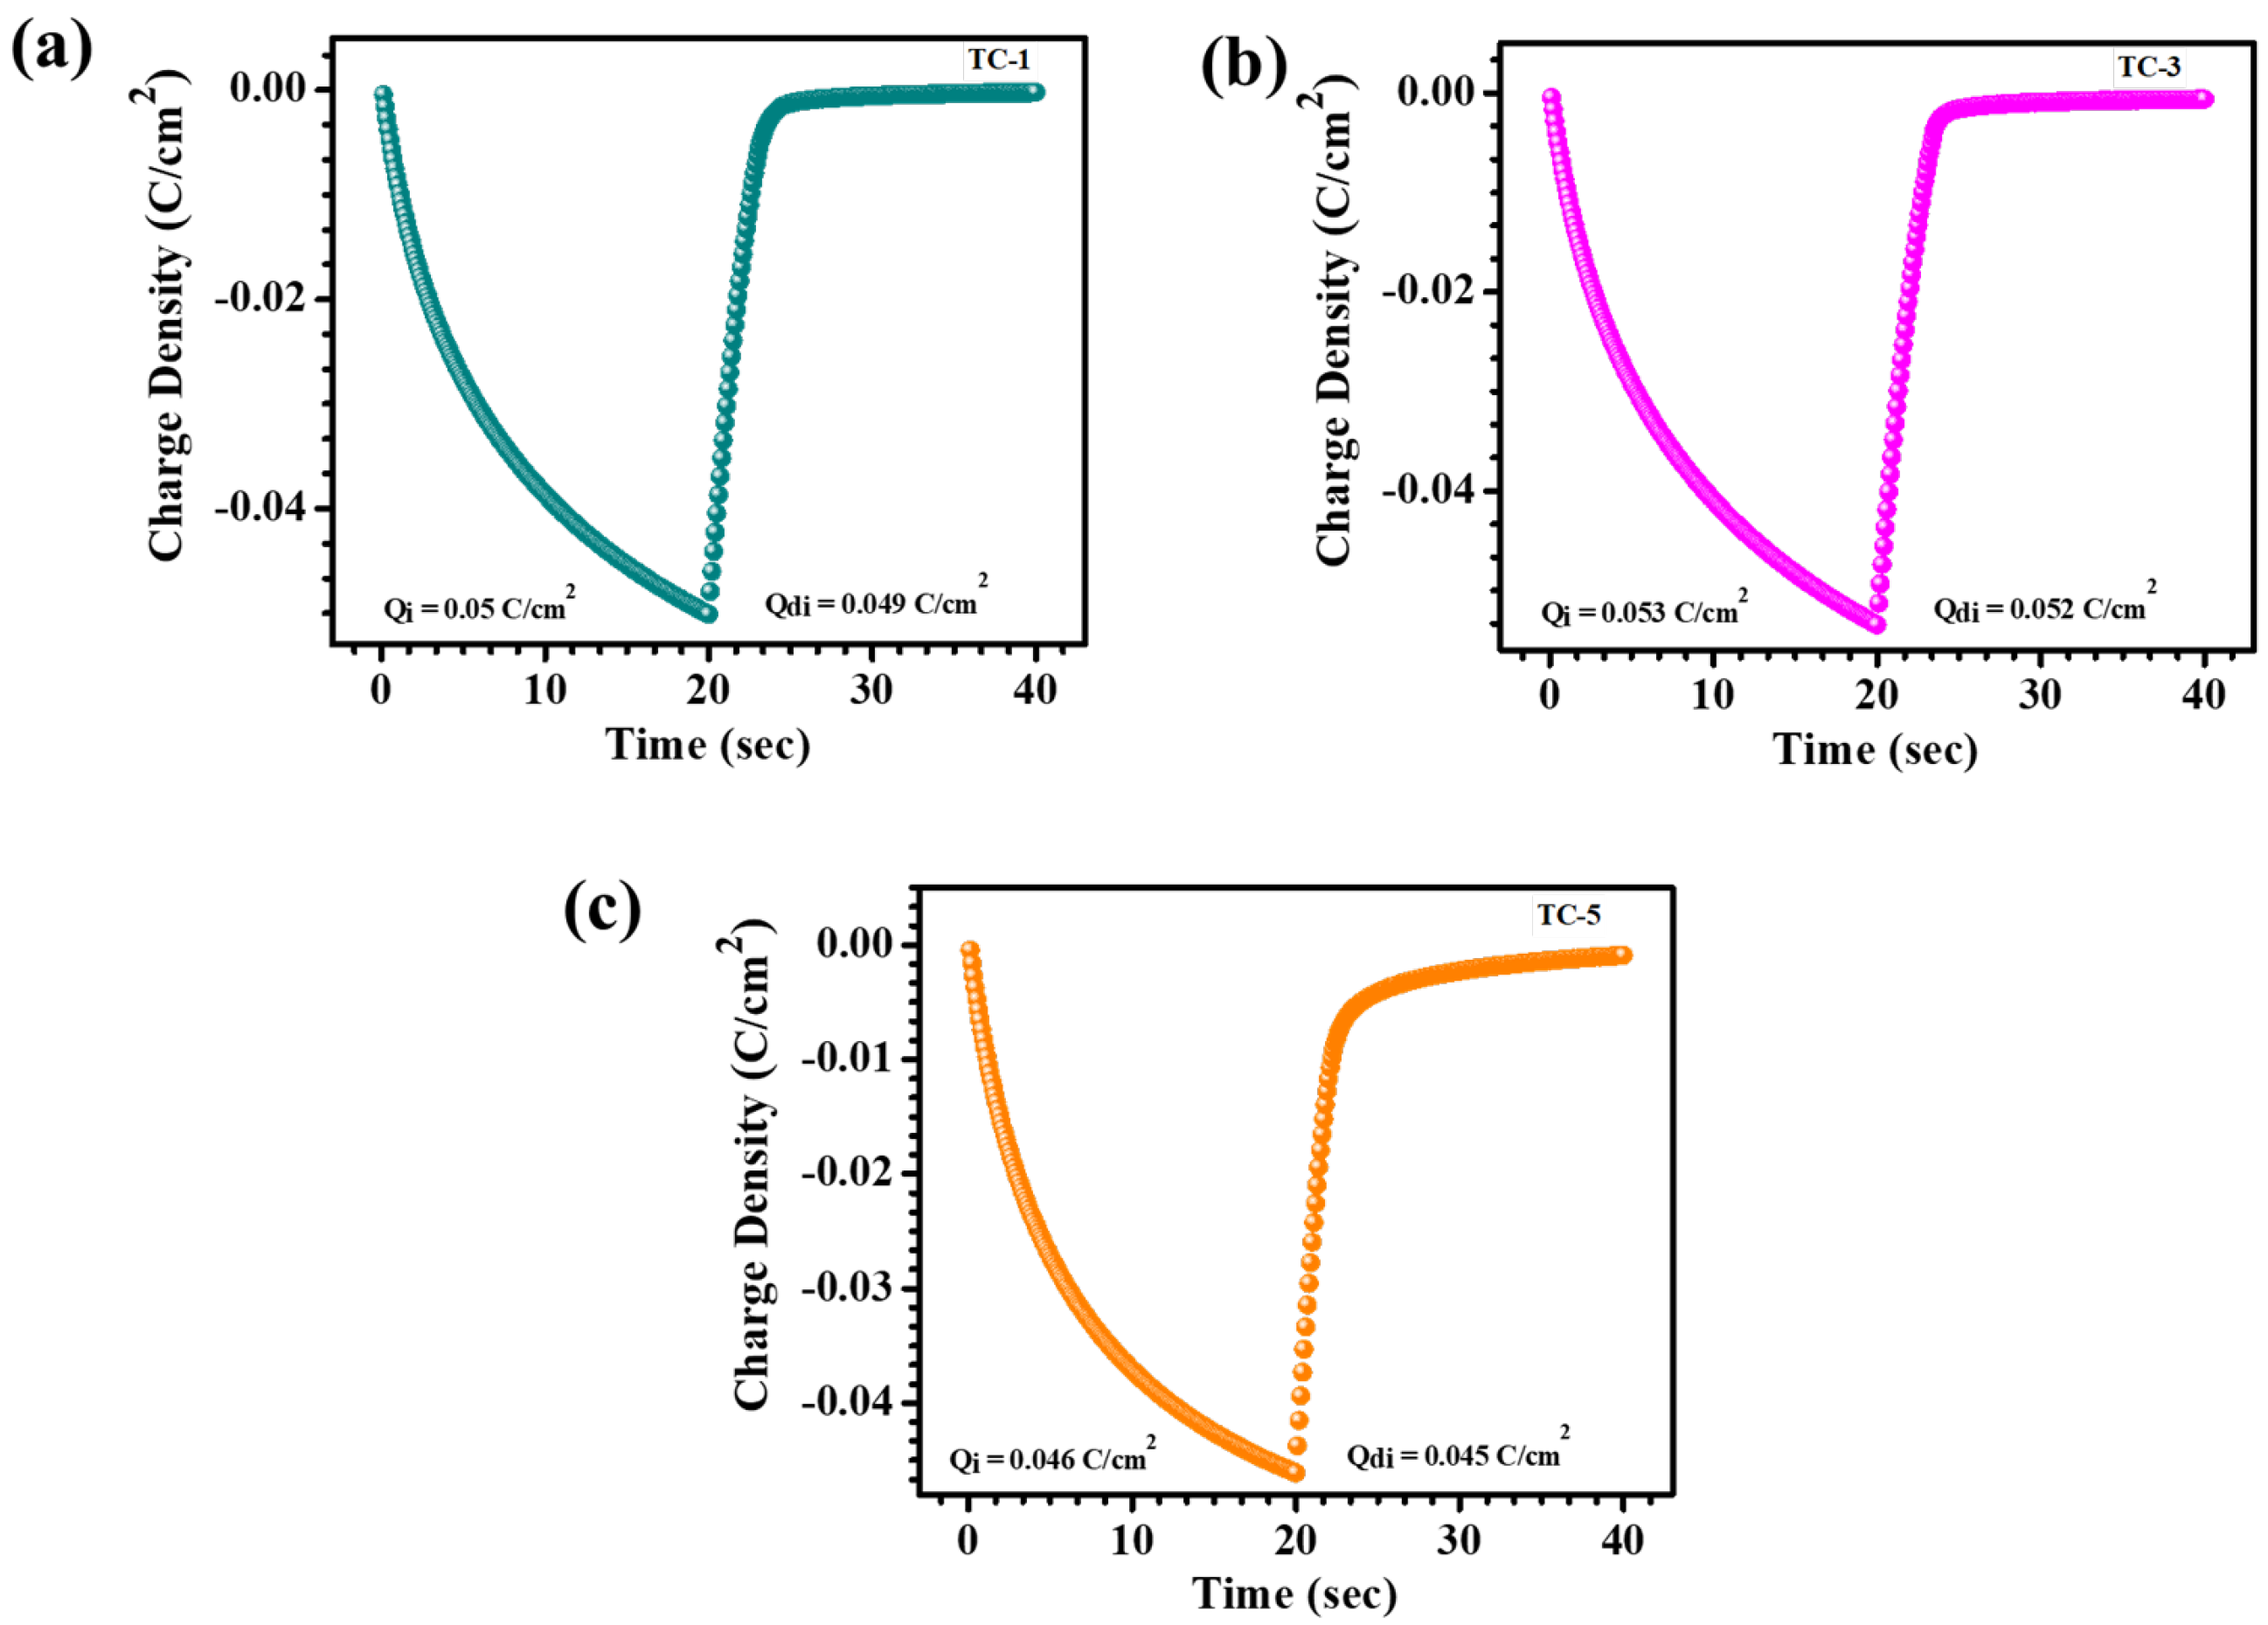
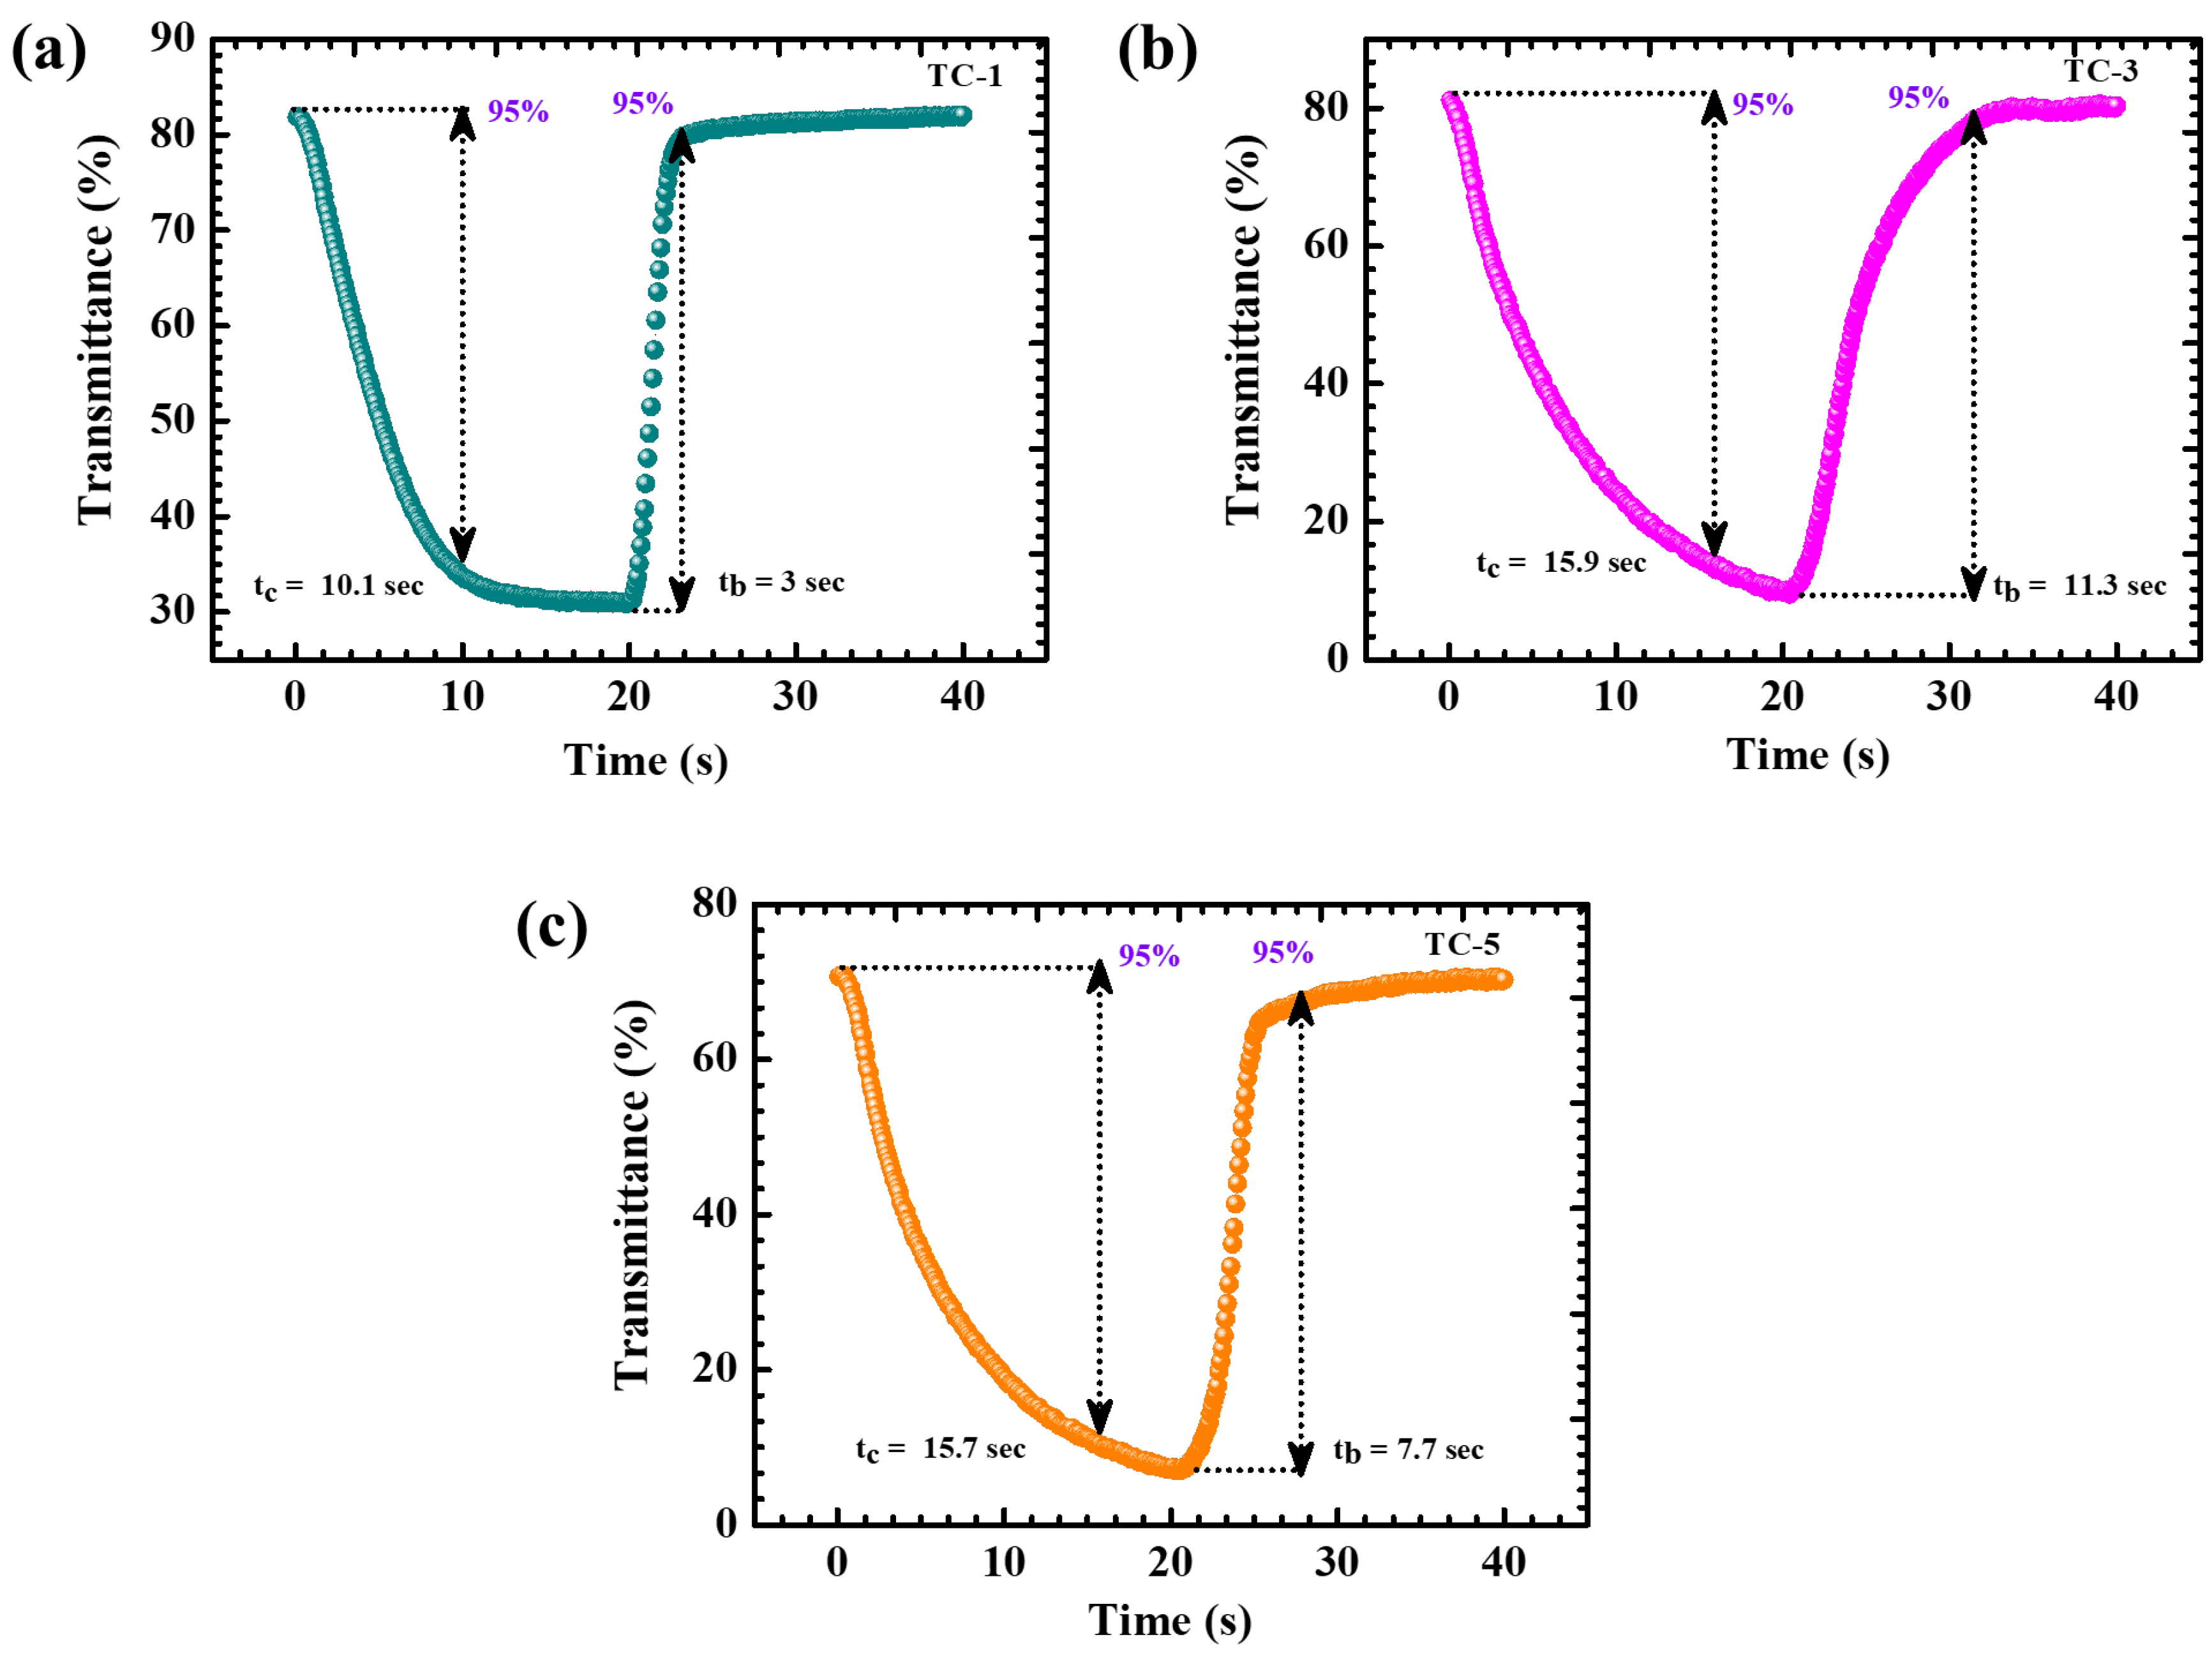
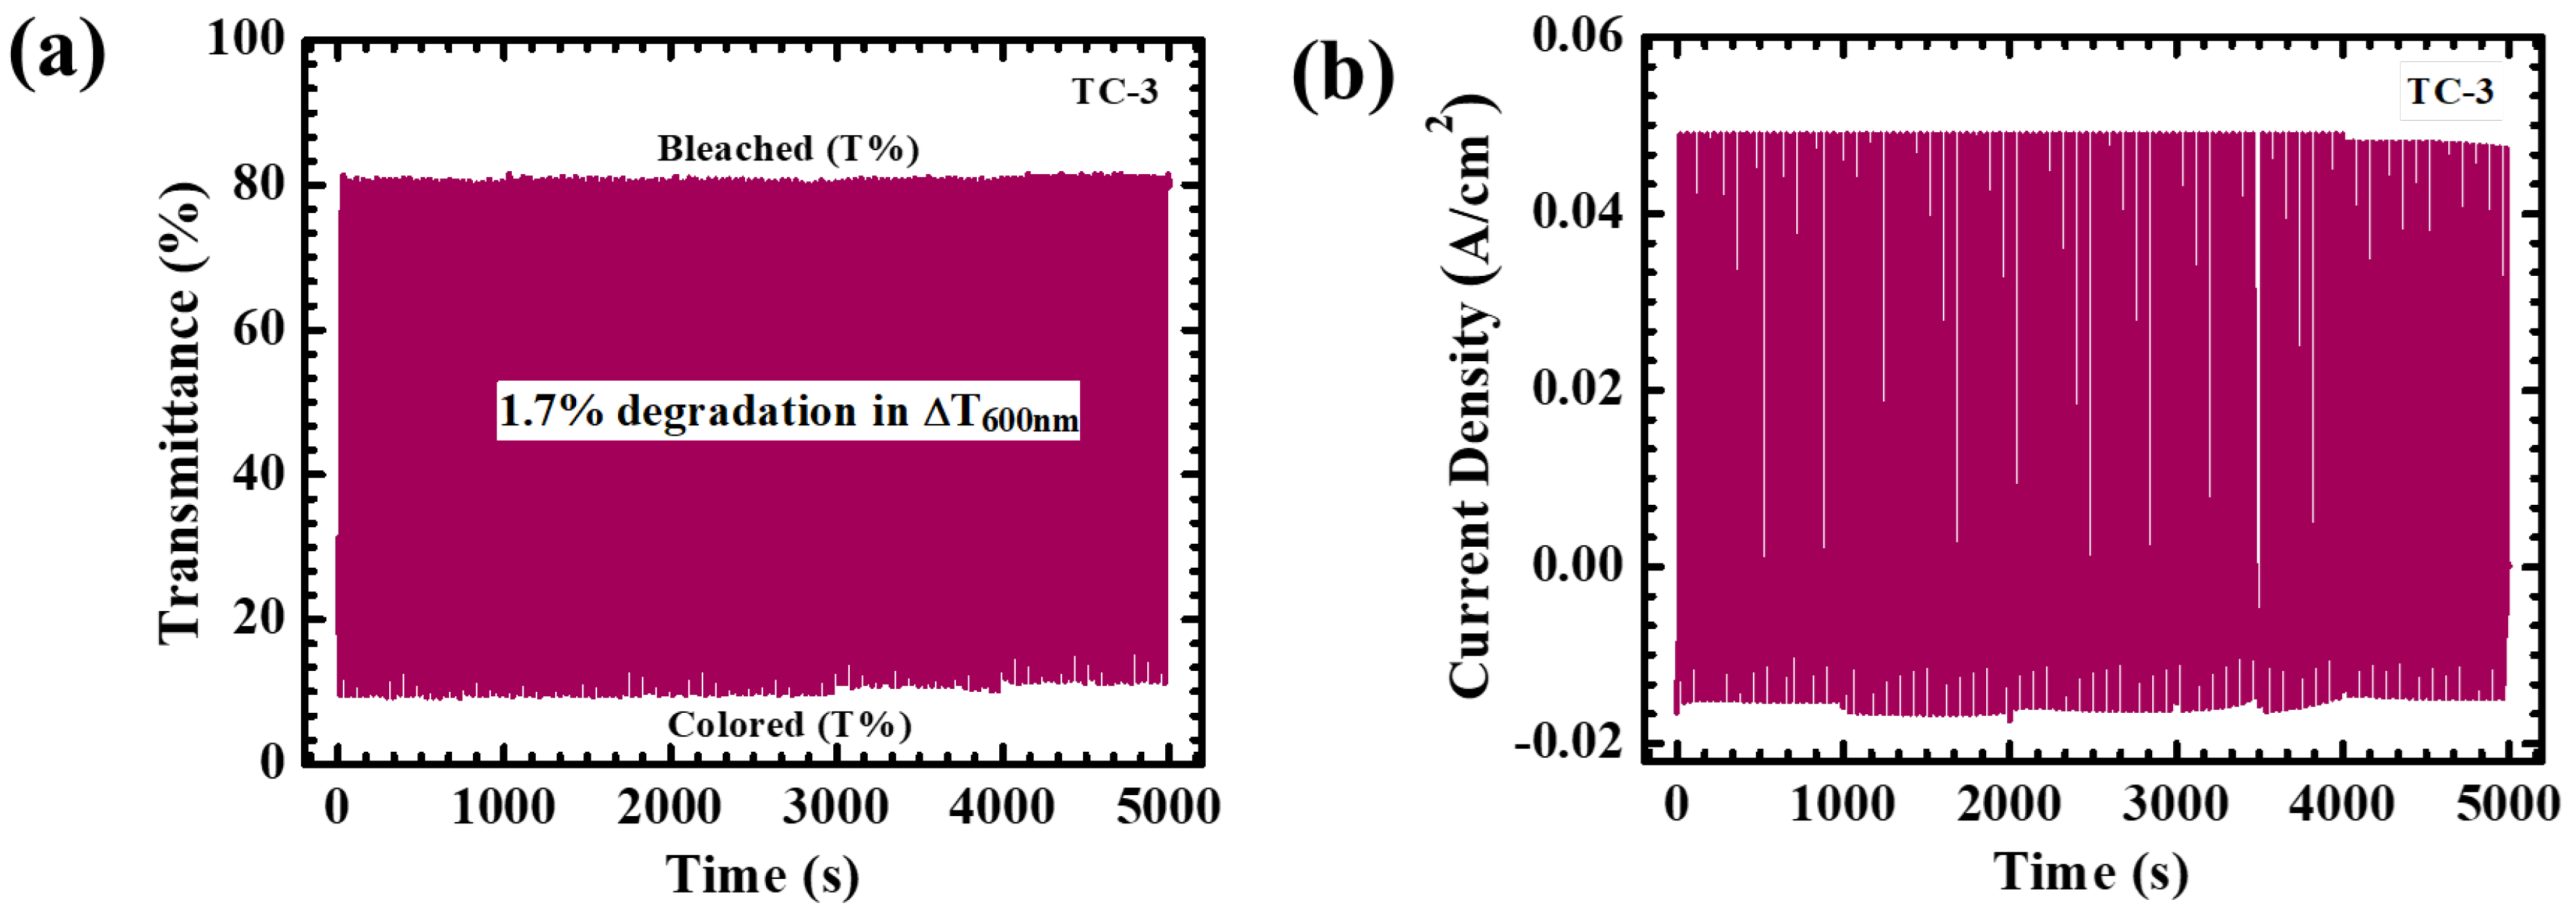
4.5. Electrochromic Analysis

The confirmation of the electrochemical process occurring at the electrode–electrolyte interface was achieved through a cyclic voltammetry (CV) study, emphasizing the critical role of electrolyte ion diffusion in such systems. A comprehensive analysis of the CV profiles of Ti-Co thin film electrodes was conducted using a three-electrode electrochemical setup. As illustrated in Figure 6a, the experimental data were carefully recorded with a 1 M LiClO4 + PC aqueous electrolyte at a scan rate of 20 mV/s, with an operating potential range of +0.5 to −2 V, in comparison to an Ag/AgCl electrode. The electrochemical characteristics of the Ti-Co thin film electrodes were additionally assessed across scan rates ranging from 20 to 100 mV/s. This assessment aimed to determine their pertinent electrochemical attributes. In particular, Figure 6b depicts the behavior of TC-3, whereas Figure S2a,b show the analogous behavior of TC-1 and TC-5, and (c) shows the cyclic voltammetry of the bare TiO2 electrode [8,16]. The CV profiles demonstrate a nearly uniform characteristic, featuring well-defined and broad redox peaks, which suggest significant electrochemical activity and reversibility. There is a noticeable linear relationship observed between the area enclosed within the CV and the sweep rate. This correlation is attributed to the higher potential scan rates, which shorten the diffusion path at the electrode surface, consequently increasing the current density. The examination of the symmetrical redox peaks suggests a notable degree of electrochemical reversibility exhibited by the TC-1, TC-3, and TC-5 electrodes. Additionally, the widening of the hysteresis loop region with an increasing current density for applied scan rates indicates an elevated level of electrochemical activity. This phenomenon signifies a heightened occurrence of Li+ ion insertion and extraction processes within the electrodes. The observed effects could be explained by the decrease in the thickness of the diffusion layer at the electrode surface as the scan rates rise. This reduction in thickness allows for quicker ion transport to and from the electrode, resulting in higher current densities. The peak currents recorded for TC-3 were observed to be higher compared to those of TC-1, TC-3, and the bare TiO2 electrode [8,16].
These findings suggest that the TC-3 electrode displays heightened electrochemical activity, indirectly indicating improved EC characteristics. Conversely, TC-1, TC-3, and the bare TiO2 electrodes exhibited reduced current densities, potentially due to the limited availability of electroactive sites for Li+ ion diffusion. The restricted electrochemical performance of TC-1 and TC-5 electrodes may be attributed to their dense and compact nanostructured morphology. In contrast, TC-3 exhibited a progressive rise in nanosphere coverage and size, accompanied by a shift towards a more even distribution on nanorods. This change can be attributed to improved processing conditions, resulting in increased uniformity. This surface morphology allows for the enhanced penetration of Li+ ions, thereby improving electrochemical performance compared to TC-1 and TC-5. Conversely, the observed decrease in current in TC-1 and TC-5 electrodes could be attributed to hindered charge carrier mobility and reduced surface chemical reactivity resulting from their surface structure. These findings underscore the significance of surface morphology in the electrochemical process, emphasizing the importance of morphological differences in electrode materials. Furthermore, the phenomena of coloring and bleaching can be elucidated by analyzing the variations in electrode colors observed during CV measurements. The application of a negative potential induced reduction processes, involving the injection of Li+/e ions into the Ti-Co lattice, resulting in the formation of complexes exhibiting a dark blue color in the films. Conversely, the application of a positive voltage triggered oxidation processes, leading to the extraction of Li+/e ions and subsequent bleaching of the films [24].
An exploration of the kinetics of Li+ ion insertion/extraction within Ti-Co thin films was conducted through an analysis of CV data, with a focus on the relationship between peak current and scan rate. Figure 6c illustrates a linear correlation between the redox peak current and the square root of the scan rates, ranging from 20 to 100 mV/s for Ti-Co thin films. This observed linear increase in cathodic/anodic peak currents as scan rates rise is attributed to a surface redox reaction. Subsequently, the diffusion coefficient for Li+ ions was determined using the Randles–Sevcik Formula (1) at a scan rate of 20 mV/s [31].
D 1 2 = i p 2.69 × 10 5 × n 3 / 2 × A × C × ϑ 1 / 2    
In the equation provided, ip represents the peak current, n denotes the assumed number of electrons participating in the redox reaction, A signifies the area of the working electrode (in cm2), C stands for the concentration of the electrolyte, ϑ represents the scan rate, and D represents the diffusion coefficient (measured in cm2/s). The resulting cathodic and anodic diffusion coefficient values for N-W electrodes are outlined in Table 1. Notably, it highlights a significantly higher diffusion coefficient for WNi-3% (cathodic 1.86 × 10⁻⁹ cm2/s and anodic 0.7 × 10⁻⁹ cm2/s) compared to the other reference electrodes. These findings offer additional evidence that the electrochromic performance of WO3 can be enhanced through the incorporation of an optimal quantity (3%) of Ni.
The equation provided encompasses several parameters: ip, representing the peak current; n, indicating the assumed number of electrons engaged in the redox reaction; A, denoting the area of the working electrode (in cm2); C, signifying the concentration of the electrolyte; ϑ, representing the scan rate; and D, representing the diffusion coefficient (measured in cm2/s). Table 1 details the resulting cathodic and anodic diffusion coefficient values for Ti-Co electrodes. Of particular interest is the significantly higher diffusion coefficient observed for TC-3 (cathodic 3.4 × 10⁻¹⁰ cm2/s and anodic 0.06 × 10⁻¹⁰ cm2/s) compared to the other reference electrodes. These findings offer additional evidence supporting the notion that the electrochromic performance of TiO2 electrodes can be enhanced through the incorporation of an optimal quantity (0.3%) of Co [42].
The Ti-Co thin films underwent the quantification of Li+ ion intercalation and deintercalation using chronocoulometry (CC) under voltage sweeps ranging from +0.5 to −2 V vs. Ag/AgCl in a 1 M LiClO4 + PC electrolyte, with each step lasting 40 s. Figure 7a–c display charge versus time transient graphs for TC-1, TC-3, and TC-5 samples. During cathodic polarization, the film shifts from transparent to colored as charges diffuse into it. Conversely, anodic polarization reverses this process, returning the films to their bleached state by removing the intercalated charges. Electrochemical reversibility is a crucial metric for evaluating the effective electrochromic performance of materials. Therefore, the electrochromic reversibility of the Ti-Co thin films was assessed based on the intercalation charge (Qi) and deintercalation charge (Qdi), as detailed by the following Equation (2) [16,42].
R e v e r s i b i l i t y = Q d i Q i
Table 2 showcases the estimated percentages of electrochromic reversibility for Ti-Co thin films. TC-3 exhibits the highest reversibility due to its Qi and Qdi values surpassing those of TC-1 and TC-5 samples. The TC-3 sample’s homogeneous surface morphology, along with an increased surface area, facilitates ion transmission and enhances ion percolation into the film.
Exploring the impact of doping on Ti-Co thin film electrochromic performance, we utilized in situ transmittance spectra in both colored and bleached states. Our investigation encompassed various Co doping levels (TC-1, TC-3, and TC-5) within TiO2 thin films, enabling a thorough comparative analysis. Figure 8a–c display the in situ transmittance spectra of the electrodes, covering wavelengths from 300 to 1100 nm, under a potential bias of +0.5 to −2 V. Additionally, a succinct summary of the corresponding transmittance results is provided in Table 2 for quick reference [24].
When the thin films are in their bleached state, they possess a significant degree of transparency. However, upon the application of −2 V, they undergo a transition into a colored state. This change is facilitated by polaron absorption, which serves as the fundamental mechanism underlying the observable coloration in the visible optical spectrum of the thin films. According to Table 2, TC-3 exhibits an exceptionally high optical modulation (ΔT) of 73.6% at a wavelength of 600 nm. In the bleached state, it achieves a transmittance of 83.1% (Tb%), while in the colored state, it records 9.5% transmittance (Tc%). This value surpasses the optical modulations observed for TC-1 (ΔT = 62.7%) and TC-5 (ΔT = 51.8%). Figure 8d showcases digital photographs of a 4 × 3 cm2 EC device featuring the TC-3 sample in both its colored and bleached states, effectively demonstrating the film’s ability to undergo color changes. The TC-3 material has a uniform arrangement of nanospheres on nanorods, which provides many active sites that promote the diffusion of Li+ ions. The heightened interaction between the electrode and electrolyte enhances both the coloring and bleaching processes. The homogeneous nanogranules on nanorods are particularly remarkable due to their beneficial characteristics, such as a short ion diffusion length, which greatly contribute to a high ΔT. On the other hand, TC-1 and TC-5 thin films, which have surface aggregation, can hinder the process of Li+ ion intercalation and deintercalation, resulting in a decrease in ΔT [16].
An essential parameter for evaluating electrochromic performance is coloration efficiency (CE), which quantifies the alteration in optical density (ΔOD) per charge unit introduced into or extracted from the electrochromic film at a specific wavelength. Mathematically, CE is calculated using the following Equation (3) [31],
C E = Δ O D   Q i A
The CC plot facilitates the calculation of the Q i A   parameter, representing the charge delivered per unit area of the electrode. This function, dependent on charge, correlates with the quantity of charge within the sample, affecting the resultant optical density, as described by the provided Equation (4) [31],
Δ O D = l n   T b T c
Tb and Tc denote the transmissions of the bleached and colored states at the wavelength of the visible region (nm), respectively. The ΔOD and CE values for Ti-Co thin films were determined using the aforementioned formula and are outlined in Table 2. Among all Ti-Co thin films, the TC-3 sample exhibited the highest coloring efficiency, with a value of 81.50 cm2/C at 600 nm. The remarkable optical modulation and high CE value are likely due to the uniform distribution of nanospheres on nanorods, which offer a vast surface area for charge diffusion processes. A higher CE indicates that a smaller amount of charge is required to produce a significant change in transmittance. Conversely, the lower CE observed for the other Ti-Co samples (TC-1 and TC-5) can be explained by the increased charge insertion required for the coloration process, leading to minimal variations in ΔOD [8,16].
As a promising electrochromic material, it offers a straightforward color-switching mechanism with minimal time consumption. Figure 9a–c present the results of in situ transmittance response time measurements for Ti-Co thin films. The duration of coloring time (Tc) and bleaching time (Tb) significantly influences the operational efficiency of the electrochromic device. The in situ transmittance characteristic cycles were measured for 40 s at a step potential of +0.5 to −2 V vs. Ag/AgCl. In this study, reaction time refers to the duration required for an electrochromic device to achieve 95% of its transmittance modulation change. Table 2 presents the estimated response times for coloring and bleaching of the films. These switching durations are influenced by the rate of Li+ diffusion and the generation of electrons due to the applied voltage. Interestingly, the observed switching speeds for coloring and bleaching in the TC-3 sample seem to deviate somewhat from the expected trends. Although the switching times (Tc and Tb) are rapid, they remain within a comparable range to those of the TC-1 and TC-5 samples. Notably, bleaching consistently occurs faster than coloring due to the increased conductivity of Lix TiO2 during the bleaching process. However, the insertion of Li+ at the Ti-Co electrolyte interface remains crucial for effective coloring [10,31].
The EC transmittance stability denotes the capacity of an EC material to uphold its optical transmission characteristics over an extended duration without significant deterioration. Hence, the cycling stability of TC-1 and TC-5 EC films was evaluated over 1000 cycles, while TC-3 was tested over 5000 cycles, with continuous switching between bleached (+0.5 V) and colored (−2 V) states. In situ transmittance cycles (at 600 nm) integrated with current density (CA) cycling stability for the TC-3 sample were conducted using a UV–Vis spectrometer coupled with an EC cyclic tester in a standard three-electrode system. Figure S3a,b and Figure 10a illustrate the time–transmittance, and Figure 10b shows the time–current (for TC-3 sample), tests of Ti-Co samples over the extended duration. Following the 1000 and 3000 s period, the ΔT degradation of TC-1, TC-3, and TC-5 films was measured at 12.7%, 1.7%, and 53.4%, respectively. Notably, the TC-3 film exhibited only a 1.7% decrease in ΔT after continuous redox switching, indicating its high long-term stability and the preservation of its original optical contrast with slight degradation over time. Consequently, the 0.3% Co doping enhances the EC’s performance along with the long-term stability of TiO2. Conversely, the remaining electrodes displayed significant attenuation in optical modulation after several cycles, indicating unstable cycling performance for electrochromism. The instability of TC-1 and TC-5 thin films can primarily be attributed to the obstruction of ion migration and the destruction of ion diffusion channels caused by unfavorable surface structures [16,42,43].
Our research delved into the impact of different Co-doping concentrations on the structural, morphological, and electrochromic properties of Ti-Co electrodes. Notably, we found that the electrode doped with 0.3% Co exhibited superior electrochromic activity and stability compared to those doped with 0.1% and 0.5% Co. This novel discovery sheds light on the optimal doping concentration for enhancing the performance of TiO2-based electrodes. While previous studies have explored the electrochromic properties of pristine and doped/composite TiO2 thin films using various synthesis methods, there has been limited progress made in electrochromic technology. In our overview, we present data compiled from different sources focused on TiO2 electrochromic applications, highlighting the diversity in synthesis methods and resulting surface morphologies. Among these, the TC-3 electrode demonstrated remarkable electrochromic characteristics. The hydrothermal technique we employed offers a simple and cost-effective approach, providing better control and facile synthesis of Ti-Co and enabling a clearer understanding of the effect of doping concentration. The significance of our work extends beyond practical applications, offering insights into fundamental studies and paving the way for the development of more efficient and sustainable energy-efficient technologies.

5. Conclusions

In conclusion, this study elucidated the profound impact of cobalt doping on the physical–chemical characteristics of TiO2 thin films, with implications for EC applications. Through a systematic investigation, Ti-Co thin films were successfully synthesized using a simple hydrothermal technique, resulting in the crystalline rutile structure of TiO2. The introduction of cobalt into the TiO2 lattice facilitated the formation of nanorods with the coverage of different arrangements of nanospheres, according to the different doping percentage. TC-3 exhibited definite and well-grown nanosphere-covered nanorods that showed exceptional EC performance. TC-3 was characterized by dark coloration during the electrochemical reduction, which resulted in an improved optical modulation of 73.6%, comprising 9.5% and 83.1% colored state and bleached state transmittance, respectively. Also, the elevated coloration efficiency and desired long-term stability of TC-3 revealed the influence of the optimized percentage of cobalt doping. The ideal cobalt amount resulted in a smooth surface which helps in easy ion intercalation/deintercalation and reduces the ion trapping states. Real-world performance testing was established through the EC device of the TC-3 sample that exhibited convincing color changing capabilities. The overall enhanced EC activity is attributed to the interfacial atomic and electronic modulation from cobalt doping, which also significantly promoted the definite surface structure. This study demonstrated a new understanding for the mechanism of a doped cathodic EC material with improved EC performance applications.

Supplementary Materials

The following supporting information can be downloaded at: https://www.mdpi.com/article/10.3390/coatings14060707/s1, Figure S1: (a) The FE-SEM image of the pristine TiO2 thin film at different magnifications, (b) EDS spectra, and (c) mapping analysis of the pristine TiO2 thin film. Figure S2: Cyclic voltammetry of (a) TiO2, (b) TC-1, and (c) TC-5 samples at different scan rates (20–100 mV/s). Figure S3: Plot of the long-term in situ stability as a function of time of (a) TC-1 and (b) TC-5 thin films measured for 1000 s.

Author Contributions

P.J.M.: writing—original draft, methodology, investigation; R.U.A.: review and editing, software; A.M.T.: review and editing, software; S.A.B.: review and editing, formal analysis; C.-W.J.: supervision, writing—review and editing, project administration, funding acquisition. All authors have read and agreed to the published version of the manuscript.

Funding

This work was supported by the Korea Institute of Energy Technology Evaluation and Planning (KETEP) grant funded by the Korea Government (MOTIE) (No. 20204010600100, Hydrogen Education and Research Consortium).

Institutional Review Board Statement

Not applicable.

Informed Consent Statement

Not applicable.

Data Availability Statement

Data are contained within the article.

Conflicts of Interest

The authors declare no conflicts of interest.

References

  1. Ibrahim, N.S.; Leaw, W.L.; Mohamad, D.; Alias, S.H.; Nur, H. A Critical Review of Metal-Doped TiO2 and Its Structure–Physical Properties–Photocatalytic Activity Relationship in Hydrogen Production. Int. J. Hydrogen Energy 2020, 45, 28553–28565. [Google Scholar] [CrossRef]
  2. Review, S.T.P.A.; Janus, M.; Szyma, K. C-,N- and S-Doped TiO2 Photocatalysts: A Review. Catalysts 2021, 11, 144. [Google Scholar] [CrossRef]
  3. Roose, B.; Pathak, S.; Steiner, U. Doping of TiO2 for Sensitized Solar Cells. Chem. Soc. Rev. 2015, 44, 8326–8349. [Google Scholar] [CrossRef]
  4. Zavatski, S.; Neilande, E.; Bandarenka, H.; Popov, A.; Piskunov, S.; Bocharov, D. Density Functional Theory for Doped TiO2: Current Research Strategies and Advancements. Nanotechnology 2024, 35, 192001. [Google Scholar] [CrossRef]
  5. Hsu, C.Y.; Mahmoud, Z.H.; Abdullaev, S.; Ali, F.K.; Ali Naeem, Y.; Mzahim Mizher, R.; Morad Karim, M.; Abdulwahid, A.S.; Ahmadi, Z.; Habibzadeh, S.; et al. Nano Titanium Oxide (Nano-TiO2): A Review of Synthesis Methods, Properties, and Applications. Case Stud. Chem. Environ. Eng. 2024, 9, 100626. [Google Scholar] [CrossRef]
  6. Zhao, J.; Wang, H.; Cai, Y.; Zhao, J.; Gao, Z.; Song, Y.Y. The Challenges and Opportunities for TiO2 Nanostructures in Gas Sensing. ACS Sens. 2024, 9, 1644–1655. [Google Scholar] [CrossRef]
  7. Mahmoud, Z.H.; Ajaj, Y.; Kamil Ghadir, G.; Musaad Al-Tmimi, H.; Hameed Jasim, H.; Al-Salih, M.; Hasen shuhata Alubiady, M.; Muzahem Al-Ani, A.; Salih Jumaa, S.; Azat, S.; et al. Carbon-Doped Titanium Dioxide (TiO2) as Li-Ion Battery Electrode: Synthesis, Characterization, and Performance. Results Chem. 2024, 7, 101422. [Google Scholar] [CrossRef]
  8. Sun, X.; Wang, D.; Wu, W.; Zhao, X.; Zhang, X.; Wang, B.; Rong, X.; Wu, G.; Wang, X. Amorphous and Crystalline Ti-Doped WO3·2H2O for Dual-Band Electrochromic Smart Windows. ACS Sustain. Chem. Eng. 2024, 12, 5459–5467. [Google Scholar] [CrossRef]
  9. Yin, Y.; Zhu, Y.; Liao, P.; Yuan, X.; Jia, J.; Lan, C.; Li, C. Co-Sputtering Construction of Gd-Doped WO3 Nano-Stalagmites Film for Bi-Funcional Electrochromic and Energy Storage Applications. Chem. Eng. J. 2024, 487, 150615. [Google Scholar] [CrossRef]
  10. Jia, J.; Chen, Y.; Zhang, W.; Wang, Z.; Wang, F.; Zhang, L.; Ma, H. Experimental Study and Simulation of Electrochromic Properties of TiO2-Doped NiO Films. Ceram. Int. 2024, 50, 15065–15075. [Google Scholar] [CrossRef]
  11. Tong, Z.; Zhu, X.; Xu, H.; Li, Z.; Li, S.; Xi, F.; Kang, T.; Ma, W.; Lee, C.S. Multivalent-Ion Electrochromic Energy Saving and Storage Devices. Adv. Funct. Mater. 2024, 2308989. [Google Scholar] [CrossRef]
  12. Ivanova, T.; Harizanova, A.; Koutzarova, T.; Vertruyen, B. Preparation and Investigation of Sol–Gel TiO2-NiO Films: Structural, Optical and Electrochromic Properties. Crystals 2024, 14, 192. [Google Scholar] [CrossRef]
  13. Ma, D.; Yang, T.; Feng, X.; Wang, P.; Huang, J.; Wang, J.; Li, H. Quadruple Control Electrochromic Devices Utilizing Ce4W9O33 Electrodes for Visible and Near-Infrared Transmission Intelligent Modulation. Adv. Sci. 2024, 11, 2307223. [Google Scholar] [CrossRef]
  14. Zhao, L.; Zhu, Y.; Long, X.; Liao, W.; Hu, B.; Miao, R.; Zhang, G.; Sun, G.; Xie, Y.; Miao, L. Manganese Doped Nickel Oxide Thin Film with Improved Electrochromic Performance towards Smart Window Application. Ceram. Int. 2024, 50, 12810–12817. [Google Scholar] [CrossRef]
  15. Mustafa, M.N.; Mohd Abdah, M.A.A.; Mohamad Saidi, N.; Wong, W.P.; Tan, Y.S.; Numan, A.; Sulaiman, Y.; Walvekar, R.; Mohammad Azlan, F.N.; Khalid, M. High-Performance Electrochromic Supercapacitor with Bimetallic Phosphate and Vanadium Carbide MXene. J. Power Sources 2024, 595, 234079. [Google Scholar] [CrossRef]
  16. Amate, R.U.; Morankar, P.J.; Teli, A.M.; Beknalkar, S.A.; Chavan, G.T.; Ahir, N.A.; Dalavi, D.S.; Jeon, C.W. Versatile Electrochromic Energy Storage Smart Window Utilizing Surfactant-Assisted Niobium Oxide Thin Films. Chem. Eng. J. 2024, 484, 149556. [Google Scholar] [CrossRef]
  17. García-Tecedor, M.; Villar-Garcia, I.J.; Gorni, G.; Liras, M.; de la Peña O’Shea, V.A.; Barawi Moran, M. Unveiling the Non-Innocence of Vanadium Dopant in TiO2 Nanocrystals for Advanced Energy Storage and Smart Windows. J. Phys. Energy 2024, 6, 025024. [Google Scholar] [CrossRef]
  18. Öztetïk, B.; Pat, S.; Korkmaz, Ş. Investigation on the Optical and Electrochromic Characteristics of Thin Films of WO3 Doped with Graphene and MXene (Ti2AlC). Ceram. Int. 2024, 50, 13113–13124. [Google Scholar] [CrossRef]
  19. Qin, L.; Liu, Y.; Long, M.; Zou, B.; Cao, S. Advancements in Dual-Band Electrochromic Smart Windows: Exploring Single-Component Materials for Sustainable Building Solutions. Ceram. Int. 2024, 50, 22174–22183. [Google Scholar] [CrossRef]
  20. Li, J.; Yu, H.; Lv, Y.; Cai, Z.; Shen, Y.; Ruhlmann, L.; Gan, L.; Liu, M. Electrode Materials for Electrochromic Supercapacitors. Nanotechnology 2024, 35, 152001. [Google Scholar] [CrossRef]
  21. Li, S.; Zhang, G.; Meng, D.; Yang, F. Photoelectrocatalytic Activation of Sulfate for Sulfamethoxazole Degradation and Simultaneous H2 Production by Bifunctional N,P Co-Doped Black-Blue TiO2 Nanotube Array Electrode. Chem. Eng. J. 2024, 485, 149828. [Google Scholar] [CrossRef]
  22. Huang, L.; He, G.; Yuan, Y.; Zhang, T.C.; Wang, Y.; Yuan, S. Trivalent Metal Ions (Al, Ga, In)-Doped TiO2 for Enhanced Photocatalytic Desulfurization of H2S: Band Structure Regulation, Performance, and Mechanism. Ind. Eng. Chem. Res. 2024, 63, 7154–7165. [Google Scholar] [CrossRef]
  23. Jian, L.; Wu, X.; Li, R.; Zhao, F.; Liu, P.; Wang, F.; Liu, D.; Yao, Q.; Deng, J. Enhanced Aluminum-Ion Storage Properties of N-Doped Titanium Dioxide Electrode in Aqueous Aluminum-Ion Batteries. Nanomaterials 2024, 14, 472. [Google Scholar] [CrossRef]
  24. Morankar, P.J.; Amate, R.U.; Teli, A.M.; Chavan, G.T.; Beknalkar, S.A.; Dalavi, D.S.; Ahir, N.A.; Jeon, C.W. Surfactant Integrated Nanoarchitectonics for Controlled Morphology and Enhanced Functionality of Tungsten Oxide Thin Films in Electrochromic Supercapacitors. J. Energy Storage 2023, 73, 109095. [Google Scholar] [CrossRef]
  25. Zheng, T.; Zhang, H.; Chen, C.; Tu, X.; Fang, L.; Zhang, M.; He, W.; Wang, P. Self-Powered Dual-Band Electrochromic Supercapacitor Devices for Smart Window Based on Ternary Dielectric Triboelectric Nanogenerator. Nanomaterials 2024, 14, 229. [Google Scholar] [CrossRef] [PubMed]
  26. Zhao, J.; Zhang, S.; Chang, S.; Li, C.; Fang, C.; Xia, X.; Shen, L.; Yang Lee, J.; Cao, C.; Zhang, X.; et al. A Flexible Electrochromic Device with Variable Infrared Emissivity Based on W18O49 Nanowire Cathode and MXene Infrared Transparent Conducting Electrode. Chem. Eng. J. 2024, 480, 148010. [Google Scholar] [CrossRef]
  27. Songara, S.; Saini, L.; Gowd, G.S.; Rajpurohit, J.S.; Gupta, V.; Patra, M.K.; Vadera, S.R.; Kumar, N. Improved Photochromic Properties of W6+ Doped Nanostructured TiO2 Coatings. Results Surf. Interfaces 2024, 14, 100201. [Google Scholar] [CrossRef]
  28. Wang, J.; Wang, Z.; Zhang, M.; Huo, X.; Guo, M. A Semi-Solid, Polychromatic Dual-Band Electrochromic Smart Window: Visualizing Sunlight and Solar Heat Transmission. Chem. Eng. J. 2024, 484, 149628. [Google Scholar] [CrossRef]
  29. Qiao, P.; Zhang, Y.; Wang, J.; Peng, Z.; Wu, D.; Chao, X.; Yang, Z.; Liang, P. Enhanced Dielectric Properties and Improved Thermal Stability in TiO2-Based Ceramics by Cu and Nb Co-Doping. Ceram. Int. 2024, 50, 2242–2248. [Google Scholar] [CrossRef]
  30. Wang, B.; Huang, Y.; Zhao, S.; Li, R.; Gao, D.; Jiang, H.; Zhang, R. Novel Self-Assembled Porous Yolk-Shell NiO Nanospheres with Excellent Electrochromic Performance for Smart Windows. Particuology 2024, 84, 72–80. [Google Scholar] [CrossRef]
  31. Morankar, P.J.; Amate, R.U.; Chavan, G.T.; Teli, A.M.; Dalavi, D.S.; Jeon, C.W. Improved Electrochromic Performance of Potentiostatically Electrodeposited Nanogranular WO3 Thin Films. J. Alloys Compd. 2023, 945, 169363. [Google Scholar] [CrossRef]
  32. Cao, S.; Zhang, S.; Zhang, T.; Lee, J.Y. Fluoride-Assisted Synthesis of Plasmonic Colloidal Ta-Doped TiO2 Nanocrystals for Near-Infrared and Visible-Light Selective Electrochromic Modulation. Chem. Mater. 2018, 30, 4838–4846. [Google Scholar] [CrossRef]
  33. Guo, Z.; Wang, S.; Chen, K.; Mao, J.; Diao, X. Investigation on the Properties and Mechanism of W-Doped TiO2 Electrochromic Films Deposited by Cosputtering. ACS Appl. Electron. Mater. 2023, 5, 6778–6786. [Google Scholar] [CrossRef]
  34. Zhang, B.; Xu, G.; Tan, S.; Liu, C.; Zhang, J. Study on Electrochromic Properties of TiO2 Films under Co Ion Content Fluctuations. Opt. Mater. 2020, 100, 109659. [Google Scholar] [CrossRef]
  35. Khot, A.C.; Desai, N.D.; Khot, K.V.; Salunkhe, M.M.; Chougule, M.A.; Bhave, T.M.; Kamat, R.K.; Musselman, K.P.; Dongale, T.D. Bipolar Resistive Switching and Memristive Properties of Hydrothermally Synthesized TiO2 Nanorod Array: Effect of Growth Temperature. Mater. Des. 2018, 151, 37–47. [Google Scholar] [CrossRef]
  36. Chanda, A.; Rout, K.; Vasundhara, M.; Joshi, S.R.; Singh, J. Structural and Magnetic Study of Undoped and Cobalt Doped TiO2 Nanoparticles. RSC Adv. 2018, 8, 10939–10947. [Google Scholar] [CrossRef] [PubMed]
  37. Perevedentseva, E.; Lin, Y.C.; Karmenyan, A.; Wu, K.T.; Lugovtsov, A.; Shirshin, E.; Priezzhev, A.; Cheng, C.L. Raman Spectroscopic Study of TiO2 Nanoparticles’ Effects on the Hemoglobin State in Individual Red Blood Cells. Materials 2021, 14, 5920. [Google Scholar] [CrossRef] [PubMed]
  38. Liu, C.; Zhang, C.; Ji, D.; Yin, G.; Wang, W.; Chen, Z. Cobalt-Doped TiO2 Nanowire Arrays Coated with NiFe Layered-Double-Hydroxide Nanoplatelets as Photoanodes for Photoelectrochemical Water Oxidation. ACS Appl. Nano Mater. 2020, 3, 6598–6608. [Google Scholar] [CrossRef]
  39. Siddiqa, A.; Masih, D.; Anjum, D.; Siddiq, M. Cobalt and Sulfur Co-Doped Nano-Size TiO2 for Photodegradation of Various Dyes and Phenol. J. Environ. Sci. 2015, 37, 100–109. [Google Scholar] [CrossRef]
  40. Amate, R.U.; Morankar, P.J.; Teli, A.M.; Chavan, G.T.; Beknalkar, S.A.; Ahir, N.A.; Jeon, C.W. Exploring the Electrochemical Performance of Niobium Phosphate Electrode for Supercapacitor Application. Surf. Interfaces 2023, 41, 103265. [Google Scholar] [CrossRef]
  41. Xiang, S.; Xu, G.; Liu, C.; Bu, H.; Zhang, Y. Study on the Variable Color and Emissivity Properties of Co Doped TiO2 under Temperature Fluctuations. Opt. Mater. 2018, 85, 254–260. [Google Scholar] [CrossRef]
  42. Amate, R.U.; Morankar, P.J.; Chavan, G.T.; Teli, A.M.; Desai, R.S.; Dalavi, D.S.; Jeon, C.W. Bi-Functional Electrochromic Supercapacitor Based on Hydrothermal-Grown 3D Nb2O5 Nanospheres. Electrochim. Acta 2023, 459, 142522. [Google Scholar] [CrossRef]
  43. Teli, A.M.; Beknalkar, S.A.; Amte, R.U.; Morankar, P.J.; Yewale, M.A.; Burungale, V.V.; Jeon, C.W.; Efstathiadis, H.; Shin, J.C. Investigating into the Intricacies of Charge Storage Kinetics in NbMn-Oxide Composite Electrodes for Asymmetric Supercapacitor and HER Applications. J. Alloys Compd. 2023, 965, 171305. [Google Scholar] [CrossRef]
Figure 1. Detailed depiction of the Ti-Co synthesis process.
Coatings 14 00707 g001
Figure 2. (A) XRD pattern and (B) combined Raman spectra of bare TiO2 and Ti-Co thin films.
Coatings 14 00707 g002
Figure 3. (a) Ti 2p core level spectrum; (b) O 1s spectrum; (c) Co 2p spectrum of TC-3% thin film.
Coatings 14 00707 g003aCoatings 14 00707 g003b
Figure 4. FE-SEM images of (a) TC-1; (b) TC-3; and (c) TC-5 thin films at different magnifications.
Coatings 14 00707 g004
Figure 5. Elemental analysis and mapping of (a1a4) TC-1, (b1b4) TC-3, and (c1c4) TC-5 thin films.
Coatings 14 00707 g005
Figure 6. Cyclic voltammetry of (a) Ti-Co thin films at 20 mV/s, (b) TC-3 sample at different scan rates (20–100 mV/s), and (c) plot of peak current vs. (scan rate)1/2 of all samples for the diffusion coefficient.
Coatings 14 00707 g006
Figure 7. Charge versus time transient graphs for (a) TC-1, (b) TC-3, and (c) TC-5 samples.
Coatings 14 00707 g007
Figure 8. Optical transmittance spectrum of (a) TC-1, (b) TC-3, and (c) TC-5 thin films at the colored and bleached states from 300 to 1100 nm range over potential window +0.5 to −2 V vs. Ag/AgCl and (d) digital photographs of a 4 × 3 cm2 EC device for TC-3 sample in both its colored and bleached states.
Coatings 14 00707 g008
Figure 9. In situ transmittance measurements of (a) TC-1, (b) TC-3, and (c) TC-5 thin films in the colored and bleached state for 40 s.
Coatings 14 00707 g009
Figure 10. Plot of the long-term (a) in situ optical and (b) chronoamperometry response as a function of time of TC-3 thin films measured for 5000 s.
Coatings 14 00707 g010
Table 1. Calculated diffusion coefficient of Ti-Co thin films.
Sample CodeDiffusion Coefficient (cm2/s × 10−10)
ReductionOxidation
TC-12.70.03
TC-33.40.06
TC-52.30.02
Table 2. Evaluation of electrochromic measurements of TC-1, TC-3, and TC-5 thin films.
Sample
Name
Charge
Intercalation
( Q i ) (C/cm2)
Charge Deintercalation
( Q d i ) (C/cm2)
Reversibility (%)Coloration Time
(s) (TC)
Bleaching Time
(s) (Tb)
Tb %TC %Optical Modulation
(ΔT600nm%)
Optical Density
(ΔOD)
Coloration Efficiency
(cm2/C)
TC-10.0500.04998%10.1373.210.562.71.9477.6
TC-30.0530.052~99%15.911.383.19.573.62.1681.50
TC-50.0460.04597.82%15.77.782.530.751.80.9842.60
Disclaimer/Publisher’s Note: The statements, opinions and data contained in all publications are solely those of the individual author(s) and contributor(s) and not of MDPI and/or the editor(s). MDPI and/or the editor(s) disclaim responsibility for any injury to people or property resulting from any ideas, methods, instructions or products referred to in the content.

