3.1. Coating Morphology, Thickness, and Roughness
Figure 1a presents the graphite coatings obtained at various combinations of graphite concentrations and spray coating flow rates. Visual inspection discerned notable disparities in graphite morphology across the sample groups. The appearance of graphite flakes in the deposited coatings varied throughout the design of experiment range. Coatings produced at low flow rates exhibit porous aggregates of graphite particles arranged hierarchically, while those at medium and high flow rates display flatter topographies. Arrows in
Figure 1a indicate areas of uneven coating coverage at a 5% concentration and high flow rate. This likely stemmed from high spray flow rate coupled with the low graphite concentration in the dispersion which corresponded to a dispersion with a high aqueous to solid ratio. In this scenario, the dispensing nozzle causes the graphite dispersion to form large droplets which pool on the surface. Consequently, during the drying process, liquid is drawn away from the droplet edges resulting in uncoated gaps in the coated surface, indicated by arrows on the figure. Conversely, when the 5% concentration dispersion was sprayed using the low flow rate, the gradual release during each spray facilitated the evaporation of some water from the atomized droplets. Consequently, mostly graphite flakes reached the surface in small aggregates, with the graphite flakes orienting themselves randomly within the aggregates, resulting in bulbous arrangements on the surface. The increase in concentration amounted to larger aggregates in the atomized droplets, thereby forming larger structures on the surface.
Figure 1b,c illustrate the averaged roughness and thickness of graphite coatings, respectively, sprayed at different flow rates and concentrations with 10 mL graphite dispersion. Notably, in the low-flow-rate group, roughness increases with concentration, ranging widely from 8 to 37 µm. On the other hand, in the medium- and high-flow-rate groups, roughness is similar, typically below 4 µm, as evidenced by the flatter nature of the coatings in
Figure 1a. Medium and high flow rates facilitated greater deposition of the graphite dispersion during each application, resulting in a wetter substrate surface. In this liquid state, prior to drying, flakes align parallel to the substrate under surface tension, forming uniform films that transition into flat coatings upon drying.
At medium and high flow rates, the uneven coverage observed at 5% concentration is different from the uniform coatings observed at higher concentrations, attributable to increased solids concentration. Spray coating, being a rapid deposition method, readily allows for thickness augmentation. As depicted in
Figure 1c, thickness increases with rising graphite concentration. The higher solids content at elevated concentrations leaves a greater graphite portion on the surface post-drying compared with lower concentrations, thereby augmenting coating thickness. Due to the random orientation of graphite in low-flow-rate coatings, thicknesses tend to be higher than the medium- and high-flow-rate coatings because of increased porosity.
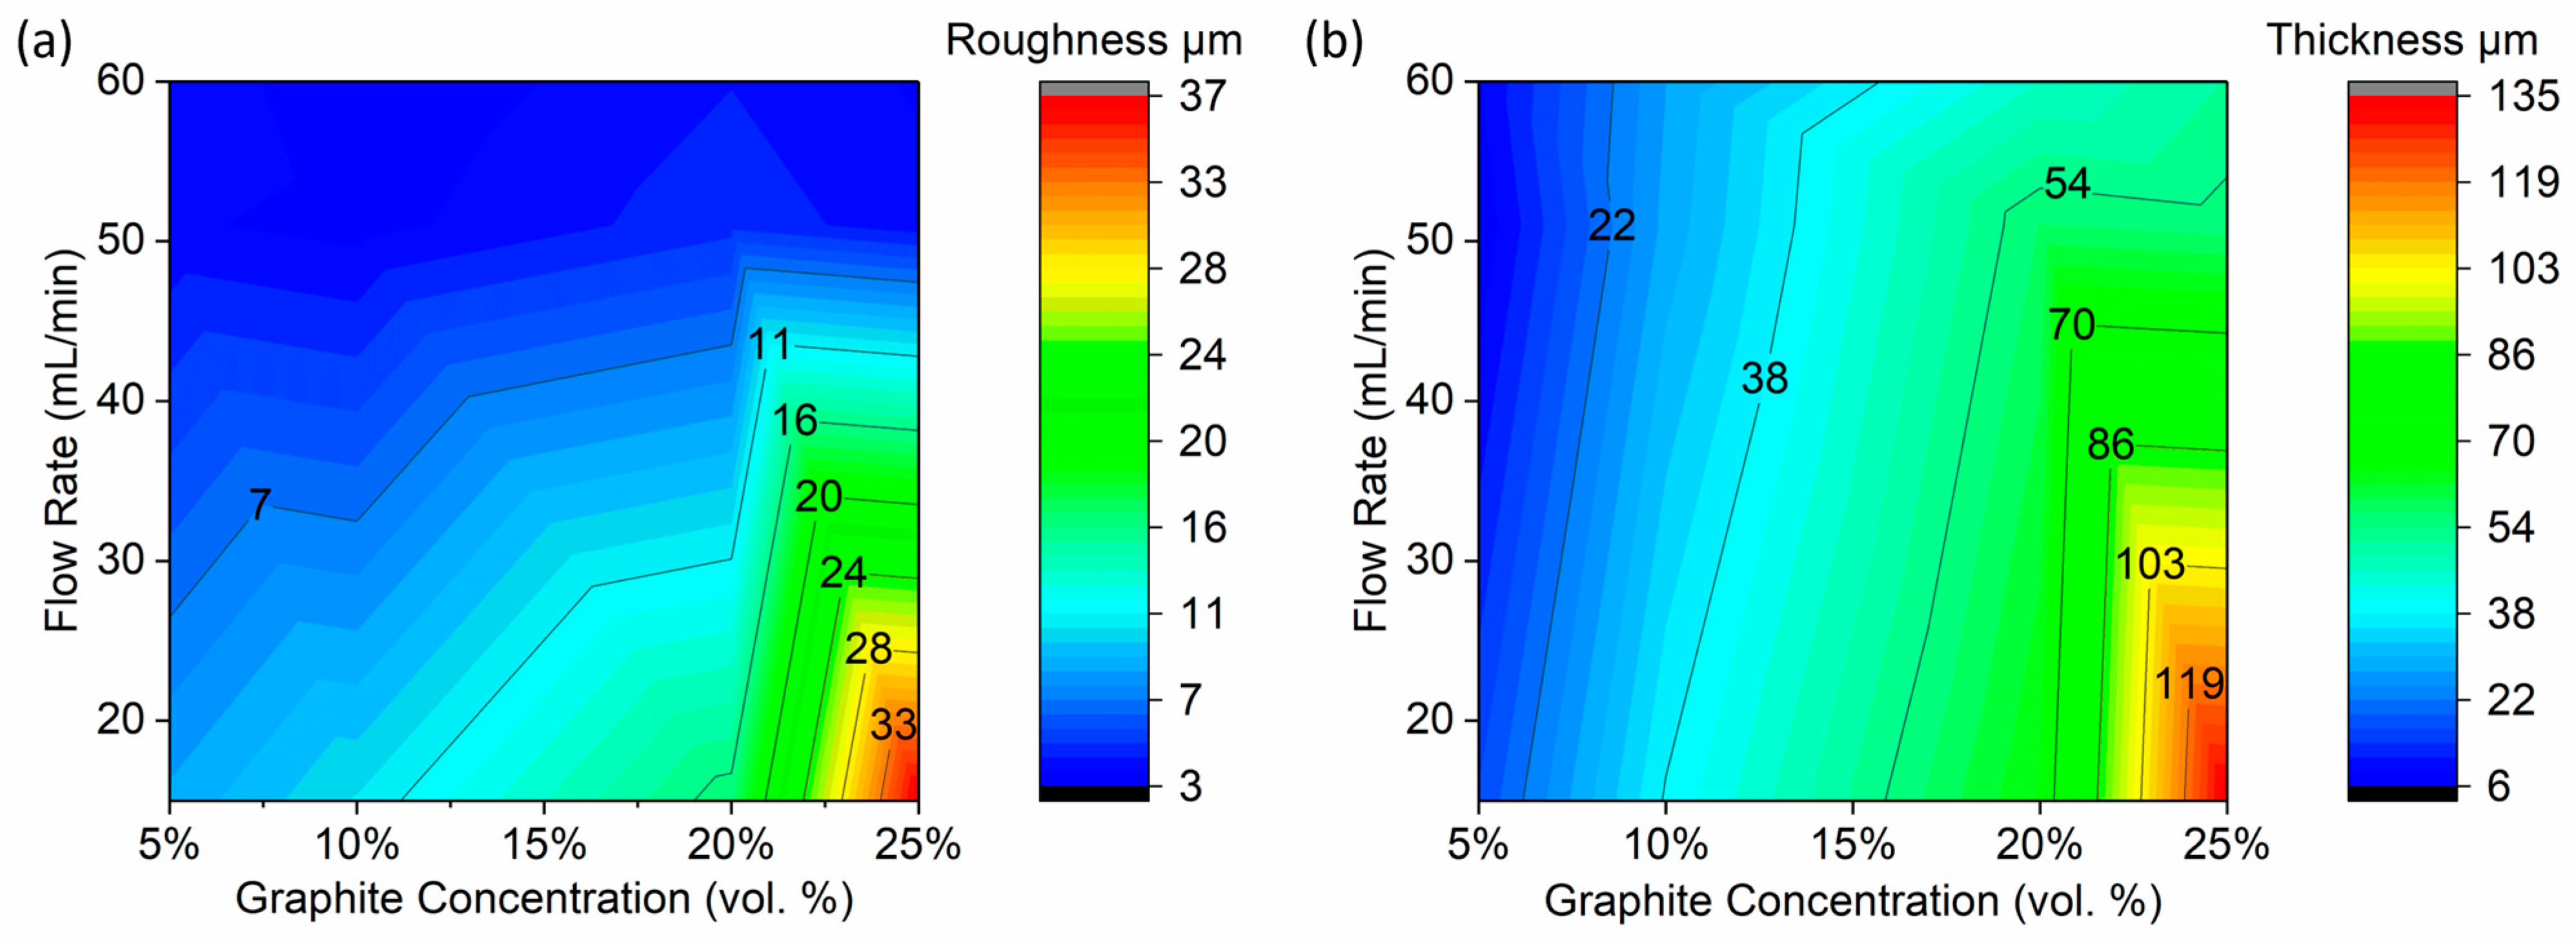
The contour plots in
Figure 2a,b depict variations in roughness and thickness map, respectively, as a function of graphite concentration and spray flow rate. These figures offer a visual representation of the data presented in
Figure 1b,c, with the
y axis scaling reflecting the measured flow rates. However, it is important to note that adjusting the nozzle knob changes the chamber size nonlinearly. One, two, and three revolutions corresponded to flow rates of 15, 51, and 60 mL/min for low, medium, and high levels, respectively. Consequently, the medium and high flow rates are relatively closer in value compared to the medium to low flow rate, which explains the similar surface roughness of the coatings deposited at medium and high flow rate.
Two-way analysis of variance (ANOVA) with replication was conducted in our full factorial design to assess the impact of graphite concentration and spray flow rate on both roughness and thickness responses (
Table 2). Replication refers to having multiple measurements for each combination of factor levels. ANOVA calculates F-values to test the significance of each factor and their interactions. To determine whether the observed F-value is statistically significant, we compared it to a critical value from the F-distribution. This critical value depends on the number of levels in each factor as well as the level of significance (α = 0.05). If the calculated F-value exceeds the critical F-value, it suggests that the observed differences between group means are statistically significant. Flow rate, graphite concentration, and their interaction had critical F-values of 3.4, 3.0, and 2.5, respectively. A low
p-value (below the chosen significance level of 0.05) suggests that the observed differences between group means are unlikely to be due to random chance, leading to rejection of the null hypothesis.
p-values provide a simple indication of significance and are used in conjunction with F-values to assess the statistical significance of the observed results.
For the roughness response, simple main effects analysis demonstrated that both flow rate (F = 1352, p = 2.14 × 10⁻²⁵) and graphite concentration (F = 276, p = 1.01 × 10⁻¹⁸) had statistically significant effects on roughness. Also, analysis revealed a statistically significant interaction between the effects of graphite concentration and spray flow rate (F = 275, p = 6.70 × 10⁻²¹). Similarly, examining the thickness response, the two-way ANOVA identified statistically significant simple main effects of both flow rate (F = 62, p = 3.45 × 10⁻¹⁰) and graphite concentration (F = 159, p = 5.79 × 10⁻¹⁶). Furthermore, the interaction between the effects of graphite concentration and spray flow rate on thickness was also significant (F = 23, p = 8.82 × 10⁻⁹). The statistically significant interactions observed in the ANOVA analyses for both roughness and thickness underscore the significance of the interplay between graphite concentration and spray flow rate factors in determining the final morphology and thickness of graphite coatings.
3.2. Friction
Figure 3 illustrates the coefficient of friction (COF) averaged over the test duration for each group. The measured COF for the mild steel substrate is 0.65 due to steel-on-steel interaction, consistent with values reported in the literature [
25]. Samples coated with graphite have a significantly lower COF ranging from 0.09 to 0.19, which is 71% to 86% smaller than that of uncoated samples. In existing literature, the friction of graphite ranges widely from 0.1 to 0.9, dependent on factors such as environment and testing conditions; however, a COF of 0.17 in humid air is widely referenced [
30,
31]. Specifically, the 5% concentration coatings exhibited average COF values of approximately 0.1, while the 25% graphite coatings displayed average COF values ranging from 0.15 to 0.19 (
Figure 3).
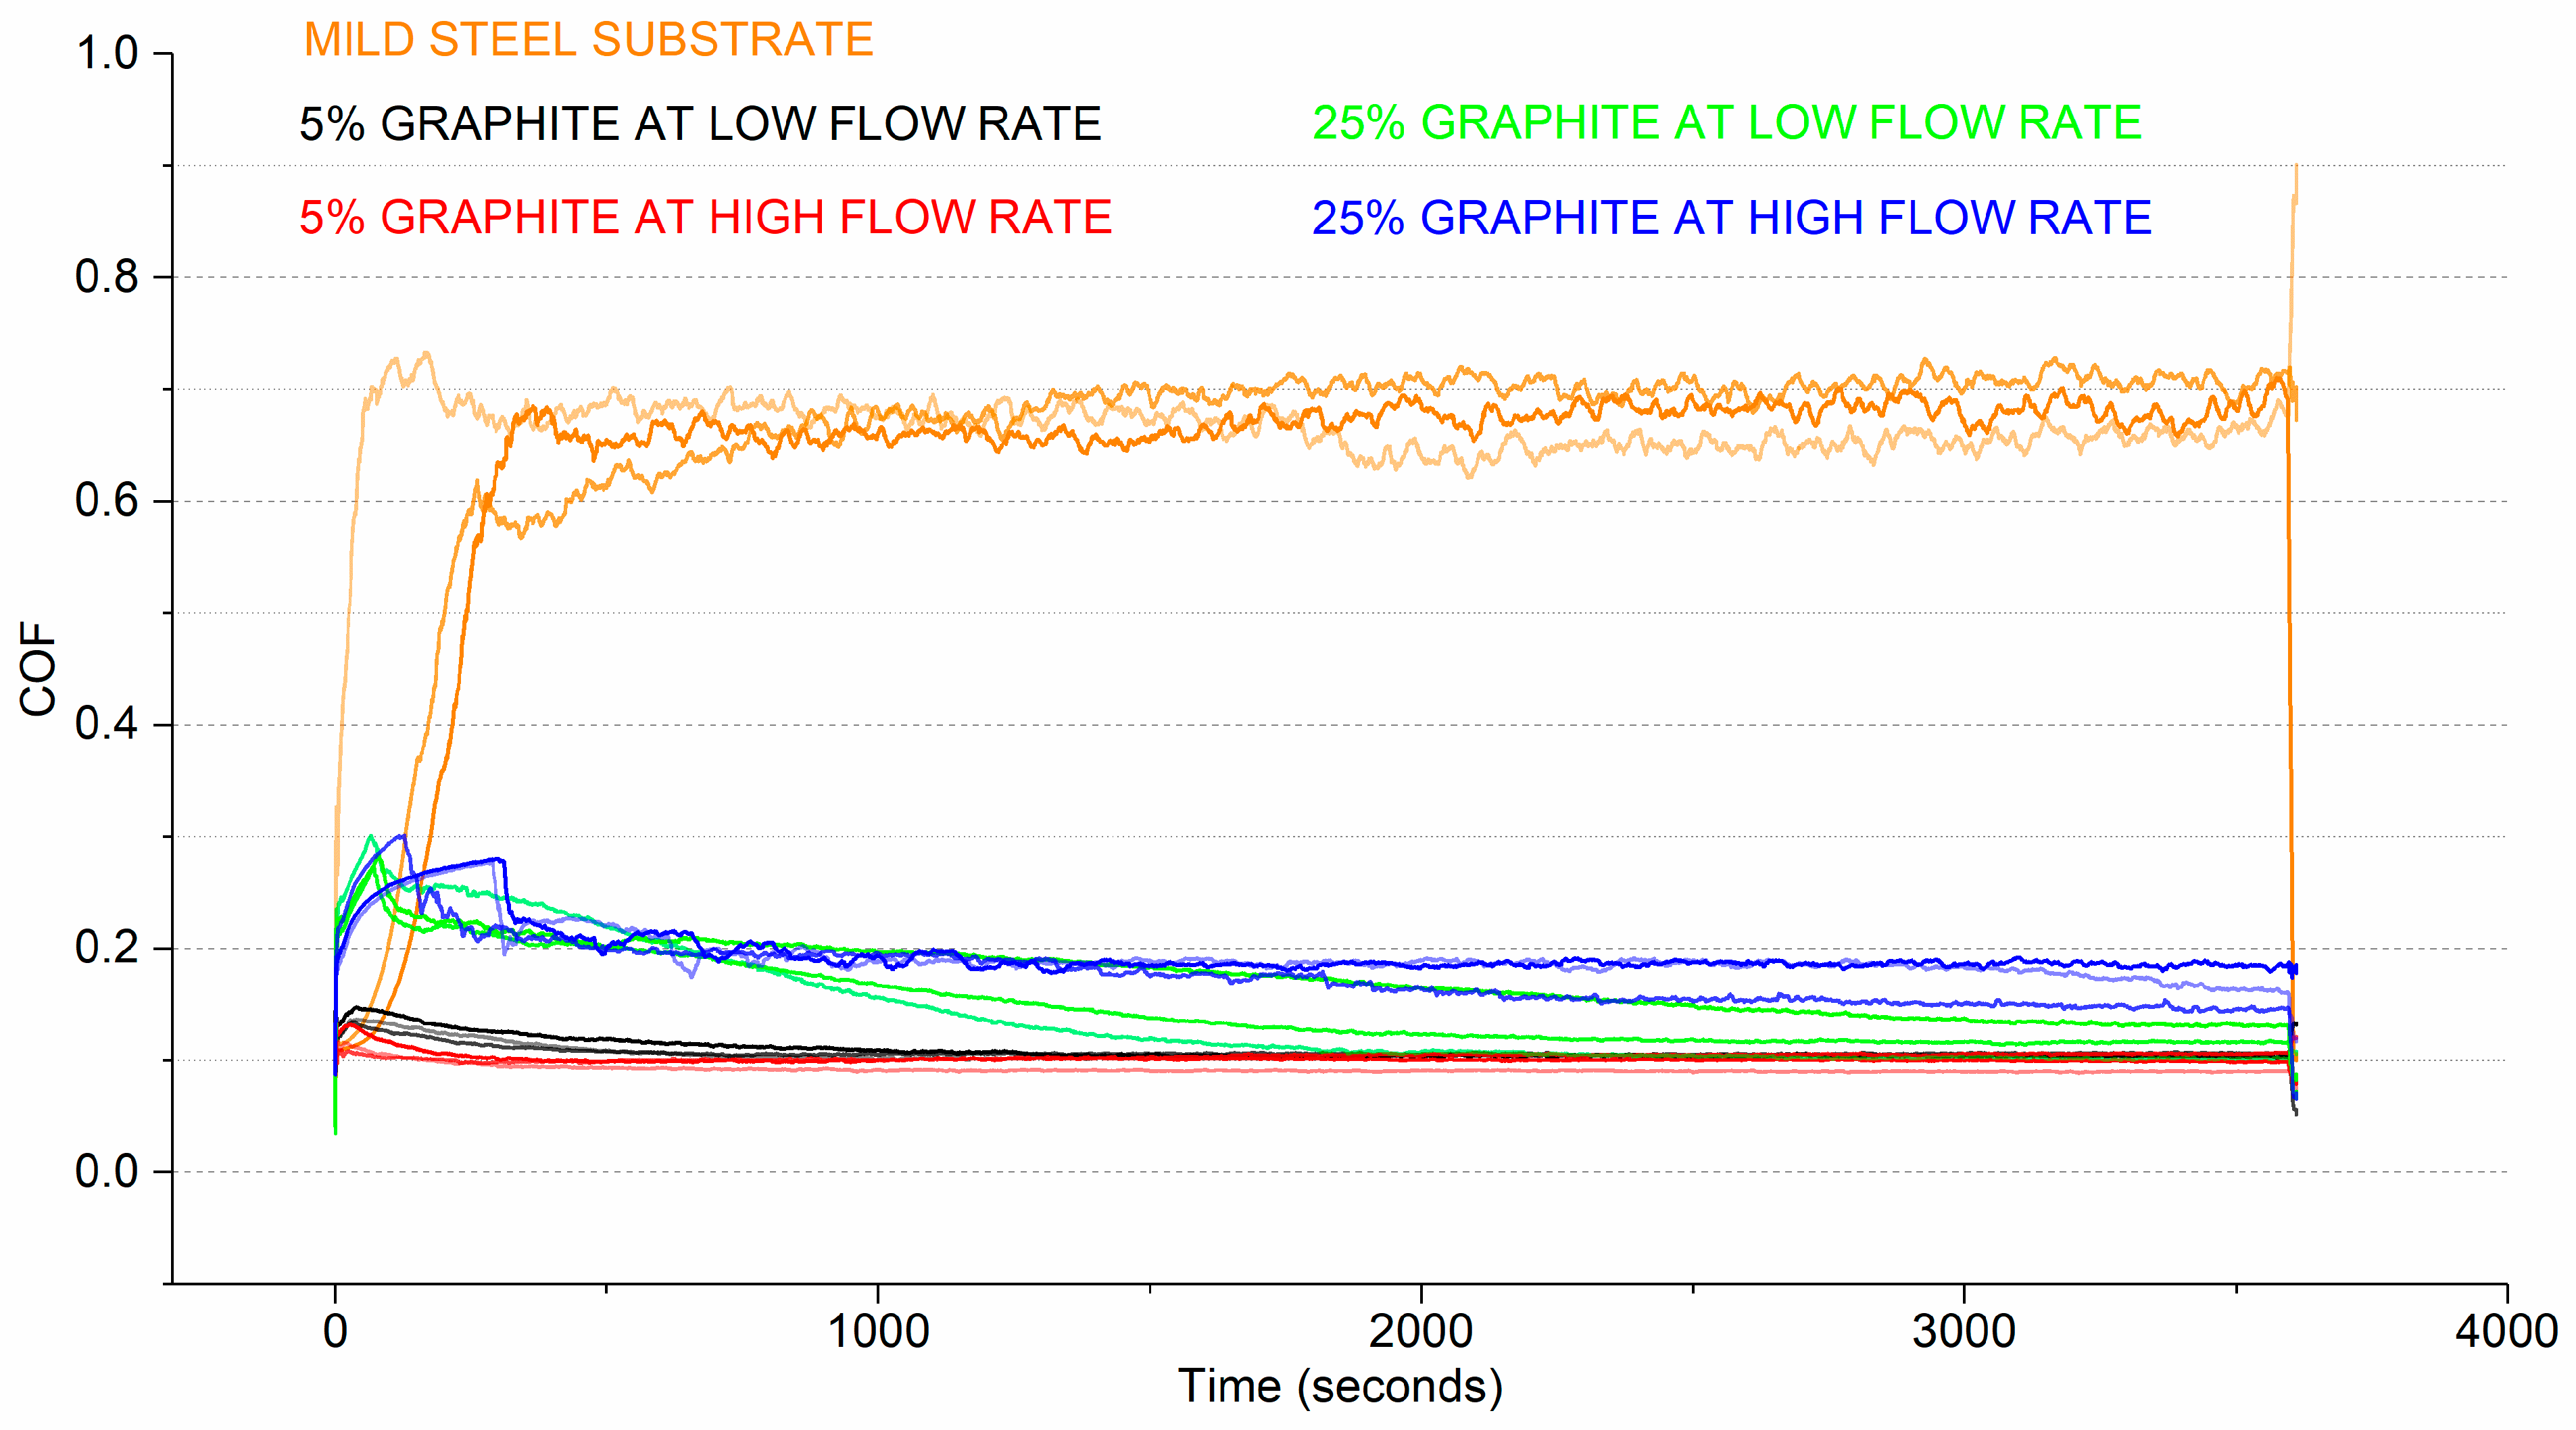
Figure 4 depicts the COF during each test for all sample groups. The relative differences among all samples are easily seen. Initially, the mild steel substrate exhibits an increasing trend, reaching a COF of about 0.7 at the conclusion of the test. In contrast, the low concentration graphite coatings display a brief run-in period within the first 100 s, followed by a reduction to a stable COF of about 0.1, which is maintained throughout the test duration.
Research shows that graphite exhibits the lowest friction during perfectly aligned relative motion [
8,
32]. However, the high concentration coatings exhibit a different trend from the low-concentration coatings. During the run-in period, friction rises to about 0.3, persisting for a longer duration compared to the low concentration coatings. After reaching 0.3, the COF for the high concentration coatings continues to decrease, approaching a COF above 0.1 at the end of the test. This can be attributed to the higher quantity of graphite flakes in the 25% concentration coatings, requiring additional time for compression and formation of a uniform layer compared to the 5% concentration coatings. Furthermore, the coating on the low-flow-rate samples have high porosity which weakened the coating shear strength, resulting in slightly lower friction than the high-flow-rate coating. Additionally, transfer film develops on the counterface as the test progresses, contributing to lower COF.
3.3. Wear
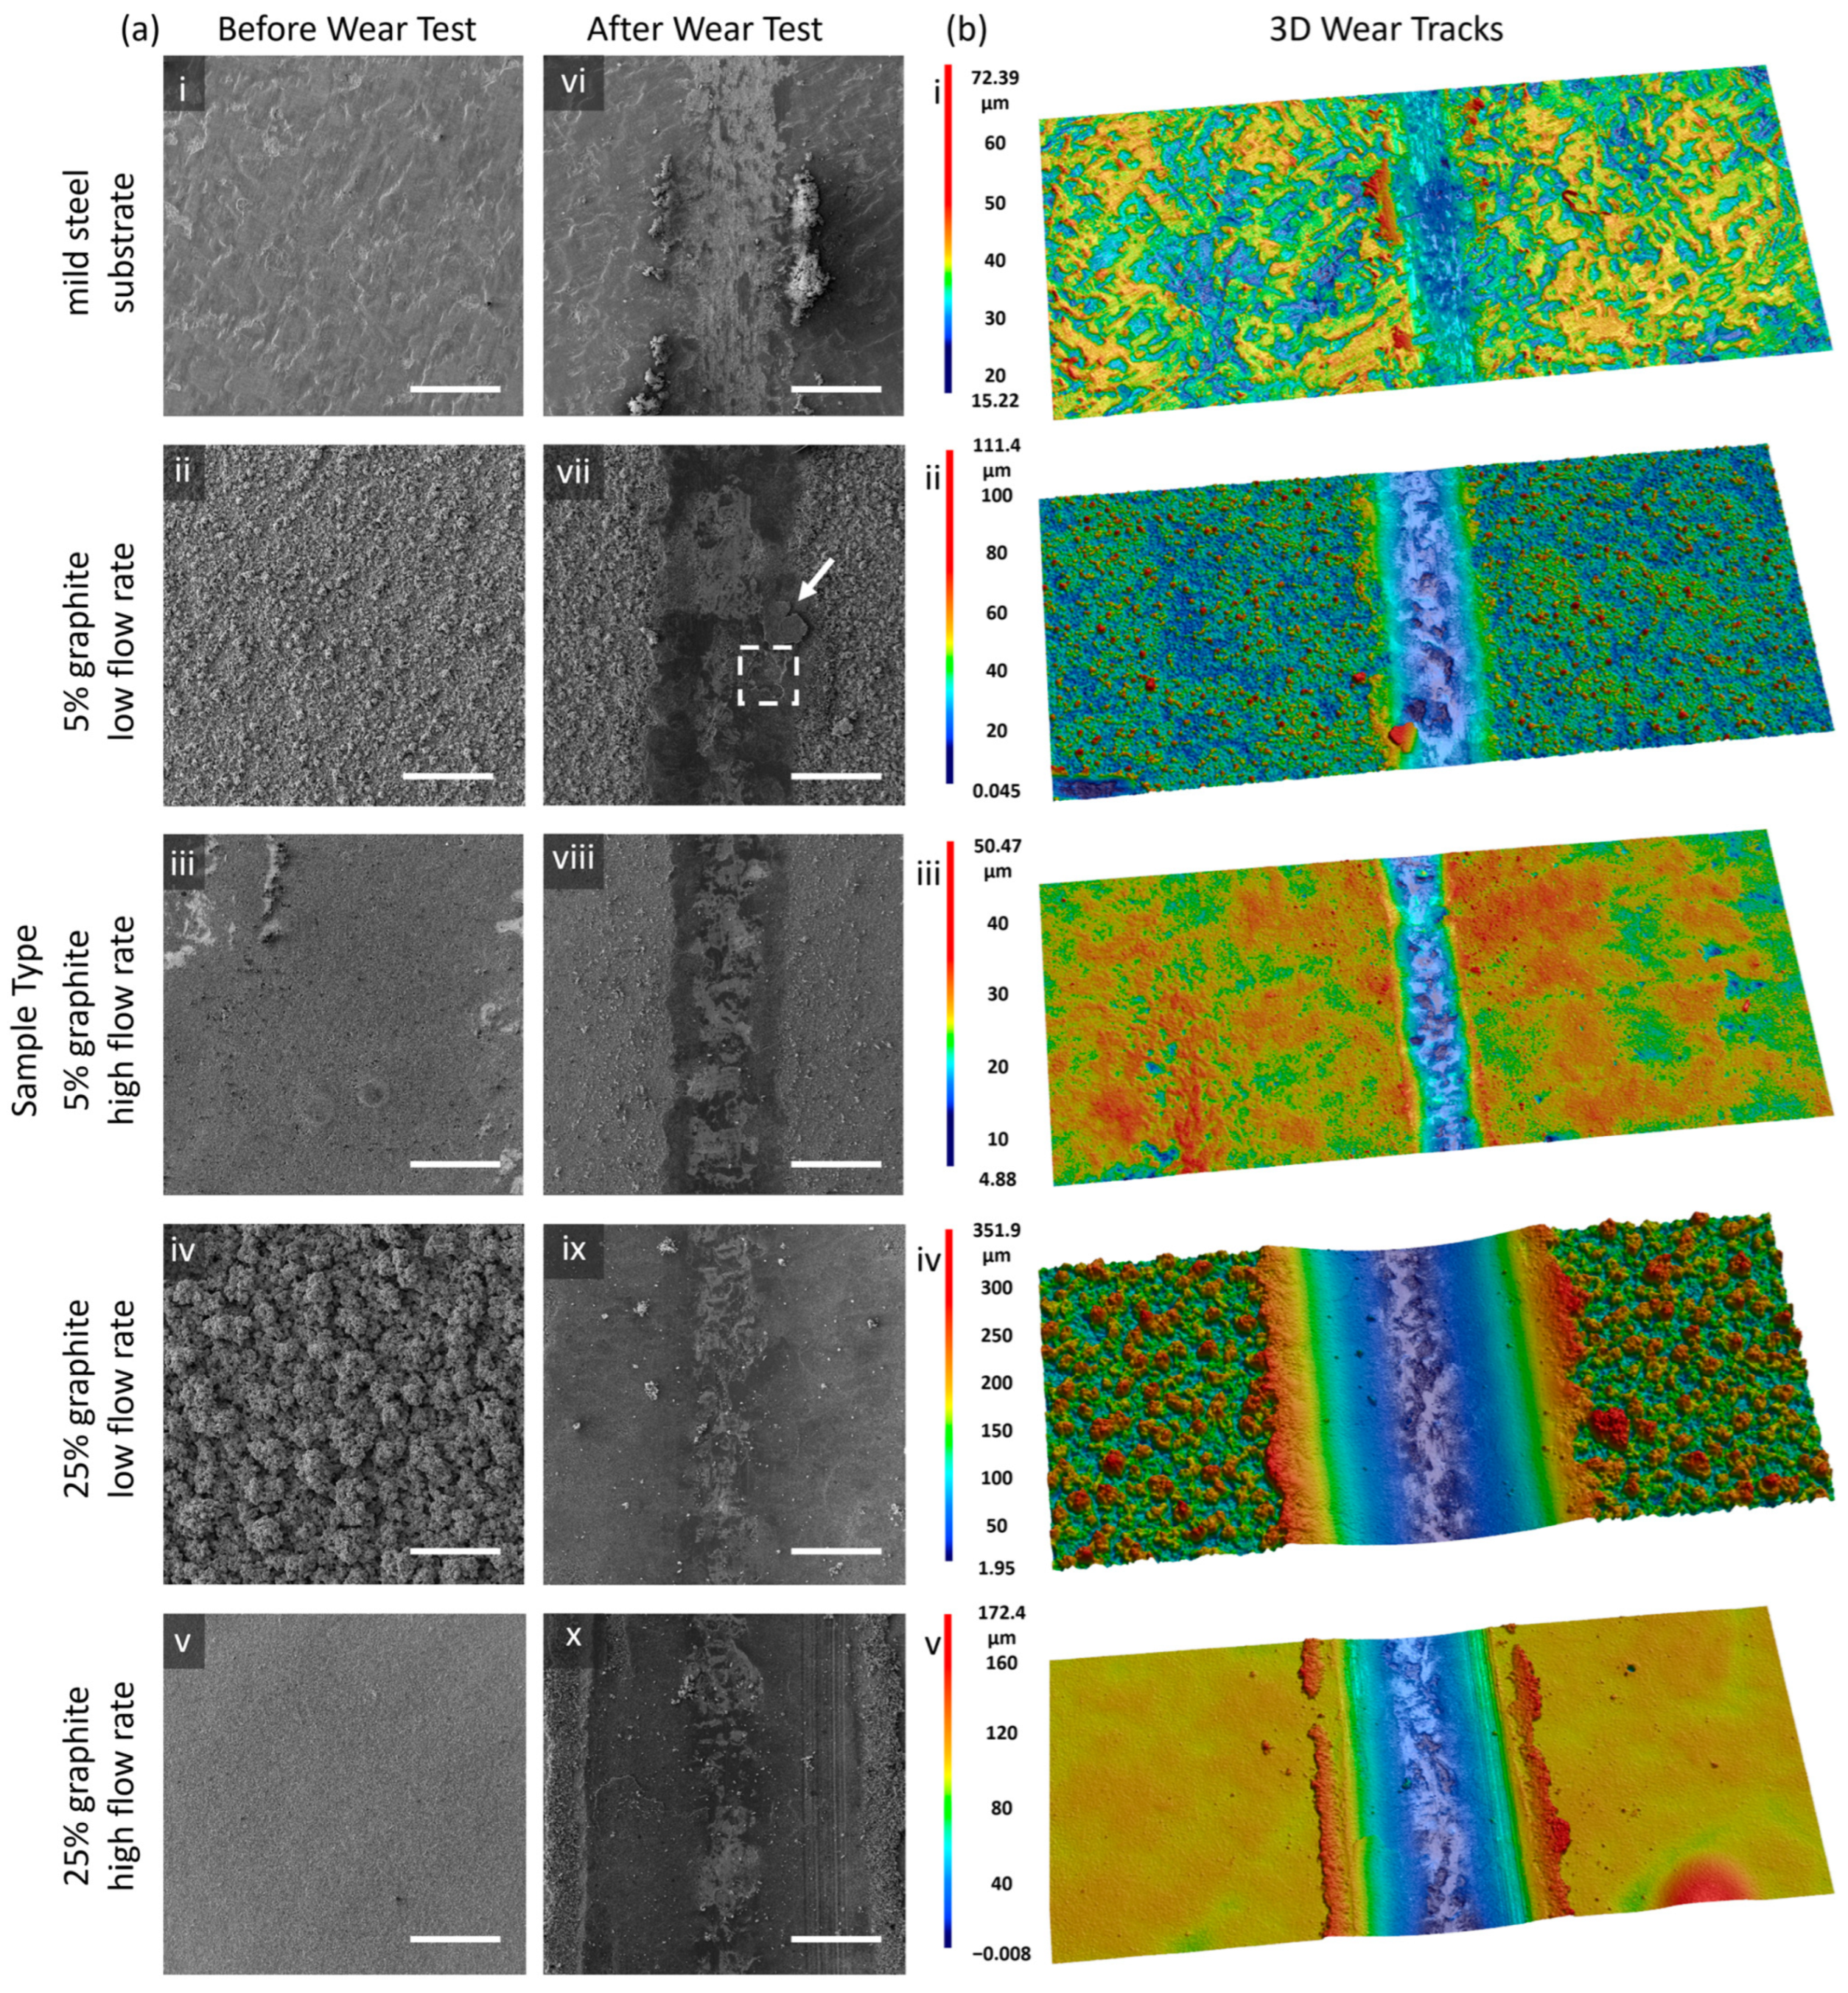
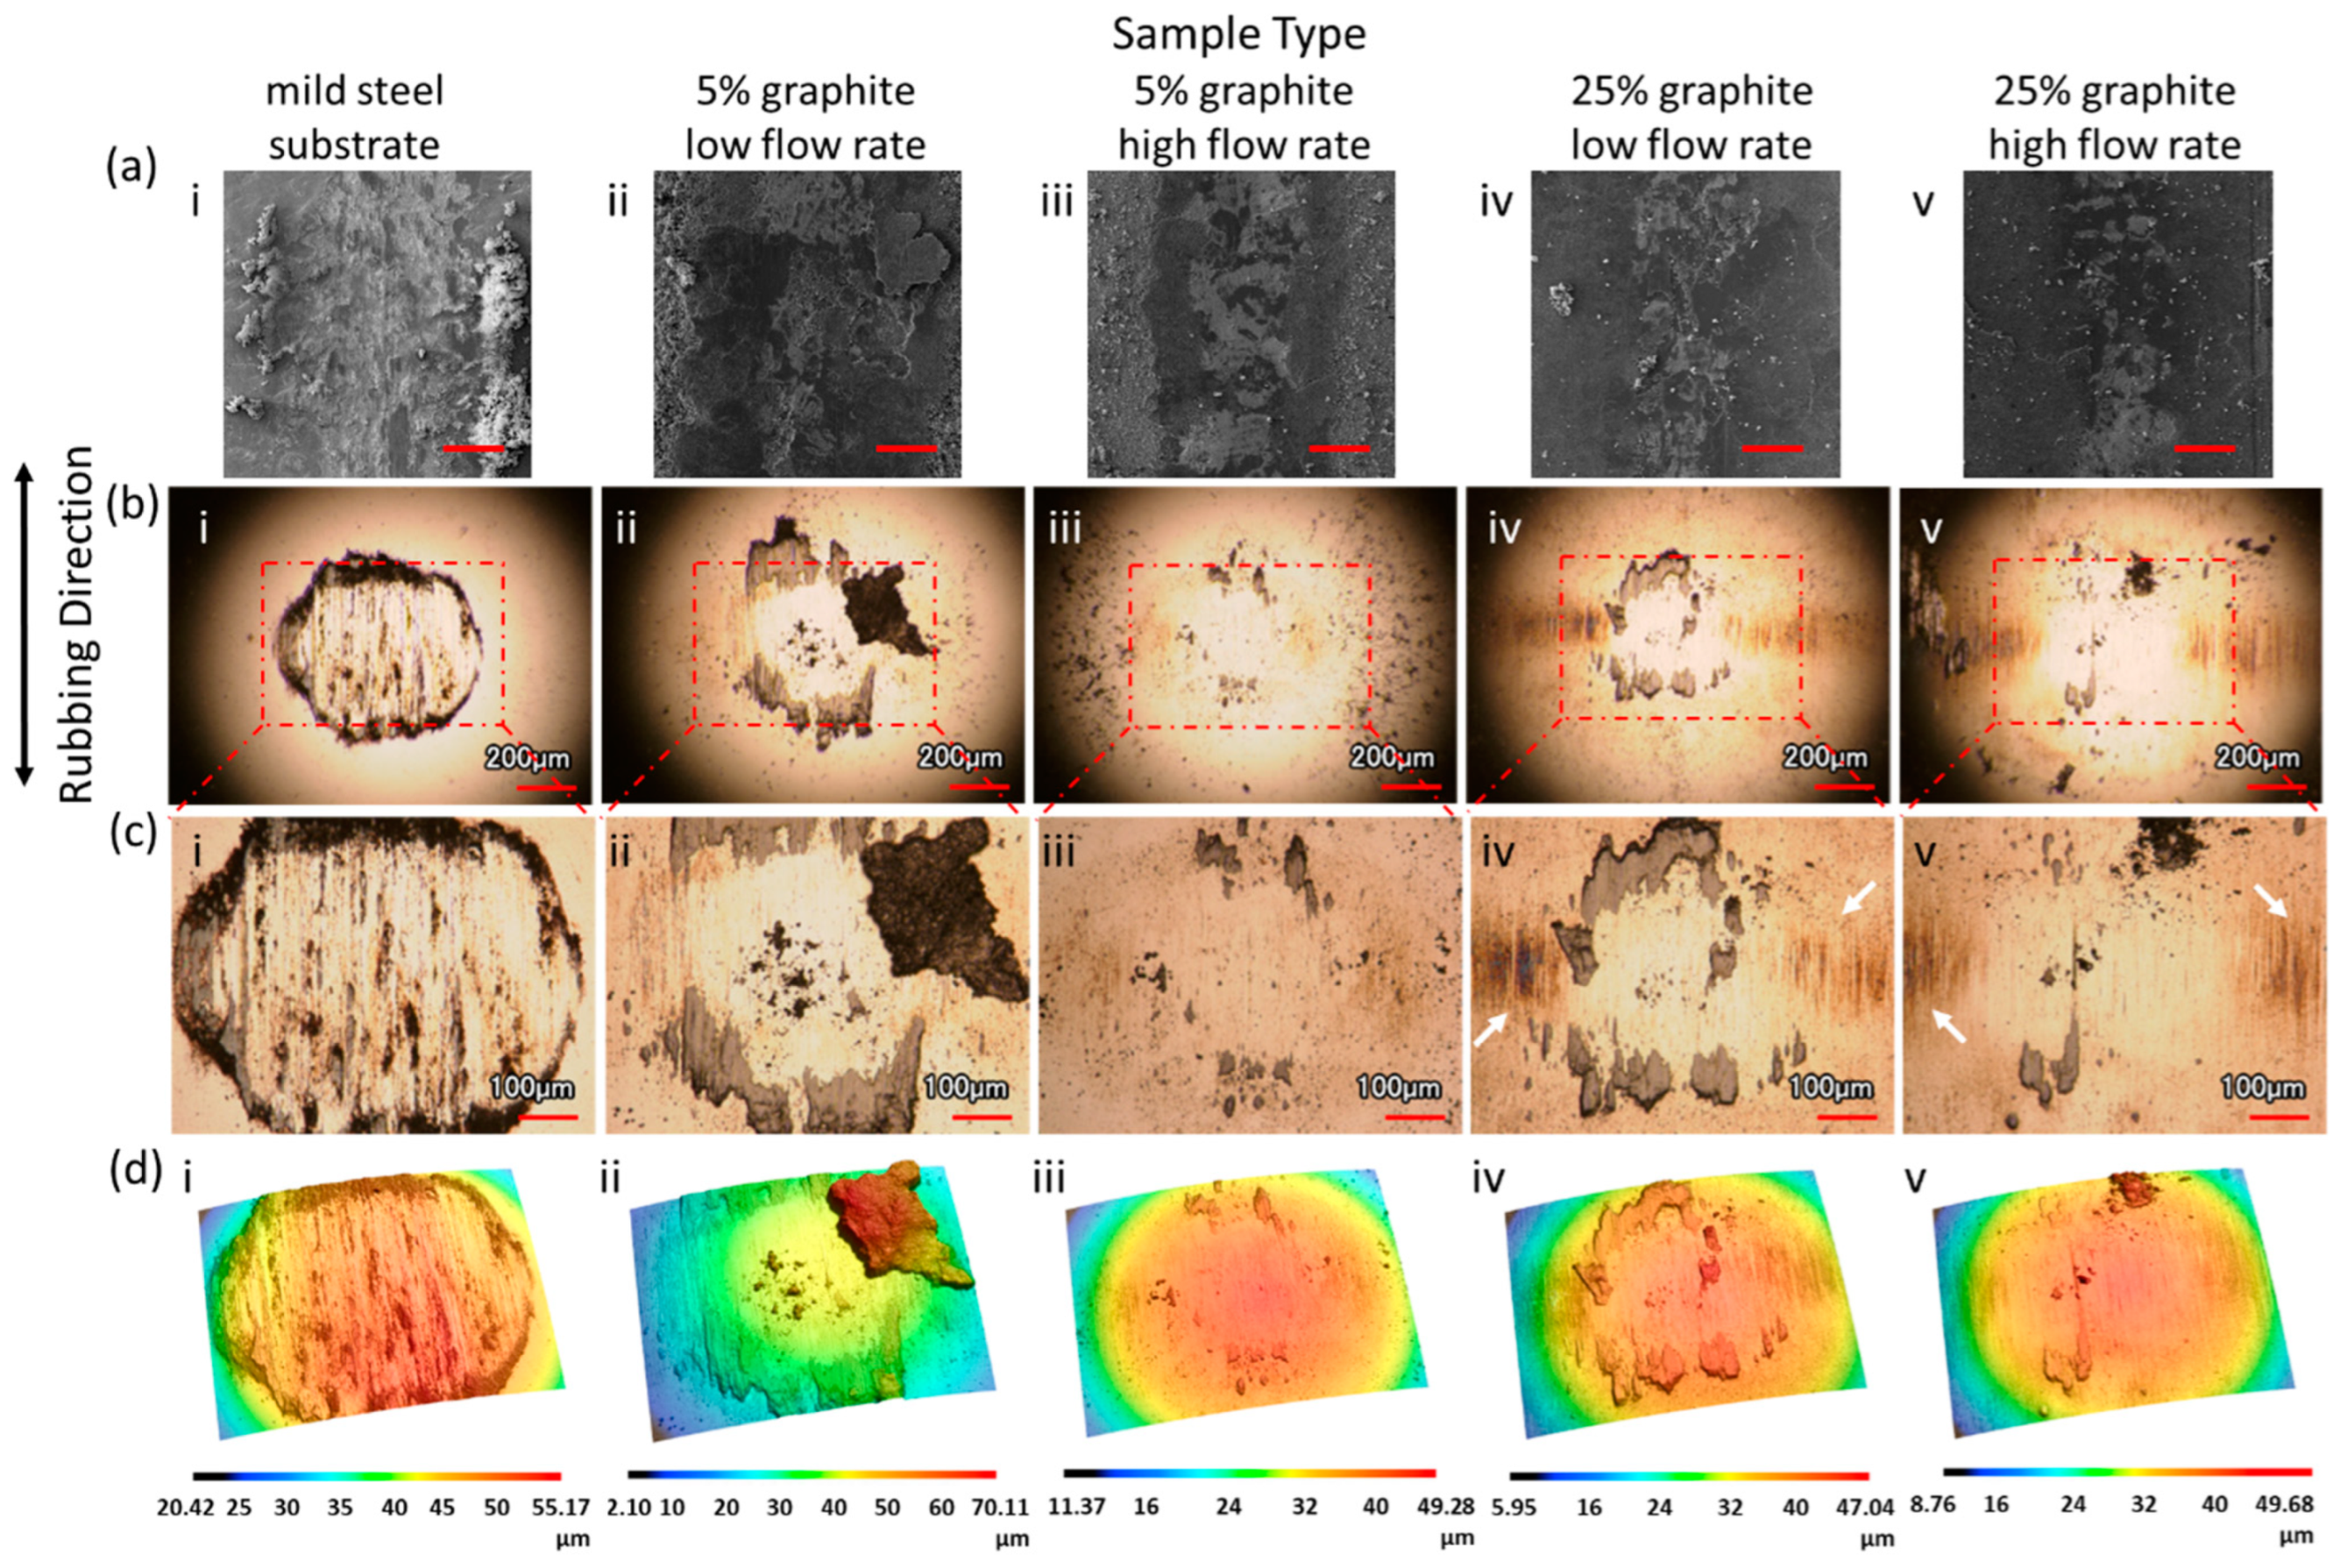
Figure 5a presents top-down SEM images of the coatings before and after the dry sliding wear test. On the left (
Figure 5a(i–v)) images, the mild steel substrate and pristine coatings are depicted, while the right (
Figure 5a(vi–x)) images reveal the wear tracks resulting from testing. For the mild steel substrate, the oxide layer is worn to expose the steel underneath, with a significant amount of wear debris deposited on the side of the wear track. In the post-wear 5% graphite low-flow-rate sample (
Figure 5a(vii)), darker compression areas indicate evidence of compacted graphite that was agitated during testing and displaced to different locations. The boxed area and arrow in
Figure 5a(vii) show where compressed coating material has been removed and redeposited, respectively. Similarly, in
Figure 5a(viii), the 5% graphite high-flow-rate sample exhibits compacted light and darker grey areas within the wear track. In the case of the 25% graphite samples, their thickness leads to a wider wear track, resulting in sidewalls of the wear track containing compacted smooth graphite in most areas. The center of the wear track, where the tip of the ball applies the highest pressure, displays uneven coloration because this area has the greatest potential for wear and transfer of coating material to the counterface. However, the 25% high-flow-rate sample (
Figure 5a(x)) demonstrates a narrower wear track compared to the 25% low-flow-rate sample (
Figure 5a(ix)), because the higher flow rate resulted in a denser coating.
In
Figure 5b, representative 3D images of wear tracks for mild steel, 5% graphite, and 25% graphite coatings at low and high flow rates are presented, accompanied by their corresponding scale bars. These images showcase the topography of the wear scar and surrounding areas. Notably, the roughness is distinguishable between the uncoated mild steel (
Figure 5b(i)) group and the groups with coated low (
Figure 5b(ii,iv)) and high (
Figure 5b(iii,v)) flow rate. While the effect of surface roughness on wear performance of graphite coatings has not typically been studied, our observations reveal that apparent lower roughness of the high-flow-rate samples contribute to narrower wear tracks at both 5% and 25% graphite concentrations due to the compact nature of the graphite coatings helping to resist deformation. This trend is further elucidated in
Figure 6.
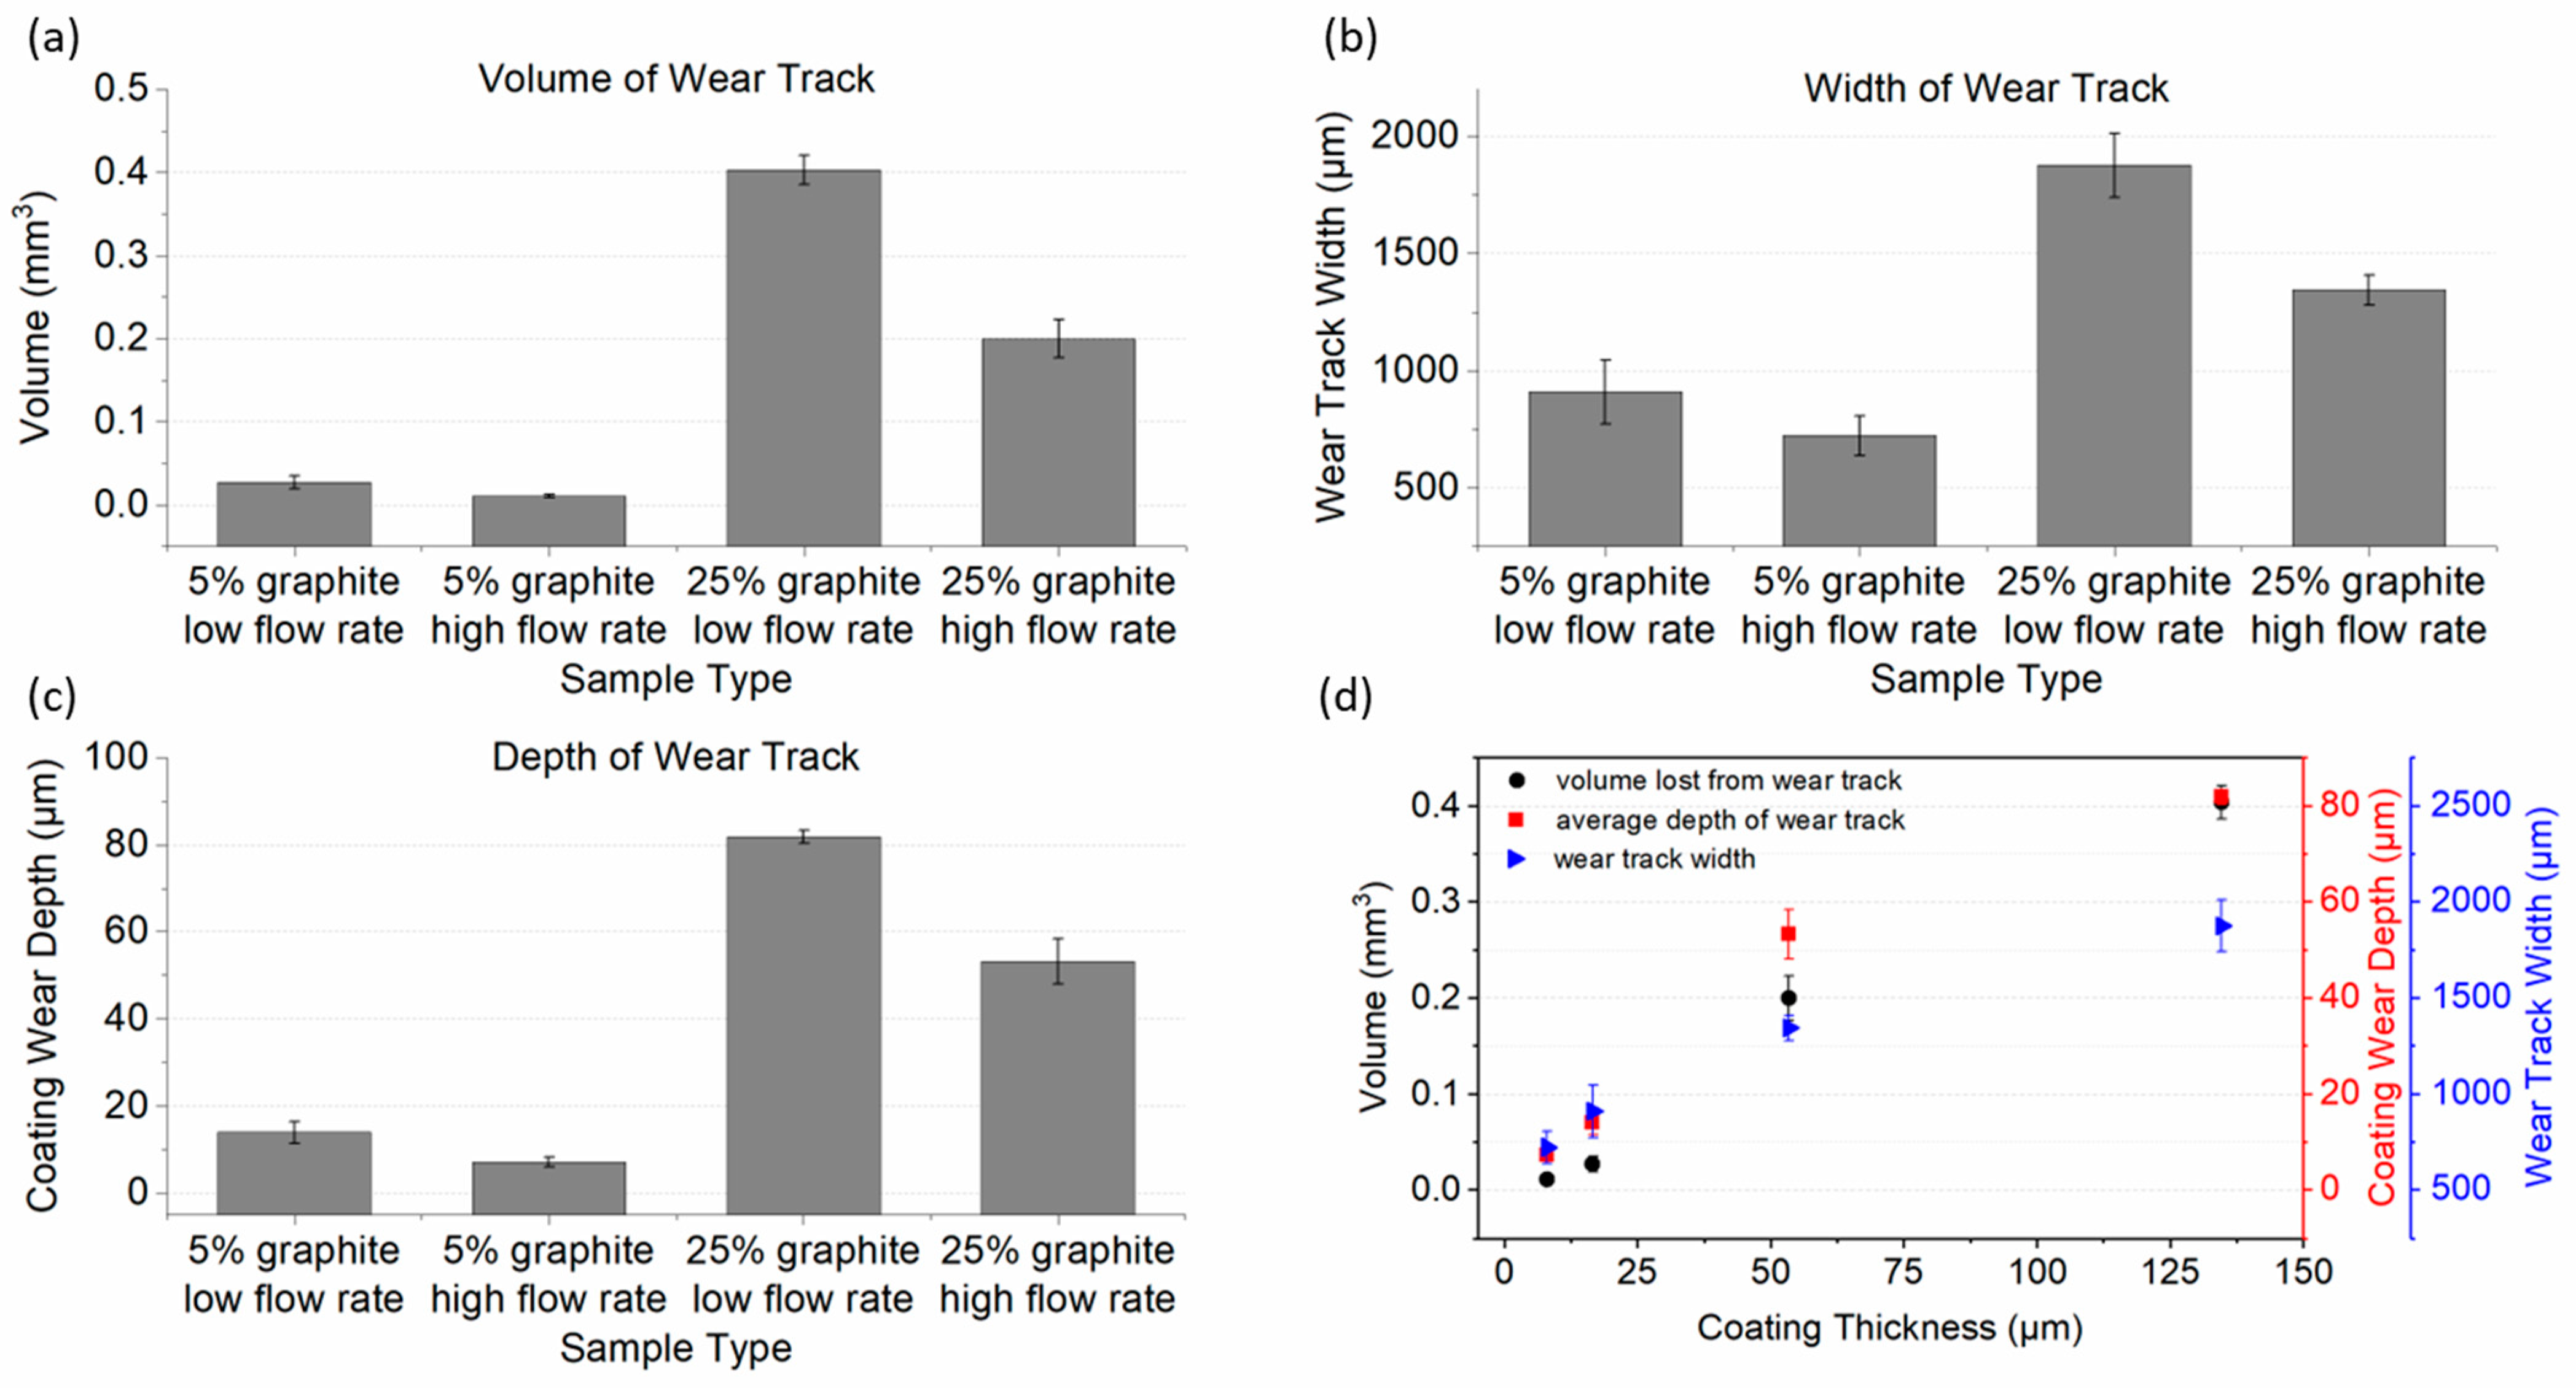
Figure 6 shows the average wear track volume (a), width (b), and depth (c) of coatings made at low and high flow rates with 5% and 25% graphite concentrations. In
Figure 6d, wear track volume, width, and depth are presented relative to coating thickness. Wear track dimensions (volume, width, and depth) in
Figure 6a–c are smaller at high flow rates compared to those at low flow rates. Also, the 5% graphite coatings consistently exhibit smaller wear metrics compared to the 25% counterparts, due to their thinner coatings. For all wear track metrics, there is an increasing trend with increasing coating thickness (
Figure 6d). Wear depth increases with the initial coating thickness. The depth of the wear track resulted from both coating compression and material removal. Morphology influences the wear behavior of graphite coatings. The loosely packed low-flow-rate coatings could facilitate transfer film formation, holding promise in applications requiring easy transfer of graphite. Conversely, the more densely packed, high-flow-rate coatings exhibit reduced wear (
Figure 6a), possibly due to the enhanced consolidation of graphite particles and the consequent reinforcement of the coating structure after rubbing.
Figure 7 illustrates the wear track SEM images and corresponding laser scanning confocal microscope images of balls.
Figure 7a,b present the wear track and counterface ball on the same scale. The figures are aligned to demonstrate the relative position of the ball during the sliding test.
Figure 7c,d show higher magnification images of the ball. In
Figure 7a(i), the uncoated substrate shows mild steel debris pushed away from the wear track and deposited outside, along with evidence of abrasion within the wear track. The ball rubbed against the mild steel substrate (
Figure 7b(i)) experienced significant wear, surpassing anything observed on the balls run against the graphite coatings. In contrast, graphite coatings are compressed (
Figure 7a(ii–v)) during testing and prevent wear on the counterface through the formation of protective films (
Figure 7b(ii–v)). In the SEM micrographs (
Figure 7a), the compressed graphite coatings exhibit a darker appearance. The area of the ball in contact with the graphite coatings is larger for the thicker 25% coatings compared to the thinner 5% coatings. This is observed by the dark areas on the sides of the ball where it rubbed against the sidewalls of thick coatings (shown with white arrows in
Figure 7c(iv,v)).
The amount of graphite transferred to each ball varies. In subfigures ii and iv of
Figure 7b–d, the low-flow-rate coatings left substantial wear debris on the ball after rubbing against both 5% and 25% concentration coatings. This is attributed to the porous structure and mobility of graphite flakes of the low-flow-rate coatings. The high roughness of these coatings also encouraged transfer film formation. In subfigures iii and v of
Figure 7b–d, the high-flow-rate coatings exhibited some transfer films protecting the rubbing interface.
SEM images of the wear tracks from representative tests are presented in
Figure 8, where the boxed regions of interest are depicted at progressively higher magnifications in each row. The middle of the wear track represents the highest contact pressure area in the rubbing direction, providing insights into the most severe wear experienced by the coatings. In subfigure (i) of
Figure 8a–c, the uncoated mild steel shows abrasion lines, debris particles, and uneven surfaces in the wear scar. On the other hand, in subfigures ii–v of
Figure 8a–c of the coated samples, graphite flakes are compressed to form protective layers on the surface. However, these compressed layers depicted in
Figure 8 may experience dislodgement, as indicated by the connected dots in subfigures a(ii), a(iv), b(iv), and c(iv). The dots are positioned on the side to indicate the original and current locations of dislodged compressed graphite flakes, identifiable by matching the shapes of the flake edge/perimeter. The low-flow-rate coatings show evidence of compressed flake displacement. In the circled areas in
Figure 8a,b, the edges of the smoothened plates of darker compressed graphite terminate with smaller graphite particles.
Figure 8a,c depict the extent of compressed graphite coverage in the area subjected to the highest contact pressure, in contrast to other regions within the wear track. The variation of light and dark areas in subfigures (ii)–(v) of
Figure 8 indicate that compression is not uniform throughout the wear track. In general, the 25% graphite coatings (subfigures (iv) and (v)) provide a more uniform protective layer of compacted graphite compared to the thinner 5% coatings (subfigures (ii) and (iii)). Arrows in
Figure 8c show wear lines on top of the graphite surface (subfigures (ii)–(v)) and on the severely worn mild steel (subfigure (i)). The compressed graphite separates the counterface ball from the substrate as shown by the wear lines (arrows in
Figure 8c). This protective layer is crucial as it serves as a lubricant reservoir, and over time, the alignment of graphite particles facilitates low friction, as observed in
Figure 4.
In the innermost portion of the wear track (
Figure 8c), light gray areas sometimes reveal the pebble-like morphology of the underlying mild steel substrate (boxed regions in
Figure 8c(i,iii,iv)). It is unclear if graphite is still present in these small regions. Therefore, elemental analysis of the light areas of the wear track and outside the wear track was carried out at higher magnifications; this is presented in
Figure 9 and
Figure 10.
3.4. Elemental Analysis
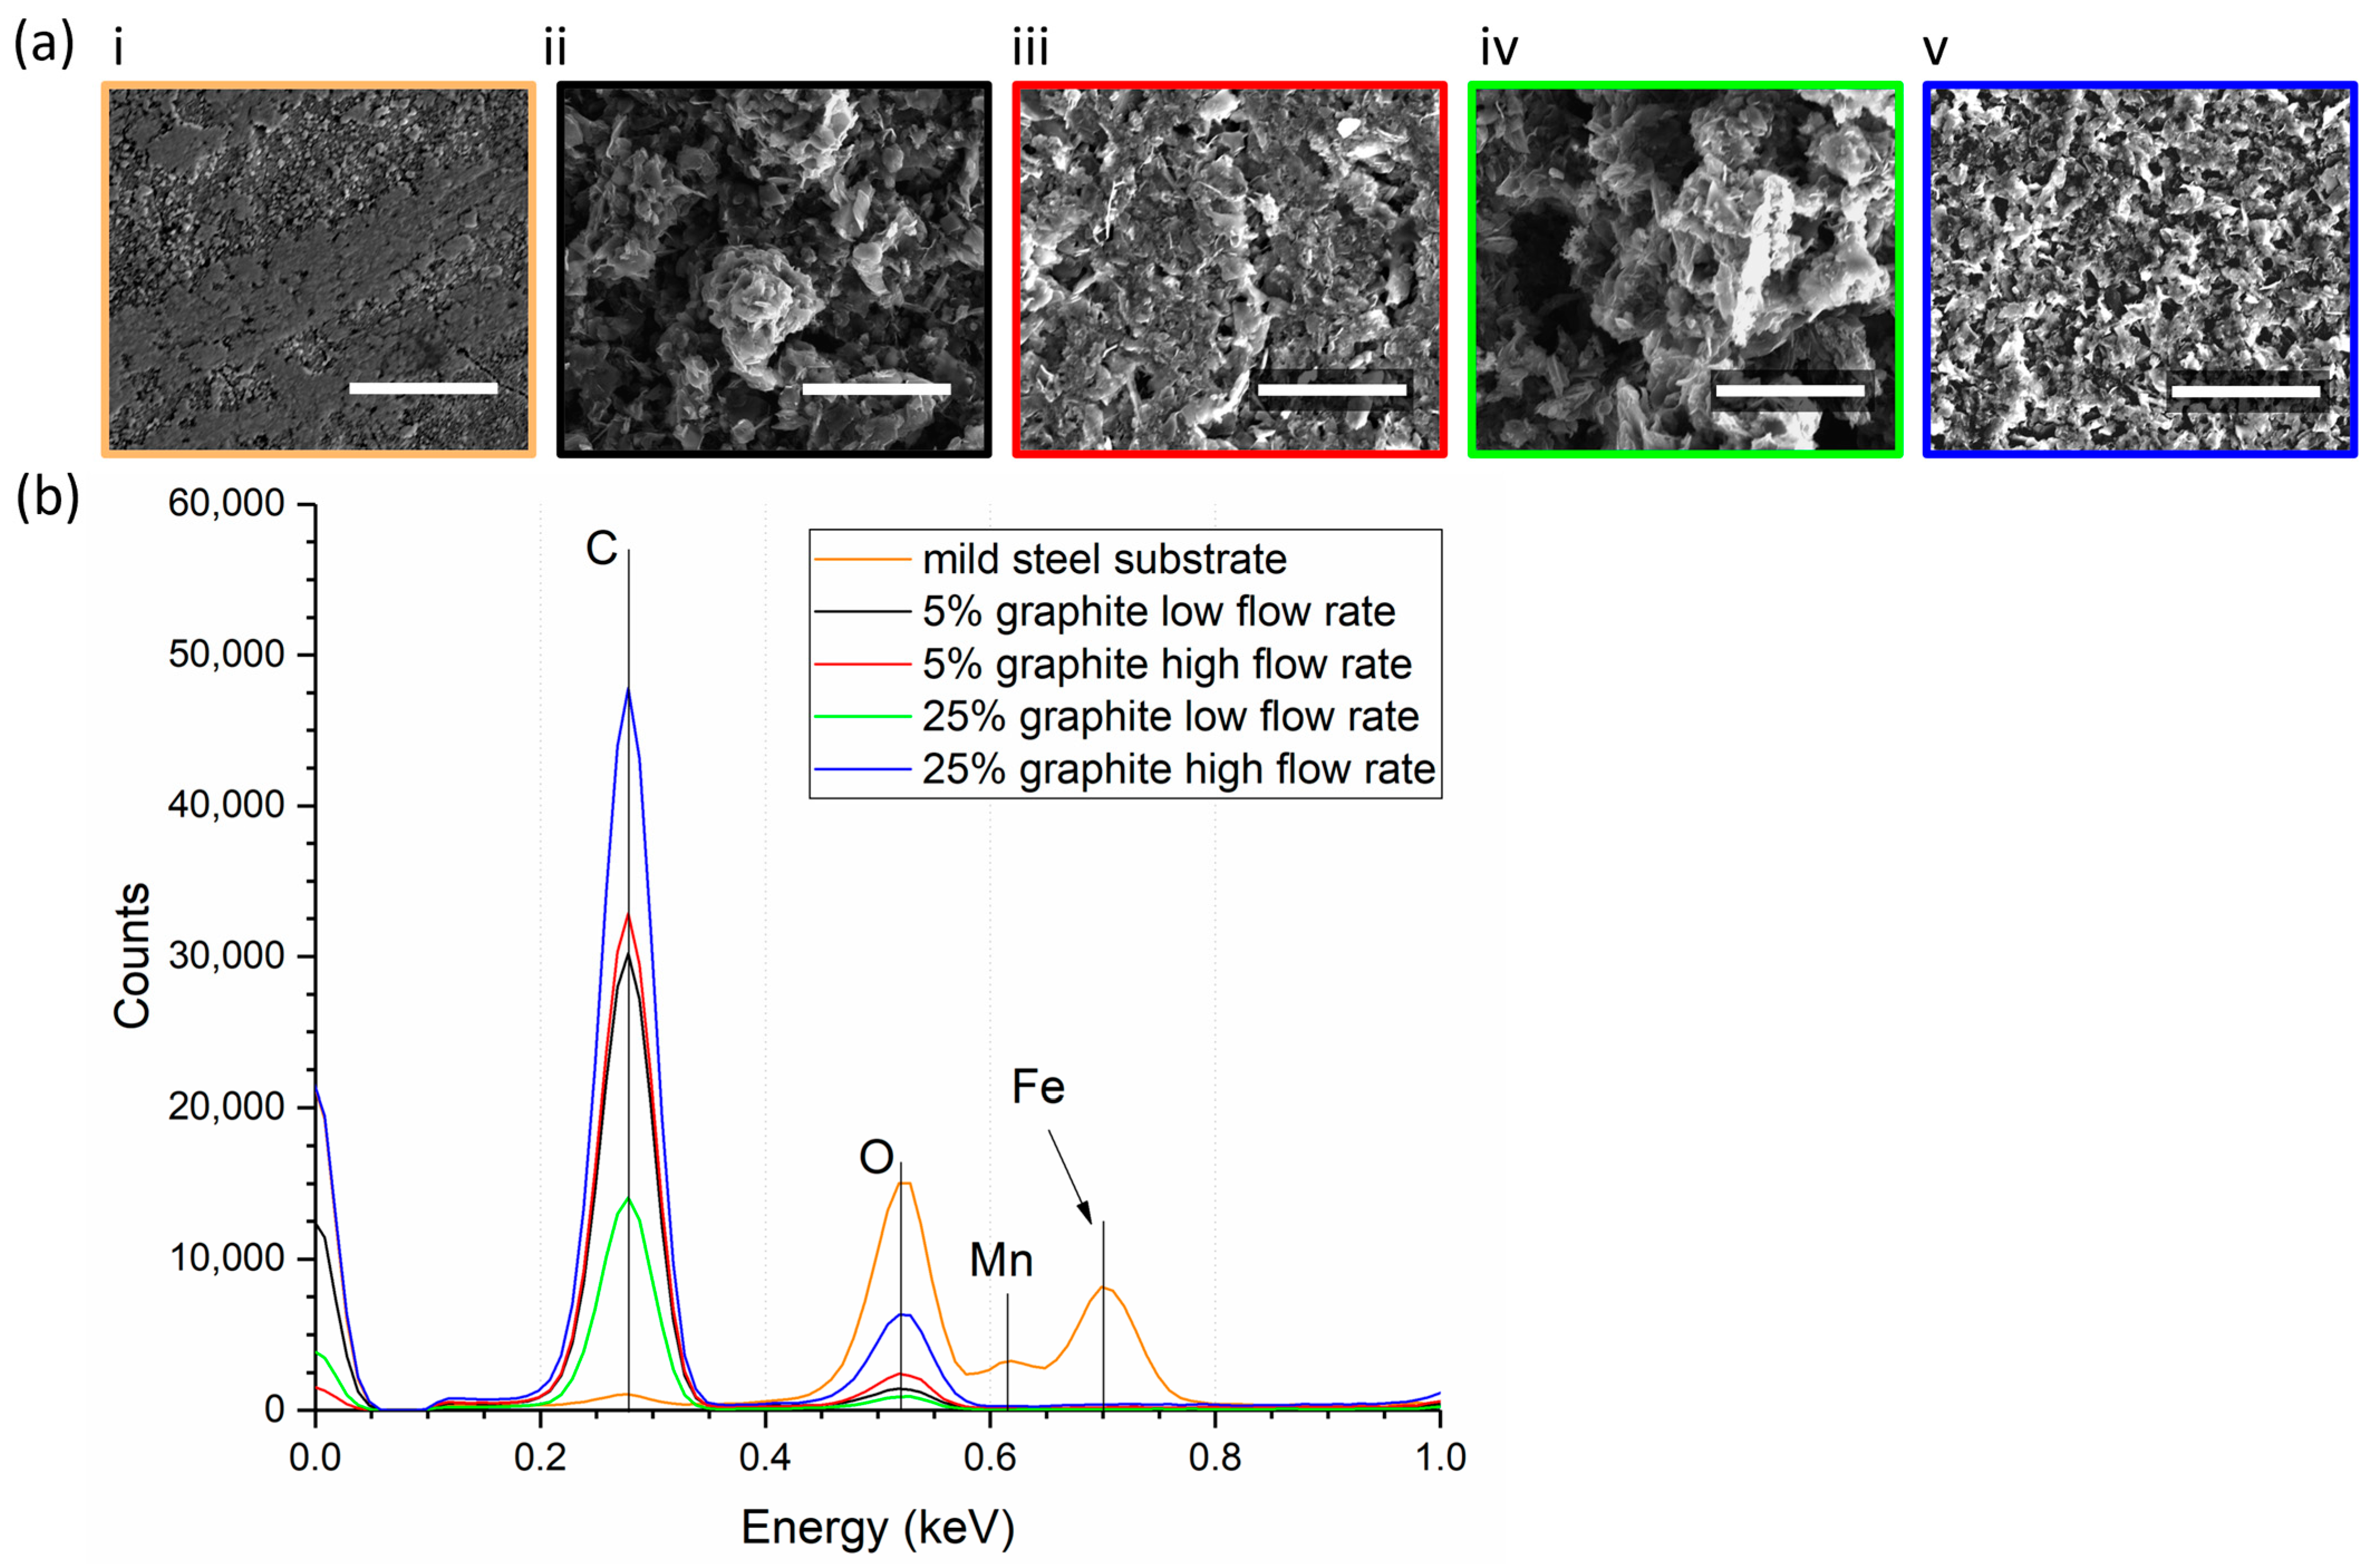
Figure 9a,b present SEM images of graphite coatings and the corresponding EDS spectra of these areas. The colors of each group are kept consistent across both
Figure 9 and
Figure 10.
Figure 9a shows the differences in coating morphology between the rough low-flow-rate coatings (subfigures (ii) and (iv)) and the smoother high-flow-rate coatings (subfigures (iii) and (v)). In graphite coatings, carbon (C) is the primary element of interest. Although carbon is also present in mild steel substrates, it constitutes a much smaller percentage, typically less than 0.3%, with iron (Fe) dominating the substrate’s spectra. Additionally, manganese (Mn) may be present in mild steel to a lesser extent, and oxygen (O) signals can indicate the presence of ferrous oxides or passivation of dangling bonds in carbon.
In
Figure 9b, the EDS spectra demonstrates that the 25% low-flow-rate coatings exhibit the lowest C signal among all coatings. This can be attributed to the high porosity of the region, resulting in fewer graphite flakes penetrated by electrons. Conversely, the 25% high-flow-rate coating exhibits the strongest C signal for graphite due to its thick and dense coating. As expected, all coatings cover the substrate up to the penetration depth of the electrons, resulting in no Fe signal measured in the graphite coatings, while the mild steel substrate displays high Fe spectra. The mild steel exhibits a high oxygen-to-iron ratio, likely due to the presence of ferrous oxides such as Fe
2O
3 and Fe
3O
4 on the surface.
Figure 10a,b present SEM images of the inner portion of the wear track (width of 250 µm, like
Figure 8c) and the magnified boxed area, respectively. Their EDS spectra are displayed in
Figure 10c and
Figure 10d, respectively. In
Figure 10a, arrows point to areas of compacted graphite. In
Figure 10a,c, the analyzed regions show that the 25% low-flow-rate coating exhibits the highest C signal, which may be influenced by the non-uniform nature of the wear track at this magnification. Nonetheless, the low-flow-rate samples display significant C counts, indicating good graphite coverage in part of the areas. This suggests that the porous graphite aggregates of the low-flow-rate coatings are compacted in the wear track and protect part of the substrate. The mild steel substrate exhibits only low C content, reflecting the minimal carbon contribution of <0.3% in its composition. Importantly, the Fe signal is lower than the respective C signal in all the coatings, indicating sufficient graphite coverage in the wear track.
Figure 10b, the zoomed-in grey areas of
Figure 10a, shows the pebble-like structure of the mild steel and darker grey areas of compressed graphite. EDS spectra in
Figure 10d indicate much higher C signals in all coatings than the mild steel, indicating the presence of carbon coating on all coated surfaces. Elemental analysis demonstrates that in the innermost regions of the most worn areas of the wear track, graphite remains embedded in the crevices of the mild steel substrate, contributing to surface protection and low friction.


