Article

A Comparative Study on the Wear Behavior of Quenched-and-Partitioned Steel (Q&P) and Martensite Steel (Q&T)

by
Jian Zheng
1,2,
Wei Li
1,2,* and
Jie Li
1,2,*
1
Institute of Advanced Wear & Corrosion Resistant and Functional Materials, Jinan University, Guangzhou 510632, China
2
National Joint Engineering Research Center of High Performance Metal Wear Resistant Materials Technology, Jinan University, Guangzhou 510632, China
*
Authors to whom correspondence should be addressed.
Coatings 2024, 14(6), 727; https://doi.org/10.3390/coatings14060727
Submission received: 26 May 2024 / Revised: 4 June 2024 / Accepted: 4 June 2024 / Published: 6 June 2024
(This article belongs to the Special Issue Advanced Surface Technology and Application)

Abstract

:
The wear resistance of quenched-and-partitioned steel (Q&P) compared to martensite steel (Q&T) remains unclear. In this research, the wear resistance of Q&P steel and Q&T steel was researched by the means of the abrasive wear (AW) and impact abrasive wear (IAW) tests. The results show that abrasive ploughing was the main reason causing the material loss of Q&P and Q&T steel, while Q&T steel was subjected to severe fatigue spalling in the impact abrasive wear tests. Under the abrasive wear test, Q&T steel has better wear resistance due to its higher initial hardness. Under the impact abrasive wear test, Q&P steel has better wear resistance. This is because the formation of the deformed layer, which consists of finer grains and newly formed martensite in the worn subsurface, increased the hardness of the Q&P steel, causing the hardness of the worn subsurface in Q&P steel to be higher than that of Q&T steel. Furthermore, Q&P steel has better resistance to cracks nucleation and propagation compared to Q&T steel. As a result, less material loss was caused by fatigue spalling in Q&P steel under the impact abrasive wear tests.

1. Introduction

Wear, corrosion, and fracture are the three main forms of material failure [1,2,3]. Wear is widely observed in the metallurgy, building, and mining industries [4,5,6,7,8,9,10]. Large amounts of energy loss are caused by wear every year [10,11,12]. For example, wear consumes about 40% of the energy in the mining industry [13]. Therefore, improving the wear resistance of materials in mining industry equipment is important. In the mining industry, abrasive wear (AW) and impact abrasive wear (IAW) often appear in equipment such as crushers and ball mills. The current wear-resistant steels mainly include Hadfield steel, martensitic steel, bainite steel, etc. [14,15,16,17,18]. Hadfield steel with the austenitic microstructure has high toughness and work hardening ability, but low initial hardness, leading to severe abrasive plowing. Moreover, as the surface layer of Hadfield steel could not be fully hardened, the advantages of the work hardening of it are not realized in low impact loads. Compared with Hadfield steel, martensitic steel has higher strength and hardness to resist abrasive plowing effectively, but it exhibits a low plasticity and toughness. In addition, some factors such as the grain size of prior austenite, heating temperature, and chemical composition may have an effect on the wear resistance of martensitic steels [19,20,21].
For improving the ductility of conventional martensitic steel, Speer designed a new heat treatment technology called the quenched-partitioned process (Q&P) [22]. The specific process is as follows, low alloy steel was produced by austenitizing above Ac3 temperature, then quenching to a temperature between the martensite start temperature (Ms) and martensite finish temperature (Mf), followed by partitioning treatment at this quenching temperature or above the Ms, while the steel was directly quenched to room temperature after austenitizing and followed by tempering treatment in Q&T process. This process of Q&P results in some retained austenite that can be preserved in room temperature and the microstructure containing martensite/bainite. While the microstructure containing martensite and the retained austenite in Q&T steel which was less than Q&P steel, the martensite with the BCC structure gives the material high strength and hardness. Compared to martensite, the retained austenite with the FCC structure and more slip systems improves the ductility of the material. Some research found that film-like retained austenite which is distributed between the martensite/bainite laths improved the toughness of Q&P steel and increased the wear hardening ability of Q&P steels [23]. Retained austenite will transform into martensite under a certain stress, accompanied with volume expansion, causing local stress relaxation, increasing the uniform deformation capacity and inhibiting the propagation of cracks before necking (TRIP effect) [24,25,26,27]. Q&P steel has high strength and elongation based on this two-phase microstructure. As a result, Q&P steel with higher hardness and toughness has the potential to become new wear-resistant material under abrasive wear and impact abrasive wear condition.
At present, research on the wear resistance of Q&P steel has been carried out, but mainly focus on the influence of heat treatment processes on wear properties [28,29]. For example, Kun Wang et al. found that the wear resistance of bainitic steel partitioned below Ms is better than that of bainitic steel partitioned above Ms [29]. Jun Lu et al. found that Q&P steel obtained optimum mechanical properties at the partitioning temperature of 400 °C and partitioning time of 25 min, Q&P steel has better wear resistance than Mn13Cr2 [28]. But there are few comparative studies about the wear resistance and microstructure evolution behavior of Q&P steel and martensitic steel under abrasive wear and impact abrasive wear tests.
Therefore, the wear behavior of Q&P steel and martensitic steel were investigated under both the abrasive wear and impact abrasive wear tests in this study. The microstructures of Q&P steel and martensitic steel were characterized by X-ray diffraction (XRD) analyses, electron backscattering diffraction (EBSD) analyses, and scanning electron microscopy (SEM) analyses, and the hardness and impact absorbed energy of the two types of steels were investigated by a micro-hardness tester and pendulum impact tester. Subsequently, the abrasive wear and impact abrasive wear tests were performed and the microstructures evolution behavior of the worn subsurface were characterized by SEM and EBSD.

2. Materials and Experiments

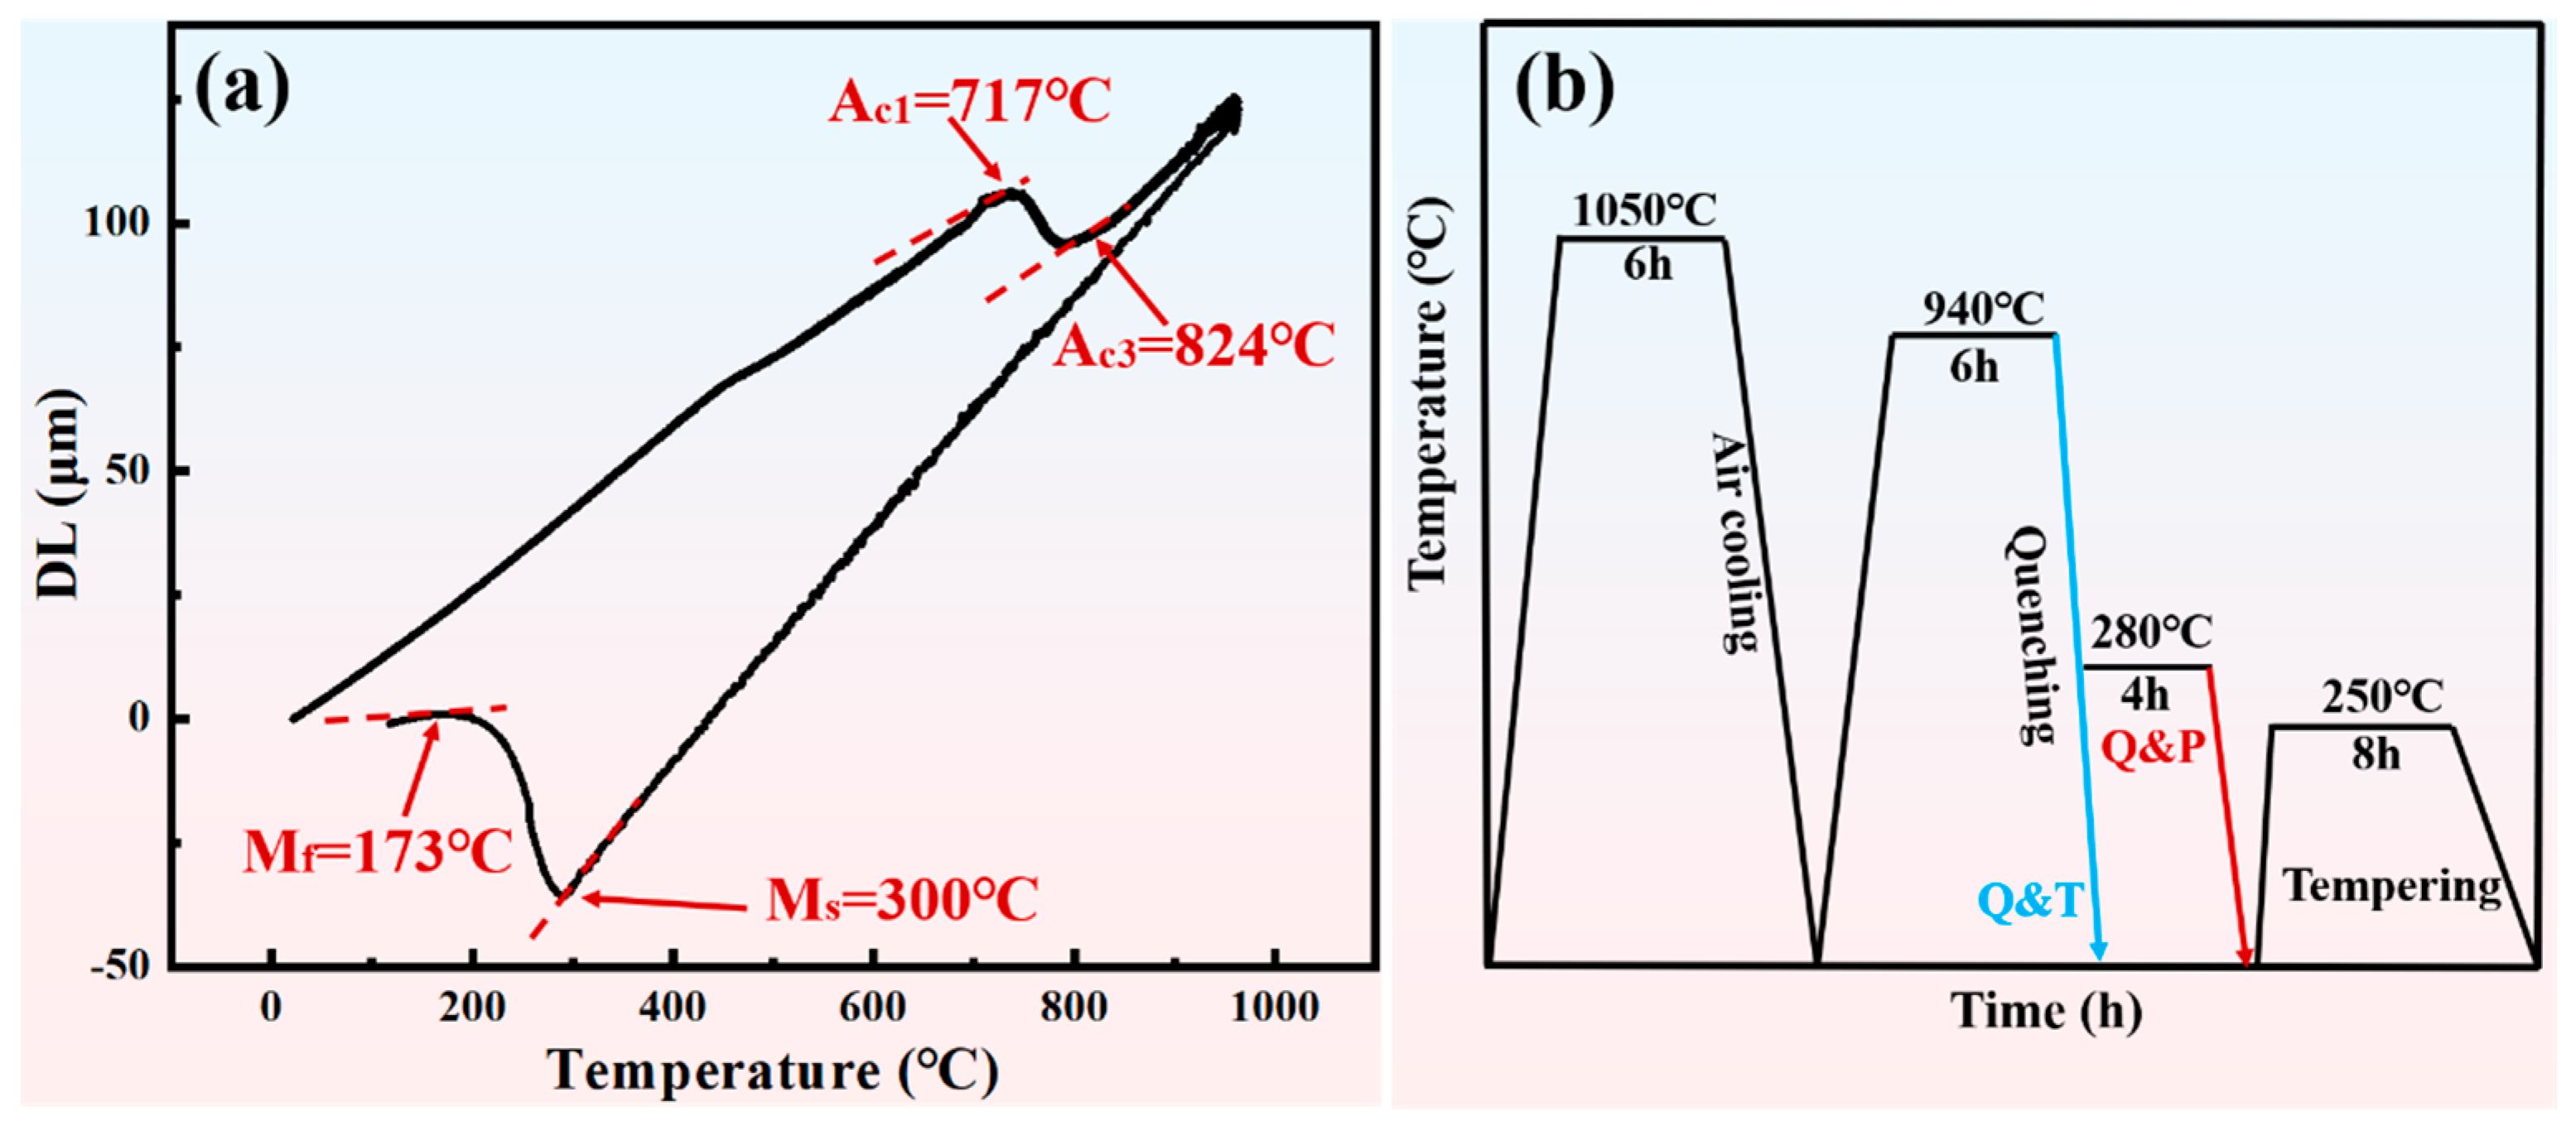
2.1. Materials Preparation

The steel of the experiment was melted in a medium-frequency induction furnace and then cast into 4.5 kg ingots in a factory. The chemical composition of the steel (wt%) is shown in Table 1. The phase transition temperature of the experimental steel was investigated using a Formaster-FII fully automated phase-transformation tester. The parameters were set as follows: The sample was heated to 950 °C at the rate of 0.2 K/s and held for 10 min, and then cooled to 30 °C at the rate of 20 K/s. A thermal expansion curve of the experimental steel is shown in Figure 1. The temperatures of the austenite transformation (Ac1 and Ac3) and the martensite transformation (Ms and Mf) are 717 °C, 824 °C, 300 °C, and 173 °C, respectively. The heat treatment processes are shown in Figure 2. The Q&P process consists of an austenitizing step (940 °C, 6 h) followed by a partitioning step (280 °C, 4 h) in a salt bath furnace to promote the diffusion of carbon, and then cooling to room temperature in air. Regarding Q&T steel, austenitizing was first carried out and then directly quenched in water to room temperature in order to obtain a martensite microstructure. In order to remove stress, all the samples were tempered (250 °C, 8 h).

2.2. Test Equipment

The volume percentage of retained austenite (RA) was measured by an X-ray diffractometer (XRD). The microstructure of the test steel was observed by an electron backscattered diffractometer (EBSD). The EBSD experiments were carried out with a field-emission scanning electron microscope (SEM) equipped with an EBSD accessory (voltage: 20 kV, scanning step: 0.1 μm). Impact toughness tests were conducted using Charpy V-notch samples (10 mm × 10 mm × 55 mm) on a 300 J impact testing machine. The hardness tests were performed by a microhardness tester (load: 50 gf, loading time: 15 s). Nanoindentation tests were performed to measure the nanomechanical properties of the samples after wear. These tests were performed in a fixed depth mode with the maximum depth of 1000 nm to obtain the variation curve of load. The loading rate was 0.1 mN/s, and the maximum value of the thermal drift rate was set to 0.1 nm to minimize the effects of thermal drift on results.

2.3. Wear Test

The abrasive wear tests were carried out using a friction tester (Rtec-MFT 5000, Rtec Instruments, San Jose, CA, USA) (Figure 2a). The grinding material was GCr15 grinding balls (diameter: 5 mm, hardness: 62 HRC), and the parameters of the abrasive wear tests were set as follows: load of 25 N, frequency of 10 Hz, and time of 30 min. The worn morphology was characterized by a three-dimensional profilometer mirror (America ADE MicroXAM-3D, Rtec Instruments, USA) and the wear volume was analyzed by Gwyddion software (Version 2.62). The wear tests were repeated three times for each group of specimens, and the average volume of the three experiments were taken as the wear volume.
Impact abrasive wear tests were performed using the MLD-10 type impact abrasion testing machine (Figure 2b). Among them, the upper specimen was a 10 mm × 10 mm × 30 mm test steel, where the specimen end face was concave (radius of 50 mm). The lower specimen was a smooth polished heat-treated 45# steel, with the outer and inner diameters of the ring cylinder at 50 mm and 30 mm, and the hardness of the ring cylinder at 50 HRC. The parameters of the impact abrasive wear tests were set as follows: impact load: 3 J; impact frequency: 150 times/min; lower specimen rotational speed: 150 r/min; total wear time: 150 min; the wear loss of the test specimens was weighed with a precision electronic balance for every 30 min, and the first wear loss was not counted.

3. Results

Figure 3 shows the microstructures of Q&P steel and Q&T steel. The microstructure of the Q&P steel consists of lath-like martensite/bainite, while the microstructure of the Q&T steel is entirely lath-like martensite (Figure 3b,e). As can be seen in Figure 3c,f, thin film-like retained austenite (blue) was observed in Q&P steel, and the width of the retained austenite was less than 350 nm, while only a few equiaxed retained austenite can be seen in the Q&T steel. In addition, the volume percentage of RA in Q&P steel and Q&T steel calculated by Image-pro software (Image Pro Plus 6.0) were 1.7% and 0.58%.
As shown in Figure 4, the stronger peaks of α-Fe with the BCC structure and the peaks of γ-Fe with the FCC structure can be observed in the XRD spectrums. From the comparison of the diffraction peaks in two steels, it can be seen that the percentage of the FCC phase in Q&P steel was higher than Q&T steel. In Q&P steel, the volume percentage of RA was 10.42% calculated by Equation (1) [30], and the volume percentage of martensite was 19.75% calculated by Equation (2) [31], so the volume percentage of bainitic was 69.83%, while the volume percentage of RA was less than 3% in Q&T steel and the rest of the microstructure was all martensite. From Figure 4b, it can be seen that the retained austenite peak of the Q&P steel is shifted more to the left compared to the peak of the Q&T steel, due to C atoms diffusing into the RA in the process of partitioning. Lattice distortions were caused by the diffusion of C atoms, the increased lattice spacing caused the decrease in the diffraction angle.
f γ = 1 1 + I α C γ I γ C α
f M = 1 e ( 0.01 × 1.1 × ( M s T ) )
Figure 5 shows the Vickers hardness and impact absorbed energy values of the Q&P steel and Q&T steel. Figure 5a shows that the Vickers hardness of Q&P steel and Q&T steel were 465 HV and 523 HV, which means the hardness of Q&T steel increased 12.5% compared to Q&P steel. Figure 5b shows that the impact absorbed energy of Q&P steel and Q&T steel are 32.2 J and 13.1 J, so that the impact absorbed energy of Q&T steel decreased by 59.3% in comparison with Q&P steel. Due to the reduction in martensite, the hardness value of Q&P steel was lower than Q&T steel. However, the presence of retained austenite in Q&P steel results in a greater increase in toughness compared to Q&T steel. As shown in Figure 5c,d, a large number of dimples can be observed on the surface of impact fracture about Q&P steel, but a tearing prong can be observed on the surface of impact fracture about Q&T steel without dimples.
Figure 6 shows the volume loss and wear loss of Q&P steel and Q&T steel. Under the abrasive wear test, the volume losses of Q&P steel and Q&T steel are 1.24 × 107 μm3 and 0.97 × 107 μm3, respectively (Figure 6a). Q&T steel exhibits better wear resistance under the abrasive wear test due to its higher hardness, its wear resistance increased by 21.8% compared to Q&P steel. Moreover, the wear loss of Q&P steel and Q&T steel under the impact abrasive wear test was shown in Figure 6b. The wear loss of Q&P steel was 178.7 mg, the wear loss of Q&T steel was 265.7 mg which increased by 48.7% compared to Q&P steel. This indicates that Q&P steel has better wear resistance than Q&T steel under the impact abrasive wear test.
Figure 7 shows the wear morphology of Q&P steel and Q&T steel. As shown in Figure 7a,b, significant differences can be observed in the wear morphology of Q&P steel and Q&T steel under the abrasive wear test. Many grooves with the width of 7–11 μm and the length in the tens of micrometers can be observed on the worn surface of Q&P steel. In addition, several short microcracks with lengths of 3–8 μm can be seen on the worn surface. Thus, ploughing was the main wear mechanism of Q&P steel under the abrasive wear test, accompanied with a small amount of fatigue spalling. Compared to Q&P steel, the worn surface of Q&T steel was much smoother, only slight wear marks can be observed. Grooves in the tens of micrometers lengths can be seen on the worn surface but the depth of the grooves was lighter compared to Q&P steel. In addition, a few micro-cuttings can also be observed in the Q&T steel. Therefore, Q&T steel was subject to slighter ploughing under the abrasive wear test. In the impact abrasive wear test (Figure 7c,d), grooves with the width of ~16 μm were observed on the worn surface of Q&P steel. The material of the Q&P steel produced plastic deformation and was piled up on both sides of the grooves but was difficult to peel off due to the presence of RA improving the toughness of Q&P steel. As a result, the wear loss of Q&P steel was reduced. Laminar fatigue spalling and long cracks can be seen on the worn surface of Q&T steel, indicating that it was subjected to severe fatigue spalling in the wear process.
Figure 8 shows the SEM images of the worn subsurface of the Q&P steel and Q&T steel without etching. Under the abrasive wear test, cracks were not observed on the worn subsurface of the Q&P steel and Q&T steel. Under the impact abrasive wear test, the cracks can be observed on the worn subsurface of Q&P steel and the length of fatigue cracks was ~9 μm. The cracks grew easily due to the materials being subjected to repeated impacts with high loads. Coarser cracks with a total length close to 30 μm can be seen on the worn subsurface of Q&T steel, which was not only expanding parallel to the worn surface, but also expanding in the depth direction.
Figure 9 shows the typical SEM morphology of the etched worn subsurface of Q&P steel and Q&T steel. The two steels have different degrees of deformation (between the red-yellow dotted lines) in the subsurface microstructure. Under the abrasive wear test, the degree of deformation of the Q&P steel increases as it approaches the worn surface, and the direction of the lath-like martensite/bainite within 3 μm of the worn surface was completely parallel to the wear direction (Figure 9a). But the subsurface microstructure of Q&T steel only exhibits slight deformation under the abrasive wear test (Figure 9b). Under the impact abrasive wear test, it can be seen that the degree of deformation of the subsurface microstructure was higher than the abrasive wear test due to the material was subjected to higher stress in Q&P steel (Figure 9c). The worn surface morphology was hollow due to the deformation of the material, and the microstructure was already completely parallel to the wear direction, lath-like martensite/bainite and the distances between them grew thinner. From the worn subsurface morphology of the Q&T steel in Figure 9d, the martensite has a certain extent of deformation, but the degree of deformation was obviously slighter in comparison with Q&P steel.
Figure 10 shows the nanoindentation curves of the deformation and matrix layer of the Q&P steel and Q&T steel. As shown in Table 2, the nanohardness of the matrix about Q&P steel and Q&T steel are 5.76 and 6.90 GPa, respectively. The nanohardness of the deformed layer of the Q&P and Q&T steels under the abrasive wear test are 7.14 and 7.32 GPa, respectively, which increased by 23.9% and 6.1% compared to matrix. Although Q&P steel has higher wear-hardening ability under the abrasive wear test, the nanohardness of the deformation layer was still lower than the nanohardness of the Q&T steel. Under the impact abrasive wear test, the nanohardness of the deformed layer of Q&P steel and Q&T steel were 8.55 and 8.14 GPa, respectively, which increased by 48.4% and 17.9% compared to the matrix. Q&P steel shows the best wear-hardening ability under the impact abrasive wear test.
In order to further analyze the microstructure evolution behavior of the Q&P steel in the subsurface layer, EBSD analysis was performed. As shown in the phase image in Figure 11b, the microstructure in the deformed layer (between the red-yellow dotted lines) only had the BCC structure (gray) and no retained austenite with FCC structure (blue) was observed, but film-like austenite can still be observed in the matrix. This suggests that retained austenite in deformed layer had already transformed into martensite under the effect of stress. From the grain boundary image in Figure 11c, lath-like martensite/bainite with misorientation larger than 9° (black) can be observed in both the matrix and deformed layer. Low-angle grain boundaries with a misorientation smaller than 3° (green), which were mainly distributed in deformed layer, can be observed in martensite/bainite. This indicates that finer grains were formed in the martensite on the worn subsurface.

4. Discussion

As shown in Figure 6, the wear resistance of the Q&T steel was better than that of the Q&P steel under the abrasive wear test, but under the impact abrasive wear test, the wear loss of Q&T steel was 48.7% higher compared to Q&P steel. Meanwhile, plowing was the main reason that caused material loss according to the SEM images of the worn surface in Figure 7. It is well known that the ability of materials to resist ploughing is directly proportional to their hardness. As shown in Figure 9, the subsurface microstructure of Q&P steel had larger deformation compared to Q&T steel under the impact abrasive wear test. The results showing that the hardness of the deformed layer has a greater increasement compared to the matrix in the Q&P steel, while the hardness of the deformed layer only has a smaller increment compared to the matrix in the Q&T steel, as shown in the nanoindentation test in Figure 10. Therefore, the wear loss of Q&P steel is lower than Q&T steel due to the hardness of the deformed layer of Q&P steel being higher than that of Q&T steel under the impact abrasive wear test. The improvement in the deformed layer hardness was related to the microstructure of deformed layer. Hereafter, the microstructure of deformed layer was discussed.
Under the impact abrasive wear test, the Q&T steel was subjected to severe fatigue spalling as shown in Figure 7. Moreover, cracks with a total length close to 30 μm can be observed in Q&T steel shown in Figure 8. The microstructure difference between the deformed layer and the matrix layer caused that the mechanical properties such as hardness and toughness to be different, resulting in deformation incongruity between the deformed layer and the matrix. As a result, cracks will nucleate and propagate at the interface of the deformation layer and the matrix layer. In addition, cracks in the Q&T steel were larger than those of the Q&P steel due to the retained austenite in Q&P steel was much more than Q&T steel. Retained austenite could improve the toughness and inhibit the propagation of cracks during it transform into martensite. Therefore, Q&P steel has better resistance to crack nucleation and expansion compared to Q&T steel. As a result, less material loss is caused by fatigue spalling in Q&P steel.
As shown in Figure 11b, the retained austenite content in the subsurface layer is much lower than the matrix, as it is transformed into martensite by the TRIP effect during the wear process. The newly formed martensite phase was harder than austenite, thus increasing the hardness of the worn surface [32]. In addition, it can be seen in Figure 11c that a large number of low-angle grain boundaries were generated in the BCC structural lath bundles in the worn subsurface layer. Therefore, it can be inferred that finer grains were formed in the worn subsurface layer and thus improving the hardness of the worn subsurface layer as the hardness of material will increase with the decreasing grain size.

5. Conclusions

In the present work, the differences in the microstructure and properties between the quenched-partitioned steel (Q&P) and tempered martensitic steel (Q&T) were investigated, the wear behavior under the abrasive wear and impact abrasive wear tests were studied by XRD, EBSD, and SEM, and the following conclusions were obtained:
(1)
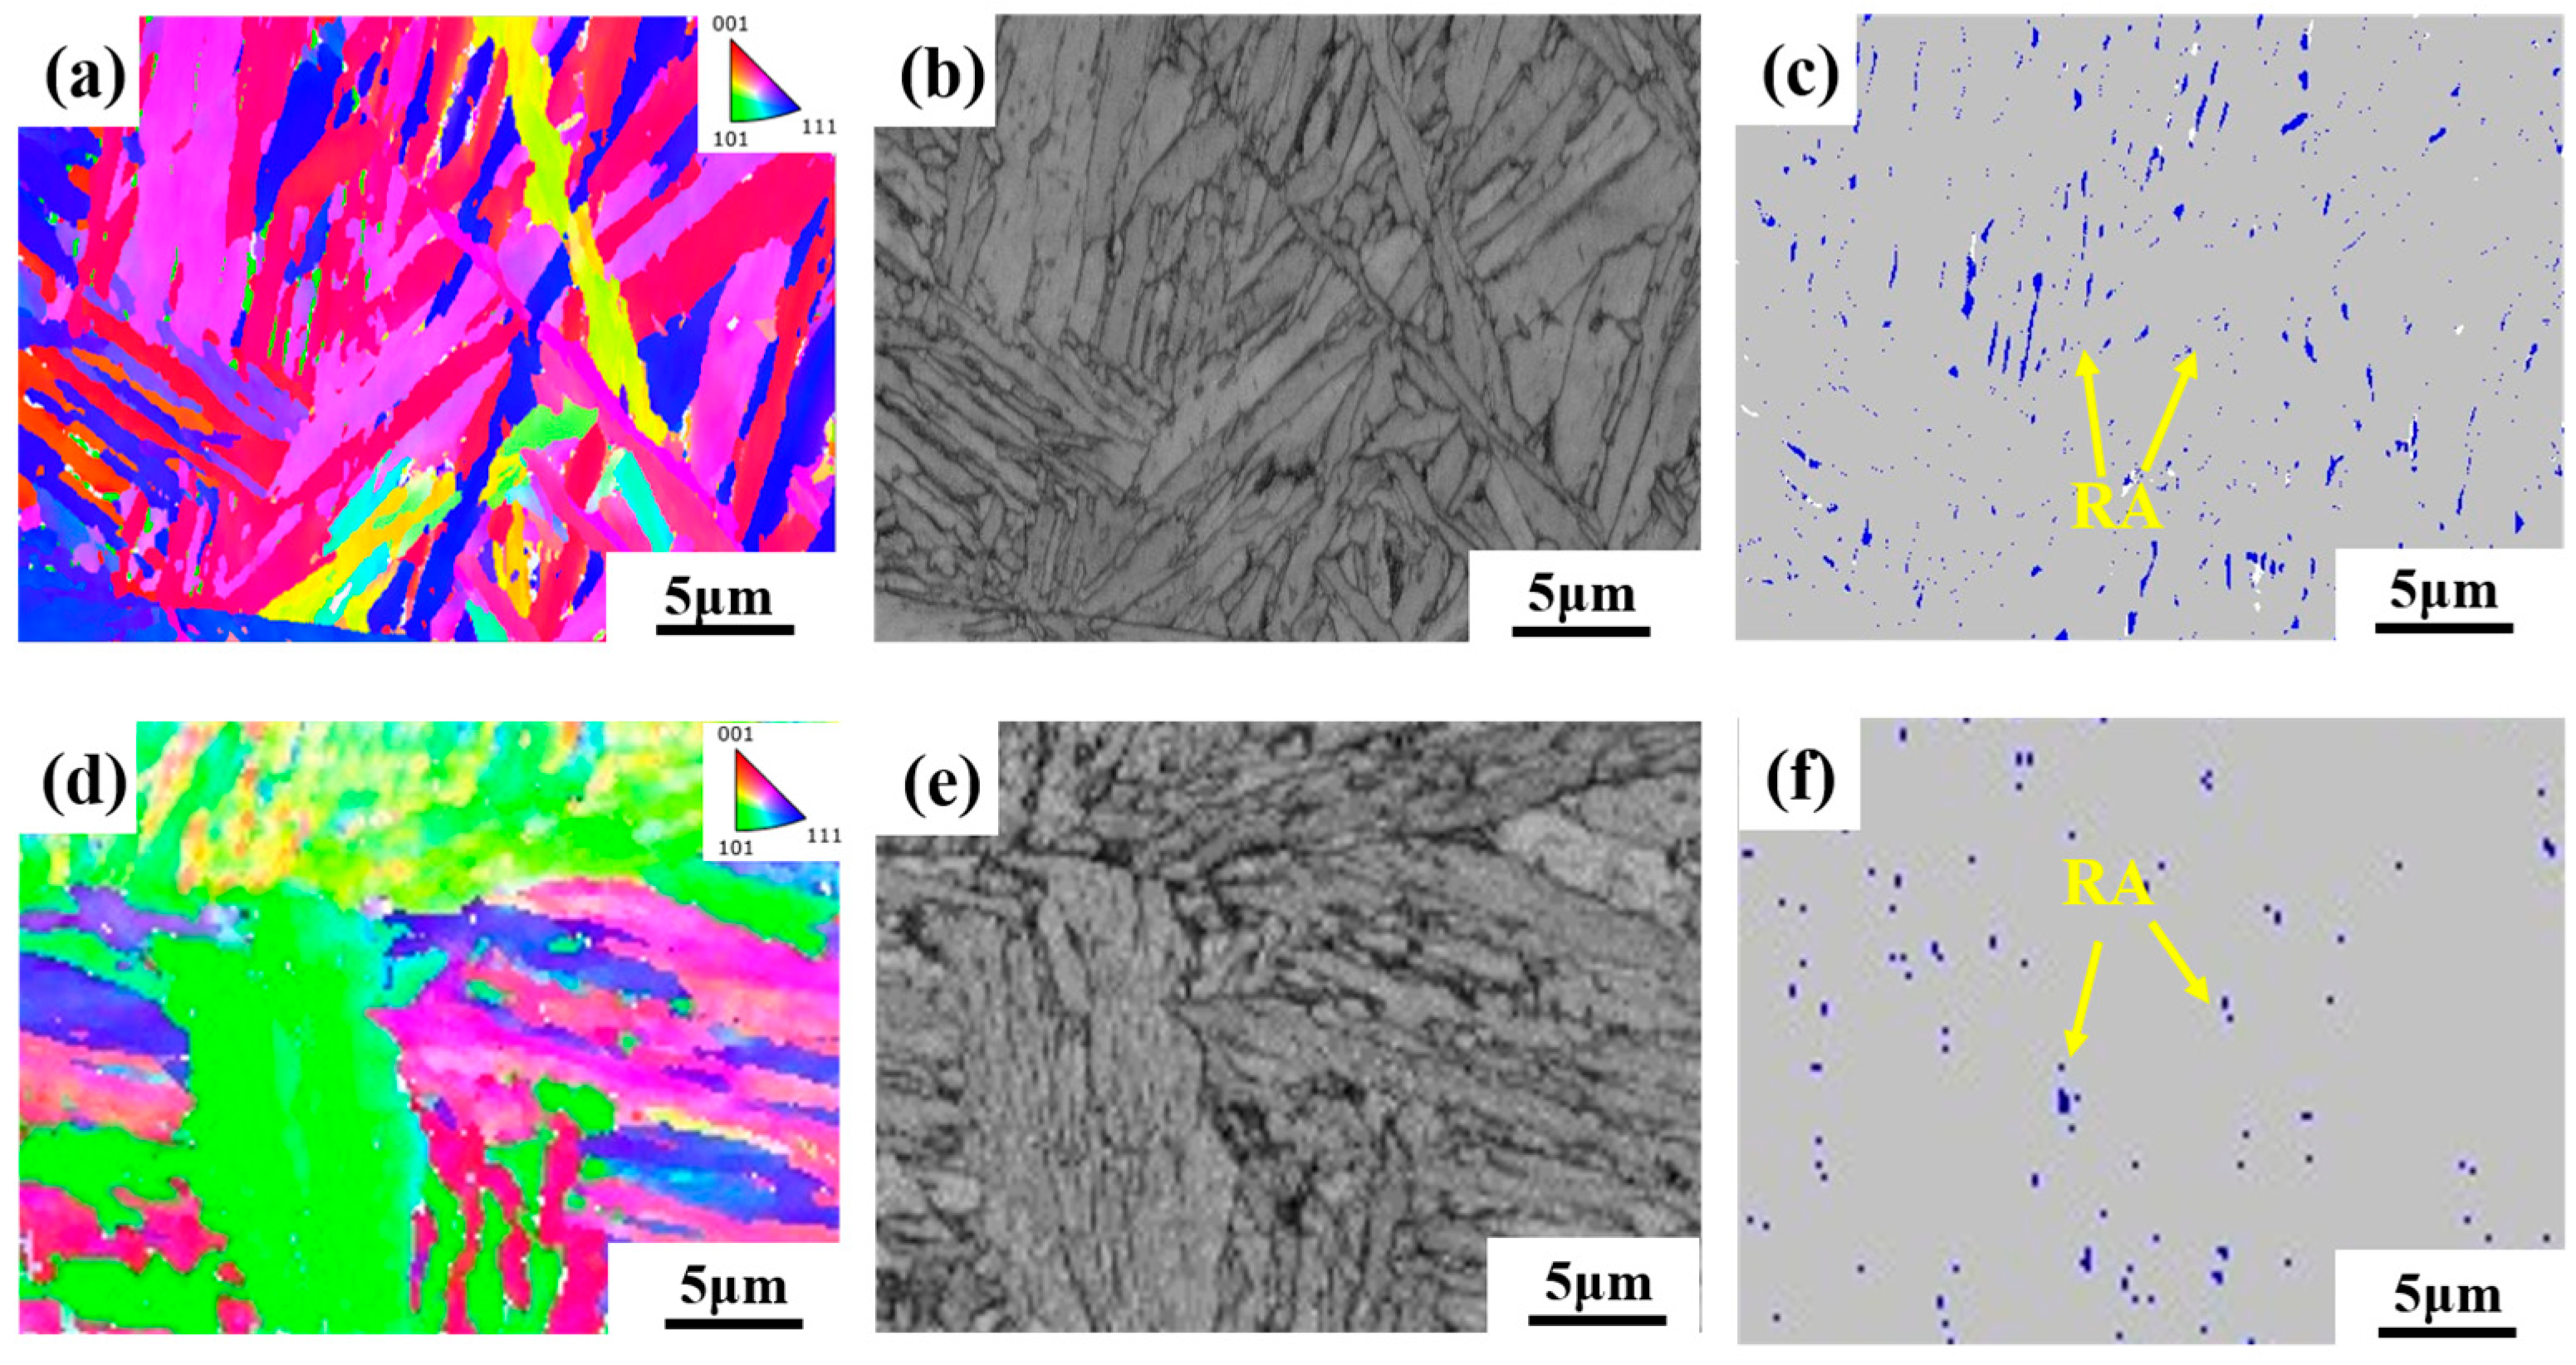
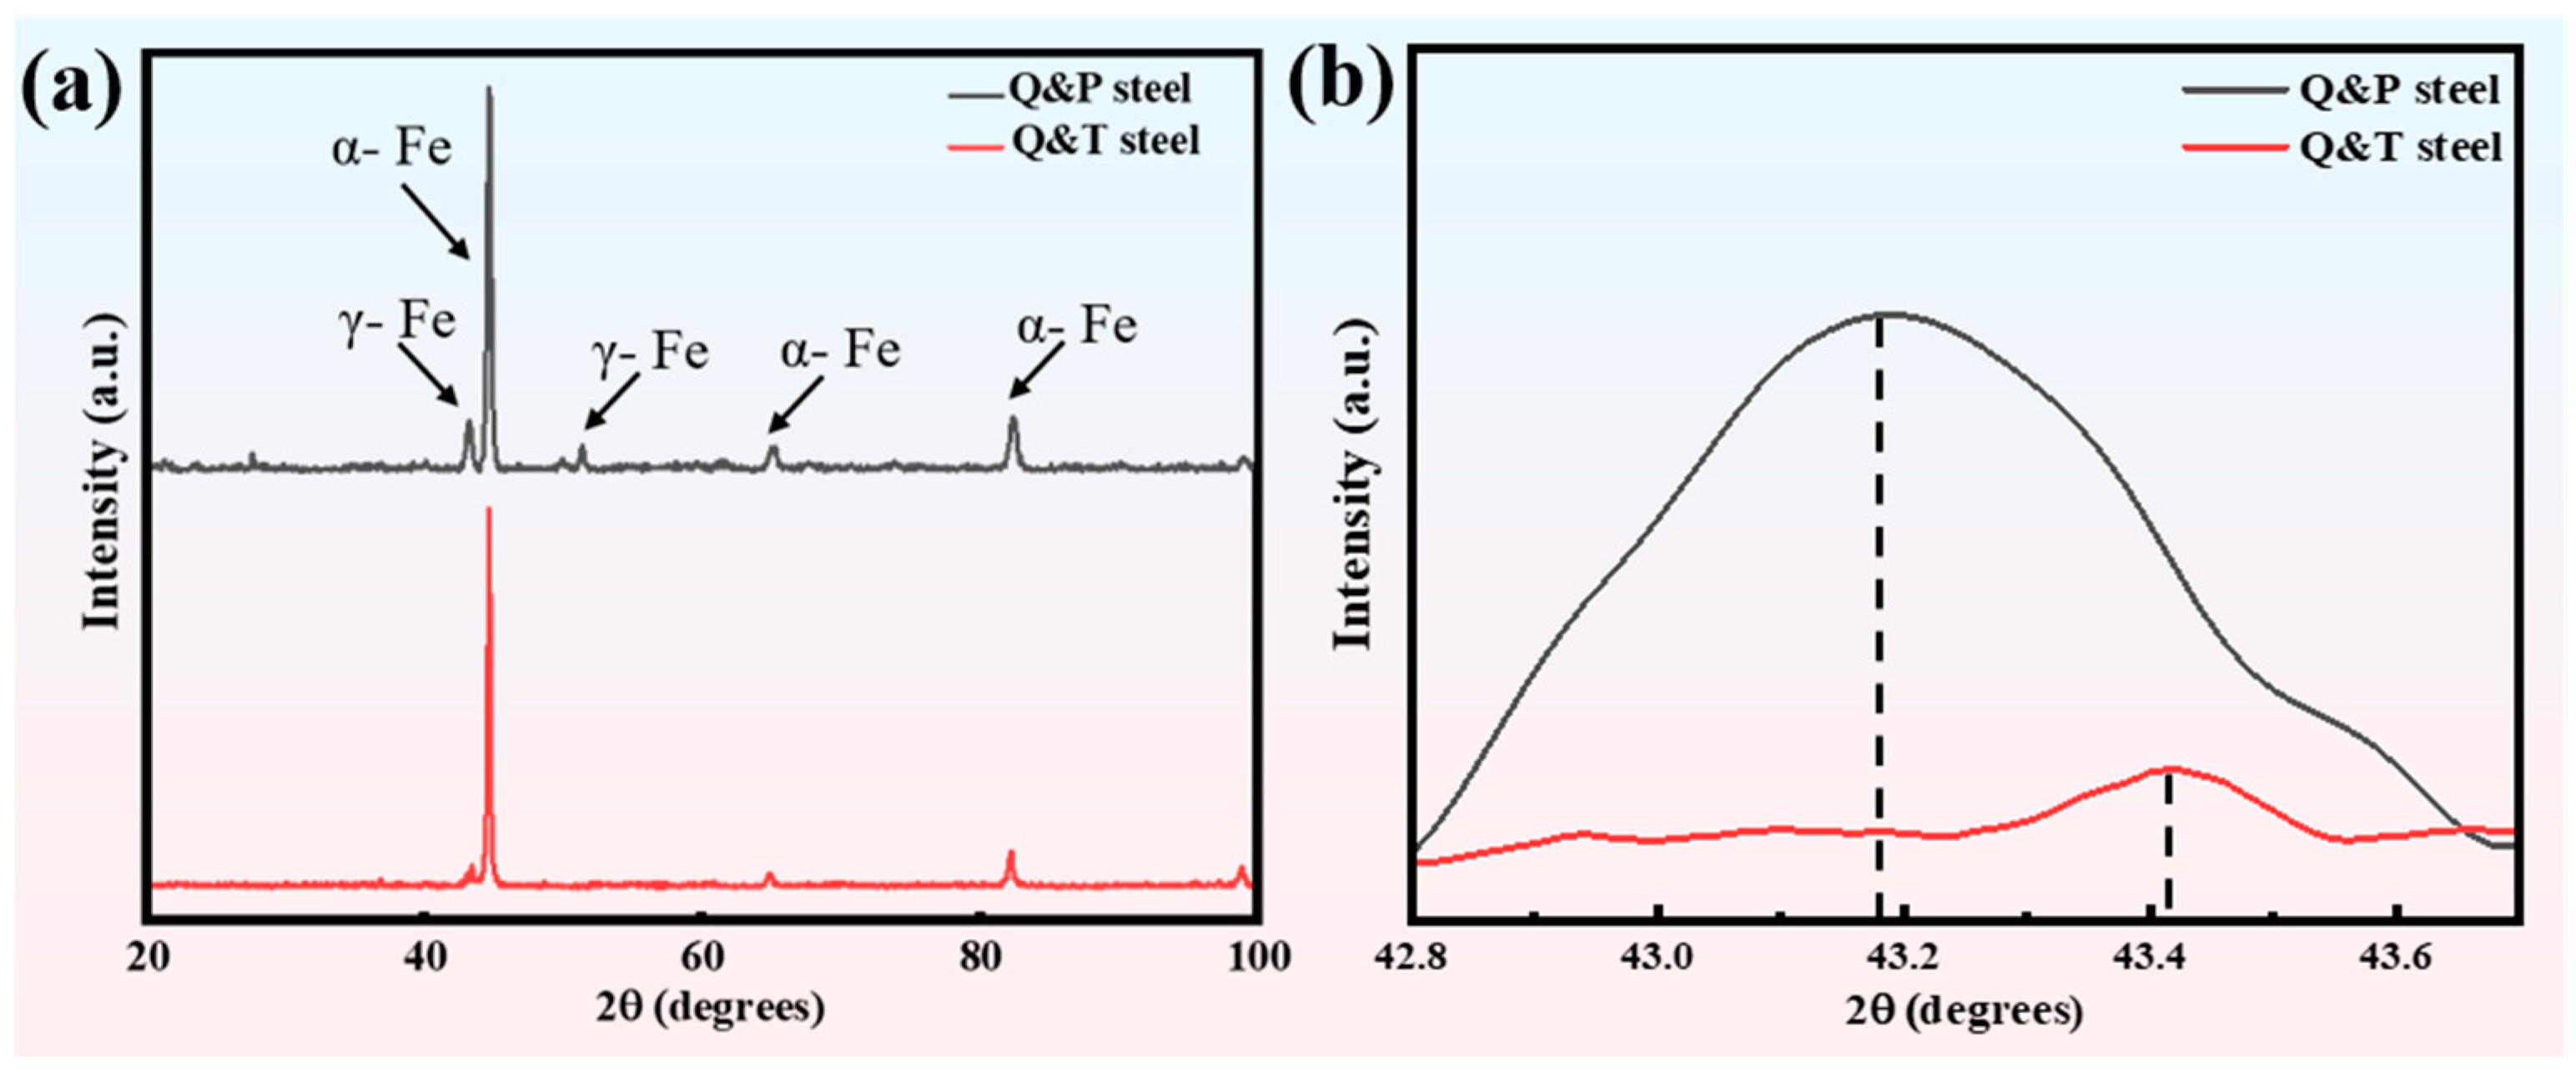
The microstructure of Q&P steel contains lath-like martensite/bainite and film-like retained austenite, the volume percentage of RA was 10.42% calculated by the result of XRD, but the microstructure of Q&T steel consists almost of martensite, the retained austenite was barely observed.
(2)
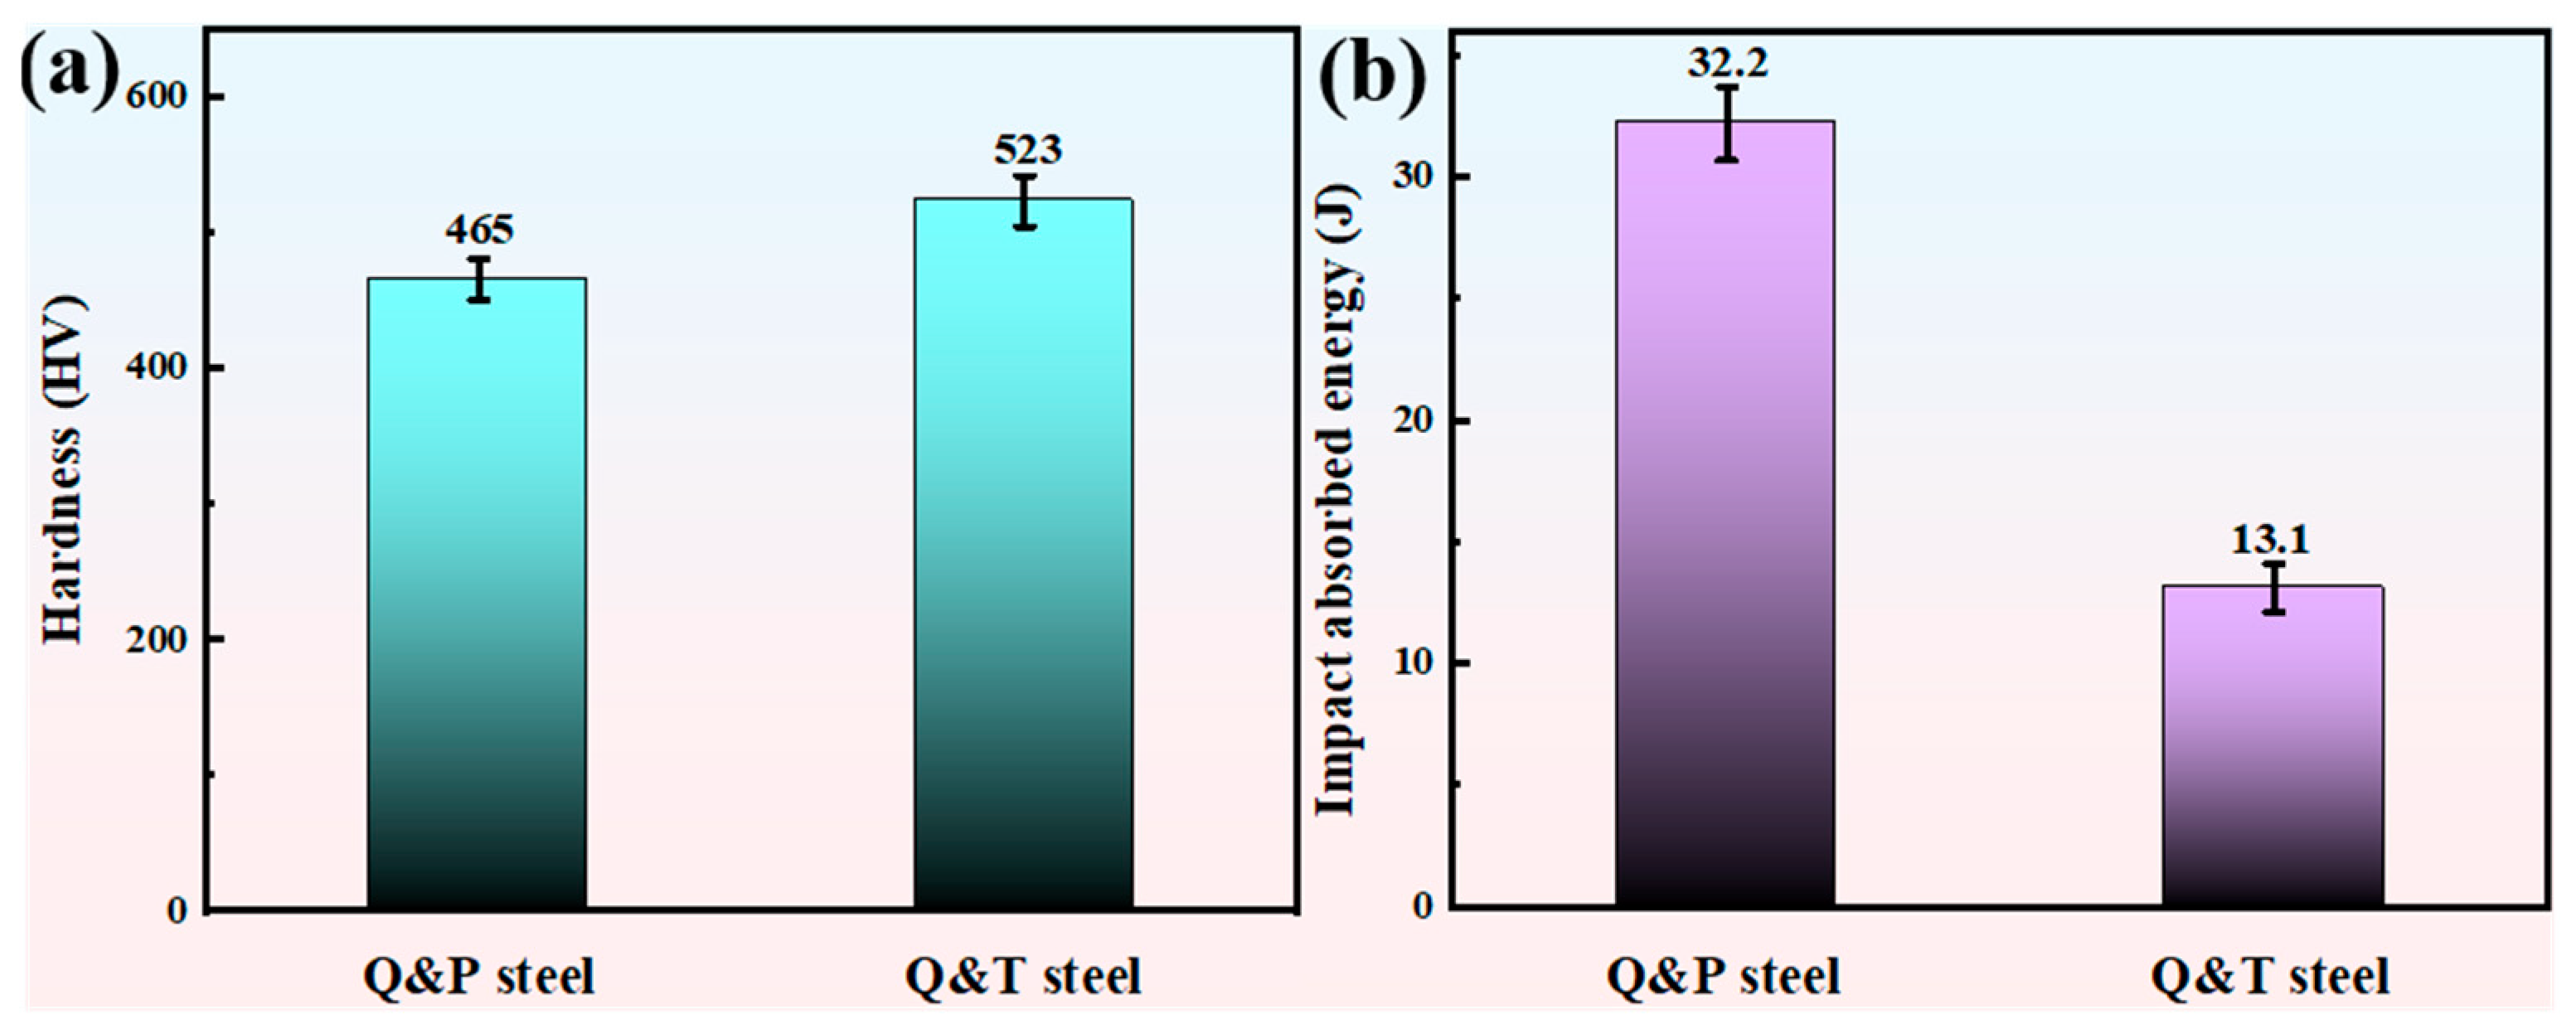
Q&P steel exhibits better toughness due to the thin film-like retained austenite. The impact absorbed energy of Q&P steel and Q&T steel are 32.2 J and 13.1 J. Compared to Q&P steel, the impact absorbed energy of Q&T steel reduced by 59.3%. The hardness of Q&P steel and Q&T steel are 465 HV and 523 HV. Compared to the Q&P steel, the hardness of Q&T steel improved by 12.5%.
(3)
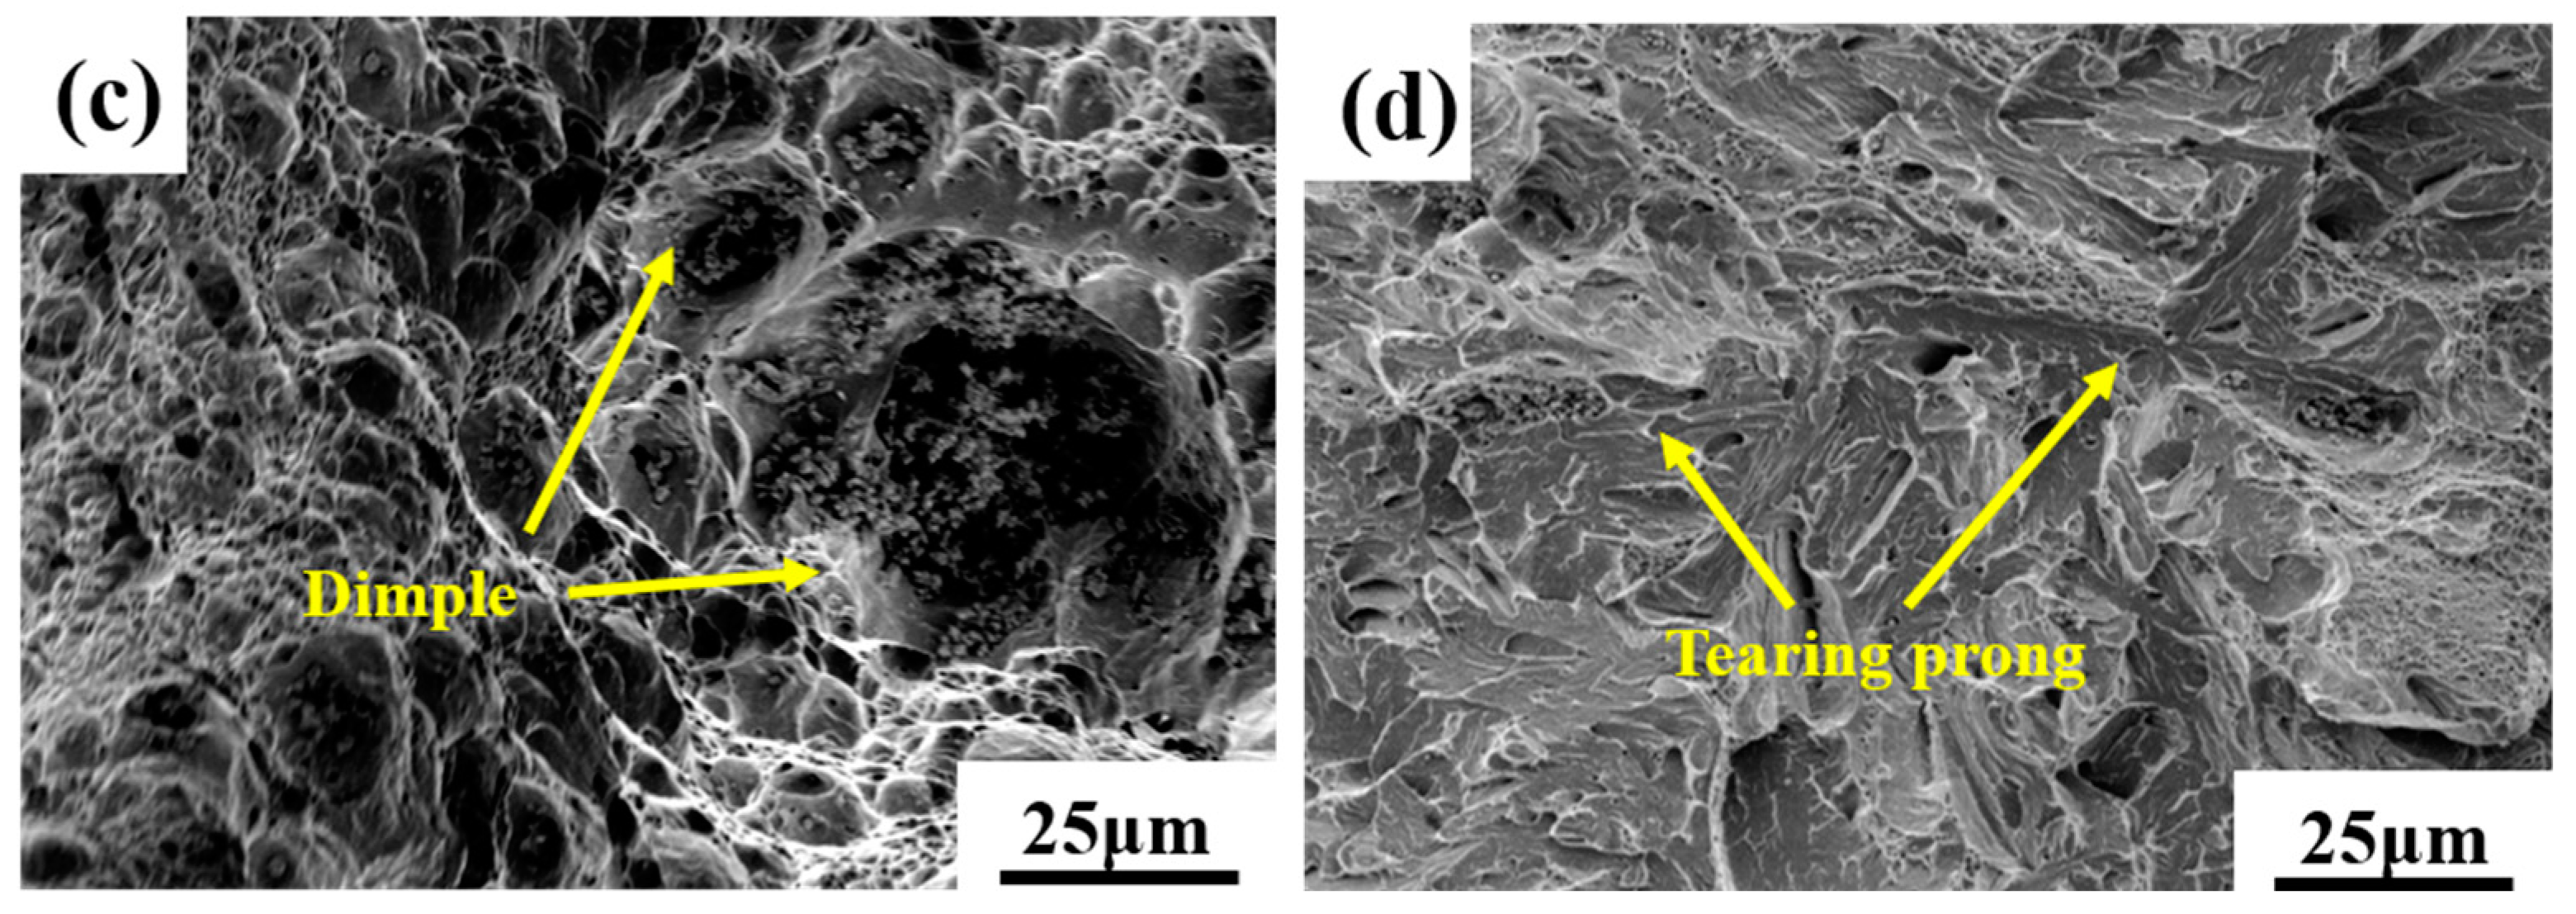
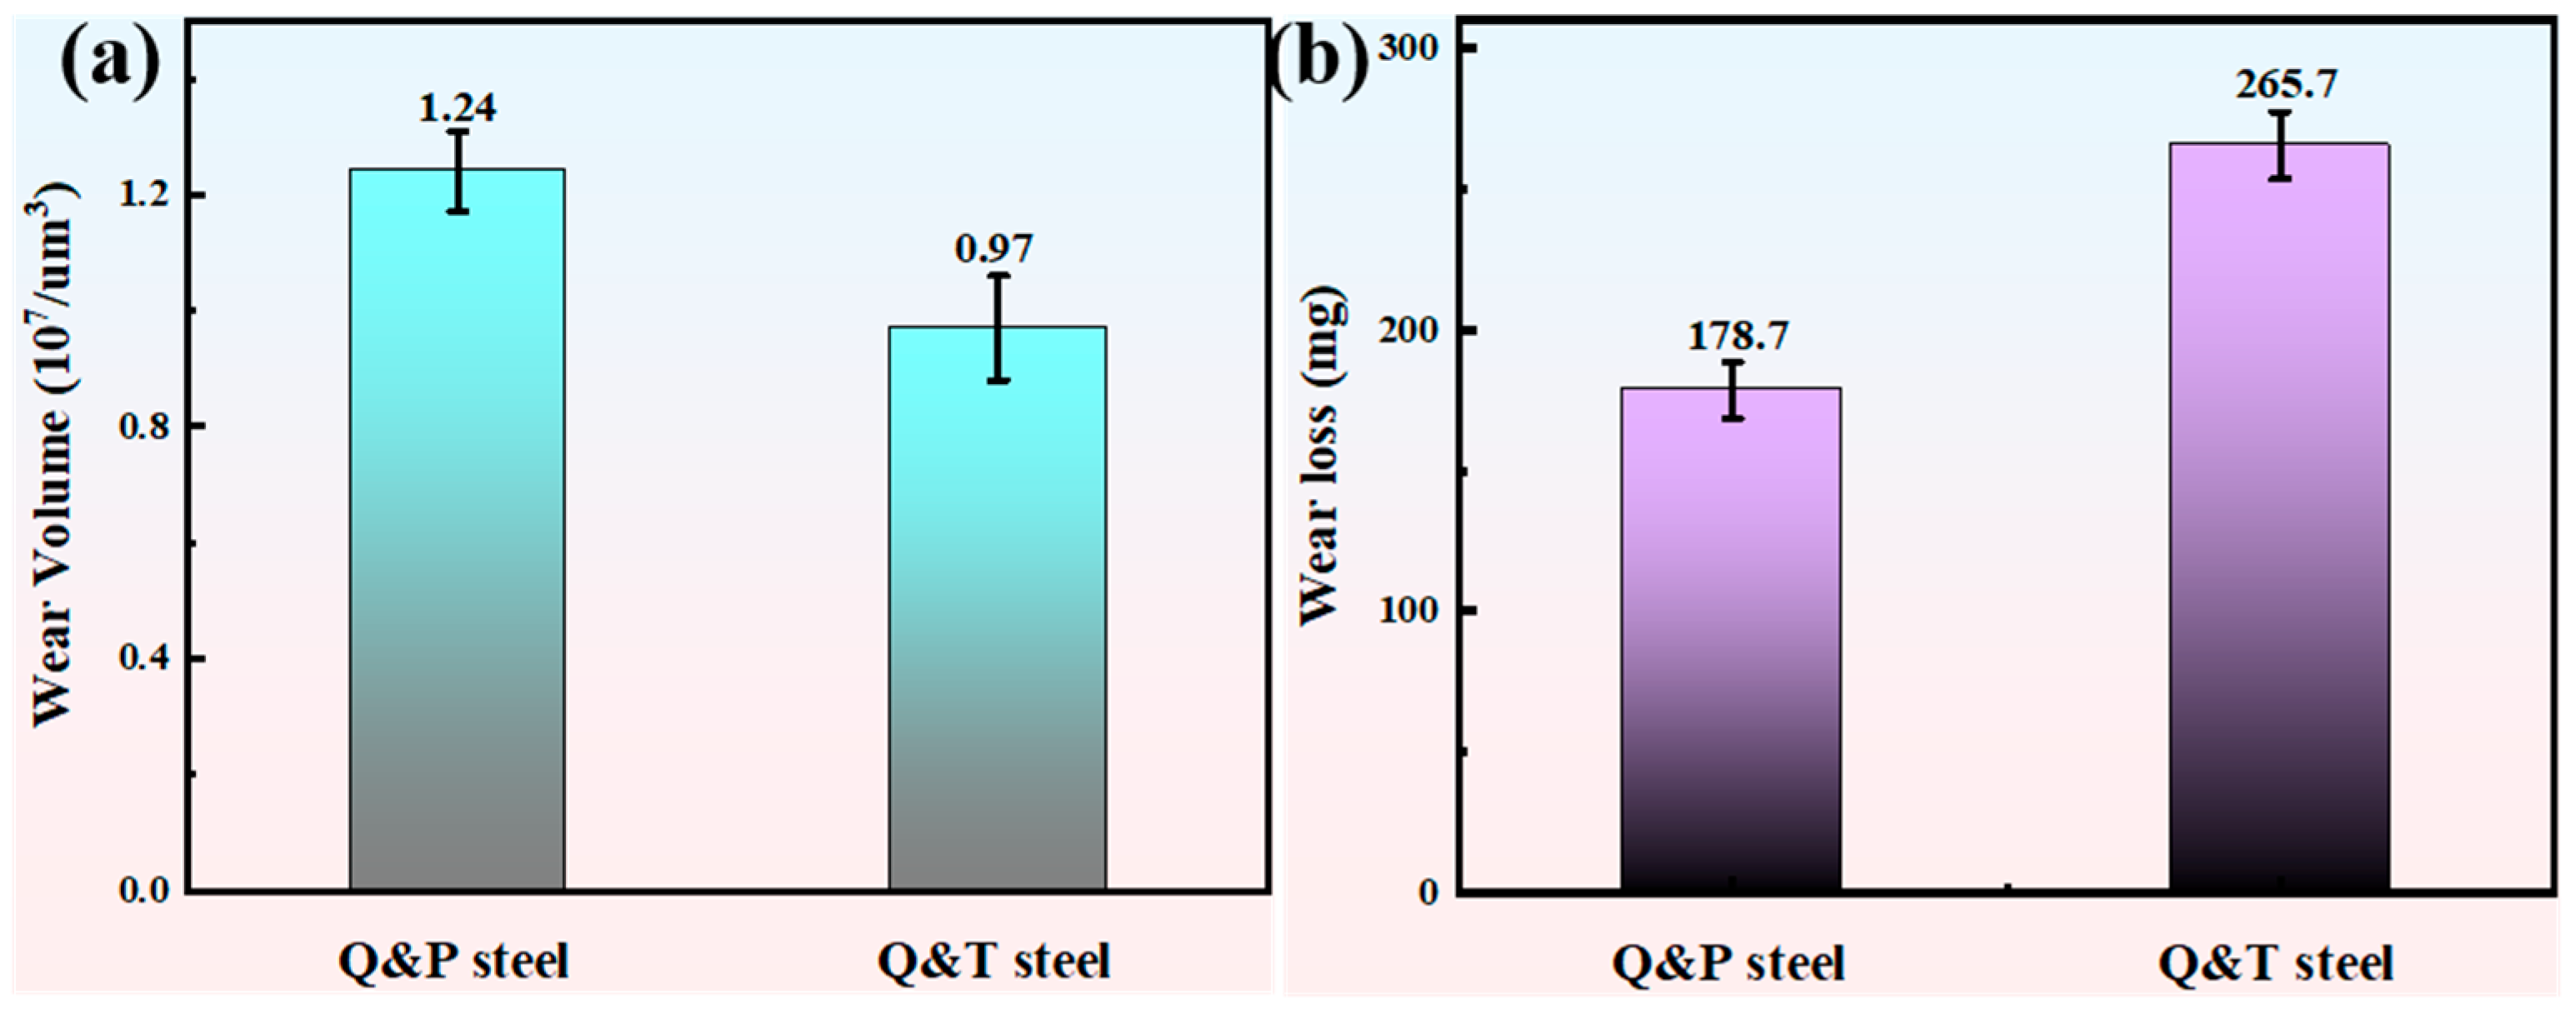
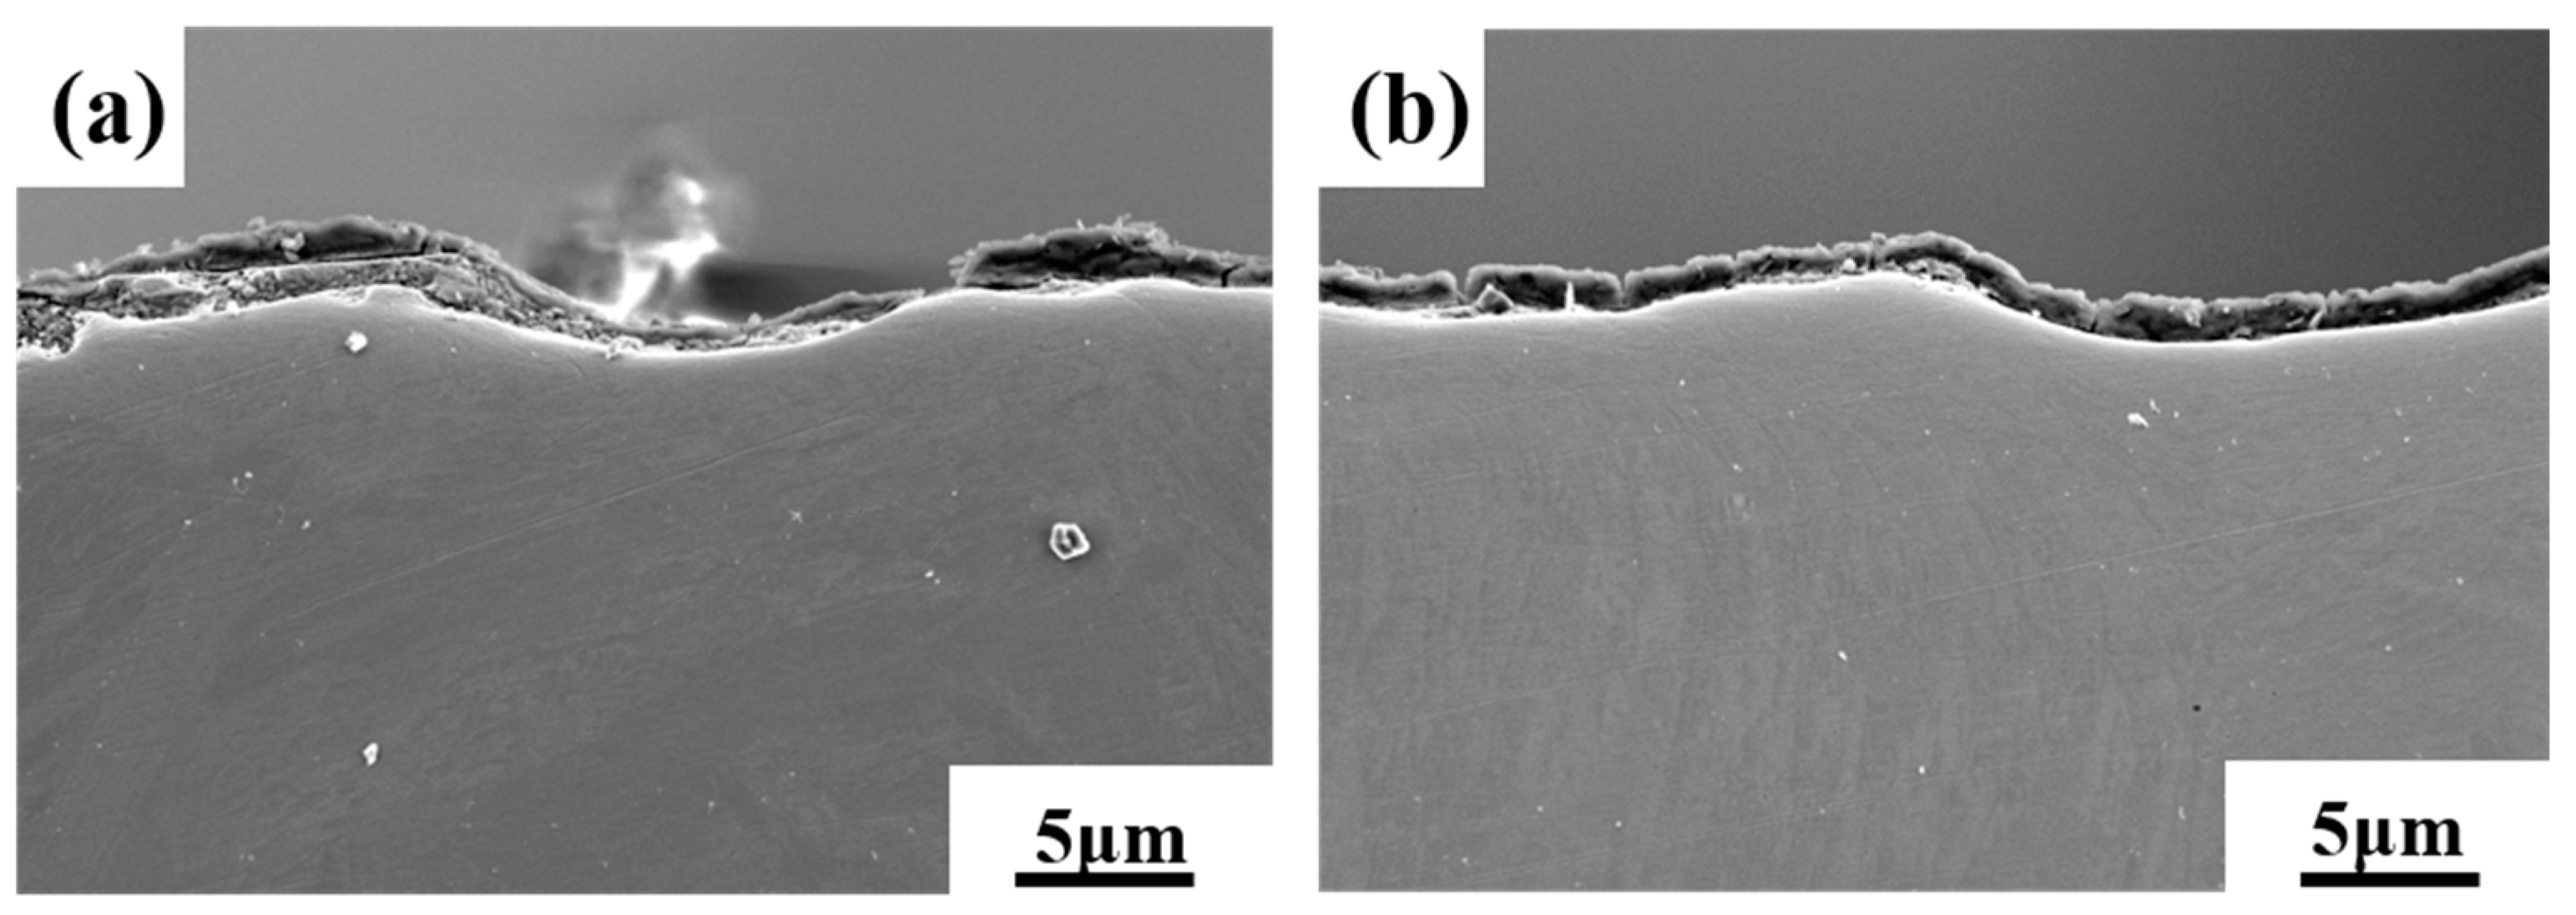
Under the abrasive wear test and impact abrasive wear test, the material loss of Q&P and Q&T steel was mainly caused by ploughing, while Q&T steel was subjected to severe fatigue spalling in impact abrasive wear test. The wear loss of Q&T steel was 21.8% lower compared to Q&P steel under the abrasive wear test. The wear loss of Q&T steel was 48.7% higher compared to Q&P steel under the impact abrasive wear test. Therefore, Q&P steel is the better selection of wear-resistance material under impact abrasive wear condition, such as semi-autogenous mill, while Q&T steel is more suitable for abrasive wear condition.
(4)
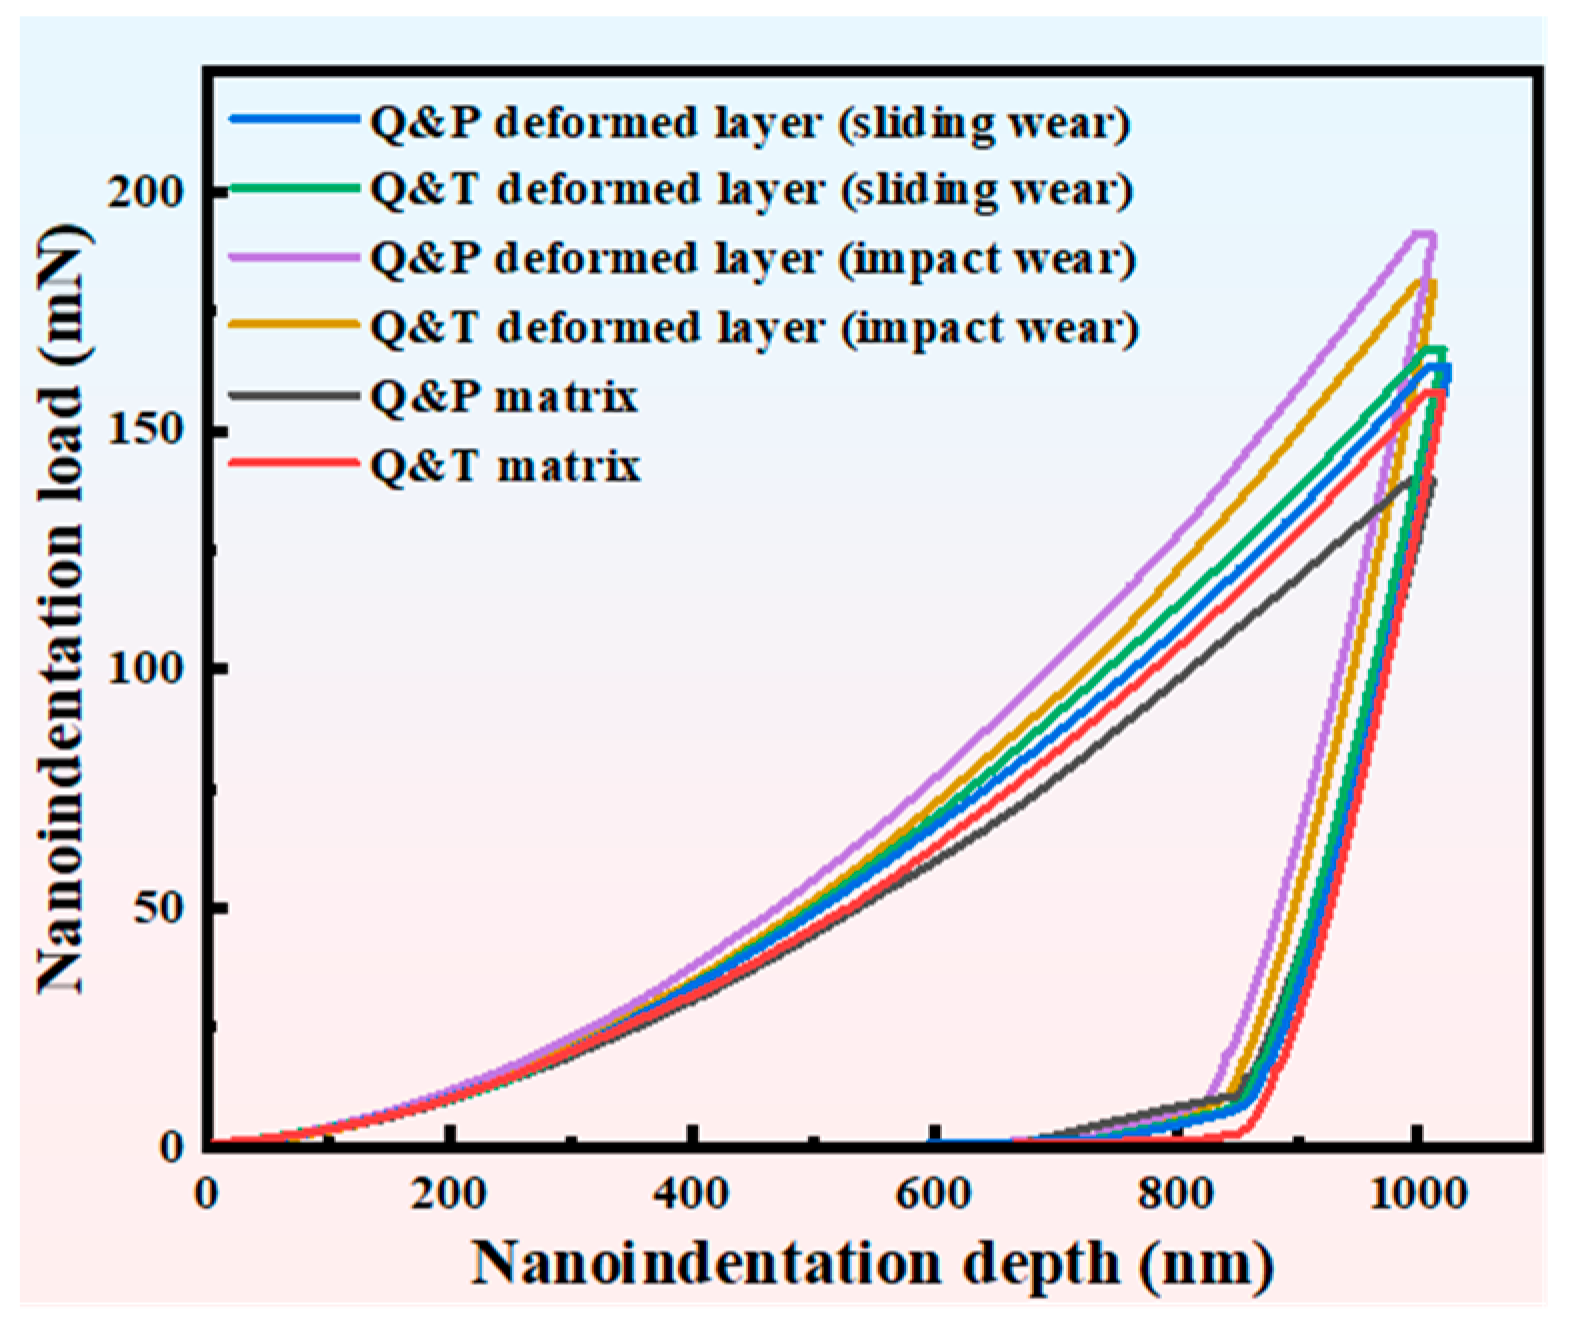
The RA transformed into martensite and finer grains were formed, thus improving the wear hardening ability of Q&P steel. In addition, RA inhibits the propagation of cracks. As a result, Q&P steel exhibited higher resistance to impact abrasive wear.

Author Contributions

Methodology, W.L.; Formal analysis, J.Z.; Investigation, J.L.; Writing—original draft, J.Z.; Writing—review & editing, J.L.; Visualization, J.Z.; Funding acquisition, W.L. All authors have read and agreed to the published version of the manuscript.

Funding

This work was supported by the National Key Research and Development Plan of China (No. 2023YFB3408200) and Guangdong Basic and Applied Basic Research Foundation (No. 2024A1515030004 and 2023A1515011579).

Institutional Review Board Statement

Not applicable.

Informed Consent Statement

Not applicable.

Data Availability Statement

Data are contained within the article.

Conflicts of Interest

The authors declare that they have no conflicts of interest to this work. We declare that we do not have any commercial or associative interest that represents a conflict of interest in connection with the work submitted.

References

  1. Roy, K.; Lau, H.H.; Fang, Z.Y.; Masood, R.; Ting, T.C.H.; Lim, J.B.P.; Lee, V.C.C. Effects of corrosion on the strength of self-drilling screw connections in cold-formed steel structures-experiments and finite element modeling. Structures 2022, 36, 1080–1096. [Google Scholar] [CrossRef]
  2. Feng, R.; Yang, F.M.; Shao, Y.B.; Roy, K.; Lim, J.; Chen, B.S. Experimental study on high-cycle fatigue behaviour of butt welds made of corroded AISI 304 stainless steel and Q460 high-strength steel. Structures 2024, 62, 18. [Google Scholar] [CrossRef]
  3. Feng, R.; Pan, J.D.; Zhang, J.Z.; Shao, Y.B.; Chen, B.S.; Fang, Z.Y.; Roy, K. Effects of corrosion morphology on the fatigue life of corroded Q235B and 42CrMo steels: Numerical modelling and proposed design rules. Structures 2023, 57, 11. [Google Scholar] [CrossRef]
  4. Trevisiol, C.; Jourani, A.; Bouvier, S. Effect of martensite volume fraction and abrasive particles size on friction and wear behaviour of a low alloy steel. Tribol. Int. 2017, 113, 411–425. [Google Scholar] [CrossRef]
  5. Liu, L.; He, B.B.; Cheng, G.J.; Yen, H.W.; Huang, M.X. Optimum properties of quenching and partitioning steels achieved by balancing fraction and stability of retained austenite. Scr. Mater. 2018, 150, 1–6. [Google Scholar] [CrossRef]
  6. Garmeh, B.; Kasiri-Asgarani, M.; Amini, K.; Ghayour, H. Analysis of hadfield scrap shredder hammer fracture and replacing it with carbide-free nano-bainitic steel. Eng. Fail. Anal. 2020, 109, 14. [Google Scholar] [CrossRef]
  7. Jia, Y.; Deng, X.T.; Wang, Q.; Li, C.R.; Wang, Z.D. Improvement of Mechanical Properties and Wear Resistance of Direct-Quenched Wear-Resistant Steel by Deformed Austenite. Steel Res. Int. 2023, 94, 11. [Google Scholar] [CrossRef]
  8. Chen, C.; Zhang, F.C.; Wang, F.; Liu, H.; Yu, B.D. Effect of N plus Cr alloying on the microstructures and tensile properties of Hadfield steel. Mater. Sci. Eng. A-Struct. Mater. Prop. Microstruct. Process. 2017, 679, 95–103. [Google Scholar] [CrossRef]
  9. Zhang, D.Y.; Li, Z.W.; Wang, L.P.; Kong, L.F.; Gao, F.; Wang, Q.D. Study on tribological properties of boronized and textured composite surface and its application on camshaft connecting-rod type hydraulic motor. Wear 2021, 482, 14. [Google Scholar] [CrossRef]
  10. Inoue, A.; Shen, B.L.; Koshiba, H.; Kato, H.; Yavari, A.R. Cobalt-based bulk glassy alloy with ultrahigh strength and soft magnetic properties. Nat. Mater. 2003, 2, 661–663. [Google Scholar] [CrossRef]
  11. Li, Z.B.; Yuan, Q.; Xu, S.P.; Zhou, Y.; Liu, S.; Xu, G. In Situ Observation of the Grain Growth Behavior and Martensitic Transformation of Supercooled Austenite in NM500 Wear-Resistant Steel at Different Quenching Temperatures. Materials 2023, 16, 3840. [Google Scholar] [CrossRef]
  12. Legendre, D.; Zevenhoven, R. Assessing the energy efficiency of a jaw crusher. Energy 2014, 74, 119–130. [Google Scholar] [CrossRef]
  13. Holmberg, K.; Kivikytö-Reponen, P.; Härkisaari, P.; Valtonen, K.; Erdemir, A. Global energy consumption due to friction and wear in the mining industry. Tribol. Int. 2017, 115, 116–139. [Google Scholar] [CrossRef]
  14. Tressia, G.; Sinatora, A. Effect of the normal load on the sliding wear behavior of Hadfield steels. Wear 2023, 520, 15. [Google Scholar] [CrossRef]
  15. Wang, R.; Zhang, W.; Zhang, F.; Fu, H.; Huang, Q.Y.; Wu, H.; Li, Z.L.; Shan, Q. The effect of RRA treatment on mechanical properties and wear behavior in vanadium micro-alloyed Hadfield’s steel. J. Mater. Res. Technol.-JMRT 2023, 24, 9884–9896. [Google Scholar] [CrossRef]
  16. Teixeira, M.F.; Pacheco, J.T.; da Silva, L.J.; Rabelo, A.; Pereira, M.; Niño, C.E. Laser cladding of Metco 1040® (Fe-V-Mn-C) on Hadfield steel: Effect of processing parameters on microstructure and wear resistance. Opt. Laser Technol. 2021, 142, 11. [Google Scholar] [CrossRef]
  17. Gonzalez-Moran, A.K.; Naeem, M.; Hdz-García, H.M.; Granda-Gutiérrez, E.E.; Ruíz-Mondragón, J.J.; Alvarez-Vera, M.; Díaz-Guillén, J.C. Improved mechanical and wear properties of H13 tool steel by nitrogen-expanded martensite using current-controlled plasma nitriding. J. Mater. Res. Technol.-JMRT 2023, 25, 4139–4153. [Google Scholar] [CrossRef]
  18. Penfornis, C.; Jourani, A.; Mazeran, P.E. Experimental and modelling study of the effect of martensite volume fraction on friction and wear of dual-phase steel at microscopic scale. Wear 2021, 484, 203878. [Google Scholar] [CrossRef]
  19. Haiko, O.; Javaheri, V.; Valtonen, K.; Kaijalainen, A.; Hannula, J.; Kömi, J. Effect of prior austenite grain size on the abrasive wear resistance of ultra-high strength martensitic steels. Wear 2020, 454, 13. [Google Scholar] [CrossRef]
  20. Javaheri, V.; Haiko, O.; Sadeghpour, S.; Valtonen, K.; Kömi, J.; Porter, D. On the role of grain size on slurry erosion behavior of a novel medium-carbon, low-alloy pipeline steel after induction hardening. Wear 2021, 476, 15. [Google Scholar] [CrossRef]
  21. Ojala, N.; Valtonen, K.; Heino, V.; Kallio, M.; Aaltonen, J.; Siitonen, P.; Kuokkala, V.T. Effects of composition and microstructure on the abrasive wear performance of quenched wear resistant steels. Wear 2014, 317, 225–232. [Google Scholar] [CrossRef]
  22. Speer, J.; Matlock, D.K.; De Cooman, B.C.; Schroth, J.G. Carbon partitioning into austenite after martensite transformation. Acta Mater. 2003, 51, 2611–2622. [Google Scholar] [CrossRef]
  23. Zhang, S.; Findley, K.O. Quantitative assessment of the effects of microstructure on the stability of retained austenite in TRIP steels. Acta Mater. 2013, 61, 1895–1903. [Google Scholar] [CrossRef]
  24. Dong, H.Y.; Wu, K.M.; Wang, X.L.; Hou, T.P.; Yan, R. A comparative study on the three-body abrasive wear performance of Q&P processing and low-temperature bainitic transformation for a medium-carbon dual-phase steel. Wear 2018, 402, 21–29. [Google Scholar]
  25. Leiro, A.; Vuorinen, E.; Sundin, K.G.; Prakash, B.; Sourmail, T.; Smanio, V.; Caballero, F.G.; Garcia-Mateo, C.; Elvira, R. Wear of nano-structured carbide-free bainitic steels under dry rolling-sliding conditions. Wear 2013, 298, 42–47. [Google Scholar] [CrossRef]
  26. Liu, J.; Deng, X.T.; Huang, L.; Wang, Z.D. Friction and wear behavior of nano/ultrafine-grained and heterogeneous ultrafine-grained 18Cr-8Ni austenitic stainless steels. Tribol. Int. 2020, 152, 11. [Google Scholar] [CrossRef]
  27. Luo, L.B.; Li, W.; Liu, S.L.; Wang, L.; Jin, X.J. Effect of intermediate temperature annealing on the stability of retained austenite and mechanical properties of medium Mn-TRIP steel. Mater. Sci. Eng. A-Struct. Mater. Prop. Microstruct. Process. 2019, 742, 69–77. [Google Scholar] [CrossRef]
  28. Lu, J.; Yu, H.; Kang, P.; Duan, X.; Song, C. Study of microstructure, mechanical properties and impact-abrasive wear behavior of medium-carbon steel treated by quenching and partitioning (Q&P) process. Wear 2018, 414, 21–30. [Google Scholar]
  29. Wang, K.; Hu, F.; Zhou, S.B.; Zhou, W.; Zhang, Z.C.; Yershov, S.; Wu, K.M. Effect of microstructure transformation below MS temperature in bainitic steels on the impact-abrasive wear behavior. Wear 2023, 514, 14. [Google Scholar] [CrossRef]
  30. Jatczak, C.F.J.S.T. Retained austenite and its measurement by X-ray diffraction. SAE Trans. 1980, 89, 1657–1676. [Google Scholar]
  31. Hu, R.; Bai, G.H.; Li, J.S.; Zhang, J.Q.; Zhang, T.B.; Fu, H.Z. Precipitation behavior of grain boundary M23C6 and its effect on tensile properties of Ni-Cr-W based superalloy. Mater. Sci. Eng. A-Struct. Mater. Prop. Microstruct. Process. 2012, 548, 83–88. [Google Scholar] [CrossRef]
  32. Cui, J.J.; Chen, L.Q. Microstructures and Mechanical Properties of a Wear-Resistant Alloyed Ductile Iron Austempered at Various Temperatures. Metall. Mater. Trans. A-Phys. Metall. Mater. Sci. 2015, 46A, 3627–3634. [Google Scholar] [CrossRef]
Figure 1. (a) Thermal expansion curve and (b) schematic diagram of heat treatment process.
Coatings 14 00727 g001
Figure 2. (a) Schematic diagram of Rtec-MFT 5000 multifunctional friction and wear tester; (b) Schematic diagram of the impact abrasive wear test device.
Coatings 14 00727 g002
Figure 3. IPF images of (a) Q&P steel, (d) Q&T steel; band contrast images of (b) Q&P steel, (e) Q&T steel; phase images of (c) Q&P steel, (f) Q&T steel.
Coatings 14 00727 g003
Figure 4. XRD patterns of the test steels: (a) 20° < 2θ < 100° and (b) 42.8° < 2θ < 43.7°.
Coatings 14 00727 g004
Figure 5. Test values of Q&P and Q&T steel (a) Vickers hardness and (b) impact absorbed energy, (c) impact fracture of Q&P steel, (d) impact fracture of Q&T steel.
Coatings 14 00727 g005aCoatings 14 00727 g005b
Figure 6. Abrasive wear test of (a) wear volume; impact abrasive wear test of (b) wear loss.
Coatings 14 00727 g006
Figure 7. Worn surface of abrasive wear test (a) Q&P steel, (b) Q&T steel; worn surface of impact abrasive wear test (c) Q&P steel, (d) Q&T steel.
Coatings 14 00727 g007
Figure 8. Without etching worn subsurface of abrasive wear test (a) Q&P steel, (b) Q&T steel; without etched worn subsurface of impact abrasive wear test (c) Q&P steel, (d) Q&T steel.
Coatings 14 00727 g008aCoatings 14 00727 g008b
Figure 9. Etched worn subsurface of abrasive wear test (a) Q&P steel, (b) Q&T steel; etched worn subsurface of impact abrasive wear test (c) Q&P steel, (d) Q&T steel.
Coatings 14 00727 g009
Figure 10. Typical inclination depth–load curves of the matrix and deformed layer.
Coatings 14 00727 g010
Figure 11. EBSD images of Q&P steel worn subsurface under impact abrasive wear test: (a) band contrast image, (b) phase image, (c) grain boundaries image.
Coatings 14 00727 g011
Table 1. Chemical compositions of the experimental steel (wt.%).
SpecimenCSiMnMoCrFe
steel0.31.780.980.111.13Bal
Table 2. Nano-hardness of matrix and deformed layer as well as the wear-hardening capacity.
SpecimensMatrix(AW)
Deformed Layer/(GPa)
(AW) Wear
Hardening Rate/(%)
(IAW)
Deformed Layer/(GPa)
(IAW) Wear
Hardening Rate/(%)
Q-P steel5.767.1423.98.5548.4
Q-T steel6.907.326.18.1417.9
Disclaimer/Publisher’s Note: The statements, opinions and data contained in all publications are solely those of the individual author(s) and contributor(s) and not of MDPI and/or the editor(s). MDPI and/or the editor(s) disclaim responsibility for any injury to people or property resulting from any ideas, methods, instructions or products referred to in the content.

