Article

Experimental Study on the Process of Submerged Arc Welding for Nickel-Based WC Flux-Cored Wire on Descaling Roll

1
College of Mechanical Engineering and Automation, University of Science and Technology Liaoning, Anshan 114051, China
2
State Key Laboratory of Powder Metallurgy, Central South University, Changsha 410083, China
*
Author to whom correspondence should be addressed.
These authors contributed equally to this work.
Coatings 2024, 14(6), 734; https://doi.org/10.3390/coatings14060734
Submission received: 9 May 2024 / Revised: 3 June 2024 / Accepted: 5 June 2024 / Published: 8 June 2024

Abstract

:
Descaling roll is a key component used to remove iron oxide on billet surface in hot rolling production lines, and its surface properties have a significant effect on the quality of hot rolling products. The descaling roll is in bad service condition and subjected to the dynamic impact caused by high-pressure water erosion and high temperature billet descaling process for a long time. Under the action of high temperature, strong wear, multi-cycle heat, force, flow and multi-field strong coupling, the surface is prone to wear and corrosion failure, which affects the continuous rolling production. Submerged arc welding provides an effective way to repair and strengthen the descaling roll surface. The content of WC hard phase has a significant effect on welding quality. At the same time, direct submerged arc welding of Ni based WC wire on the descaling roll surface is easy to cause cracks, and a gradient synergistic strengthening effect can be formed by setting the transition bottom layer in welding. At present, there is a lack of experiments related to the preparation of flux-cored wire with different contents and the overlaying for the bottom submerged arc welding. Relevant studies are urgently needed to further reveal the welding process mechanism to provide significant theoretical support for the preparation of wire materials and the improvement of welding quality. In this paper, 30% and 60% WC flux-cored wires were prepared by employing Ni-Cr-B-Si alloy powder as the base powder, and submerged arc welding tests were conducted on the descaling roll, preparing three welding layers, namely 70% NiCrBSi + 30% WC without the bottom layer, 70% NiCrBSi + 30% WC with the bottom layer, and 40% NiCrBSi + 60% WC with the bottom layer. The properties of the welding layer were evaluated by SEM, XRD, EDS, hardness, friction and wear, corrosion and impact experiments. The results show that the WC hard phase added in the filler metal has dissolved and formed a new phase with other elements in the melting pool. The surfacing layer mainly contains Fe-Ni, Cr-C, Fe3Si, Ni3C and other phases. The surfacing layer prepared by a different amount of WC flux-cored wire and the surfacing layer with or without the bottom layer have great differences in microstructure and properties. This study lays a significant theoretical foundation for optimizing the submerged arc welding process and preparing welding materials for the descaling roll and has significant practical significance and application value.

1. Introduction

Descaling roll is a key component of steel rolling production, which is prone to wear and corrosion failure due to high pressure water erosion, billet dynamic impact and high temperature wear for a long time [1,2]. It is necessary to build a protective layer on the descaling roll surface for strengthening treatment to improve the service life for the descaling roll to meet the needs of low cost and high-quality rolling production [3,4]. Submerged arc surfacing of flux-cored wire is one of the strengthening technologies widely used in roll remanufacturing, and its working principles are shown in Figure 1. By using the arc heat source, the alloy with excellent properties is coated on the welded substrate surface, which can achieve a large repair and an excellent surface strengthening effect. Compared with other surface technologies, submerged arc surfacing has the advantages of high automation, high production efficiency, high energy utilization rate and high current welding [5,6]. Due to the metallurgical combination for the surfacing layer and the substrate, the surfacing layer is not easy to peel off, and has an excellent adaptability to alternating stress conditions. Suitable surfacing materials can be selected according to different performance requirements such as wear resistance, corrosion resistance and high temperature resistance, and the process is largely flexible [7].
In 2013, Jan Vinas [8] analyzed the influence of key parameters with submerged arc surfacing welding on the life of continuous casting rolls, focusing on the influence of welding current, welding voltage, welding speed, current polarity, preheating temperature, interlayer temperature, preheating temperature and cooling conditions on the life of rolls. They discussed the process of repairing the roll surface failure and analyzed the influence of corrosion environment on the friction process. The results showed that Cr precipitates (M3C, M23C6, M7C3 and M3C2) have significant effects on the wear resistance of rolls. In 2020, Lochan Sharma [9] studied the influence of flux on improving the corrosion resistance of structural steel welds by changing the basicity of flux, and evaluated the corrosion resistance, tensile strength, impact strength and microhardness of submerged arc surfacing welds. The results showed that the tensile strength decreases and the impact strength and microhardness increase with an increase in alkalinity index. Compared with the substrate, the corrosion resistance of the weld is improved. In 2021, Sumit Saini [10] used recycled steel slag to produce submerged arc welding flux and studied the influence of flux on the surfacing layer. The results showed that the surfacing layer prepared by this flux had higher hardness and strength, and the cost was nearly 62% less than that of the same flux. In 2023, Zefang Chen [11] used EBSD, SEM, energy spectrum analysis, electrochemistry and other detection technologies to study the influence of multi-wire welding and single-wire welding on the microstructure and pitting resistance of 2205 duplex stainless steel submerged arc welding. The results showed that the welding efficiency of multi-wire welding doubled, the concentration of Ni in the weld and the proportion of austenite in the heat affected zone increased, the diffusion of main alloy elements (Cr, Mo, Ni, N) was promoted, and the welding mechanical properties and pitting resistance were improved. The traditional surfacing material has a limited strengthening effect on the descaling roll surface, and the surfacing layer is prone to surface failure due to short service life. A large number of scholars have carried out a variety of research on new surfacing materials. Nickel-based alloy powder has excellent wear resistance and corrosion resistance, and the comprehensive performance is great. WC is a hard phase commonly used in metal composite materials [12,13], WC powder has a high melting point, high hardness, excellent wear resistance, and great wettability with metal alloy. Therefore, it is feasible to use a nickel-based tungsten carbide alloy for surfacing repair and surface strengthening [14,15]. A large number of studies have shown that the comprehensive performance of a WC-reinforced nickel-based alloy surfacing layer is better.
In 2019, C. F. Han [16] prepared WC-reinforced nickel-based alloy composite coating on an ASTM 1045 steel surface by vacuum cladding and analyzed the microstructure, hardness and wear resistance of the coating with different WC content, and the dissolution mechanism of WC with different cladding temperatures. The results showed that the binding phase was composed of austenite (Ni2.9Cr0.7Fe0.36, FeNi), and the strengthening phase was composed of WC, carbides (M7C3), borides and silicates. With the increasing cladding temperature, the dissolution of WC was intensified, and the reaction products mainly include round bulk WC particles, strip WC particles and fine particles carbide. In 2019, A. N. Cherepanov [17] prepared a welding coating using Ni-Cr-B-Si-Fe nickel-based self-fusing alloy powder with WC as the strengthened phase of the welding material, and nano-refractory powders of titanium nitride and yttrium oxide were coated with the modification additive of iron and chromium. The results showed that the main components of the coating were Ni and Ni3(Fe, Cr) type iron compounds, and partial dissolution of the strengthening phase occurred during the melting process. In 2023, Jizhuang Wang [18] prepared two coatings of Inconel 718 nickel-based superalloy and WC particles by laser cladding and analyzed the phase composition, microstructure evolution, microhardness, residual stress and tribological properties of the coatings. The results showed that the addition of WC increased the hardness, improved the frictional properties, and caused the accumulation and mass formation of carbides related to the rough structure.
The above literature comprehensively discusses the influence of submerged arc surfacing process parameters and wire materials on post-welding properties and post-welding microstructure, providing valuable experimental data and conclusions for the field. However, relatively little attention has been paid to surface repair and strengthening on the descaling roll. Especially in the Ni-Cr-B-Si alloy powder preparation of nickel-based WC flux-cored wire with different content, and the experiment of flux-cored wire submerged arc surfacing on the descaling roll, the relevant literature is still insufficient. The purpose of this study is to fill this research gap, and to analyze the effects of flux-cored wire with/without the bottom layer and different WC content on the performance of the surfacing layer through systematic experiments, so as to provide new theoretical and practical support for surface repair and strengthening on the descaling roll. Under the actual working conditions, due to unreasonable selection wire powder composition, and mismatch of process parameters, the surfacing layer is prone to cracking and poor weldability [19,20]. It is necessary to conduct theoretical analysis of powder raw materials, process parameters and element ratio to provide a basis for the failure of protection in actual production. At present, nickel-based WC materials are still mainly studied in batch small experiments, and most of them use laser cladding, plasma surfacing and other processes [21,22,23]. Nickel based WC powder is used as the filling powder of flux-cored wire, and the flux-cored wire is made by drawing, reducing and other processes. There are few reports on the submerged arc surfacing of flux-cored wire on the descaling roll surface, and there is still insufficient understanding of the evolution mechanism in welding metallurgy. In this paper, Ni-Cr-B-Si alloy powder was used as the base powder, 30% and 60% WC were added to make the flux-cored wire, and the flux-cored wire submerged arc surfacing experiment was carried out on the descaling roller. The performance of the surfacing layer was evaluated by SEM, XRD, EDS, hardness, friction and wear, corrosion, impact energy and other material characterization experiments. Based on the experimental analysis and evaluation of the whole process, this study quantitatively analyzed the influence of different element contents on welding quality and provided a theoretical basis for submerged arc surfacing process of flux-cored wire. It also provided new innovative ideas and theoretical support for surface repair and strengthening of descaling rolls in the iron and steel metallurgy industry.

2. Experiment on Submerged Arc Surfacing with Flux-Cored Wire

2.1. The Materials of Submerged Arc Surfacing Welding Experimental

The descaling roll material is 42CrMo4, with a diameter of 200 mm and a length of 1000 mm. The chemical composition is shown in Table 1. The direct surfacing of nickel-based WC material on the descaling roll surface is easy to cause cracking, and an intermediate transition layer needs to be set. The surfacing gradient lap transition layer material is YD263 welding wire and homemade nickel-based WC flux-cored wire, and 430 flux is selected. The YD263 welding wire composition is shown in Table 2. The steel strip size for preparing flux-cored wire is 16 mm wide and 0.3 mm thick. The composition is shown in Table 3.
The powder cored from the flux-cored wire is made of a mixture of various alloys. The particle size of the nickel-based alloy powder is 50 μm~150 μm, and the element content as shown in Table 4. The composition of WC powder added to the powder, as shown in Table 5.
70% NiCrBSi + 30% WC and 40% NiCrBSi + 60% WC nickel-based WC powder was selected for flux-cored wire powder, respectively. Sigma500 field emission SEM and X-ray diffractometer were used to research the microstructure and phase analysis of nickel-based WC powder. The morphology and element distribution of 70% NiCrBSi + 30% WC powder is shown in Figure 2. The white ball is nickel-base powder with a particle size of 50 μm~100 μm. Dark spherical WC; diameter 30 μm~100 μm. 40% NiCrBSi + 60% WC. The powder morphology and element distribution are shown in Figure 3. The white spherical powder is nickel-based base powder with a particle size of 50 μm~100 μm. Dark spherical WC; diameter 30 μm~100 μm. The XRD results of the two alloy powders are shown in Figure 4. The powders contain Ni, Cr-Ni, WC, Si, W, FeCu4 and other elements and their compounds. The highest peaks of the two powder XRD are Ni and Cr-Ni. Due to the different amount of WC added, the highest peaks are significantly different, and the nickel-based alloy with 30% WC added amount has a higher peak.
In this paper, the flux-cored wire was prepared via the cold-rolled strip forming method [24]; 70% NiCrBSi + 30% WC and 40% NiCrBSi + 60% WC nickel-based alloy composite powders were selected and proportionally mixed, respectively, and wrapped with the steel strip, and then the flux-cored wire was prepared through drawing and reducing. The cross-section shape of the welding wire uses the common butt “O” type of flux-cored wire, the diameter is 4.0 mm, and the powder filling rate is 31.48%. The finished welding wire diagram are shown in Figure 5.

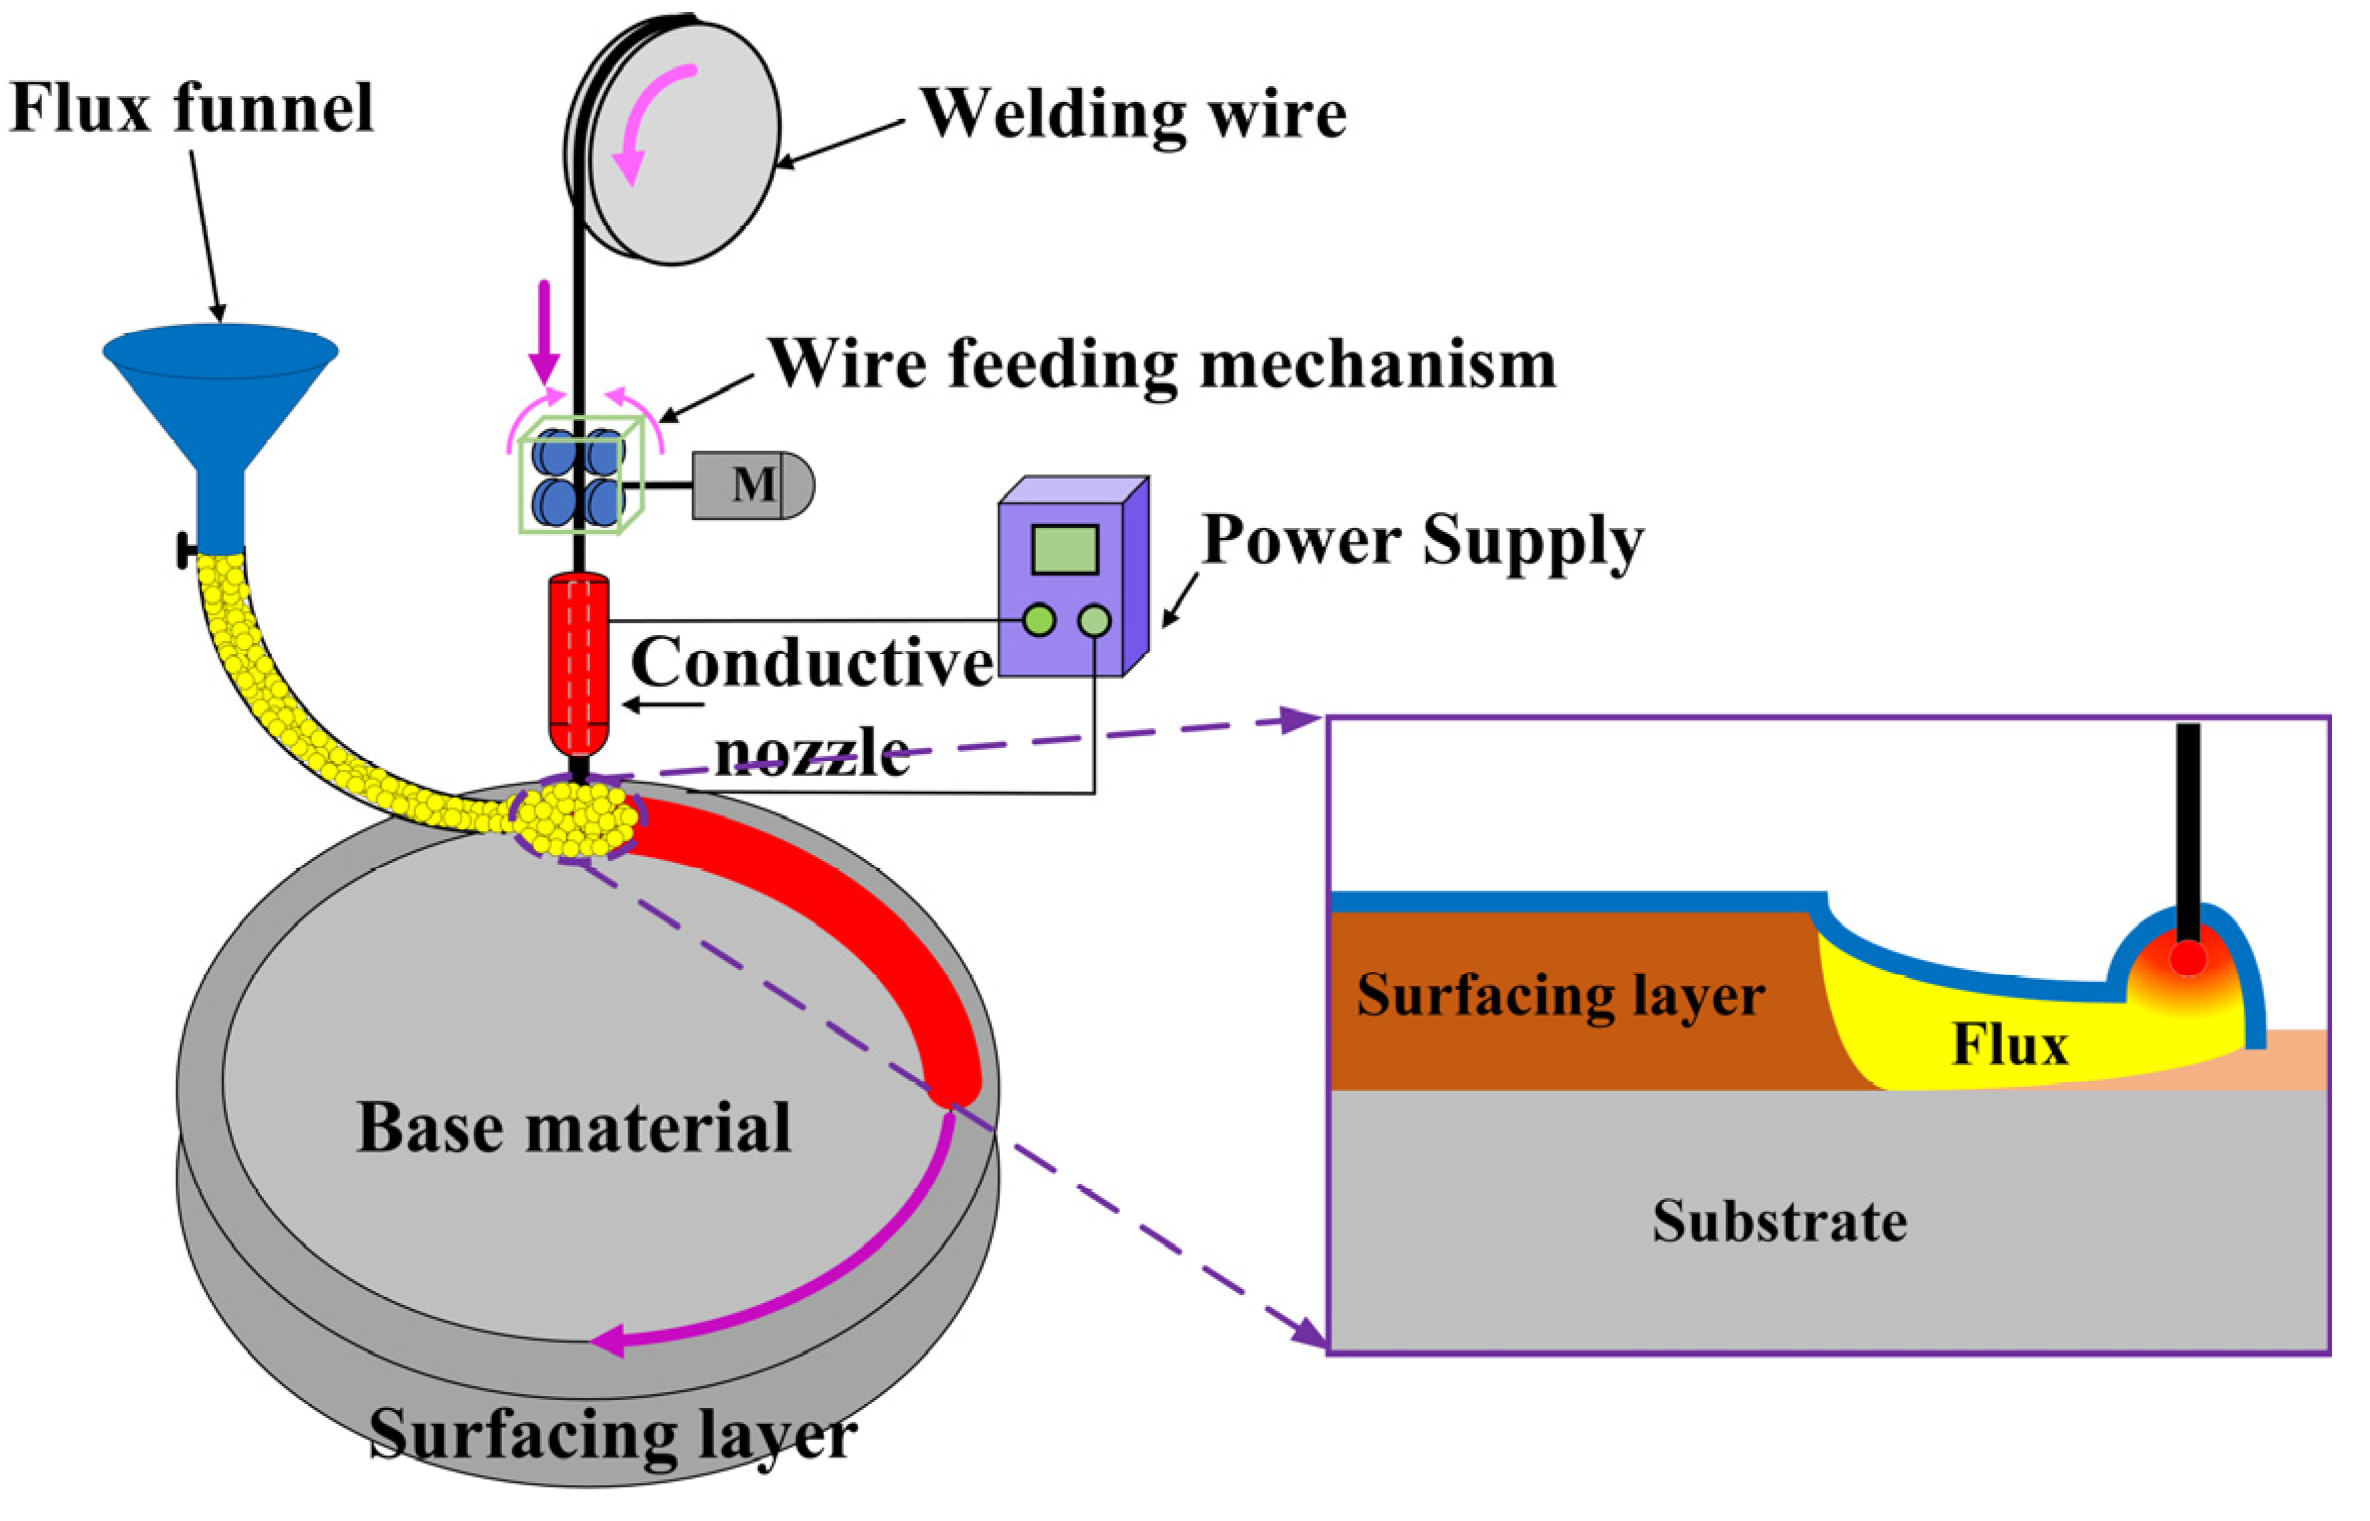
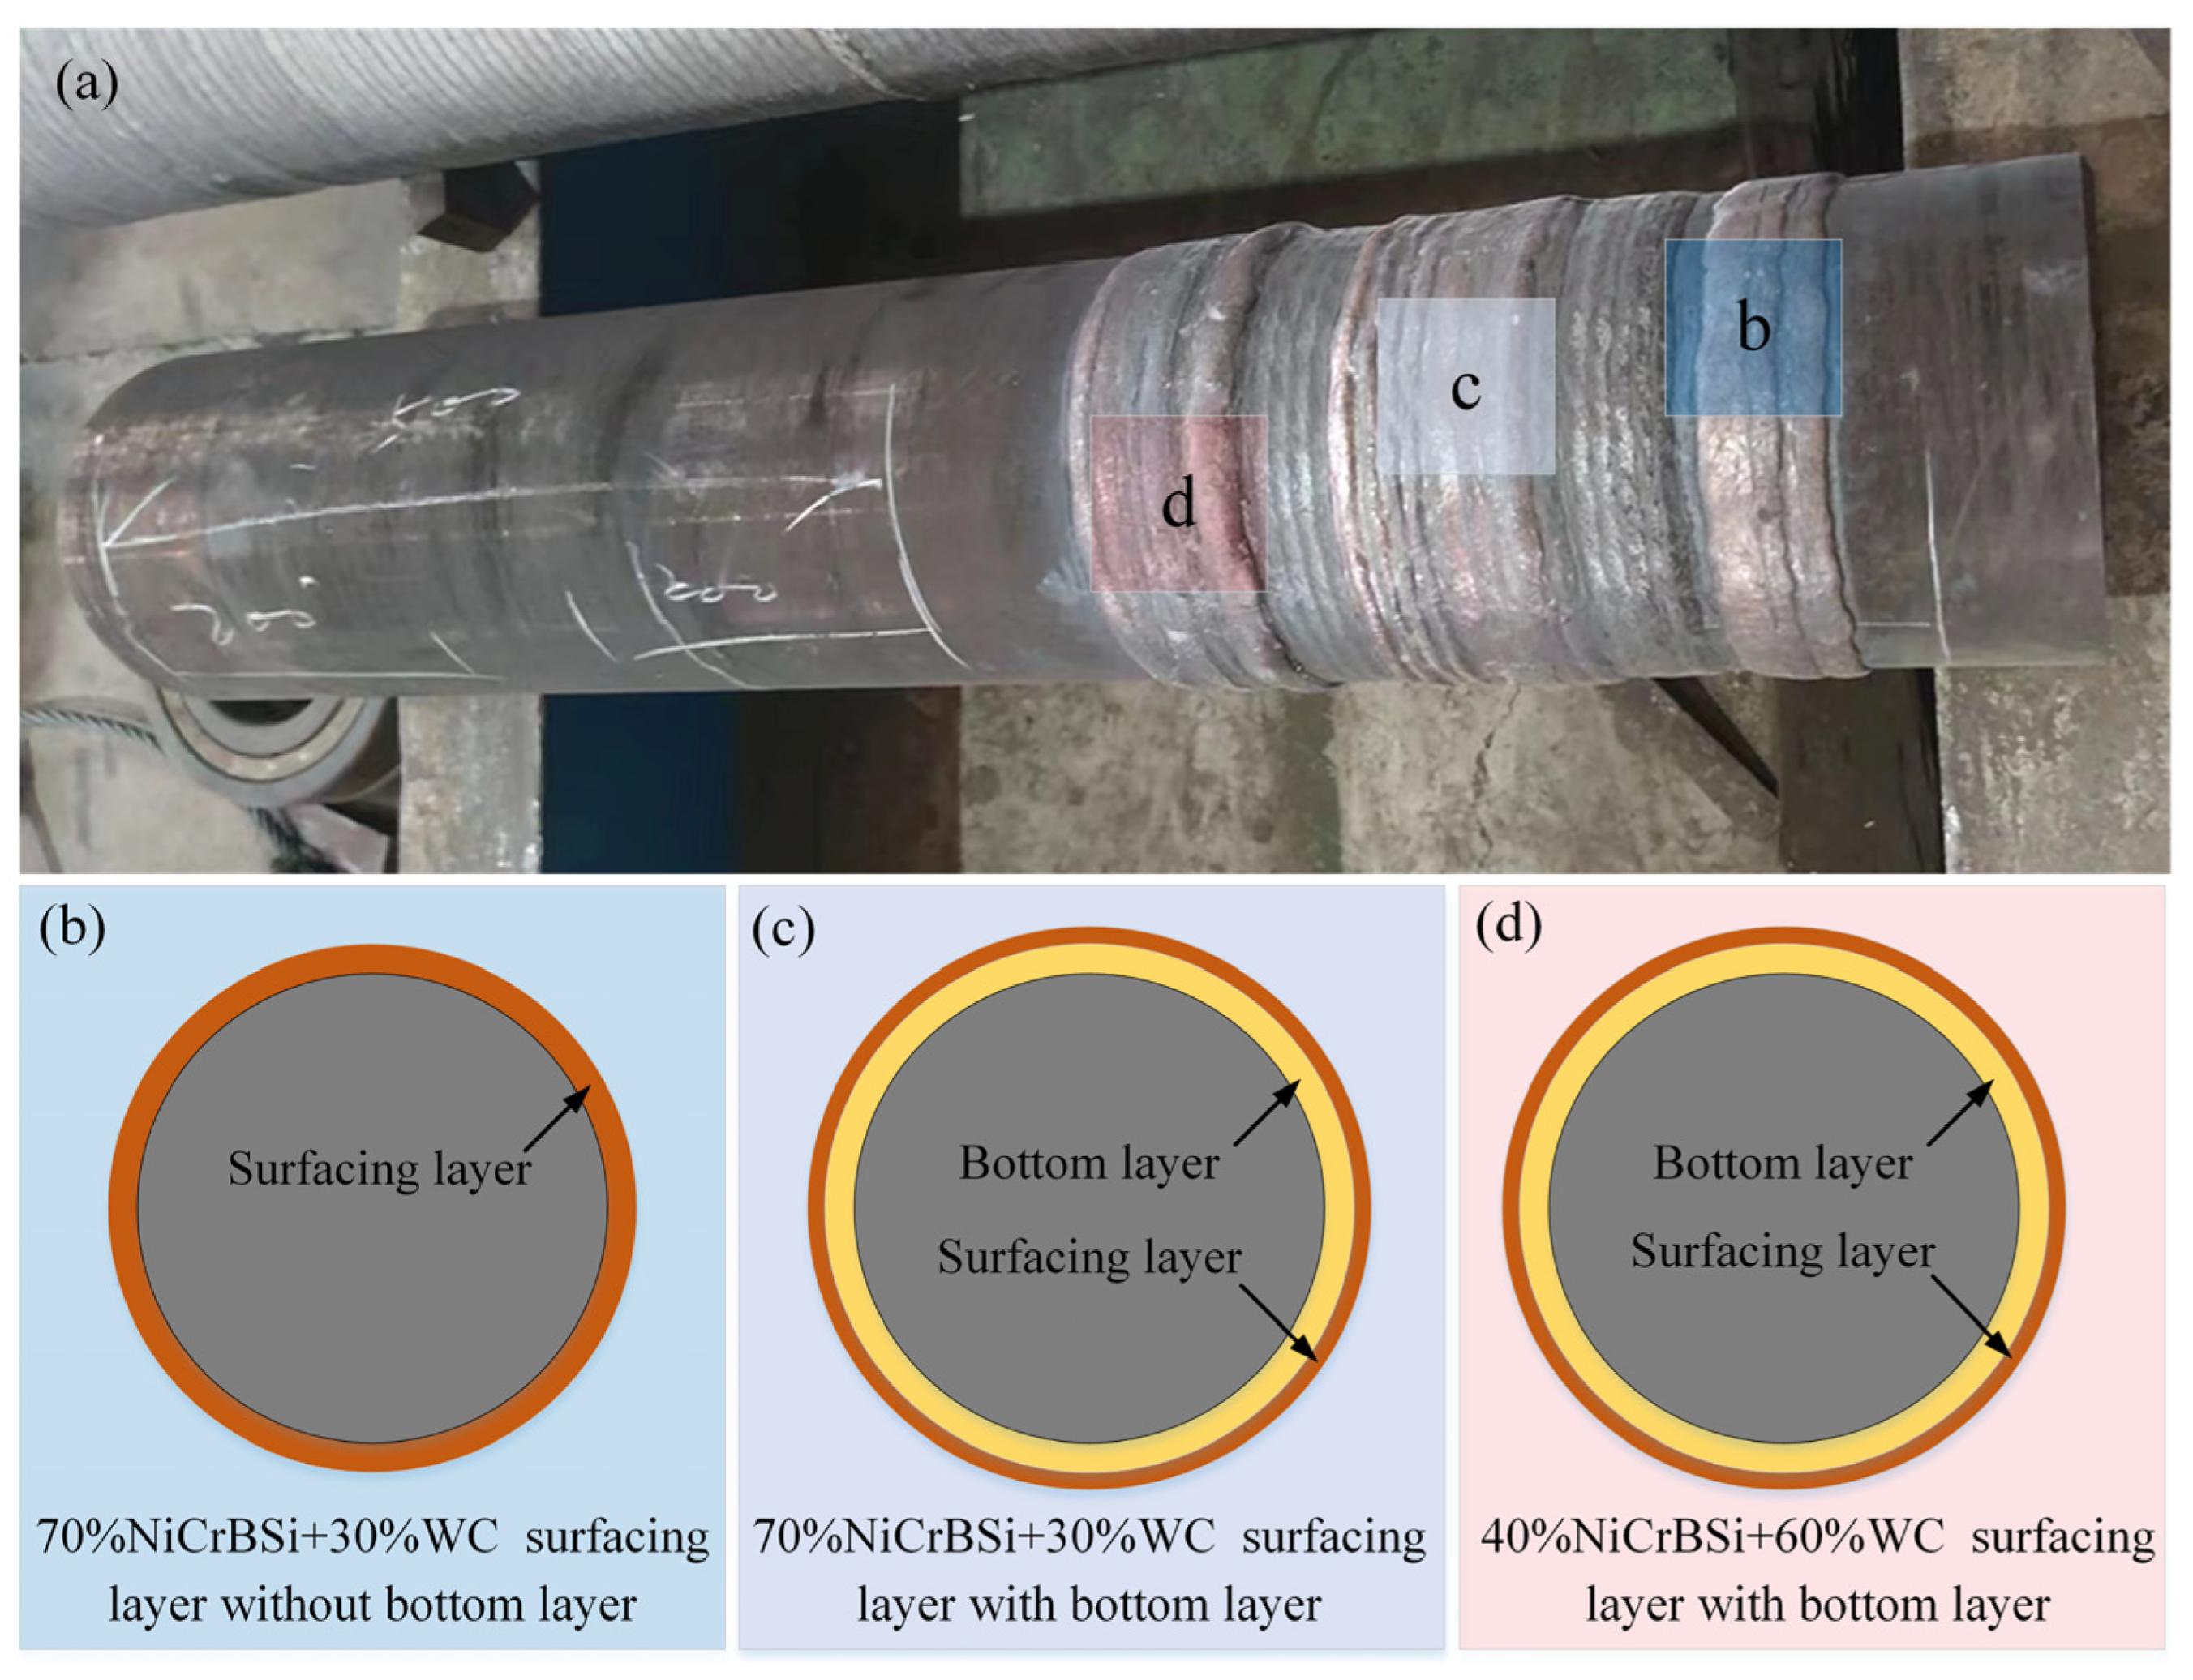
2.2. Submerged Arc Surfacing Experiment of Flux-Cored Wire

JK-4000 automatic submerged arc surfacing machine was used in this paper. Two kinds of submerged arc surfacing layers with different WC content were prepared using the self-made nickel-based WC flux-cored wire in 42CrMo4 scaler roll base. The selection of surfacing process parameters will affect the welding metallurgical behavior and weld formation between alloy components, and ultimately affect the surfacing layer properties. Therefore, it is significant to select the best process parameters to improve the performance of submerged arc surfacing layer. After several experiments of submerged arc surfacing welding, the optimal process parameters are finally determined as shown in Table 6.
The welding preheating and post-treatment temperature affect the cold crack, porosity, residual stress and new phase formation in welding, demonstrating that the submerged arc surfacing process of nickel-based WC flux-cored wire is more sensitive to temperature. To obtain the best surfacing performance, the descaling roller was preheated before welding, the furnace temperature was set at 400 °C, and the heat was kept for 4 h. Before welding, the substrate surface is grinded with sandpaper to remove burrs, rust and oxides so that the substrate surface is clean and tidy. During welding, the heat preservation and heating of the proprietary equipment are used to maintain the interlayer temperature and avoid the formation of excessive temperature gradients. In the welding process, the bottom transition should be made by submerged arc surfacing on the descaling roll surface, and then the self-made submerged arc surfacing of nickel-based WC flux-cored wire should be carried out. Setting the bottom layer can avoid cracking and is conducive to improving the welding quality. After welding, it is slowly cooled to room temperature in the heating furnace, and the cooling rate is set to 1 °C/min. The descaling roll welding layer is shown in Figure 6. The macroscopic morphology on the surfacing layer shows that the weld paths of the three kinds of surfacing layers are smooth and clean, without welding slag residue, and without cracks and other defects on the surfacing layer surface. Cut the descaling roll welding layer according to the predetermined plan. Different types of sandpaper from coarse to fine (100 mesh to 3000 mesh) were used to grind the experiment piece, and a polishing machine was used to polish it until the section surface was specular. Aqua Regis reagent (HCI:HNO3 = 3:1) was used for 10 s~15 s to etch the specimen; the specimen was wiped with anhydrous ethanol after etching, and dried for the experiment.

3. Experimental Characterization for Surfacing Layer Materials

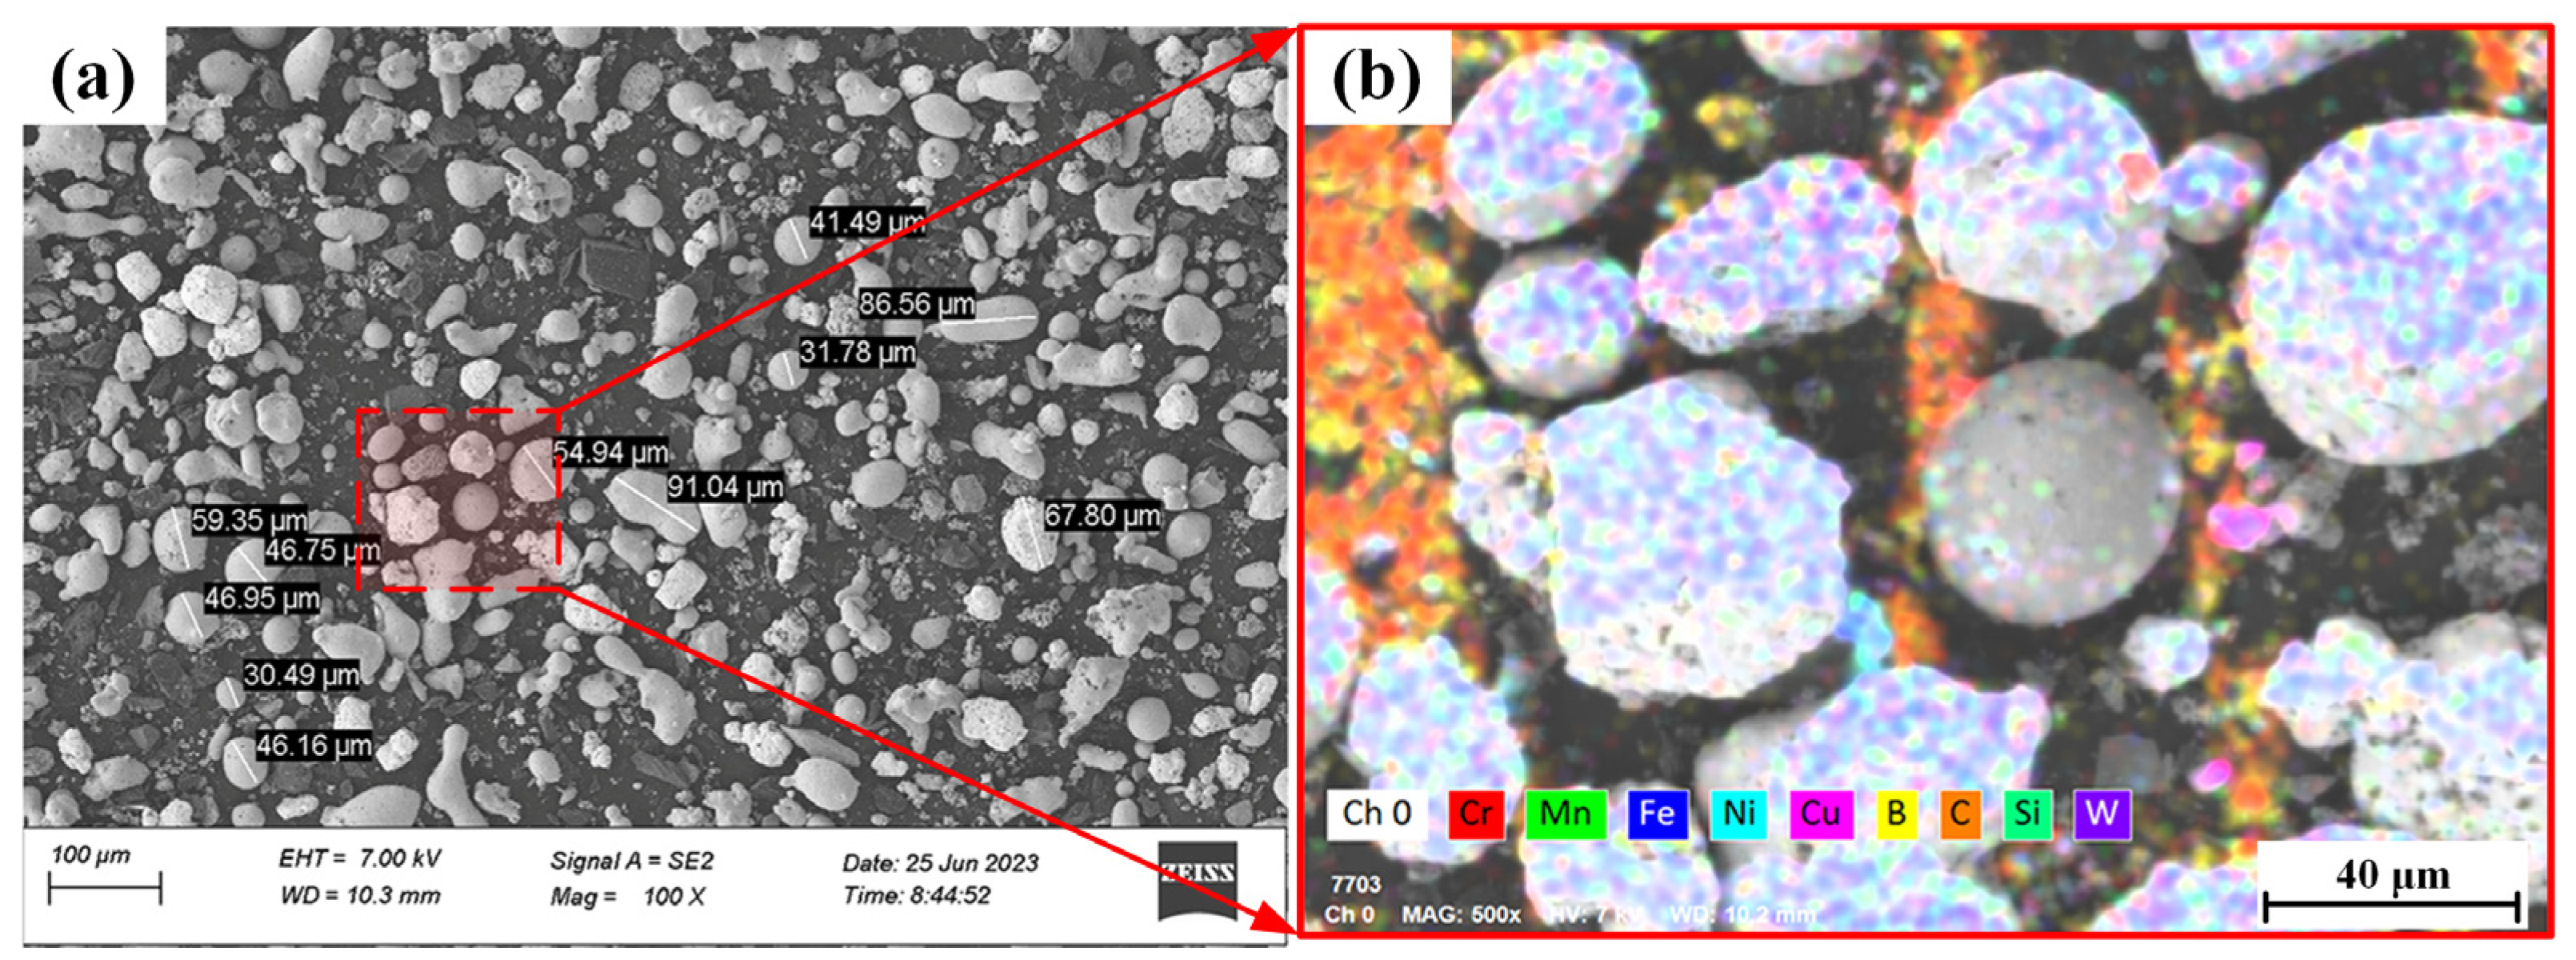
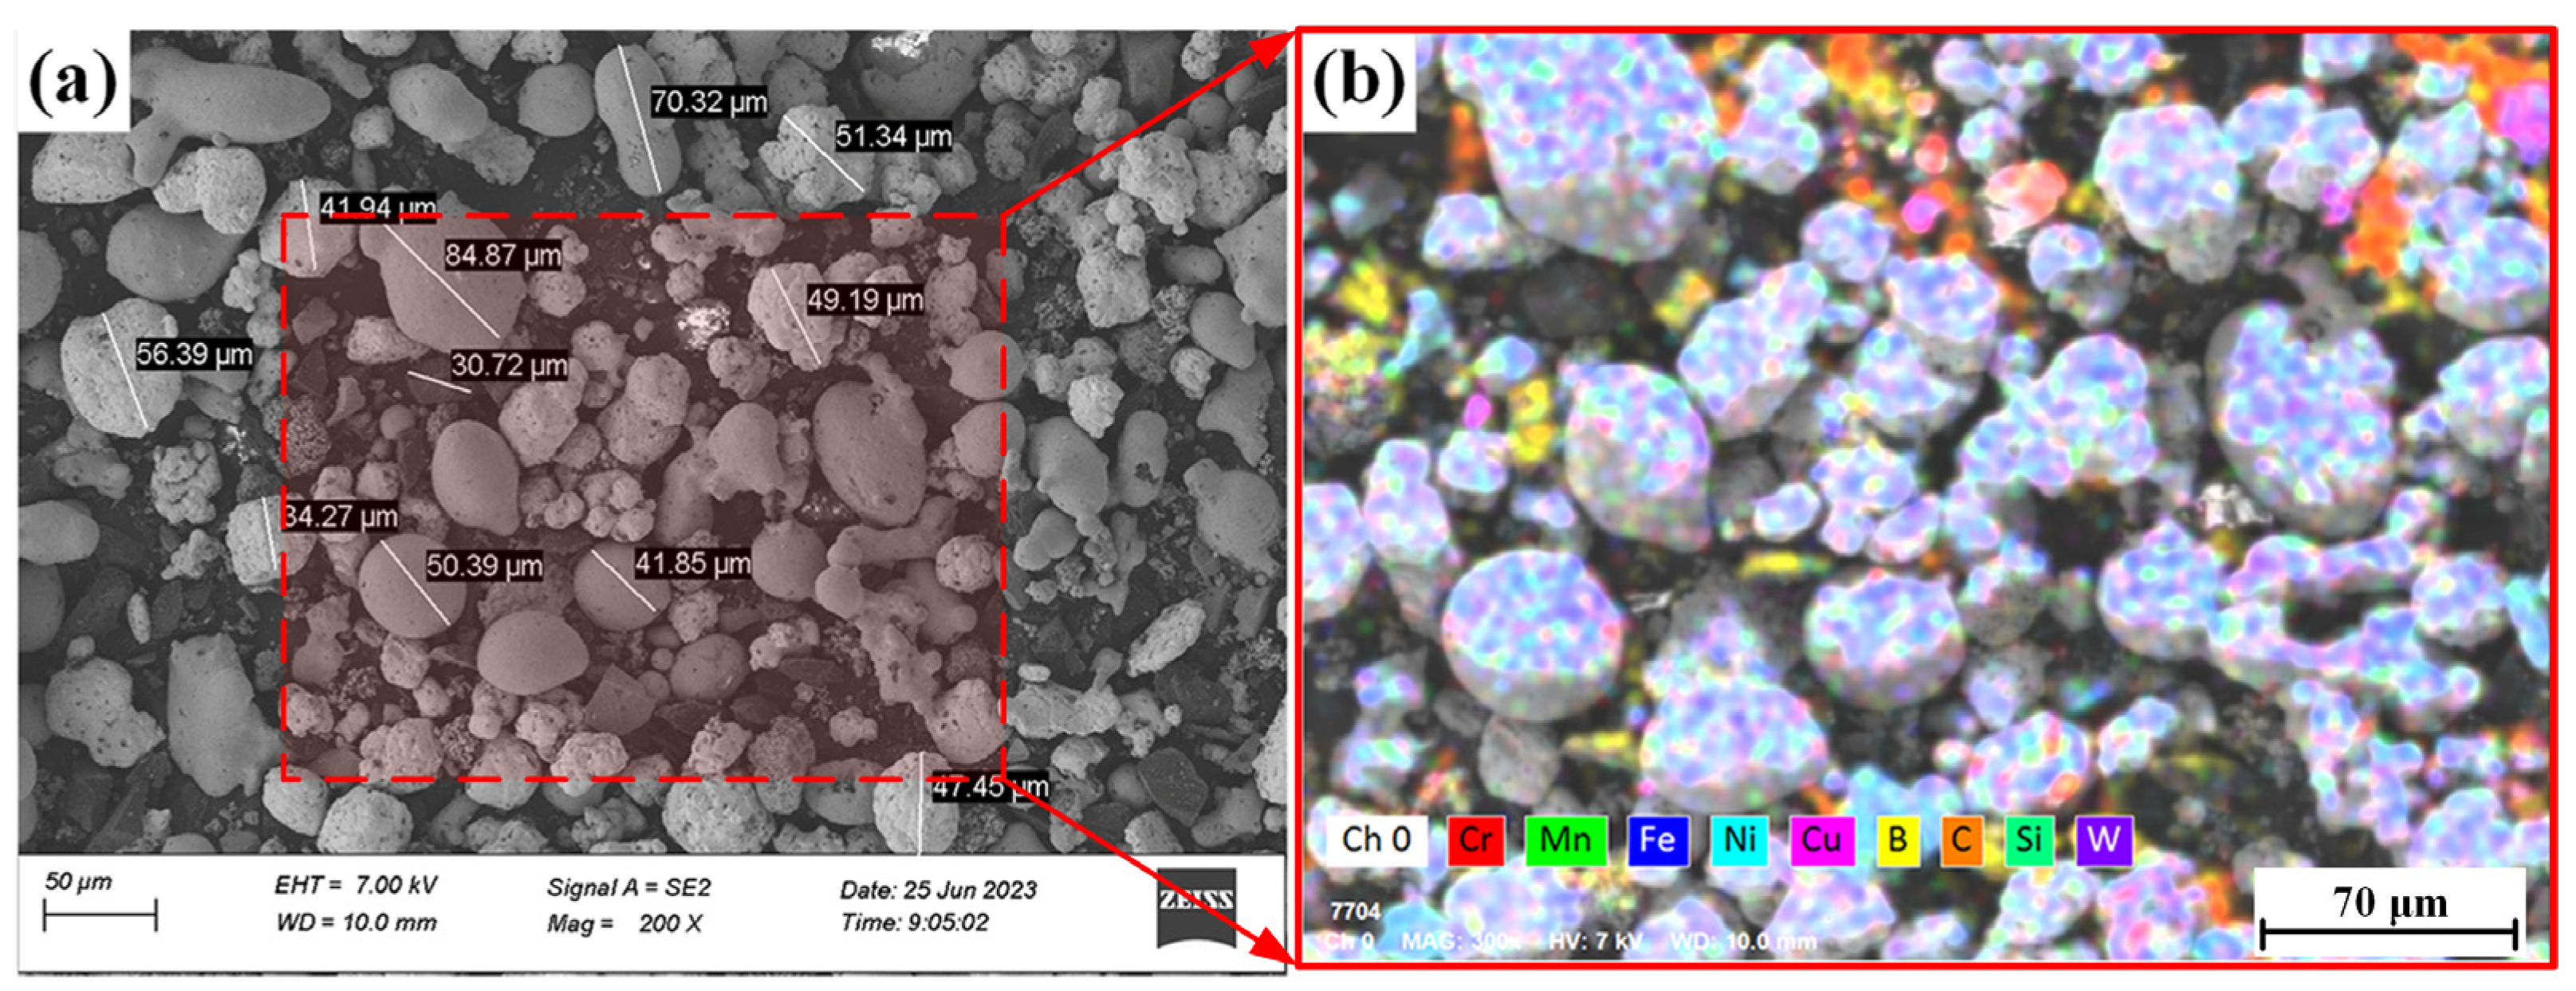
3.1. Experiments with SEM and EDS

The content and distribution of the WC hard phase in the surfacing layer have a significant influence on the performance of surfacing welding. Due to the different WC content in flux-cored wire, there are obvious differences in the microstructure and hard phase of the surfacing layer. Therefore, it is necessary to observe the microstructure of surfacing layer. In the experiment, ultra-depth of field 3D electron microscope (Keenz Company, Osaka, Japan) and Sigma500 field emission scanning electron microscope (Carl Zeiss AG, Oberkochen, Germany) were used to observe the surfacing morphology and hard phase distribution.

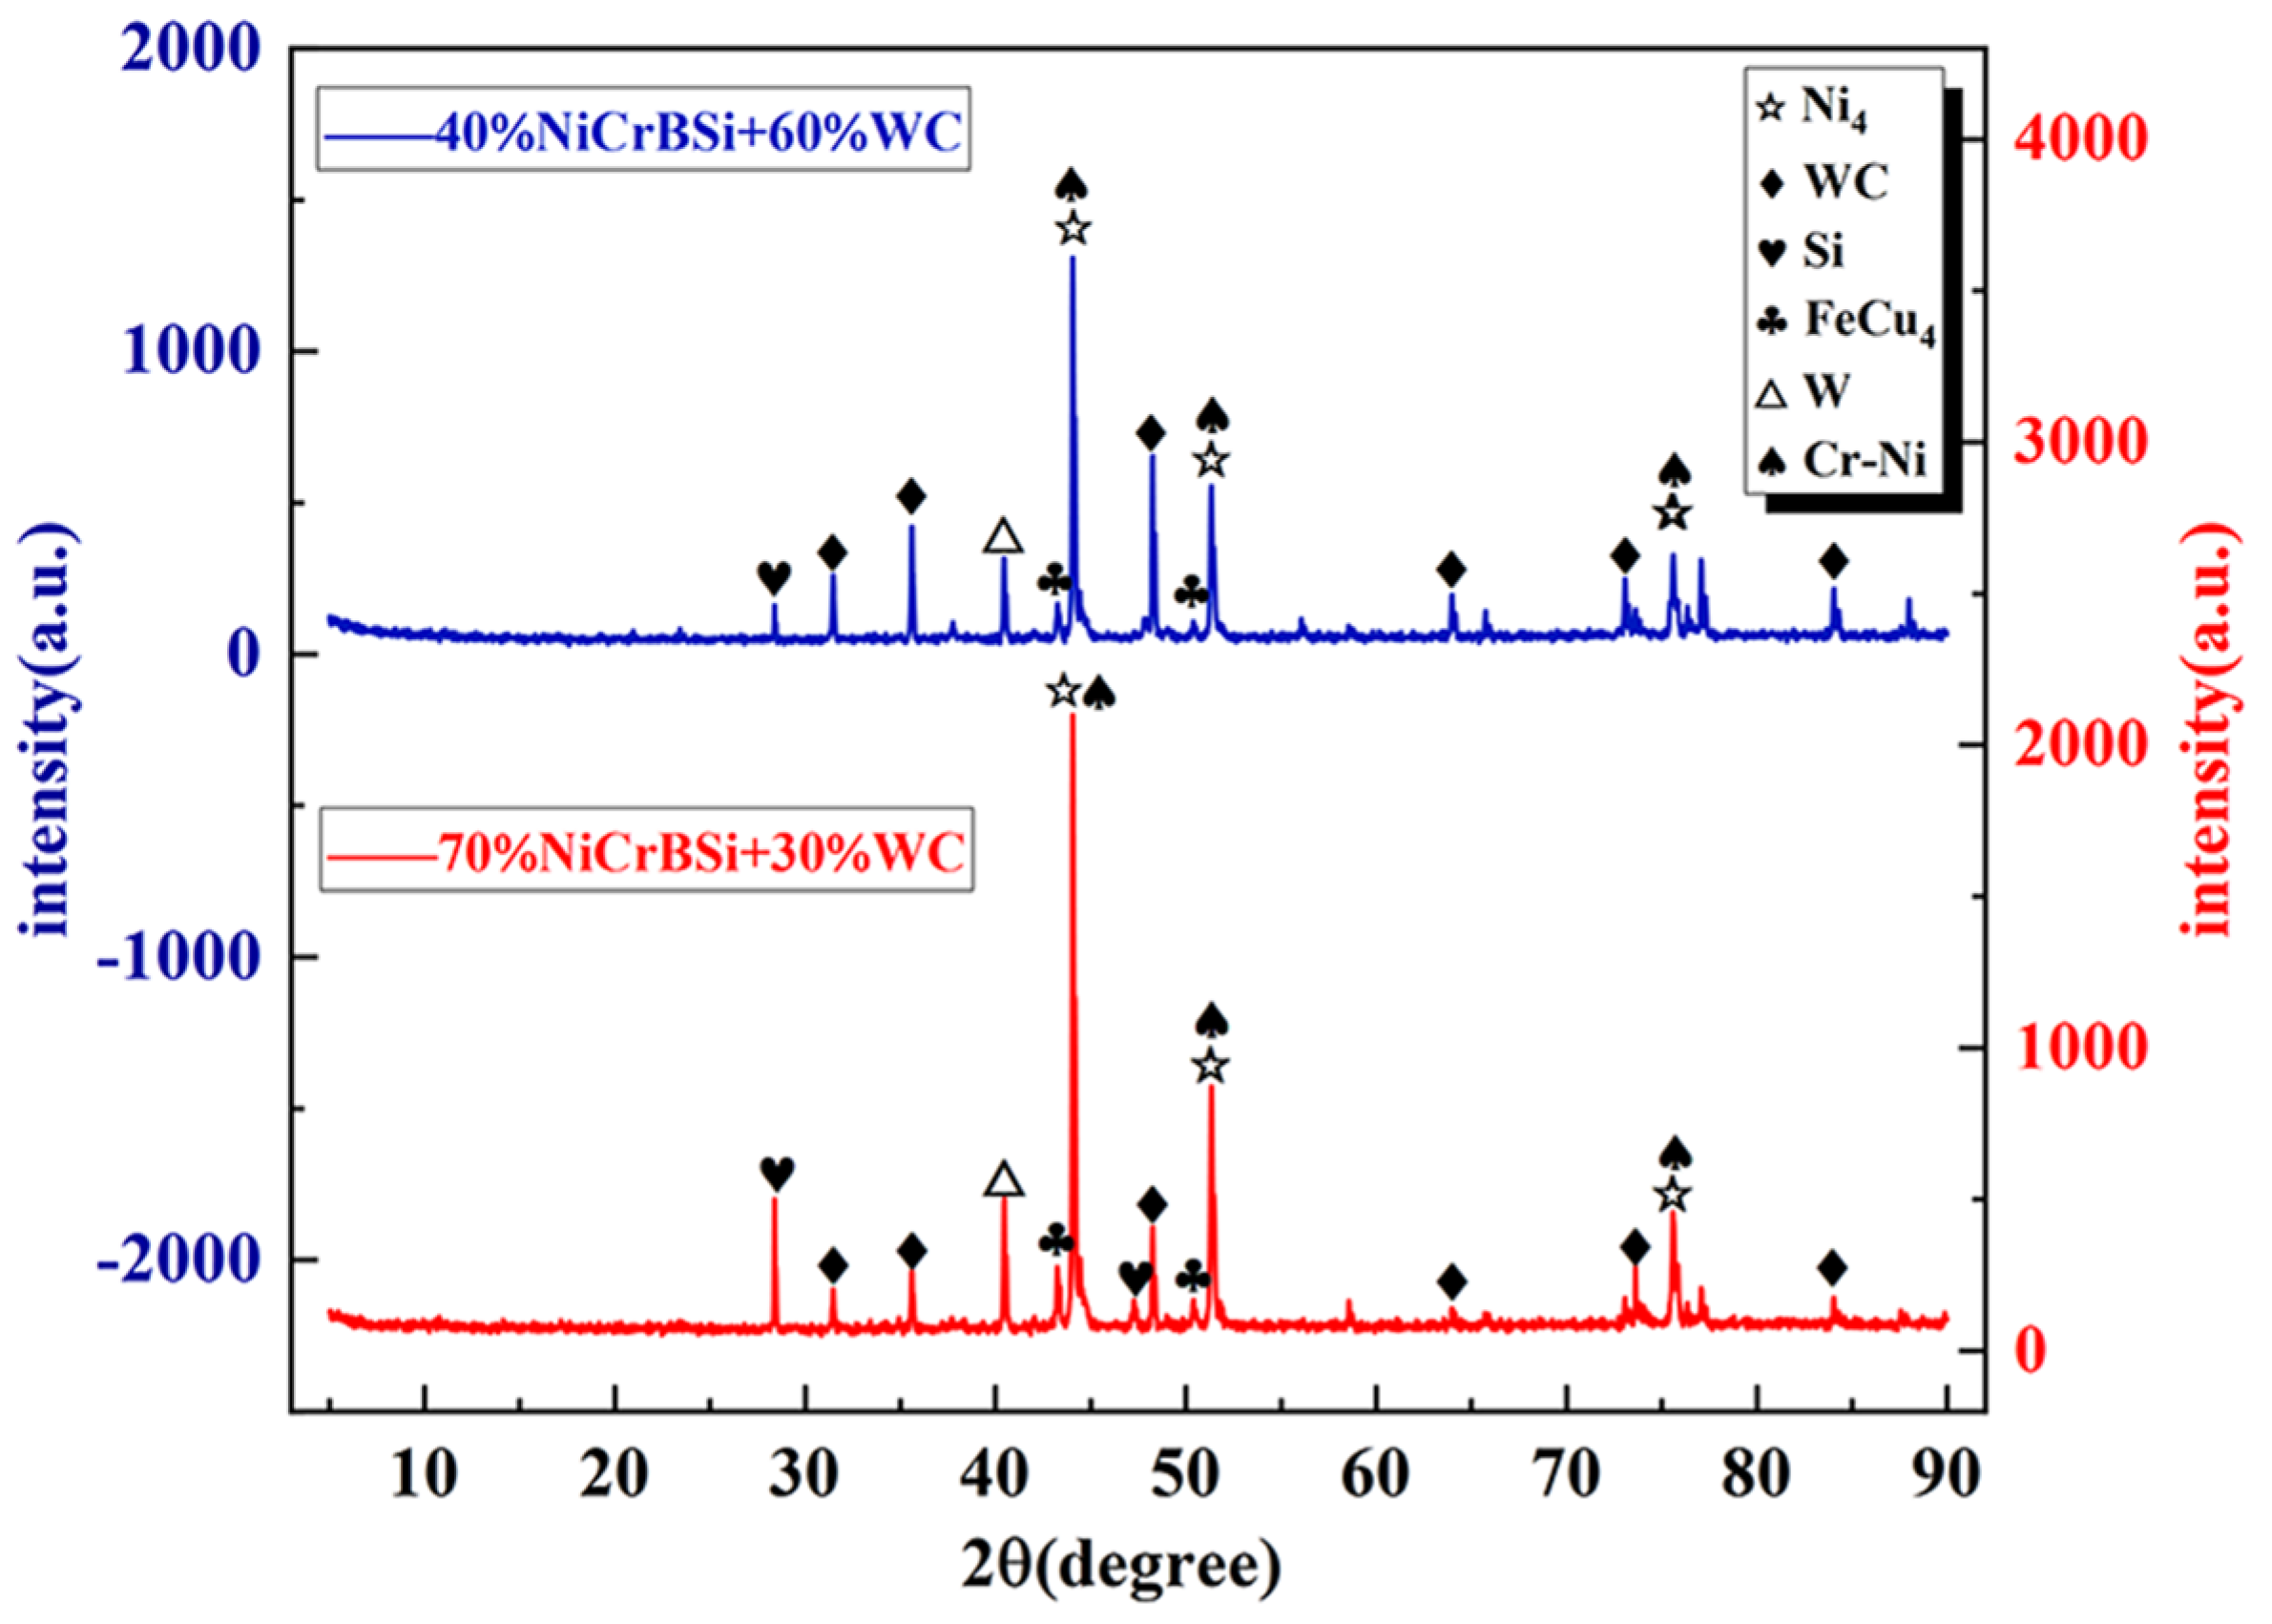
3.2. XRD Experimental Scheme

The phase composition of surfacing layer has a significant influence on the surfacing layer serviceability. X-ray diffractometer produced by PANalytical B.V (PANalytical B.V, Almelo, The Netherlands) was used for X-ray diffractometer experiment to analyze the phase composition on the surfacing layer. Kα was the ray source and the Cu target was the target material. The scanning angle was 20°~90° and the scanning time was 2 min. After the experiment was completed, the results were imported into the data processing software to analyze and draw the diffraction curve.

3.3. Microhardness Experiment

WC added to the flux-cored wire can improve the surfacing layer hardness, and the different amount of WC added will have a significant impact on the microhardness. The Q10M microhardness experimenter (QATM Corporation, Golling, Austria) was used in the microhardness experiment; the load was 3 N, the loading time lasted 15 s, and the indentation was a diamond shape. To effectively measure the hardness change along the surfacing depth direction, 18 points were continuously made along the surfacing depth direction. Afterwards, the hardness experiment used an ultra-depth microscope to observe the hardness indentation.

3.4. Friction and Wear Experiment

The friction and wear experiment of the surfacing layer was carried out. The experimental instrument model was MS-T300 (Lanzhou Huahui Instrument Technology Co., LTD, Lanzhou, China). To accurately experiment the wear resistance of the surfacing layer, the grinding ball material Si3N4 was selected, which has high hardness, lubricating property and abrasion resistance. In the experiment, the load applied was 1000 g, the wear time was 50 min, the measuring radius was 3 mm, the rotating speed was 300 r/min, and the friction coefficient curve was drawn. After the experiment, the wear marks and wear of surfacing layer were observed using an ultra-depth microscope.

3.5. Electrochemical Corrosion Experiment

Electrochemical corrosion experiments were carried out on the surfacing layer with the equipment of Coster CS310M electrochemical workstation (Wuhan Koster Instrument Co., LTD, Wuhan, China). The experimental temperature was a normal temperature, the corrosion solution was 3.5% NaCl solution, the working electrode was saturated with calomel, the auxiliary electrode was platinum sheet, the initial scanning point was −0.2 V, the scanning termination potential was 1.2 V, and the scanning speed was 0.16 mV/s. Before the experiment, the parts not involved in the experiment were encapsulated and dried with epoxy resin, and only the surfacing layer under experiment was exposed to the corrosion solution.

3.6. Impact Energy Experiment

The impact energy experiment can experiment the material toughness. By measuring the impact energy, the material’s response to the impact energy can be known. In this paper, impact toughness tests were carried out on the 42CrMo4 descaling roll substrate direct submerged arc surfacing of 30% WC nickel base alloy specimen and the transition gradient lap layer of 30% WC nickel base alloy surfacing specimen, respectively. The surfacing layer and a small part of the substrate were processed into GB/T229-2020 [25] impact samples with a length of 55 mm and a cross-sectional area of 10 mm × 5 mm. A V-shaped groove was opened in the middle along the length direction of the sample. The angle of the V-shaped mouth was 45°, the depth was 2 mm, and the radius of the bottom curvature was 0.25 mm. A charpy V-groove impact test was carried out at a normal temperature for all samples.

4. Analysis of Experiment Results

4.1. Analysis of SEM and EDS Experiment Results

Zeiss-ƩIGMA HD field emission was used to observe the submerged arc surfacing test piece after corrosion.

4.1.1. The Results of 70% NiCrBSi + 30% WC Filler Metal without the Bottom Layer Welding

The surfacing layer appearance is shown in Figure 7. The experiment shows that the WC hard phase dissolves in the submerged arc surfacing welding and forms the hard phase with the network structure, which is distributed in the whole surfacing layer. The top microstructure of the surfacing layer as shown in Figure 7a–c. The hard phase deposit mainly showed a fishbone structure, the EDS scan showed that the hard phase was W-Si-Ni-B, and the adhesive phase was mainly Ni–Fe solid solution, as show in Figure 8. The microstructure of the middle part surfacing welding is shown in Figure 7d–f. The hard phase deposits are mainly neuronal and accompanied by a few Fe–Ni blocks. The microstructure of the fusion zone surfacing layer and substrate is shown in Figure 7g. During the welding process, Fe elements in the substrate entered the surfacing layer due to the metallurgical diffusion behavior. Fe–Ni blocks were formed with Ni elements in the surfacing layer, which were attached near the fusion line.

4.1.2. 70% NiCrBSi + 30% WC Filler Metal with the Bottom Layer

The surfacing layer appearance is shown in Figure 9. The microstructure of the surfacing layer middle part is shown in Figure 9a–c. The hard phase deposit is a flower-like structure, EDS scanning shows that the hard phase is Cr-Fe-Si, Ni-Cr-Si-W, and the adhesive phase is mainly an Ni–Fe solid solution. EDS results as shown in Figure 10. The microstructure of the fusion zone surfacing layer and substrate are shown in Figure 9d–f. The resulting mesh structure is sparser than the surfacing layer middle. The mesh structure elements are mainly W-Fe-C-Cr, the mesh joints are Cr-rich areas, and the bonding phase elements are Fe-C-Ni-W. Due to the existence of the bottom layer, an Fe–Ni block was not found at the fusion zone of the surfacing layer and the substrate.

4.1.3. 40% NiCrBSi + 60% WC Filler Metal with the Bottom Layer

The surfacing layer appearance is shown in Figure 11. The microstructure of the middle surfacing layer is shown in Figure 11a–c. The hard phase deposit is mainly characterized by a flower-flocculent structure, and EDS scanning shows that the hard phase is C-W-Si-Cr, and the adhesive phase is mainly an Ni–Fe solid solution. EDS results are shown in Figure 12. C is mainly distributed around the hard phase, W, Si, Cr and B are all over the hard phase area, and Ni and Fe are mainly concentrated in bonding. Compared with 70% NiCrBSi + 30% WC filler metal surfacing layer, the resulting mesh structure has a larger gap, but the mesh vein is clear. The structure morphology at the fusion zone of the surfacing layer and gradient lap is shown in Figure 11d. The surfacing layer morphology is at the top, and the gradient lap layer is at the bottom. The microstructure of the fusion zone between the gradient lap layer and the substrate is shown in Figure 11e, and the enlarged region is shown in Figure 11f.

4.2. Analysis of XRD Experiment Results

The X-ray diffraction results of 70% NiCrBSi + 30% WC wire without the bottom layer, 70% NiCrBSi + 30% WC filler metal with the bottom layer and 40% NiCrBSi + 60% WC filler metal with the bottom layer submerged arc welding are shown in Figure 13. The results show that the welding layer is mainly composed with Fe-Ni, CrFe8Si, Fe3Si, Ni3C, and C-Cr. The powder is wrapped with a steel strip and the substrate contains Fe; during welding the substrate melts, and some Fe diffuses to the welding layer, and then forms Fe3Si and Fe-Cr phases. The diffraction peaks of the Fe-Ni, CrFe8Si, Fe3Si and Fe-Cr phases are the highest.

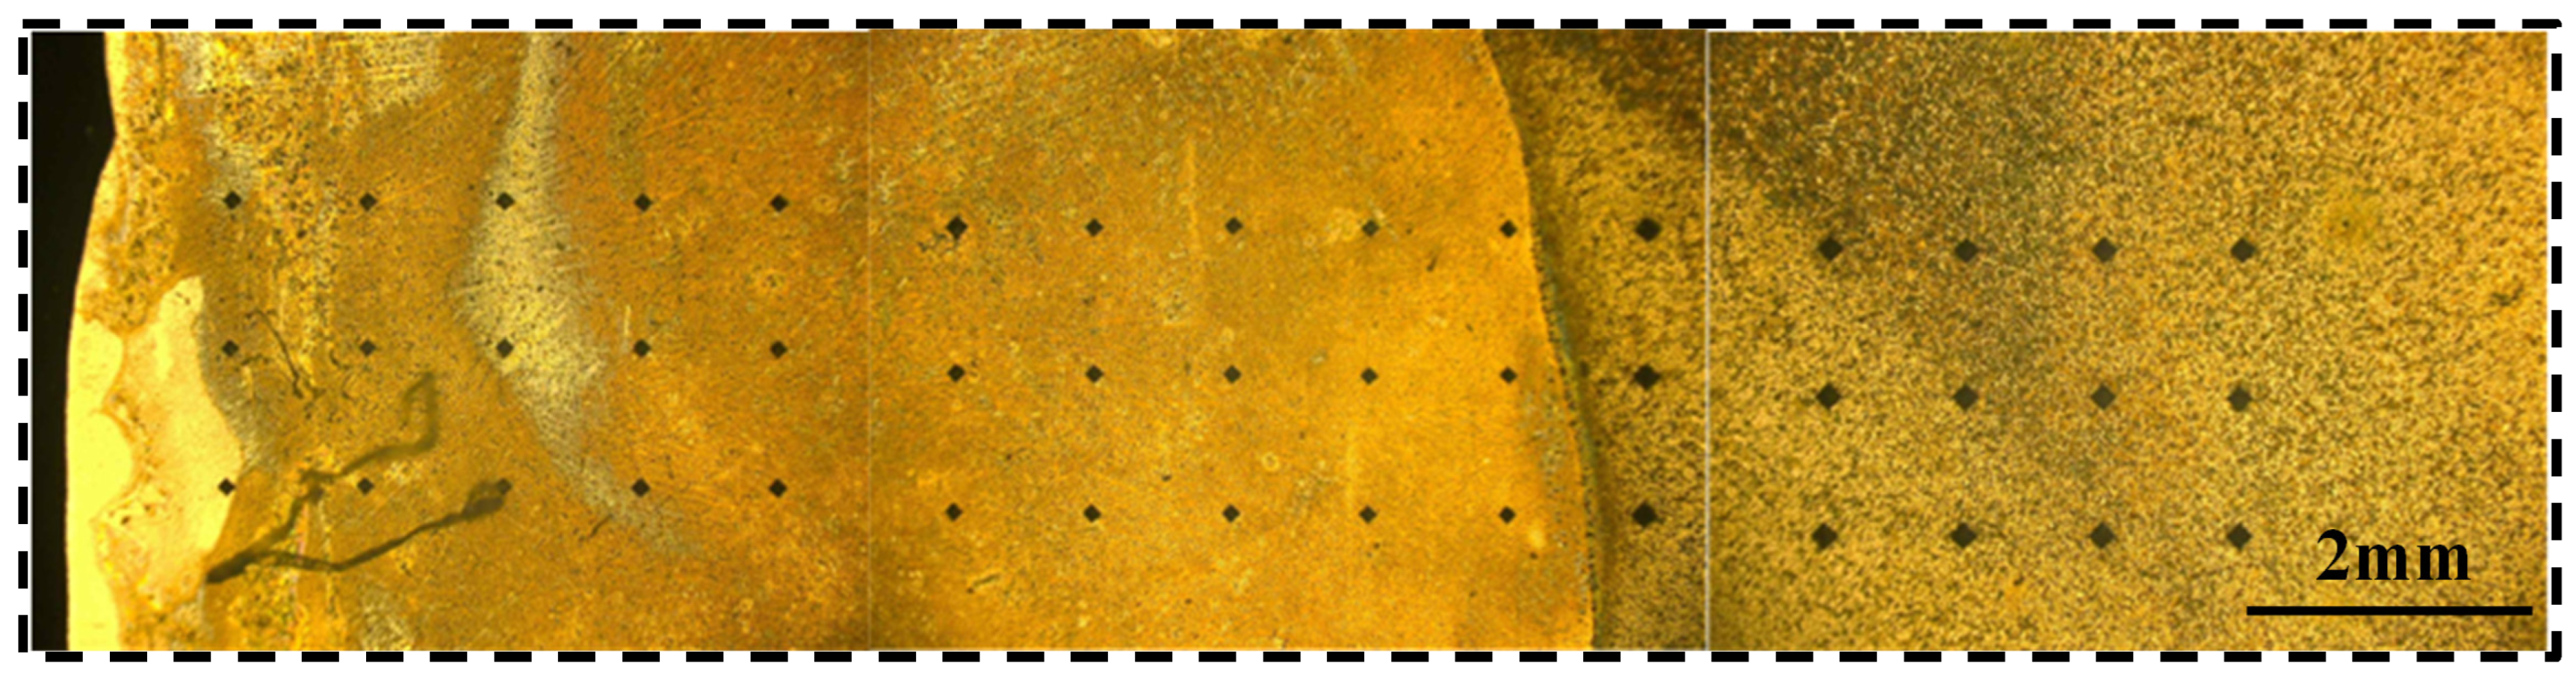
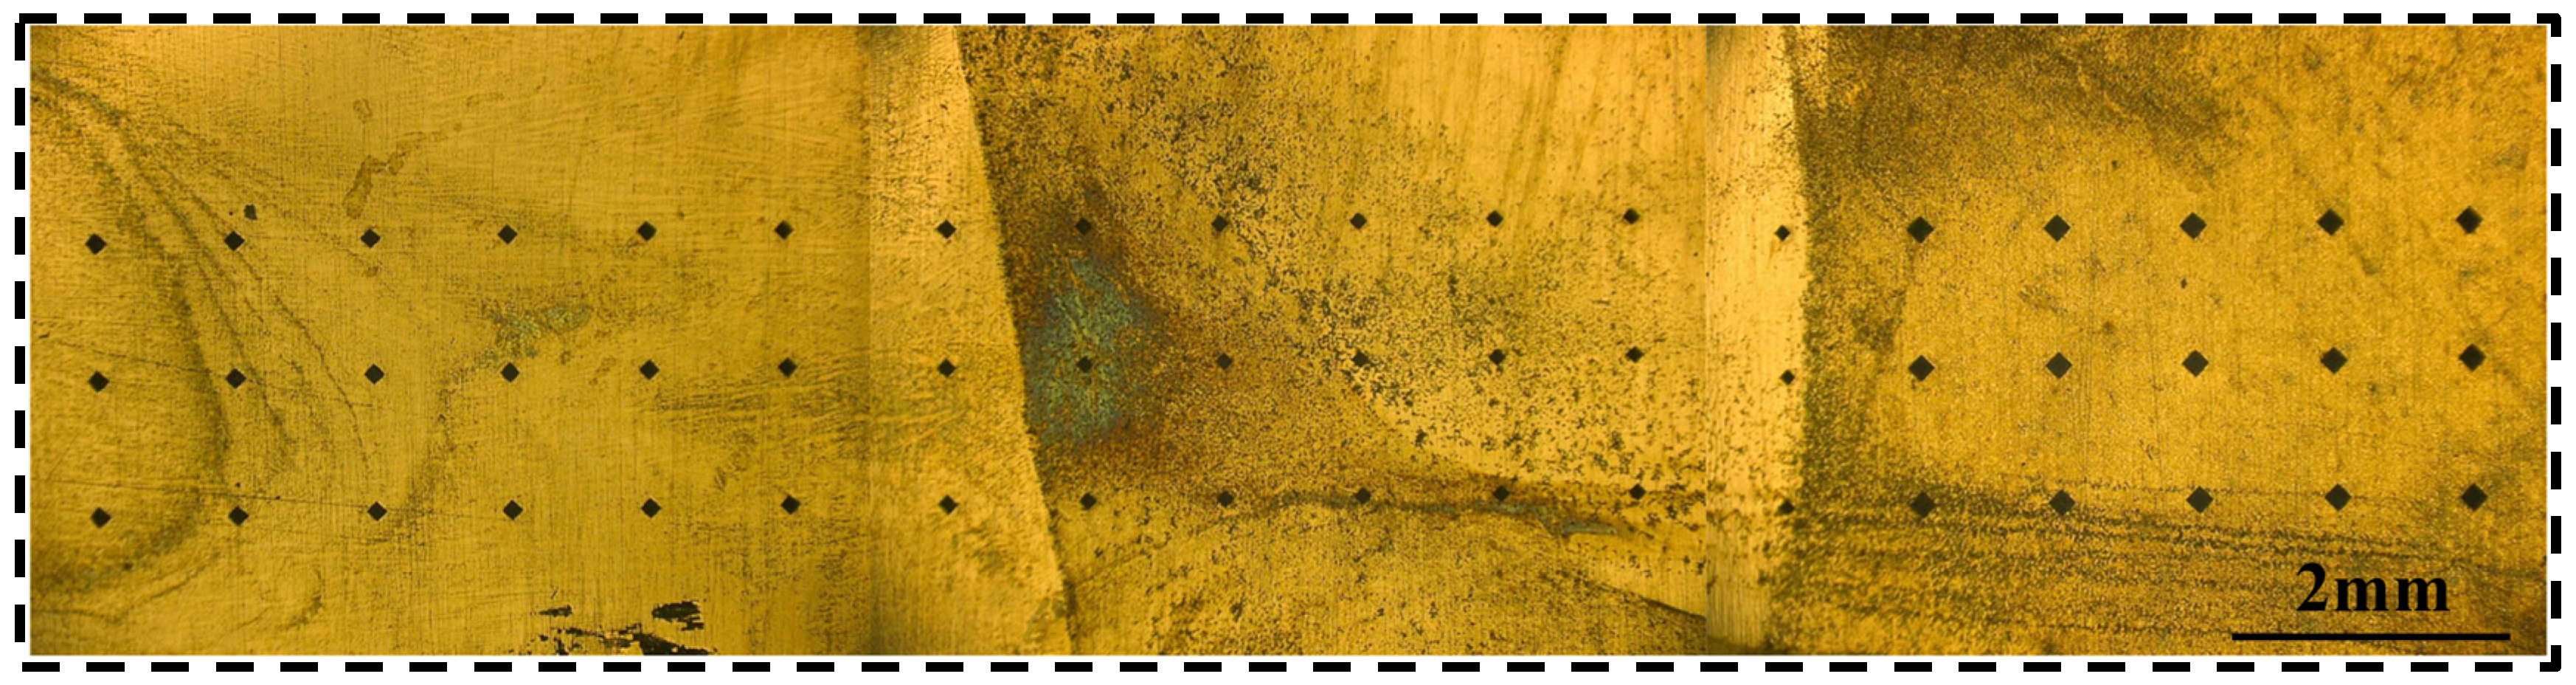
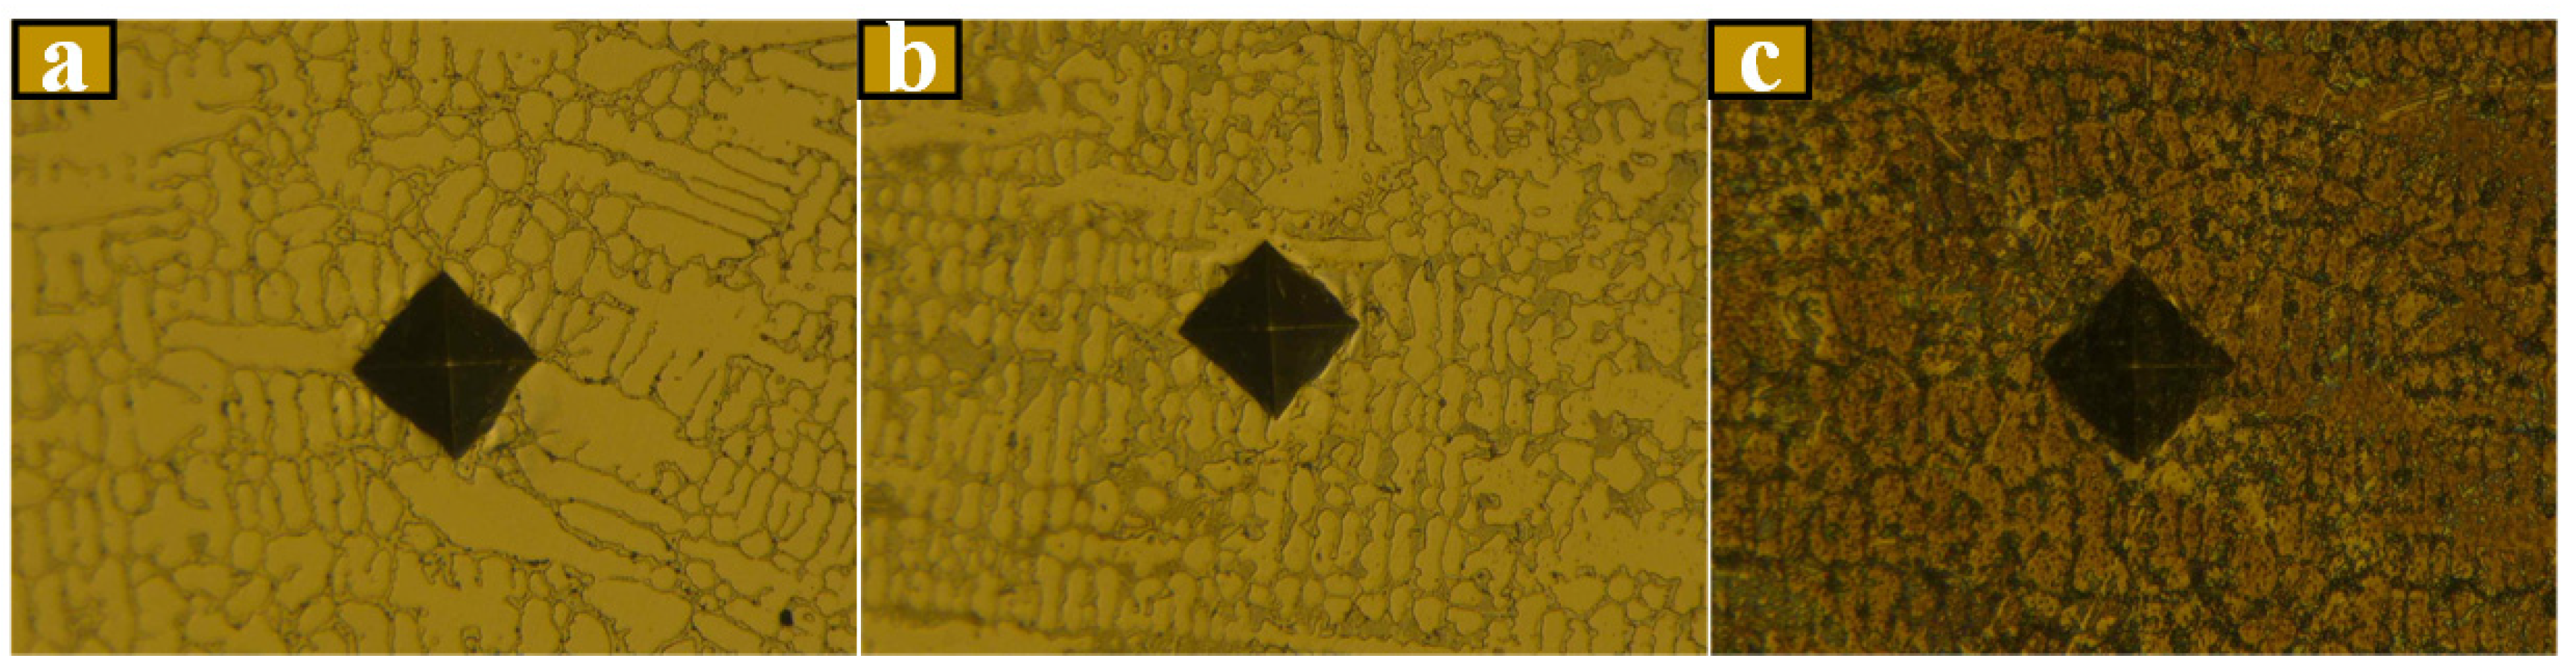
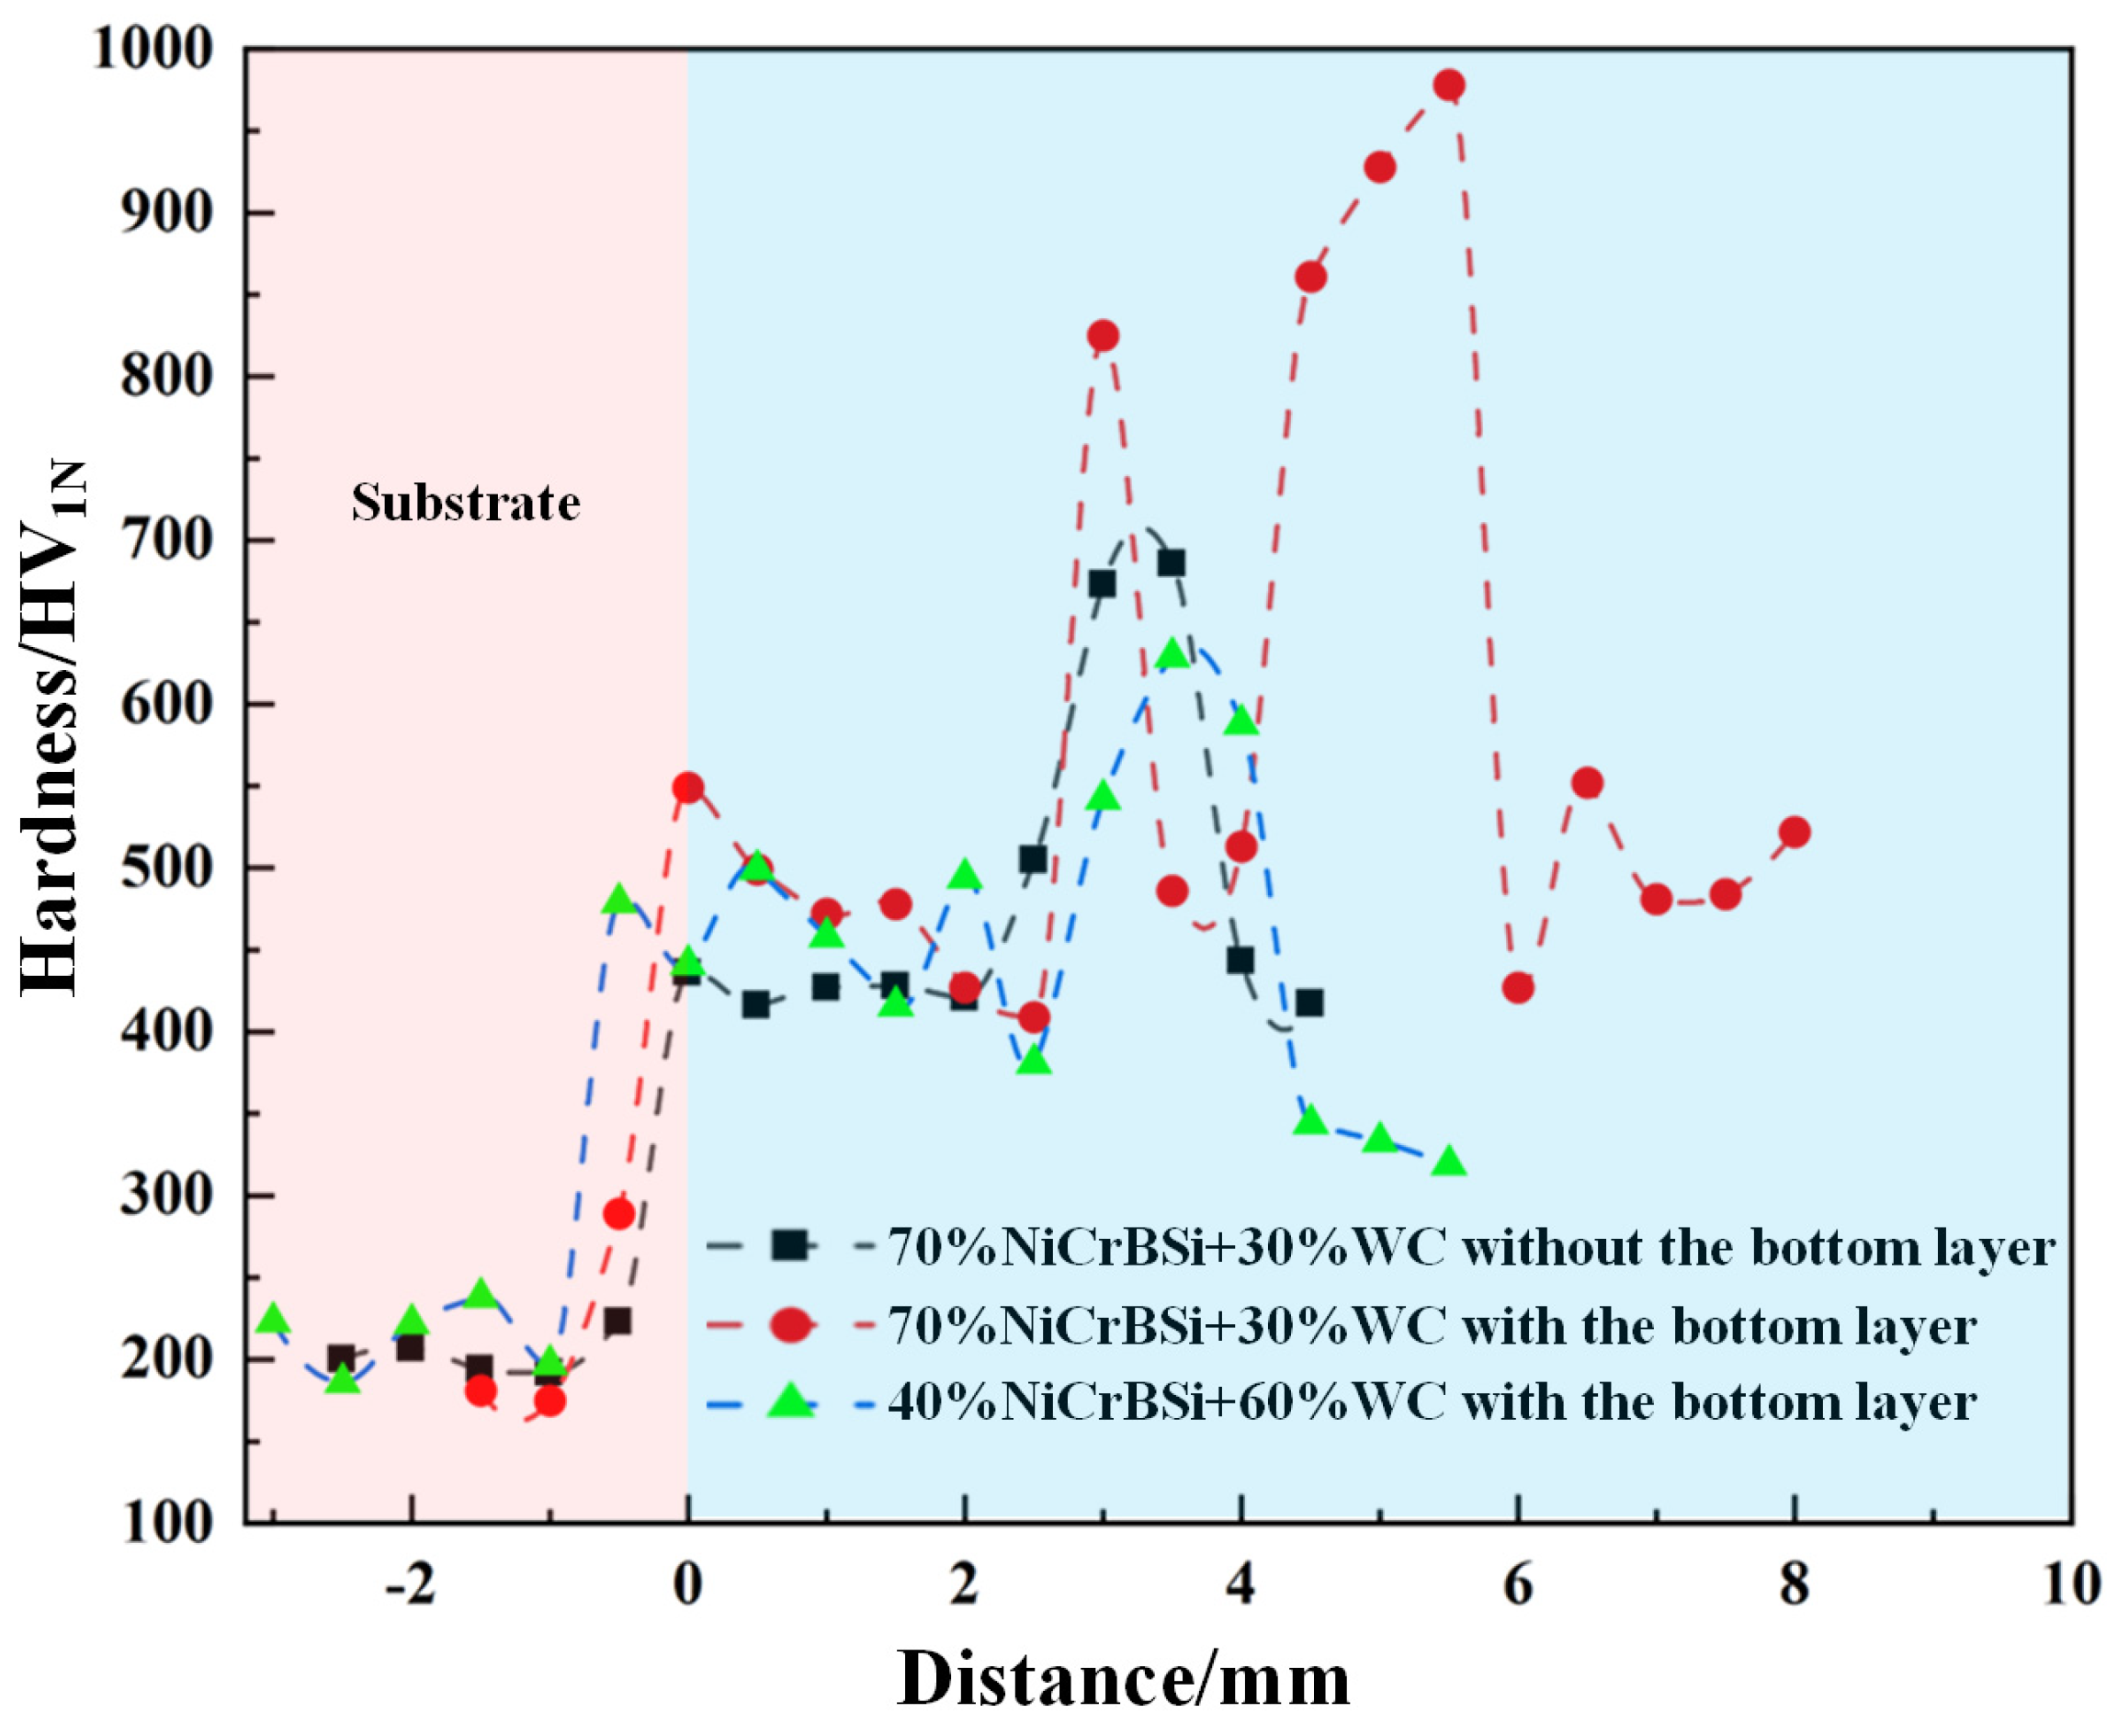
4.3. Analysis of Microhardness

The hardness of the welding layer, heat affected zone and substrate were tested by a QNESS-Q10M Vickers hardness tester. The sample was polished and placed on the test bench. A diamond indenter was used to apply 1 N load perpendicular to the sample surface, and the load duration was 15 s. After the test, the sample surface was distressed, and the test data was recorded. To accurately measure hardness changes along the depth direction, dots were placed along a linear distance of 1 mm, creating a total of three lines. Due to the difference in thickness of the welding layer, 70% NiCrBSi + 30% WC filler metal had 15 hardness points without the bottom layer, 70% NiCrBSi + 30% WC filler metal had 20 points at the bottom welding layer, and 40% NiCrBSi + 60% WC filler metal had 18 hardness points at the bottom welding layer. The full microhardness indentation is shown in Figure 14, Figure 15 and Figure 16. As shown in Figure 17, the hardness indentation enlargement diagram shows that the amount of hard phase contained in different hard points is obviously different.
Three hardness curves were printed for each test piece, and the average value was taken. The hardness changes along the surfacing depth direction are shown in Figure 18. The results show that due to the formation of W elements and C elements after WC decomposition, the hard phase of chromium carbide generated by Cr in the molten pool exists in the area between the branches, and the distribution is uneven, in which the hardness of the hard phase is high, the hardness of the adhesive phase is low, and the hard phase content at the hardness point is different, resulting in the uneven hardness of the surfacing layer.
In the 70% NiCrBSi + 30% WC filler metal without a bottom welding layer, the hardness of the welding layer at the fusion zone substrate and the top of the welding layer is relatively small, close to 440 HV. This indicates that there is less hard phase content here, and less hard phase is hit during the dot process. When the hardness in the middle of the welding layer is higher, the maximum hardness is 714 HV. 70% NiCrBSi + 30% WC filler metal is in the bottom welding layer, and the hardness at the top of the welding layer is still lower than that in the middle. The middle of the welding layer has the highest hardness, and the maximum hardness is close to 1000 HV. 40% NiCrBSi + 60% WC has a similar rule to the first two kinds of welding layers, but the hardness value is lower than the first two kinds. The SEM experiment results show that 40% NiCrBSi + 60% WC filler metal with the bottom layer forms a network structure, and the gap is larger, and the hardness value is calculated according to the hardness of the indenter area, resulting in the hardness value of the welding layer being lower than the first two kinds.

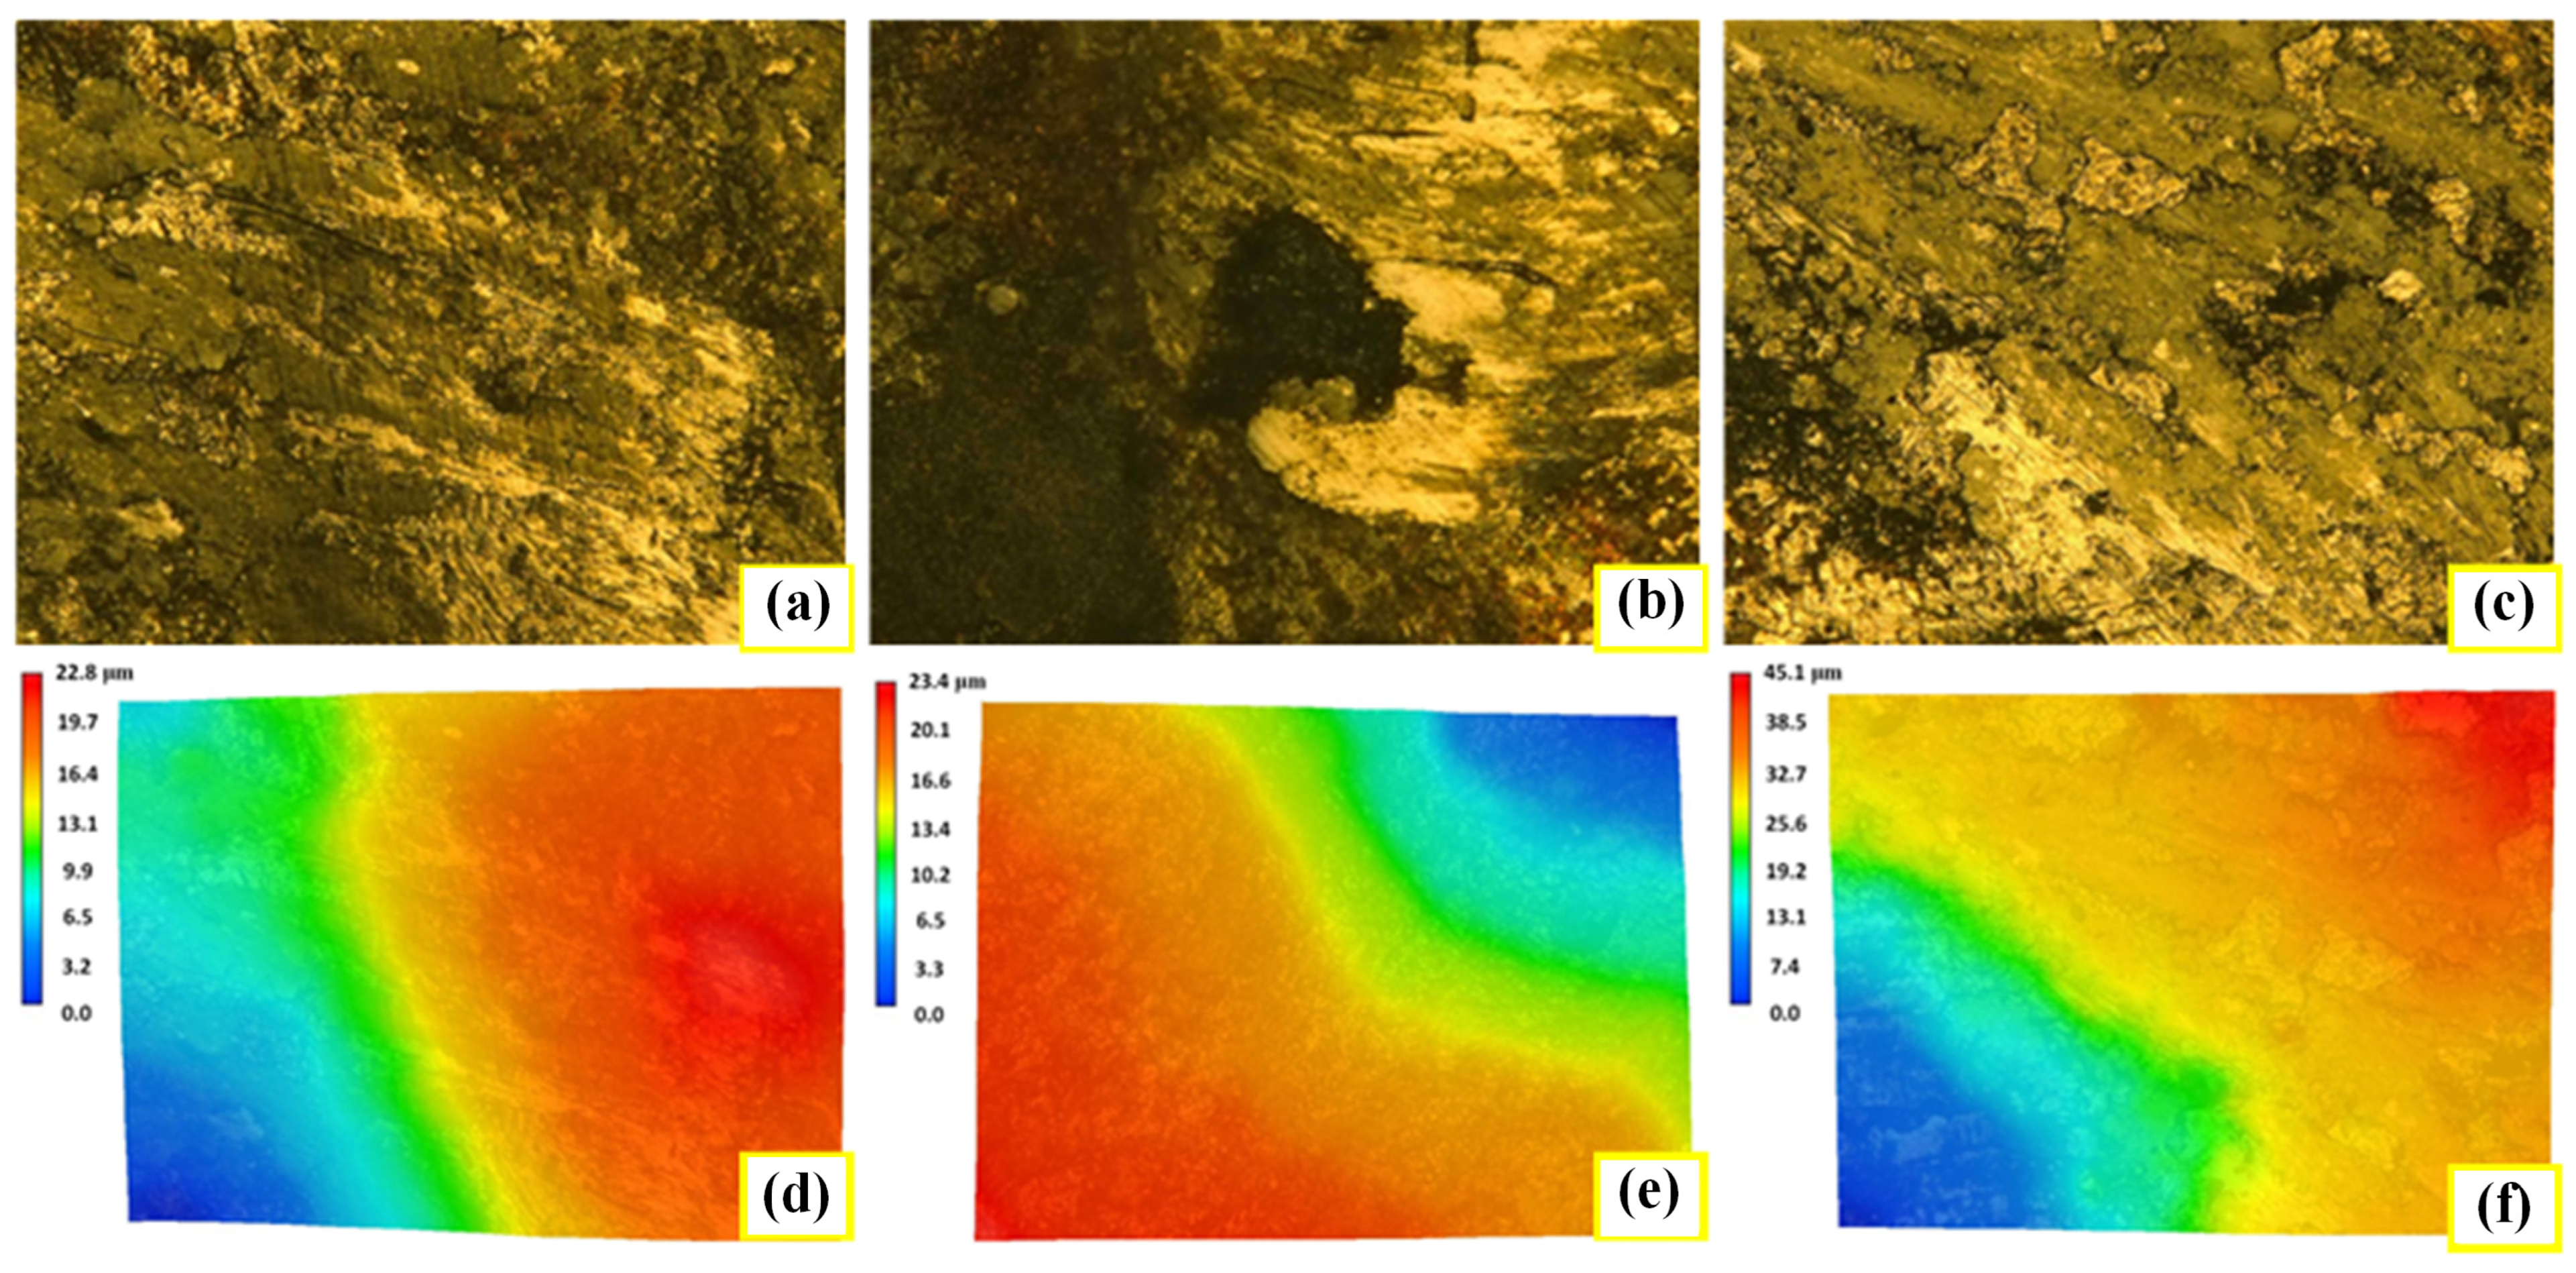
4.4. Analysis of Friction and Wear Results

The friction and wear curve of the prepared welding layer is shown in Figure 19. The experiment shows that the friction coefficient of the cladding layer is increasing in the pre-friction and mid-friction period, and in the late friction period, the friction coefficient is in a stable and fluctuating state. There is a certain amount of oxide on the surface of the front and middle welding layers, which has low hardness and low friction coefficient. In the experiment, the surface oxide layer should be removed first, and then rubbed with the welding layer. Due to the uneven distribution of the hard phase, the wear resistance of the welding layer near the surface is poor. After 20 min, the friction coefficient of 30% WC welding layer tended to be stable, the maximum friction coefficient is 0.2561, and the average friction coefficient is 0.2136. After about 20 min, the friction coefficient of 60% WC welding layer fluctuates up and down around 0.2732, the maximum friction coefficient is 0.3423, and the average friction coefficient is 0.2710. The experimental results show that the wear resistance of 30% WC welding layer is better than that of 60% WC welding layer.
The morphology of wear marks after friction and wear experiment is shown in Figure 20a–c. Under 200× electron microscope, the abrasion marks are clearly visible. On the 3D wear mark topography, the horizontal height of the wear mark is low, and the height difference between the upper left corner and lower right corner of the welding layer in Figure 20d–f is present. The experiments show that the hard phase presence improves the surface wear resistance of the welding layer, and the surface wear marks of 60% WC welding layer are deeper than those of 30% WC welding layer.

4.5. Analysis of Electrochemical Corrosion Experiment Results

To analyze the corrosion resistance of the welding layer, 304 stainless-steel with high corrosion resistance was selected for comparative analysis. Polarization curves of the welding layer with different WC contents is shown in Figure 21a. The horizontal coordinate is corrosion current (I) and the vertical coordinate is corrosion potential (E). The self-etching potential and self-etching current density were calculated using the Tafel extrapolation method to characterize the corrosion degree. The self-corrosion current density, self-corrosion potential and corrosion rate of various materials were obtained by calculation, as shown in Table 7. The self-corrosion current density of 304 stainless steel is 1.79 ×10⁻¹⁰ A/cm2, the self-corrosion potential is −0.23207 V, and the corrosion rate is 2.10 × 10⁻⁶ mm/a.
The electrochemical kinetics criterion is that the lower the self-corrosion current density, the slower the corrosion rate [26,27]. The electrochemical thermodynamic criterion is that the more positive the self-corrosion potential, the stronger the corrosion resistance [28,29]. By analyzing the electrochemical corrosion data of the welding layer with the progress of corrosion, the corrosion potential of the welding layer is smaller than 304 stainless steel, the self-corrosion current density of the welding layer is two orders of magnitude larger than 304 stainless steel, and the corrosion rate is 325 times higher than 304 stainless steel. The corrosion resistance of the nickel-based WC welding layer is significantly different from that of 304 stainless-steel.
By comparing the data of the self-corrosion rate, the corrosion resistance can be obtained. The self-corrosion rate of 70% NiCrBSi + 30% WC filler metal without the bottom layer is 6.5389 × 10⁻⁴ mm/a, 70% NiCrBSi + 30% WC filler metal with the bottom layer is 6.4972 × 10⁻³ mm/a, and the self-corrosion rate of 40% NiCrBSi + 60% WC filler metal with the bottom layer is 7.0596 × 10⁻⁴ mm/a. 70% NiCrBSi + 30% WC filler metal with the bottom layer has the weakest corrosion resistance, and 40% NiCrBSi + 60% WC filler metal with the bottom layer has the strongest corrosion resistance. In summary, the more WC added, the stronger the corrosion resistance of the welding layer, and the impact of the bottom layer on the corrosion resistance of the welding layer is small.
The open circuit potential–time curve of welding layer with different WC contents is shown in Figure 21b. It can be seen from Figure 21b that with the increase in time, the potential of 304 stainless steel moves in a positive direction, indicating that the metal surface has been passivated. 70% NiCrBSi + 30% WC without the bottom layer and 70% NiCrBSi + 30% WC with the bottom layer potential moves in a negative direction, indicating that the test surface has begun to react with the etching liquid. The potential moving speed of 70% NiCrBSi + 30% WC without the bottom layer is greater than 70% NiCrBSi + 30% WC with the bottom layer. While 40% NiCrBSi + 60% WC has the bottom layer with the increase in time, the potential basically remains unchanged. This indicates that among the three prepared surfacing layers, 40% NiCrBSi + 60% WC has the strongest corrosion resistance with the bottom layer, and 70% NiCrBSi + 30% WC has the weakest corrosion resistance without the bottom layer, but they are all smaller than stainless steel. The accuracy of the experimental results of the polarization curve was verified.

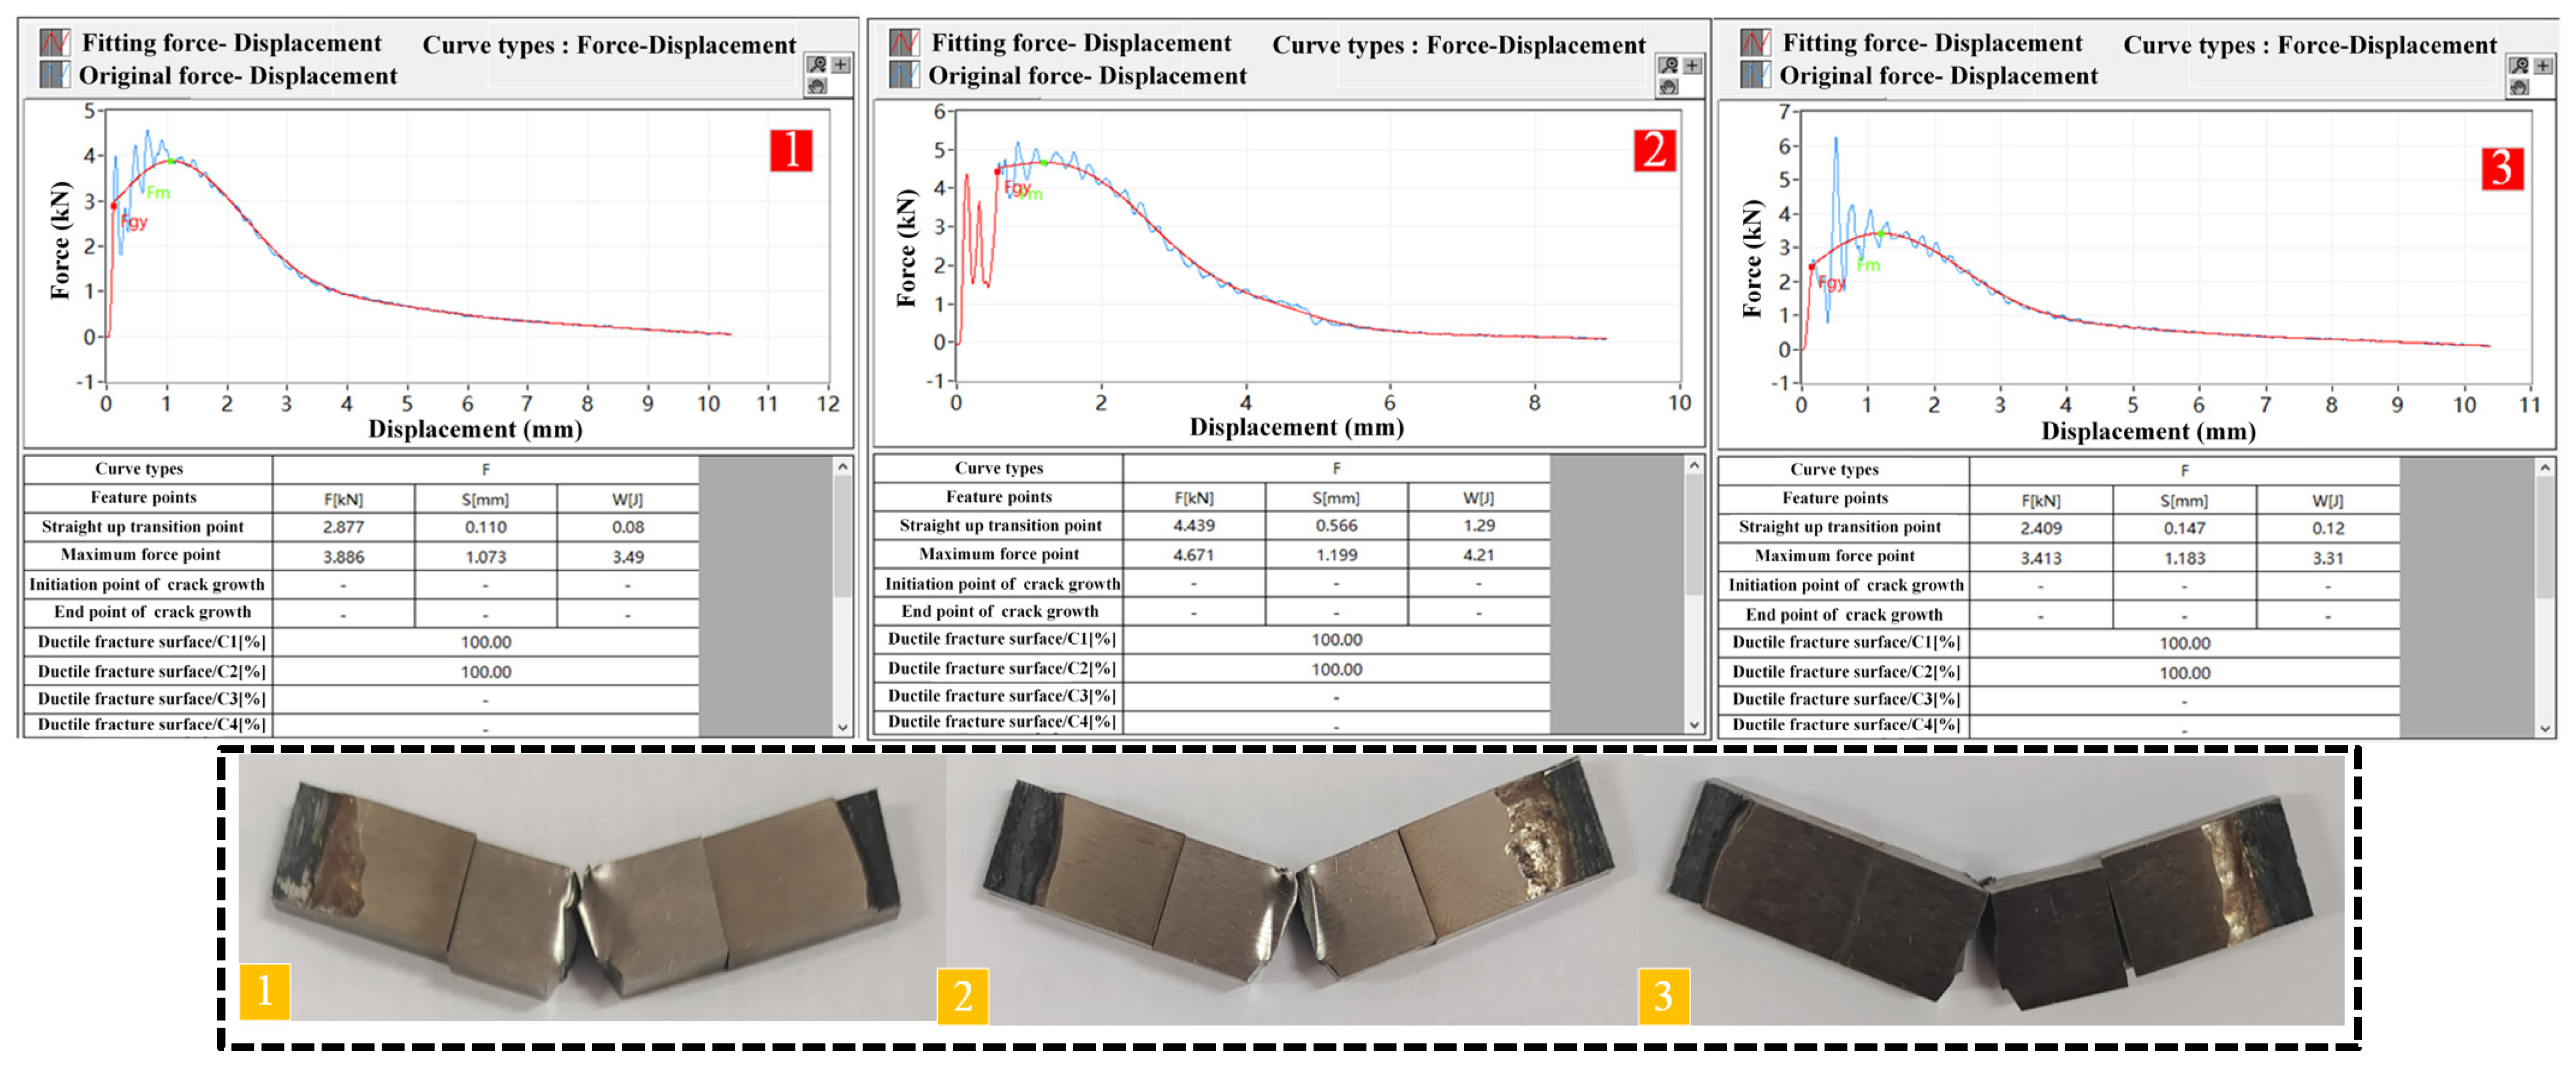
4.6. Analysis of Impact Power Experiment Results

4.6.1. 70% NiCrBSi + 30% WC Filler Metal without the Bottom Layer

The impact test curve and test block of 70% NiCrBSi + 30% WC filler metal without the bottom layer is shown in Figure 22, and the impact energy test results are shown in Table 8. The results show that the average absorbed work is 14.63 J, the average impact toughness is 36.57 J/cm2, and the average total impact energy is 13.19 J at 25 °C. The surface microstructure of the test piece after impact was observed, as shown in Figure 23. The impact surface of the substrate is bone-shaped, the impact surface of the welding layer is flake-shaped, and spherical Fe is scattered in the area of the welding layer.

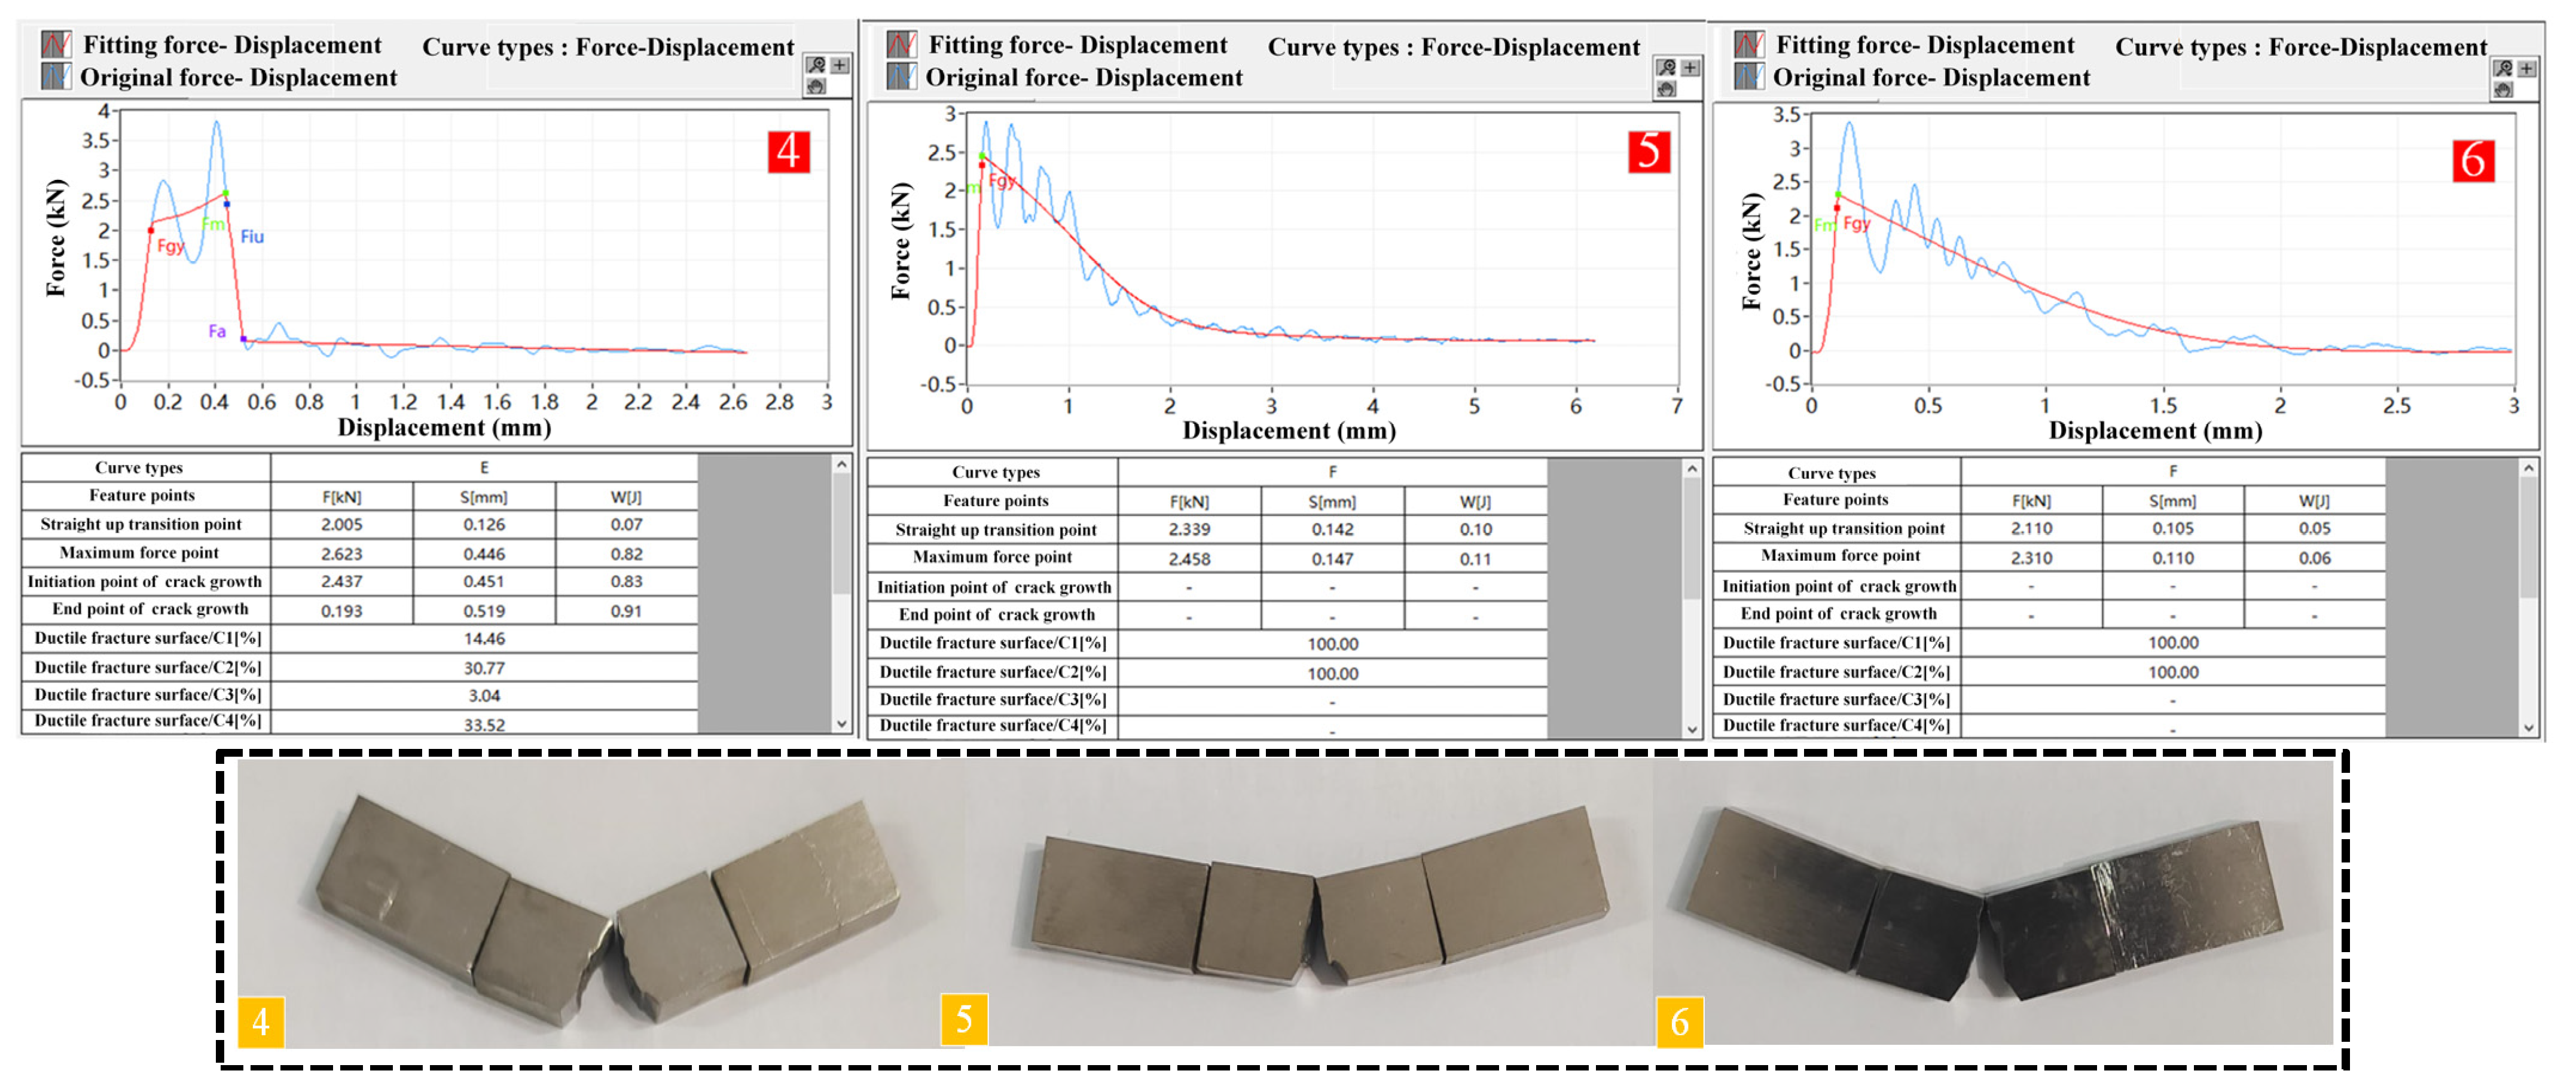
4.6.2. 70% NiCrBSi + 30% WC Filler Metal with the Bottom Layer

The impact test curve and test block of 70% NiCrBSi + 30% WC filler metal with the bottom layer is shown in Figure 24, and the impact energy test results are shown in Table 9. The results show that the average absorbed work is 2.66 J, the average impact toughness is 6.65 J/cm2, and the average total impact energy is 1.03 J at 25 °C. The surface microstructure of the test piece after impact was observed, as shown in Figure 25. The impact surface of the substrate is bone-shaped, the impact surface of the welding layer is flake-shaped, and there are spherical Fe-Ni blocks scattered on the impact surface.
In summary, the impact toughness of the WC welding layer without the bottom layer is higher, and the average impact toughness is 29.92 J/cm2 higher than that of the WC welding layer with the bottom layer. The presence of the bottom layer significantly reduces the impact toughness on the test pieces.

5. Conclusions

In this paper, Ni-Cr-B-Si alloy was used as the base powder to make submerged arc welding flux-cored wire by adding WC powder with different contents. The submerged arc welding experiment was carried out on the 42CrMo4 scaling roll substrate using welding flux-cored. Considering pre-welding preheating, thermal insulation and other processes, 70% NiCrBSi + 30% WC filler metal without the bottom layer, 70% NiCrBSi + 30% WC filler metal with the bottom layer and 70% NiCrBSi + 60% WC filler metal with the bottom layer was prepared. The material characterization experiment was carried out to analyze the influence of different processes and WC content on the welding layer performance, and the quality of the welding layer was evaluated. It provides a significant theoretical basis and practical guidance for improving the performance of submerged arc welding on descaling roll. The main conclusions are as follows:
(1)
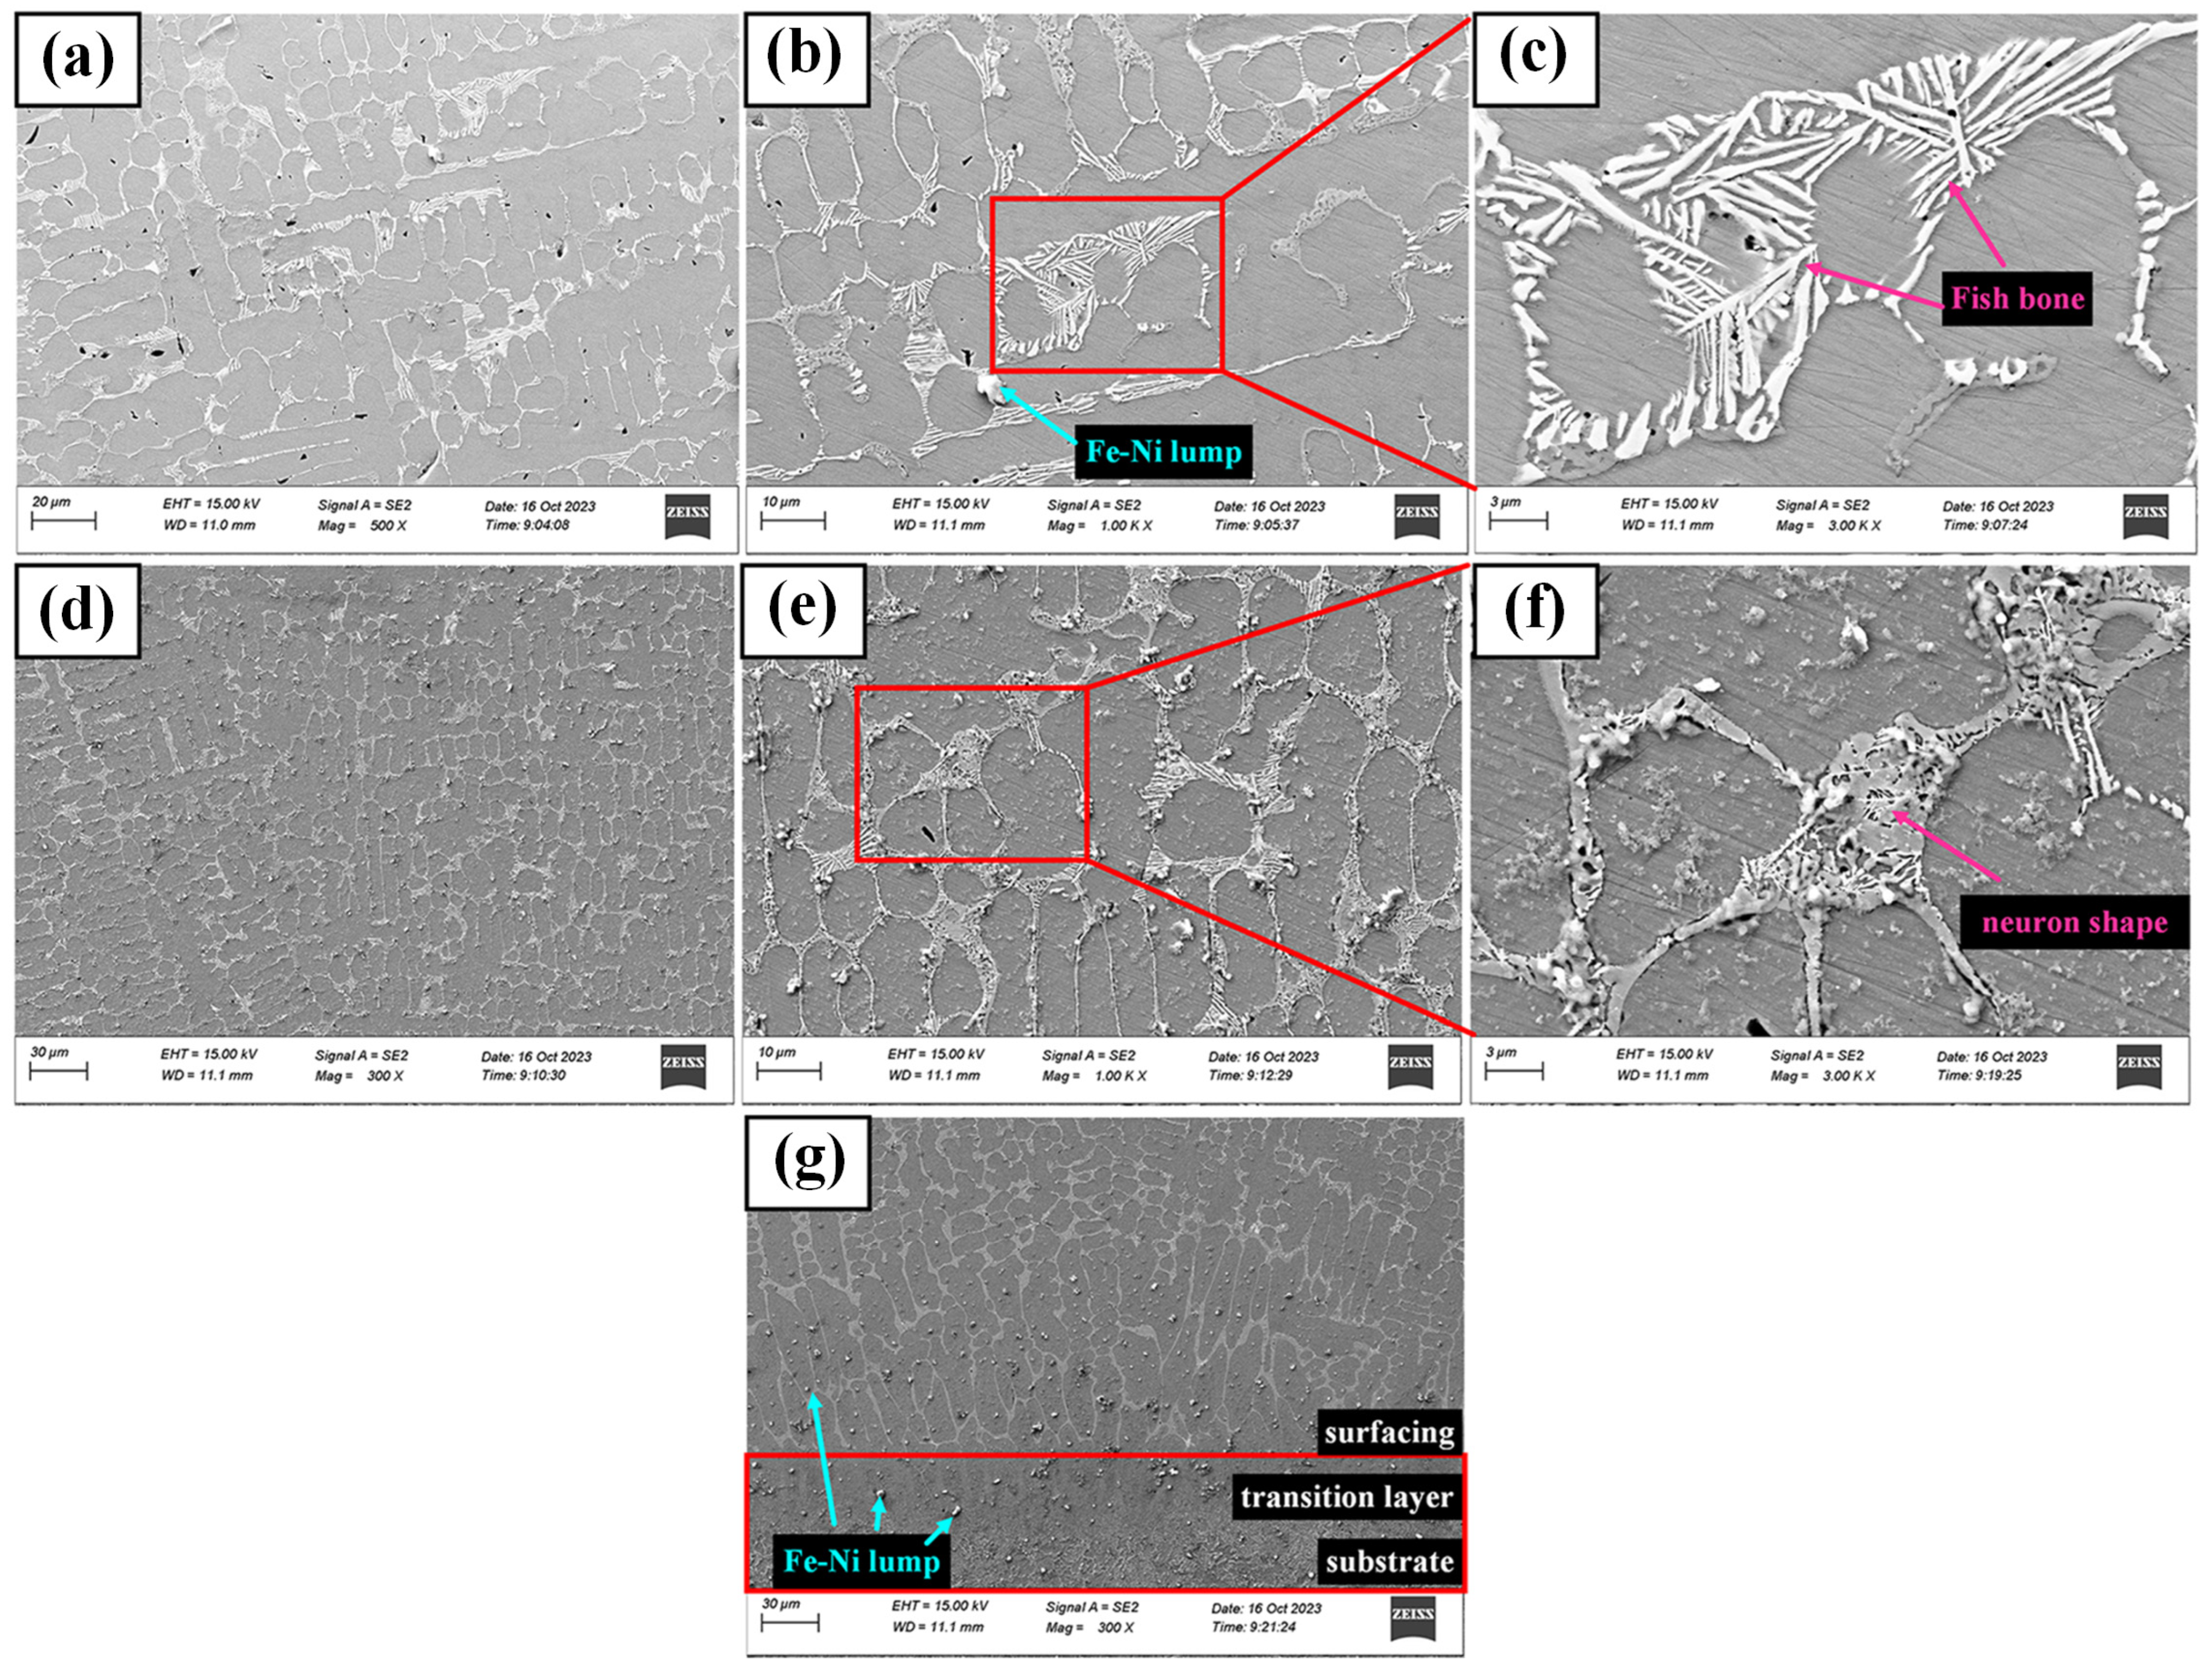
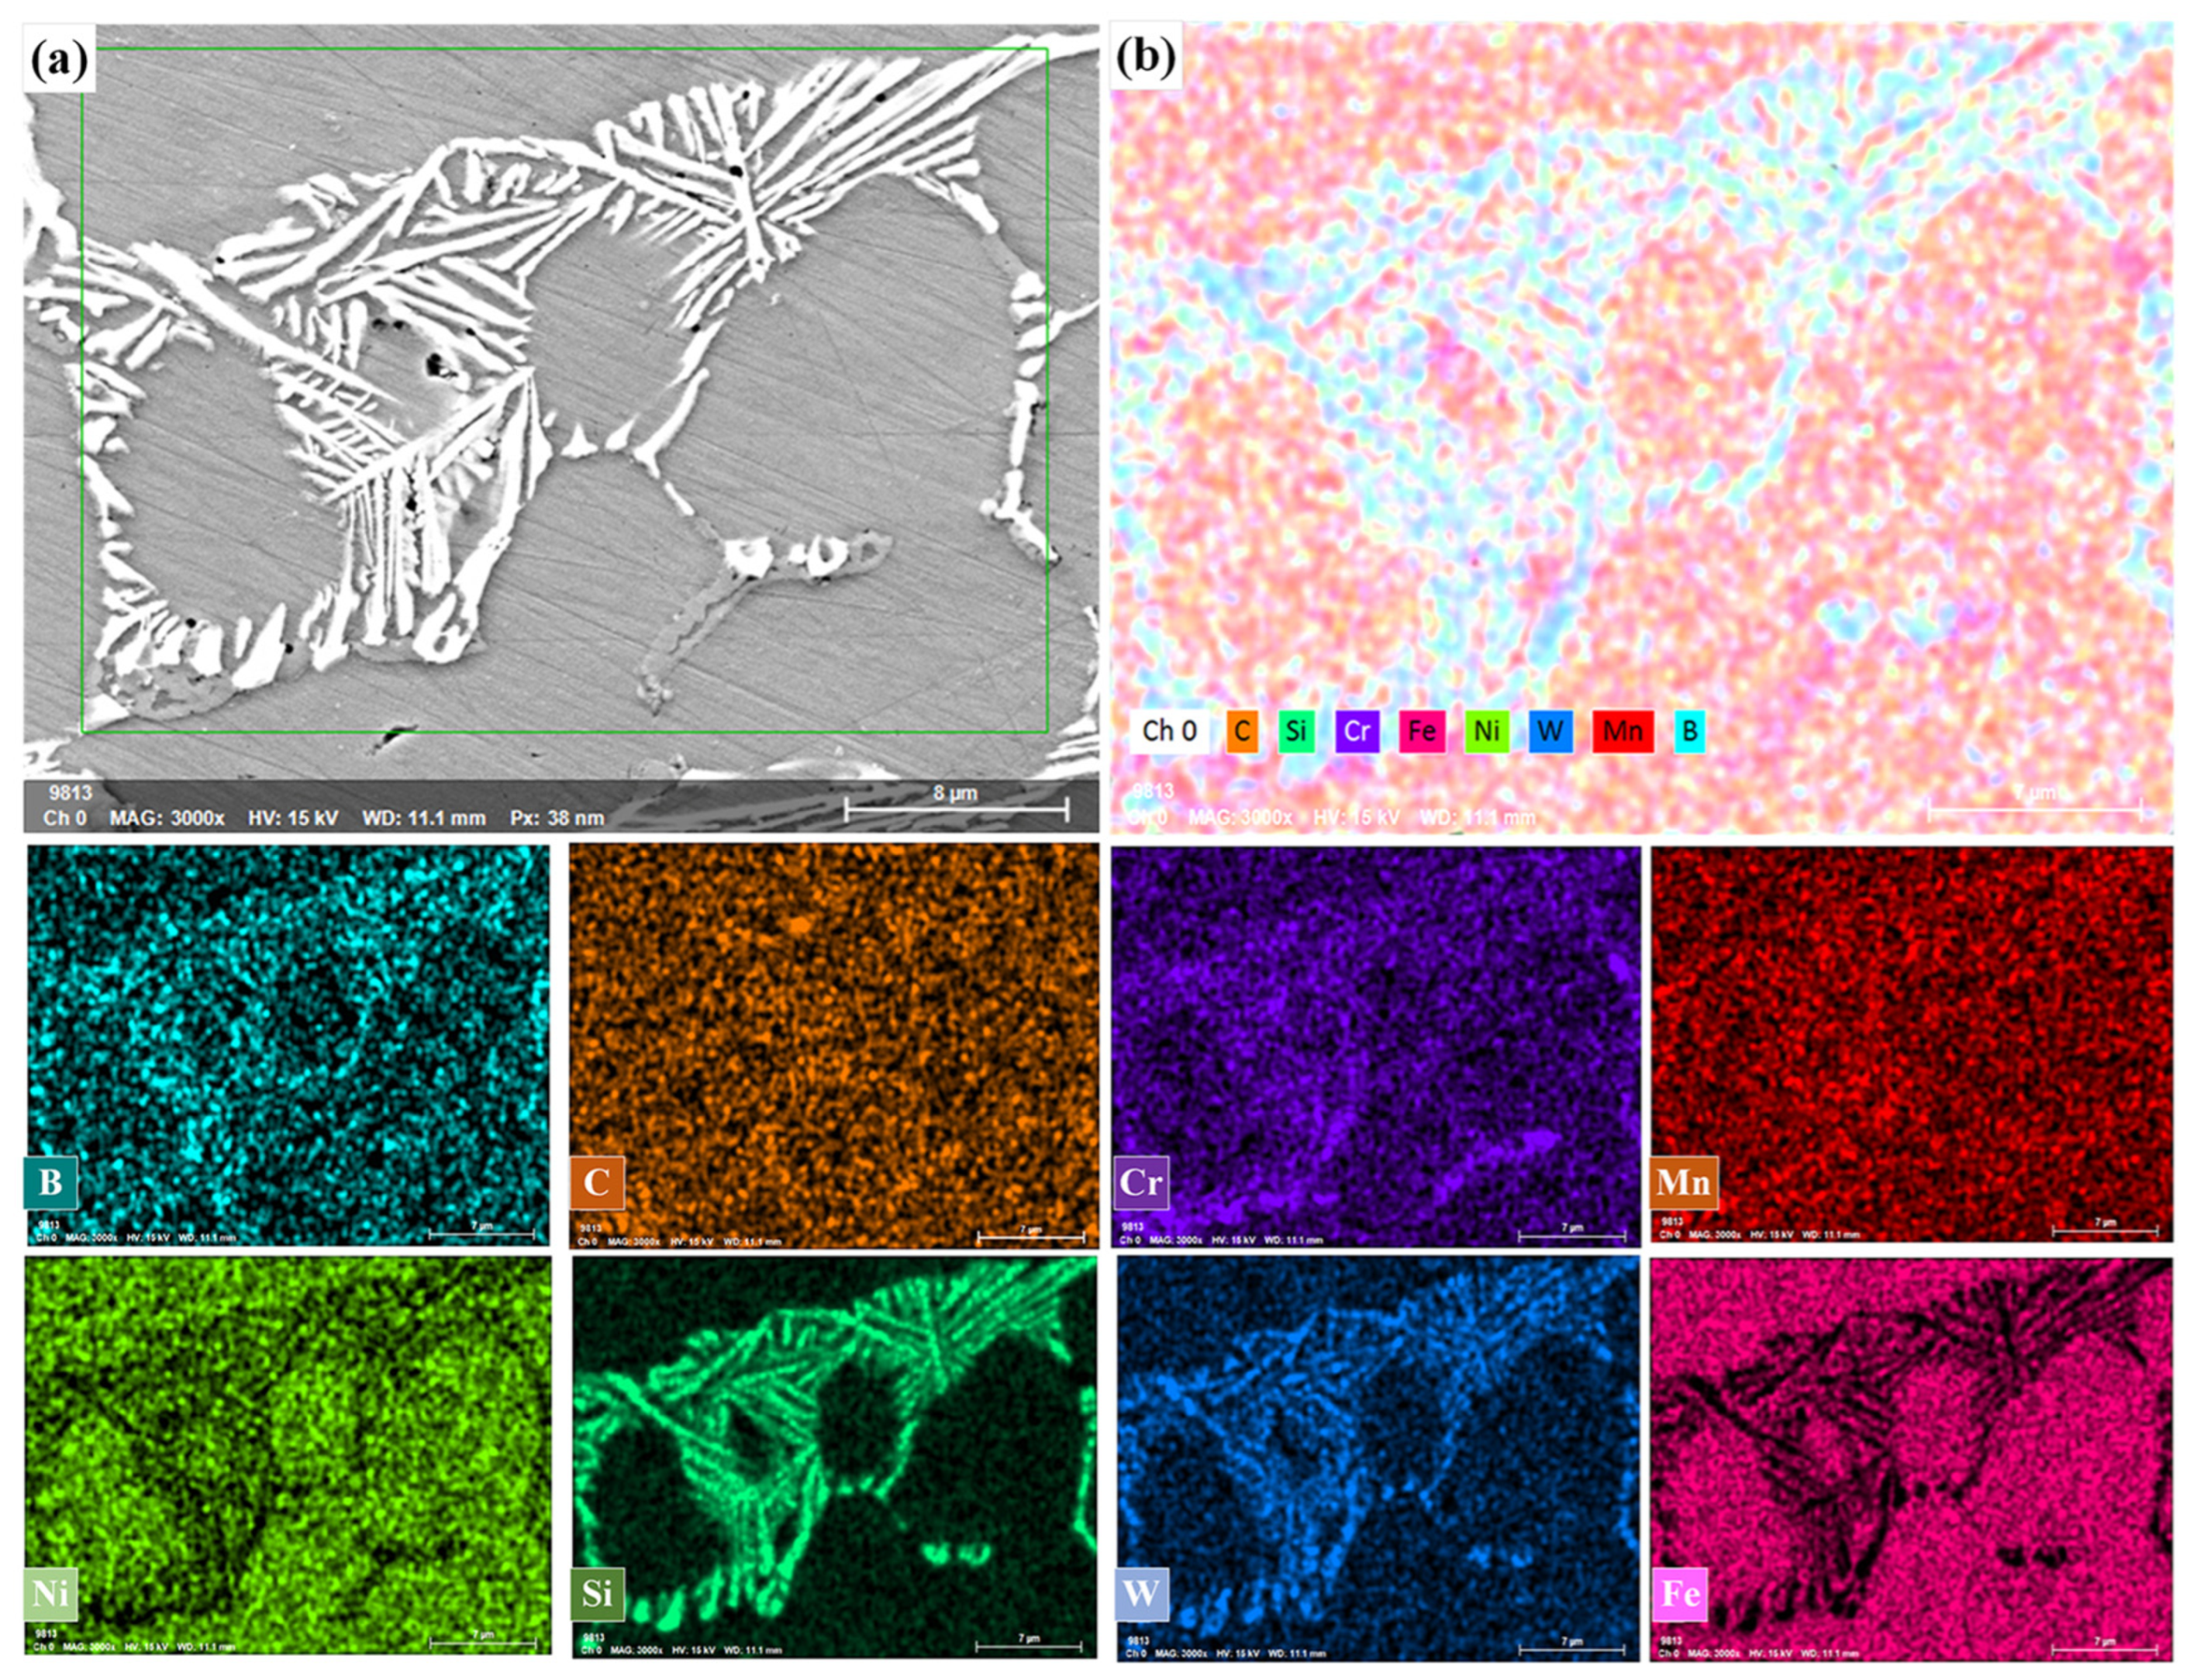
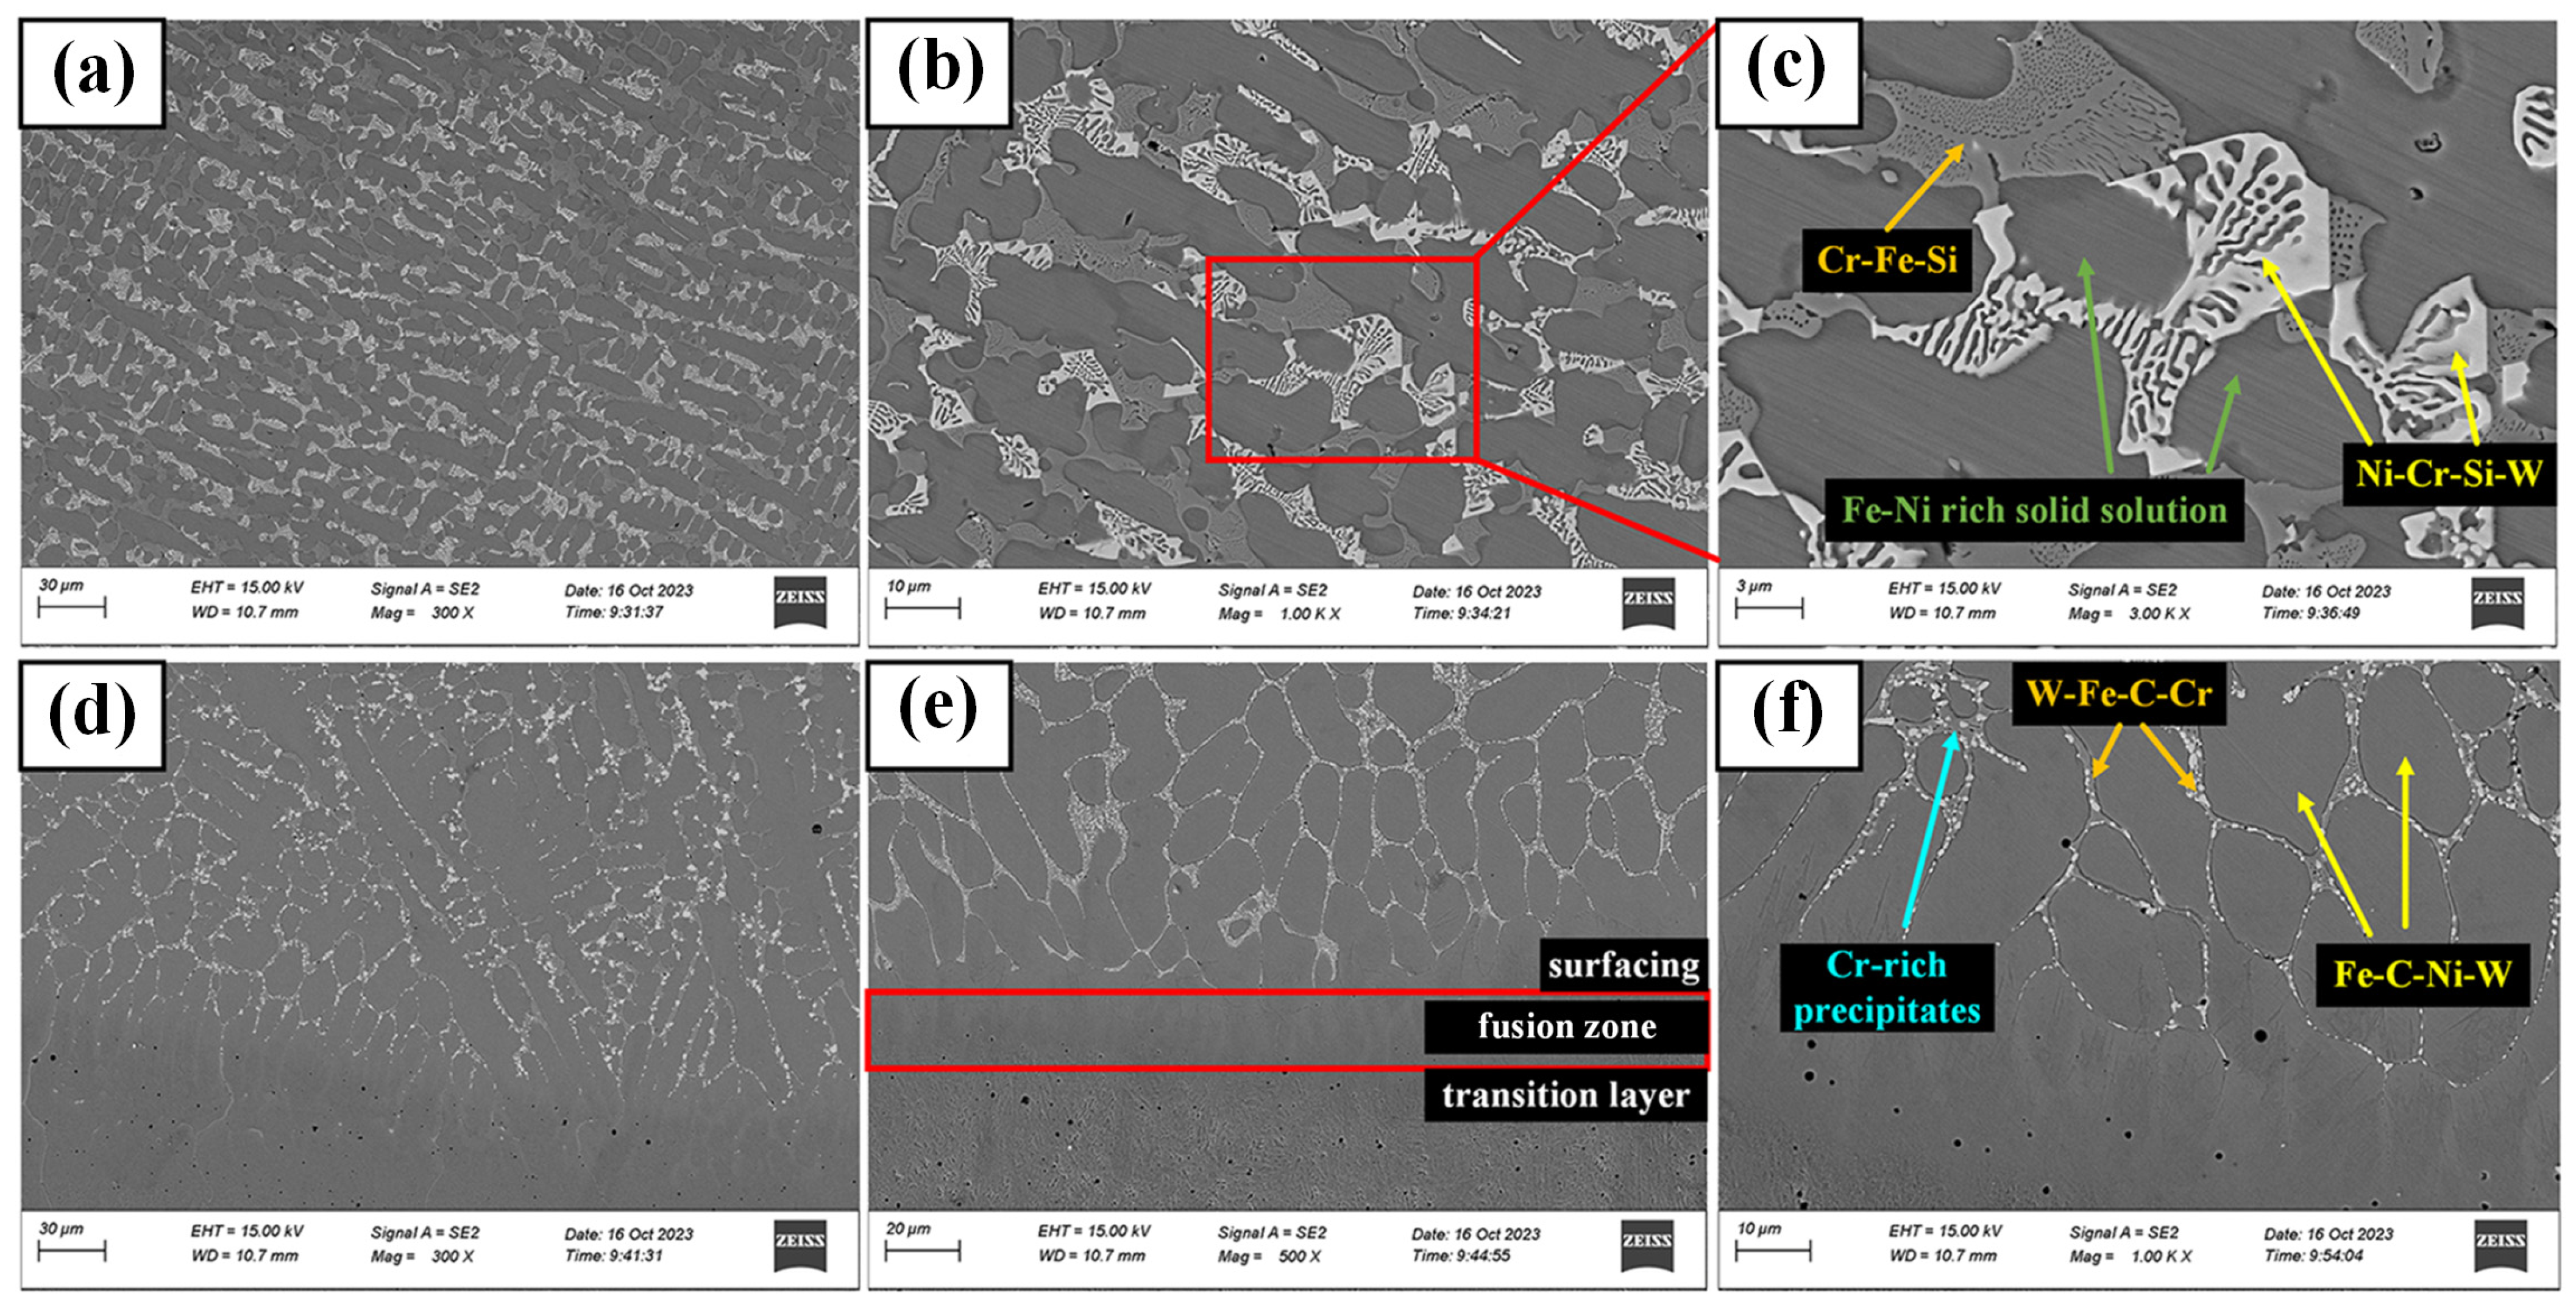
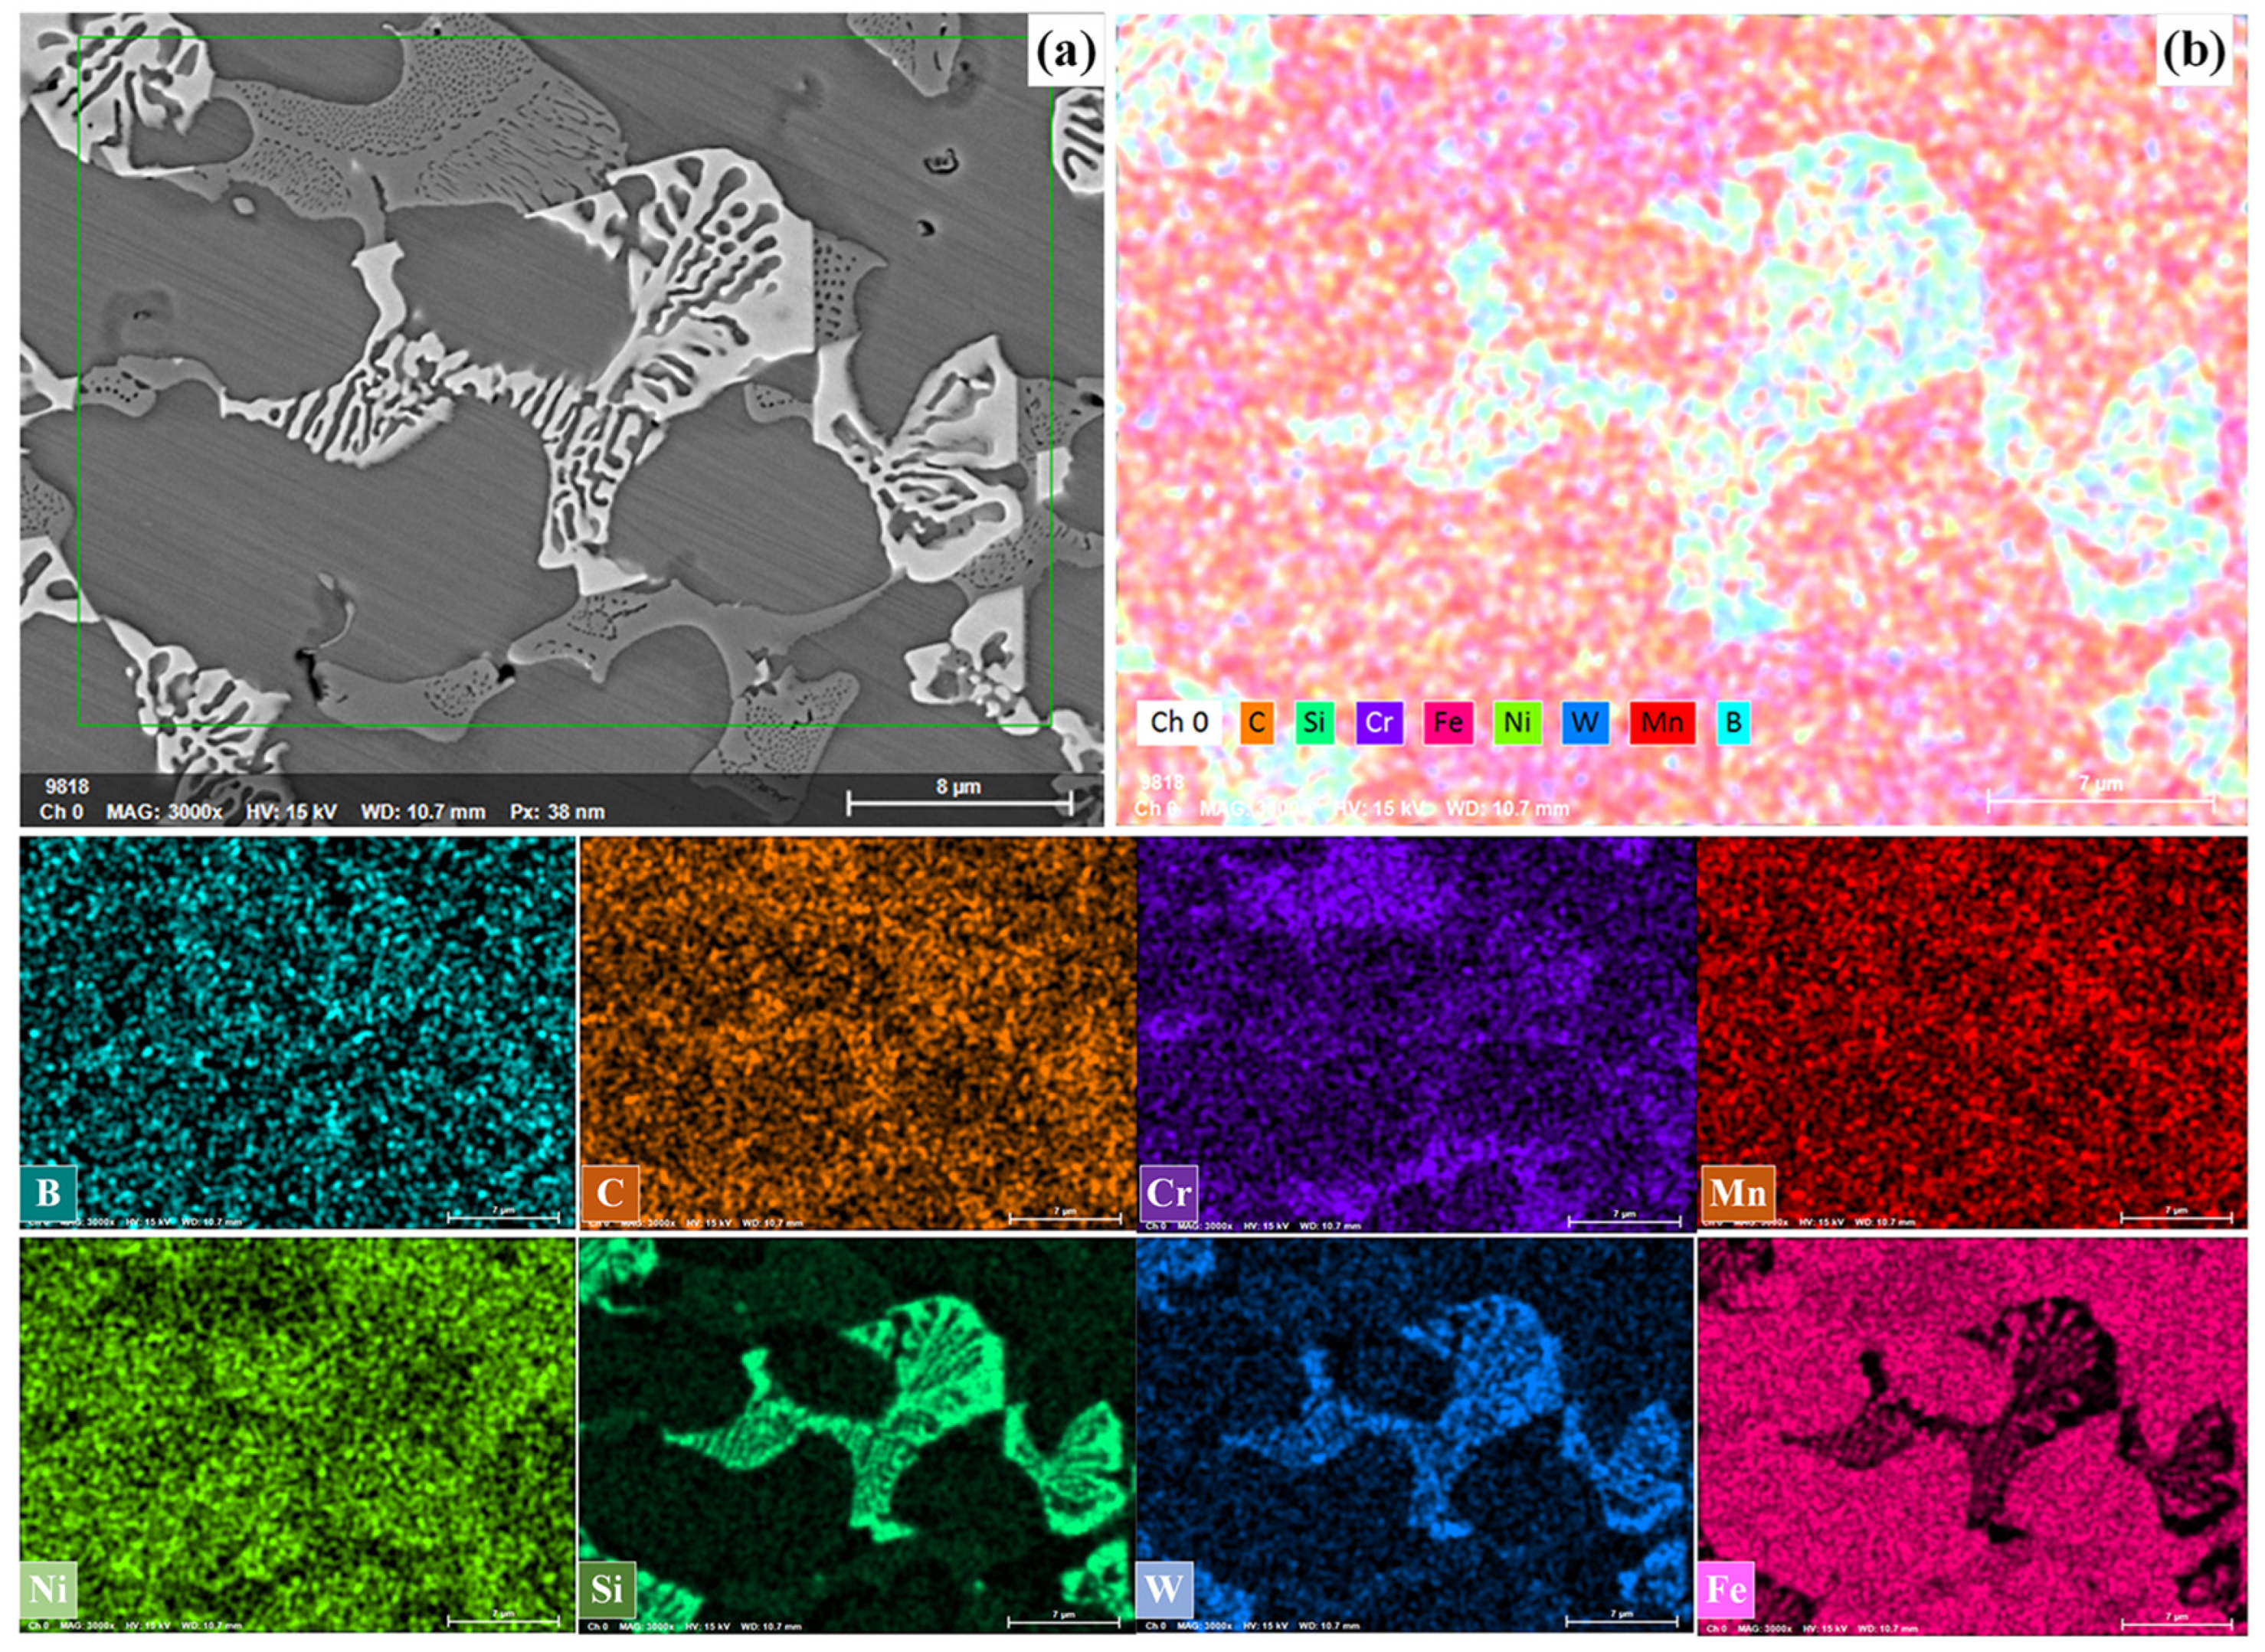
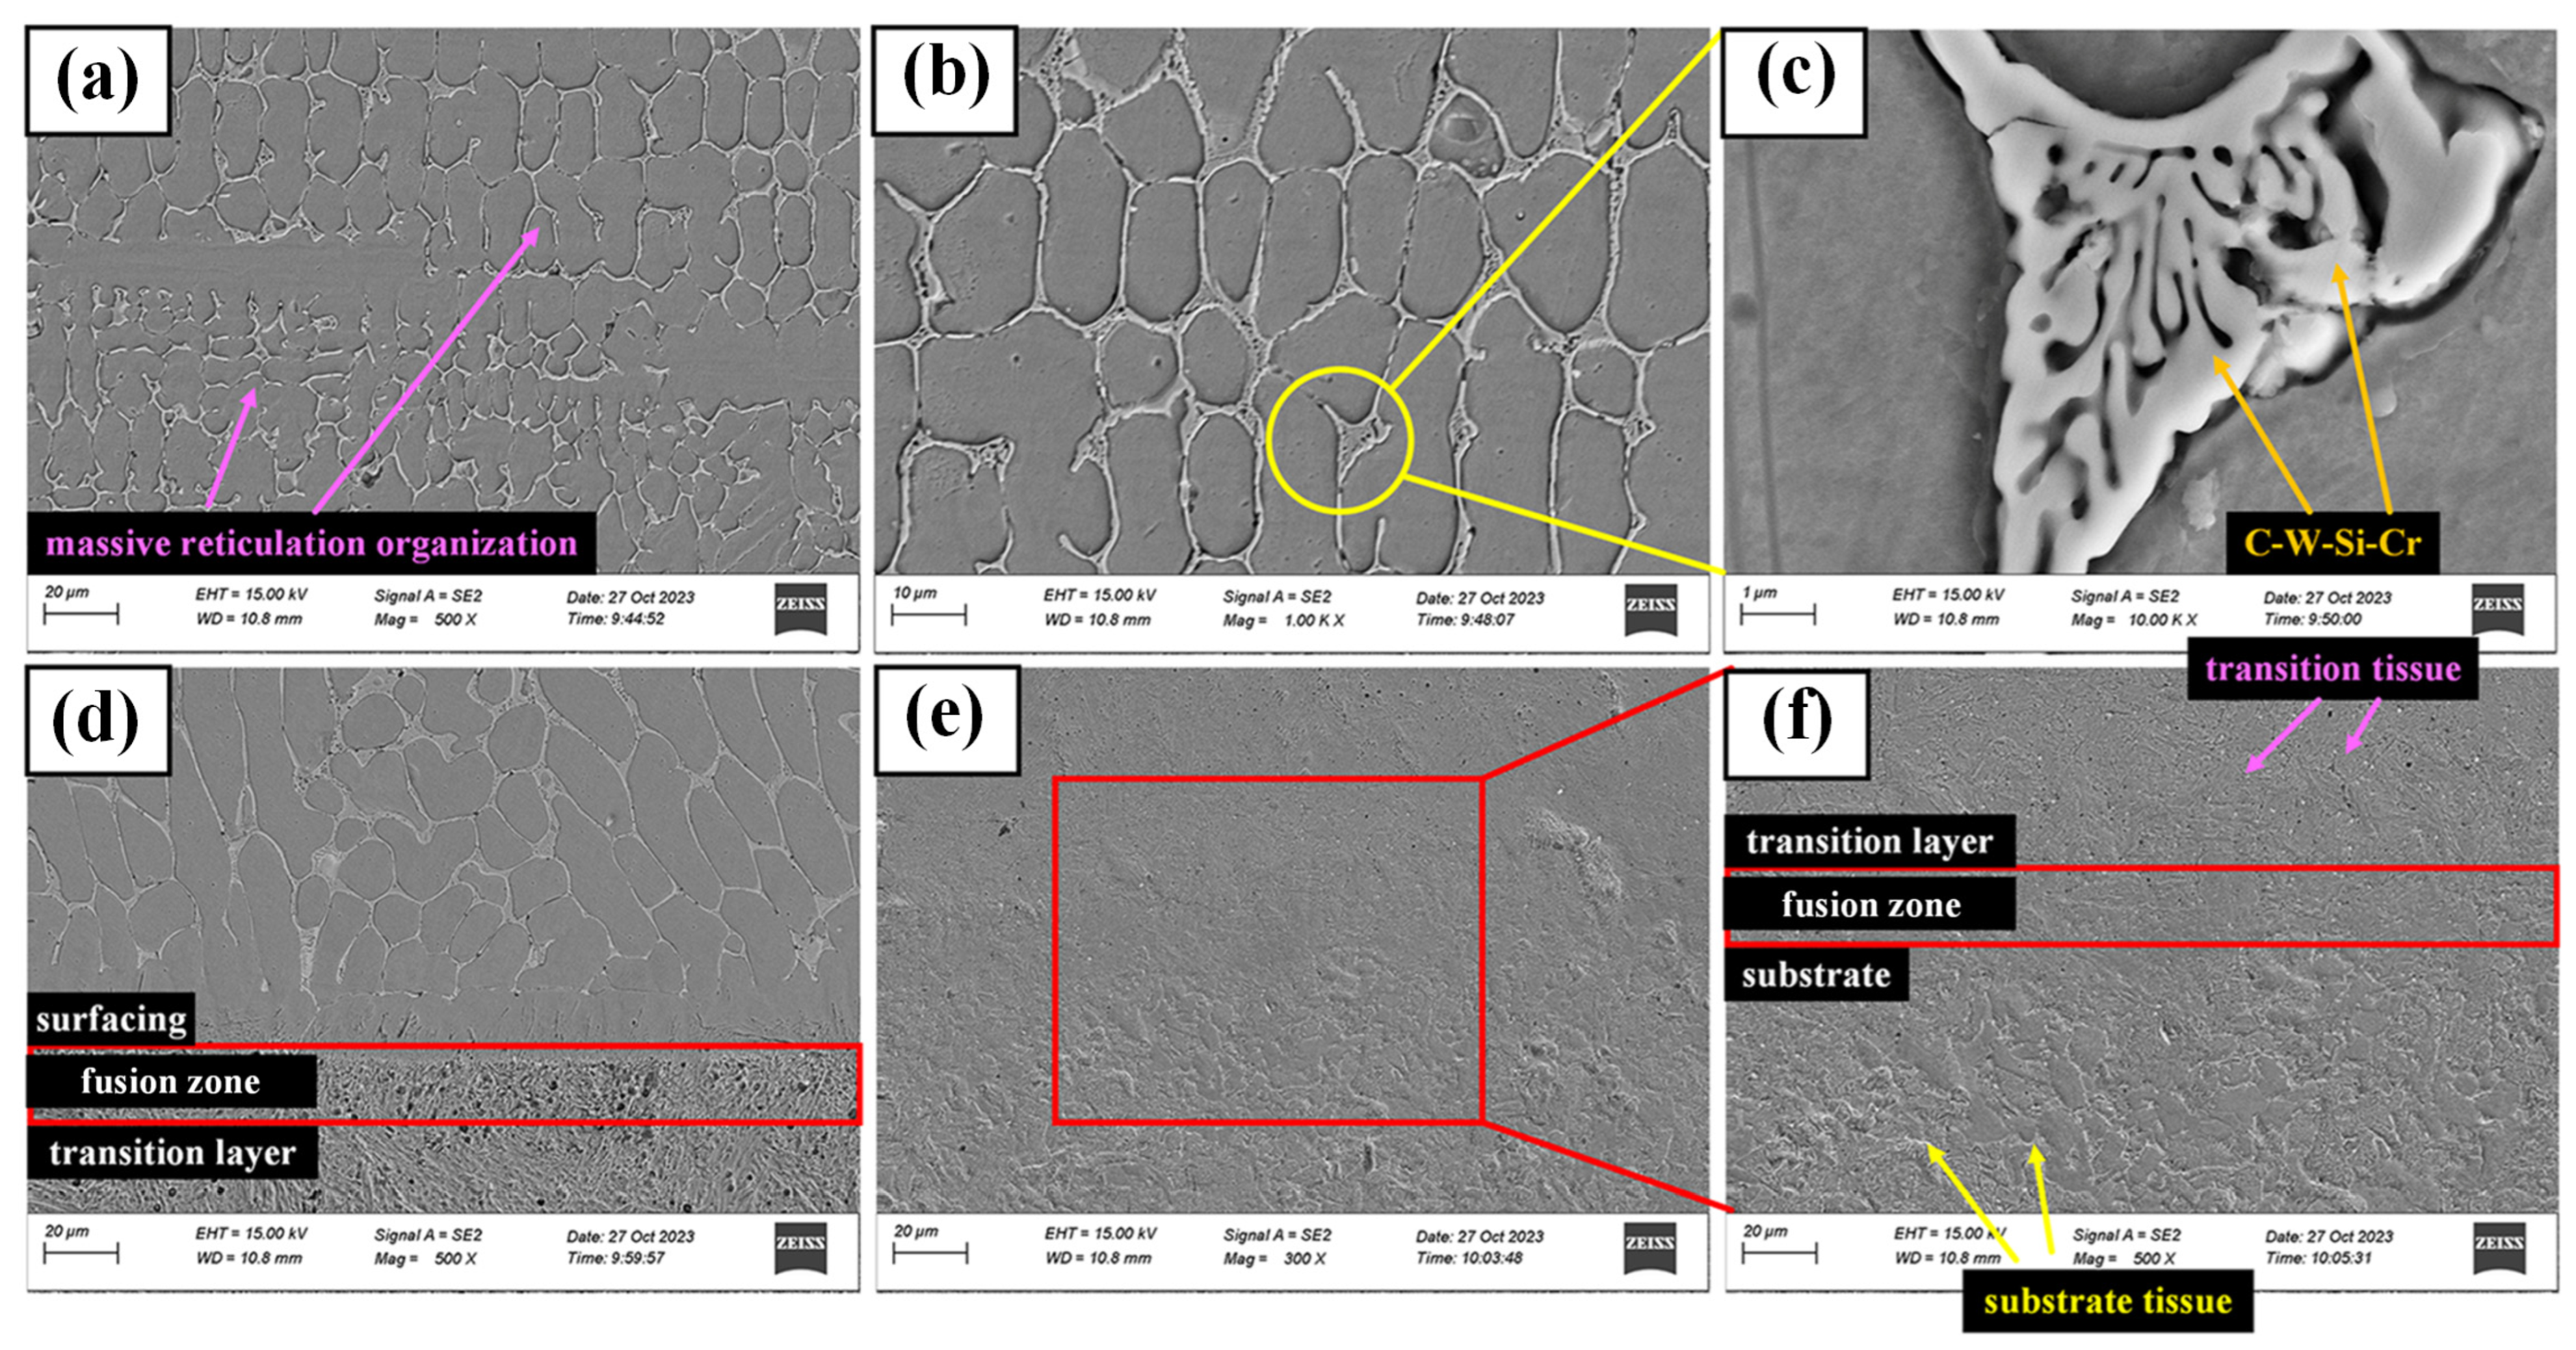
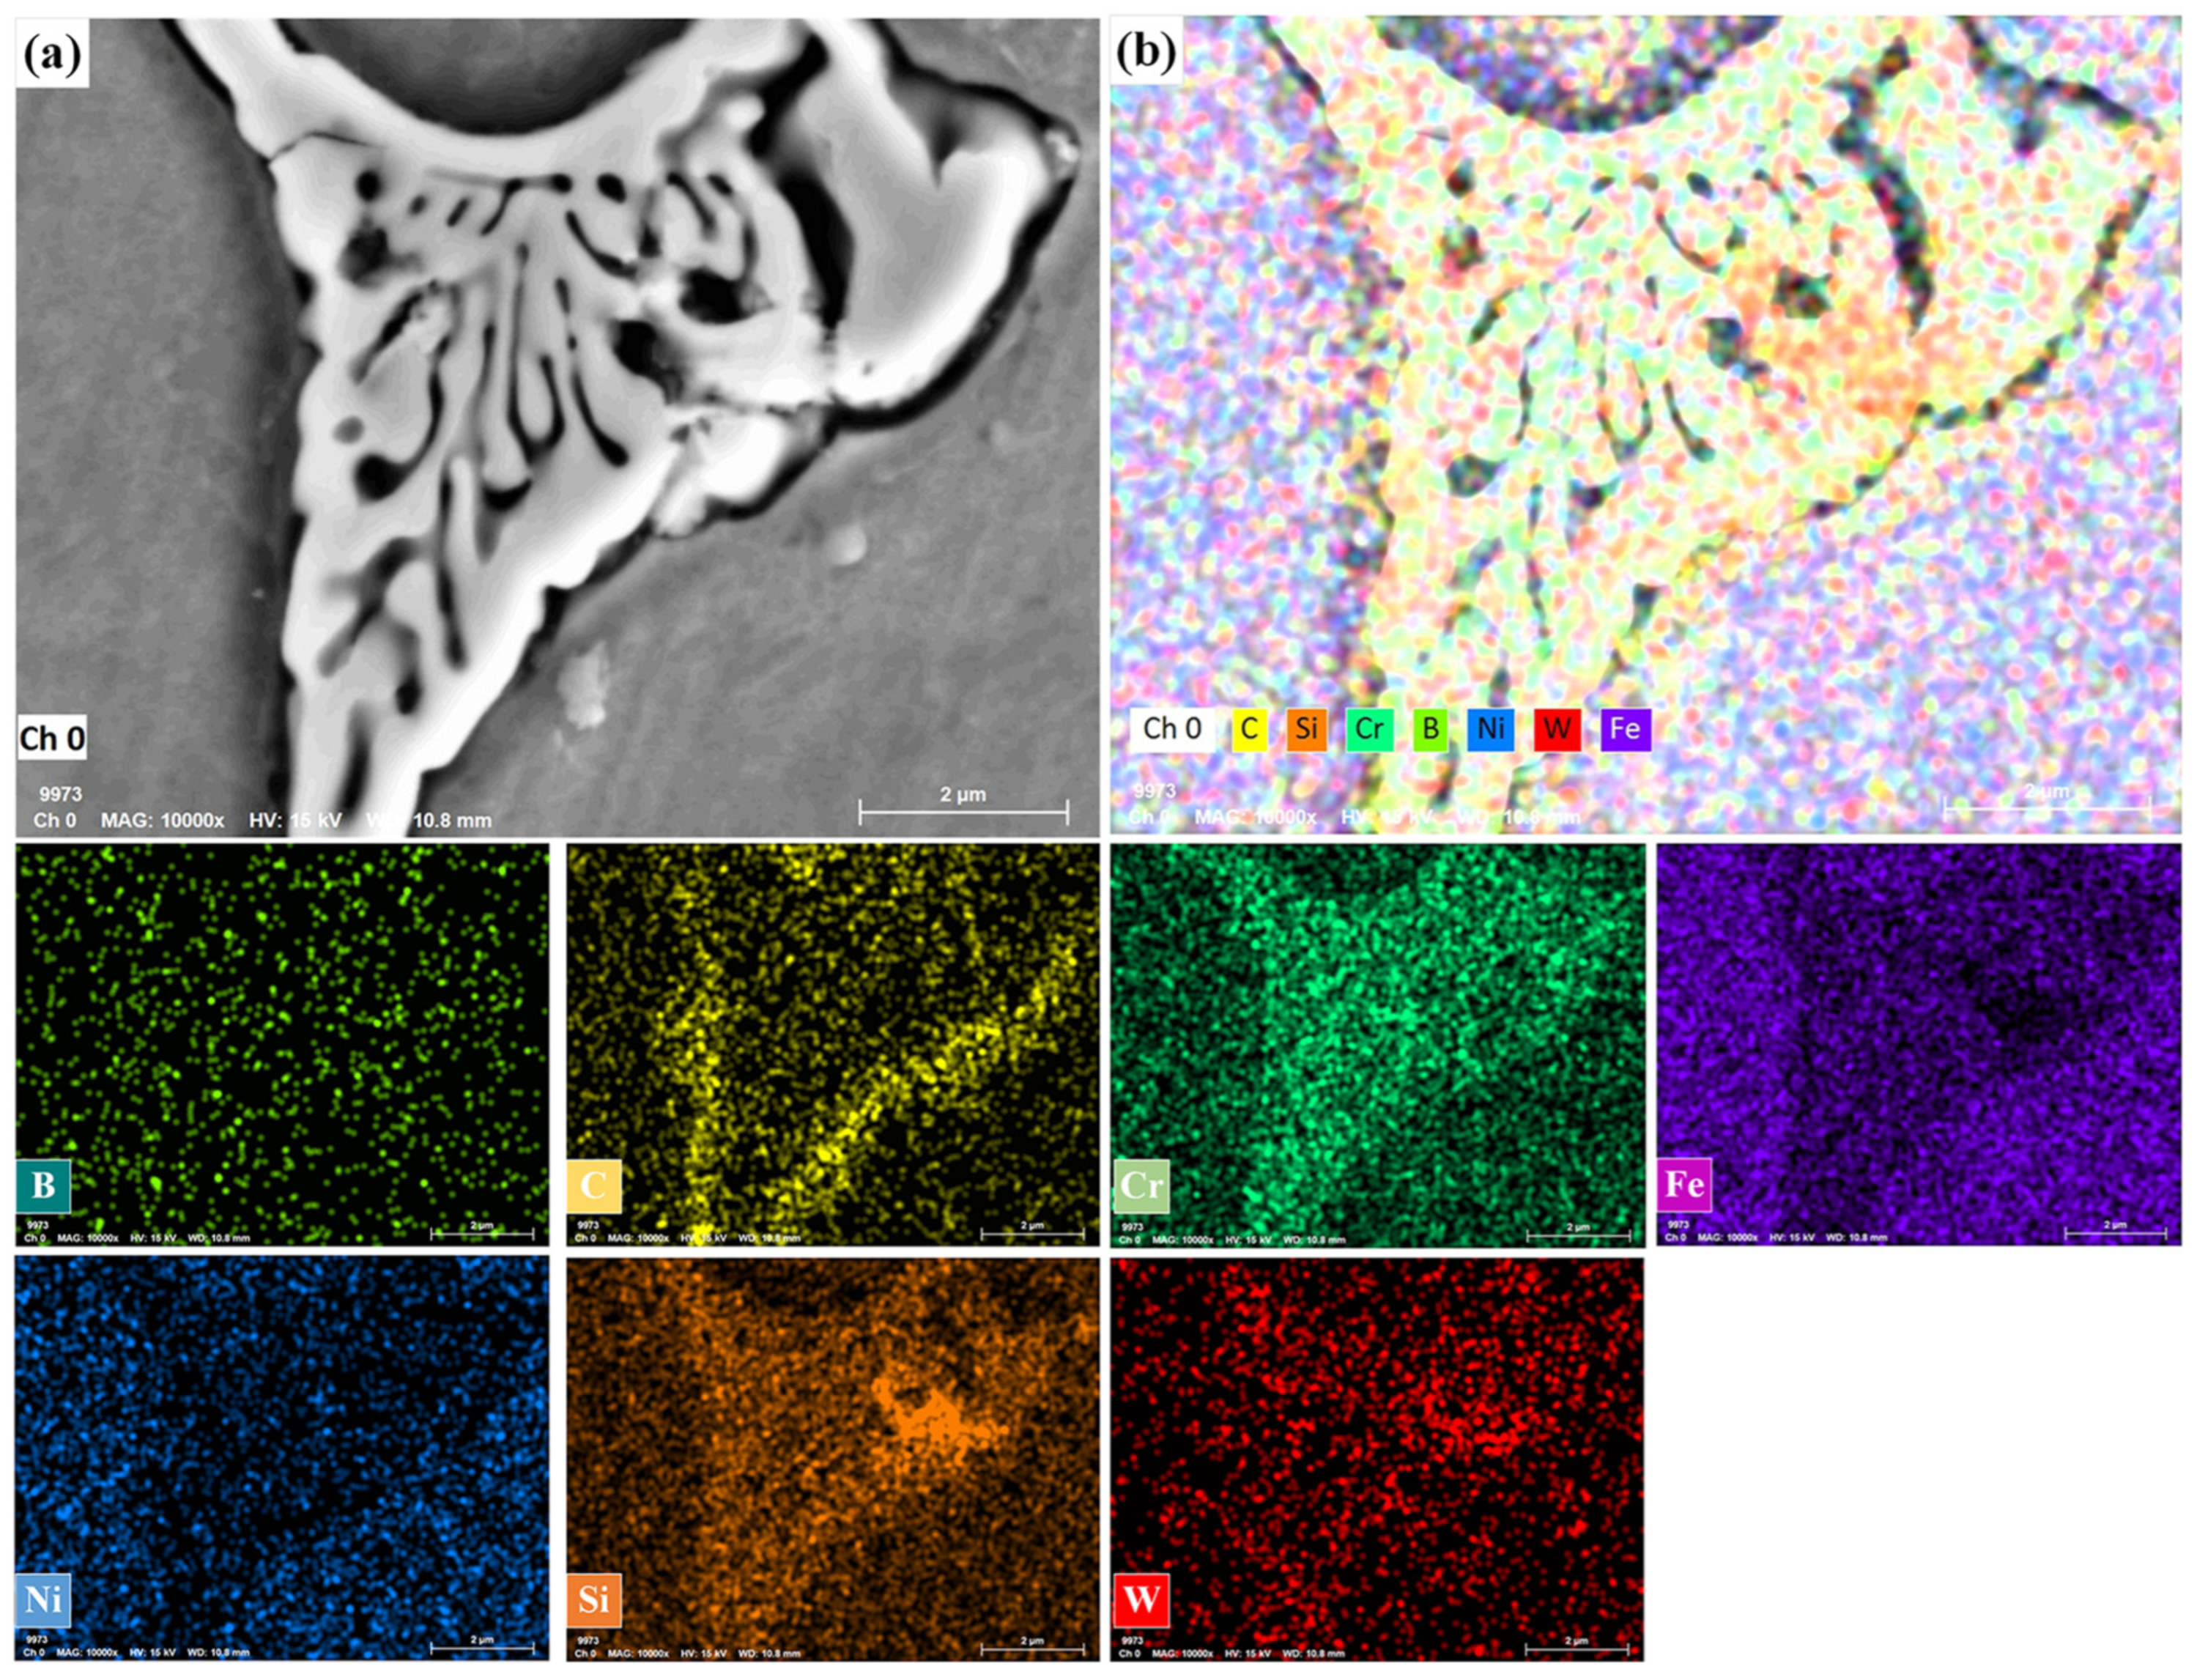
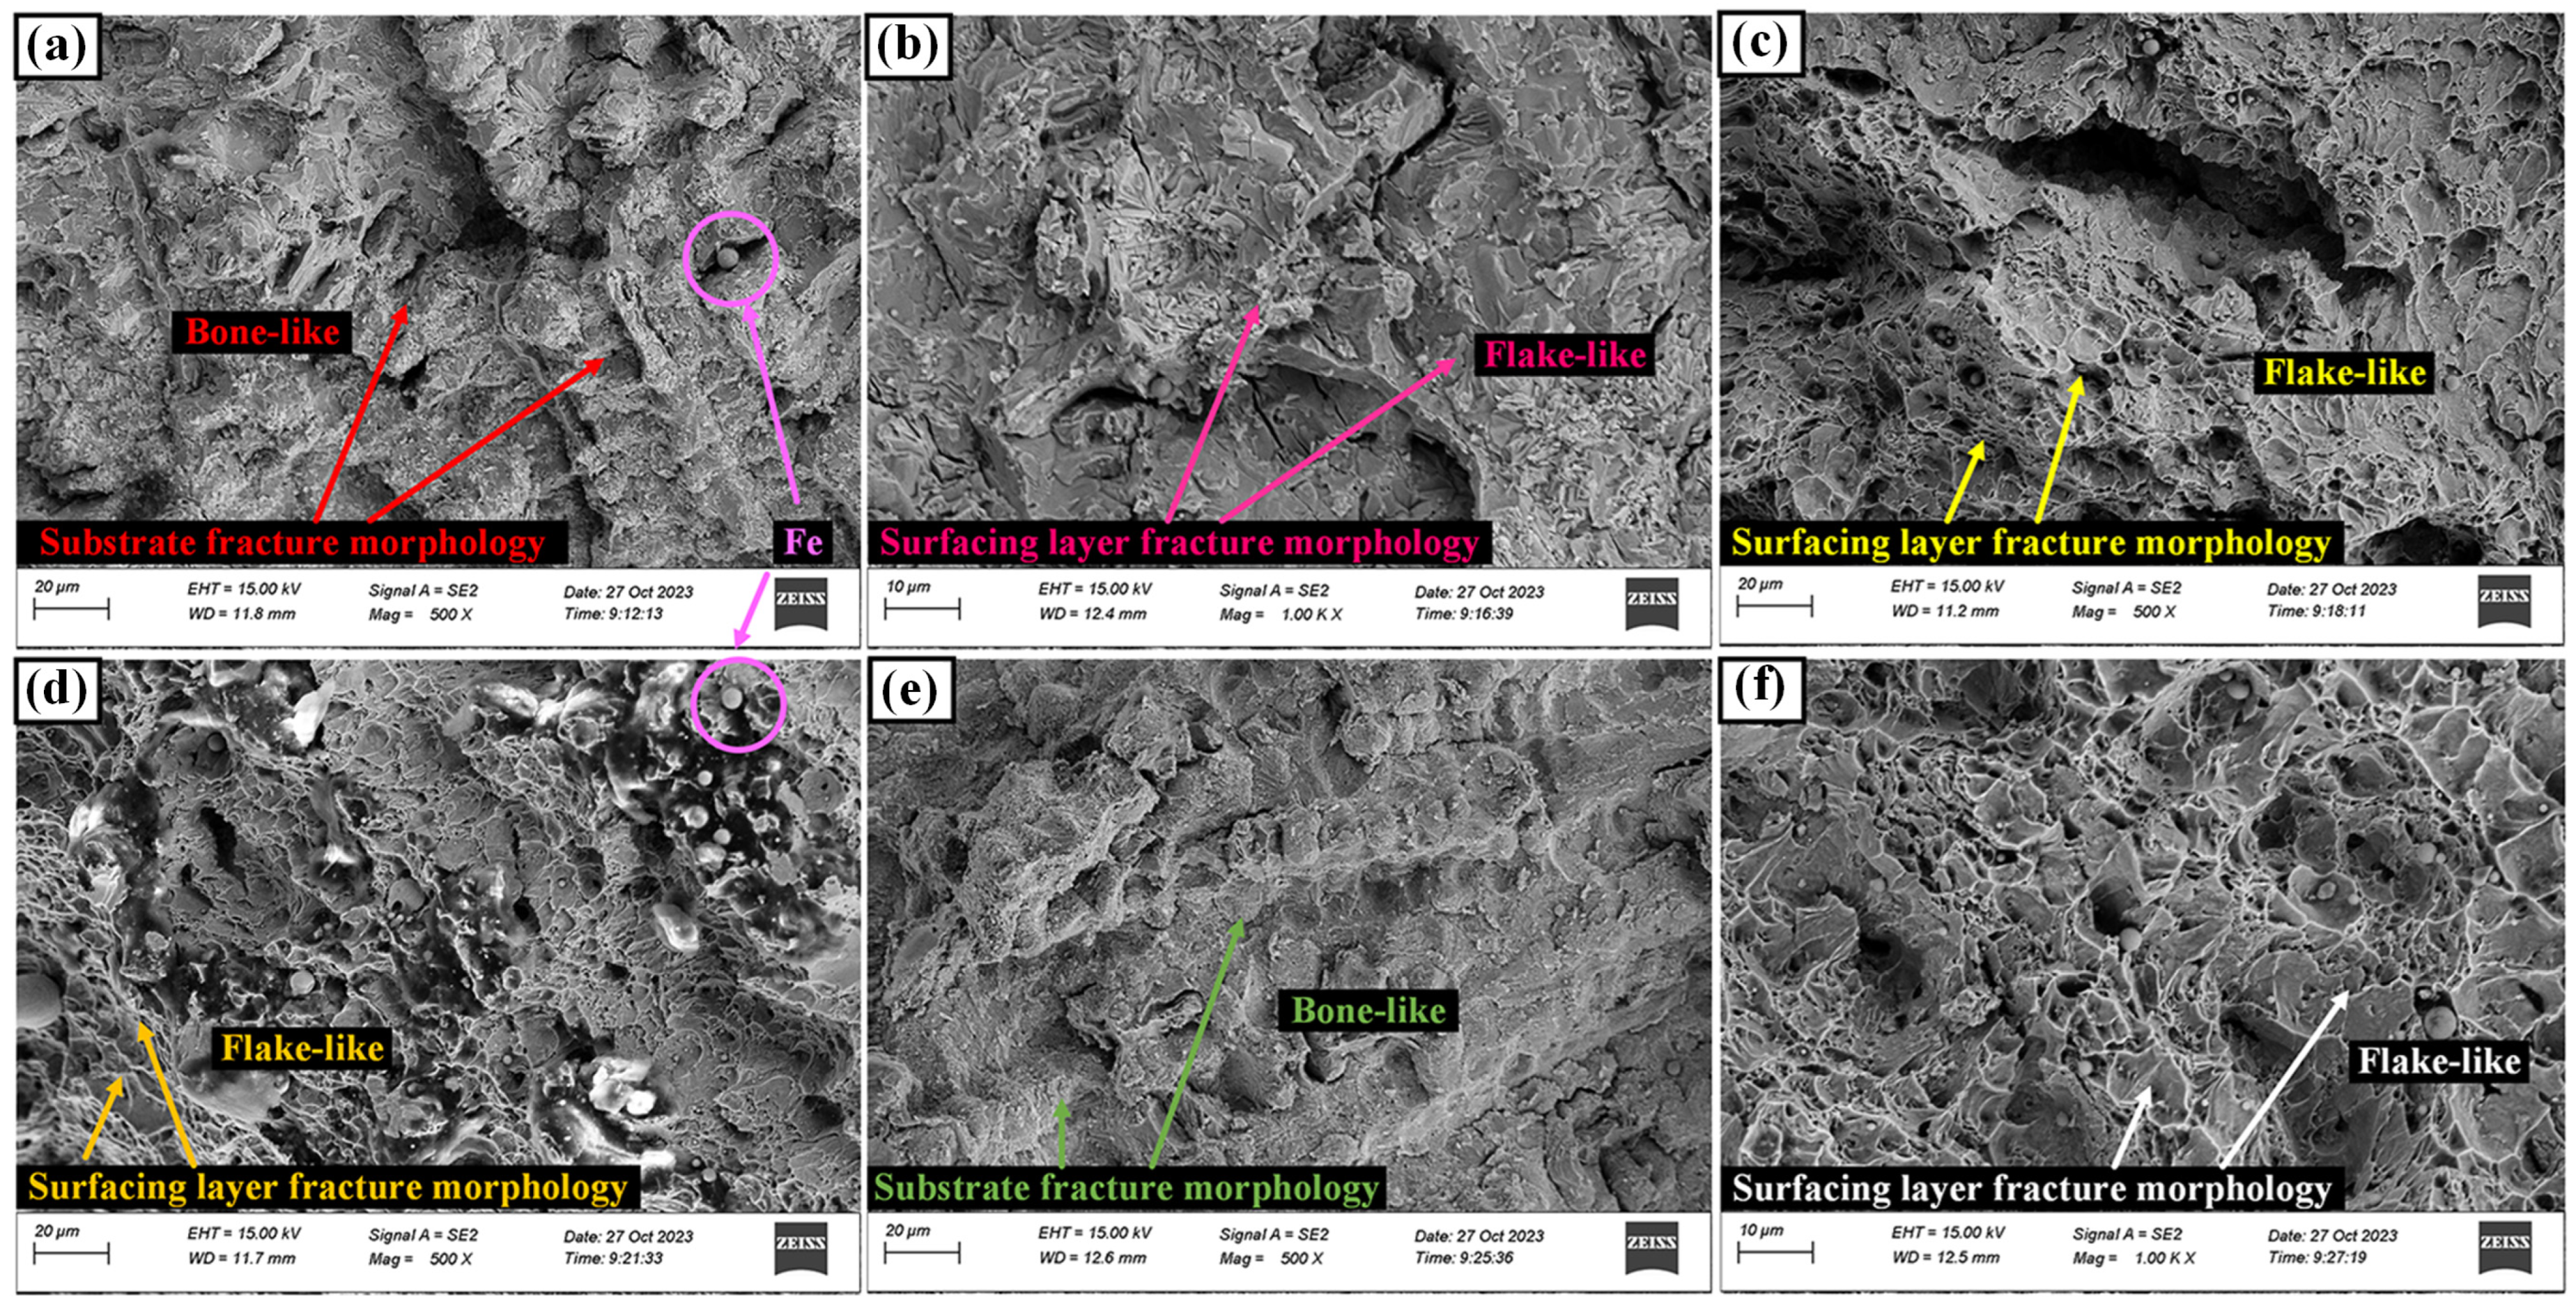
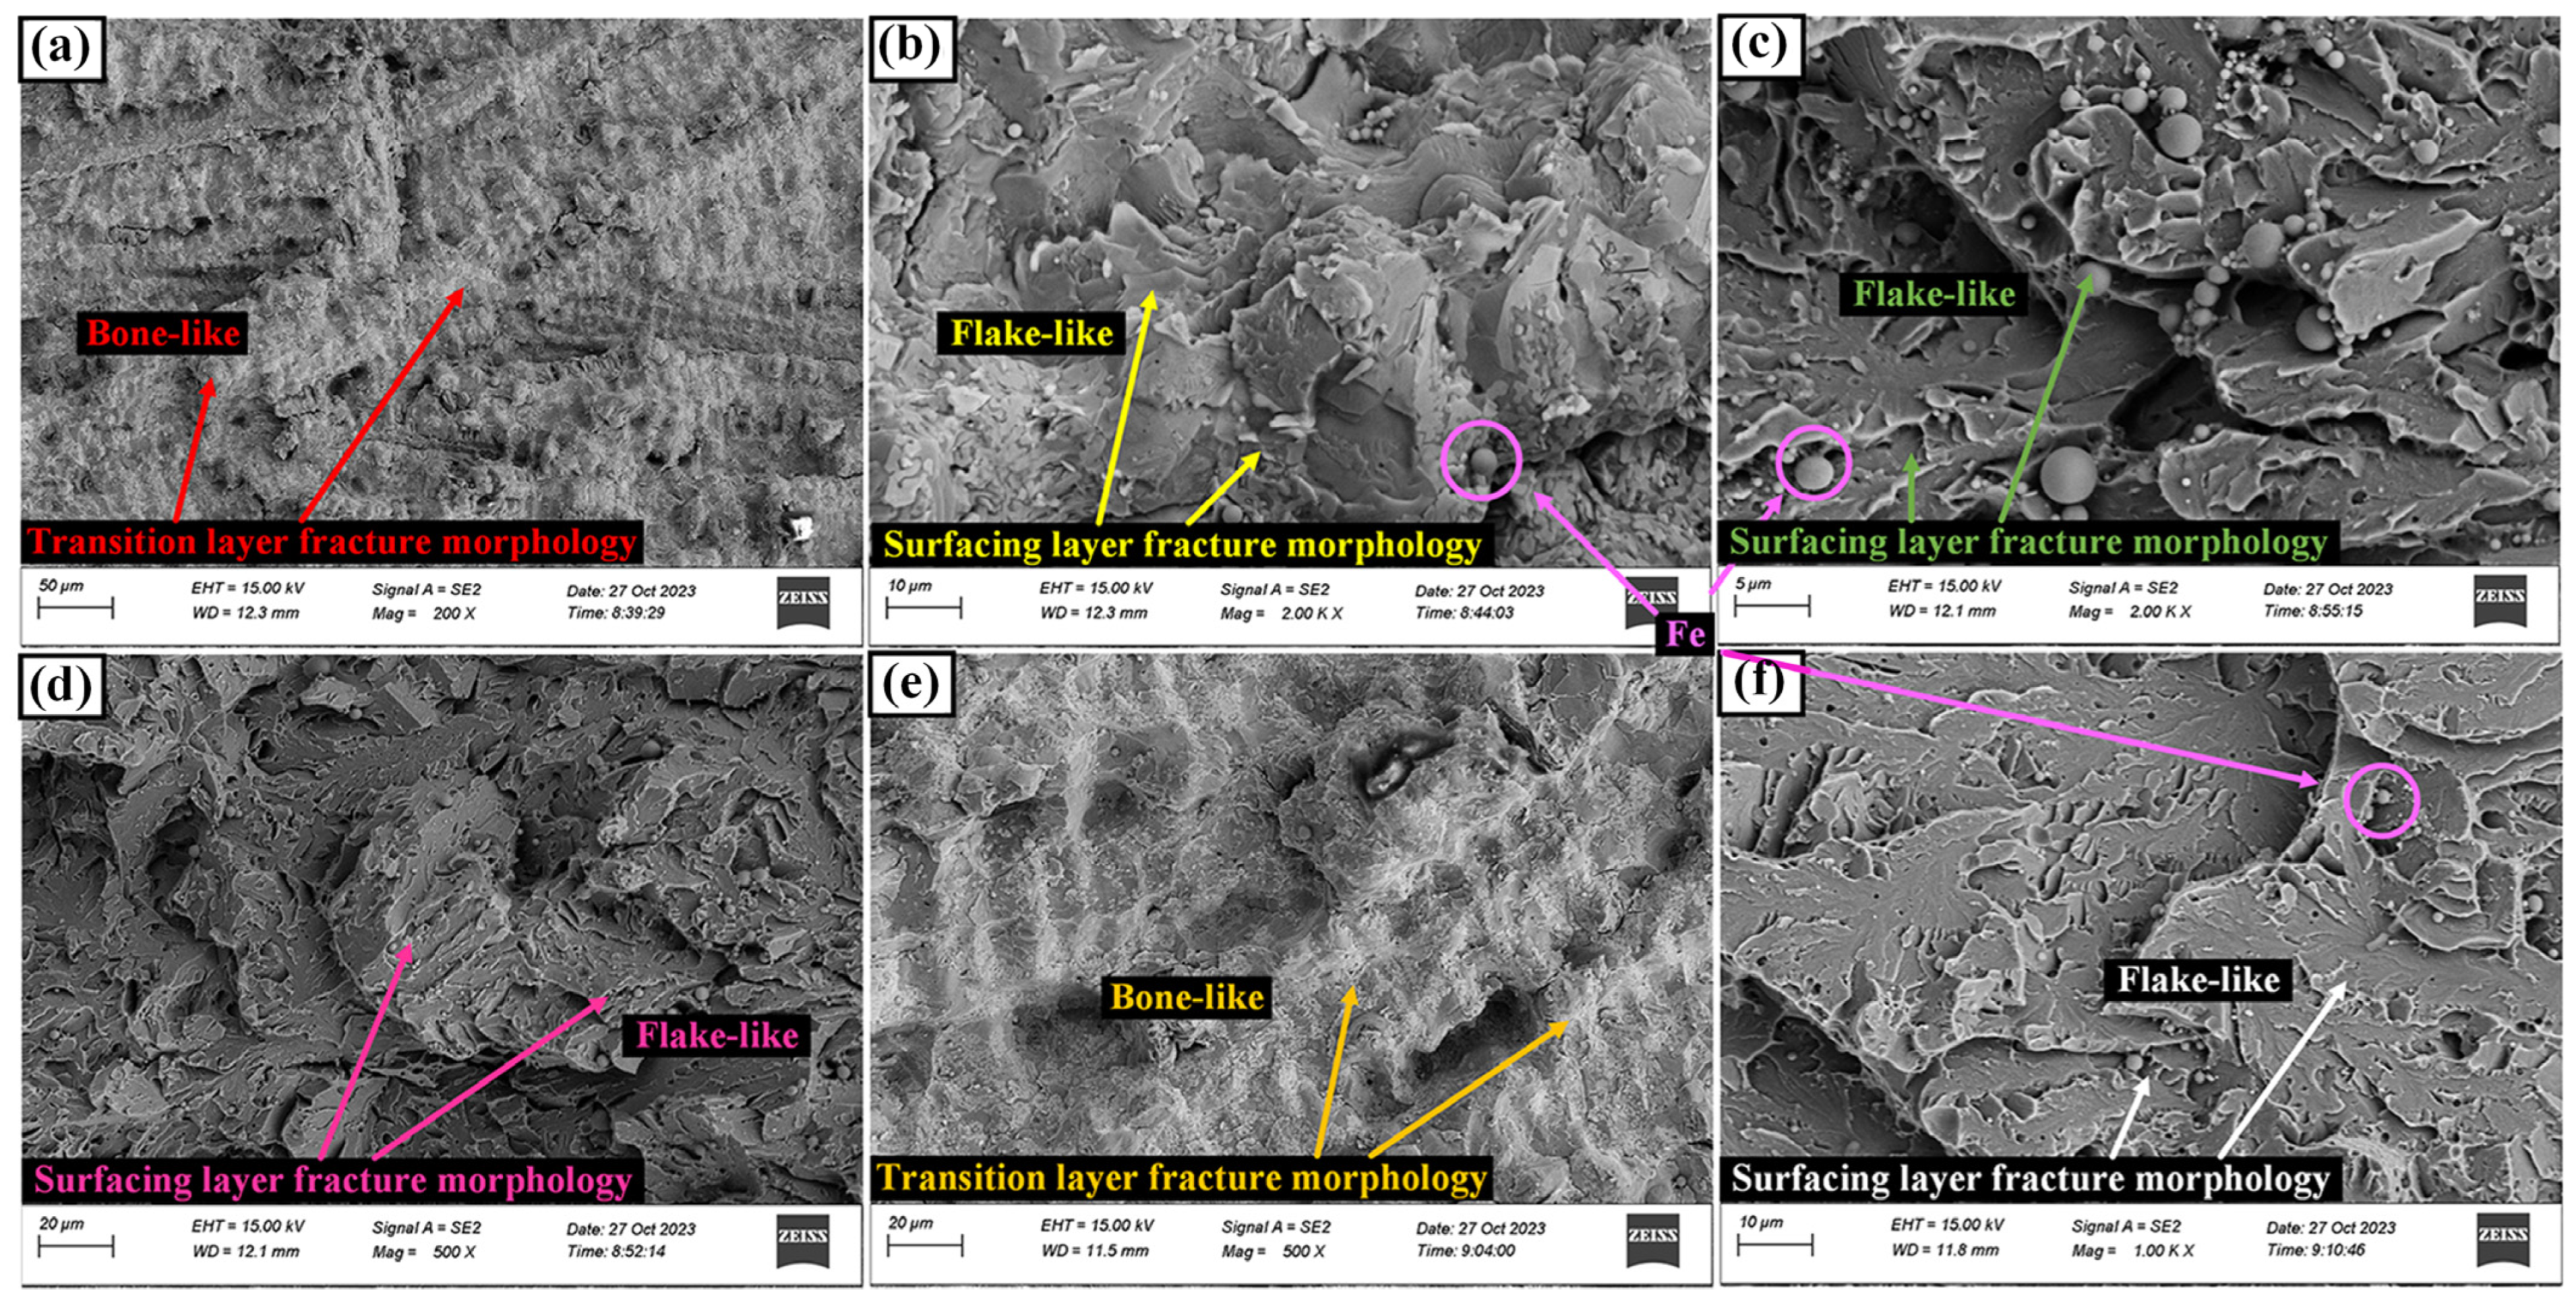
SEM and EDS experiments show that the WC hard phase is dissolved after submerged arc welding, and the hard phase with mesh structure is formed and distributed in the whole welding layer. Under different WC content, the hard phase density generated at the same position of the welding layer is different, and the hard phase element content is different to some extent. The hard phase deposits are mainly composed of fishbone, neuronal, flower-like and flower-flocculent structures, and the binding phase is mainly an Ni–Fe solid solution. An Fe–Ni block is formed at the fusion zone of the welding layer and the substrate, which is attached to the fusion line.
(2)
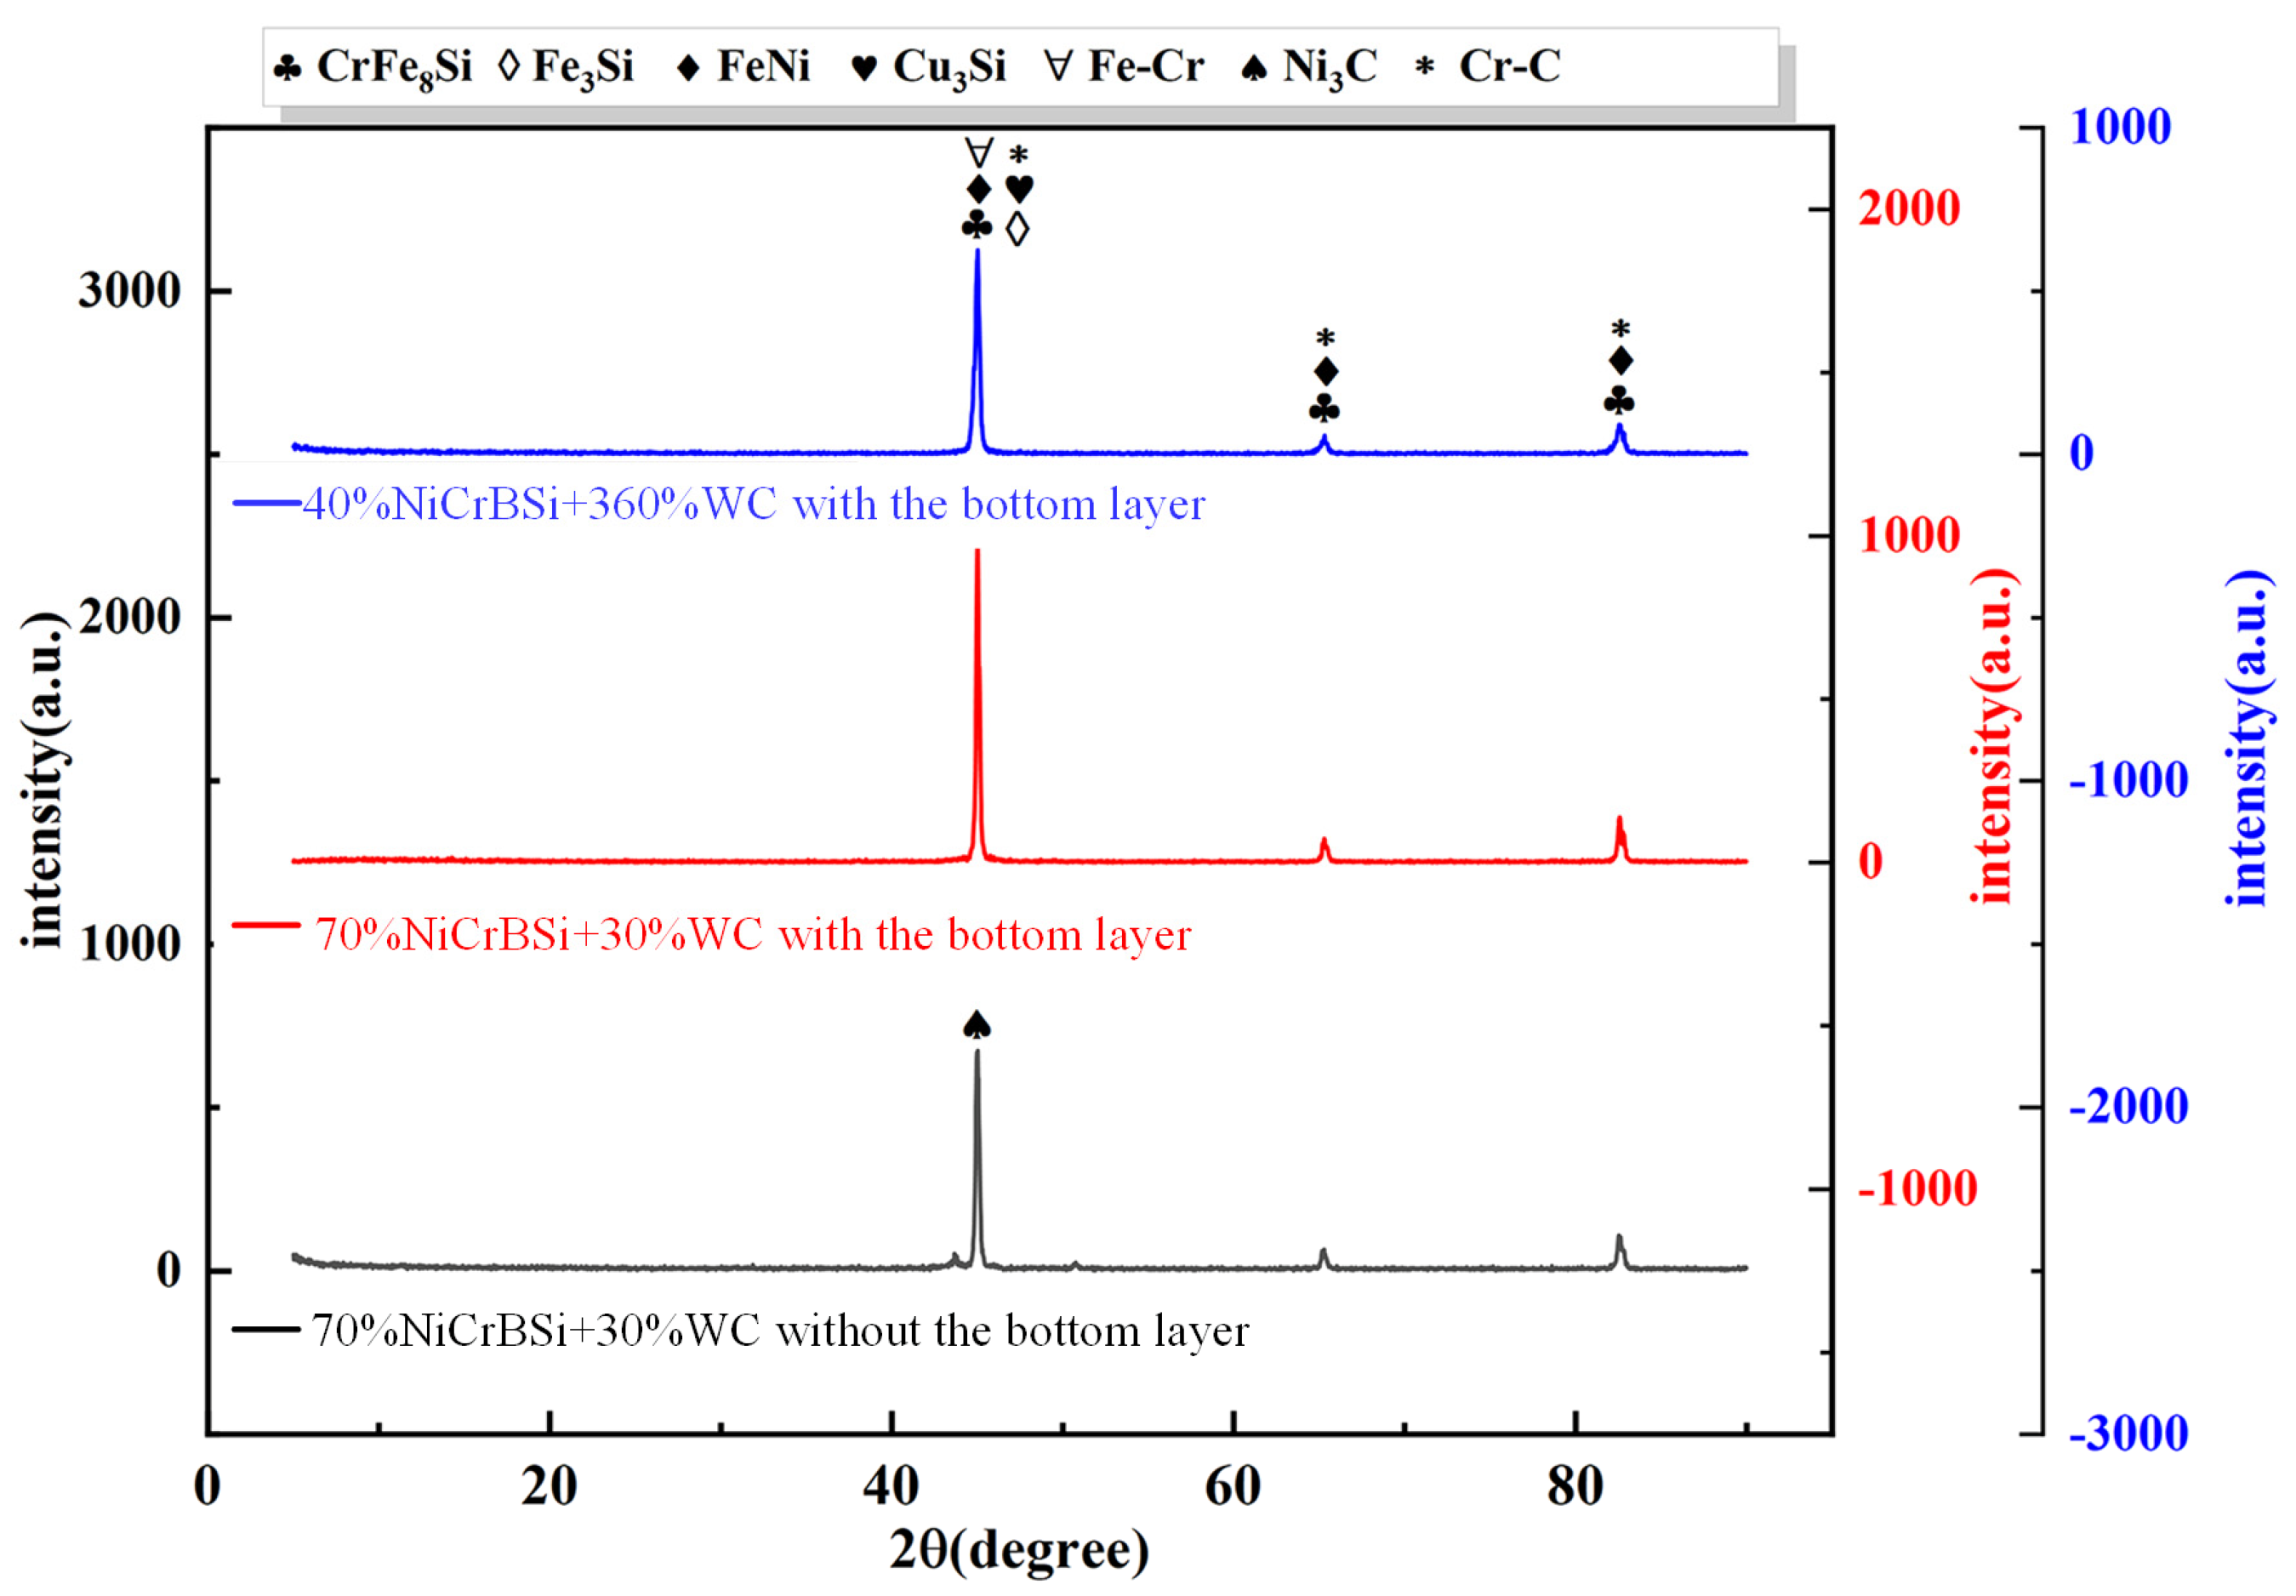
The submerged arc welding layer XRD analysis shows that the hard phase is mainly composed of CrFe8Si, Fe3Si, Ni3C, and C-Cr, and the bonding phase is mainly an Fe–Ni solid solution. 70% NiCrBSi + 30% WC filler metal has the highest peak of the bottom layer, and the generated hard phase is the most, resulting in the highest hardness of the welding layer, and the highest hardness of the hard phase is close to 1000 HV.
(3)
Because 40% NiCrBSi + 60% WC filler metal with the bottom layer has more WC content, the generated hard phase network structure is sparse, resulting in lower hardness than the former, and the maximum hardness is 673 HV. The hardness of the welding layer is more than 2.5 times that of the substrate. The abrasion resistance of 70% NiCrBSi + 30% WC welding layer is better than that of 40% NiCrBSi + 60% WC welding layer, the friction coefficient of the former is 0.2136, and the friction coefficient of the latter is 0.2732.
(4)
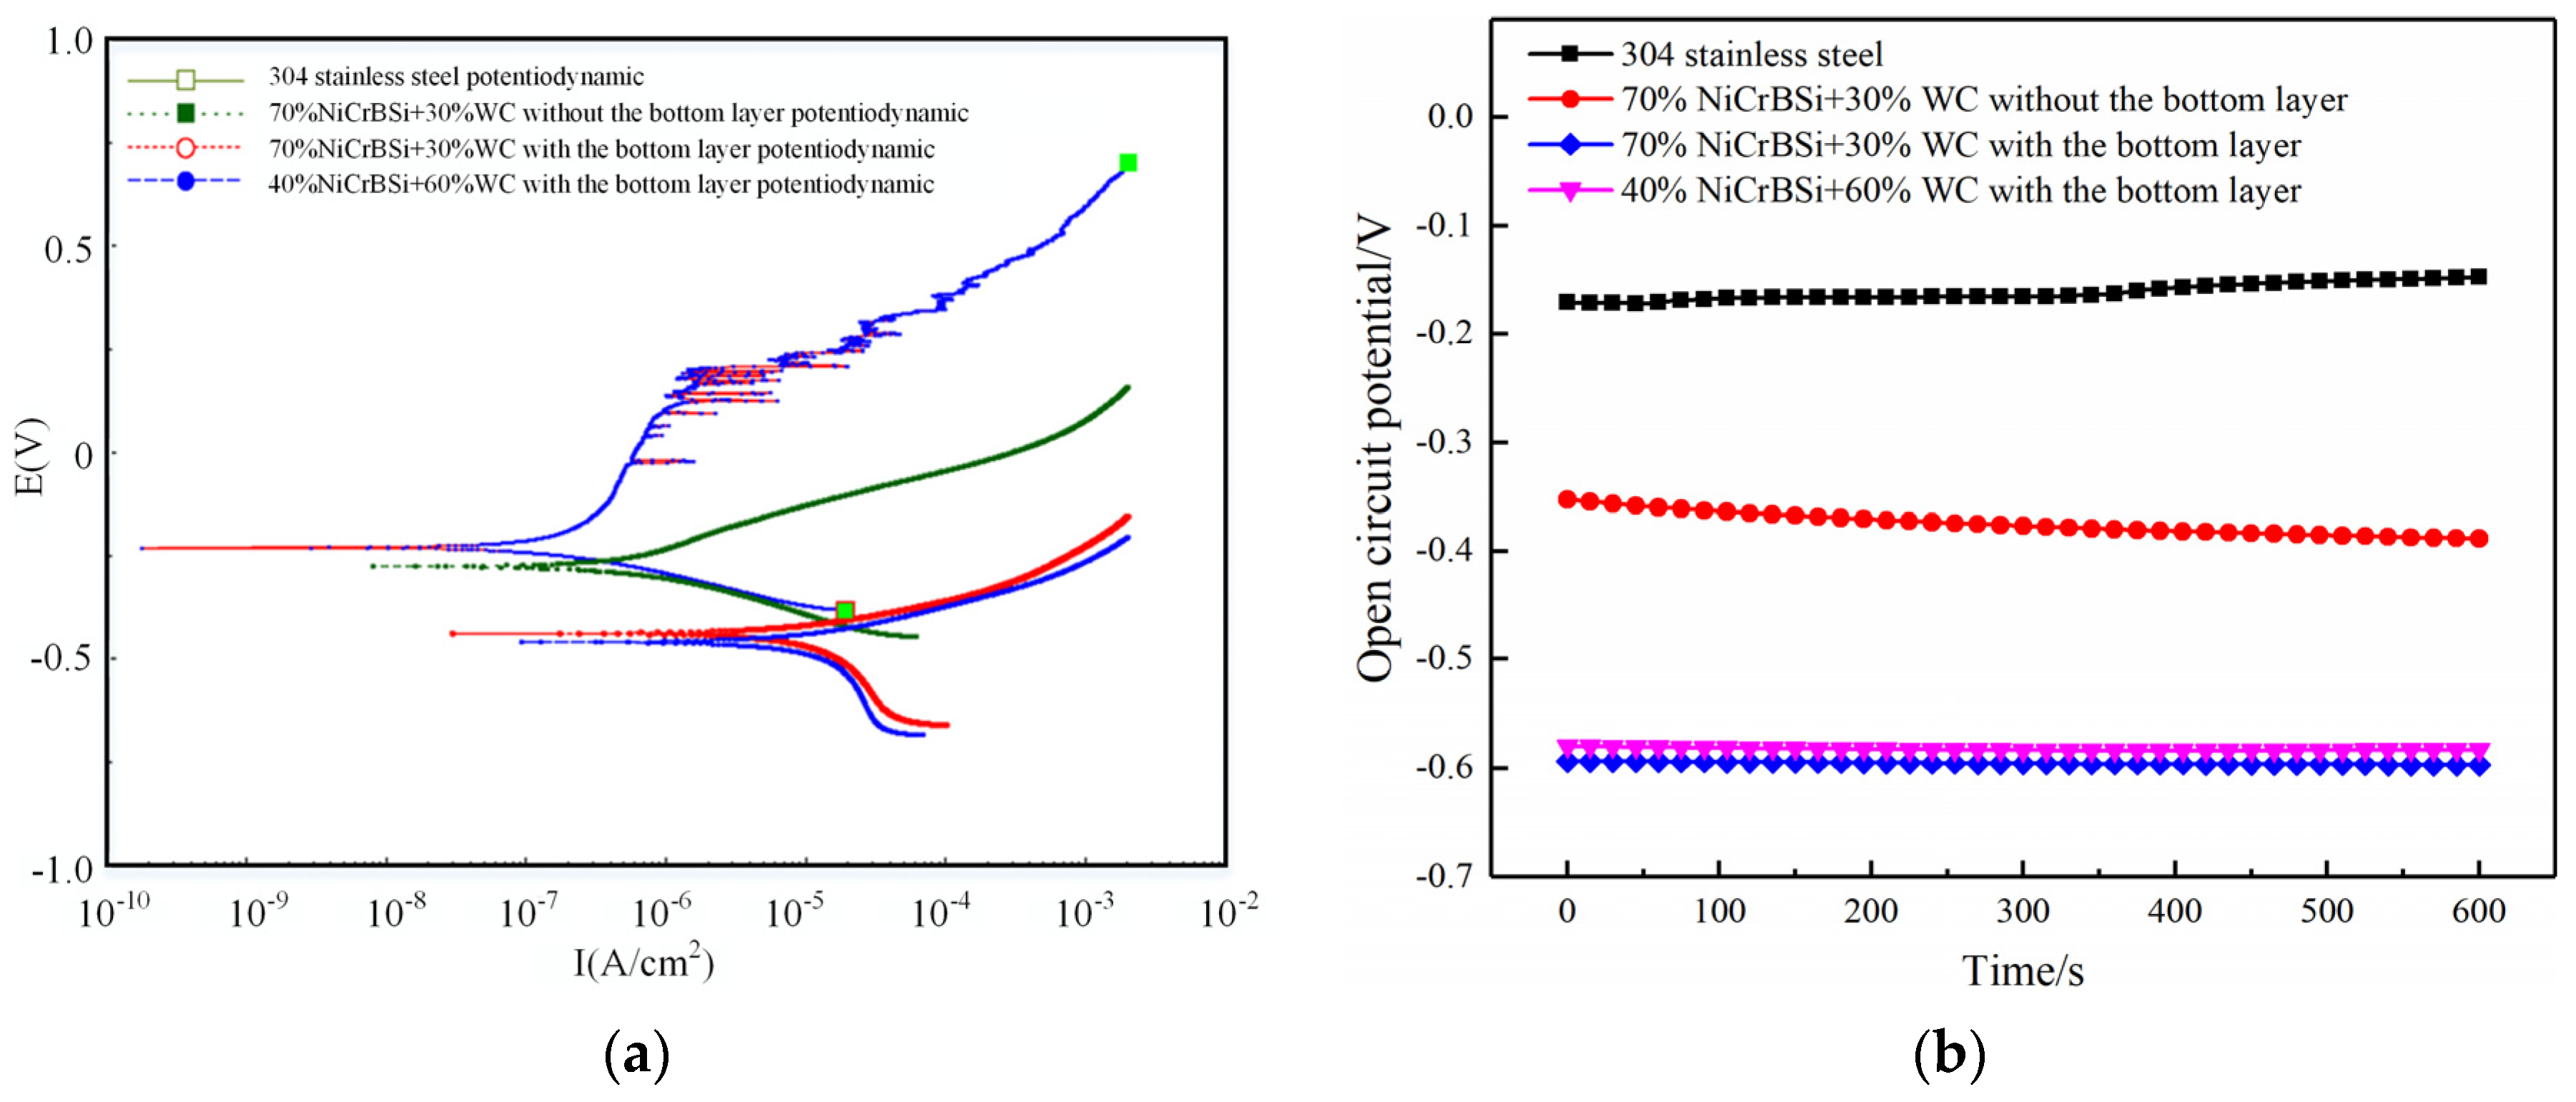
The polarization curve of the electrochemical corrosion experiment shows that the corrosion resistance of 40% NiCrBSi + 60% WC welding layer is better than that of 70% NiCrBSi + 30% WC welding layer. The corrosion potential of the welding layer is more negative than that of 304 stainless steel, and the self-corrosion current density of the welding layer is two orders of magnitude higher than that of 304 stainless steel, and the corrosion rate is higher.
(5)
The average impact toughness of 70% NiCrBSi + 30% WC filler metal without the bottom layer is 36.57 J/cm2, and the average total impact energy is 13.19 J. The average impact toughness of 70% NiCrBSi + 30% WC filler metal with the bottom layer is 6.65 J/cm2, and the average total impact energy is 13.19 J. The impact surface of the substrate is bone-shaped, the impact surface of the welding layer is flake-shaped, and spherical Fe-Ni is scattered in the area of the welding layer.

Author Contributions

Conceptualization, C.L.; Formal analysis, C.L. and H.S.; Investigation, F.L.; Resources, C.L. and F.L.; Writing—original draft, L.F.; Writing—review & editing, X.H.; Supervision, C.L. All authors have read and agreed to the published version of the manuscript.

Funding

This work was supported by The Ministry of Science and Technology of the People’s Republic of China under the project “High-Throughput Design, Preparation, and Characterization of Composite Powders for Special Coatings on Key Components in Metallurgy” (2021YFB3702002), The Applied Basic Research Project of Liaoning Province (2023JH2/101300226), and The Project for Graduate Education Reform and Technological Innovation and Entrepreneurship of University of Science and Technology Liaoning (2023YJSCX02).

Institutional Review Board Statement

Not applicable.

Informed Consent Statement

Not applicable.

Data Availability Statement

The data that supports the findings of this study are available within the article.

Conflicts of Interest

The authors declare no conflict of interest.

References

  1. Choudhary, A.; Kumar, M.; Gupta, M.K.; Unune, D.K.; Mia, M. Mathematical modeling and intelligent optimization of submerged arc welding process parameters using hybrid PSO-GA evolutionary algorithms. Neural Comput. Appl. 2019, 32, 5761–5774. [Google Scholar] [CrossRef]
  2. Rebelo Kornmeier, J.; Marques, M.J.; Gan, W.; Batista, A.C.; Paddea, S.; Loureiro, A. Quantification of Residual Stress Relief by Heat Treatments in Austenitic Cladded Layers. Materials 2022, 15, 1364. [Google Scholar] [CrossRef] [PubMed]
  3. Kumar Choudhary, M.; Unune, D.R. Experimental investigation and optimization of weld bead characteristics during submerged arc welding of AISI 1023 steel. Def. Technol. 2019, 15, 72–82. [Google Scholar] [CrossRef]
  4. Shi, X.-L.; Xiu, S.-C.; Su, H.-L. Residual stress model of pre-stressed dry grinding considering coupling of thermal, stress, and phase transformation. Adv. Manuf. 2019, 7, 401–410. [Google Scholar] [CrossRef]
  5. Zhang, J.; Shao, G.; Fan, J.; Wang, L.; Zhang, D. A Review on Parallel Development of Flux Design and Thermodynamics Subject to Submerged Arc Welding. Processes 2022, 10, 2305. [Google Scholar] [CrossRef]
  6. Mahapatra, M.M.; Datta, G.L.; Pradhan, B.; Mandal, N.R. Three-dimensional finite element analysis to predict the effects of SAW process parameters on temperature distribution and angular distortions in single-pass butt joints with top and bottom reinforcements. Int. J. Press. Vessel. Pip. 2006, 83, 721–729. [Google Scholar] [CrossRef]
  7. Cheng, R.; Zhang, J.; Wang, B. Closure behavior of spherical void in slab during hot rolling process. Metall. Res. Technol. 2018, 115, 301. [Google Scholar] [CrossRef]
  8. Viňáš, J.; Brezinová, J.; Guzanová, A.; Svetlík, J. Degradation of renovation layers deposited on continuous steel casting rollers by submerged arc welding. Proc. Inst. Mech. Eng. Part B J. Eng. Manuf. 2013, 227, 1841–1848. [Google Scholar] [CrossRef]
  9. Sharma, L.; Chhibber, R. Experimental investigation of structural integrity behavior of High strength low alloy steel—Study of mechanical, microstructural and corrosion behavior of Submerged arc welding weldments. Proc. Inst. Mech. Eng. Part E J. Process Mech. Eng. 2020, 235, 266–273. [Google Scholar] [CrossRef]
  10. Saini, S.; Singh, K. Recycling of steel slag as a flux for submerged arc welding and its effects on chemistry and performance of welds. Int. J. Adv. Manuf. Technol. 2021, 114, 1165–1177. [Google Scholar] [CrossRef]
  11. Chen, Z.; Peng, K.; Chen, X.; Wang, Q.; Liang, Y. Comparative Investigation of Multi-stranded Wire and Single Wire in Submerged Arc Welded Joints of Duplex Stainless Steel: Microstructure and Pitting Properties. J. Mater. Eng. Perform. 2023, 1–11. [Google Scholar] [CrossRef]
  12. Zhang, H.F.; Zhang, C.H.; Wang, Z.Y.; Cui, X.; Zhang, S.; Chen, H.T. Microstructure and corrosion behaviour of WC/NiCrBSi coatings by vacuum cladding. Mater. Sci. Technol. 2022, 38, 19–29. [Google Scholar] [CrossRef]
  13. Deenadayalan, K.; Murali, V. Role of various weight percentages of WC particle on interface thickness and friction-wear property of NiCrBSi-WC composite fabricated using PTAW process. Mater. Res. Express 2019, 6, 046542. [Google Scholar] [CrossRef]
  14. Deenadayalan, K.; Murali, V.; Elayaperumal, A.; Arulvel, S. Effective role of short time furnace heat treatment and laser treatment on the residual stress and mechanical properties of NiCrBSi–WC weldments produced using plasma transferred arc welding process. J. Mater. Res. Technol. 2021, 15, 3492–3513. [Google Scholar] [CrossRef]
  15. Wang, Y.Y.; Gong, Y.F.; Sun, T.F.; Ni, P.F.; Liu, Z.; Gao, G.H.; Li, C.J. Effect of Powder Size and Volume Fraction of WC on the Microstructure of Laser Cladding WC-NiCrBSi Composite Coatings. Appl. Mech. Mater. 2011, 121–126, 105–109. [Google Scholar] [CrossRef]
  16. Han, F.; Zhang, X.D.; Sun, Y.F. Microstructure and Properties of NiFeCrBSi/WC Composite Coatings Fabricated by Vacuum Cladding. Phys. Met. Metallogr. 2019, 120, 898–906. [Google Scholar] [CrossRef]
  17. Cherepanov, A.N.; Orishich, A.M.; Ovcharenko, V.E.; Malikov, A.G.; Drozdov, V.O.; Pshenichnikov, A.P. Influence of Modifying Nanoadditives on the Properties of a Multilayer Composite Coating Obtained by Laser Welding. Phys. Met. Metallogr. 2019, 120, 101–106. [Google Scholar] [CrossRef]
  18. Wang, J.; Zhou, J.; Zhang, T.; Meng, X.; Li, P.; Huang, S.; Zhu, H. Ultrasonic-Induced Grain Refinement in Laser Cladding Nickel-Based Superalloy Reinforced by WC Particles. Coatings 2023, 13, 151. [Google Scholar] [CrossRef]
  19. Chmielewski, T.; Golański, D. The role of welding in the remanufacturing process. Weld. Int. 2015, 29, 861–864. [Google Scholar] [CrossRef]
  20. Luzan, S.A.; Sidashenko, A.I.; Luzan, A.S. The wear resistance increasing of the deposited coatings of the Ni-Cr-B-Si system by modifying them with composite materials synthesized using the SHS process (Self-propagating high-temperature synthesis). Weld. Int. 2021, 33, 249–254. [Google Scholar] [CrossRef]
  21. Mortazavian, E.; Wang, Z.; Teng, H. Repair of light rail track through restoration of the worn part of the railhead using submerged arc welding process. Int. J. Adv. Manuf. Technol. 2020, 107, 3315–3332. [Google Scholar] [CrossRef]
  22. Kik, T.; Moravec, J.; Svec, M. Experiments and Numerical Simulations of the Annealing Temperature Influence on the Residual Stresses Level in S700MC Steel Welded Elements. Materials 2020, 13, 5289. [Google Scholar] [CrossRef] [PubMed]
  23. He, Q.; Wei, H.; Chen, J.S.; Wang, H.P.; Carlson, B.E. Analysis of hot cracking during lap joint laser welding processes using the melting state-based thermomechanical modeling approach. Int. J. Adv. Manuf. Technol. 2017, 94, 4373–4386. [Google Scholar] [CrossRef]
  24. Yu, S.; Lu, W.; Zhang, Y.; Xie, M.; Wang, C. Development of HYDCrMo Hardfacing Flux Cored Wire for Submerged Arc Welding. Mater. Mech. Eng. 2003, 27, 35–37. [Google Scholar]
  25. GB/T229-2020; Metallic Materials Charpy Pendulum Impact Test-Part l: Test Method. State Administration for Market Regulation and Standardization Administration: Beijing, China, 2020.
  26. Ciubotariu, C.R.; Frunzaverde, D.; Marginean, G. Investigations of Cavitation Erosion and Corrosion Behavior of Flame-Sprayed NiCrBSi/WC-12Co Composite Coatings. Materials 2022, 15, 2943. [Google Scholar] [CrossRef] [PubMed]
  27. Xiao, J.K.; Wu, Y.Q.; Zhang, W.; Chen, J.; Wei, X.L.; Zhang, C. Microstructure, wear and corrosion behaviors of plasma sprayed NiCrBSi-Zr coating. Surf. Coat. Technol. 2019, 360, 172–180. [Google Scholar] [CrossRef]
  28. Sabzi, M.; Dezfuli, S.M.; Mirsaeedghazi, S.M. The effect of pulse-reverse electroplating bath temperature on the wear/corrosion response of Ni-Co/tungsten carbide nanocomposite coating during layer deposition. Ceram. Int. 2018, 44, 19492–19504. [Google Scholar] [CrossRef]
  29. Zeng, Q.; Sun, J.; Emori, W.; Jiang, S.L. Corrosion Behavior of Thermally Sprayed NiCrBSi Coating on 16MnR Low-Alloy Steel in KOH Solution. J. Mater. Eng. Perform. 2016, 25, 1773–1780. [Google Scholar] [CrossRef]
Figure 1. Schematic of submerged arc surfacing process.
Coatings 14 00734 g001
Figure 2. SEM and EDS results of 70% NiCrBSi + 30% WC powder: (a) 100× SEM results; (b) the EDS element surface scan result of local, corresponding to view (a).
Coatings 14 00734 g002
Figure 3. 40% NiCrBSi + 60% WC powder SEM and EDS. (a) 200× SEM results; (b) the EDS element surface scan result of local, corresponding to view (a).
Coatings 14 00734 g003
Figure 4. XRD results of 70% NiCrBSi + 30% WC and 40% NiCrBSi + 60% WC powder.
Coatings 14 00734 g004
Figure 5. Flux-cored wire powder and wire preparation.
Coatings 14 00734 g005
Figure 6. Descaling roll submerged arc surfacing layer: (a) morphology of surfacing layer under different processes; (b) schematic of 70% NiCrBSi + 30% WC surfacing without the bottom layer; (c) schematic of 70% NiCrBSi + 30% WC with the bottom layer; (d) schematic of 40% NiCrBSi + 60% WC with the bottom layer.
Coatings 14 00734 g006
Figure 7. SEM of 70% NiCrBSi + 30% WC experimental block without the bottom layer: (ac) the top microstructure of the surfacing layer; (df) the microstructure of the middle part surfacing layer; (g) the microstructure of the fusion zone surfacing layer and substrate.
Coatings 14 00734 g007
Figure 8. SEM and EDS of 70% NiCrBSi + 30% WC without the bottom layer. (a); 3000× SEM results; (b) the EDS element surface scan result, corresponding to view (a).
Coatings 14 00734 g008
Figure 9. SEM of 70% NiCrBSi + 30% WC with the bottom layer: (ac) the microstructure of the surfacing layer middle part; (df) the microstructure of the fusion zone surfacing layer and substrate.
Coatings 14 00734 g009
Figure 10. SEM and EDS of 70% NiCrBSi + 30% WC with the bottom layer: (a) 3000× SEM results; (b) the EDS element surface scan result, corresponding to view (a).
Coatings 14 00734 g010
Figure 11. SEM of 40% NiCrBSi + 60% WC filler metal with the bottom layer: (ac) The microstructure of the middle surfacing layer; (d) the structure morphology at the fusion zone of the surfacing layer and gradient lap; (e) the microstructure of the fusion zone between the gradient lap layer and the substrate; (f) the enlarged region, corresponding to view (e).
Coatings 14 00734 g011
Figure 12. SEM and EDS 40% NiCrBSi + 60% WC filler metal with the bottom layer: (a) 10,000× SEM results; (b) the EDS element surface scan result, corresponding to view (a).
Coatings 14 00734 g012
Figure 13. XRD of experimental block of submerged arc welding of descaling rollers.
Coatings 14 00734 g013
Figure 14. Hardness points of 70% NiCrBSi + 30% WC filler metal without the bottom layer.
Coatings 14 00734 g014
Figure 15. Hardness points of 70% NiCrBSi + 30% WC filler metal with the bottom layer.
Coatings 14 00734 g015
Figure 16. Hardness points of 40% NiCrBSi + 60% WC filler metal with the bottom layer.
Coatings 14 00734 g016
Figure 17. Magnified hardness indentation: (a) 70% NiCrBSi + 30% WC filler metal without the bottom layer; (b) 70% NiCrBSi + 30% WC filler metal with the bottom layer; (c) 40% NiCrBSi + 60% WC filler metal with the bottom layer.
Coatings 14 00734 g017
Figure 18. Hardness distribution curve.
Coatings 14 00734 g018
Figure 19. Variation curve of friction coefficient for welding layer.
Coatings 14 00734 g019
Figure 20. Abrasion morphology of welding layer with different WC contents: (a) the morphology of wear marks on 70% NiCrBSi + 30% WC filler metal without the bottom layer; (b) the morphology of wear marks on 70% NiCrBSi + 30% WC filler metal with the bottom layer; (c) the morphology of wear marks on 40% NiCrBSi + 60% WC filler metal with the bottom layer; (d) the 3D wear mark topography of 70% NiCrBSi + 30% WC filler metal without the bottom layer; (e) the 3D wear mark topography of 70% NiCrBSi + 30% WC filler metal with the bottom layer; (f) the 3D wear mark topography of 40% NiCrBSi + 60% WC filler metal with the bottom layer.
Coatings 14 00734 g020
Figure 21. Polarization curves and open circuit potential–time curve of welding layer with different WC contents. (a) Polarization curves; (b) open circuit potential-time curve.
Coatings 14 00734 g021
Figure 22. Experimental curves and experiment blocks of 70% NiCrBSi + 30% WC without the bottom layer.
Coatings 14 00734 g022
Figure 23. Fracture microstructure of 70% NiCrBSi + 30% WC filler metal without the bottom layer: (af) SEM results at different locations of the fracture.
Coatings 14 00734 g023
Figure 24. Hardness points of 70% NiCrBSi + 30% WC with the bottom layer.
Coatings 14 00734 g024
Figure 25. Fracture microstructure of 70% NiCrBSi + 30% WC filler metal with the bottom layer: (af) SEM results at different locations of the fracture.
Coatings 14 00734 g025
Table 1. Composition and content of 42CrMo4 (wt%).
ElementNiMoCrMnSiCPSFe
Content (wt%)0.040.210.980.770.150.370.030.04Bal.
Table 2. YD263 elemental composition (wt%).
ElementCSiMnVMoCrNiFe
Content (wt%)0.250.51.50.251.532.5Bal.
Table 3. Composition and content of steel strip (wt%).
ElementCMnSiPSFe
Content (wt%)0.080.150.010.020.02Bal.
Table 4. Nickel-based elemental composition (wt%).
ElementCSiBCrFeNi
Content (wt%)0.33.31.782.3Bal.
Table 5. WC elemental composition (wt%).
ElementCW
Content (wt%)6.0Bal.
Table 6. Process parameters of automatic submerged arc surfacing machine.
Welding ParameterValue
welding voltage/V38~40
welding current/A410~420
welding angular velocity/(rad/s)0.12~0.122
welding speed/(mm/s)12~12.2
feed rate of welding wire/(mm/s)14~16
flux thickness/(mm)8~10
electrode distance/(mm)30~32
overlap rate30%
Table 7. Electrochemical corrosion data.
NumberSelf-Corrosion Current Density
I/(Amps/cm2)
Self-Corrosion Potential
E/(Volts)
Corrosion Rate
Corrosion Rate/(mm/a)
304 stainless-steel1.79 × 10−10−0.232072.10 × 10−6
30% WC without the bottom layer5.57 × 10−8−0.274046.5389 × 10−4
30% WC with the bottom layer5.54 × 10−7−0.43836.4972 × 10−3
60% WC with the bottom layer6.02 × 10−8−0.470697.0596 × 10−4
Table 8. Experimental results of 70% NiCrBSi + 30% WC without the bottom layer impact energy.
Sample NumberSetting
Temperature/°CSample
Width/mm
Sample
Thickness/mm
Absorbing Power/JImpact
Toughness/(J/cm2)
Total Impact Energy/JSwing Angle/°
without the bottom layer 12510513.7634.4012.76−150
without the bottom layer 22510515.7539.3714.93−150
without the bottom layer 32510514.3835.9511.90−150
average------14.6336.5713.19--
Table 9. Experimental program of impact energy.
Sample NumberSetting
Temperature/°CSample Width/mmSample Thickness/mmAbsorbing Power/JImpact Toughness/(J/cm2)Total Impact Energy/JSwing Angle/°
with the bottom layer 4251051.283.200.00−150
with the bottom layer 5251054.2310.583.10−150
with the bottom layer 6251052.476.170.00−150
average------2.666.651.03--
Disclaimer/Publisher’s Note: The statements, opinions and data contained in all publications are solely those of the individual author(s) and contributor(s) and not of MDPI and/or the editor(s). MDPI and/or the editor(s) disclaim responsibility for any injury to people or property resulting from any ideas, methods, instructions or products referred to in the content.

