
In Situ Synthesis and Tribological Characterization of TiC–Diamond Composites: Effect of the Counterface Material on Wear Rate and Mechanism


Abstract
1. Introduction
2. Materials and Methods
3. Results
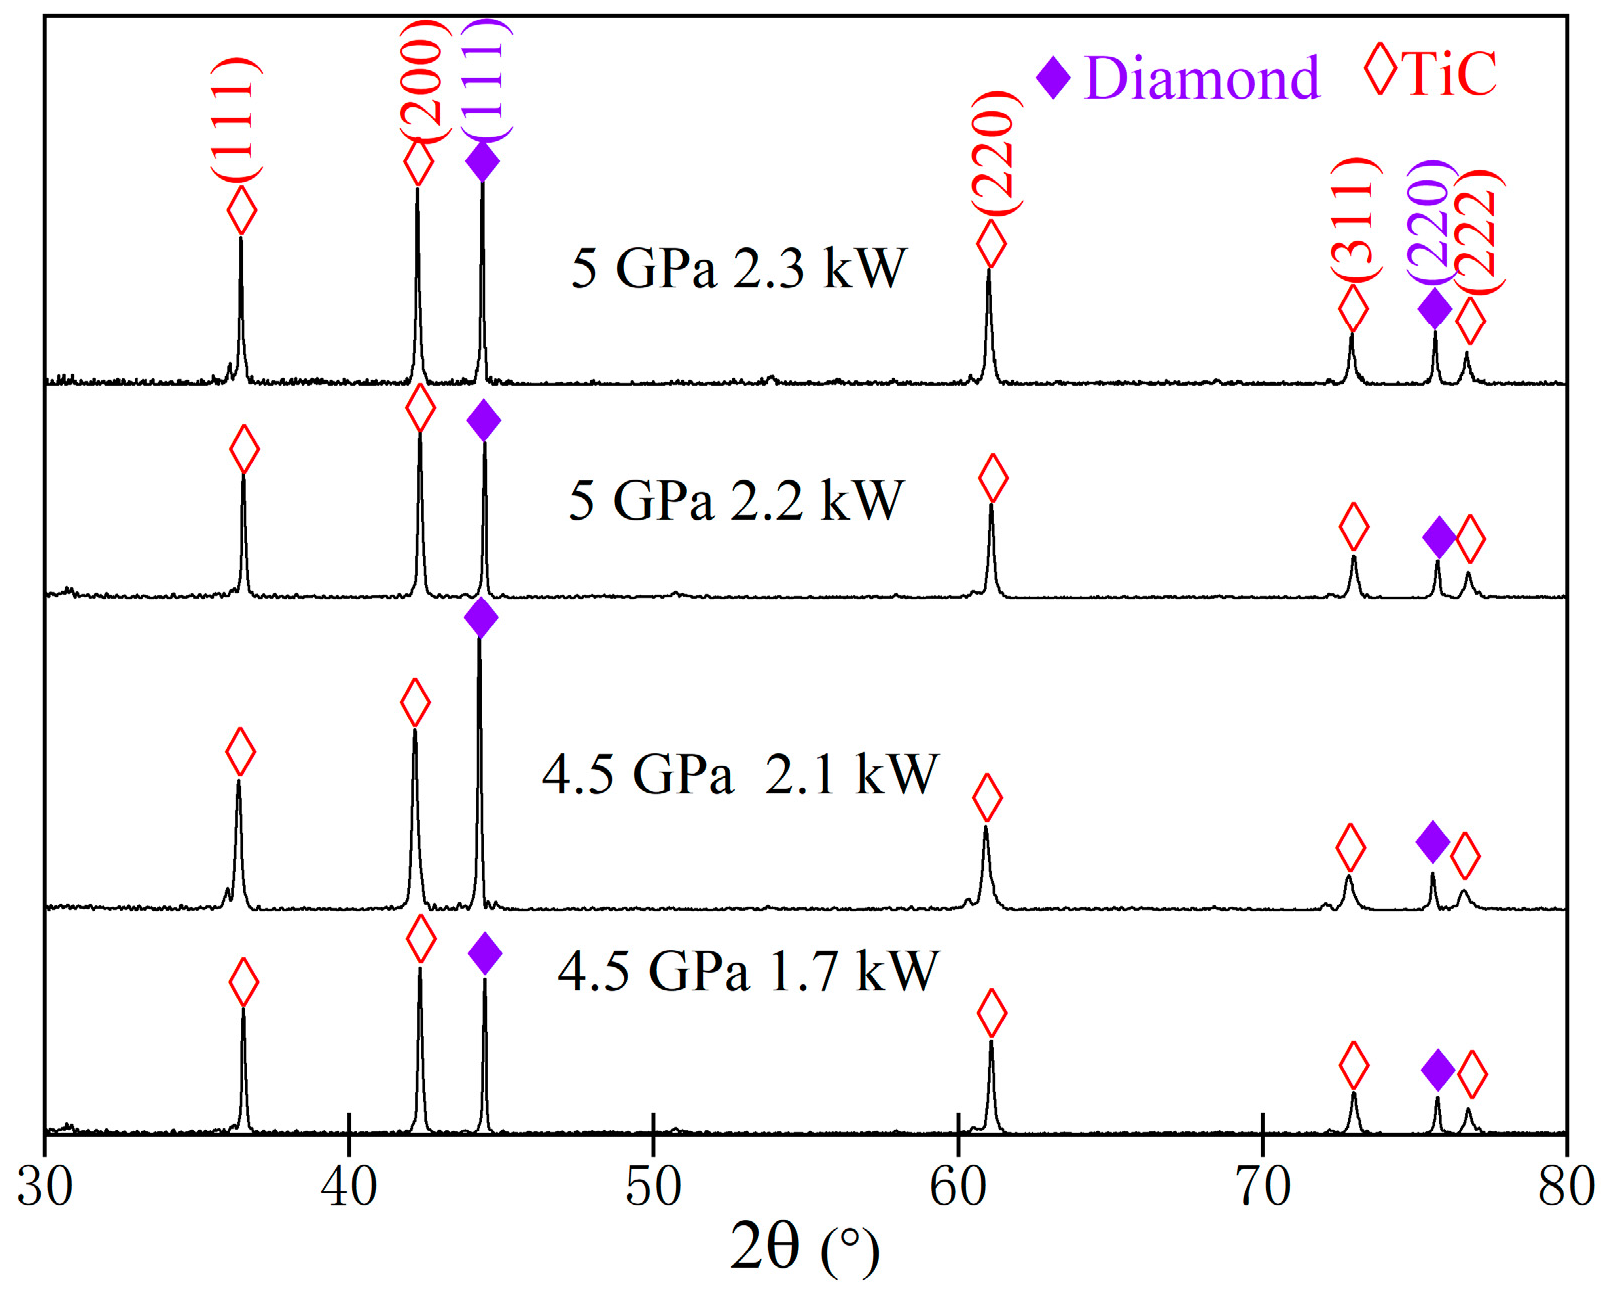
3.1. Composition of TiC–Diamond Composites
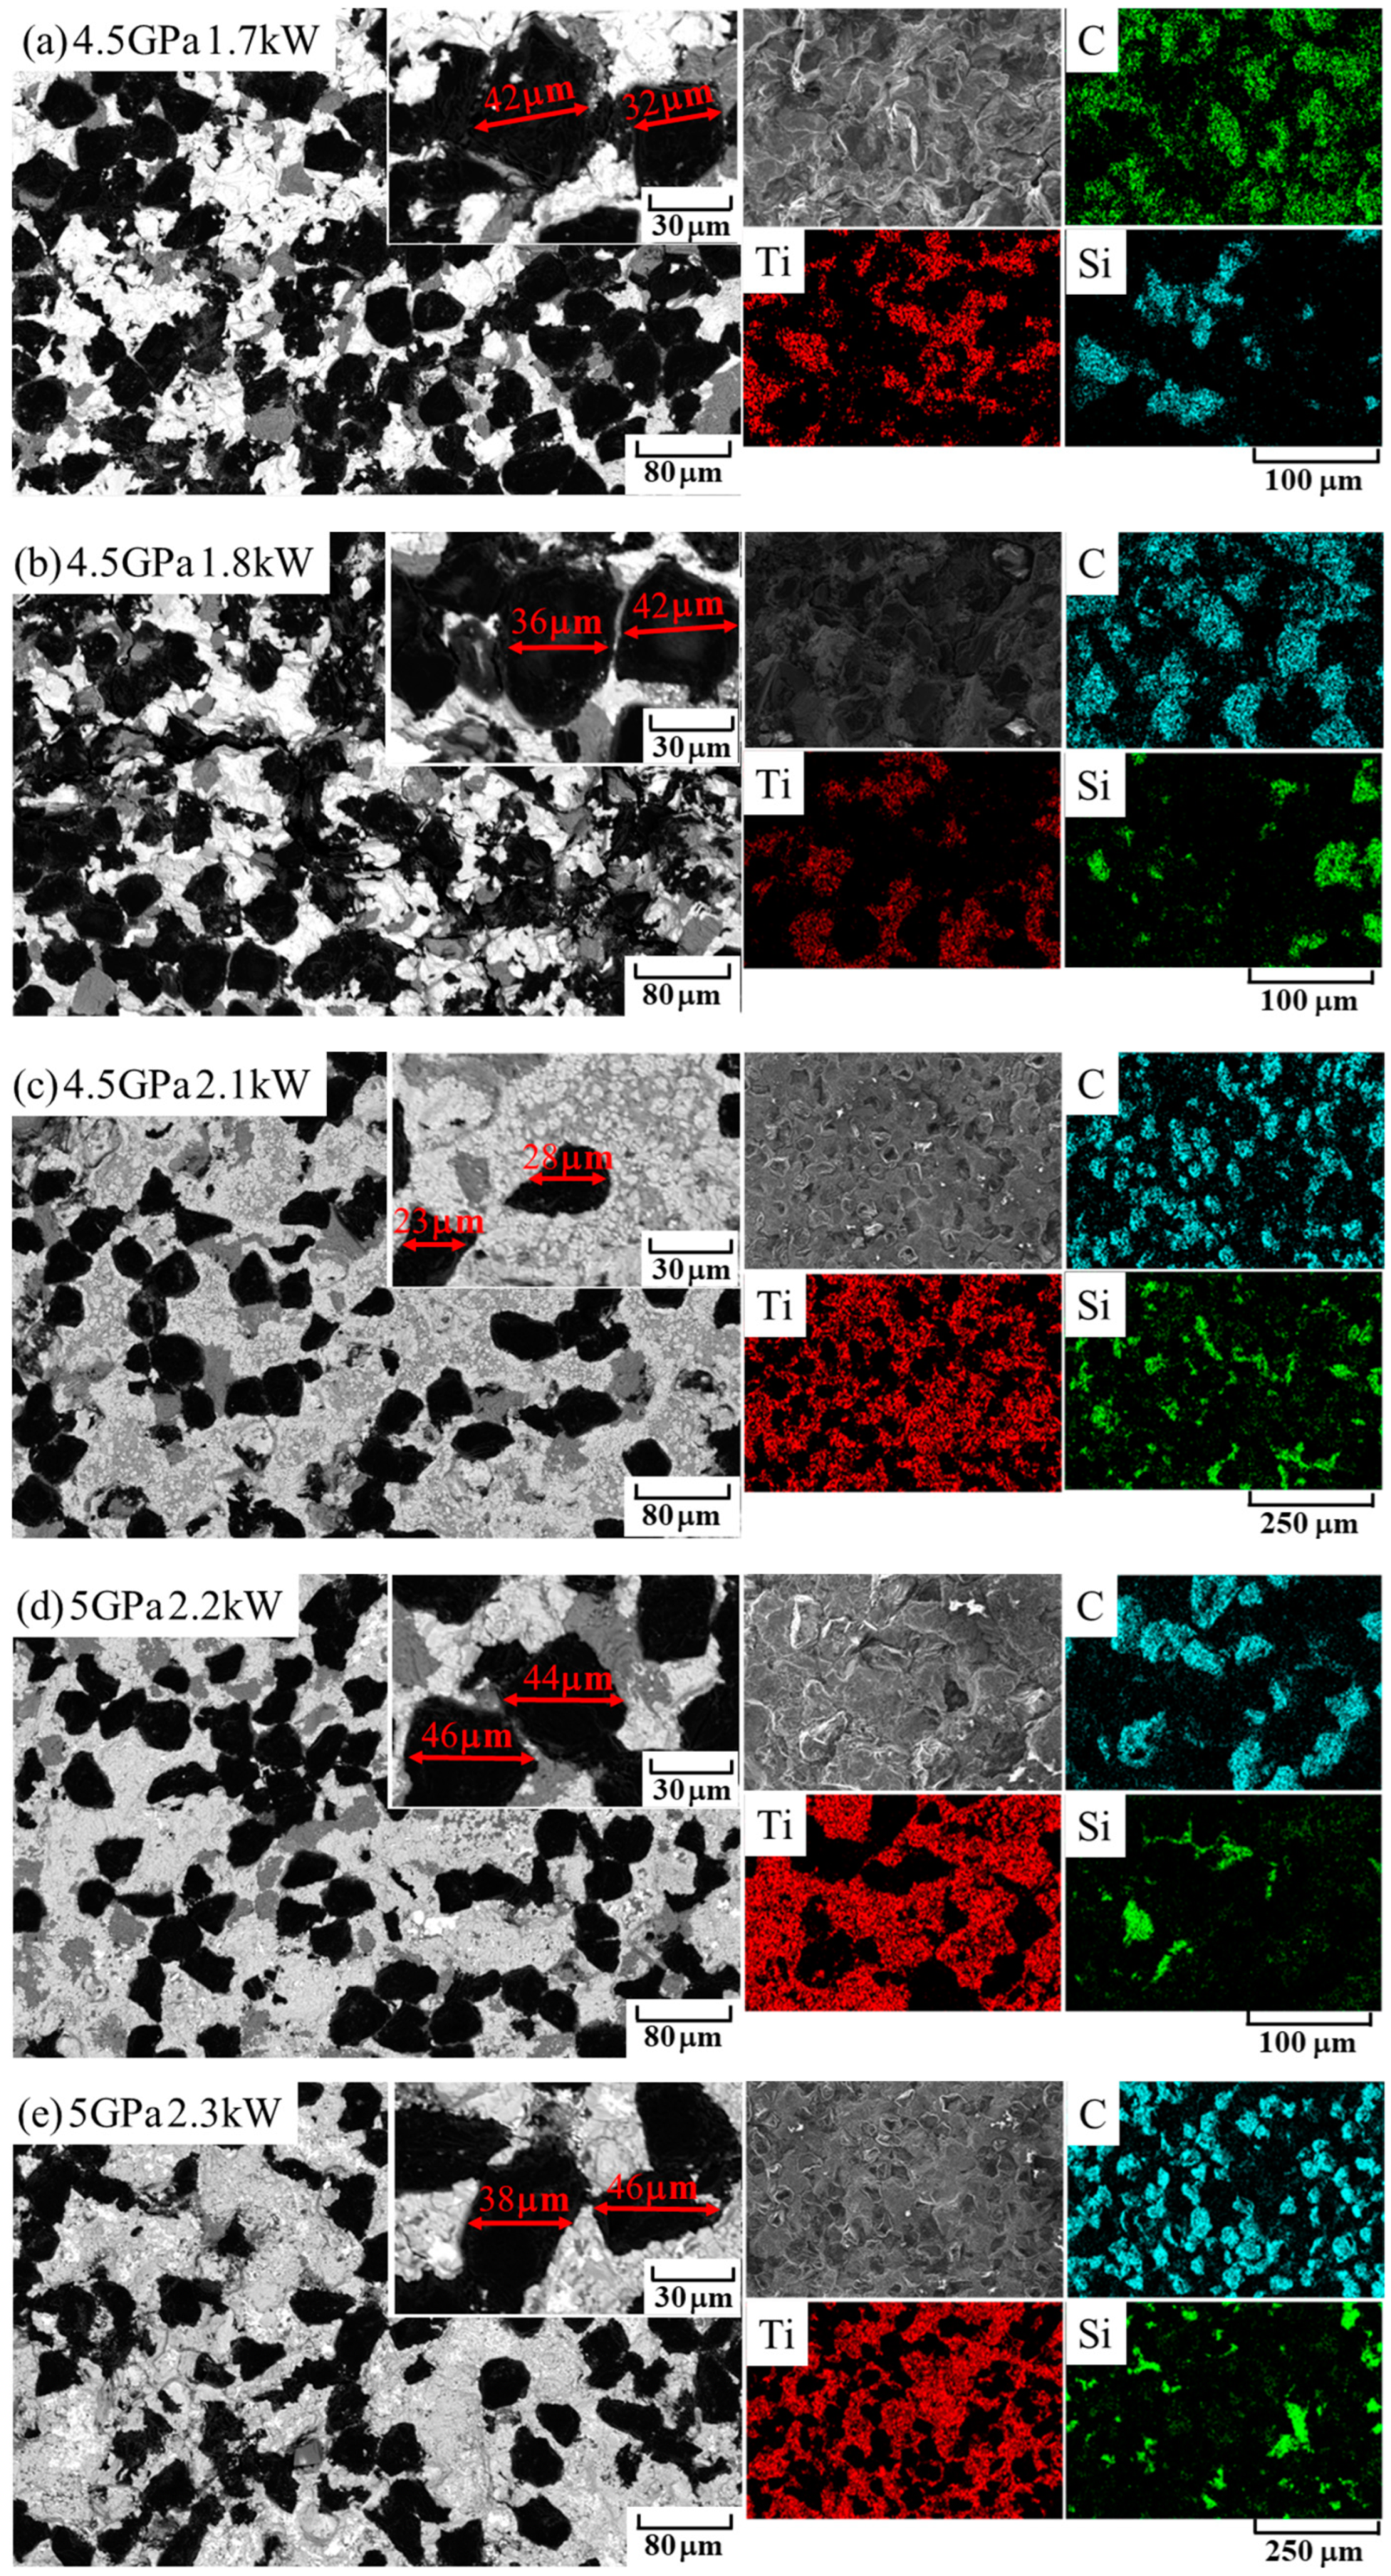
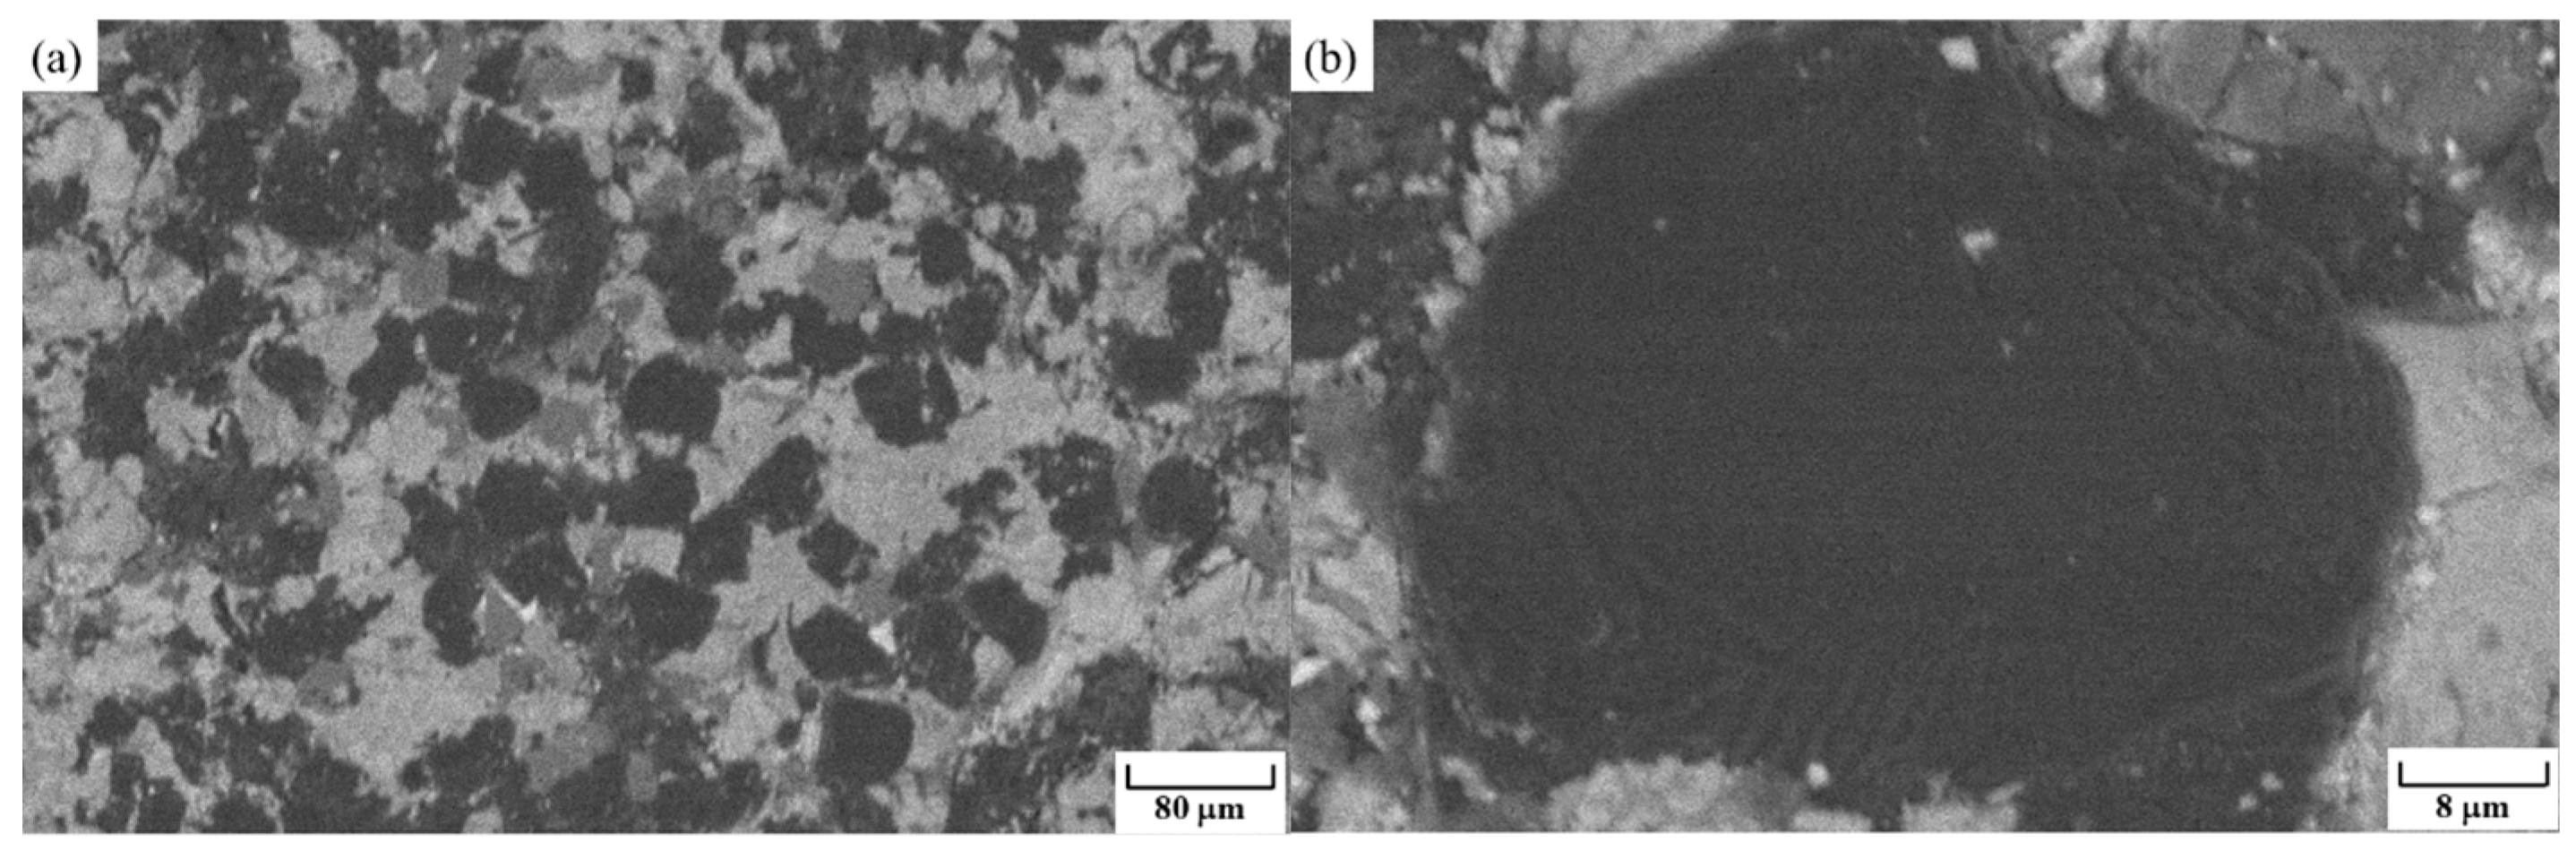
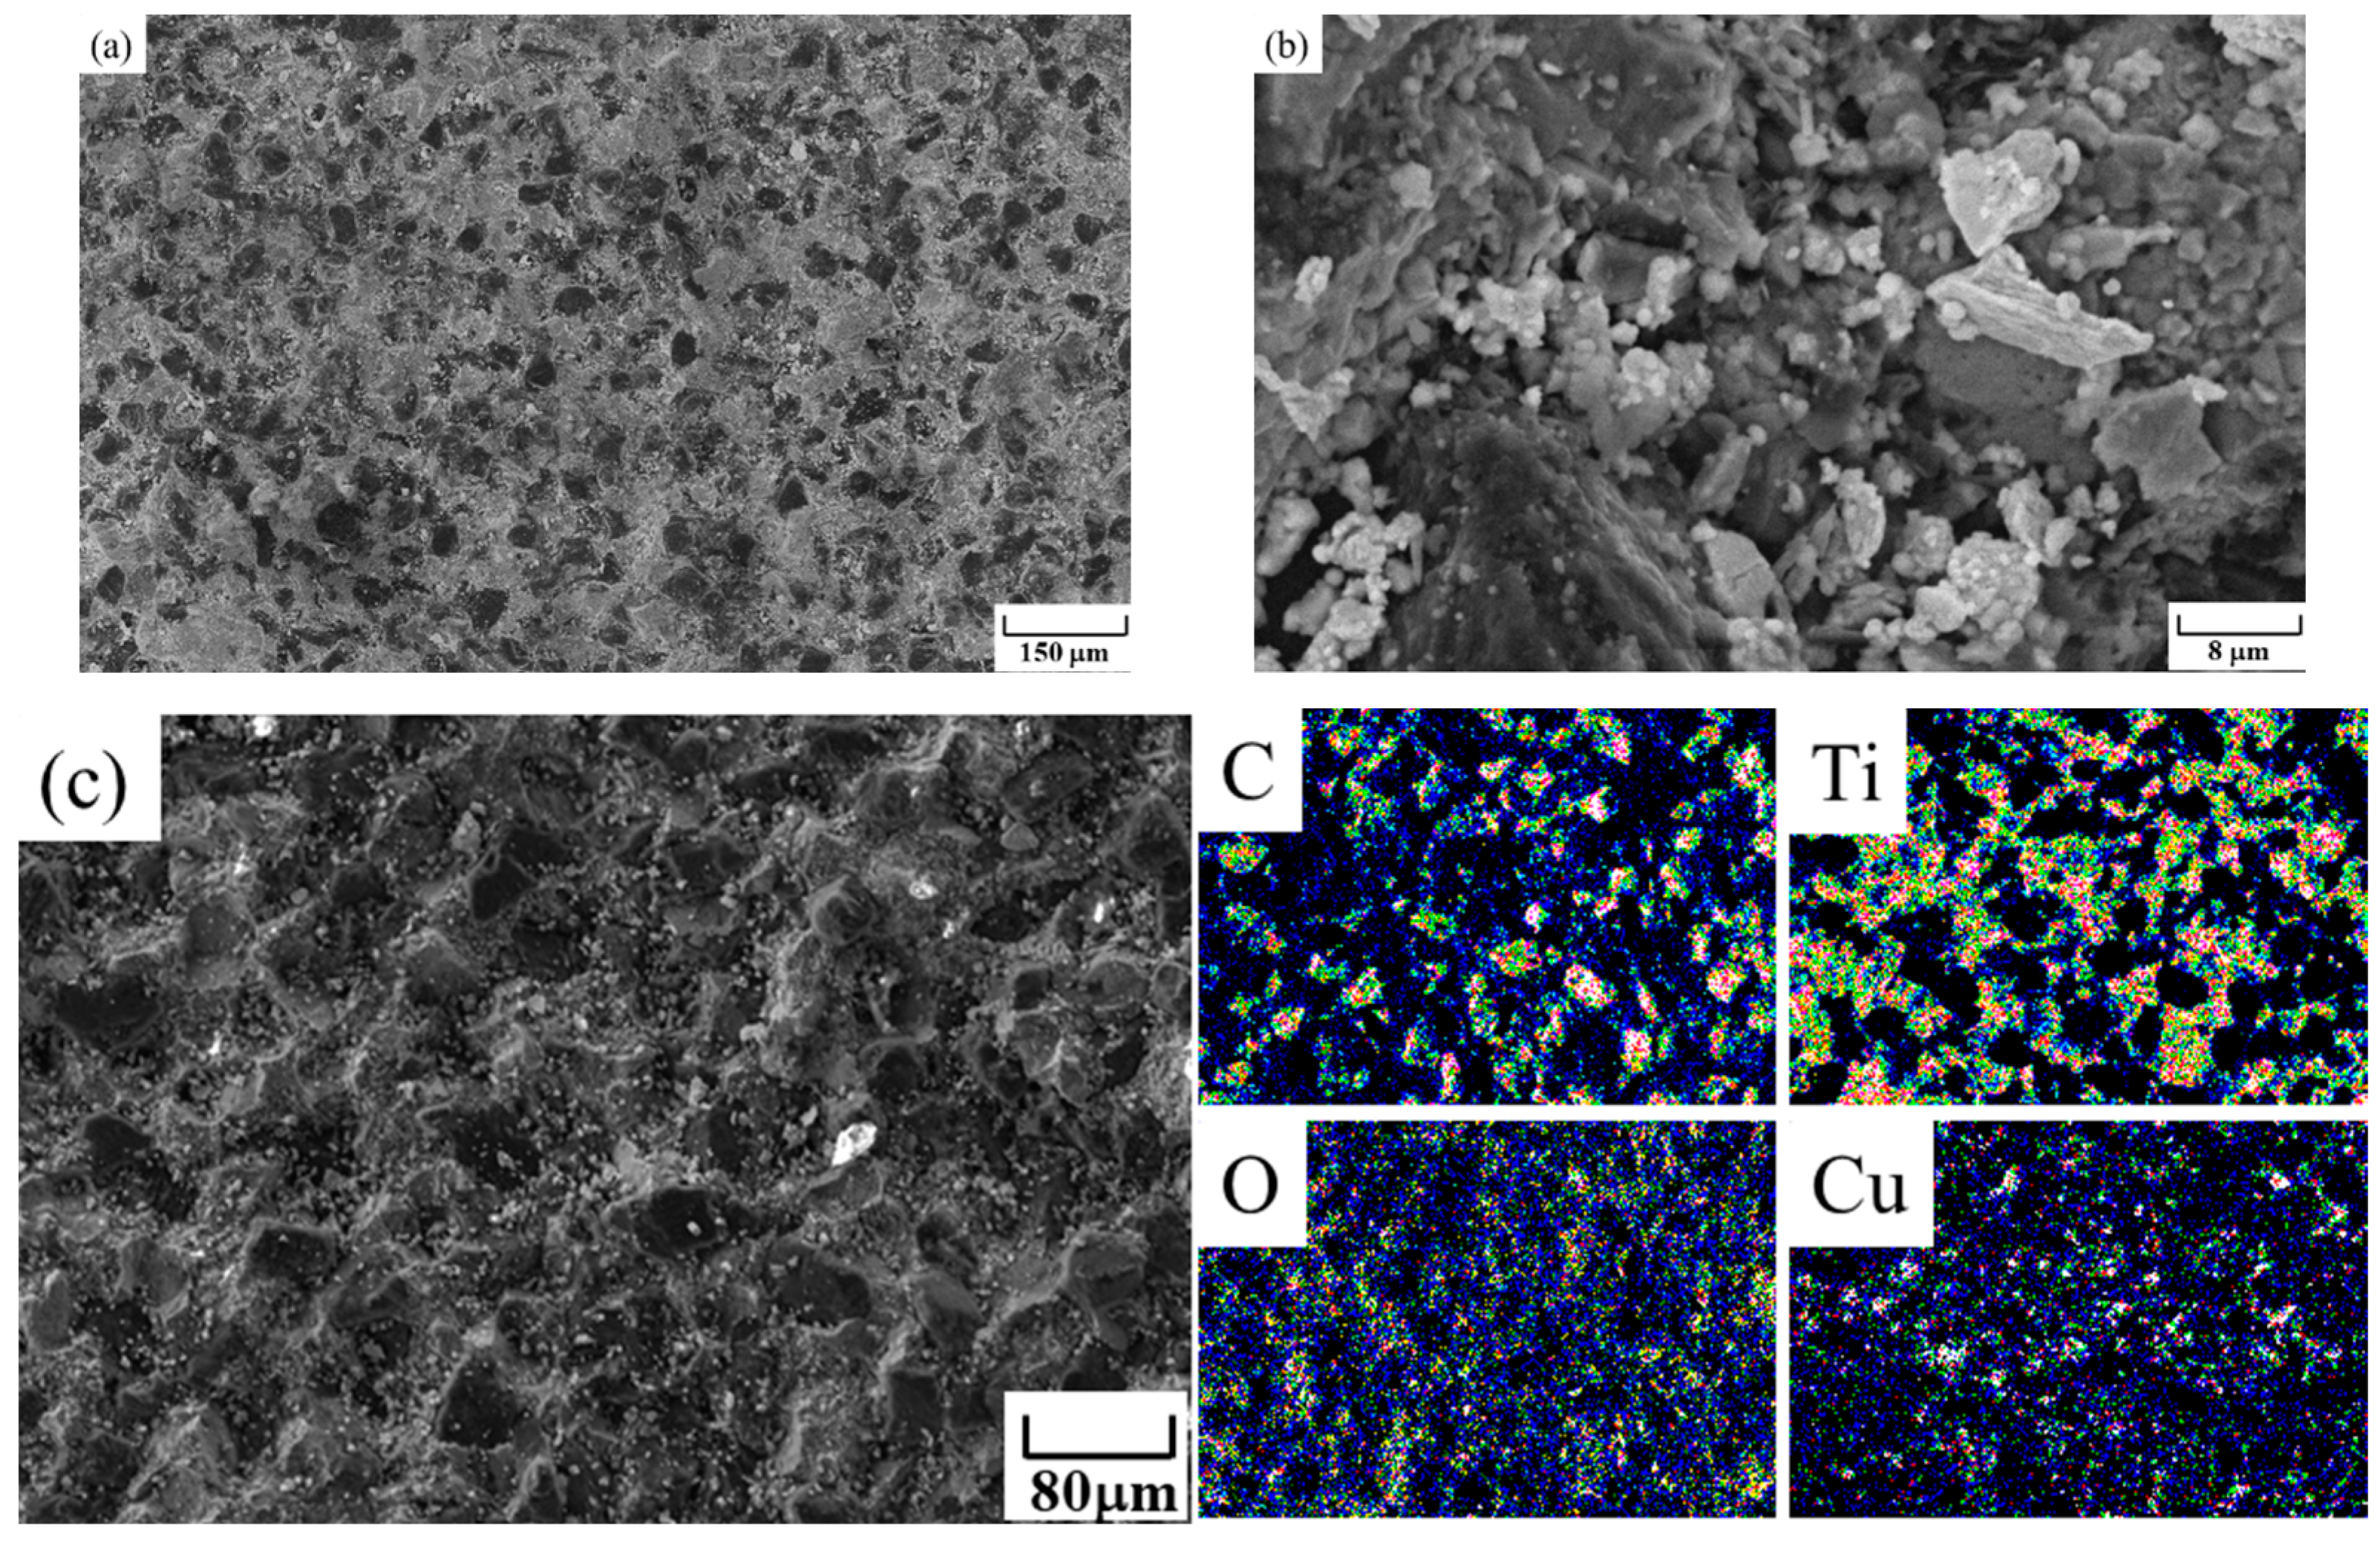
3.2. SEM/EDS and XPS Analysis of TiC–Diamond Composites
3.3. Friction Properties of TiC–Diamond Composites
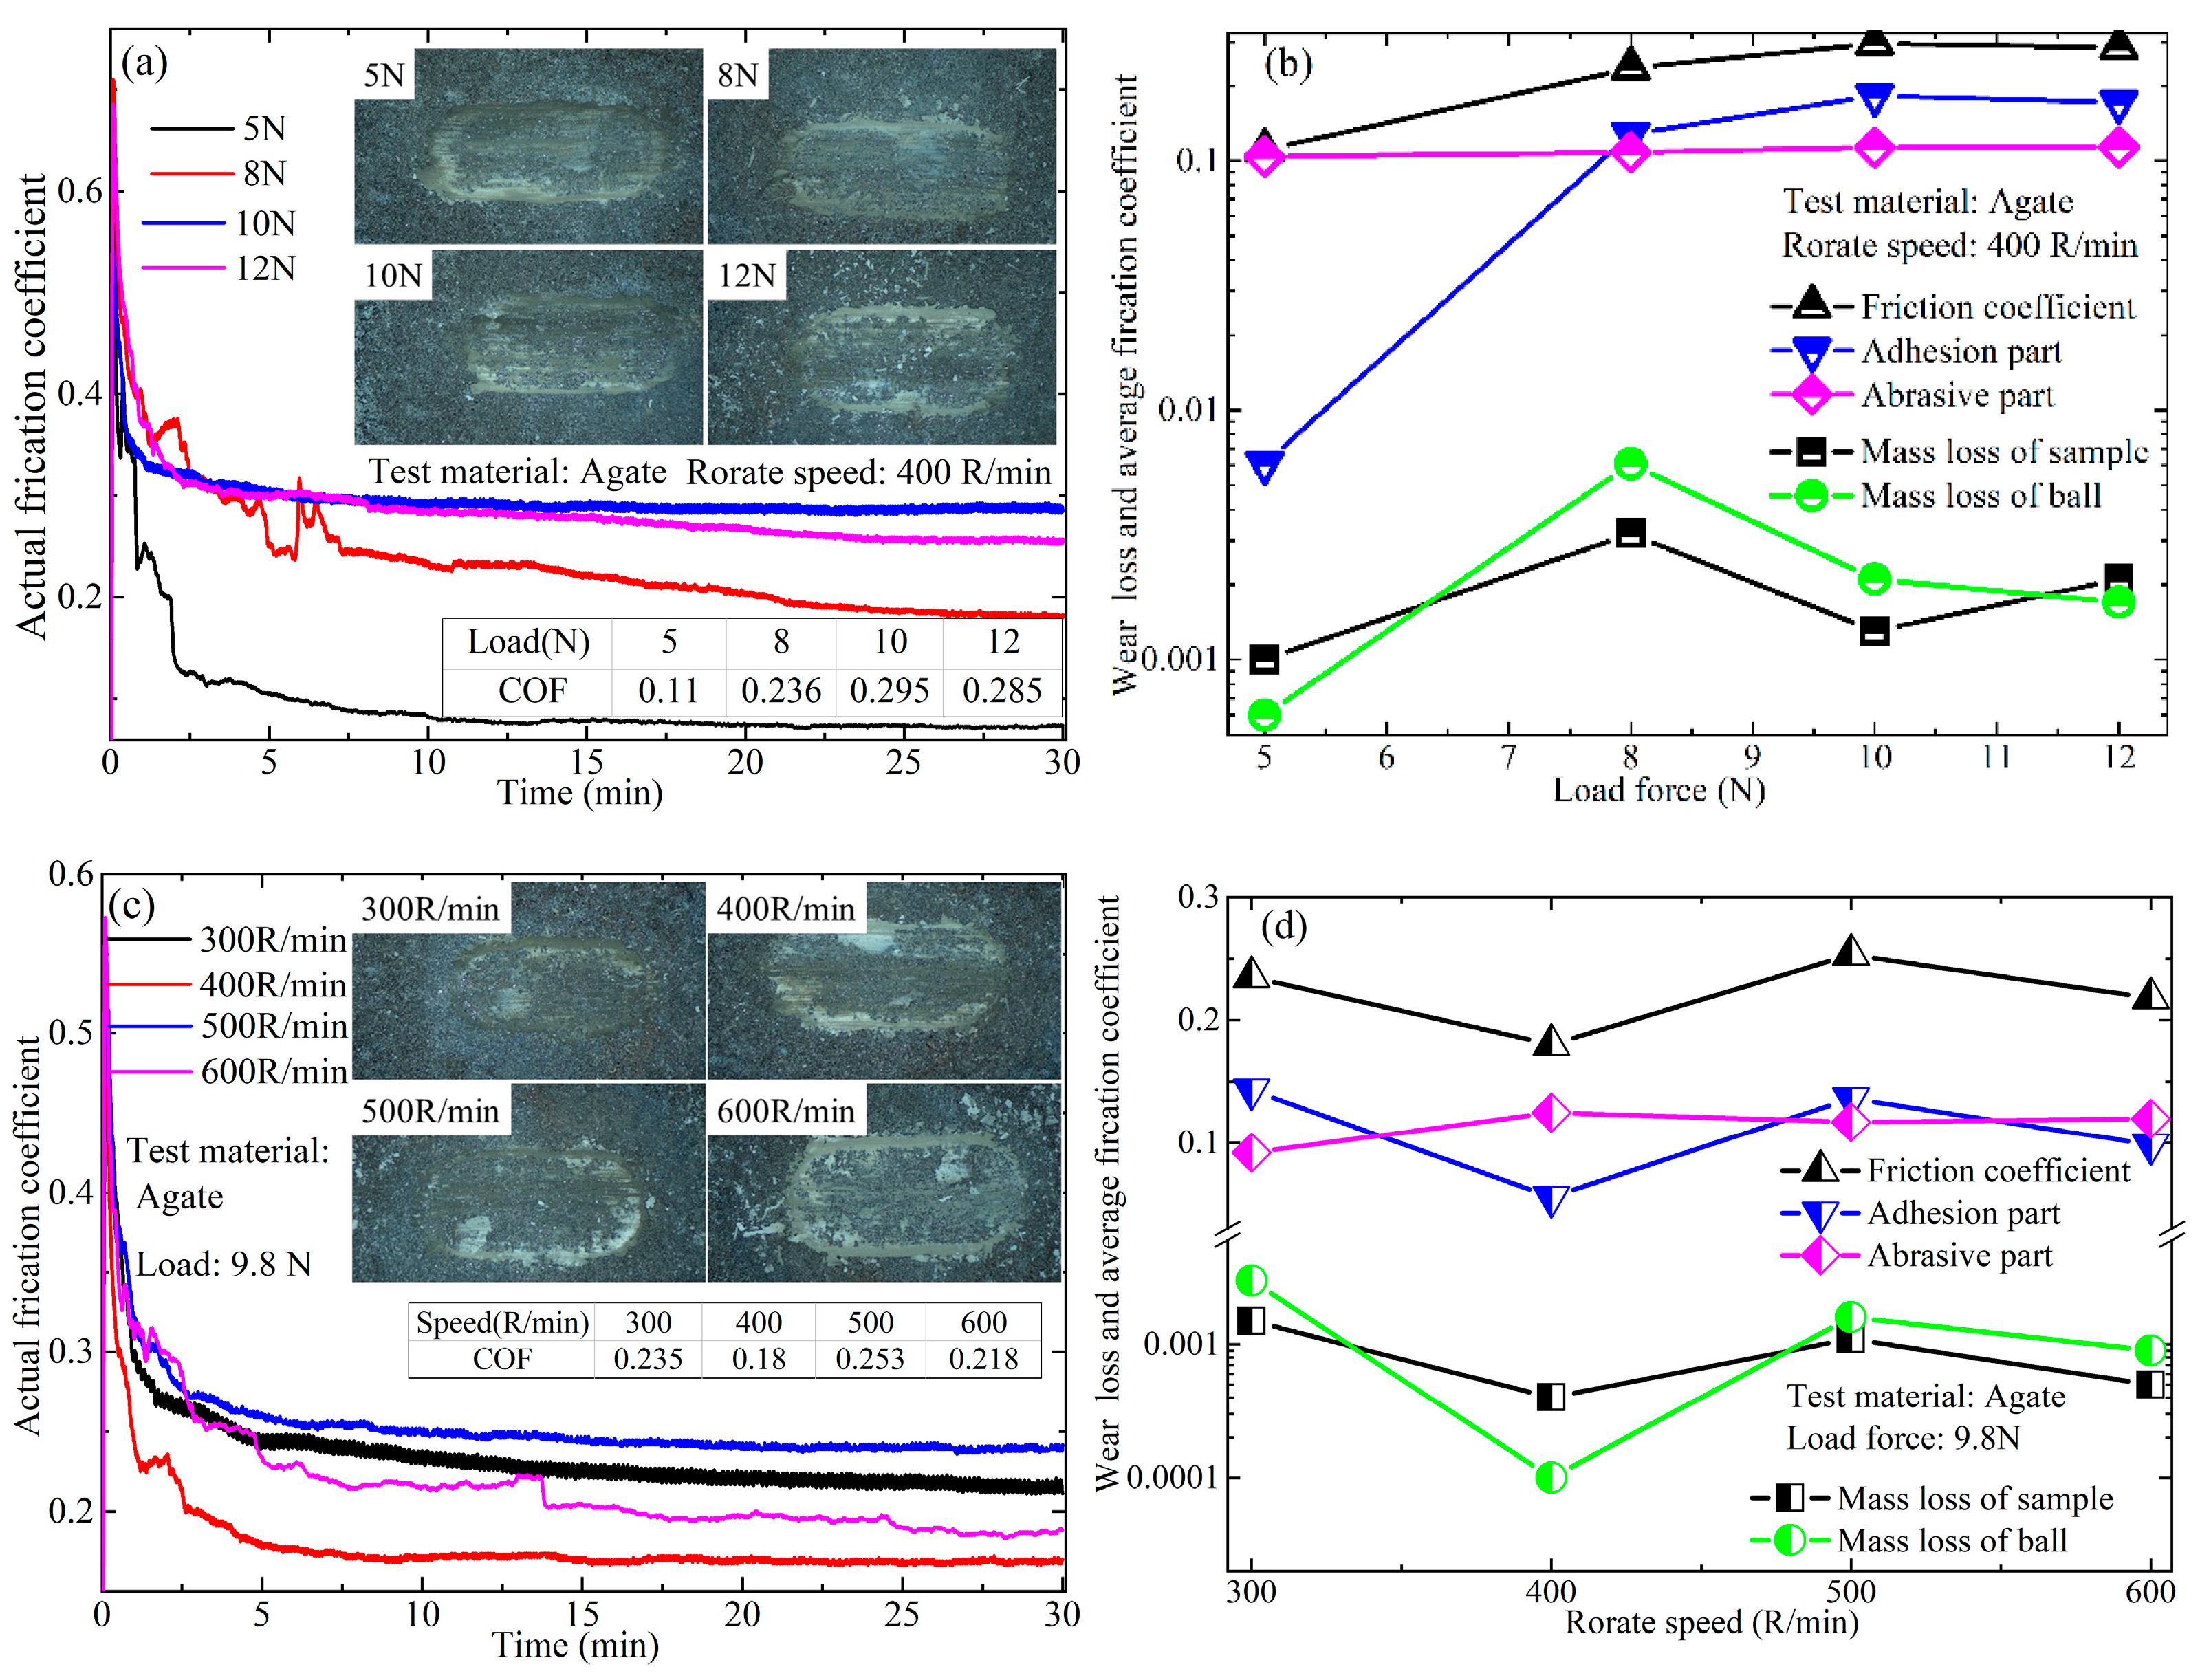
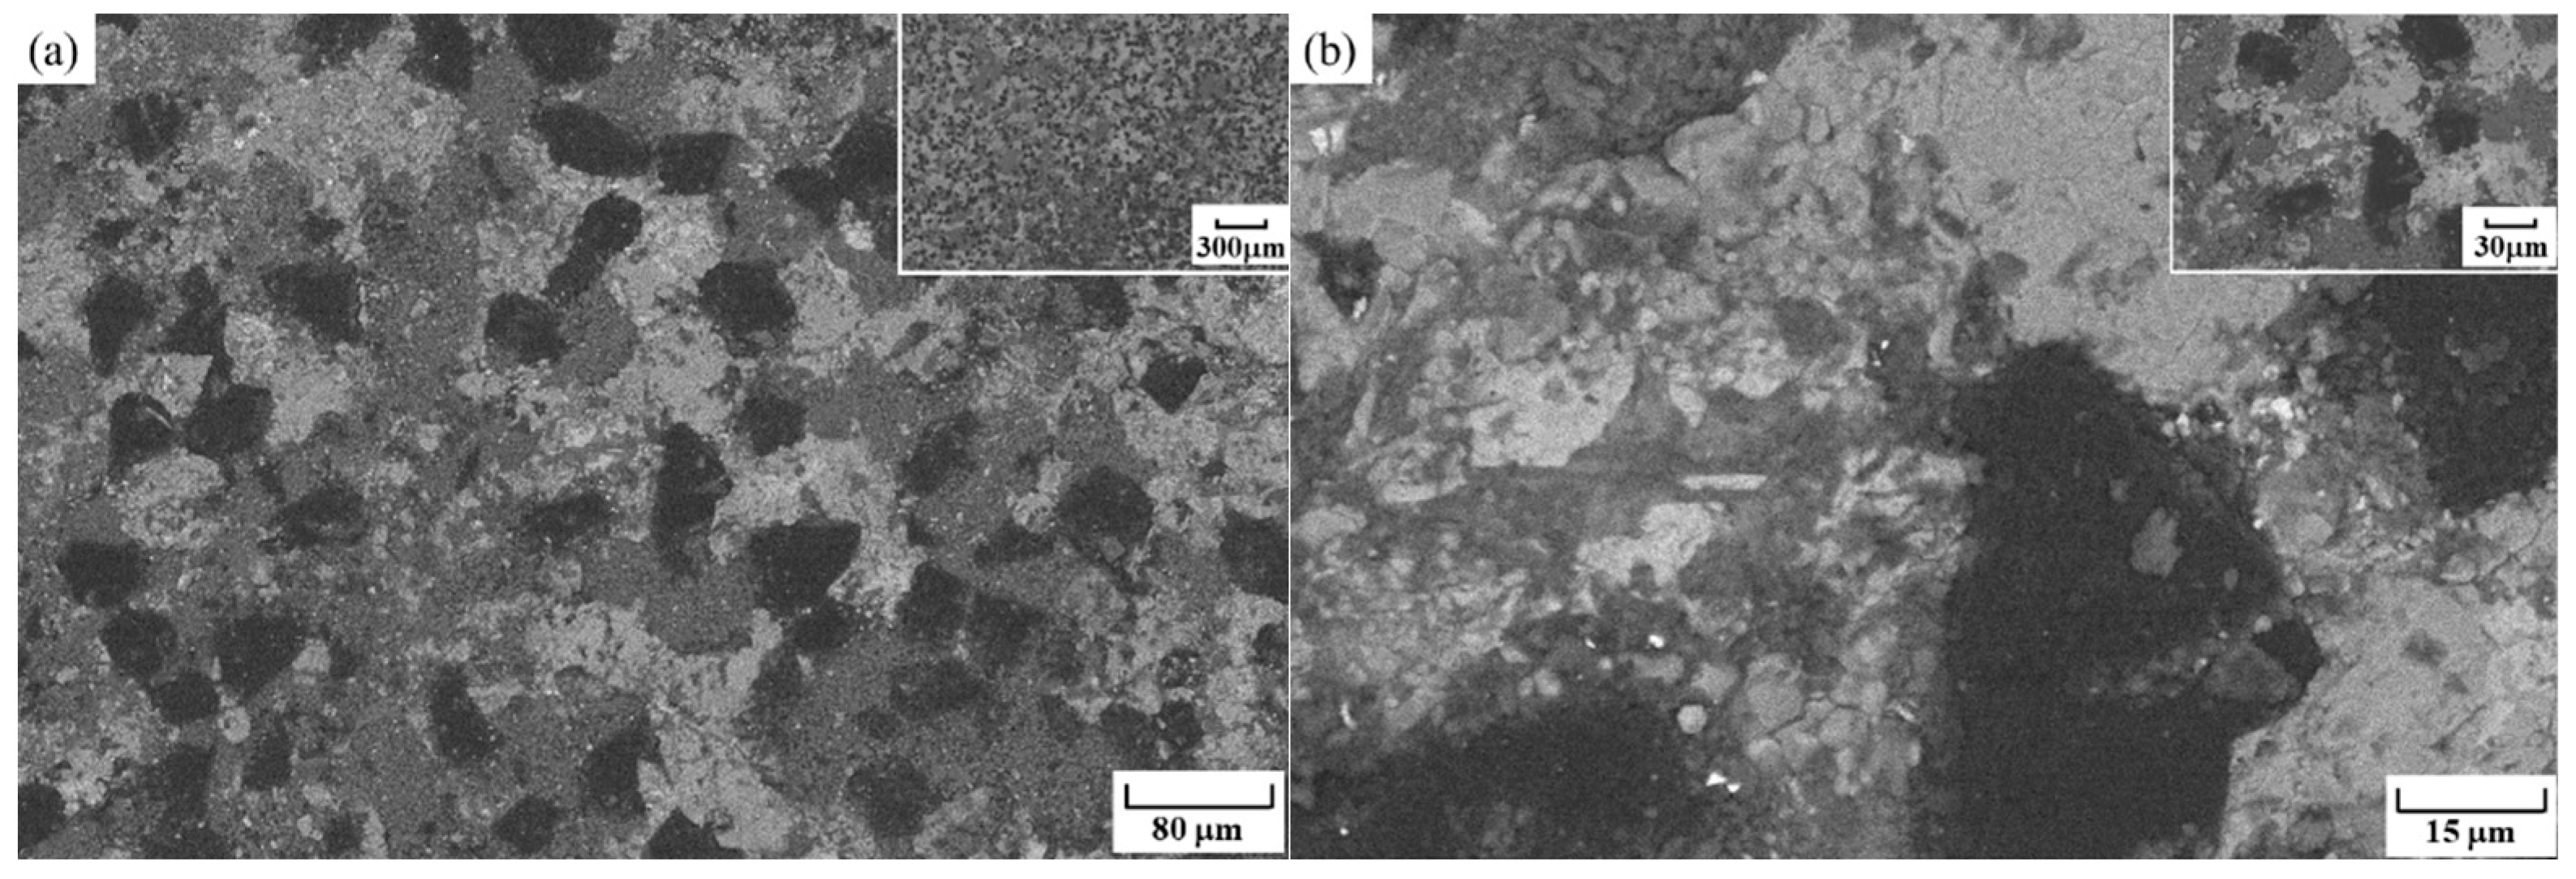
3.3.1. Agate
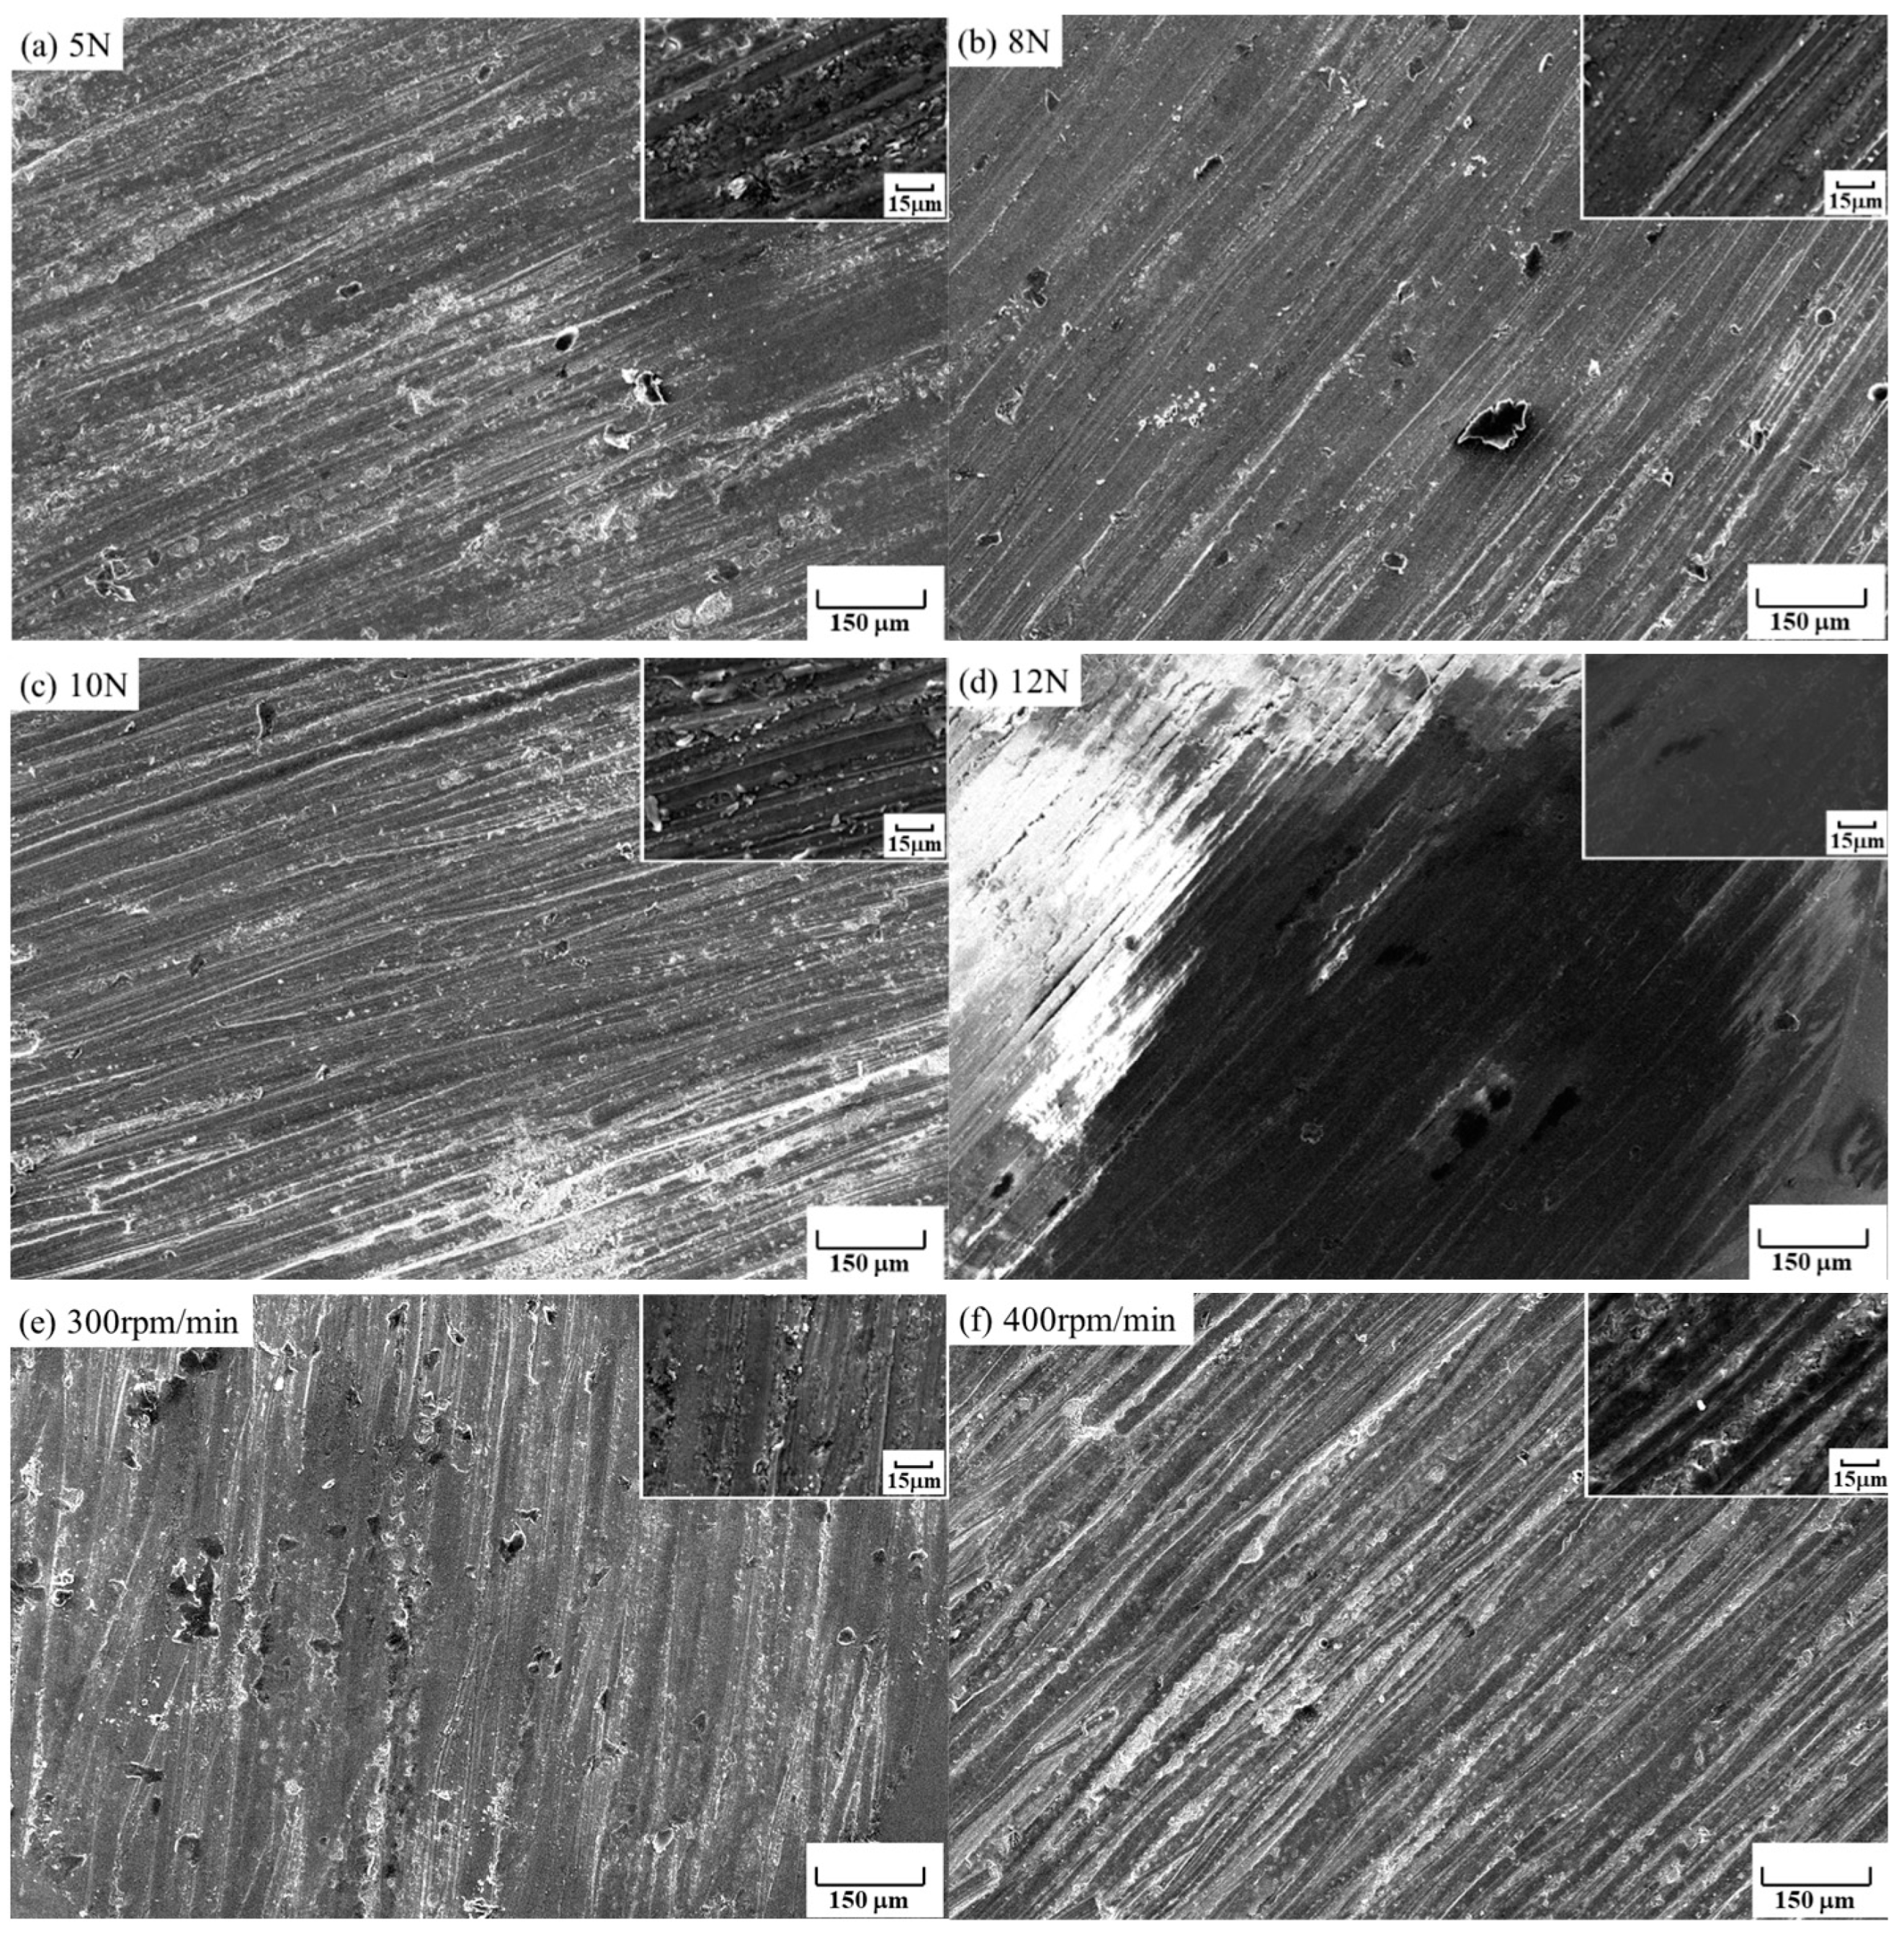
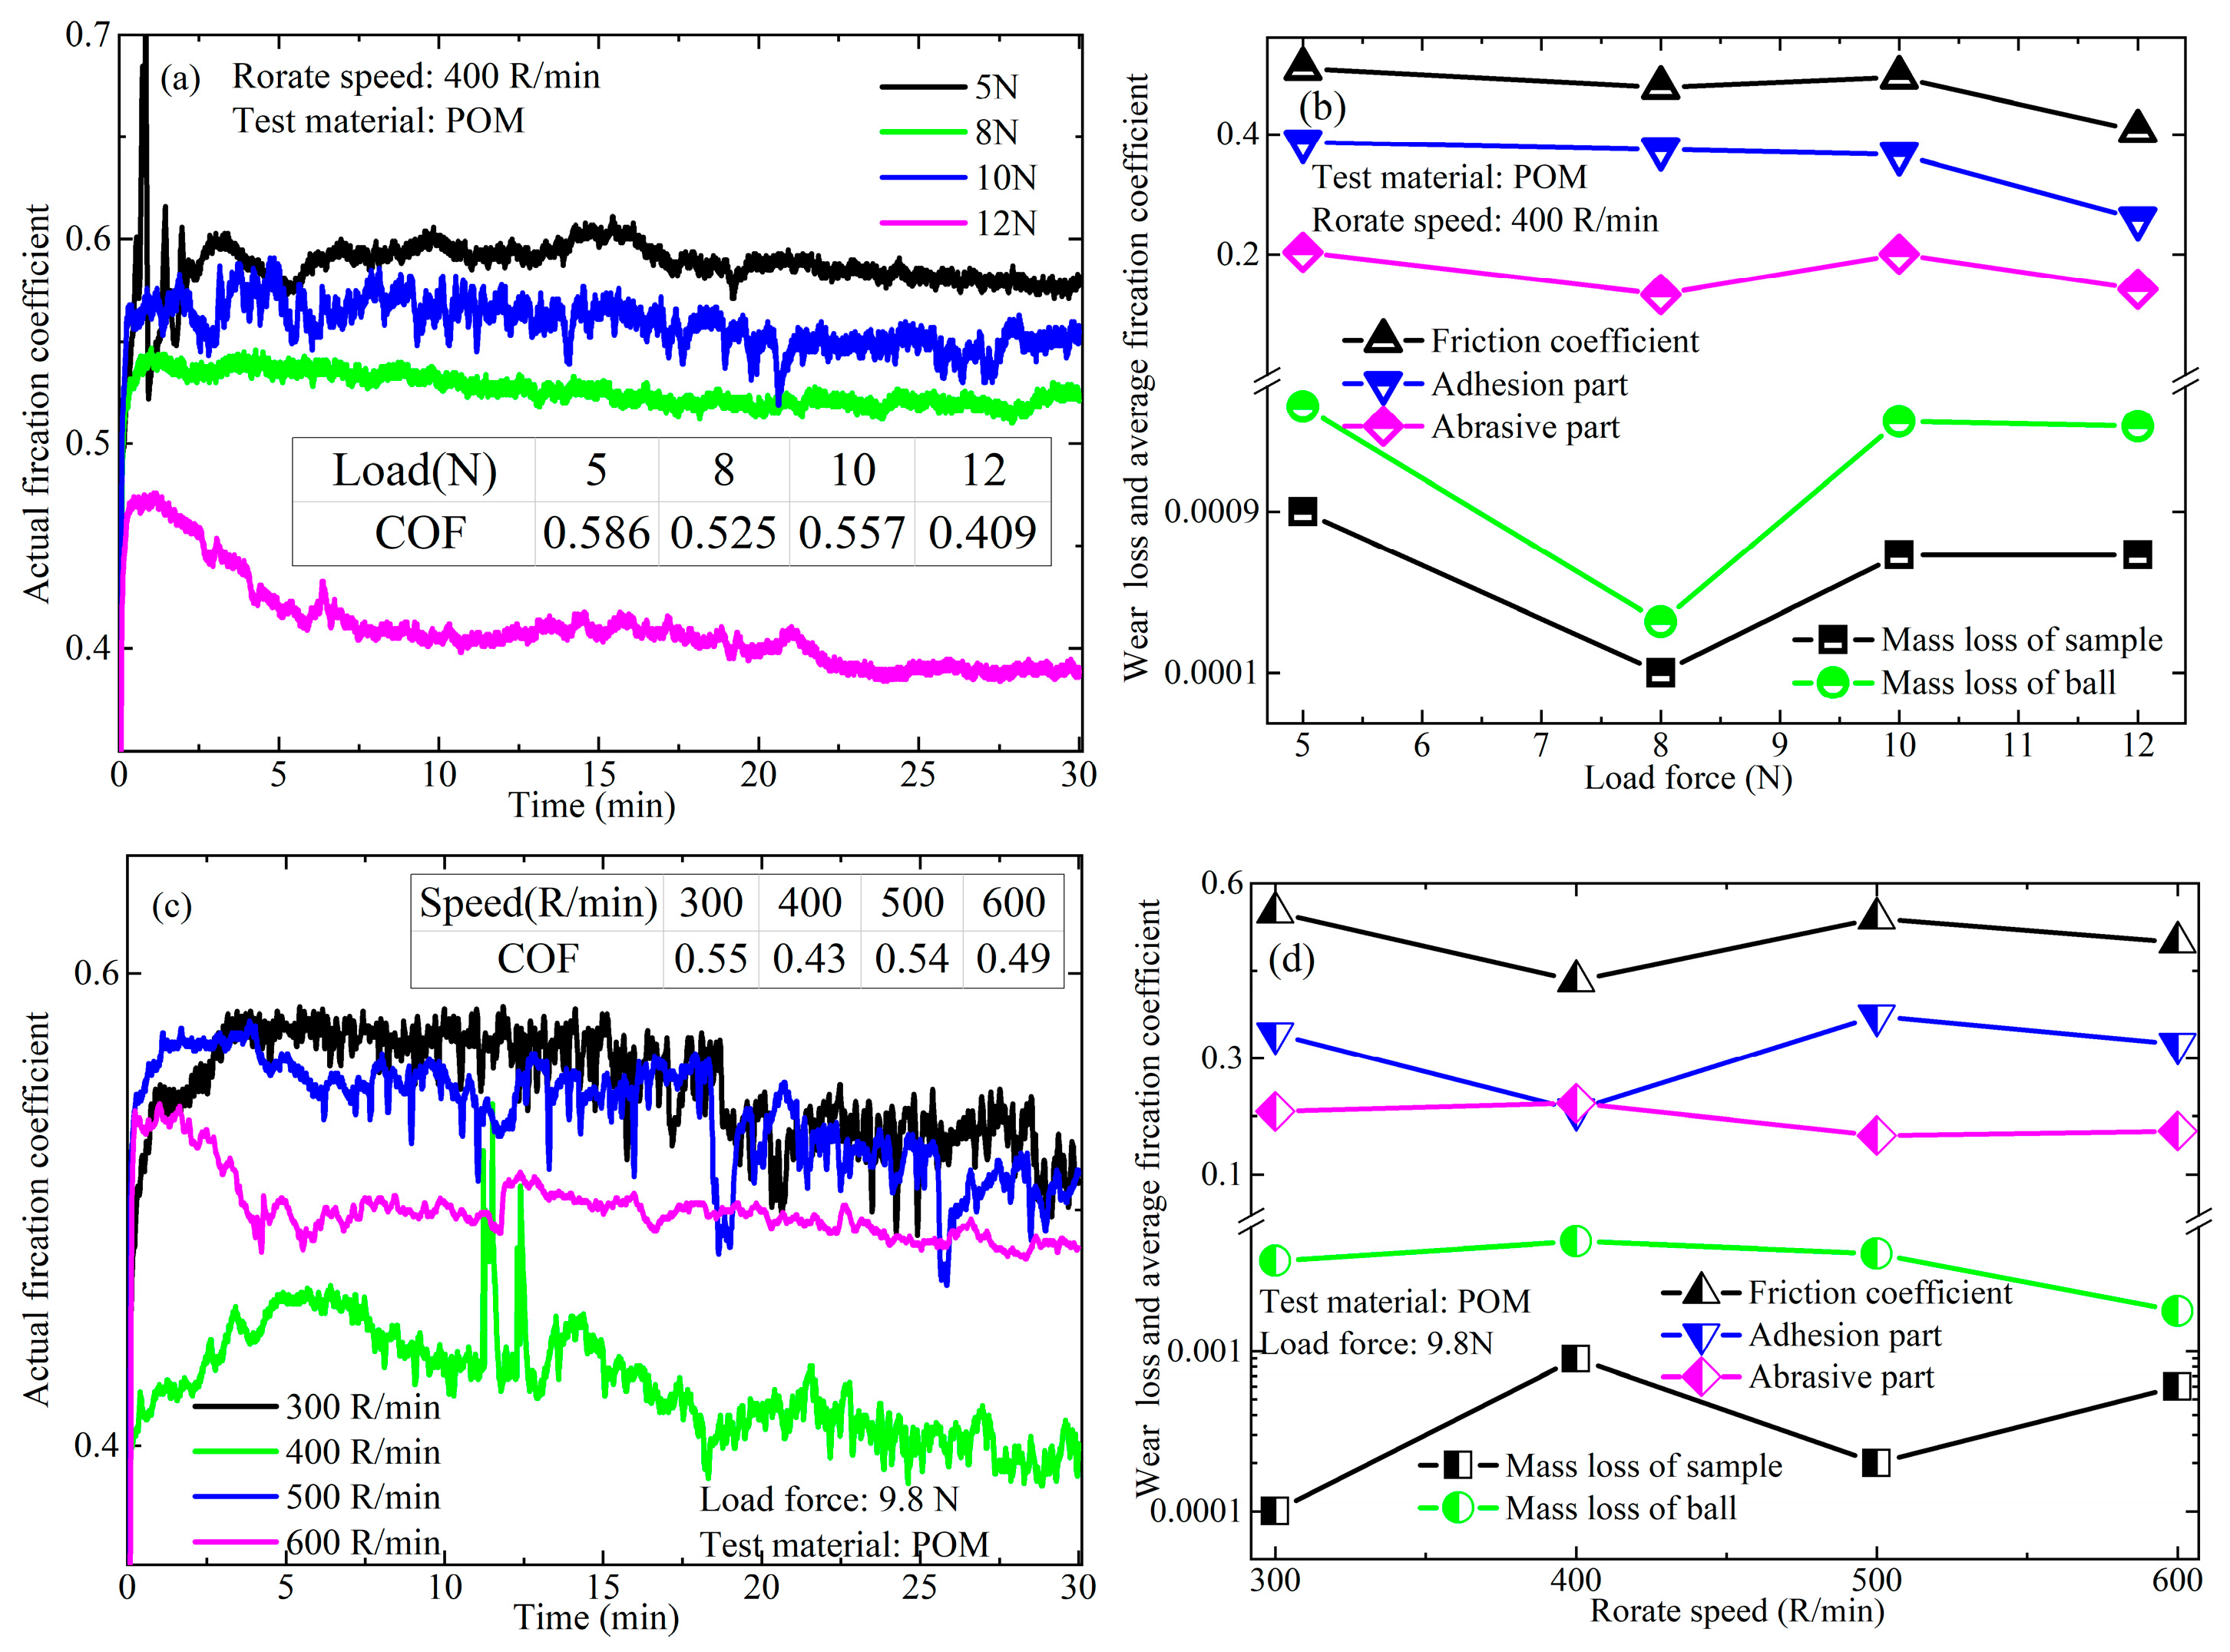
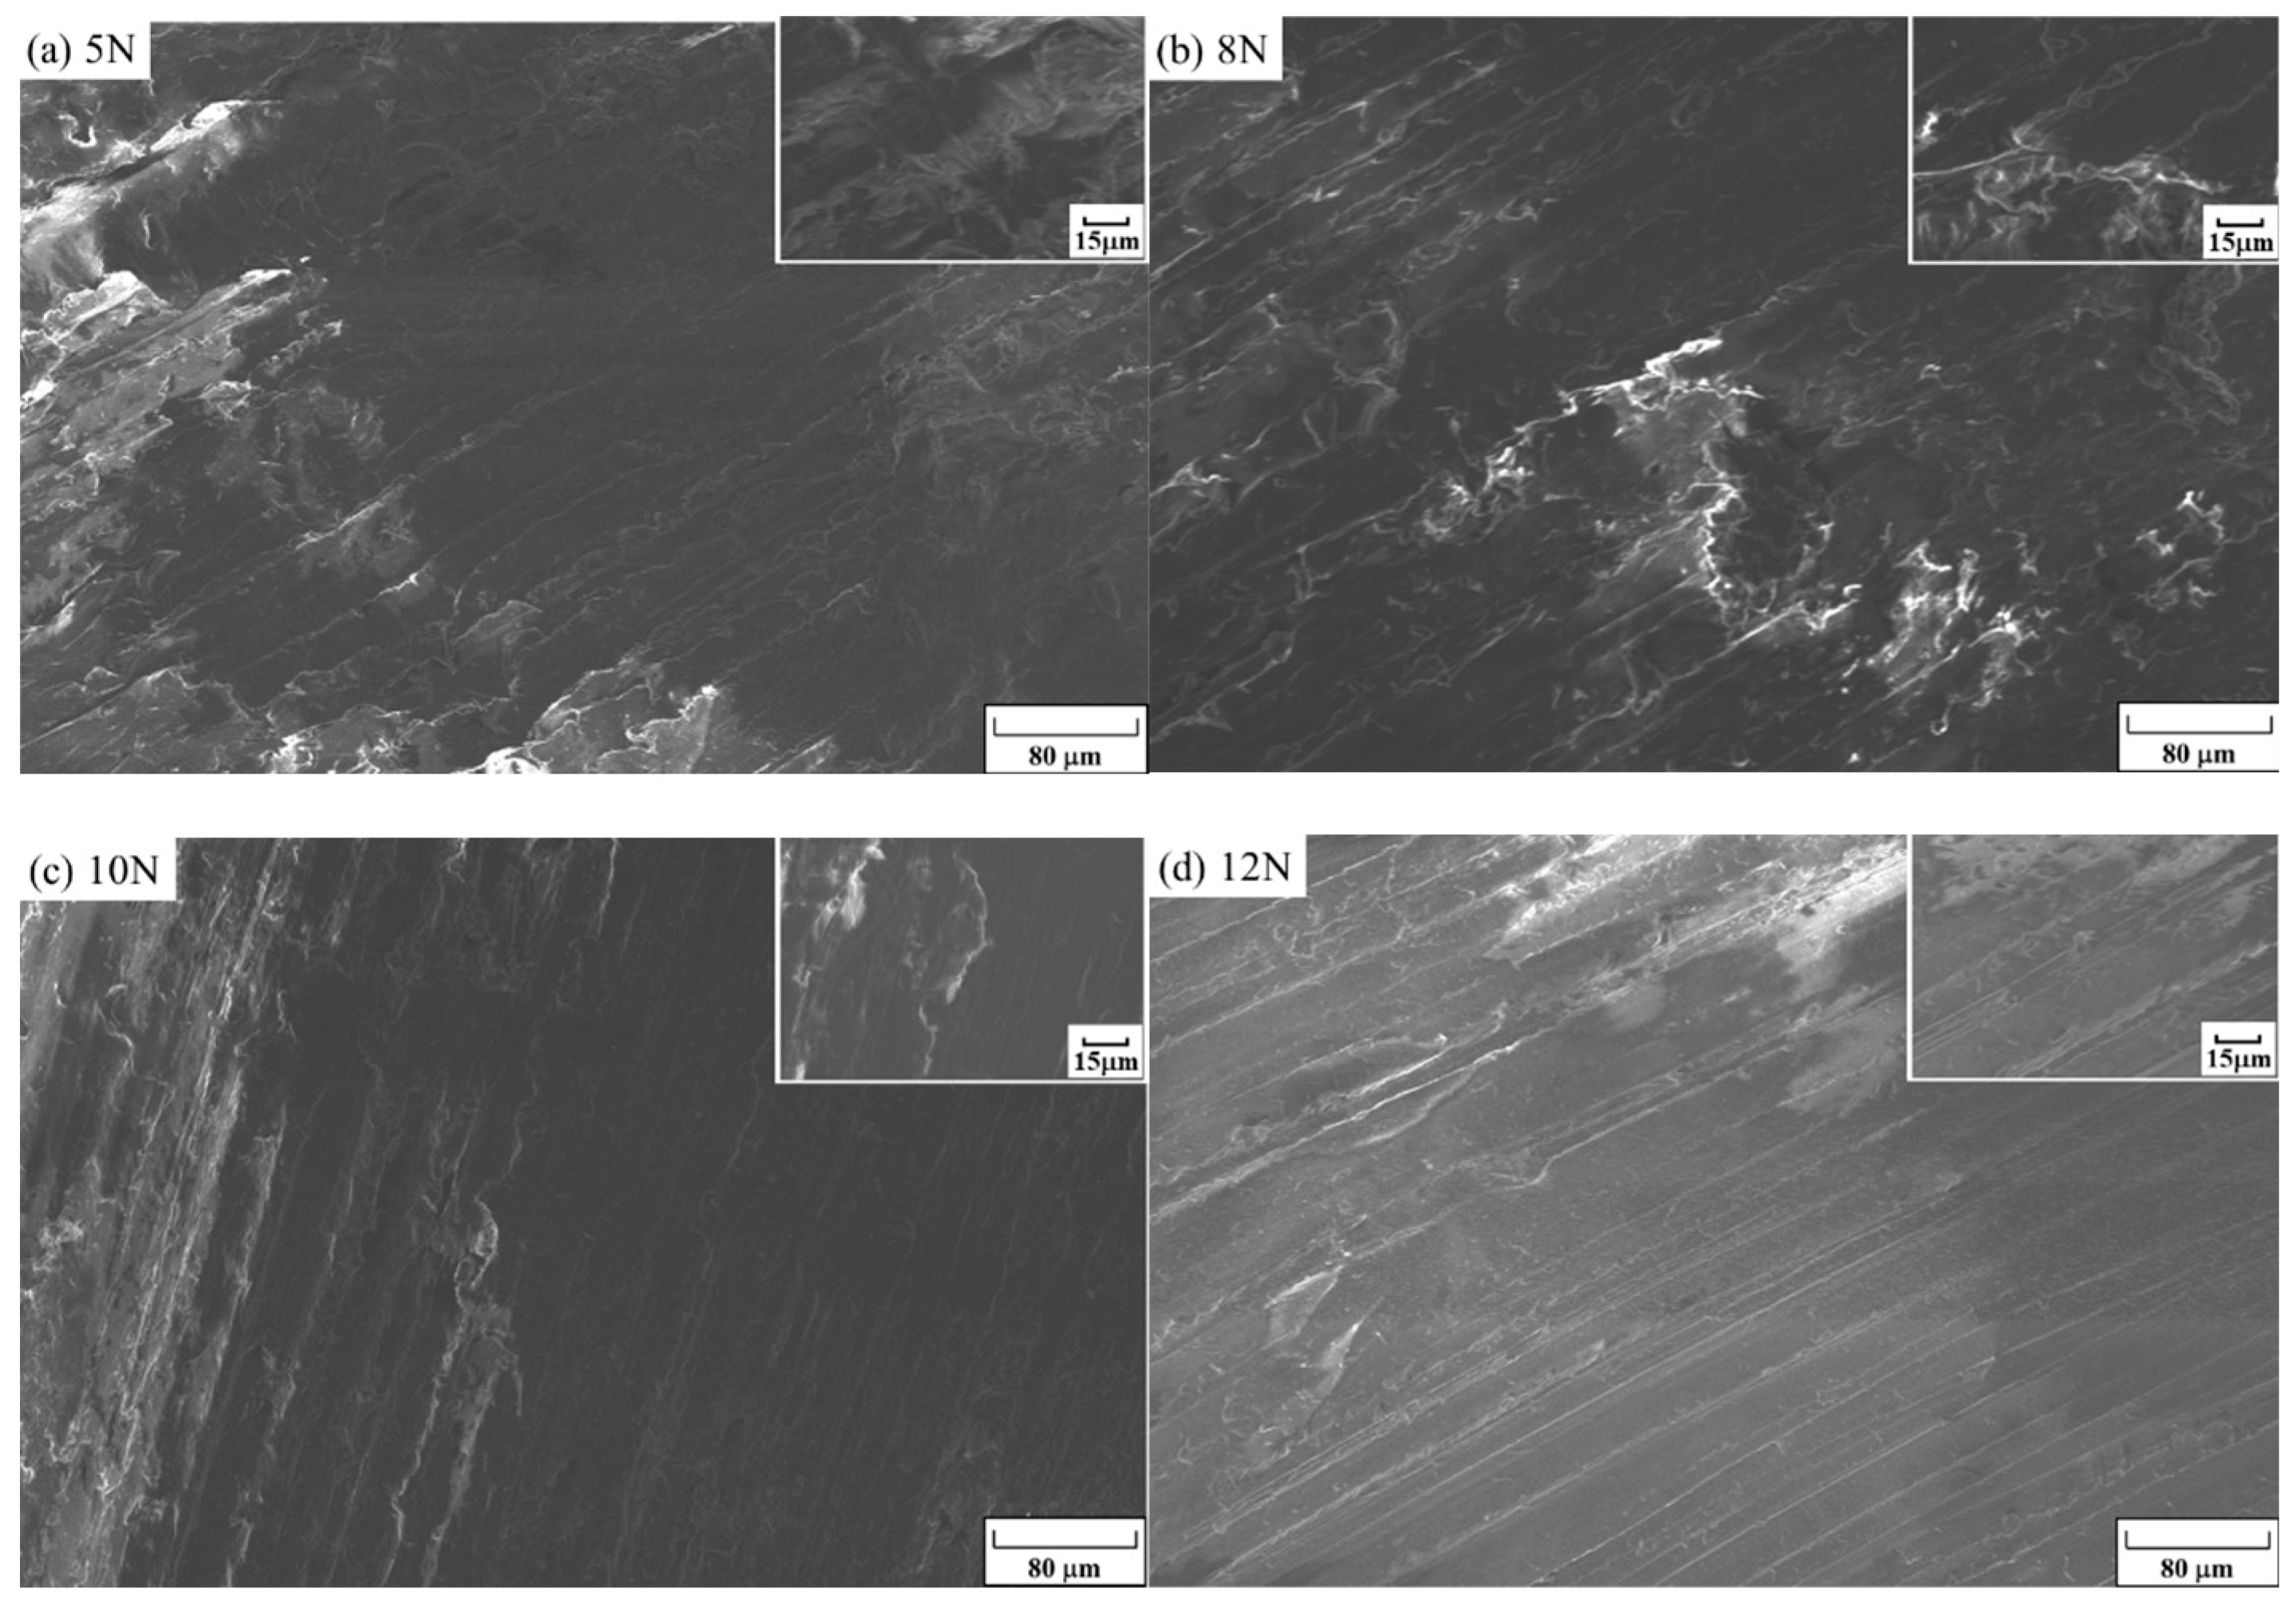
3.3.2. POM
3.3.3. PP
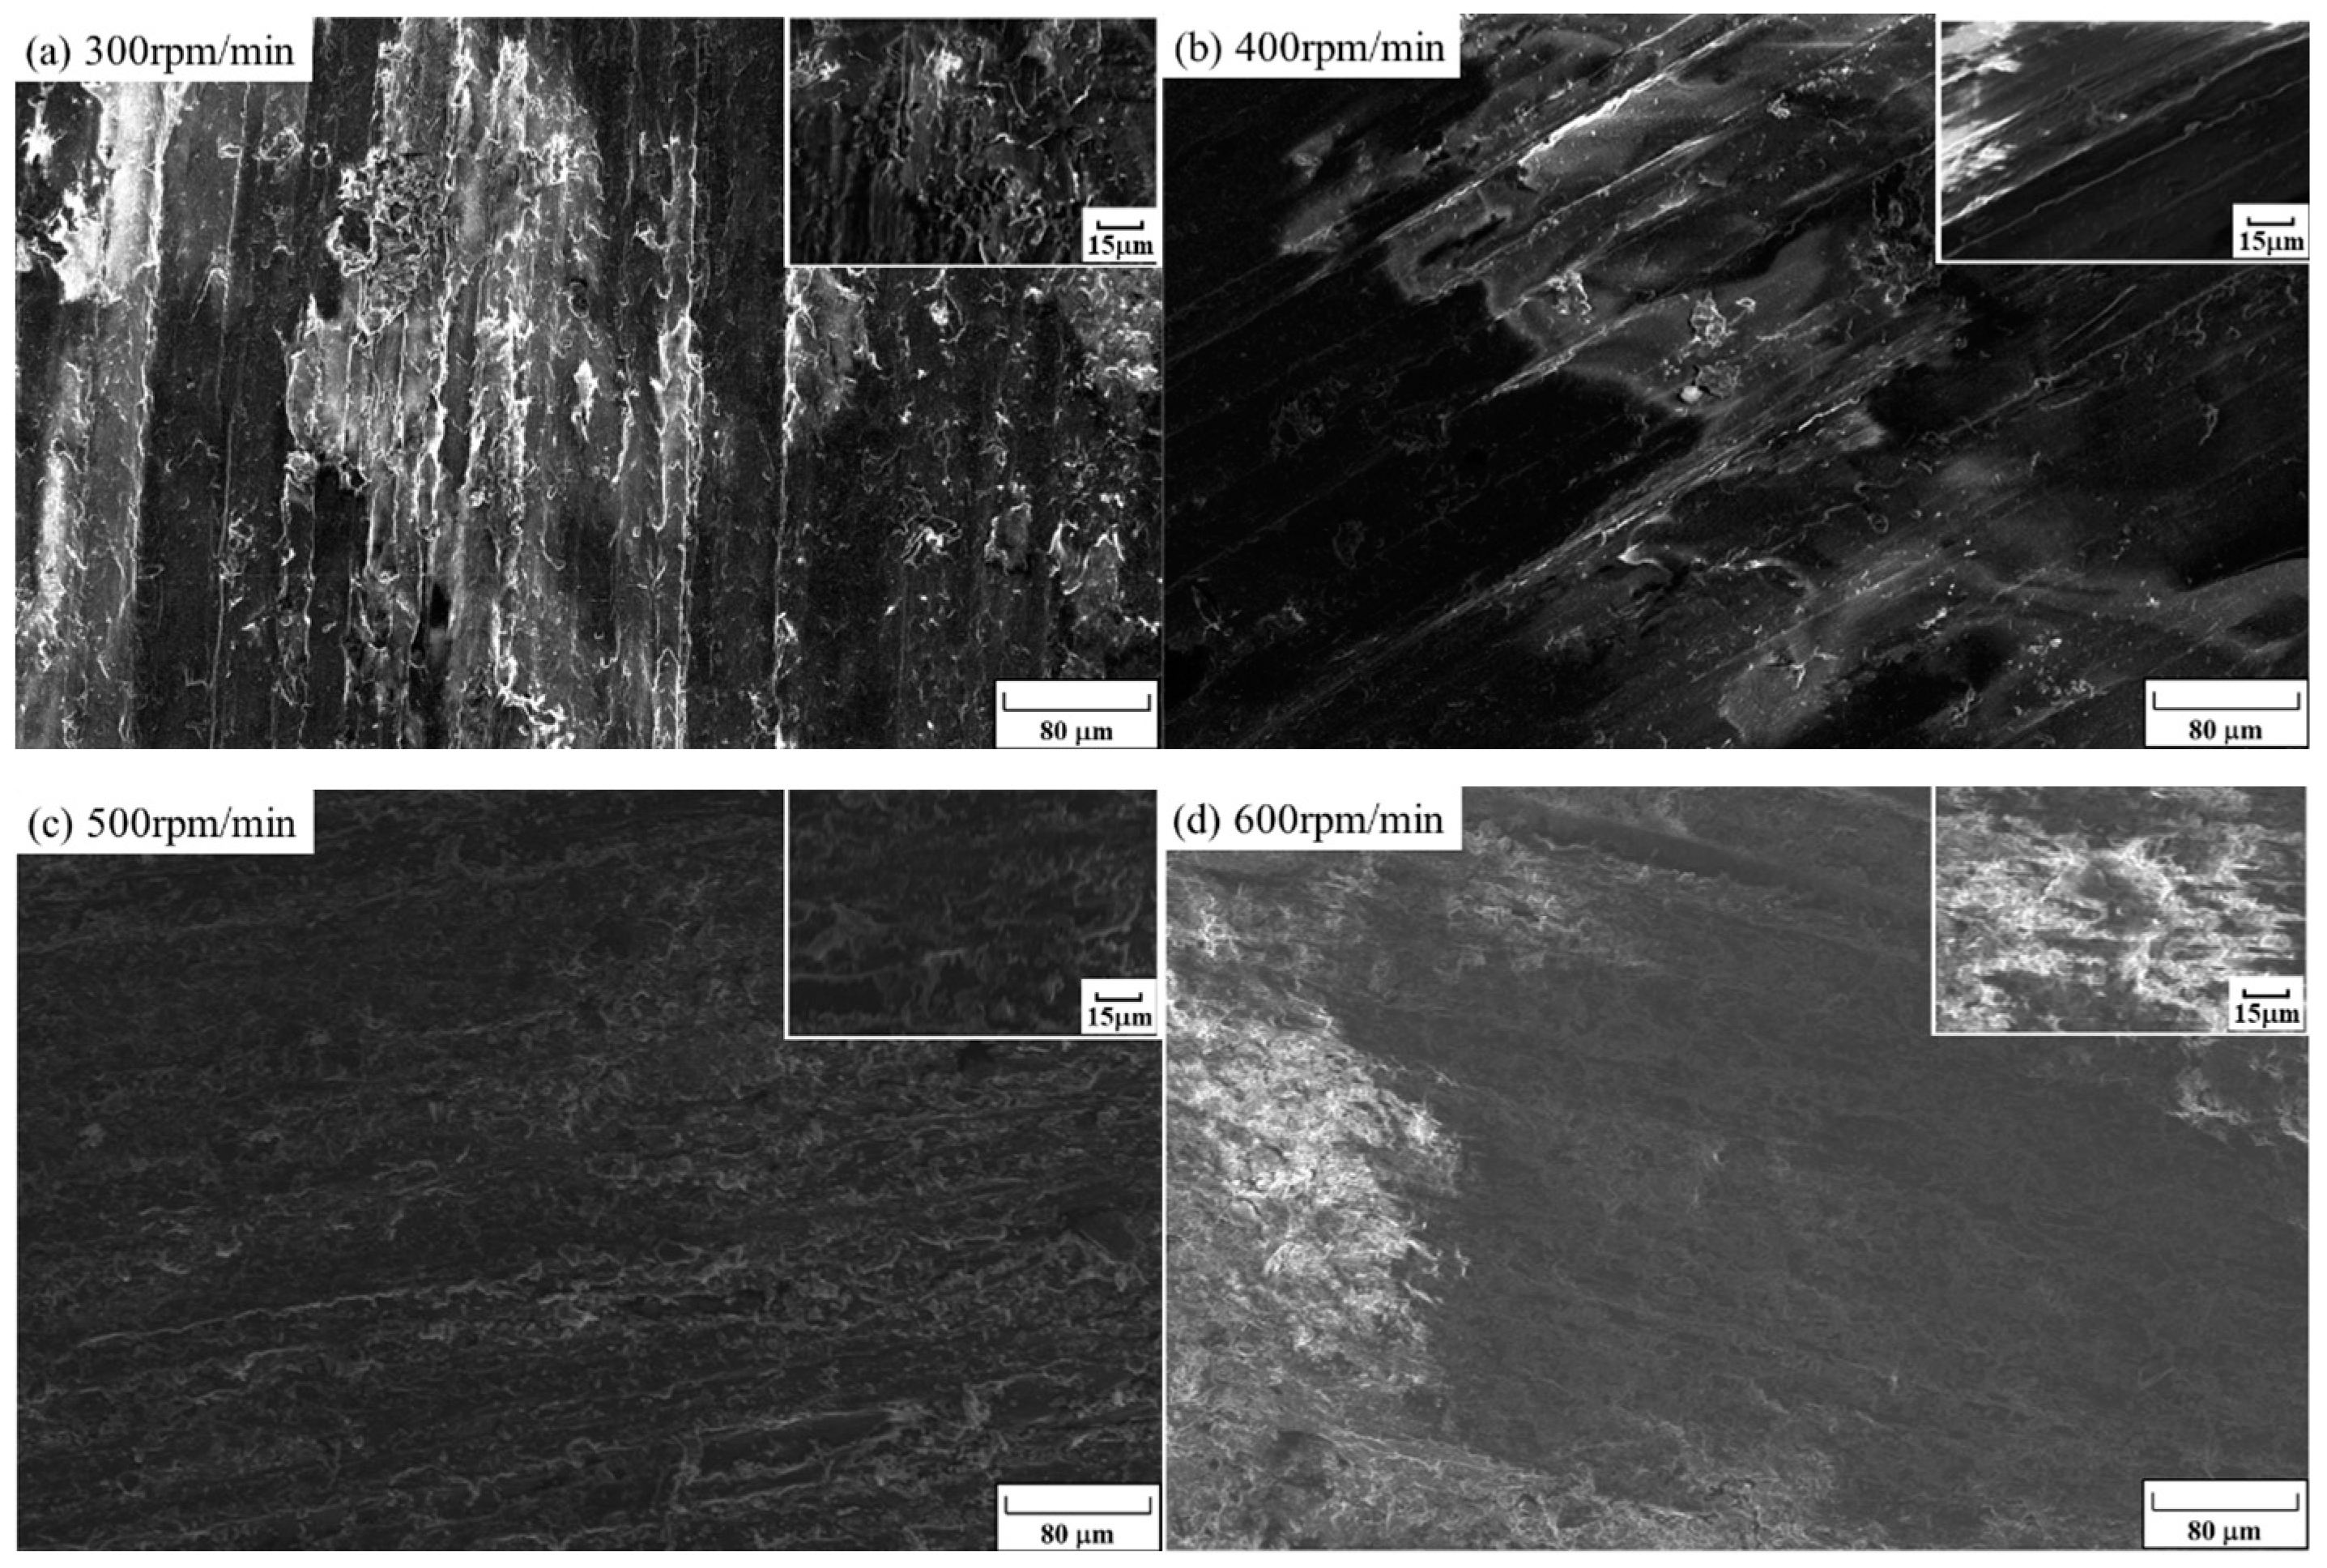
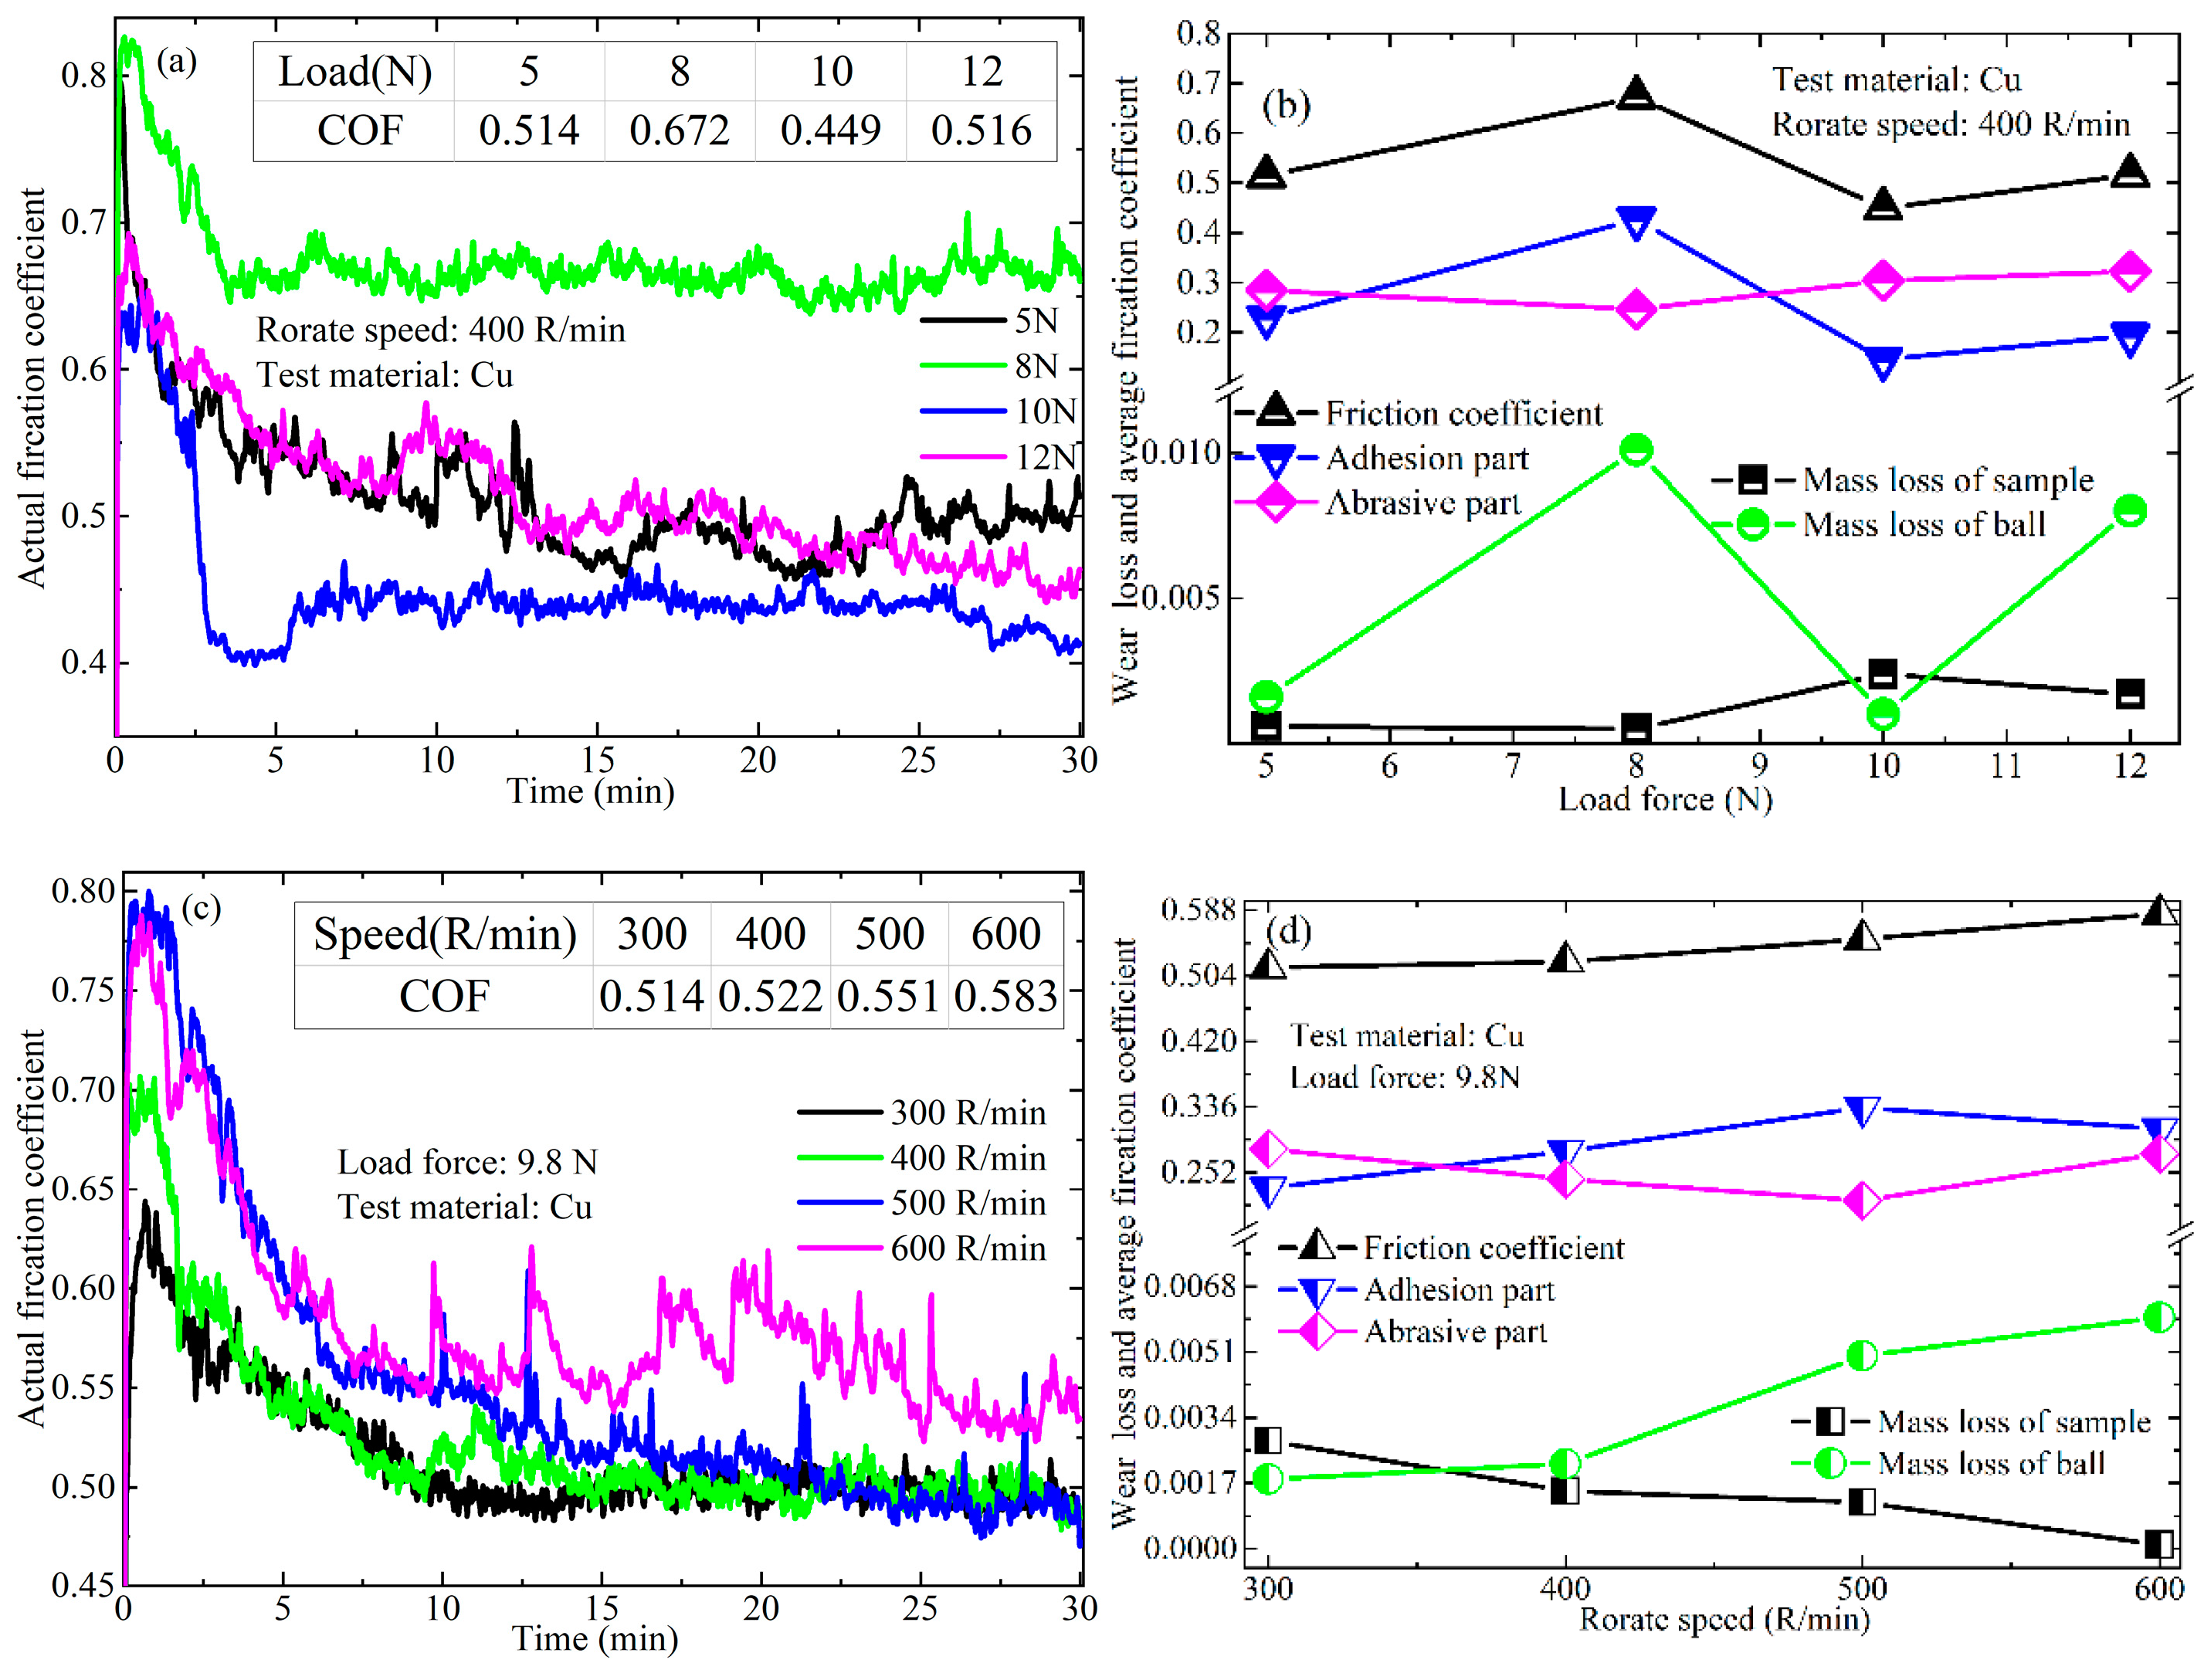
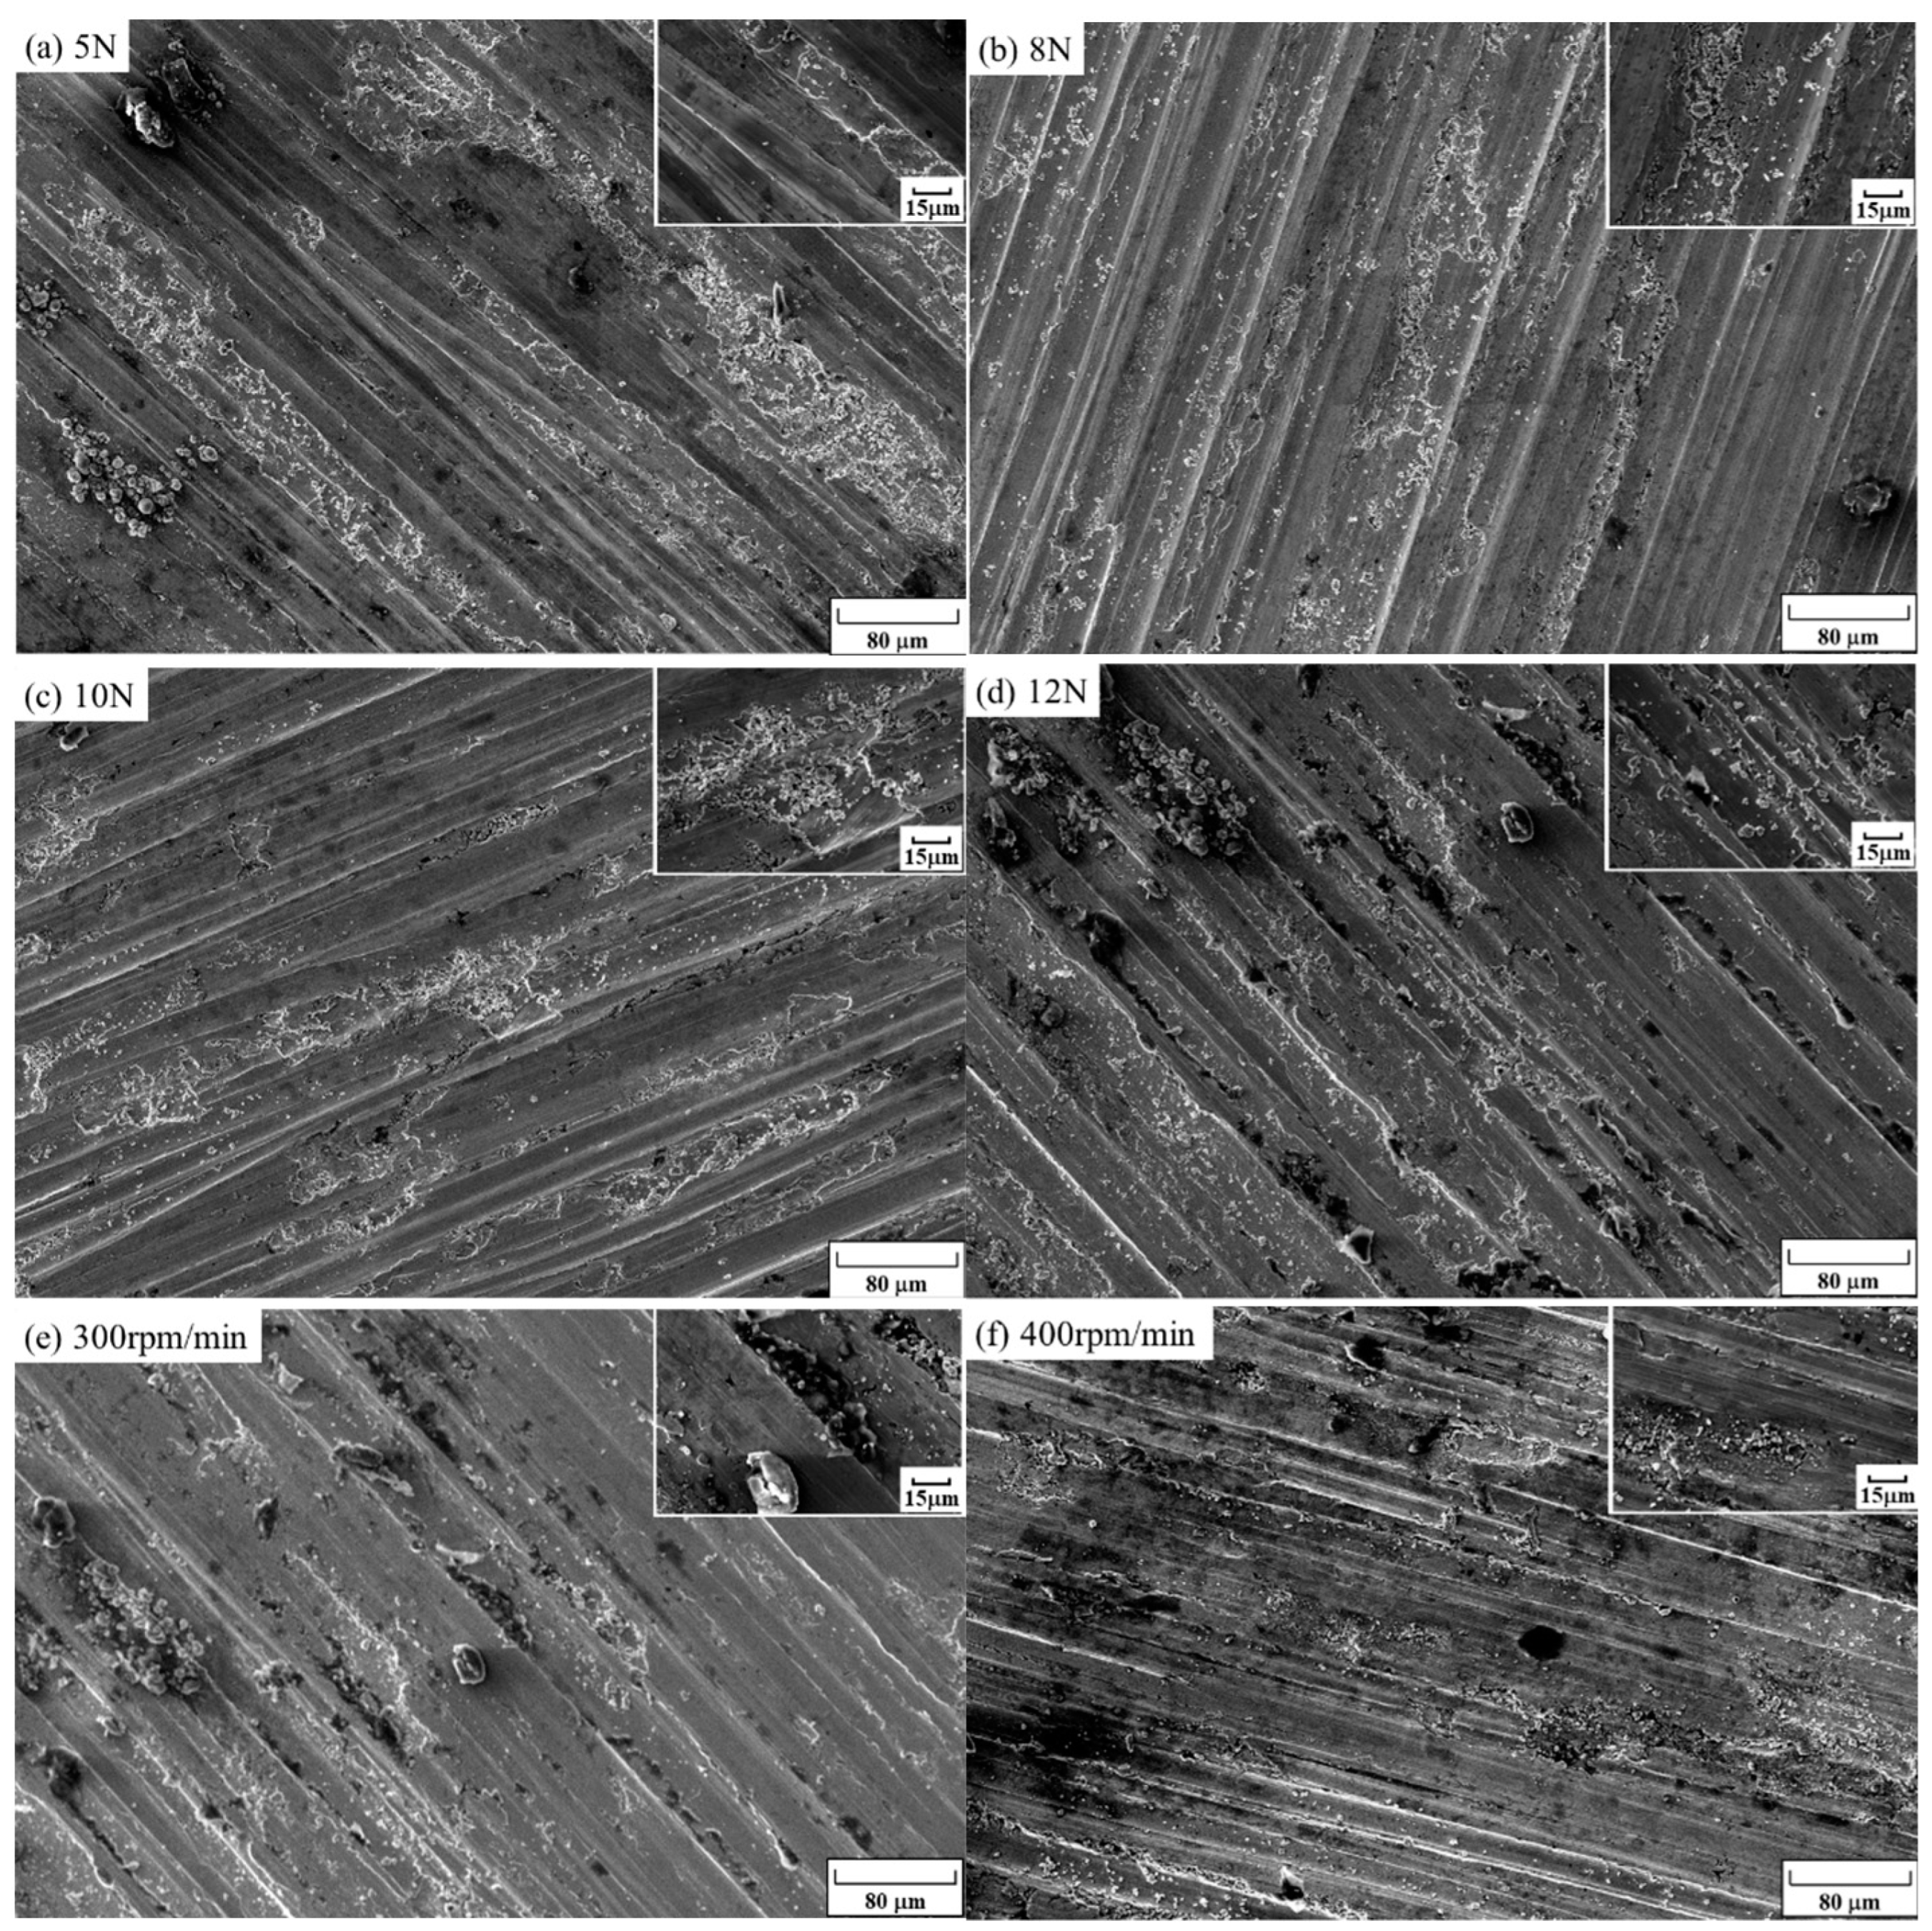
3.3.4. Cu
3.3.5. Al
4. Conclusions
Supplementary Materials
Author Contributions
Funding
Institutional Review Board Statement
Informed Consent Statement
Data Availability Statement
Conflicts of Interest
References
- Yue, Y.; Gao, Y.; Hu, W.; Xu, B.; Wang, J.; Zhang, X.; Zhang, Q.; Wang, Y.; Ge, B.; Yang, Z.; et al. Hierarchically Structured Diamond Composite with Exceptional Toughness. Nature 2020, 582, 370–374. [Google Scholar] [CrossRef]
- Wu, L.; Zhang, G.; Li, B.; Wang, W.; Huang, X.; Chen, Z.; Dong, G.; Zhang, Q.; Yao, J. Study on Microstructure and Tribological Performance of Diamond/Cu Composite Coating Via Supersonic Laser Deposition. Coatings 2020, 10, 276. [Google Scholar] [CrossRef]
- Sokolov, E.; Ozolin, A.; Golius, D. Structure Formation of Diamond–Containing Coatings during Sintering of Specially-Shaped Grinding Wheels. Coatings 2022, 12, 333. [Google Scholar] [CrossRef]
- Zhang, X.; Wang, Y.; Zang, J.; Lu, J.; Zhang, J.; Ge, E.; Cheng, X. Effect of Si Coating on Prevention of Diamond Degradation in Diamond/Glass Composite. Surf. Coat. Technol. 2010, 204, 2846–2850. [Google Scholar] [CrossRef]
- Szutkowska, M.; Jaworska, L.; Boniecki, M.; Stobierski, L.; Rozmus, M. Mechanical Behavior of Diamond Matrix Composites with Ceramic Ti3(Si, Ge)C2 Bonding Phase. Int. J. Refract. Met. Hard Mater. 2015, 49, 302–306. [Google Scholar] [CrossRef]
- Wan, W.; Wang, J.; Liang, M.; Fan, K.; Wang, Z.; Li, Y. Fracture Behaviors of Ti(C, N) –Based Cermets with Different Contents of Metal Binder. Ceram. Int. 2022, 48, 32399–32408. [Google Scholar] [CrossRef]
- Guignard, J.; Prakasam, M.; Largeteau, A. A Review of Binderless Polycrystalline Diamonds: Focus on the High-Pressure–High-Temperature Sintering Process. Materials 2022, 15, 2198. [Google Scholar] [CrossRef]
- Li, L.; Zhou, A.G.; Wang, L.B.; Hu, F.X. Synthesize Ti3SiC2 from TiH2 by Pressureless Sintering. Key Eng. Mater. 2012, 512–515, 676–680. [Google Scholar]
- Li, Z.; Zhou, A.; Li, L.; Wang, L.; Hu, M.; Li, S.; Gupta, S. Synthesis and Char-acterization of Novel Ti3SiC2–cBN Composites. Diam. Relat. Mater. 2014, 43, 29–33. [Google Scholar] [CrossRef]
- Zhou, A.G.; Li, L.; Su, T.C.; Li, S.S. Synthesize Ti3SiC2 and Ti3SiC2–Diamond Composites at High Pressure and High Temperature. Key Eng. Mater. 2012, 512–515, 671–675. [Google Scholar]
- Li, L.; Zhou, A.; Wang, L.; Li, S.; Wu, D.; Yan, C. In Situ Synthesis of cBN–Ti3AlC2 Composites by High-Pressure and High-Temperature Technology. Diam. Relat. Mater. 2012, 29, 8–12. [Google Scholar] [CrossRef]
- Ji, H.; Liang, Y.; Jiang, Z.; Li, Z.; Zhu, Y. Controllable HPHT Sintering and Property of cBN/Diamond Composites Containing Ti3SiC2. Ceram. Int. 2020, 46, 13807–13812. [Google Scholar] [CrossRef]
- Lv, X.; Jian, Q.; Li, Z.; Sun, K.; Ji, H.; Zhu, Y. Effect of Controllable Decomposition of MAX Phase (Ti3SiC2) on Mechanical Properties of Rapidly Sintered Polycrystalline Diamond by HPHT. Ceram. Int. 2019, 45, 16564–16568. [Google Scholar] [CrossRef]
- Jiang, Z.; Jian, Q.; Han, Y.; Zhu, Y.; Li, Z. Performance Evaluation of cBN-Ti3AlC2–Al Composites Fabricated by Hthp Method. Ceram. Int. 2020, 46, 24449–24453. [Google Scholar] [CrossRef]
- Sun, F.; Huang, L.; Zhang, R.; Wang, S.; Jiang, S.; Sun, Y.; An, Q.; Jiao, Y.; Geng, L. In-Situ Synthesis and Superhigh Modulus of Network Structured TiC/Ti Composites Based on Diamond-Ti System. J. Alloy Compd. 2020, 834, 155248. [Google Scholar] [CrossRef]
- Bhaumik, S.; Divakar, C.; Singh, A.; Upadhyaya, G. Synthesis and Sintering of TiB2 and TiB2–TiC Composite under High Pressure. Mater. Sci. Eng. A 2000, 279, 275–281. [Google Scholar] [CrossRef]
- Li, L.; Chen, Y. The Influence of Sintering Pressure on the Preparation, Friction Properties, and Magnetic Properties of Ti2AlC–TiC and Ti3AlC2–Tic Composites under High-Pressure and High-Temperature. Adv. Mater. Sci. Eng. 2022, 2022, 1–12. [Google Scholar] [CrossRef]
- Chen, Y.; Liang, L.; Ma, S.; Chao, L.; Zheng, S.; Lv, W.; Wang, L.; Zhou, A.; Xing, W. Preparation of Ti3Si0.8Al0.2C2 Bonded Diamond Composites and Their Friction Properties Coupled with Different Counterfaces. Adv. Mater. Sci. Eng. 2023, 2023, 1–14. [Google Scholar] [CrossRef]
- Qin, J.; He, D. Phase stability of Ti3SiC2 at High Pressure and High Temperature. Ceram. Int. 2013, 39, 9361–9367. [Google Scholar] [CrossRef]
- Li, X.; Xu, L.; Chen, Q.; Cao, X.; Liu, L.; Wang, Y.; Zhang, H.; Meng, C.; Wu, Q. Investigation of Formation Mechanism of Ti3SiC2 by High Pressure and High-Temperature Synthesis. High Press. Res. 2018, 38, 440–447. [Google Scholar] [CrossRef]
- Garcia, C.; Smith, J.D.; Rodriguez, J.; DiGiovanni, A.A.; Scharf, T.W. Reactive Spark Plasma Sintering of SiC–TiC–Diamond Composites. Diam. Relat. Mater. 2022, 129, 109384. [Google Scholar] [CrossRef]
- Anna, D.; Koczorowski, W.; Trzcinski, M.; Mosińska, L.; Szybowicz, M. The Effect of Surface Treatment on Structural Properties of CVD Diamond Layers with Different Grain Sizes Studied by Raman Spec-troscopy. Materials 2021, 14, 1301. [Google Scholar]
- Yang, L.; Jiang, C.; Guo, S.; Zhang, L.; Gao, J.; Peng, J.; Hu, T.; Wang, L. Novel Diamond Films Synthesis Strategy: Methanol and Argon Atmosphere by Microwave Plasma CVD Method Without Hydrogen. Nanoscale Res. Lett. 2016, 11, 1–6. [Google Scholar] [CrossRef] [PubMed]
- Maria, I.; Ovodok, E.; Kotsikau, D.; Azarko, I.; Micusik, M.; Omastova, M.; Golovanov, V. Structural Transformation and Nature of Defects in Titanium Carbide Treated in Different Redox Atmospheres. RSC Adv. 2020, 10, 25602–25608. [Google Scholar]
- Gong, Y.; Tu, R.; Goto, T. High-Speed Deposition of Titanium Carbide Coatings by Laser-Assisted Metal–Organic CVD. Mater. Res. Bull. 2013, 48, 2766–2770. [Google Scholar] [CrossRef]
- Anna, I.; Song, C.; Zhu, W.; Zhang, J.; Bauer, A.; Baker, R.; Neburchilov, V.; Ye, S.; Campbell, S. Titanium Carbide and Its Core-Shelled Derivative TiC@TiO2 as Catalyst Supports for Proton Exchange Membrane Fuel Cells. Electrochim. Acta 2012, 69, 397–405. [Google Scholar]
- Guo, Y.; Gao, Y.; Chen, H.; Zhao, Q.; Zhu, Q.; Cao, Z.; Li, B.; Shang, J.; Du, Z.; Yang, S. Controllable Etching of Ti3SiC2 to Produce Fluorine-Enriched, Hydrophobic 2D Titanium Carbide for Ultrastable Zinc Ion Batteries. Adv. Energy Mater. 2023, 13, 2300890. [Google Scholar] [CrossRef]
- Zhang, R.; Feng, W.; Liu, F. Tribo-Oxide Competition and Oxide Layer Formation of Ti3SiC2/CaF2 Self-Lubricating Composites During the Friction Process in a Wide Temperature Range. Materials 2021, 14, 7466. [Google Scholar] [CrossRef] [PubMed]
- Olha, M.; Michael, N.; Yury, G.; Thierry, D. Anodized Ti3SiC2 as an Anode Material for Li–Ion Microbatteries. ACS Appl. Mater. Interfaces 2016, 8, 16670–16676. [Google Scholar]
- Zhu, Y.; Zhou, A.; Ji, Y.; Jia, J.; Wang, L.; Wu, B.; Zan, Q. Tribological Properties of Ti3sic2 Coupled with Different Counterfaces. Ceram. Int. 2015, 41, 6950–6955. [Google Scholar] [CrossRef]
- Thomas, E.L.; Nelson, G.W.; Mandal, S.; Foord, J.S.; Williams, O.A. Chemical Mechanical Polishing of Thin Film Diamond. Carbon 2014, 68, 473–479. [Google Scholar] [CrossRef]
- Xiong, X.; Hua, L.; Wan, X.; Yang, C.; Xie, C.; He, D. Experiment and Simulation of Friction Coefficient of Polyoxymethylene. Ind. Lubr. Tribol. 2018, 70, 273–281. [Google Scholar] [CrossRef]
- Sun, L.H.; Yang, Z.-G.; Li, X.-H. Study on the Friction and Wear Behavior of POM/Al2O3 Nanocomposites. Wear 2008, 264, 693–700. [Google Scholar] [CrossRef]
- Chen, Y.; Lin, Y. A Calculation Method for Friction Coefficient and Meshing Efficiency of Plastic Line Gear Pair under Dry Friction Conditions. Friction 2021, 9, 1420–1435. [Google Scholar] [CrossRef]
- Omrani, E.; Menezes, P.L.; Rohatgi, P.K. State of the Art on Tribological Behavior of Polymer Matrix Composites Reinforced with Natural Fibers in The Green Materials World. Eng. Sci. Technol. Int. J. 2016, 19, 717–736. [Google Scholar] [CrossRef]
- Lebedev, O.V.; Bogdanova, O.I.; Goncharuk, G.P.; Ozerin, A.N. Tribological and Percolation Properties of Polypropylene/Nanodiamond Soot Composites. Polym. Polym. Compos. 2020, 28, 369–377. [Google Scholar] [CrossRef]
- Orozco, V.H.; Vargas, A.F.; Brostow, W.; Datashvili, T.; López, B.L.; Mei, K.; Su, L. Tribological Properties of Polypropylene Composites with Carbon Nanotubes and Sepiolite. J. Nanosci. Nanotechnol. 2014, 14, 4918–4929. [Google Scholar] [CrossRef] [PubMed]


Disclaimer/Publisher’s Note: The statements, opinions and data contained in all publications are solely those of the individual author(s) and contributor(s) and not of MDPI and/or the editor(s). MDPI and/or the editor(s) disclaim responsibility for any injury to people or property resulting from any ideas, methods, instructions or products referred to in the content. |
© 2024 by the authors. Licensee MDPI, Basel, Switzerland. This article is an open access article distributed under the terms and conditions of the Creative Commons Attribution (CC BY) license (https://creativecommons.org/licenses/by/4.0/).
Share and Cite
Chen, Y.; Li, J.; Li, L.; Han, M.; He, J. In Situ Synthesis and Tribological Characterization of TiC–Diamond Composites: Effect of the Counterface Material on Wear Rate and Mechanism. Coatings 2024, 14, 735. https://doi.org/10.3390/coatings14060735
Chen Y, Li J, Li L, Han M, He J. In Situ Synthesis and Tribological Characterization of TiC–Diamond Composites: Effect of the Counterface Material on Wear Rate and Mechanism. Coatings. 2024; 14(6):735. https://doi.org/10.3390/coatings14060735
Chicago/Turabian StyleChen, Yuqi, Jin Li, Liang Li, Ming Han, and Junbao He. 2024. "In Situ Synthesis and Tribological Characterization of TiC–Diamond Composites: Effect of the Counterface Material on Wear Rate and Mechanism" Coatings 14, no. 6: 735. https://doi.org/10.3390/coatings14060735
APA StyleChen, Y., Li, J., Li, L., Han, M., & He, J. (2024). In Situ Synthesis and Tribological Characterization of TiC–Diamond Composites: Effect of the Counterface Material on Wear Rate and Mechanism. Coatings, 14(6), 735. https://doi.org/10.3390/coatings14060735