Article

Preparation of Fe3O4/NiO Nanomaterials by Electrodeposition and Their Adsorption Performance for Fluoride Ions

1
School of Mechatronics Engineering, Qiqihar University, Qiqihar 161006, China
2
Northeast Petroleum University, Daqing 163318, China
3
The Engineering Technology Research Center for Precision Manufacturing Equipment and Industrial Perception of Heilongjiang Province, Qiqihar 161006, China
4
College of Engineering, Northeast Agricultural University, Harbin 150030, China
*
Authors to whom correspondence should be addressed.
Coatings 2024, 14(6), 739; https://doi.org/10.3390/coatings14060739
Submission received: 6 May 2024 / Revised: 8 June 2024 / Accepted: 9 June 2024 / Published: 11 June 2024
(This article belongs to the Section Environmental Aspects in Colloid and Interface Science)

Abstract

:
The high concentration of fluoride ions in industrial wastewater poses a threat to both human safety and the ecological environment. In this paper, three types of magnetic NiO nanomaterial (MNN) with nickel–iron ratios of 3:1, 2:1, and 1:2 were successfully prepared using the electrodeposition technique to eliminate fluoride ions (F) from industrial wastewater. The surface morphology, phase composition, and chemical structure of the nanomaterials were analyzed using scanning electron microscopy (SEM), transmission electron microscopy (TEM), and X-ray diffraction (XRD). The results demonstrate the MNN material’s exceptional adsorption capabilities for fluoride ions (F) at a nickel–iron ratio of 3:1, with a maximum adsorption capacity of up to 58.3 mg/g. The adsorption process of fluoride on the MNN material was further examined using Langmuir and pseudo-second-order kinetic models, revealing predominantly monolayer adsorption and chemisorption characteristics. When the amount of FeSO4•9H2O added is minimal, only the distinctive peaks of NiO are visible in the product’s spectrum. However, as the Ni/Fe ratio decreases, characteristic peaks of Fe3O4 crystals begin to appear and gradually intensify, indicating an increase in Fe3O4 content within the MNN material. Additionally, the pH level significantly affects the adsorption of fluoride ions (F) onto the MNN material, with the highest adsorption capacity observed at pH 7.

1. Introduction

Industrial wastewater, produced during industrial activities, contains a variety of chemical substances, toxins, and pollutants. It often harbors elevated levels of organic compounds, heavy metals, fluoride, phosphorus, and other hazardous substances [1,2]. When discharged into the environment without proper treatment, it poses substantial risks to the safety of drinking water, ecosystems, and aquatic life [3]. Specifically, fluorine, an element with atomic number 9 in the periodic table, is among these hazardous constituents. In industrial wastewater, it is typically found as fluoride ions, which do not naturally degrade into harmless end products [4]. Prolonged ingestion of fluoride ions by humans can lead to osteoporosis, thyroid enlargement, and other health issues. Additionally, excessive fluoride ions can cause fluorosis, a condition characterized by symptoms such as nausea, vomiting, diarrhea, and neurological complications. Therefore, fluoride ion removal from industrial wastewater is a critical environmental concern.
The current methods used for fluoride removal include precipitation, ion exchange, electrodialysis, and adsorption [5]. Among these techniques, adsorption stands out due to its operational simplicity, environmental friendliness, and exceptional effectiveness in eliminating low concentrations of fluoride ions. Consequently, it is widely recognized as a promising method for fluoride ion removal. Marczewski et al. [6] investigated the influence of temperature on the adsorption equilibrium and kinetics of 4-chlorophenoxyacetic acid and 3-bromophenoxyacetic acid on Norit-activated carbon using an adsorption approach. Meanwhile, Rezaei et al. [7] explored the adsorption capabilities of alginate microspheres incorporating Fe3O4 nanoparticles for removing methylene blue from synthetic wastewater using an adsorption technique. Wang et al. [8] investigated the adsorption performance of arsenate on lanthanum-doped biochar for phosphate removal from wastewater through an adsorption approach. Li et al. [9] utilized the electrodeposition method to fabricate CdSe nanotubes and nanowire arrays on a porous anodic aluminum oxide (AAO) template.
Recently, despite the effective development of a range of adsorbents such as activated carbon, polymer-based materials, and metal-organic frameworks (MOFs), many of these suffer from complex preparation procedures, high costs, and inadequate performance in adsorbing fluoride ions [10,11]. These limitations substantially hinder the widespread adoption and scalability of adsorption-based techniques for fluoride ion removal. Nickel oxide (NiO), a widely used metal oxide, has gained considerable traction across various domains due to its outstanding adsorption capacity, excellent selectivity, and chemical stability. Its applications encompass diverse fields including adsorbents, catalysts, battery cathode materials, and gas sensors [12].
Iron oxide (Fe2O3 or Fe3O4), another commonly utilized metal oxide, is renowned for its magnetic properties and outstanding adsorption capacity, thereby potentially enhancing the overall performance of composite materials in adsorption applications [13]. Integrating iron oxide into NiO-based materials can enhance magnetic separation capabilities and offer supplementary active sites for fluoride ion adsorption, rendering it a strategic option for the development of efficient adsorbents.
Currently, various methods are employed for the preparation of NiO, including thermal decomposition, hydrothermal synthesis, vapor-phase deposition, and combustion methods. However, most of these methods face challenges such as complex operational procedures, limited adaptability to changing conditions, and a tendency to generate unwanted impurities. Electrodeposition is an electrochemical technique that deposits desired substances onto an electrode’s surface using an electrolytic solution and electric current. Recognized for its capacity to produce high-purity deposits, control deposition thickness, save energy, and remain cost-effective, it is extensively employed in nanomaterial synthesis. Baral et al. [14] used electrodeposition to synthesize nano-sized manganese dioxide from mineral leachate, investigating its impact on hemoglobin’s structural changes. Similarly, Lim et al. [15] utilized electrodeposition with a nano-porous AAO template to fabricate copper nanostructures. Although NiO has been extensively used as an oxide adsorbent material for various pollutants, there has been limited investigation into employing electrodeposition techniques to produce magnetic nanostructured NiO adsorbents. Moreover, research on the impact of different nickel–iron ratios on the adsorption performance of magnetic nanostructured NiO is still insufficient. The magnetic response of magnetic adsorbents also simplifies solid–liquid separation after adsorption. Moreover, these materials can often be regenerated and reused, reducing environmental burdens while maintaining the adsorption capacity for a variety of pollutants, including organic substances and metal ions, which adds versatility to the treatment process.
In this study, the magnetic nanostructured NiO nanomaterials were electrodeposited on carbon cloth surfaces via adjustments to nickel–iron ratios. The surface morphology and phase composition of these materials were examined using scanning electron microscopy (SEM), transmission electron microscopy (TEM), and X-ray diffraction (XRD). Furthermore, the specific surface area and porosity of these magnetic nanostructured NiO materials were assessed through BET analysis. Furthermore, the mechanism of removal of fluoride ions by the magnetic nanostructured NiO materials was elucidated using Langmuir and pseudo-second-order kinetic models.

2. Experimental Procedure

2.1. Materials and Instruments

The reagents used in the experiments include nickel nitrate hexahydrate (Ni(NO3)2·6H2O, ≥99%, Sigma-Aldrich, St. Louis, MO, USA, American Life Sciences & High Technology Group, Inc., Santa Clara, CA, USA), iron nitrate nonahydrate (Fe(NO3)3·9H2O, ≥98%, Sigma-Aldrich), boric acid (H3BO3, ≥99.5%, Merck Company, Darmstadt, Germany), dispersant (HFM, Hydrophilic Fumed Silica, ≥99%, Sigma-Aldrich), sodium dodecyl sulfate (C12H25SO4Na, ≥99%, Sigma-Aldrich), sodium fluoride (NaF, ≥99%, Sigma-Aldrich), hydrochloric acid (HCl, 37%, Merck), and sodium hydroxide (NaOH, ≥98%, Sigma-Aldrich). All reagents were of analytical grade and were used without further purification. Magnetic NiO nanomaterials were synthesized and used as the adsorbent in all experiments. The water used in the experiment was ultrapure (resistivity > 18.25 MΩ·cm, Millipore Company, Kenilworth, NJ, USA).
Various instruments, such as electrochemical workstation (CHI660E, CH Instruments, Shanghai Huachen Instrument Co., Ltd., Shanghai, China), three-electrode system, water bath (HH-S4, Shanghai Huitai Instrument Co., Ltd., Shanghai, China), pulse power supply (GPR-30H10D, GW Instek Co., Ltd., Taiwan, China), electronic balance (ME204, Mettler Toledo Co., Ltd., Columbus, OH, USA), ultrasonic cleaning instrument (KQ-500DE, Kunshan Ultrasonic Instruments Co., Ltd., Kunshan, China), pH meter (PB-10, Sartorius Scientific Instruments (Beijing) Co., Ltd., Beijing, China), electrolyte cell, bench ion meter (Orion Star A214, Thermo Fisher Scientific Inc., Waltham, MA, USA), surface area and porosity analyzer (ASAP 2020, Micromeritics Instruments Co., Ltd., Northcross, GA, USA), and a vacuum drying oven (DZF-6050, Shanghai Jing Hong Co., Ltd., Shanghai, China), as well as imaging and analysis tools including scanning electron microscope (SEM, FEI Quanta 450), transmission electron microscope (TEM, FEI Company, Hillsboro, OR, USA, Titans 120), X-ray diffractometer (XRD, Bruker D8 Advance, Bruker Corporation, Karlsruhe, Germany), and X-ray photoelectron spectrometer (XPS, Thermo Scientific K-Alpha, Thermo Scientific Co., Ltd., Waltham, MA, USA), were utilized during experiments.

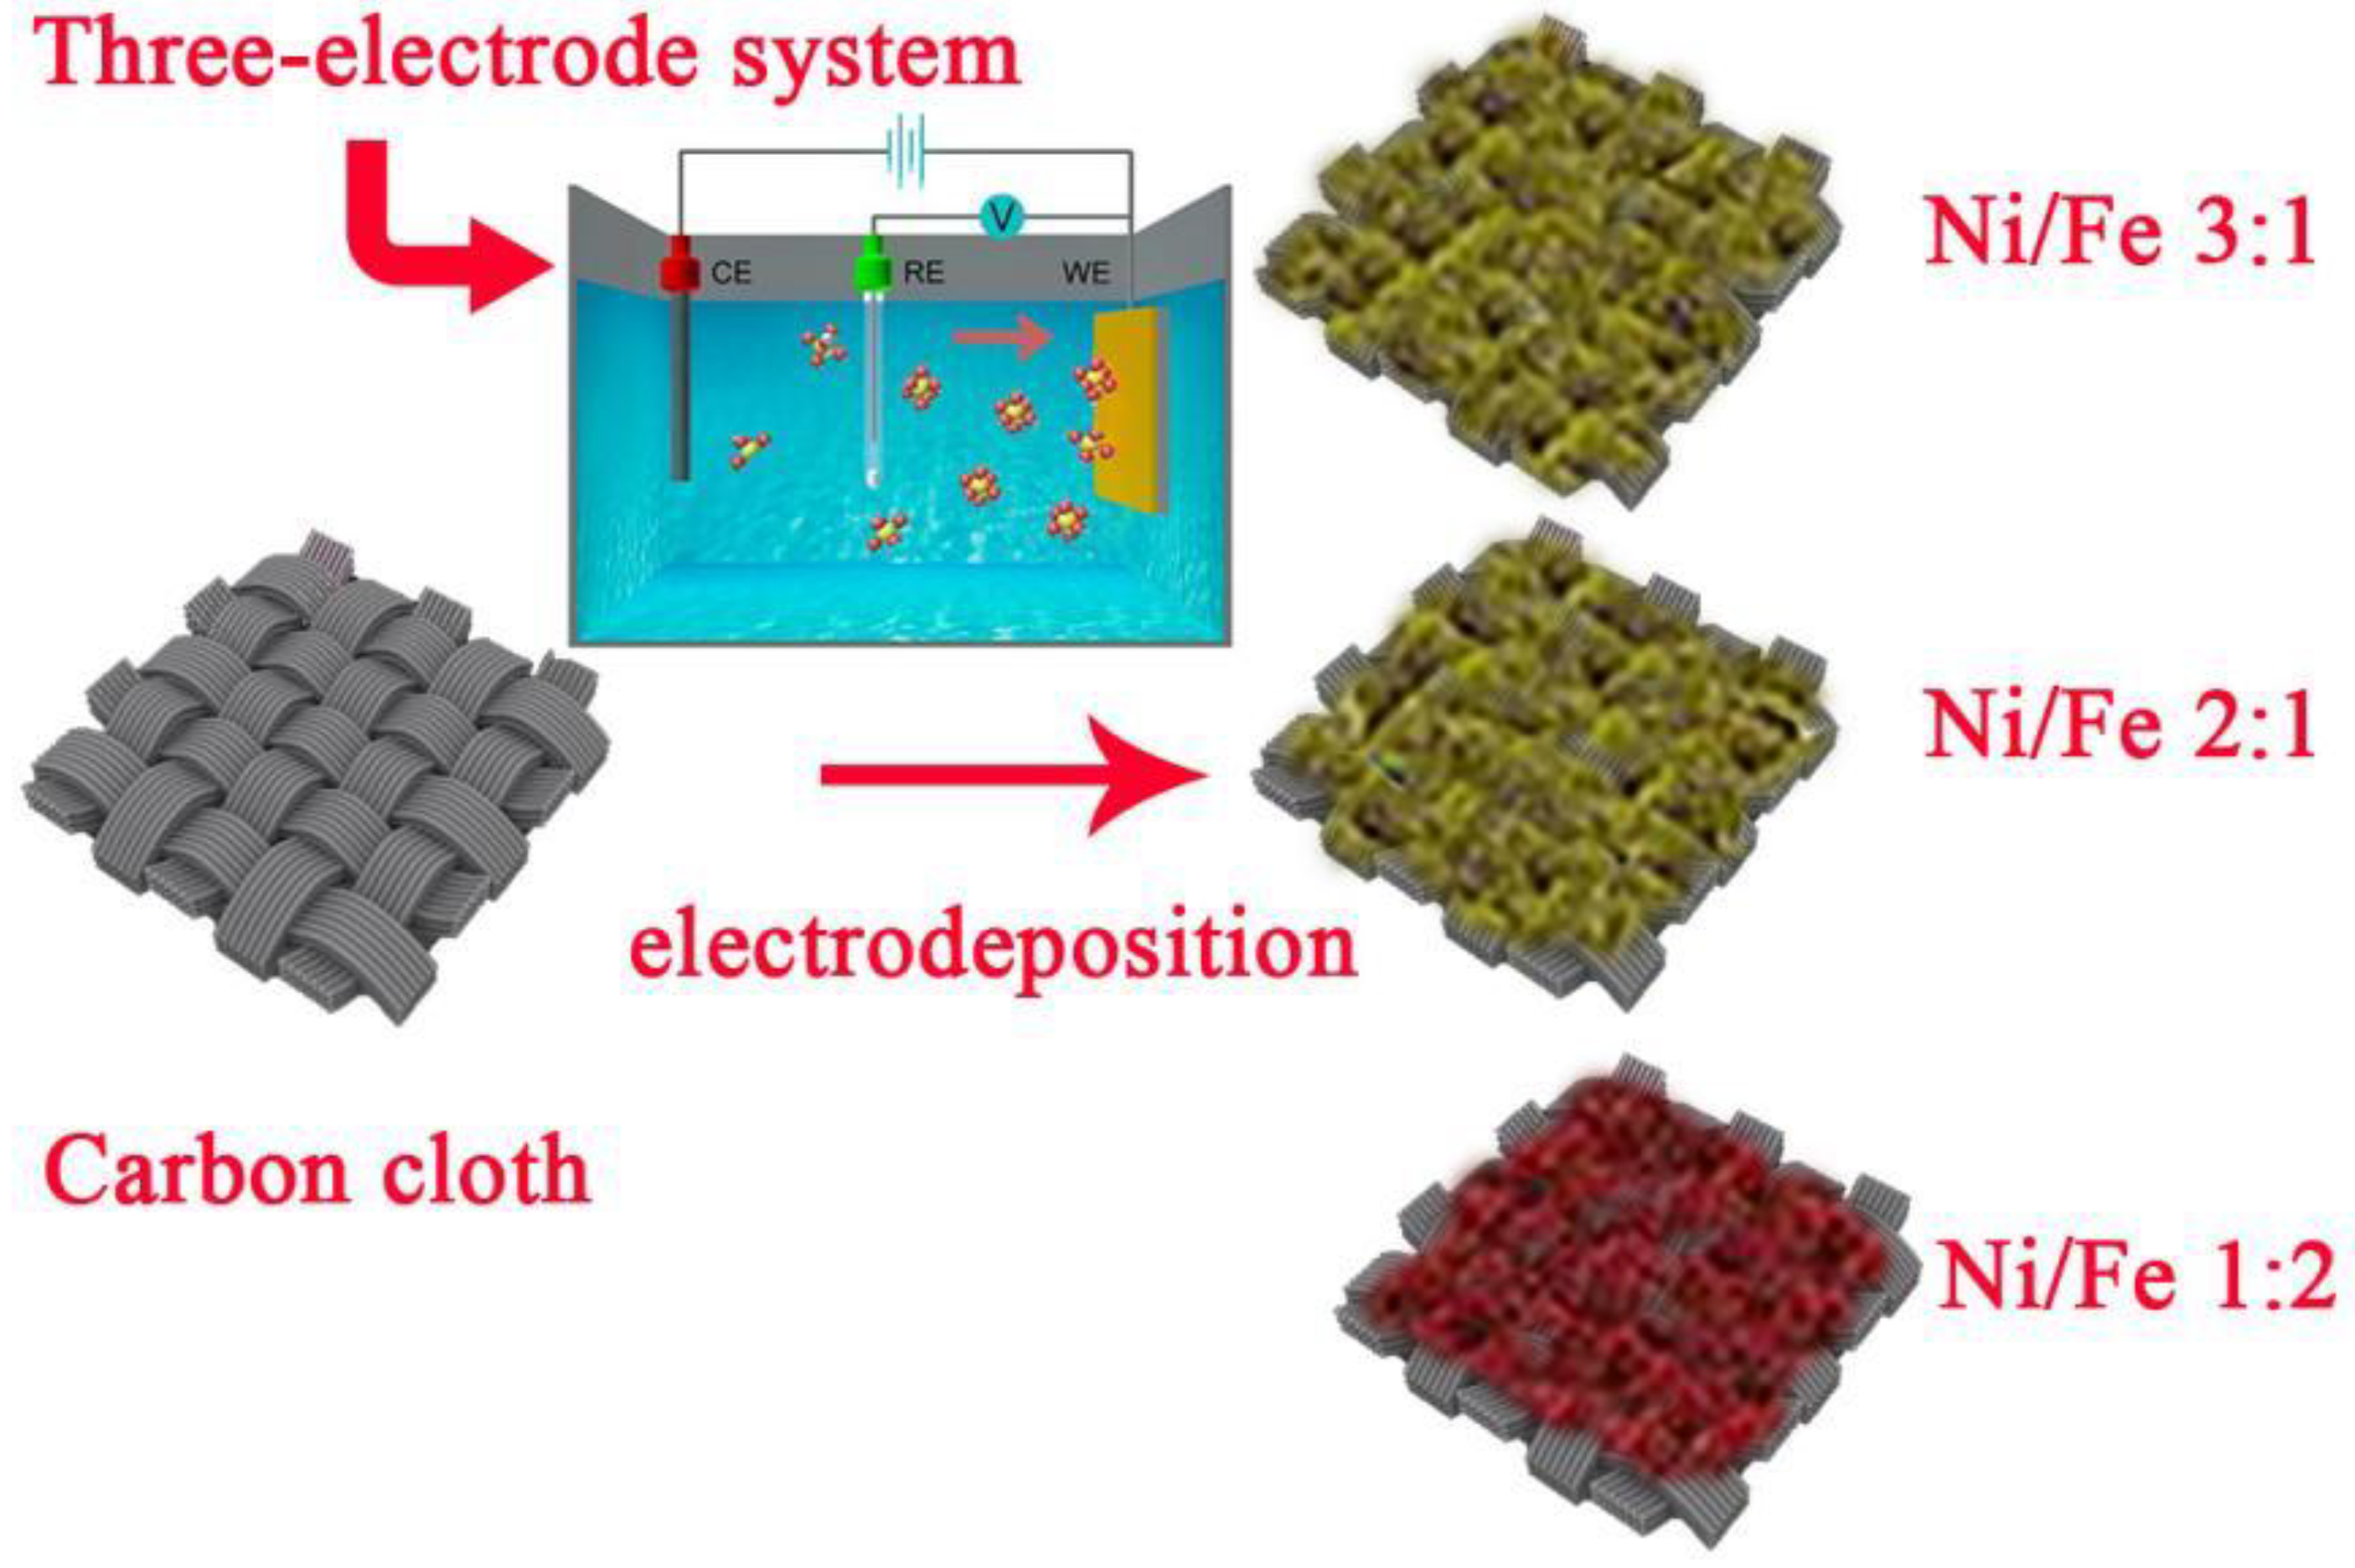
2.2. Preparation of MNN Materials

MMN materials were prepared using a three-electrode system. Before the experiment, ultrasound cleaning was performed on a carbon cloth (40 mm × 20 mm × 2 mm) to eliminate organic contaminants and impurities from the surface. The carbon cloth was immersed in ethanol and subjected to ultrasound cleaning for 30 min, followed by a similar ultrasound cleaning in ultrapure water for another 30 min. The carbon cloth underwent multiple immersions and rinses in ethanol and ultrapure water, followed by vacuum drying for 5 h in a drying oven. The pre-treated carbon cloth was utilized as the working electrode, while a platinum plate served as the auxiliary electrode, and a saturated calomel electrode was employed as the reference electrode. The experiment entailed precise measurements of nickel nitrate hexahydrate, boric acid, sodium dodecyl sulfate, and the dispersant HFM, which were accurately weighed and introduced into an electrolytic cell. To prepare the materials, nickel nitrate hexahydrate and iron nitrate nonahydrate were mixed in the desired ratios (3:1, 2:1, and 1:2). Hydrophilic Fumed Silica (HFM) was used as a dispersant at a concentration of 15 g/L. These compounds were thoroughly dissolved in 300 mL of ultrapure water, with the specific composition of the plating solution detailed in Table 1. Different volumes of ferric nitrate nonahydrate solution were then added to the suspension, and thoroughly mixed using a stirrer, and the experiment was initiated by connecting the power supply. Details of the experimental process parameters can be found in Table 2. Stirring speed is crucial as it ensures uniform mixing of the reactants, preventing agglomeration and ensuring a consistent deposition process. Additionally, it helps in maintaining a stable electrochemical environment, which is essential for reproducible results. The preparation procedure of the experiment and the adsorption process of MNN material are visually presented in Figure 1 and Figure 2, respectively.

2.3. Adsorption Experiment

Static batch experiments were carried out to investigate the influence of different factors including different time durations, initial pH levels, and initial concentrations on the adsorption capacity of magnetic nickel oxide (NiO) nanomaterials for fluoride ions (F). F ion solutions with various concentrations and pH levels were prepared to simulate fluoride-containing wastewater, with the pH adjusted using HCl or NaOH. Precisely weighed magnetic NiO nanomaterial (0.01 g) was mixed with 20 mL of the fluoride solution in a 50 mL conical flask. The mixture was shaken at 150 rpm for a specified duration at 25 °C. Following this, solid–liquid separation was accomplished via centrifugation, isolating the upper clear liquid. This solution was then used to measure the mass concentration of fluoride ions (F) with a fluoride ion electrode, enabling the calculation of F adsorption under various conditions. Using Inductively Coupled Plasma Optical Emission Spectroscopy (ICP-OES), the fluoride concentration in the solution was determined. The equilibrium adsorption capacity was calculated using Equation (1) [16].
Qe = (C0Ce) × V/m
where Qe is the amount of F adsorbed per unit amount of adsorbents (mol/g), C0 and Ce are the initial and equilibrium concentrations of F (mol/L), V is the volume of F solution (L), and m is the dry weight of adsorbents (g).
Fluoride ion concentration in the solution was measured using two methods depending on the experimental requirements. Initially, a fluoride ion-selective electrode was used for routine measurements and preliminary analyses. For more precise and detailed analysis, particularly for determining the final adsorption capacity, Inductively Coupled Plasma Optical Emission Spectroscopy (ICP-OES) was employed. This combination of methods ensured both accuracy and reliability in the measurement of fluoride ion concentrations.

2.4. Characterization

The surface morphological features and microstructure of the MNN material were examined using scanning electron microscopy (SEM, FEI Company, Hillsboro, OR, USA, FEG450) and transmission electron microscopy (TEM, FEI Company, Hillsboro, OR, USA, Titans 120). Using an X-ray diffractometer (XRD, Anton Paar Company, Vienna, Austria, Ynamic 500), the phase composition and structure of the MNN material were investigated, with Cu Kα radiation as the X-ray source, a scanning speed of 0.02°/s, a scanning angle range (2θ) of 20°–90° and a wavelength of λ = 0.15418 nm. Using Equation (2), the Relative Texture Coefficient (RTC) for the (hkl) crystal orientation can be calculated as presented below:
RTC = (Ic(hkl)/Is(hkl))/∑(Ic(hkl)/Is(hkl)) × 100%
where Ic(hkl) and Is(hkl) represent the diffraction intensities of the (h k l) planes for Ni-TiN NCs and the standard nickel particles (JCPDS no. 04-0850), respectively.
Additionally, the MNN grain size can be calculated using the Scherrer equation, as demonstrated in Equation (3) [17]:
D = 180 k λ / π β 2 ω c o s θ
where K represents Scherrer constant (~0.89), λ represents the wavelength (0.15406 nm), β denotes the half-height width of the diffraction peak for the experimental specimen (rad), ω is the width at half height of the diffraction peak (rad), and ϑ is the diffraction angle (°).

3. Results and Discussion

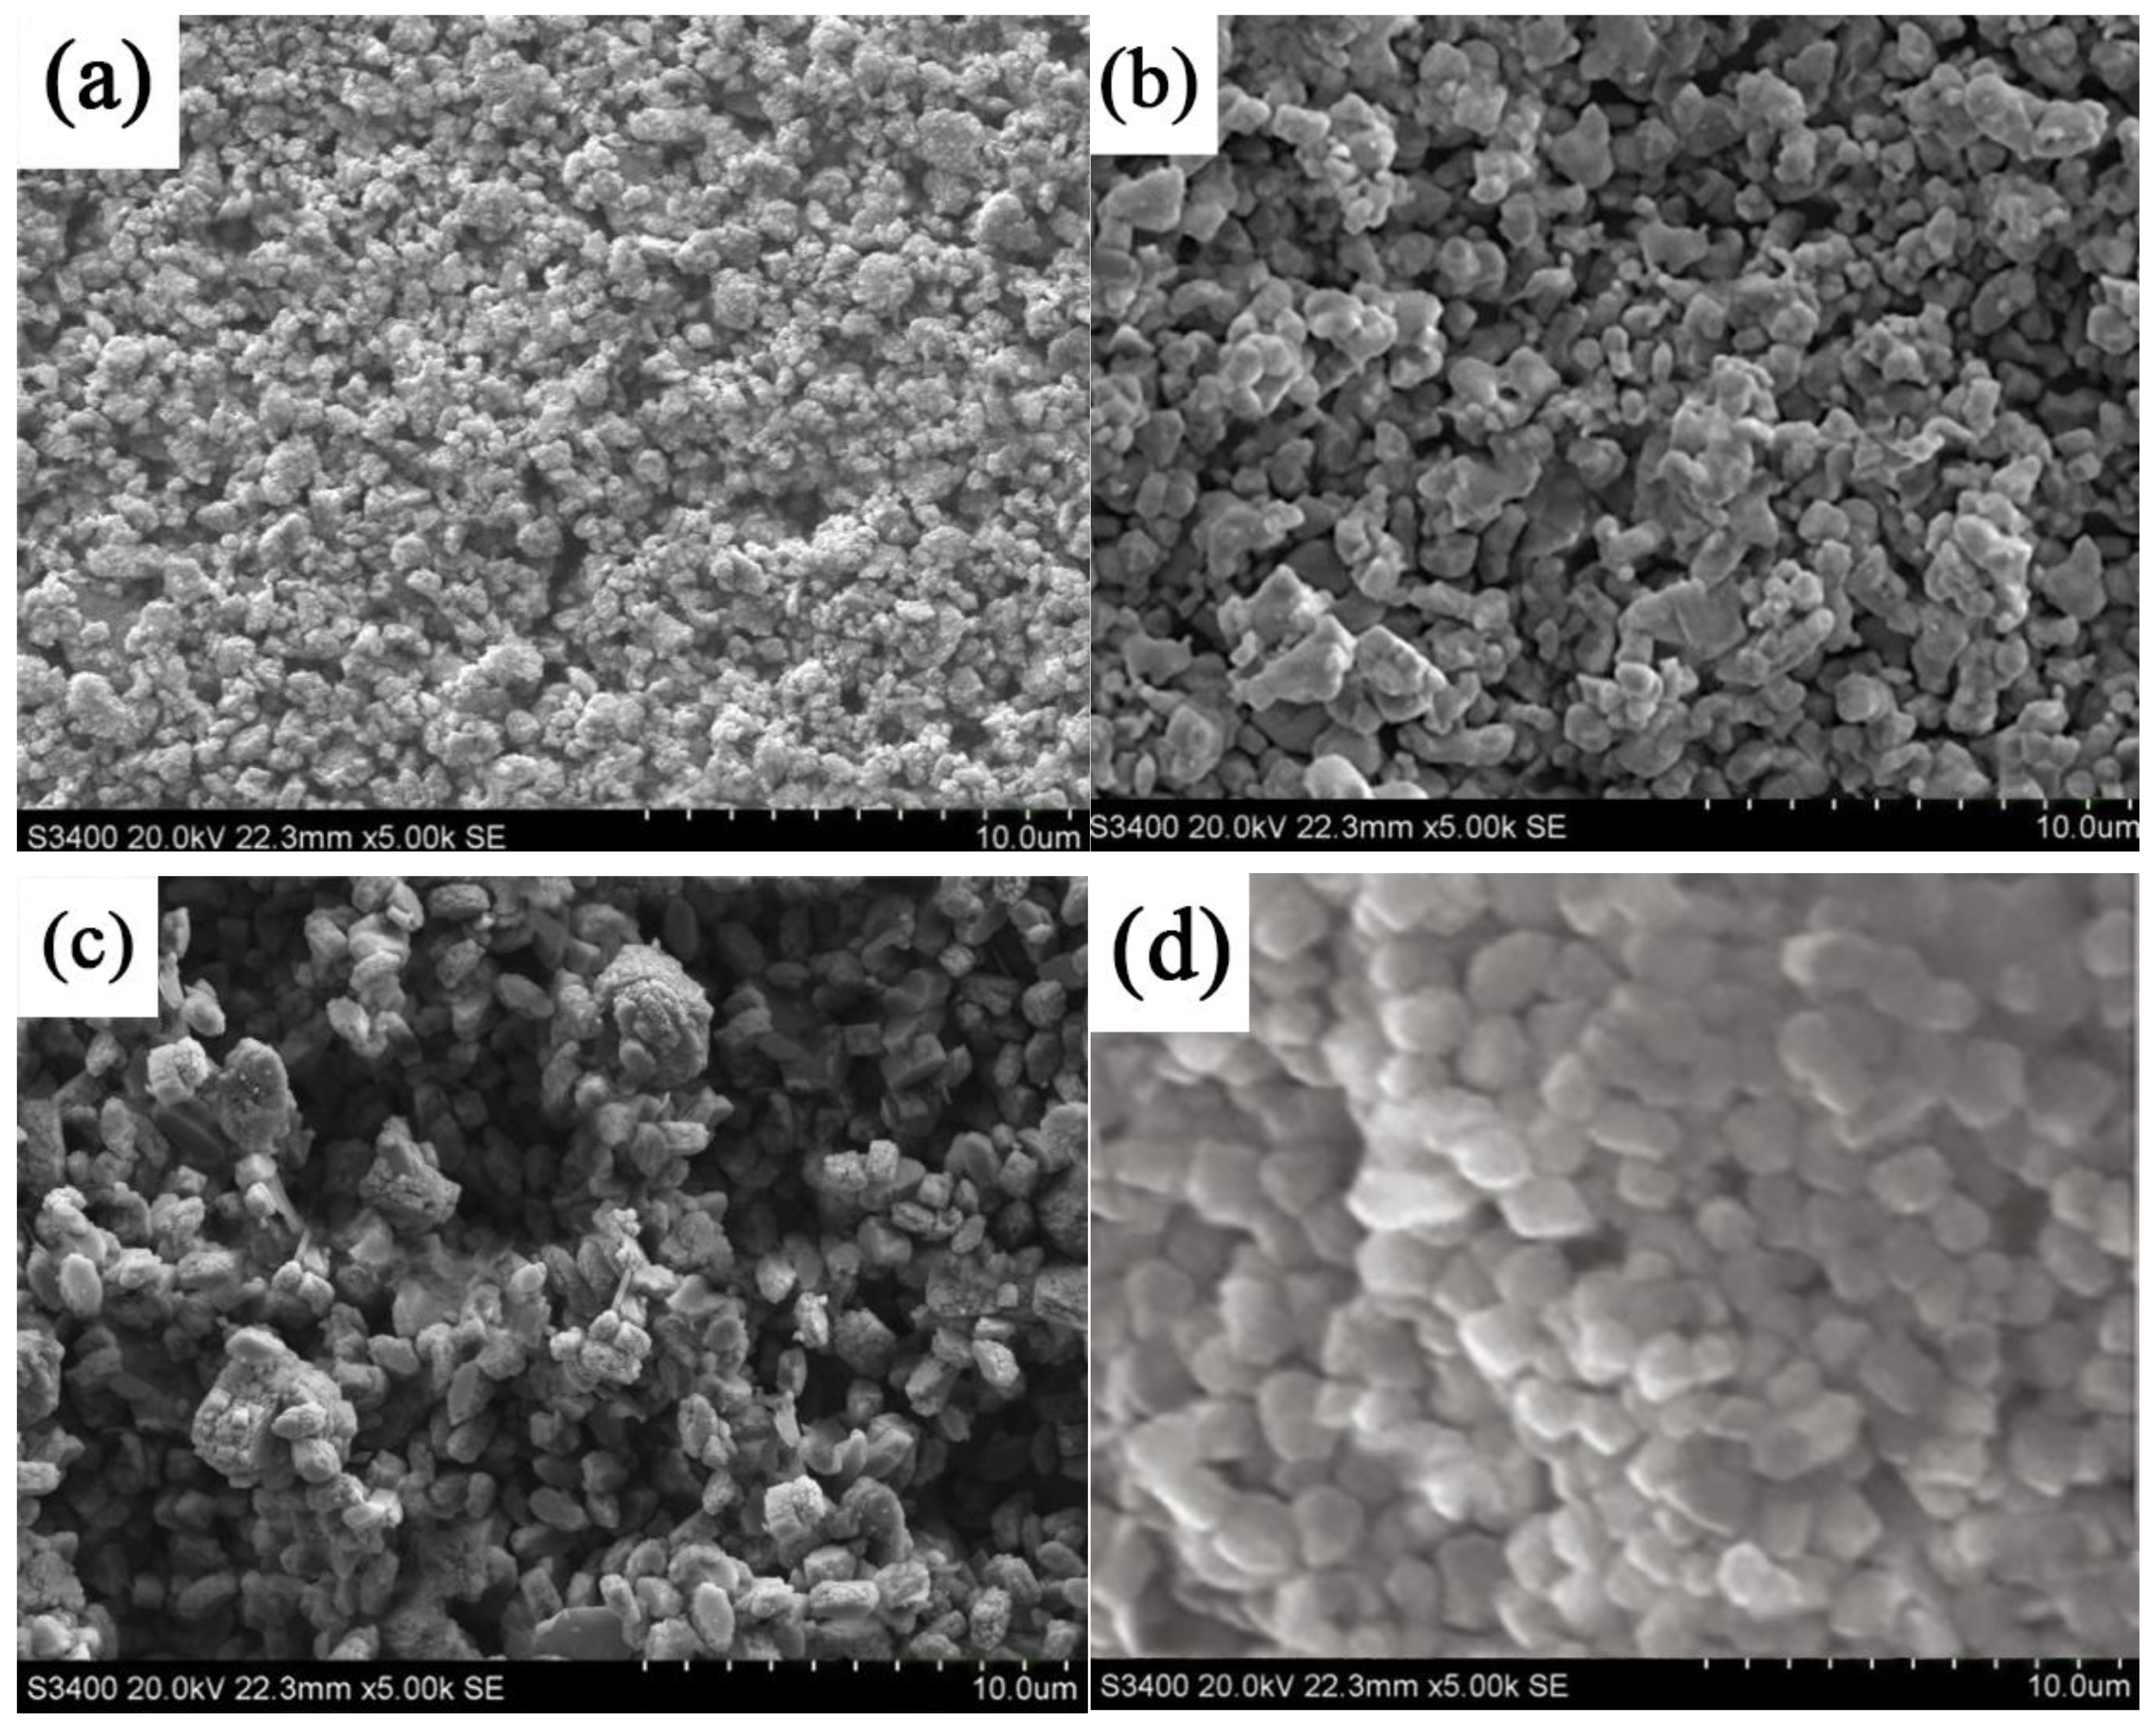
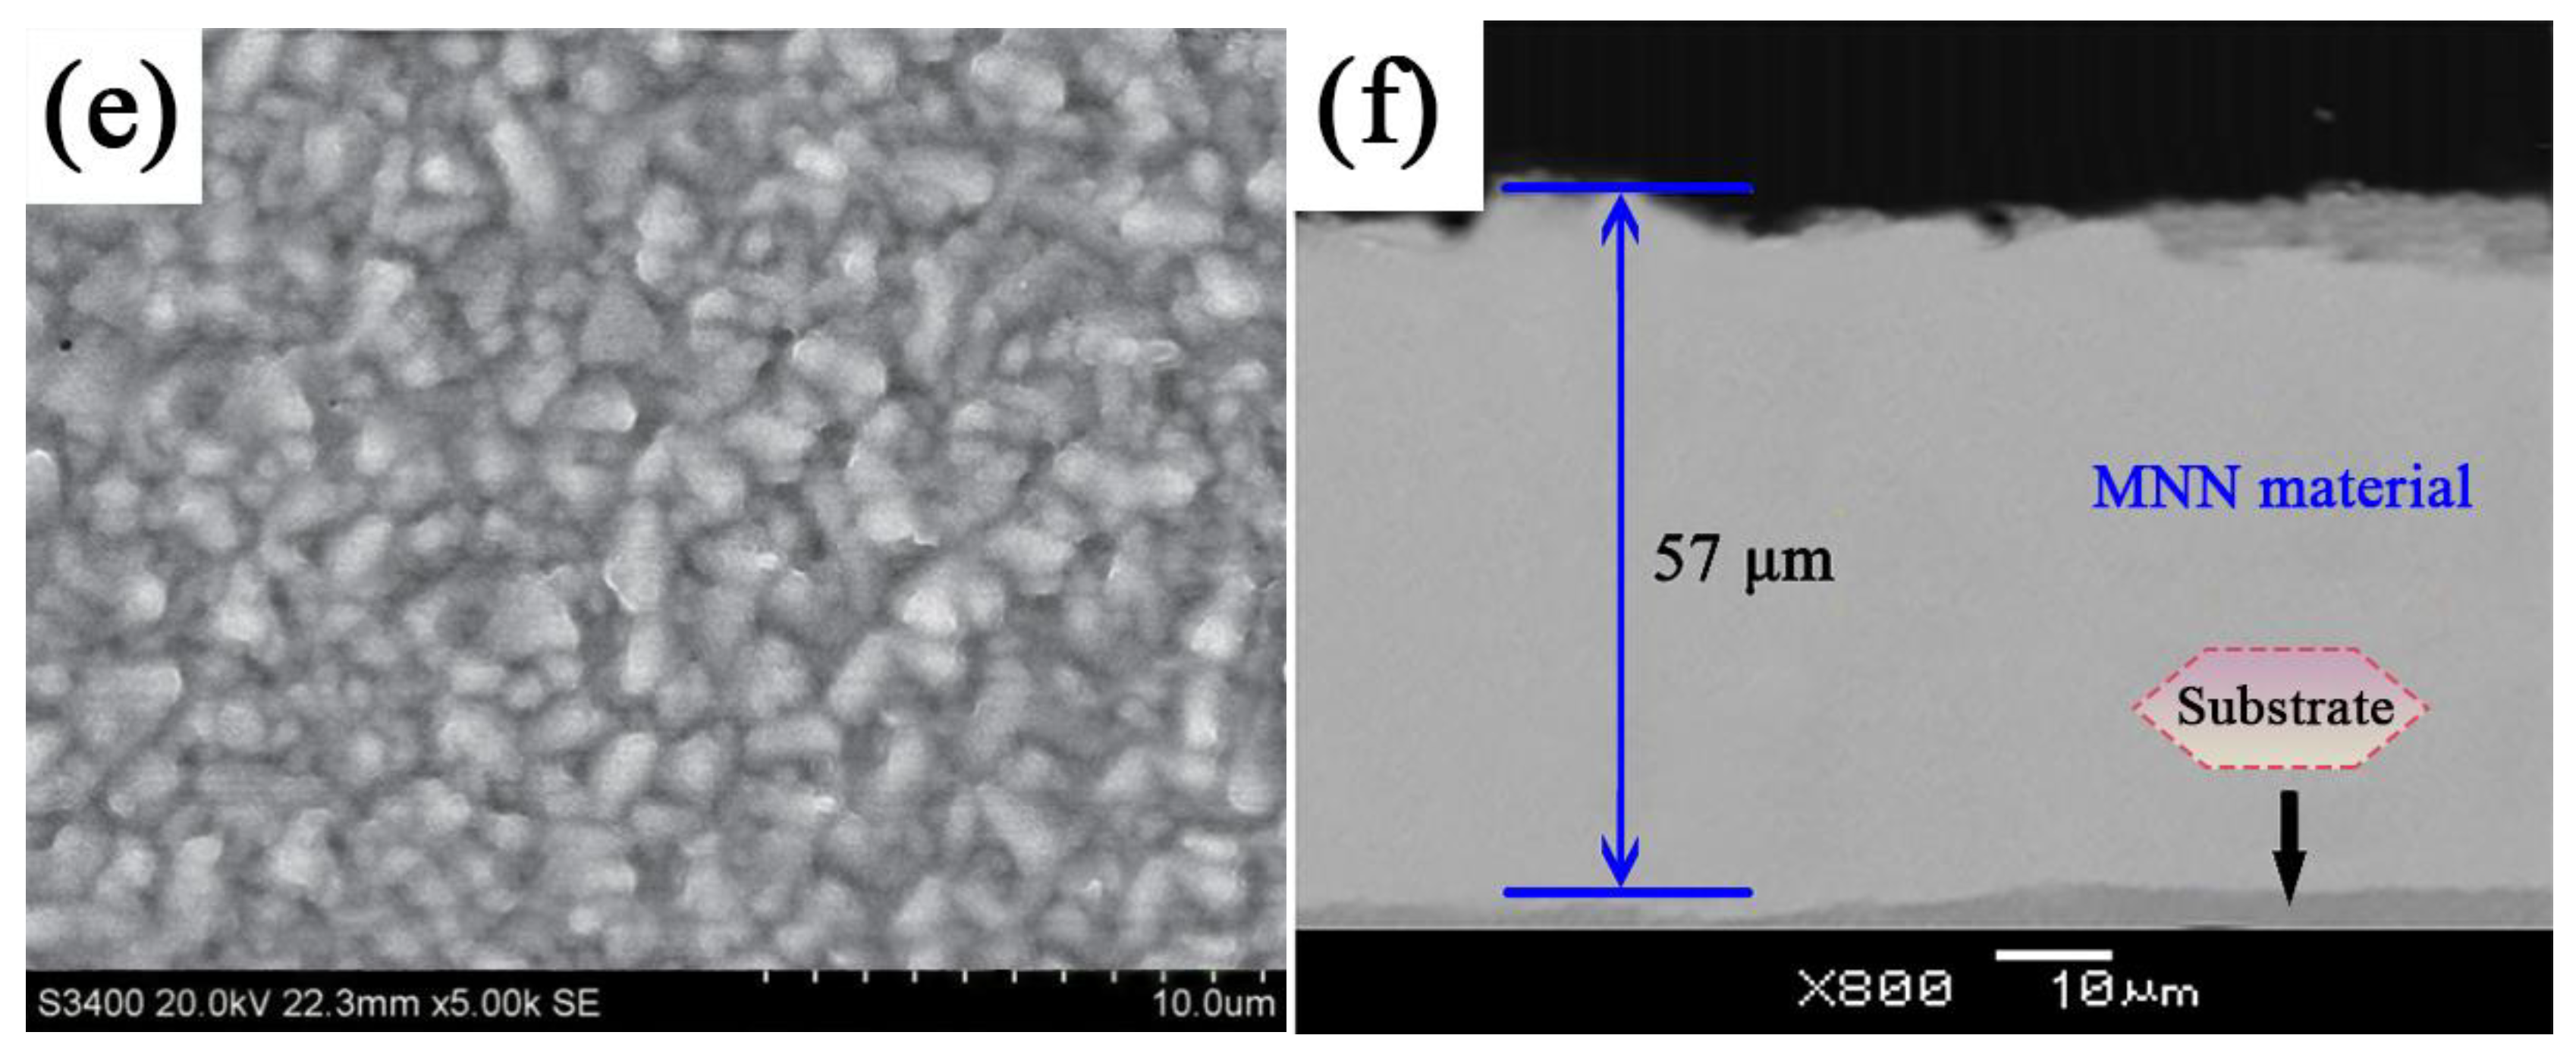
3.1. Surface Morphology of MNN Material

The structural features and morphology of MNN material with varying nickel–iron ratios were observed using SEM analysis. Figure 3 presents the SEM images of the electrodeposited MNN material. Figure 3a illustrates the microstructure of the MNN material with a nickel–iron ratio of 3:1. These images show smaller grain sizes and a uniform, densely dispersed grain arrangement. On the other hand, Figure 3b displays the MNN material prepared with a nickel–iron ratio of 2:1, showing uniformity and good dispersion of grains. However, it is evident that in this case, the MNN material contains larger-sized grains, and the arrangement of these grains is not sufficiently compact [18]. Figure 3c illustrates the microstructure of the MNN material with a nickel–iron ratio of 1:2. Varying grain sizes, noticeable grain aggregation, and evident structural collapse can be observed within the material. Figure 3d shows the SEM image of pristine Fe3O4, highlighting its grain structure and distribution. Figure 3e presents the SEM image of pristine NiO, illustrating its distinct grain morphology. Figure 3f depicts the cross-section SEM image of the MNN material, revealing the deposition layer thickness of 57 μm.
The observed results can be explained as follows: During the electrodeposition process for fabricating MNN material with a nickel–iron ratio of 3:1, Fe3O4 grains serve as nucleation sites for nickel grains, facilitating their growth around these points. Moreover, at this specific ratio, MNN material achieves an improved phase equilibrium, promoting an orderly crystal arrangement and the development of dense grain structures. Conversely, when the nickel–iron ratio is adjusted to 2:1, the reduction in nickel content affects the solution’s supersaturation. A lower degree of supersaturation decreases the nucleation rate of nickel grains, resulting in the formation of fewer new grains. Consequently, the existing nickel grains continue to grow, leading to an increase in grain size [19,20].
The growth of nickel grains is also accompanied by the migration of grain boundaries [21]. The reduction in the amount of available nickel might facilitate easier migration and merging of grain boundaries, potentially resulting in an increased grain size. Nonetheless, when the nickel–iron ratio reaches 1:2, a substantial decline in nickel content poses challenges in the formation of MNN material. This ratio induces the formation of phases that are unfavorable for maintaining stable crystal structures, causing the collapse of grains. Moreover, the accelerated growth of nickel grains primarily occurs around iron grains, serving as nucleation points, leading to uneven growth rates and localized increments in grain size.

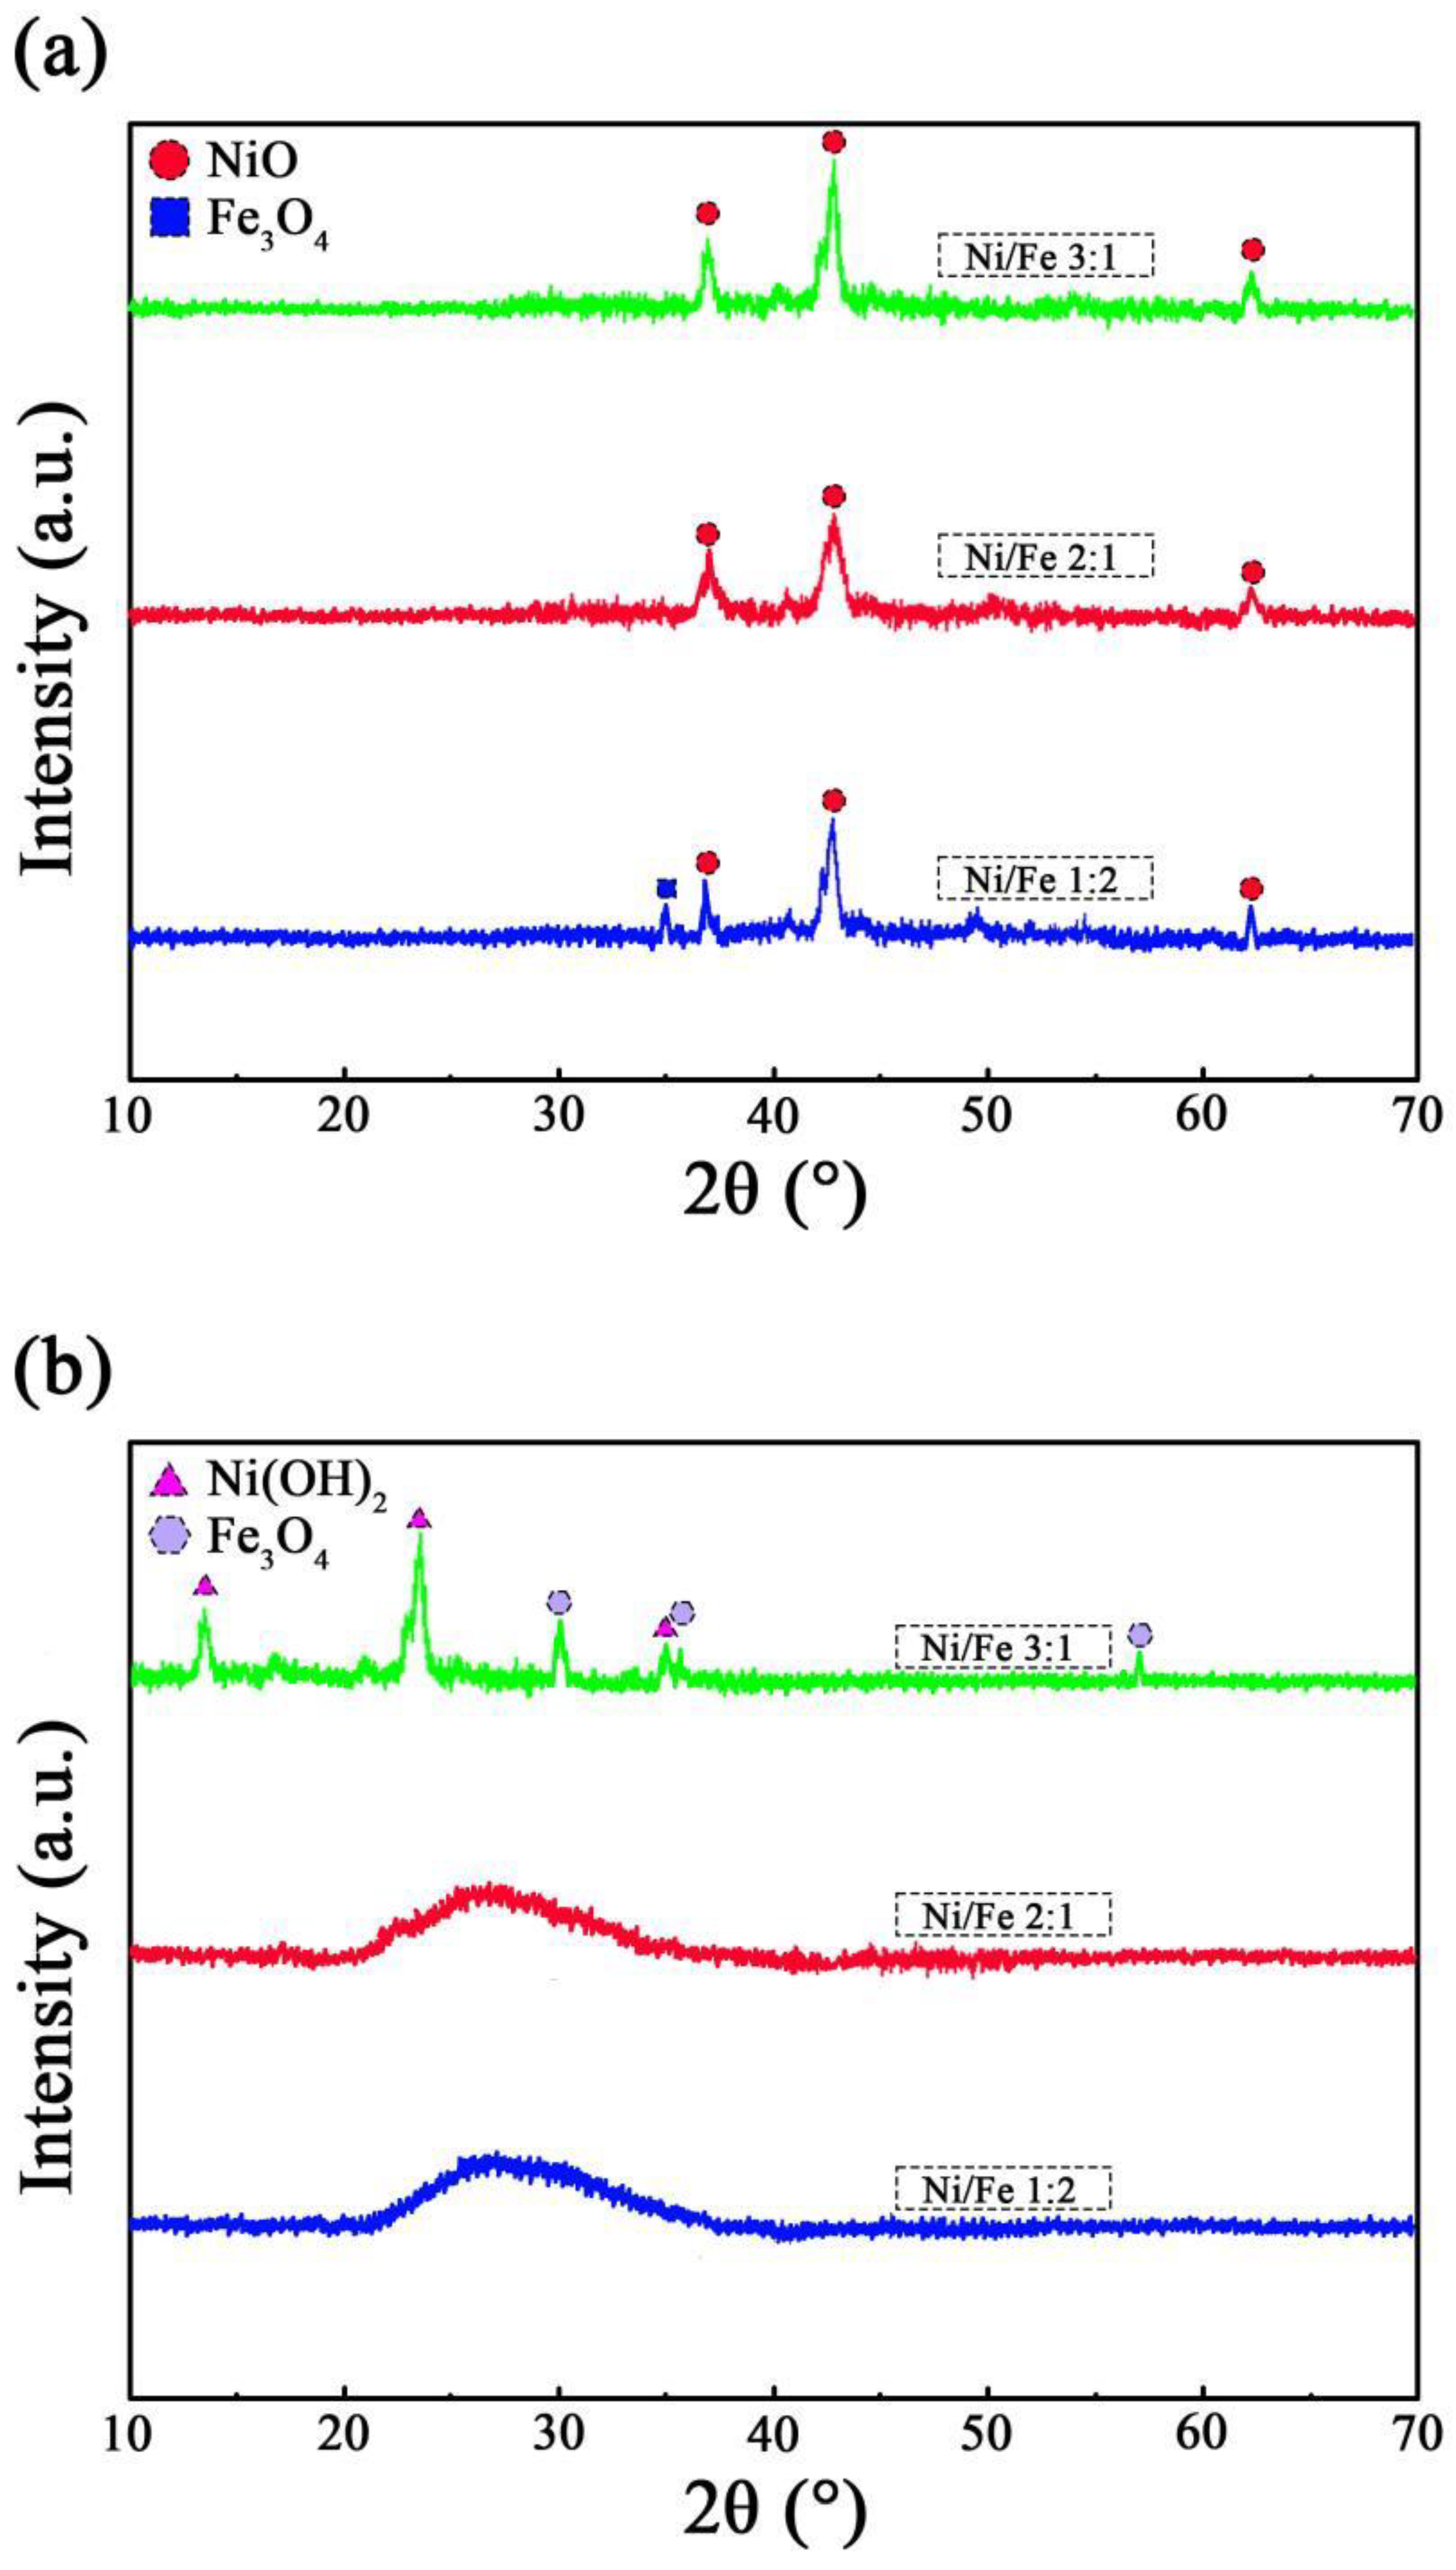
3.2. Phase Composition of MNN Material

The XRD patterns of MNN material having varying nickel–iron ratios are presented in Figure 4a. The peaks observed at 2θ = 36.8°, 42.5°, and 63.2° align with the (111), (200), and (220) planes of the cubic crystal structure of NiO, respectively. A faint peak representing the Fe3O4 (311) plane is detected at 35.2°, without any other impurity peaks. When the quantity of added FeSO4•9H2O is minimal, only the distinctive peaks of NiO are visible in the product’s spectrum. However, as the Ni/Fe ratio decreases, the characteristic peaks of Fe3O4 crystals start to appear and gradually intensify, indicating an increase in the Fe3O4 content within the MNN material. The XRD pattern of the MNN material after adsorbing (F) is shown in Figure 4b. As seen in Figure 4b, when the Fe3O4 content is minimal (Ni/Fe 3:1), nickel oxide in the MNN material reacts with water to form nickel hydroxide, suggesting that F is primarily adsorbed on the surface of the composite material based on Fe3O4 and Ni(OH)2. The adsorption can be conveniently explained by a hydration mechanism. In contrast, the MNN material with Ni/Fe ratios of 2:1 and 1:2 did not show any diffraction peaks attributed to crystalline NiO and Ni(OH)2 following the adsorption reaction. The absence of these peaks suggests that the rise in Fe3O4 content decelerated the reaction between NiO and water, and amorphous intermediate products were consequently formed. Moreover, the generally limited Fe3O4 content in the MNN material contributed to an amorphous presence that obscured its distinctive diffraction peaks [22]. However, the diffraction peaks for NiO and Fe3O4 were identified and matched using the International Centre for Diffraction Data (ICDD) database. For NiO, the peaks correspond to ICDD PDF-2 #01-089-5881, and for Fe3O4, the peaks correspond to ICDD PDF-2 #01-088-0315. These files provide accurate and up-to-date phase identification for the analyzed materials.

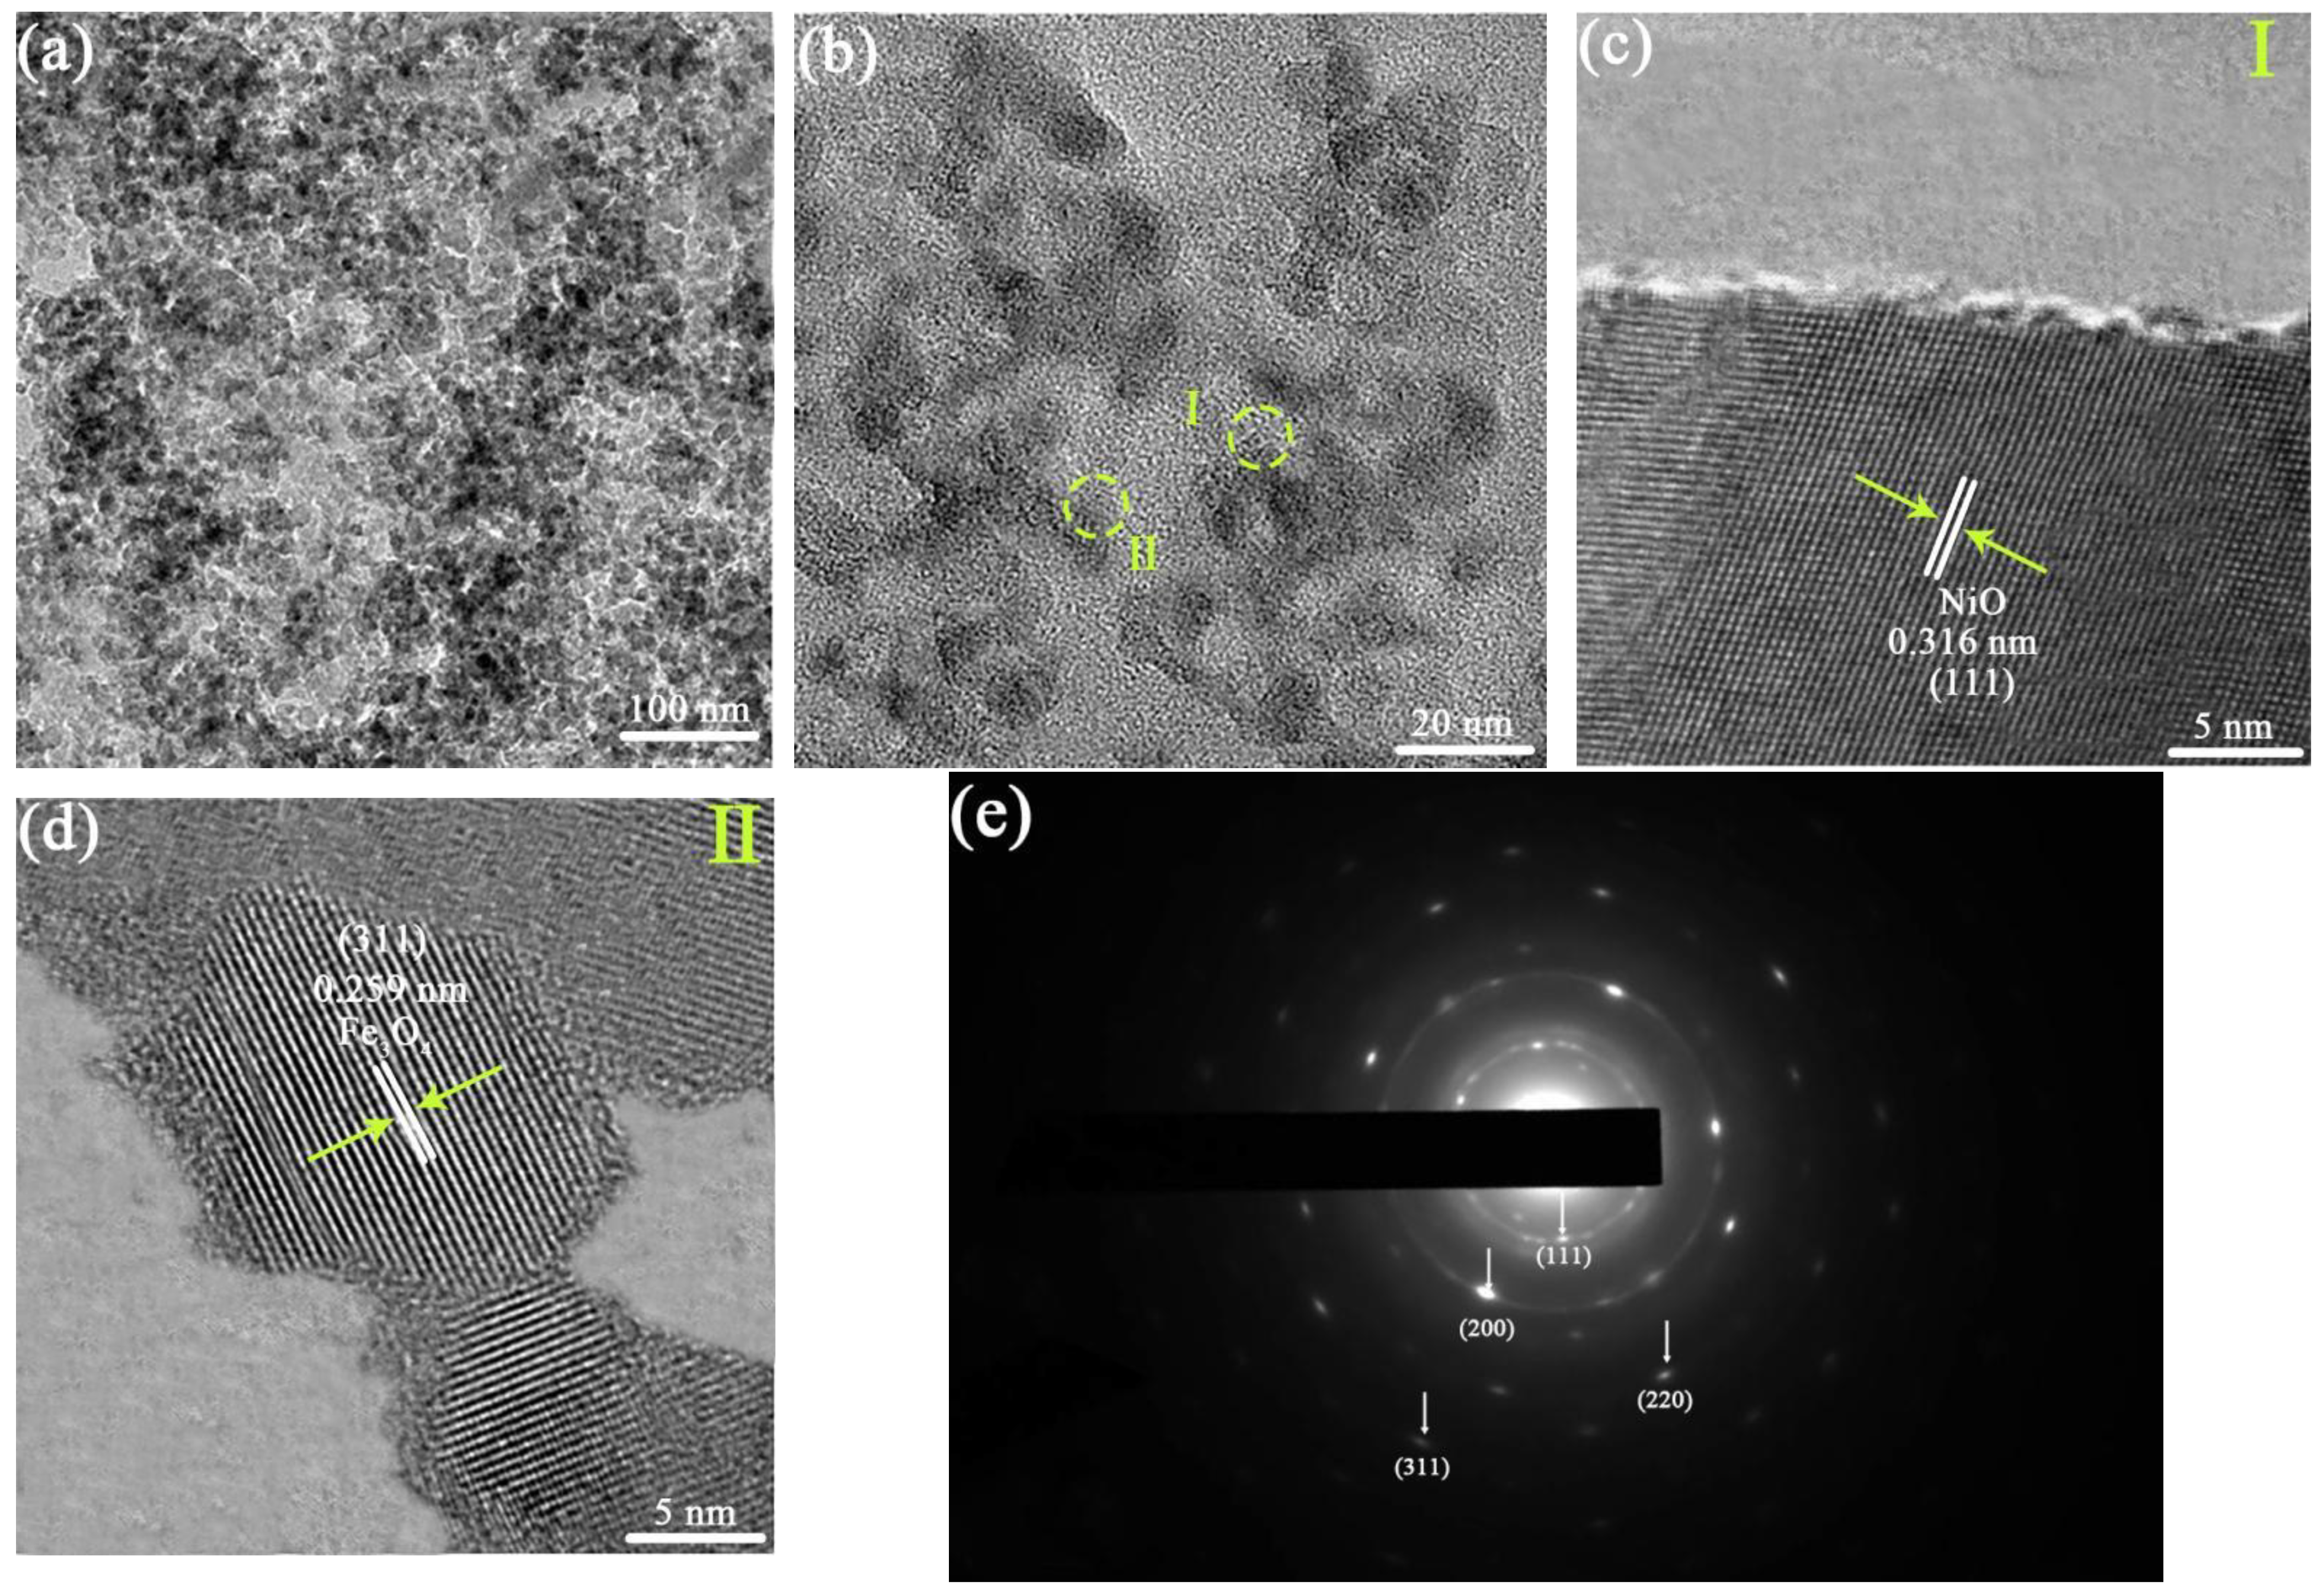
3.3. Microstructure Observation of MNN Material

Transmission electron microscopy (TEM) was employed to study the detailed microstructure of MNN material (Ni/Fe = 2:1). Figure 5a presents a low-magnification TEM micrograph of the MNN material. A uniform distribution of nanoscale Ni-Fe crystals is observed, which corroborates well with SEM findings. Figure 5b displays a high-magnification TEM image of the MNN material. At high magnification, numerous surface gaps in the MNN material are evident. Figure 5c,d depict high-resolution TEM images, showing lattice spacings of 0.316 nm (NiO) and 0.259 nm (Fe3O4), corresponding to the (111) and (311) planes, respectively. Figure 5e represents the selected electron diffraction images, demonstrating the polycrystalline nature of MNN material. Additionally, the diffraction rings correspond to the (111), (200), and (220) planes of the NiO phase and the (311) plane of the Fe3O4 phase, which aligns relatively well with XRD findings.

3.4. BET Analysis of MNN Material

The characterization of the pore structure of MNN materials with varying nickel–iron ratios was conducted using nitrogen adsorption tests. Prior to the analysis, scraps and dust were carefully removed from the surface of the materials to ensure accurate measurements. Approximately 0.1 g of each sample was used for the BET analysis [23]. At lower relative pressures, the nitrogen adsorption–desorption isotherm displays a slight convexity as illustrated in Figure 6a, for the MNN material with a nickel–iron ratio of 2:1, indicating the presence of a limited amount of microporous structures. However, upon subjecting to higher relative pressures, a distinct adsorption–desorption hysteresis loop emerges due to capillary condensation. This suggests that the sample displays characteristics similar to Type IV adsorption isotherms and H4-type hysteresis loops. This behavior indicates that mesoporous and slit-like pore structures are present within the MNN material. Figure 6b illustrates the pore size distribution curve for the MNN material with a nickel–iron ratio of 2:1. The curve depicts pore sizes ranging between 30 and 90 nm, accompanied by a BET-specific surface area of 79.68 cm2/g. The BET-specific surface areas of MNN material with nickel–iron ratios of 3:1 and 1:2 were found to be 75.31 cm2/g and 86.31 cm2/g, respectively, illustrating that as the iron content rises, the specific surface area of the MNN material progressively increases. This implies that the inclusion of iron oxides contributes to enhancing the dispersion of nickel oxides [24,25].

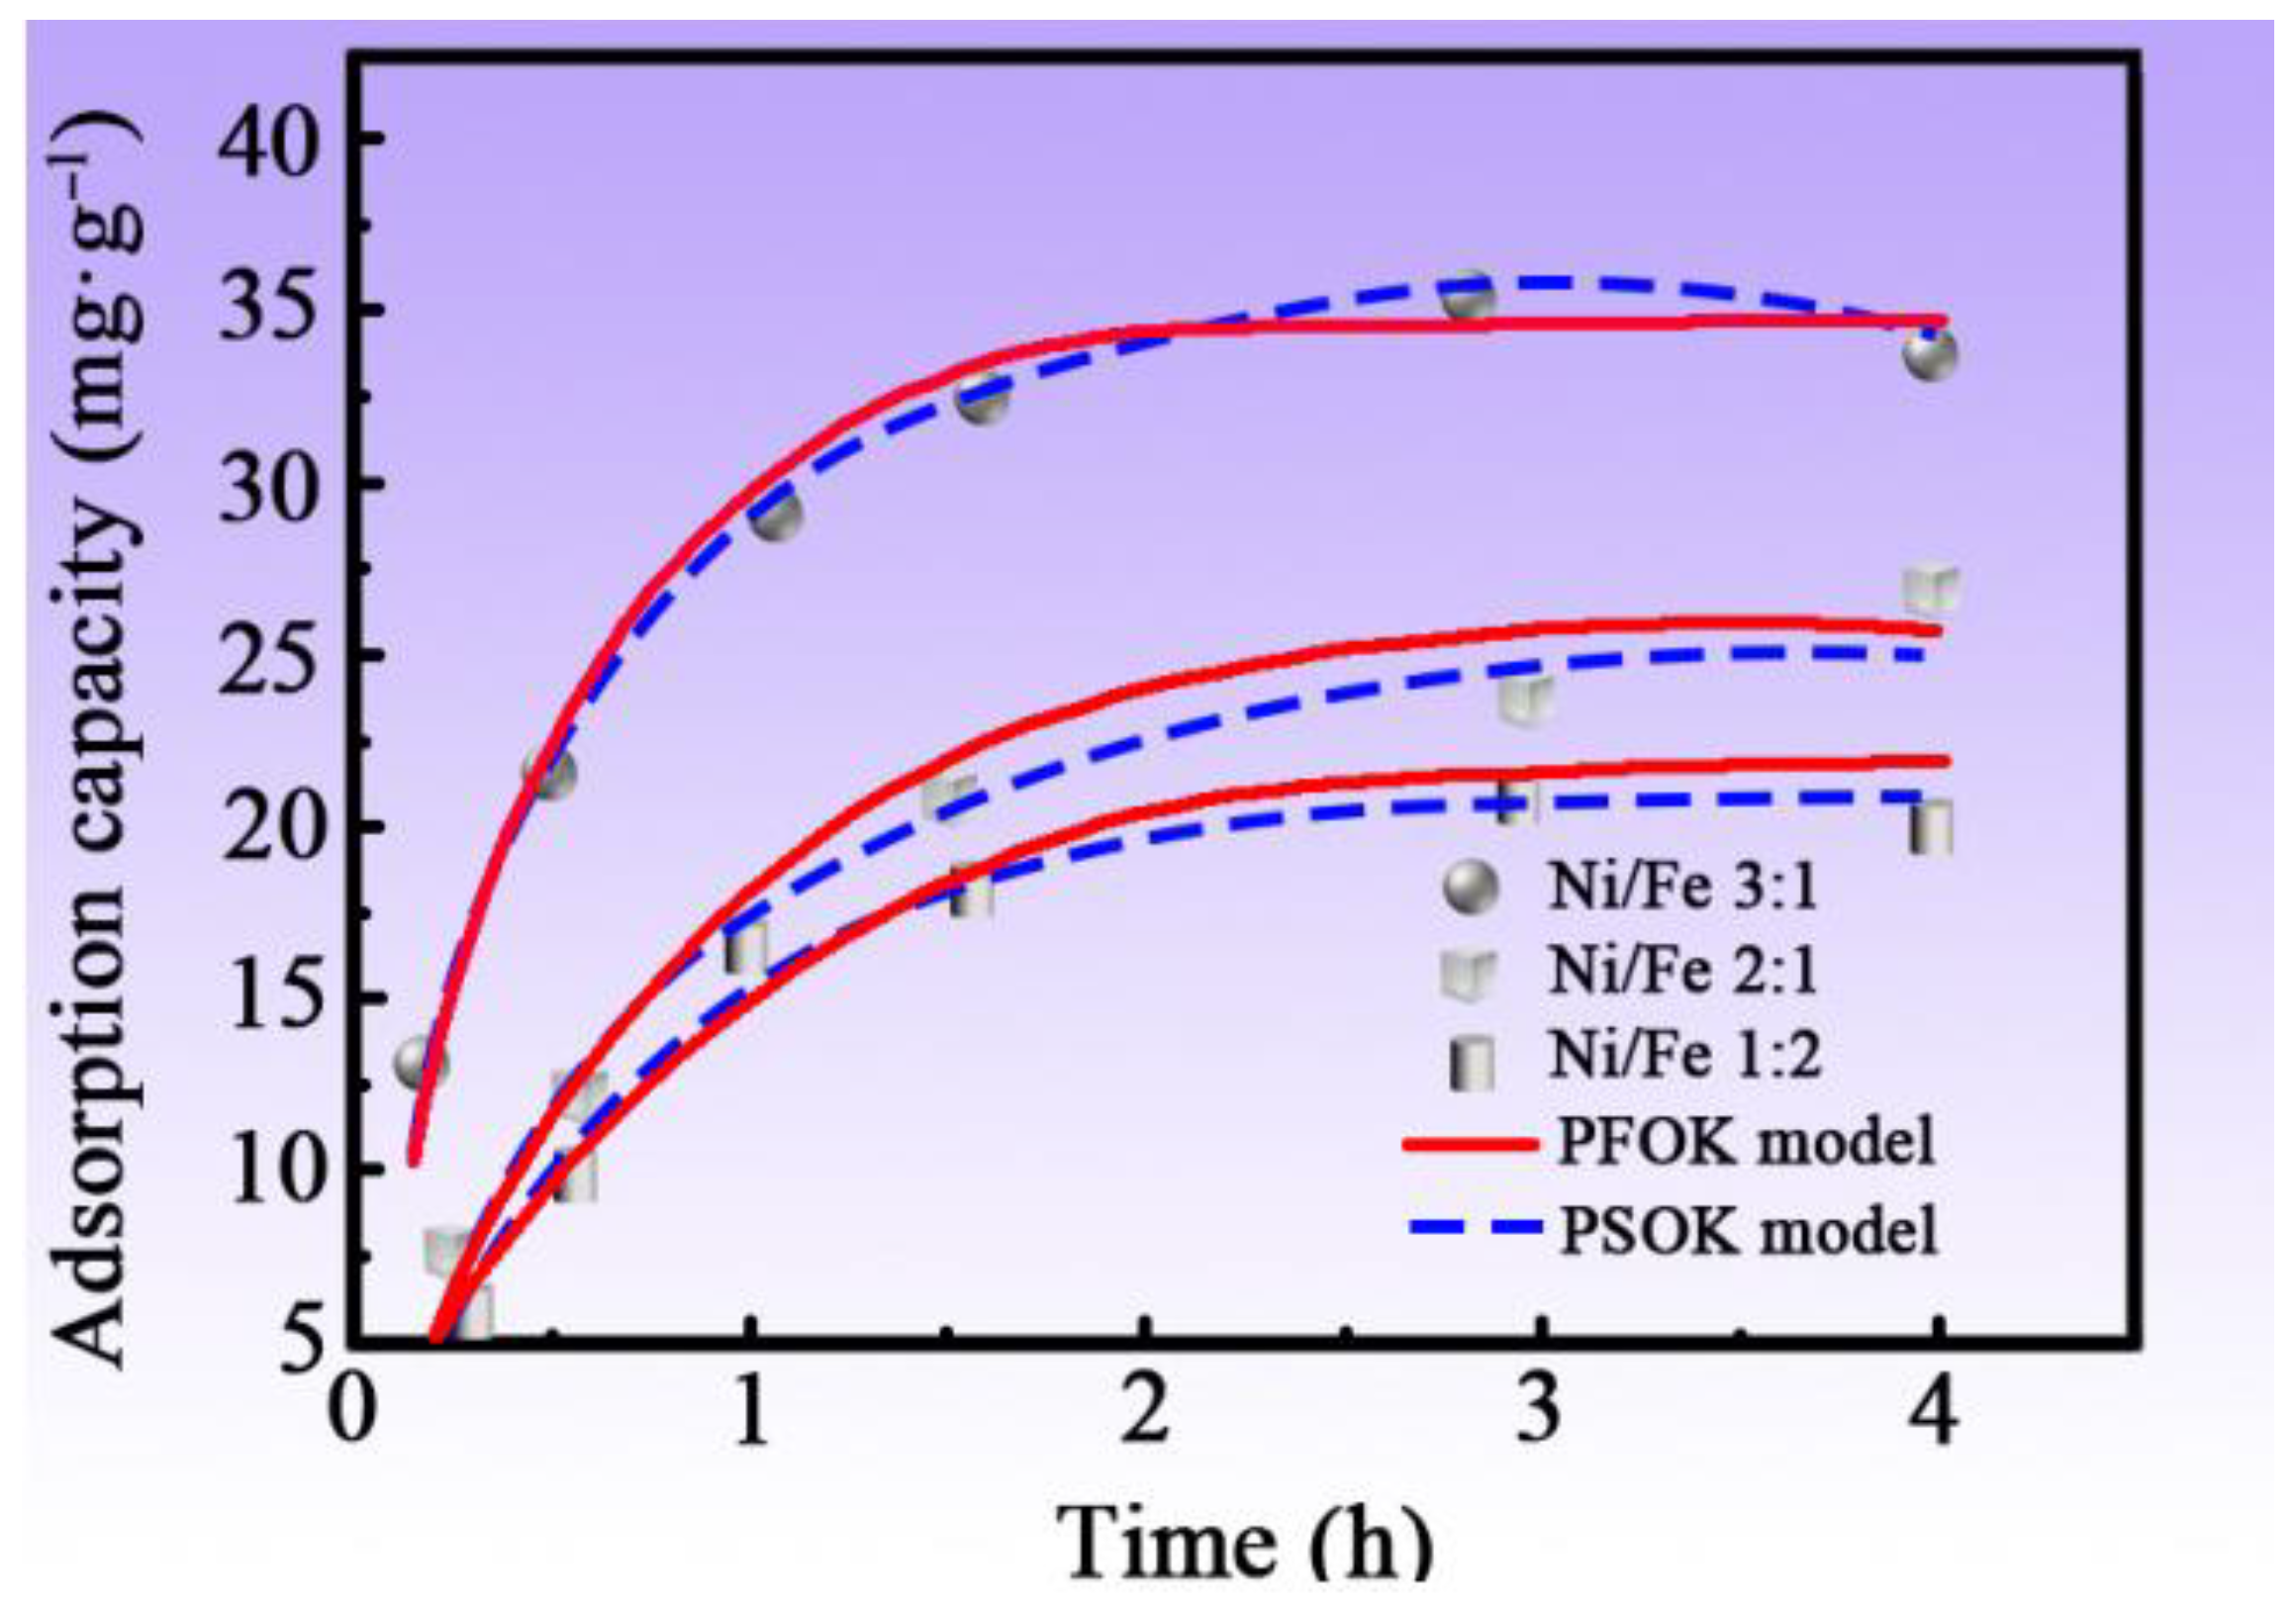
3.5. Adsorption Kinetics of MNN Material

To study the mechanism regulating the adsorption of F by MNN material, the kinetics of the adsorption process were explored using the pseudo-first-order kinetic (PFOD) model and pseudo-second-order kinetic (PSOK) model [26]. The study was conducted at a pH of 4, a temperature of 25 °C, and using an initial F concentration of 50 mg/L, and the adsorption efficiency of MNN material with different nickel–iron ratios was examined over time, as shown in Figure 7. It is evident from Figure 7 that the removal efficiency of F increases over time. As the Ni/Fe ratio decreases, the composite’s ability to adsorb F weakens. The initial 0–90 min witnesses a rapid ascent in the adsorption capacity of MNN material for F, gradually tapering off and approaching equilibrium. Considering the reaction’s efficiency, the final adsorption duration was established as 4 h. The rapid initial surge in F adsorption caused by MNN material is attributed to an abundance of active sites on the surface of the adsorbent, which can accommodate a substantial quantity of F. With the progress in adsorption, the majority of these active sites become occupied by F, slowing the adsorption rate until reaching saturation. Upon introduction, FeSO4•9H2O competes for active sites on the nickel oxide surface, leading to competitive adsorption alongside F. Consequently, it slows down the composite’s adsorption of F. Additionally, the study demonstrates that post-F adsorption, MNN material can be attracted to the walls of the sample bottle under an external magnetic field, enabling solid–liquid separation within approximately 5 min (Table 3).

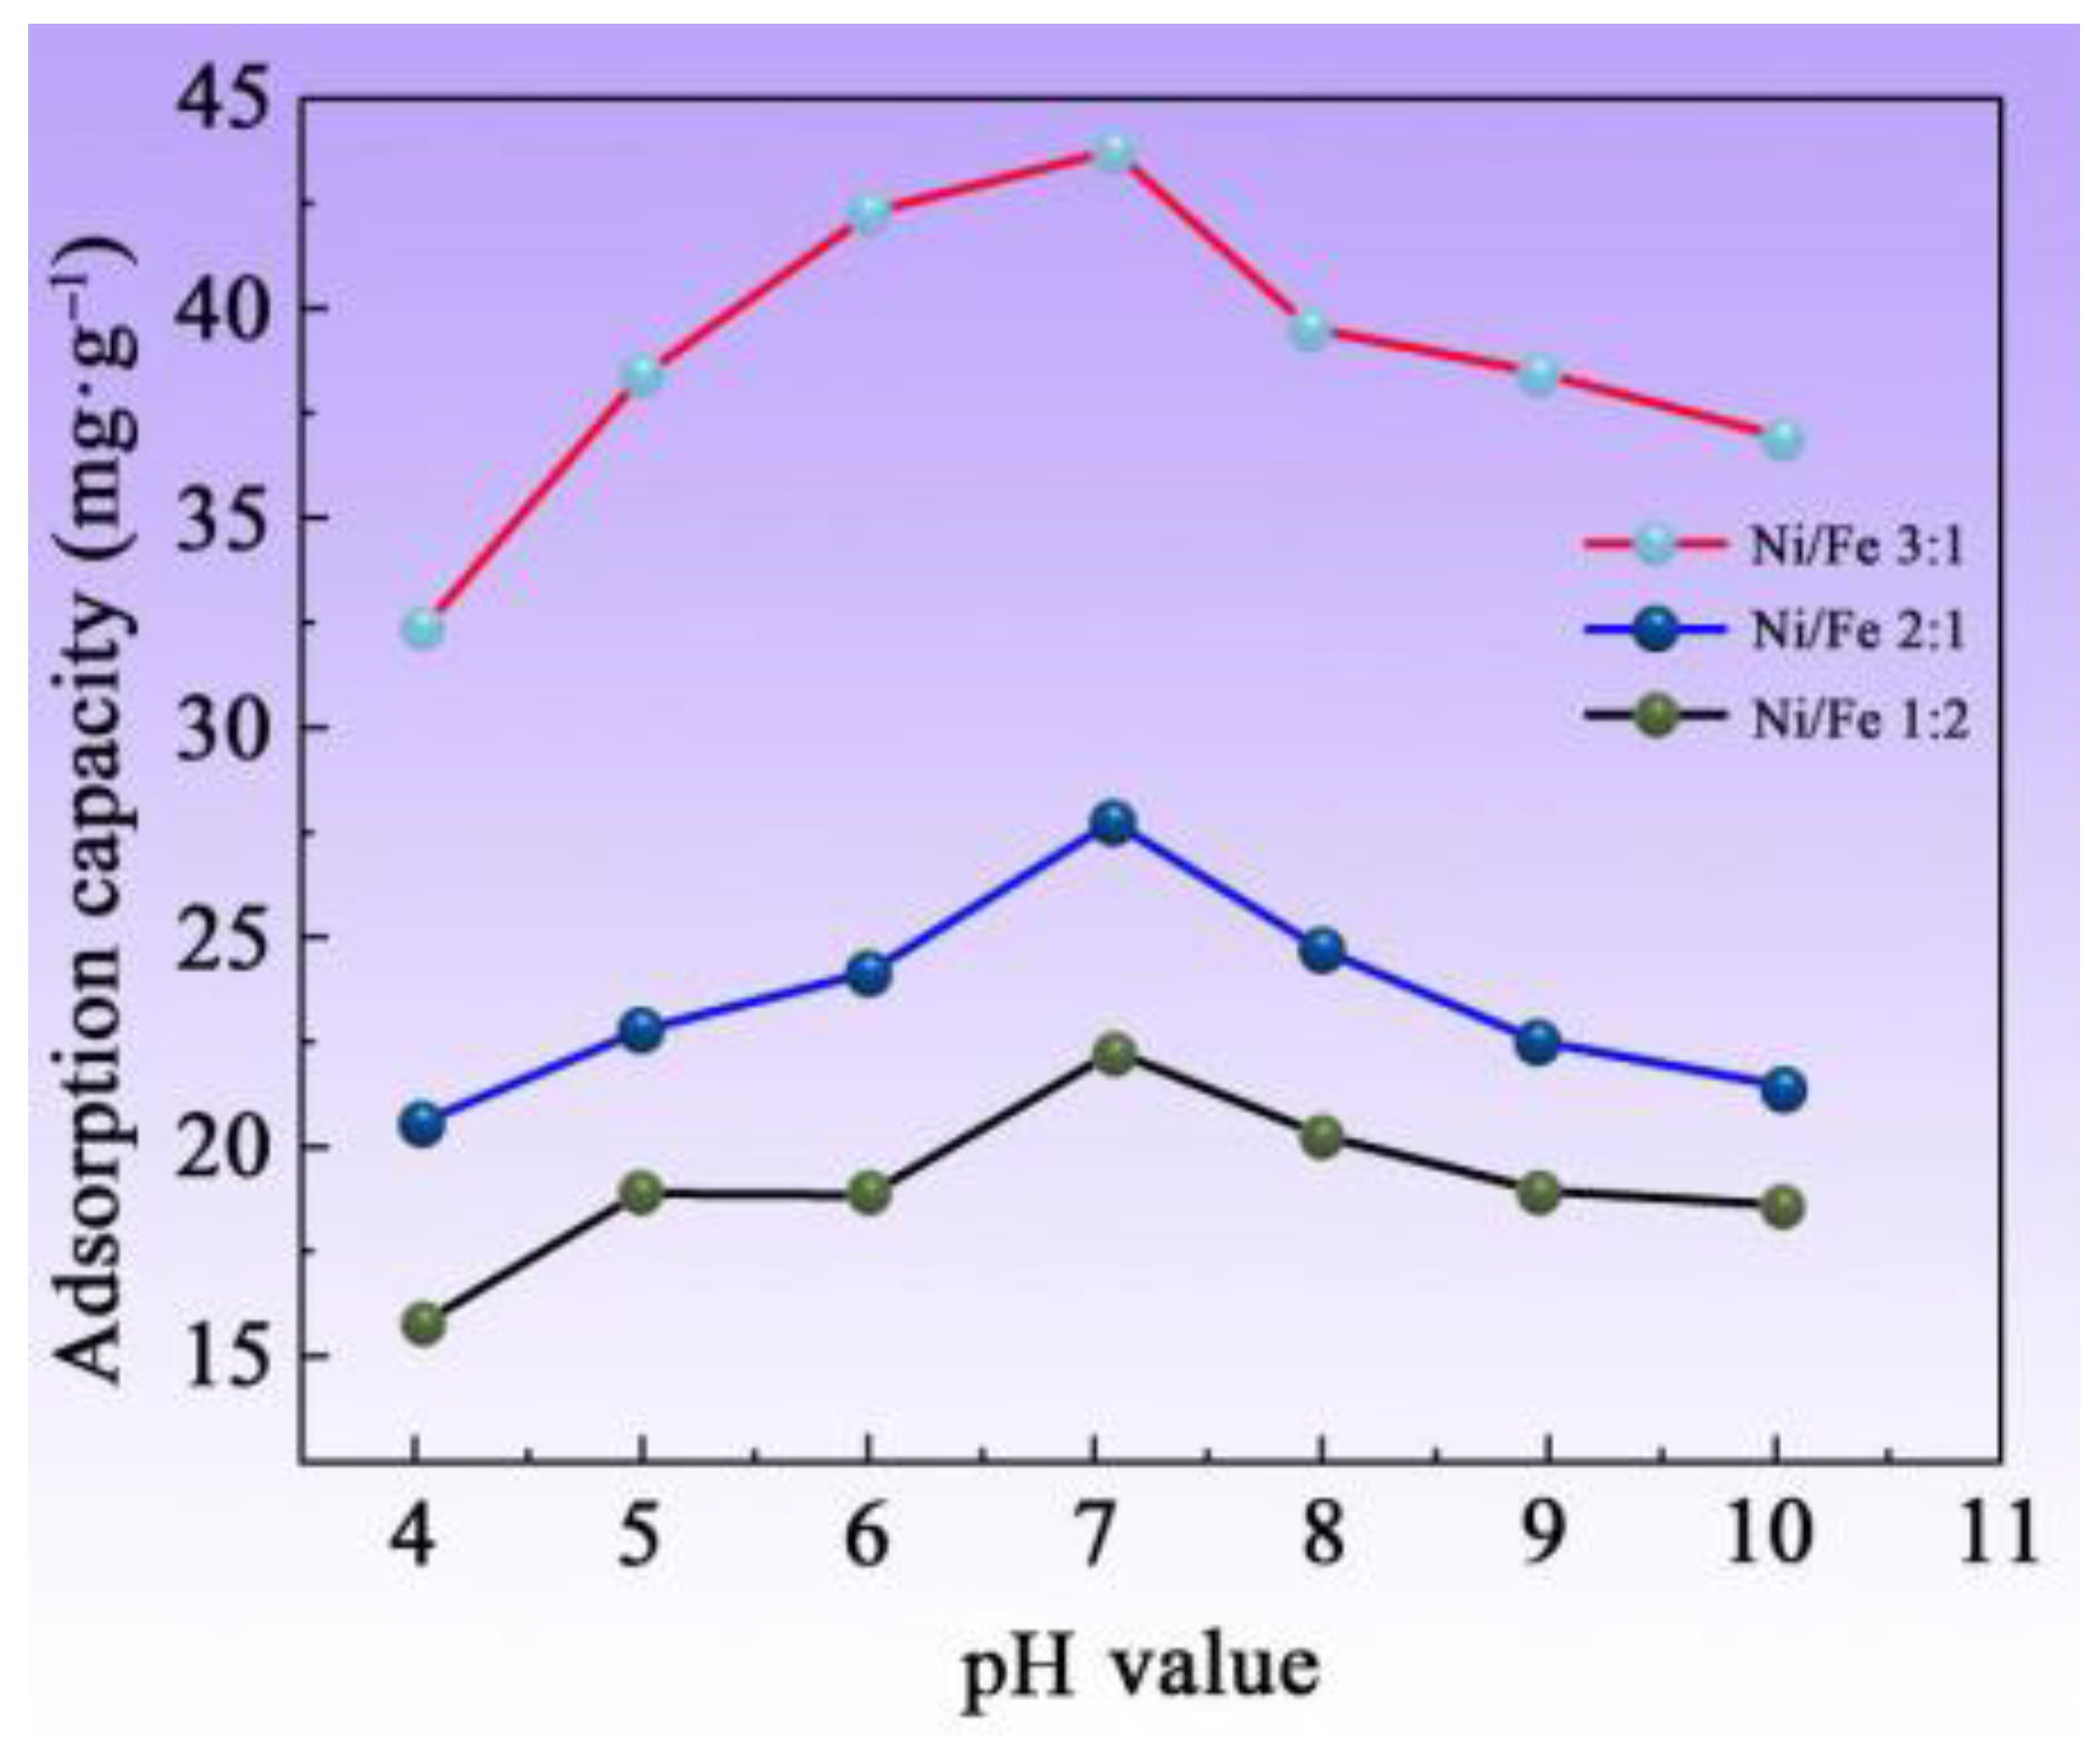
3.6. Impact of Various pH Values on Adsorption Characteristics

Investigations were carried out on the adsorption effectiveness of MNN material with different nickel–iron ratios on F at 25 °C, with a F concentration of 50 mg/L, and an optimal deposition time of 30 min, as shown in Figure 8. Within the pH range of 4–10, the adsorption capacity of MNN material for F gradually rises. This increase is ascribed to the competitive adsorption of H+ in slightly acidic conditions, wherein H+ preferentially combines with F to form HF, thereby inhibiting the formation of Ni(OH)2 [27]. The stronger the acidity, the more prominent the hindrance observed in fluoride adsorption. When the pH value surpasses 7, the composite’s adsorption capacity for F manifests a declining pattern concurrent with increasing pH. This decline is primarily the outcome of two primary factors. Firstly, the inhibitory impact of alkaline conditions on the reaction, as outlined in Equation (1), contributes to this decrease. Additionally, under alkaline circumstances, the MNN material’s surface becomes negatively charged, leading to the development of electrostatically repulsive forces between the adsorbent surface and F, consequently reducing fluoride adsorption. It is also possible that under these conditions, there is an exchange of fluoride ions with hydroxide ions in Ni(OH)2, further affecting the adsorption efficiency. Hence, as depicted in Figure 8, MNN material demonstrates robust defluoridation capabilities within a pH range from 5.0 to 8.0 in water. To verify the surface charge properties of the materials according to pH, Zeta potential measurements were performed at pH 6, 7, and 8. The results indicate a negative surface charge under alkaline conditions, confirming the electrostatic repulsion effect on fluoride adsorption. As depicted in Figure 8 and the new Zeta potential plot (Figure 9), MNN materials demonstrate robust defluoridation capabilities within a pH range from 5.0 to 8.0 in water.

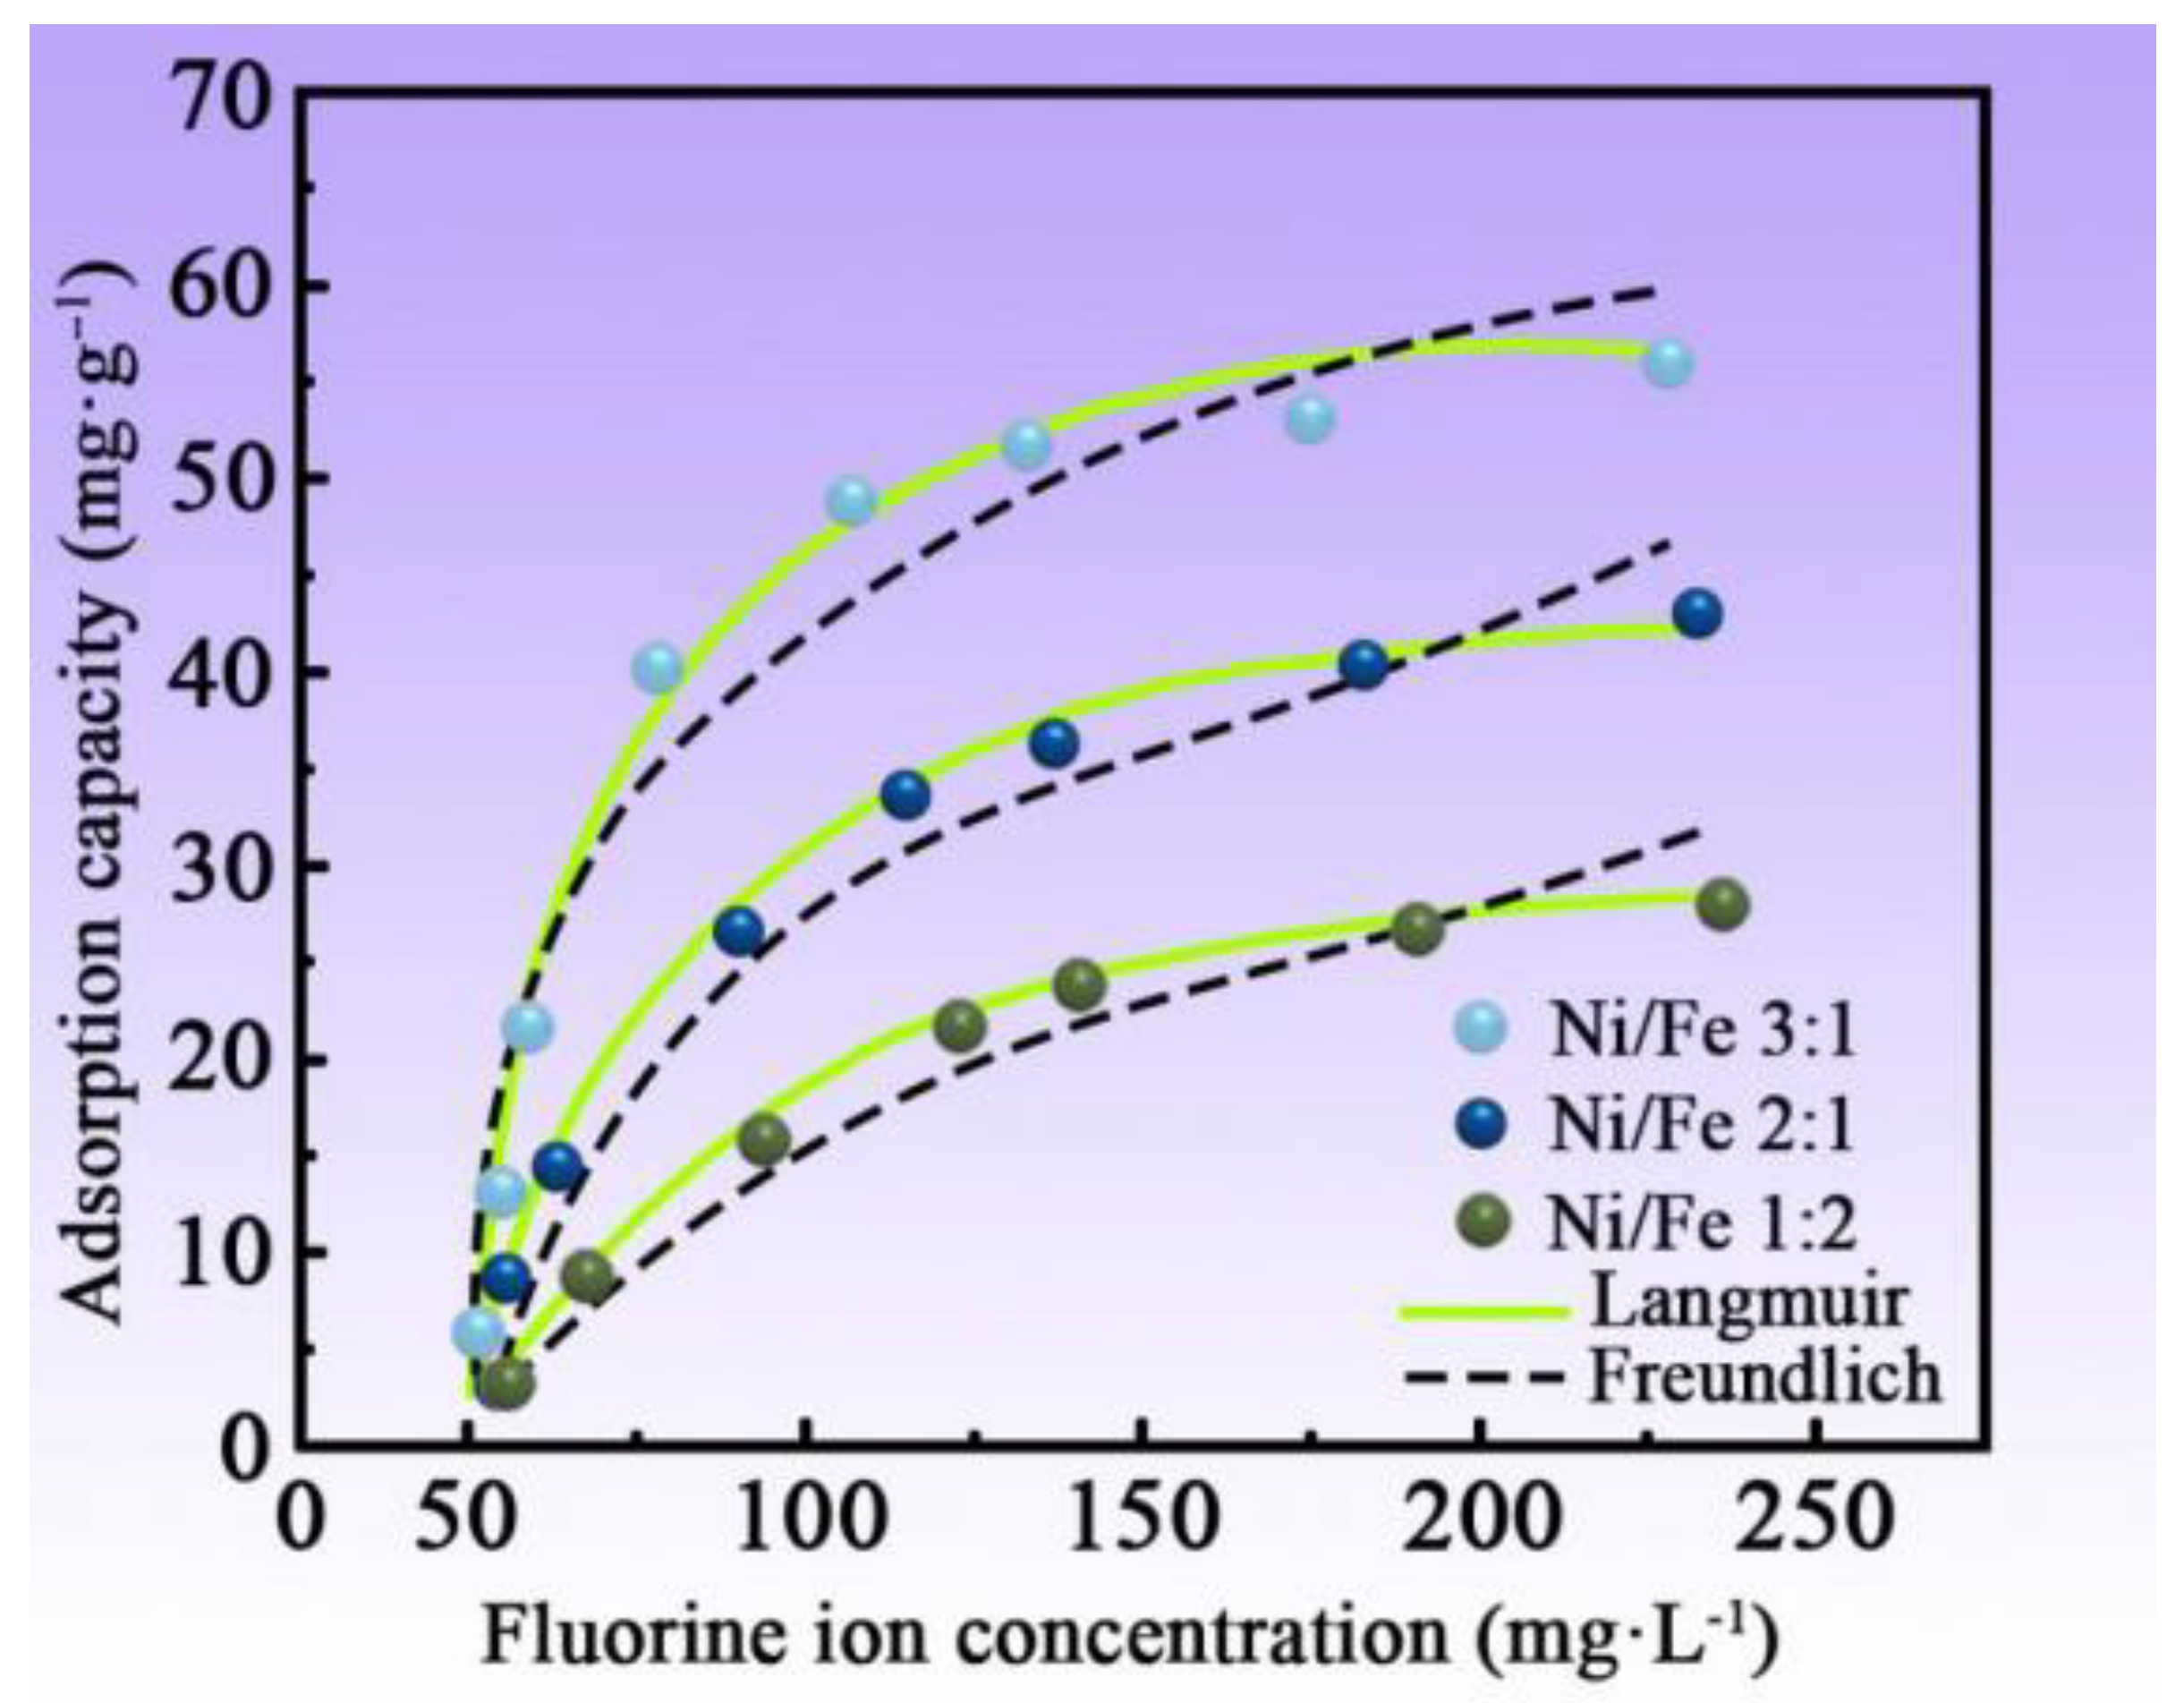
3.7. Isothermal Adsorption Test of MNN Material

The current study looks at the F adsorption effectiveness of MNN material with three different nickel–iron ratios at a pH value of 6, a temperature of 25 °C, an optimal reaction duration of 2 h, and an initial F concentration of 50 mg/L, as presented in Figure 8. An increasing trend in the adsorption capacity of MNN material is apparent with rising equilibrium concentrations of F. Experimental findings highlight an increment in the FeSO4•9H2O content in the deposition solution depending on the quantity of F adsorbed. For F equilibrium concentrations below 100 mg/L, the fluoride adsorption capacity of MNN material exhibits a rapid increase. However, when the F equilibrium concentration surpasses 100 mg/L, the adsorption capacity undergoes a more gradual increase, eventually achieving a state of equilibrium. The surplus of active sites present on the MNN surface during the initial phase of adsorption is presumed to be responsible for this behavior [28]. The elevated F concentration not only stimulates the reaction but also increases the likelihood of F binding to the surface of MNN material. When the amount of MNN material remains constant and the concentration of F continues to rise, the active sites existing on the adsorbent surface gradually diminish, leading to a slower incremental rise in adsorption capacity, eventually acquiring a state of equilibrium.
Both Langmuir and Freundlich isotherm models were employed for an analysis of the equilibrium adsorption data for a comprehensive understanding of the interaction between MNN material and F. Figure 10 and Table 4 present the fitting results. As seen from Table 4, the adsorption characteristics of MNN material towards F are effectively demonstrated by the Langmuir model, with correlation coefficients reaching above 0.98. This suggests that the adsorption of F on MNN material predominantly follows monolayer adsorption. An analysis of the influence of nickel oxide on F adsorption by MNN material demonstrated a decrease in the quantity of F adsorbed as the nickel–iron ratio decreased. At the same time, the affinity constant KL, pertaining to the adsorption of F on the MNN material’s surface, gradually diminished. This trend indicates that as Fe3O4 is introduced, the KL value declines, signifying that the presence of Fe3O4 reduces the affinity between F and MNN material.

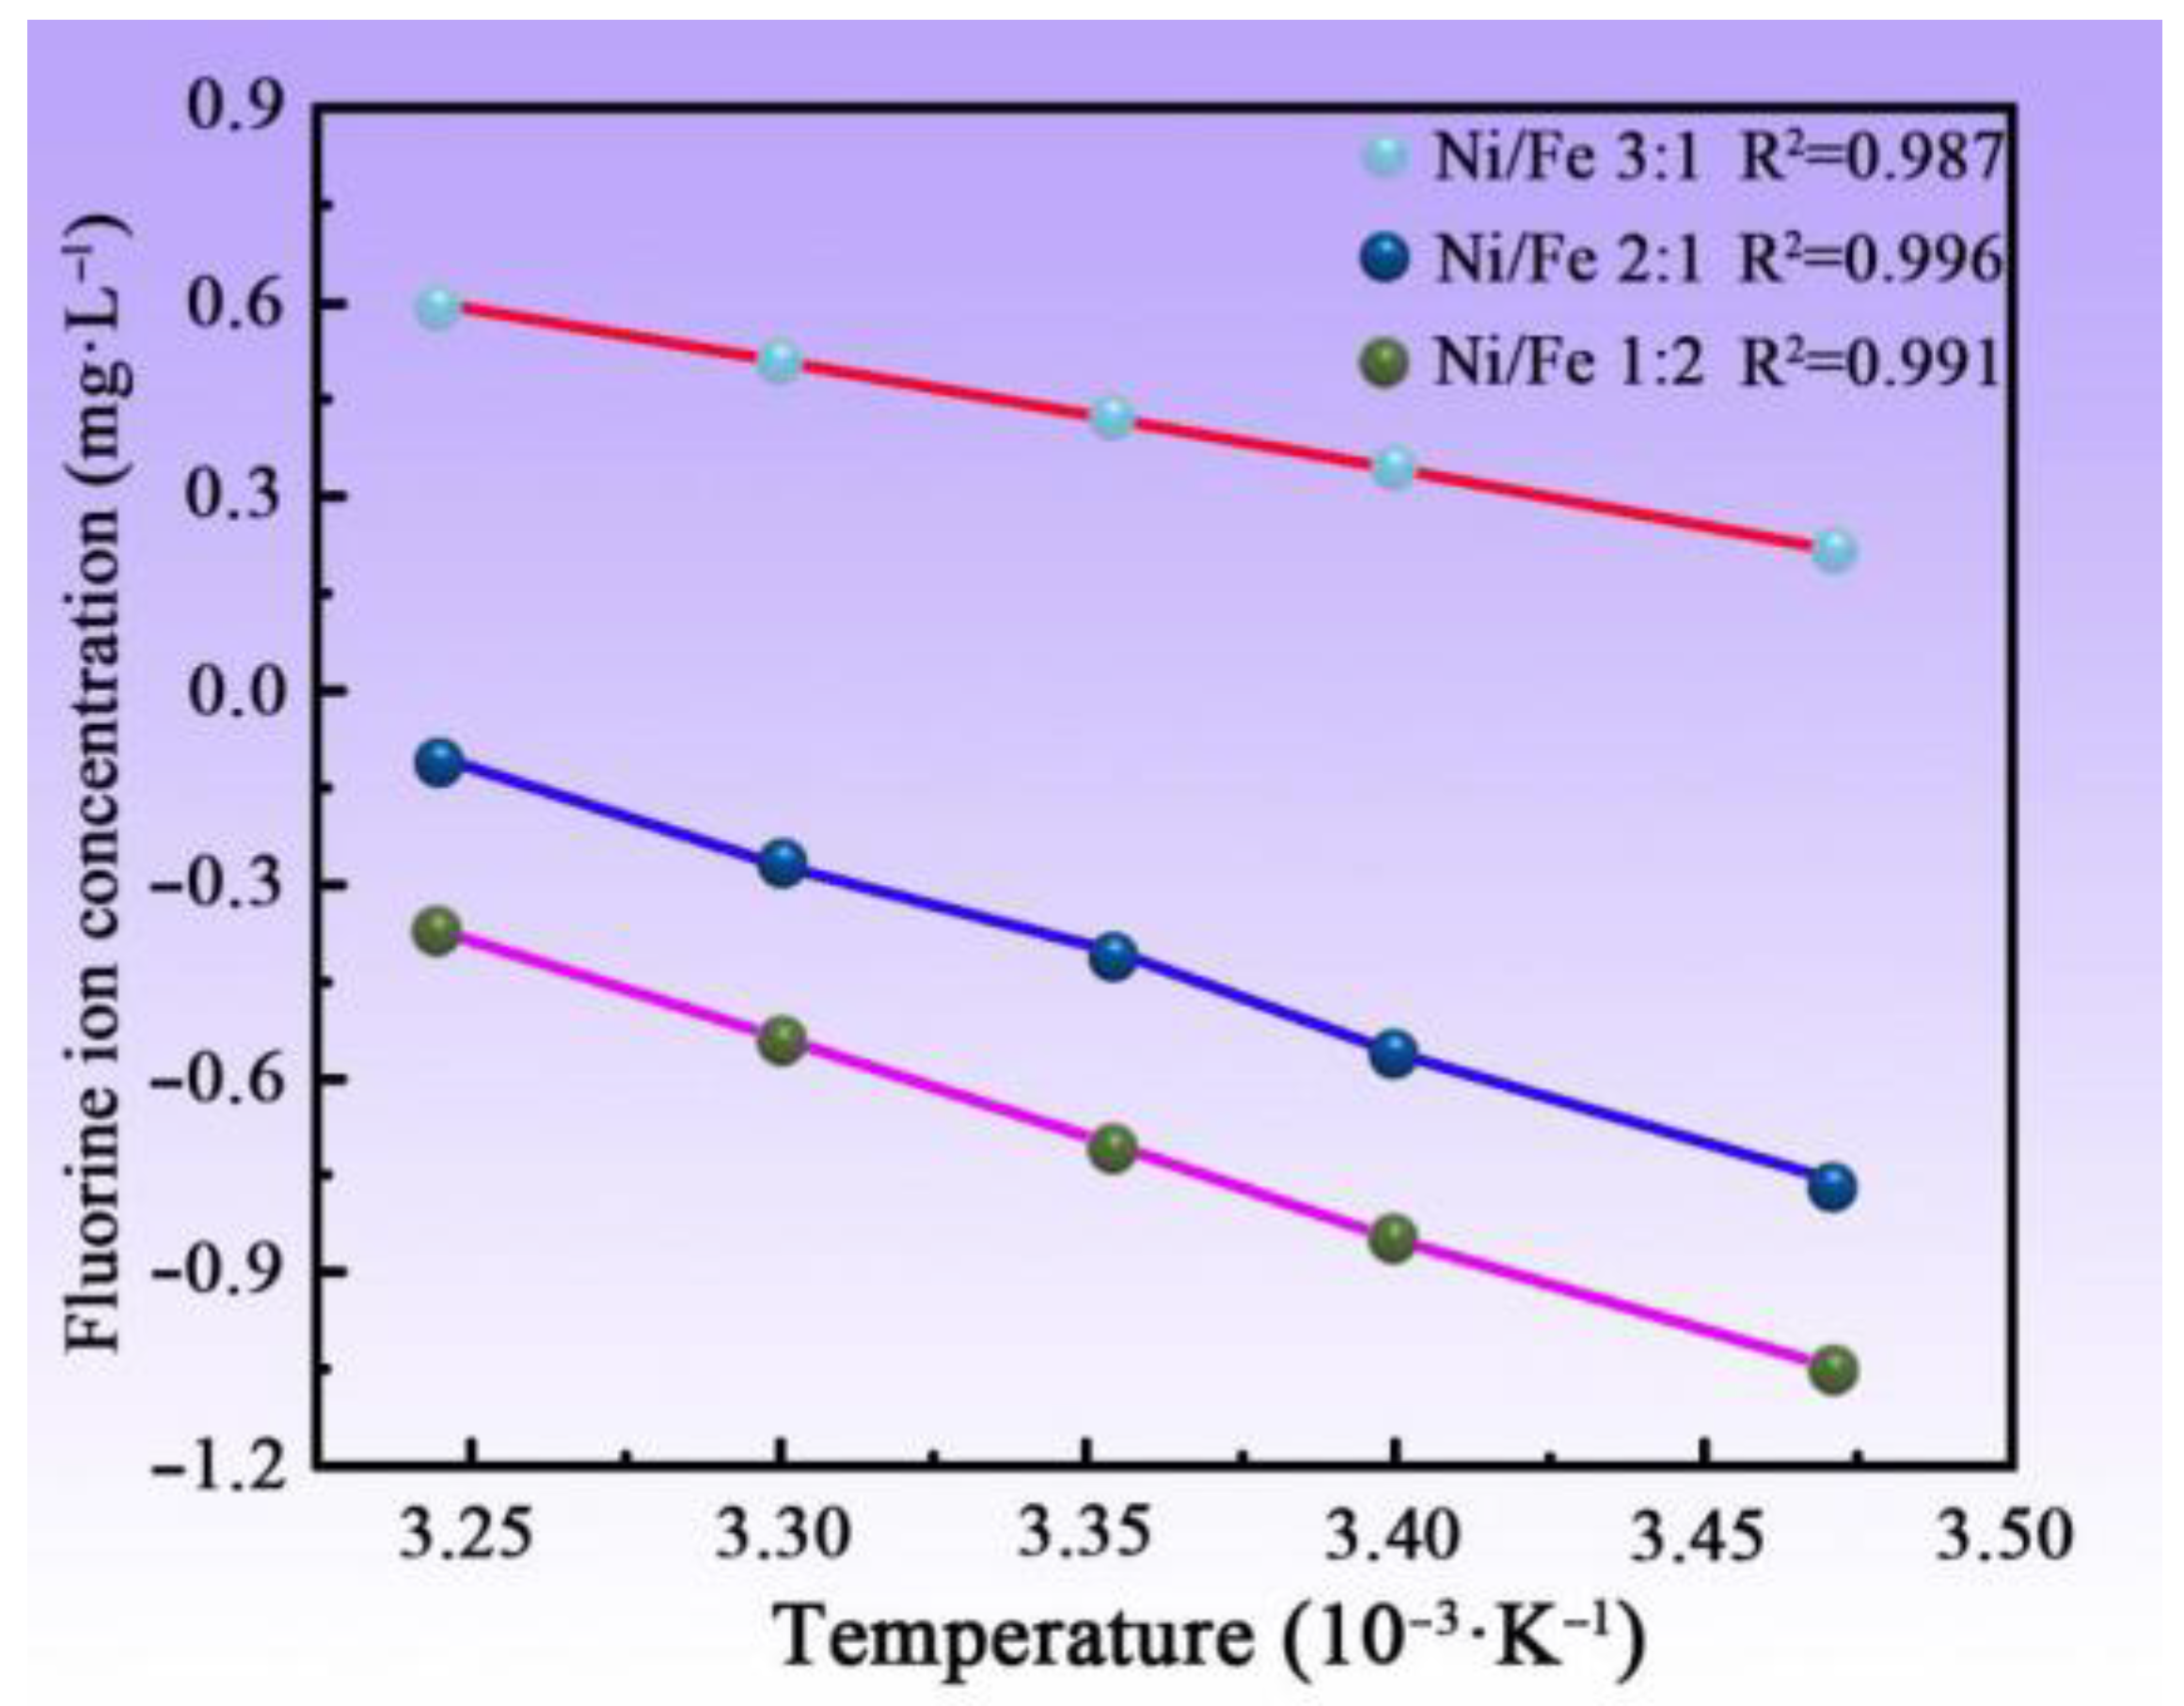
3.8. Adsorption Thermodynamic Test of MNN Material

The adsorption effectiveness of MNN material on F at 20 °C, with a F concentration of 50 mg/L and an optimal precipitation time of 30 min was studied as shown in Figure 11. With the temperature rise, the F adsorption capacity of MNN material increases, thereby implying that elevated temperatures can accelerate the adsorption process and that the adsorption of F by MNN material is an endothermic reaction. To explicitly demonstrate the interaction between MNN material and F and to determine whether the adsorption process is exothermic or endothermic, as well as to ascertain if it can proceed spontaneously, this study utilizes an adsorption thermodynamics model for the analysis of the equilibrium adsorption data. The findings, illustrated in Figure 12 and Table 5, demonstrate that the ∆H0 values associated with the adsorption of F by MNN material are uniformly greater than zero, implying an endothermic nature of the adsorption process. Therefore, an elevation in temperature enhances the adsorption of F by MNN material, consistent with the results from experiments conducted at a range of temperatures. Regarding MNN material featuring a nickel–iron ratio of 3:1, the ∆G0 values consistently remain below zero. This signifies that the adsorption of F on MNN material with this specific ratio can occur spontaneously at room temperature without the requirement of any external energy [29,30]. Furthermore, the spontaneity of this reaction becomes higher with higher temperatures. However, for MNN material with nickel–iron ratios of 2:1 and 1:2, the ∆G0 values are greater than zero, indicating that the adsorption of F by these ratios of MNN material at this temperature is relatively non-spontaneous. Therefore, the adsorption capacity for F at nickel–iron ratios of 2:1 and 1:2 is lower than that of the MNN material with a nickel–iron ratio of 3:1, corroborating with the results of the adsorption experiment conducted at different temperatures.

4. Conclusions

(1)
MNN materials were successfully synthesized with varying nickel–iron ratios using the electrodeposition method. SEM and TEM analysis revealed that MNN material, particularly with a nickel–iron ratio of 3:1, exhibits a dense and uniformly dispersed surface.
(2)
X-ray diffraction data along with the analysis of specific surface area and pore size distribution highlighted that, during F adsorption, the MNN material featuring a nickel–iron ratio of 2:1 undergoes hydration and electrostatic adsorption processes, achieving an adsorption capacity of 58.3 mg·g−1 for environmental F.
(3)
The MNN material exhibited maximum defluoridation efficiency at a neutral pH. The use of a pseudo-second-order kinetics model is followed by the adsorption process, which aligns with the Langmuir model, indicating a chemisorption mechanism involving monolayer coverage.

Author Contributions

Writing—review and editing and funding acquisition, H.Z.; data curation and resources, Z.L.; methodology and validation, C.M.; conceptualization and writing—original draft, H.H.; methodology and validation, L.W.; supervision and visualization, F.X. All authors have read and agreed to the published version of the manuscript.

Funding

The research is supported by the China Postdoctoral Science Foundation (grant no. 2023M740583), the Key Project of Qiqihar City Science and Technology Plan (grant no. ZDGG-202201), and the Basic Scientific Research Business Expenses Project of Heilongjiang Provincial Undergraduate University (grant no. 145209407).

Institutional Review Board Statement

This study was approved by the Institutional Review Board of the Qiqihar University (protocol code no. 2024060012, 11 June 2024).

Informed Consent Statement

Not applicable.

Data Availability Statement

Data are contained within the article.

Conflicts of Interest

The authors declare no conflicts of interest.

References

  1. Li, L.L.; Shi, Y.B.; Huang, Y.; Xing, A.L.; Xue, H. The Effect of Governance on Industrial Wastewater Pollution in China. Int. J. Environ. Res. Public Health 2022, 19, 9316. [Google Scholar] [CrossRef] [PubMed]
  2. Savun-Hekimoglu, B.; Isler, Z.; Hekimoglu, M.; Burak, S.; Karli, D.; Yucekaya, A.; Akpinar, E.; Ediger, V.S. Optimization of wastewater treatment systems for growing industrial parks. Sci. Total Environ. 2023, 905, 167223. [Google Scholar] [CrossRef] [PubMed]
  3. Chen, M.; Chen, H.Q. Spatiotemporal coupling measurement of industrial wastewater discharge and industrial economy in China. Environ. Sci. Pollut. Res. 2021, 28, 46319–46333. [Google Scholar] [CrossRef] [PubMed]
  4. Wan, K.L.; Huang, L.; Yan, J.; Ma, B.Y.; Huang, X.J.; Luo, Z.X.; Zhang, H.G.; Xiao, T.F. Removal of fluoride from industrial wastewater by using different adsorbents: A review. Sci. Total Environ. 2021, 773, 145535. [Google Scholar] [CrossRef] [PubMed]
  5. Kumari, U.; Siddiqi, H.; Bai, M.; Meikap, B.C. Calcium and zirconium modified acid activated alumina for adsorptive removal of fluoride: Performance evaluation, kinetics, isotherm, characterization and industrial wastewater treatment. Adv. Power Technol. 2020, 31, 2045–2060. [Google Scholar] [CrossRef]
  6. Marczewski, A.W.; Seczkowska, M.; Derylo-Marczewska, A.; Blachnio, M. Adsorption equilibrium and kinetics of selected phenoxyacid pesticides on activated carbon: Effect of temperature. Adsorpt. J. Int. Adsorpt. Soc. 2016, 22, 777–790. [Google Scholar] [CrossRef]
  7. Rezaei, N.; Ehsani, M.H.; Aghazadeh, M.; Karimzadeh, L. An Investigation on Magnetic-Interacting Fe3O4 Nanoparticles Prepared by Electrochemical Synthesis Method. J. Supercond. Nov. Magn. 2018, 31, 2139–2147. [Google Scholar] [CrossRef]
  8. Wang, Z.H.; Shen, D.K.; Shen, F.; Li, T.Y. Phosphate adsorption on lanthanum loaded biochar. Chemosphere 2016, 150, 1–7. [Google Scholar] [CrossRef]
  9. Li, L.; Hu, S.Z.; Huang, T.; Zhang, N.; Wang, Y. Fabricating the ternary CeO2@CNTs/CdSe composite with synchronously enhanced adsorption and photocatalytic activity toward water-soluble pollutants removal. Chem. Eng. J. 2023, 476, 146574. [Google Scholar] [CrossRef]
  10. Ju, F.; Wang, M.; Wu, T.; Ling, H. The Role of NiO in Reactive Adsorption Desulfurization Over NiO/ZnO-Al2O3-SiO2 Adsorbent. Catalysts 2019, 9, 79. [Google Scholar] [CrossRef]
  11. Baumagartner, M.; Spichtinger, P. Homogeneous nucleation from an asymptotic point of view. Theor. Comput. Fluid Dyn. 2019, 33, 83–106. [Google Scholar] [CrossRef]
  12. Karar, Y.; Boundinar, S.S.; Kadri, A.; Lepretre, J.C.; Benbrahim, N.; Chainet, E. Ammonium chloride effects on bismuth electrodeposition in a choline chloride-urea deep eutectic solvent. Electrochim. Acta 2021, 367, 137481. [Google Scholar] [CrossRef]
  13. Jebraeil, S.M.; Eslami, A. Hydrothermal synthesis of graphene oxide/NiO and its influence on the therma decomposition of ammonium perchlorate. Indian J. Chem. 2022, 61, 278–284. [Google Scholar]
  14. Baral, A.; Satish, L.; Padhy, S.K.; Das, D.P.; Tripathy, B.C.; Ghosh, M.K. Electrodeposition of nanoMnO2 from mineral leach liquor and the investigation on conformational changes of hemoglobin induced by the nanomaterial. Colloids Surf. A Physicochem. Eng. Asp. 2019, 585, 124102. [Google Scholar] [CrossRef]
  15. Lim, J.H.; Rotaru, A.; Min, S.G.; Malkinski, L.; Wiley, J.B. Synthesis of mild-hard AAO templates for studying magnetic interactions between metal nanowires. J. Mater. Chem. 2010, 20, 9246–9252. [Google Scholar] [CrossRef]
  16. Ursueguia, D.; Diaz, E.; Ordonez, S. Adsorption of methane and nitrogen on Basolite MOFs: Equilibrium and kinetic studies. Microporous Mesoporous Mater. 2020, 298, 110048. [Google Scholar] [CrossRef]
  17. Li, C.Y.; Xia, F.F.; Yao, L.M.; Li, H.X.; Jia, X. Investigation of the mechanical properties and corrosion behaviors of Ni-BN-TiC layers constructed via laser cladding technique. Ceram. Int. 2022, 49, 6671–6677. [Google Scholar] [CrossRef]
  18. Li, C.; Xia, F.; Ma, C.; Li, Q. Research on the Corrosion Behavior of Ni-SiC Nanocoating Prepared Using a Jet Electrodeposition Technique. J. Mater. Eng. Perform. 2021, 30, 6336–6344. [Google Scholar] [CrossRef]
  19. Xia, F.F.; Yan, P.; Ma, C.Y.; Wang, B.J.; Liu, Y. Effect of different heat-treated temperatures upon structural and abrasive performance of Ni-TiN composite nanocoatings. J. Mater. Res. Technol. 2023, 27, 2874–2881. [Google Scholar] [CrossRef]
  20. Rohrer, G.S.; Chesser, I.; Krause, A.R.; Naghoibzadeh, S.K.; Xu, Z.P.; Dayal, K.; Holm, E.A. Grain Boundary Migration in Polycrystals. Annu. Rev. Mater. Res. 2023, 53, 347–369. [Google Scholar] [CrossRef]
  21. Kutluay, S.; Sahin, O.; Ece, M.S. Fabrication and characterization of Fe3O4/perlite, Fe3O4/perlite@SiO2, and Fe3O4/perlite@SiO2@sulfanilamide magnetic nanomaterials. Appl. Phys. A Mater. Sci. Process. 2022, 128, 222. [Google Scholar] [CrossRef]
  22. Wu, Y.H.; Guo, Q.B.; Liu, H.; Wei, S.S.; Wang, L. Effect of Fe doping on the surface properties of ?-MnO2 nanomaterials and its decomposition of formaldehyde at room temperature. J. Environ. Chem. Eng. 2022, 10, 108277. [Google Scholar] [CrossRef]
  23. Eris, S.; Bashiri, H. Kinetic study of the adsorption of dyes onto activated carbon. Prog. React. Kinet. Mech. 2016, 41, 109–119. [Google Scholar] [CrossRef]
  24. Cavusoglu, H. Exploring the Role of pH on the Physical and Optoelectronic Attributes of Nanostructured NiO Thin Films. J. Nanoelectron. Optoelectron. 2019, 14, 645–652. [Google Scholar] [CrossRef]
  25. Dong, X.X.; Song, M.; Jin, B.S.; Zhou, Z.; Yang, X. The Synergy Effect of Ni-M (M = Mo, Fe, Co, Mn or Cr) Bicomponent Catalysts on Partial Methanation Coupling with Water Gas Shift under Low H2/CO Conditions. Catalysts 2017, 7, 51. [Google Scholar] [CrossRef]
  26. Balarak, D.; Mahvi, A.H.; Shim, M.J.; Lee, S.M. Adsorption of ciprofloxacin from aqueous solution onto synthesized NiO: Isotherm, kinetic and thermodynamic studies. Desalination Water Treat. 2021, 212, 390–400. [Google Scholar] [CrossRef]
  27. Li, H.X.; Xia, F.F.; Ma, C.Y.; Li, C.Y. Magnetic field-assisted electrodeposition of ZnCo2O4-rGo nanoelectrodes for enhanced supercapacitor performance. Chem. Eng. J. 2024; in press. [Google Scholar] [CrossRef]
  28. Pore, O.C.; Fulari, A.V.; Parale, V.G.; Park, H.H.; Shejwal, R.V.; Fulari, V.J.; Lohar, G.M. Facile hydrothermal synthesis of NiO/rGO nanocomposite electrodes for supercapacitor and nonenzymatic glucose biosensing application. J. Porous Mater. 2022, 29, 1991–2001. [Google Scholar] [CrossRef]
  29. Chen, P.; Richter, J.; Wang, G.; Li, D.Q.; Pietsch, T.; Ruck, M. Ionometallurgical Step-Electrodeposition of Zinc and Lead and its Application in a Cycling-Stable High-Voltage Zinc-Graphite Battery. Small 2021, 17, 2102058. [Google Scholar] [CrossRef]
  30. Al-Sehemi, A.G.; Al-Shihri, A.S.; Kalam, A.; Du, G.H.; Ahmad, T. Microwave synthesis, optical properties and surface area studies of NiO nanoparticles. J. Mol. Struct. 2014, 1058, 56–61. [Google Scholar] [CrossRef]
Figure 1. Preparation of MNN material.
Coatings 14 00739 g001
Figure 2. Adsorption process of MNN material.
Coatings 14 00739 g002
Figure 3. SEM images of the MNN composed of various Ni:Fe ratios: (a) 3:1, (b) 2:1, (c) 1:2, (d) Fe3O4 (e) NiO, and (f) cross-section SEM image.
Coatings 14 00739 g003aCoatings 14 00739 g003b
Figure 4. XRD pattern of MNN material: (a) before F adsorption; (b) following F adsorption.
Coatings 14 00739 g004
Figure 5. Microstructure of MNN material (Ni/Fe = 2:1): (a,b) TEM micrographs, (c,d) HRTEM images, (e) SAED pattern.
Coatings 14 00739 g005
Figure 6. Nitrogen adsorption test of MNN material with nickel–iron ratios of 2:1: (a) nitrogen adsorption–desorption isotherm, (b) corresponding BJH pore size distribution curve.
Coatings 14 00739 g006
Figure 7. Adsorption kinetics curve of MNN material for F.
Coatings 14 00739 g007
Figure 8. Impact of pH value on the adsorption of MNN material.
Coatings 14 00739 g008
Figure 9. Zeta potential of MNN materials at different pH values.
Coatings 14 00739 g009
Figure 10. Adsorption isotherm curve of MNN material for F.
Coatings 14 00739 g010
Figure 11. Adsorption curves of MNN material for F at different temperatures.
Coatings 14 00739 g011
Figure 12. Thermodynamic curves of the adsorption of F by MNN material.
Coatings 14 00739 g012
Table 1. Electrolyte composition for the preparation of MNN material.
Chemical ReagentsValue
Ni(NO3)2·6H2O (g·L−1)23.76–96.03
Fe(NO3)3·9(H2O) (g·L−1)66.6
HFM (g·L−1)15
H3BO3 (g·L−1)30
C12H25SO4Na (g·L−1)0.1
Table 2. Process parameters for preparation of MNN material.
ItemValue
Plating bath temperature (°C)55
Plating current density (A·dm−2)3
Stirring speed (r·min−1)800
Duty cycle (%)20
Activation time (min)30
pH4.0
Pulse frequency (Hz)500
Table 3. Kinetic model fitting of adsorption F by MNN material.
Ni/FePFOD ModelPSOK Model
qe/(mg·g−1)K1R2qe/(mg·g−1)K1R2
3:136.282.010.839440.130.0730.9396
2:127.361.190.918731.980.0700.9641
1:223.151.570.971926.640.0530.9862
Table 4. Langmuir and Freundlich model fitting for adsorption of F by MNN material.
Ni/FeLangmuir ModelFreundlich Model
Q/(mg·g−1)KLR2Kf/(mg·g−1)nR2
3:163.860.0620.97498.902.640.9521
2:151.140.0340.99565.122.130.9660
1:235.290.0200.98752.731.980.9807
Table 5. Fitting results of a thermodynamic model for FM composite adsorption of F.
Ni/Fe∆H0/(KJ·mol−1)∆S0/(J·mol−1·K−1)∆G0/(KJ·mol−1)
287.36 K296.36 K312.36 K
3:113.6751.06−0.46−1.15−1.68
2:126.3180.291.721.010.36
1:227.9381.862.611.840.99
Disclaimer/Publisher’s Note: The statements, opinions and data contained in all publications are solely those of the individual author(s) and contributor(s) and not of MDPI and/or the editor(s). MDPI and/or the editor(s) disclaim responsibility for any injury to people or property resulting from any ideas, methods, instructions or products referred to in the content.

