Article

Modeling for the Fabrication Process of a ϕ1185 mm C/C Composite Thermal Insulation Tube in an Isothermal Chemical Vapor Infiltration Reactor

1
School of Mechanical and Electrical Engineering, Guangdong University of Science and Technology, Dongguan 523083, China
2
School of Energy Science and Engineering, Central South University, Changsha 410083, China
3
Faculty of Digital of Science and Technology, Macau Millennium College, Macau 999078, China
*
Authors to whom correspondence should be addressed.
Coatings 2024, 14(6), 756; https://doi.org/10.3390/coatings14060756
Submission received: 9 May 2024 / Revised: 4 June 2024 / Accepted: 11 June 2024 / Published: 14 June 2024

Abstract

:
The large-size chemical vapor infiltration (CVI) of the carbon/carbon (C/C) composite thermal insulation tube is a key component for drawing large diameter monocrystalline silicon rods. However, the CVI densification process is complex, and the cost of experiment optimization is extremely high. In this article, a multi-physics coupling simulation model was established and validated based on COMSOL Multiphysics v.5.6 software to simulate the fabrication process of an isothermal CVI process for a Φ1185 mm C/C composite thermal insulation tube. The influence of process parameters on densification was explored, and a method of optimization was proposed. Our modeling results revealed that the deposition status in areas of low densification was effectively and significantly enhanced after process optimization. At the monitoring site, the carbon density was no less than 1.08 × 10³ kg·m−3, the average density of the composite-material thermal insulation tube improved by 5.7%, and the densification rate increased by 26.5%. This article effectively simulates the CVI process of large-sized C/C composite thermal insulation tubes, providing an important technical reference scheme for the preparation of large-sized C/C composite thermal insulation tubes.

1. Introduction

For monocrystalline silicon solar cells, more than half of the manufacturing cost is consumed in the production of silicon rods and wafers. The Czochralski method is a mature and widely used fabricating process for monocrystalline silicon rods. Currently, the pressing issue is how to improve the production efficiency of monocrystalline while simultaneously reducing the costs involved [1,2,3,4]. High-quality fine graphite materials are extensively utilized in the fabrication of thermal field components necessary for drawing monocrystalline; however, their performance is progressively falling short of meeting the demands of production. As silicon wafers increase in size, resulting in size expansion of thermal fields, it has been found that the adoption of the C/C composite for thermal field components [5] has obvious quality benefits and a good economic efficiency. Further enhancing the thermal field quality for specific shapes such as C/C composite thermal insulation tubes is a significant technical challenge presently confronting the industry [6,7,8].
CVI remains an important technology for the densification of carbon preforms and a crucial step in the preparation of high-density C/C composite materials. With the rapid progression of computer technology and the promotion of various simulation software applications, using computer simulation experiments to observe and compare mass production process experimental results has gradually become a research method with obvious advantages [9,10,11]. Initially, P McAllister et al. [12] investigated the chemical reaction kinetics, diffusion, and deposition infiltration behavior of propylene CVI, and established a two-dimensional simulation model of the CVI densification process. John Ibrahim et al. [13] simulated the fabrication of C/C composite aircraft brake discs, comprehensively considering the gas homogeneous reaction mechanism, surface heterogeneous reaction mechanism, hydrogen suppression effect, and pore model. Moreover, a model was established that included a flow field, temperature field, concentration field, deposition rate, and temporal variation law of pore. Tang et al. [14] expanded previous two-dimensional models and successfully established a transient three-dimensional simulation of the CVI process via coupling mass transfer, pore evolution, and multi-step chemical reaction models with two types of preforms for laboratory small-sized samples. Kim et al. [15] established a three-dimensional CVI model to simulate the densification of mass-produced large-size C/C composite materials, including fluid flow, diffusion, and continuous chemical reactions in porous media, providing details into the spatiotemporal evolution of preform density that cannot be observed experimentally. Numerous experimental and simulation results [16,17,18] have shown that parameters such as deposition temperature, gas flow, chamber pressure, and reaction furnace structure during the CVI densification process significantly impact the final density uniformity of C/C composite materials.
Currently, the vast majority of research on the densification of C/C composite materials in the CVI process focuses on small-size components. Studies on the densification of large-size C/C composite materials are scarce, with most being two-dimensional modeling and simulations. In the case of large-sized C/C composite components, the generation rate of pyrolytic carbon significantly surpasses the densification rate of the preform, resulting in preferential densification near the surface, leading to surface crust formation and the formation of low-density regions internally [19,20]. Consequently, there is an urgent need to investigate the densification behavior of large-sized C/C composite materials.
This article took a large-sized C/C composite thermal insulation tube in current industrial production as the research object. The parameters of dimensions were set as follows: an outer diameter of 1185 mm, an inner diameter of 1130 mm, a height of 560 mm, and a thickness of 55 mm. A three-dimensional multi-physics coupling model of the isothermal CVI densification process was established based on COMSOL Multiphysics software, and the effectiveness of CVI densification process modeling was verified. The effects of deposition temperature, gas supply pressure, and precursor gas flow rate on densification and its uniformity were investigated. Additionally, parameter optimization suggestions were proposed. This approach effectively saves time, reduces process costs, and has important practical significance for guiding industrial production.
The optimization of the large-sized CVI process is very important and time-consuming. This article focused on simulating a large-sized C/C composite thermal insulation tube CVI fabrication process. The dimensions are set at an outer diameter of 1185 mm, an inner diameter of 1130 mm, a height of 560 mm, and a thickness of 55 mm. A comprehensive three-dimensional multi-physics coupling model is developed using COMSOL to simulate the isothermal chemical vapor densification process. The accuracy of the model is confirmed through validation. The influence of deposition temperature, gas supply pressure, and precursor gas flow rate on densification and its uniformity are investigated at length. Based on the findings, optimization suggestions are provided. This approach facilitates time and cost savings of mass production process optimization, offering valuable insights for industrial production guidance.

2. Simulation Model and Verification

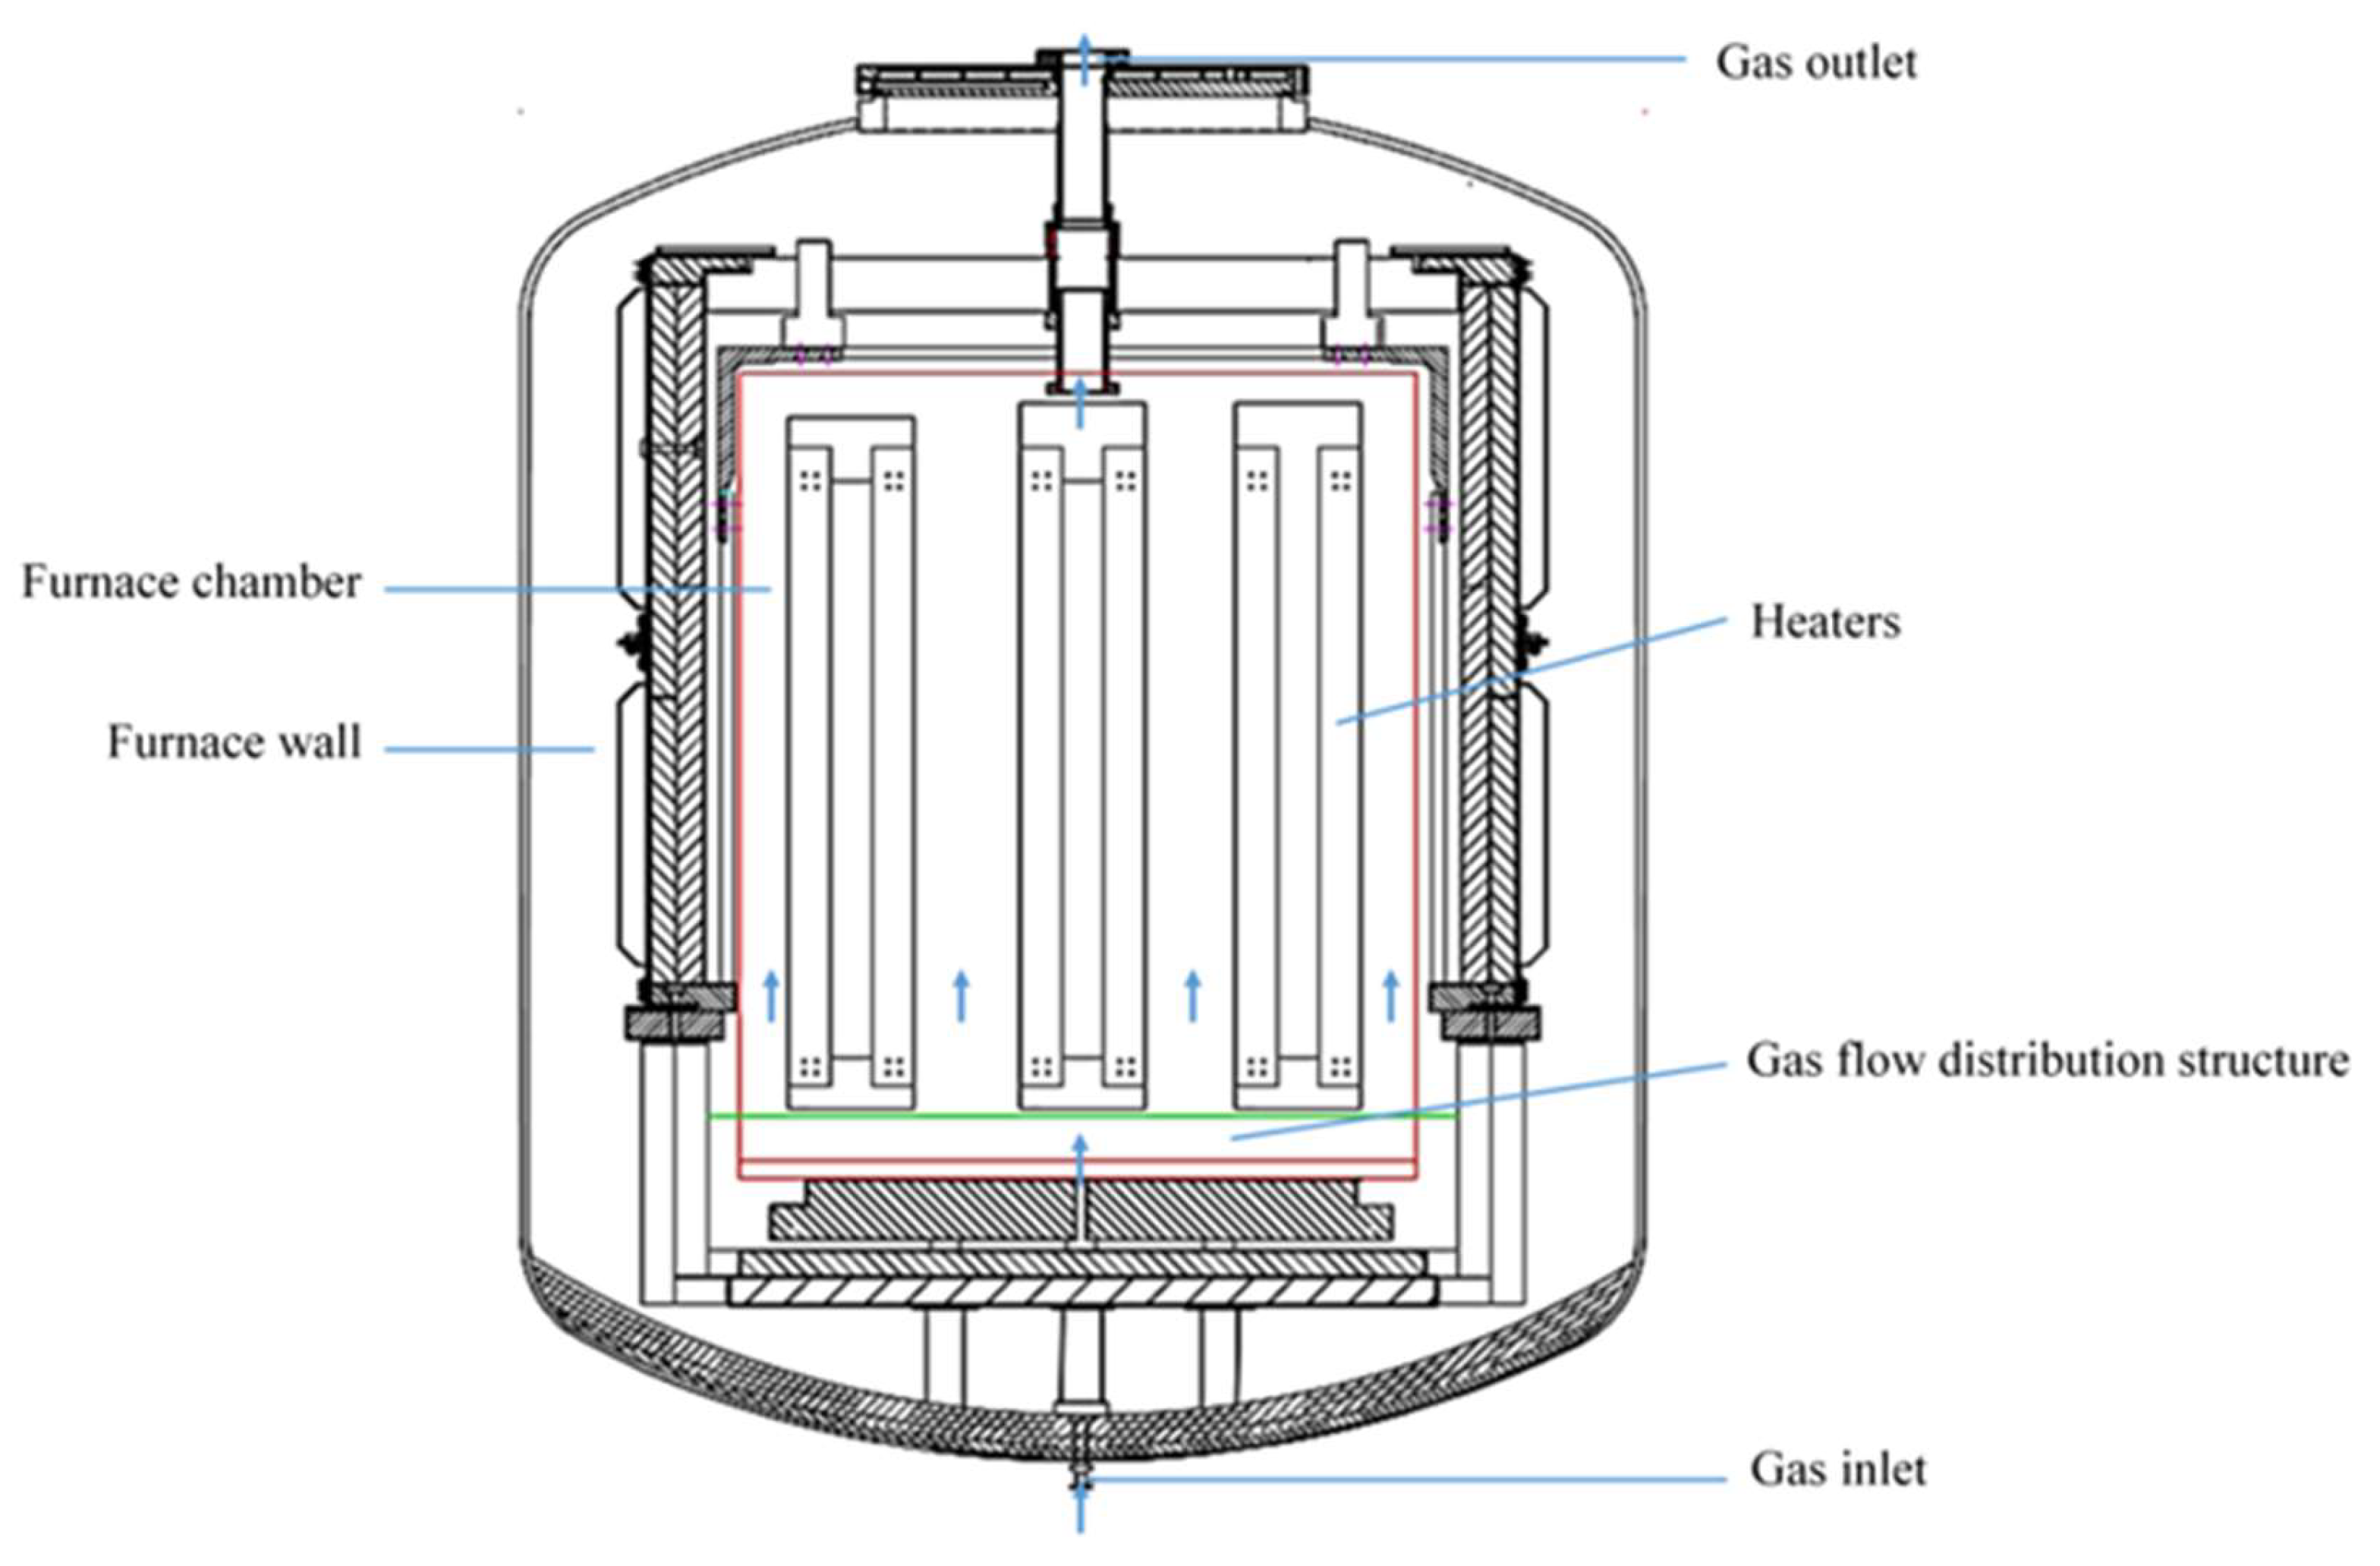
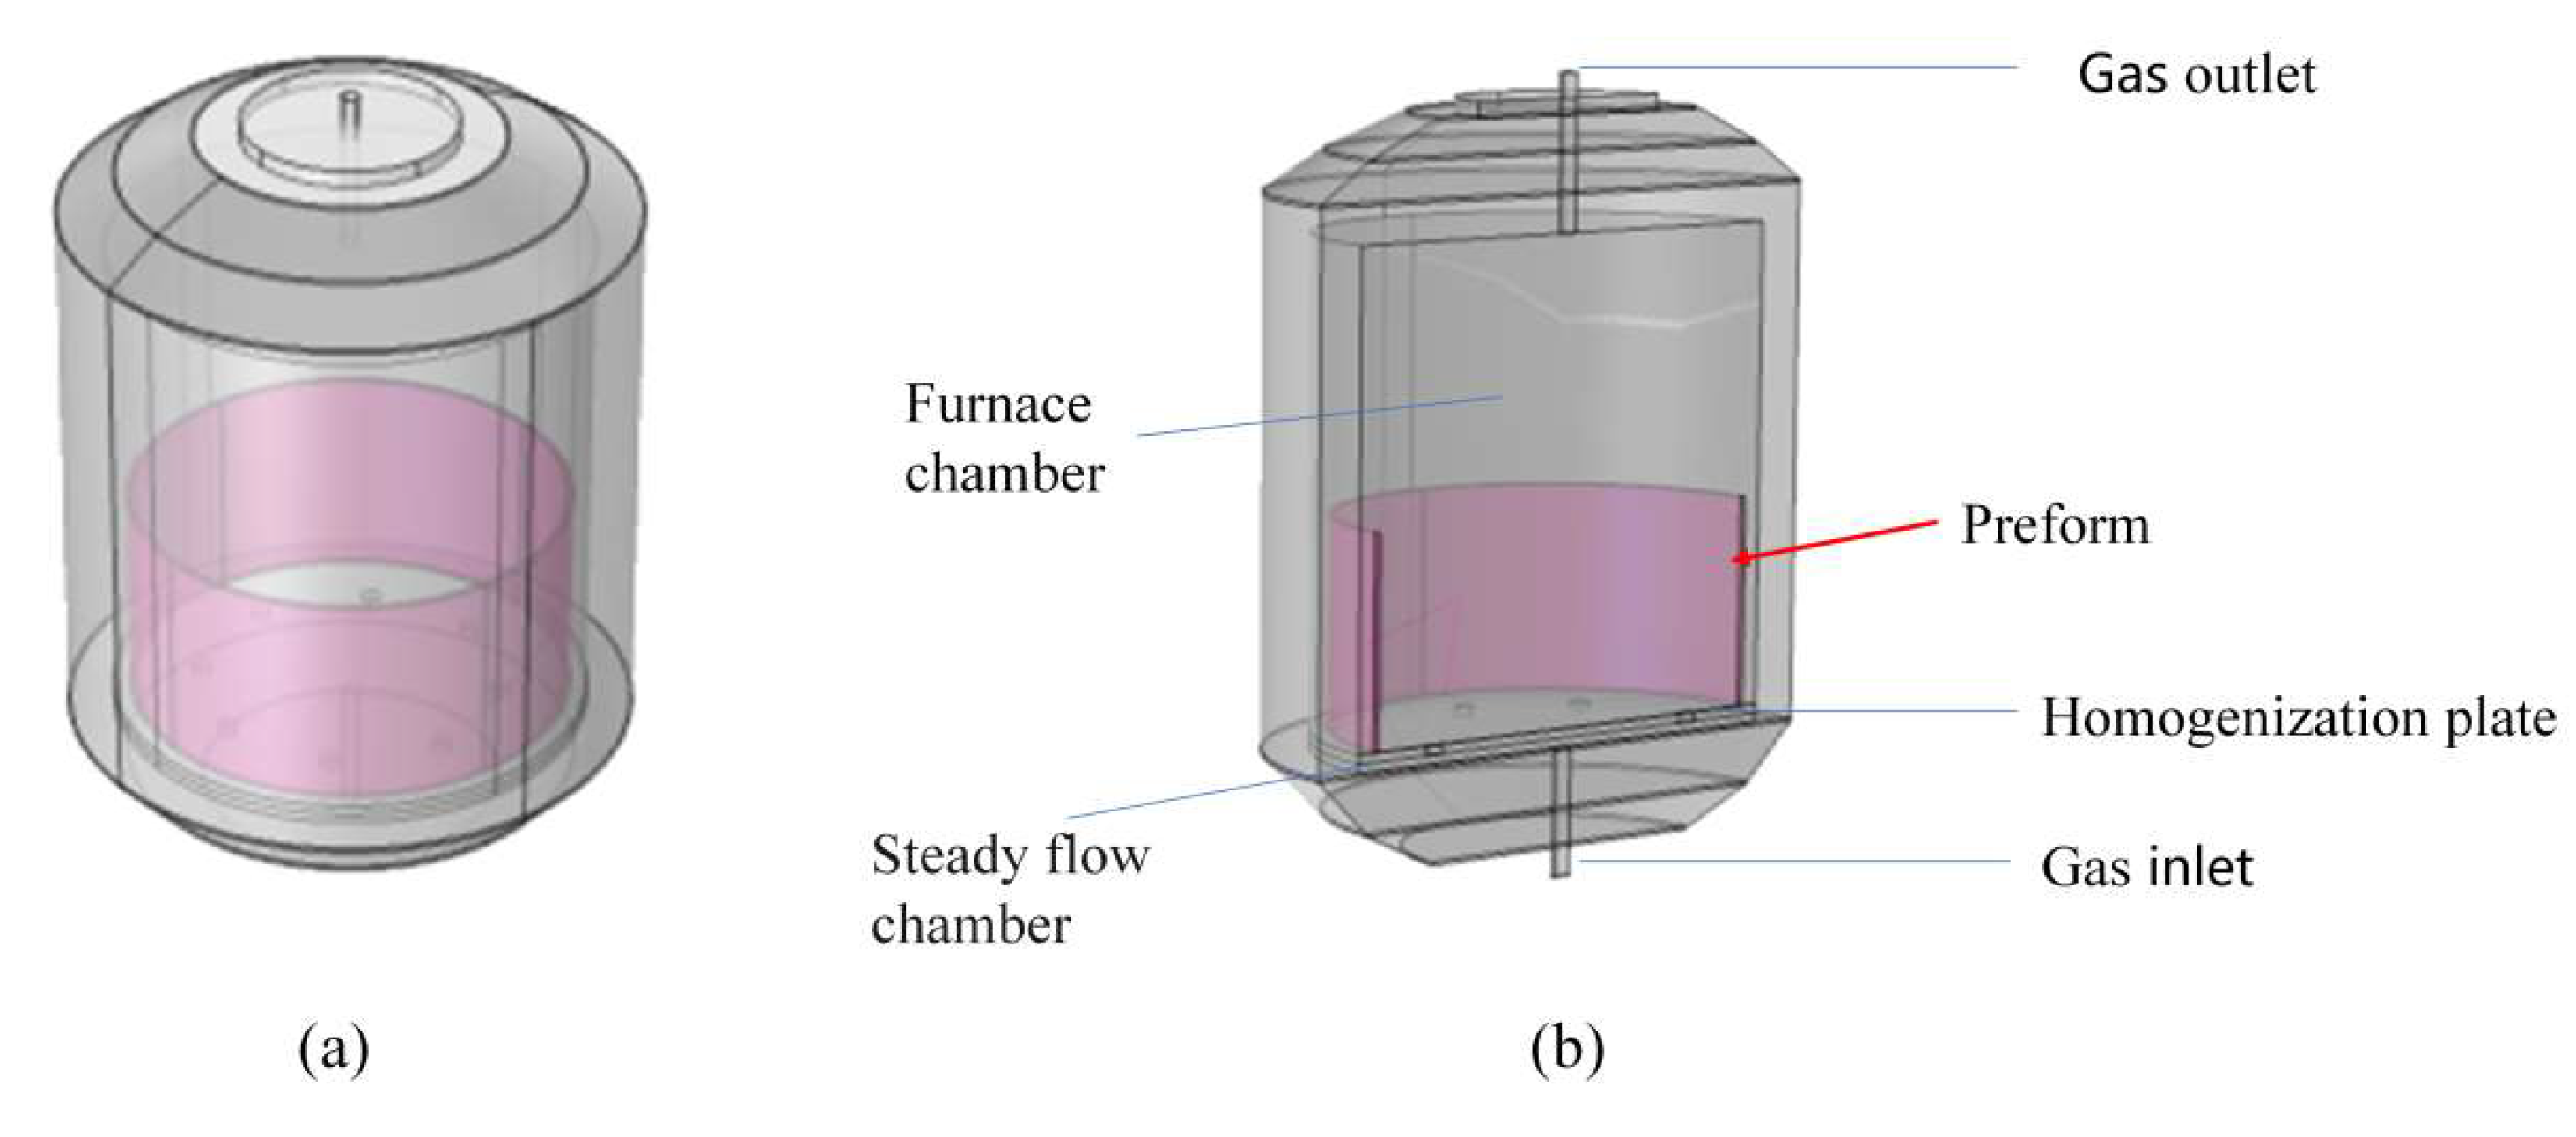
2.1. Geometric Modeling

Figure 1 depicts a schematic diagram of an industrial CVI furnace capable of fabricating a full series of composite-material thermal field components, spanning from 23 to 36 inches in size. Due to three-dimensional modeling being utilized to simulate the CVI densification process in this study, on the premise of ensuring compliance with the actual fabrication process, the furnace was simplified into five zones: the gas inlet area, the stable flow chamber, the uniform flow plate, the furnace chamber, and the gas outlet area. The heater was characterized by multi-physics boundary condition settings, as illustrated in Figure 2a. To reduce the computational costs of the simulation, only half of the three-dimensional model, depicted in Figure 2b, was used in the actual simulation, with the colored area indicating the thermal insulation tube.

2.2. Multi-Physics Field Model

The CVI densification process of the C/C composite thermal insulation tube involves the interaction of multiple physical fields, including chemical reaction fields, thermal flow fields, and material transport fields. At the same time, it is essential to couple the pore evolution process of the preform with these physical fields [16,17,18,19,20]. CVI deposition employed methane (CH4) as the carbon source gas and nitrogen (N2) for dilution and protection [21,22]. The simplified chemical reaction module was established based on the equations proposed by Li et al. [23,24], and the chemical reaction kinetics process is illustrated in Figure 3.
It is assumed that the reaction gas is an incompressible ideal gas, the C/C composite-material thermal insulation tube is an isotropic body, the gas pyrolysis reactions are all irreversible first-order reactions, and the gas inlet is assumed to be fully developed laminar flow.
Based on the above assumptions, the basic equations of mass conservation, energy conservation, and momentum conservation expressed in the simulation model are as follows:
(1)
Flow equation
Based on the principle of conservation of momentum, the Navier–Stokes equation and the continuity equation are established for the gas in the free-flow region [25,26]:
ρ u t + ρ ( u ) u = [ p I + μ ( u + ( u ) T ) 2 3 μ ( u ) I
ρ t + ( ρ u ) = 0
where ρ is the fluid density; u is the velocity vector of the fluid; μ is the dynamic viscosity of the fluid; and I is the unit vector.
The object of this study, the deposition preform of the composite-material thermal insulation tube, is a porous medium, so Brinkman’s and continuity equations are established for the flow of gases within the walls of the composite thermal insulation tube [25,26].
1 ε p ρ u t + 1 ε p 2 ρ ( u ) u = [ p I + μ 1 ε p ( u + ( u ) T ) 2 3 μ 1 ε p ( u ) I ] - ( μ κ + Q ε p 2 ) u
ρ t + ( ρ u ) = Q
where ε p is the porosity of the preform; κ is the permeability of the preform; and Q is the mass change of the fluid during the deposition of the C/C composite-material thermal insulation tube.
(2)
Heat transfer equation
The isothermal CVI process is commonly utilized in the industry. Assuming that the furnace wall deposition temperature during the process is T, as thermal radiation and pyrolysis reaction heat minimally affect the temperature distribution [27,28,29], only heat conduction and heat convection through the medium of precursor gas and preform are considered for internal heat transfer. Following the principle of energy conservation, the heat transfer equation for the free-flow region within the deposition furnace and the thermal insulation tube preform can be expressed as [27]
ρ C p T t + ρ C p u T + ( k T ) = 0
where ρ is the density of the precursor gas or preform, Cp is the specific heat capacity of the precursor gas or preform, and k is the thermal conductivity of the precursor gas or preform.
(3)
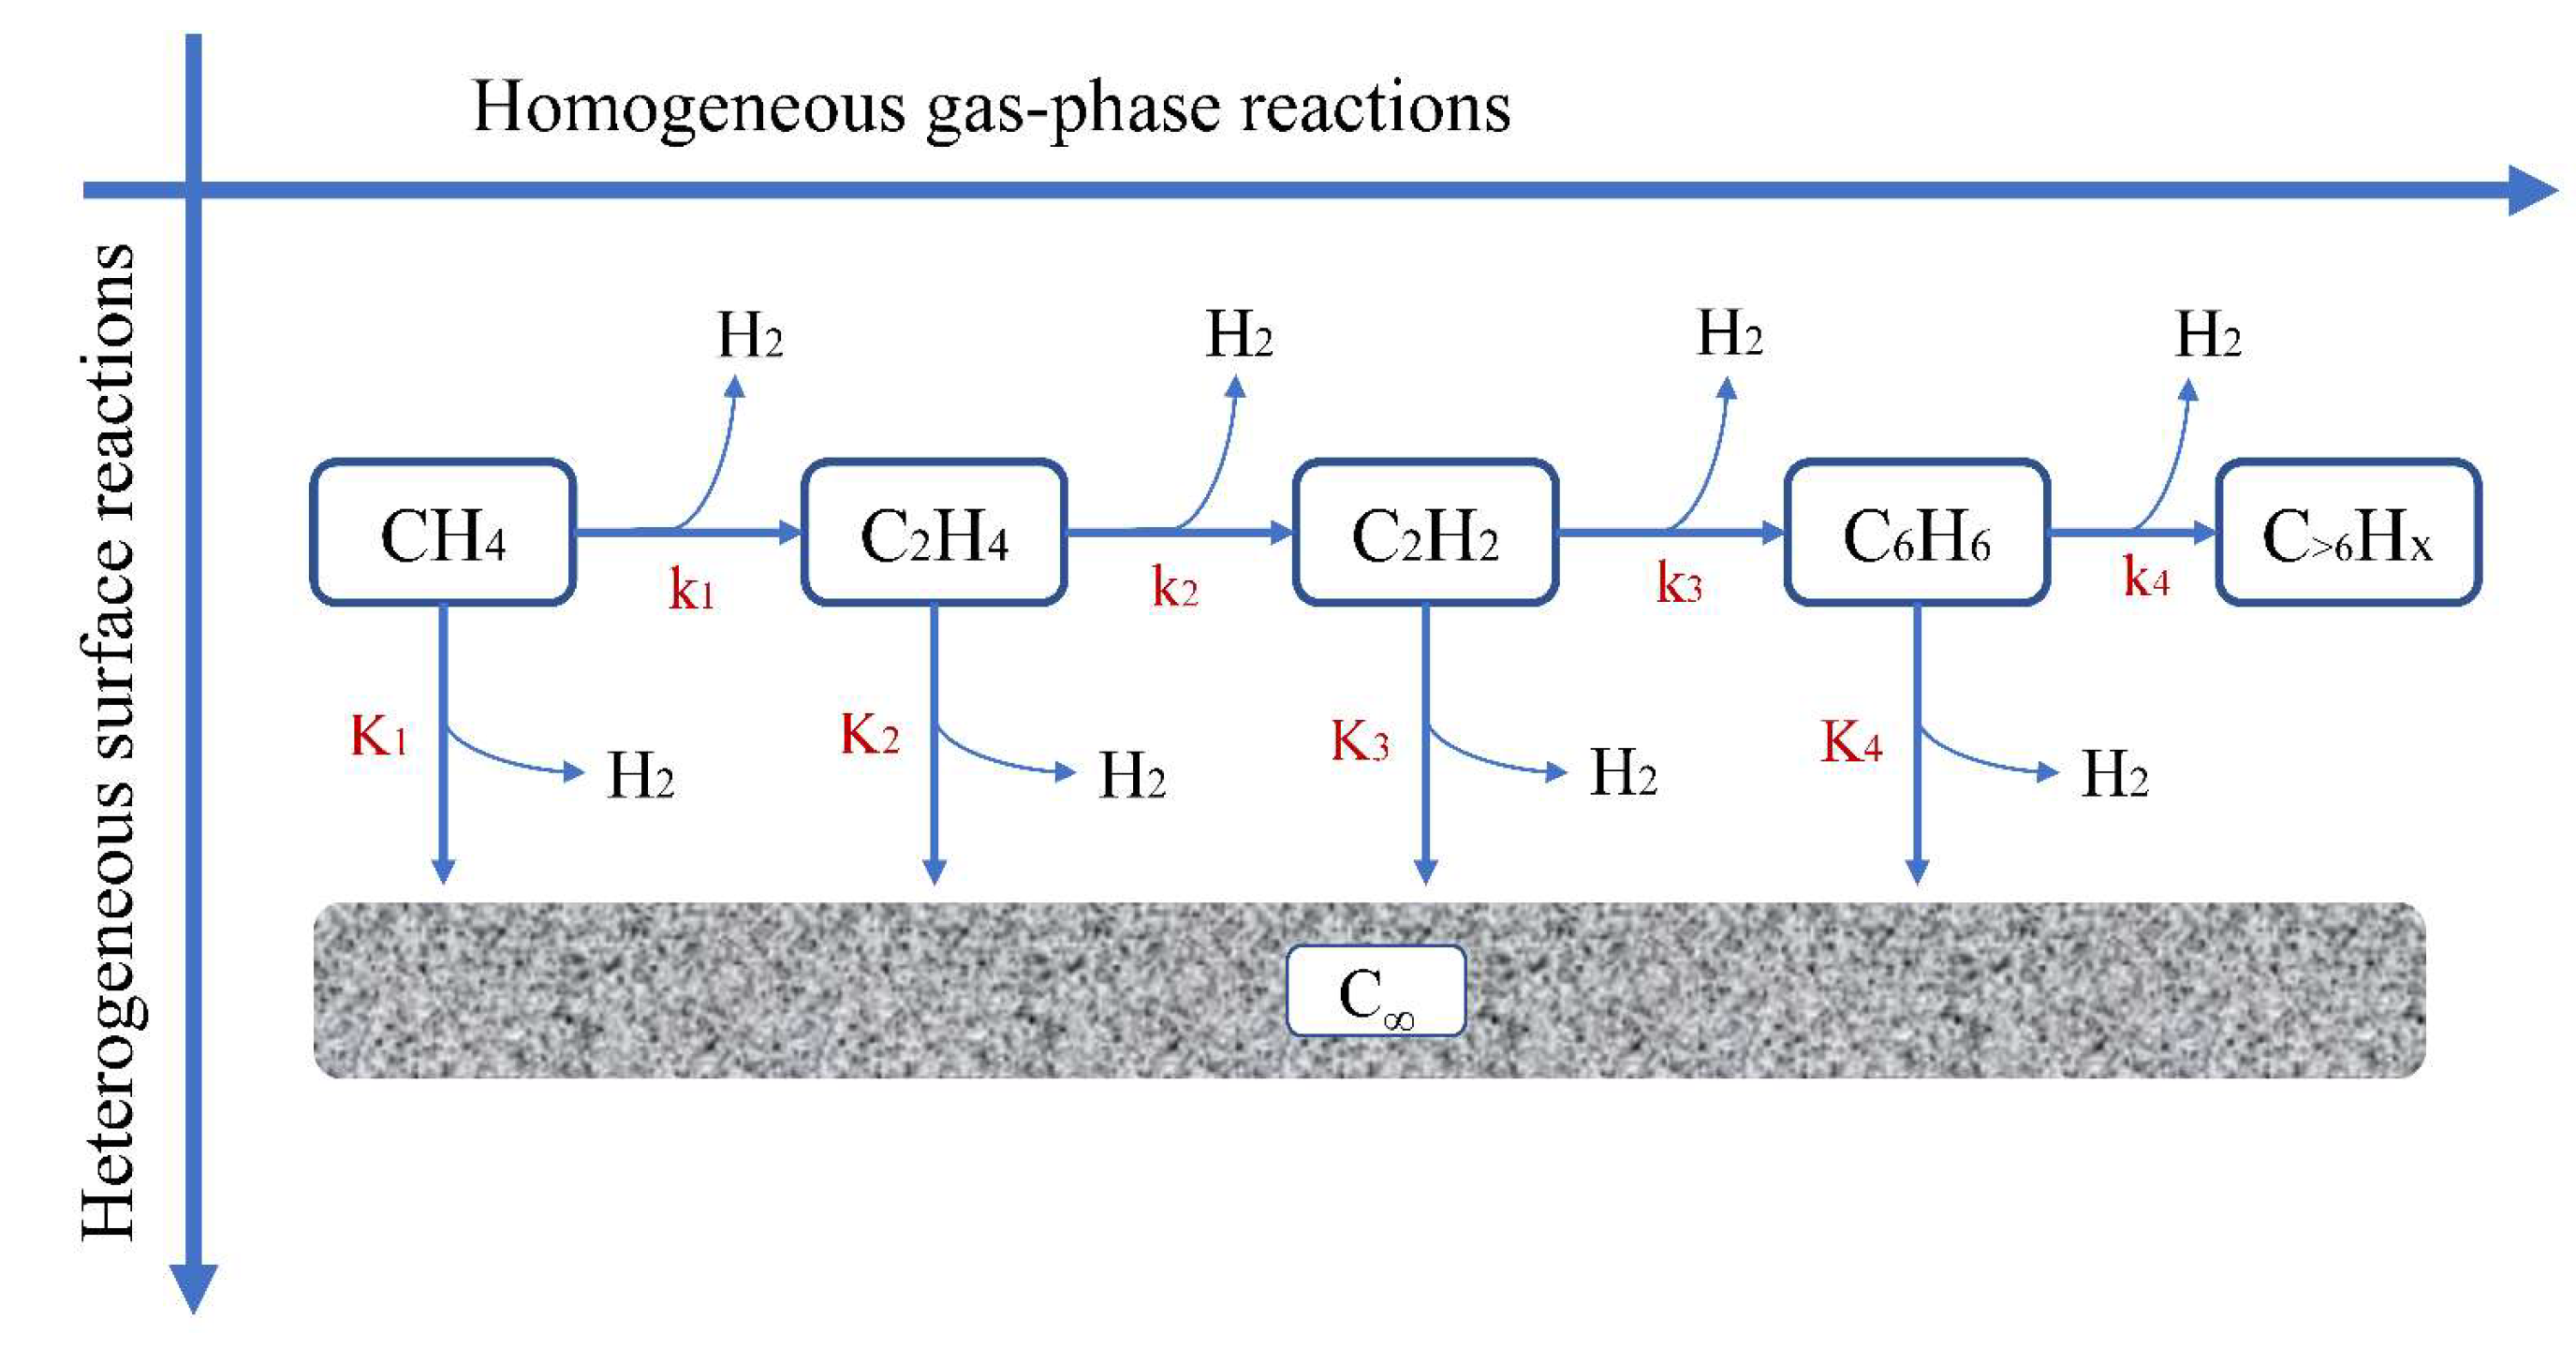
Mass transfer function
Based on the principle of mass conservation, the concentration partial differential equation for the free-flowing region inside the deposition furnace and within the thermal insulation tube preform can be established [27] as follows:
c i t + ( D i M c i ) + u c i = R i 1
c i t + ( D i e f f c i ) = R i 2
where c i is the concentration of each component gas; D i M is the Fick diffusion coefficient of various gases in the free-flow region; R i 1 and R i 2 are the reaction rates of various substances in the free-flow region of the deposition furnace and the porous media region of the composite-material thermal insulation tube, respectively. The expressions are shown in Table 1.
In summary, the model required in the complete CVI densification process is defined.
Reasonable boundary conditions are beneficial to the simulation model solution, and the boundary conditions and initial values of this simulation model are as follows:
u = u 0 ,   at   gas   inlet T W = T d e p o s i t i o n n ( k T ) = 0 ,   at   gas   outelt c = c 0 , c i = 0 ,   i = 2 , 3 , 4 , 5   ,   at   gas   inlet n ( D i c i ) = 0 ,   i = 1 , 2 , 3 , 4 , 5   ,   at   gas   outlet ρ | t = 0 = ρ 0 ε | t = 0 = ε 0
The preform porosity and density can be expressed by the following equations [31]:
ε t = M C R C ρ C
  ρ t = M C R C
    R C = + S v ( 2 K 2 c 2 + 2 K 3 c 3 + 6 K 4 c 4 )
where R C is the deposition rate of pyrolytic carbon, S V is the area-to-volume ratio of pores within the preform, M C is the molar mass of pyrolytic carbon, and ρ C is the density of pyrolytic carbon. The area-to-volume ratio model of the pores within the preform is adopted from the multi-deformed pore carbon fiber model [31]:
S v = 2 r f [ ( 2 ε 0 ) ( ε ε 0 ) ( ε ε 0 ) 2 ]
where r f is the carbon fiber radius, ε 0 is the initial porosity of the preform, and ε is the porosity of the thermal insulation tube at different times and locations.

2.3. Simulation Model Validation

Repeated comparisons were made using reference [14] as the validation target. To ensure accuracy, the simulation parameters were set to be identical to the experimental conditions. The dimensions of the two preforms mentioned in reference [14] were 36 mm (length) × 46 mm (width) × 58 mm (height). The densification process followed the isothermal CVI method, where methane served as the precursor gas, the deposition temperature was 1343 K, the pressure was 30 kPa, and the densification duration was 120 h. The simulation and experimental results are illustrated in Figure 4. As shown in Figure 4, the simulation results align with the data reported in reference [14], demonstrating consistent trends. The mean errors between the dense experimental values and their corresponding simulation values for the two preforms were 0.0158 g·cm−3 and 0.0357 g·cm−3, with root mean square errors of 4.94% and 3.71%, respectively. These errors fall within an acceptable range, thereby demonstrating the effectiveness of the simulation model.

3. Results and Discussion

Based on the validated simulation model, this article mainly investigates the densification process of a Φ1185 mm C/C composite thermal insulation tube. The emphasis was placed on exploring the impact of process parameters and deposition furnace structural parameters on densification results. The key parameters of the initial CVI process included a deposition temperature of 1180 K, a gas supply pressure of 0.1 MPa, a precursor gas flow rate of 85 L·min−1, and a densification duration of 100 h.

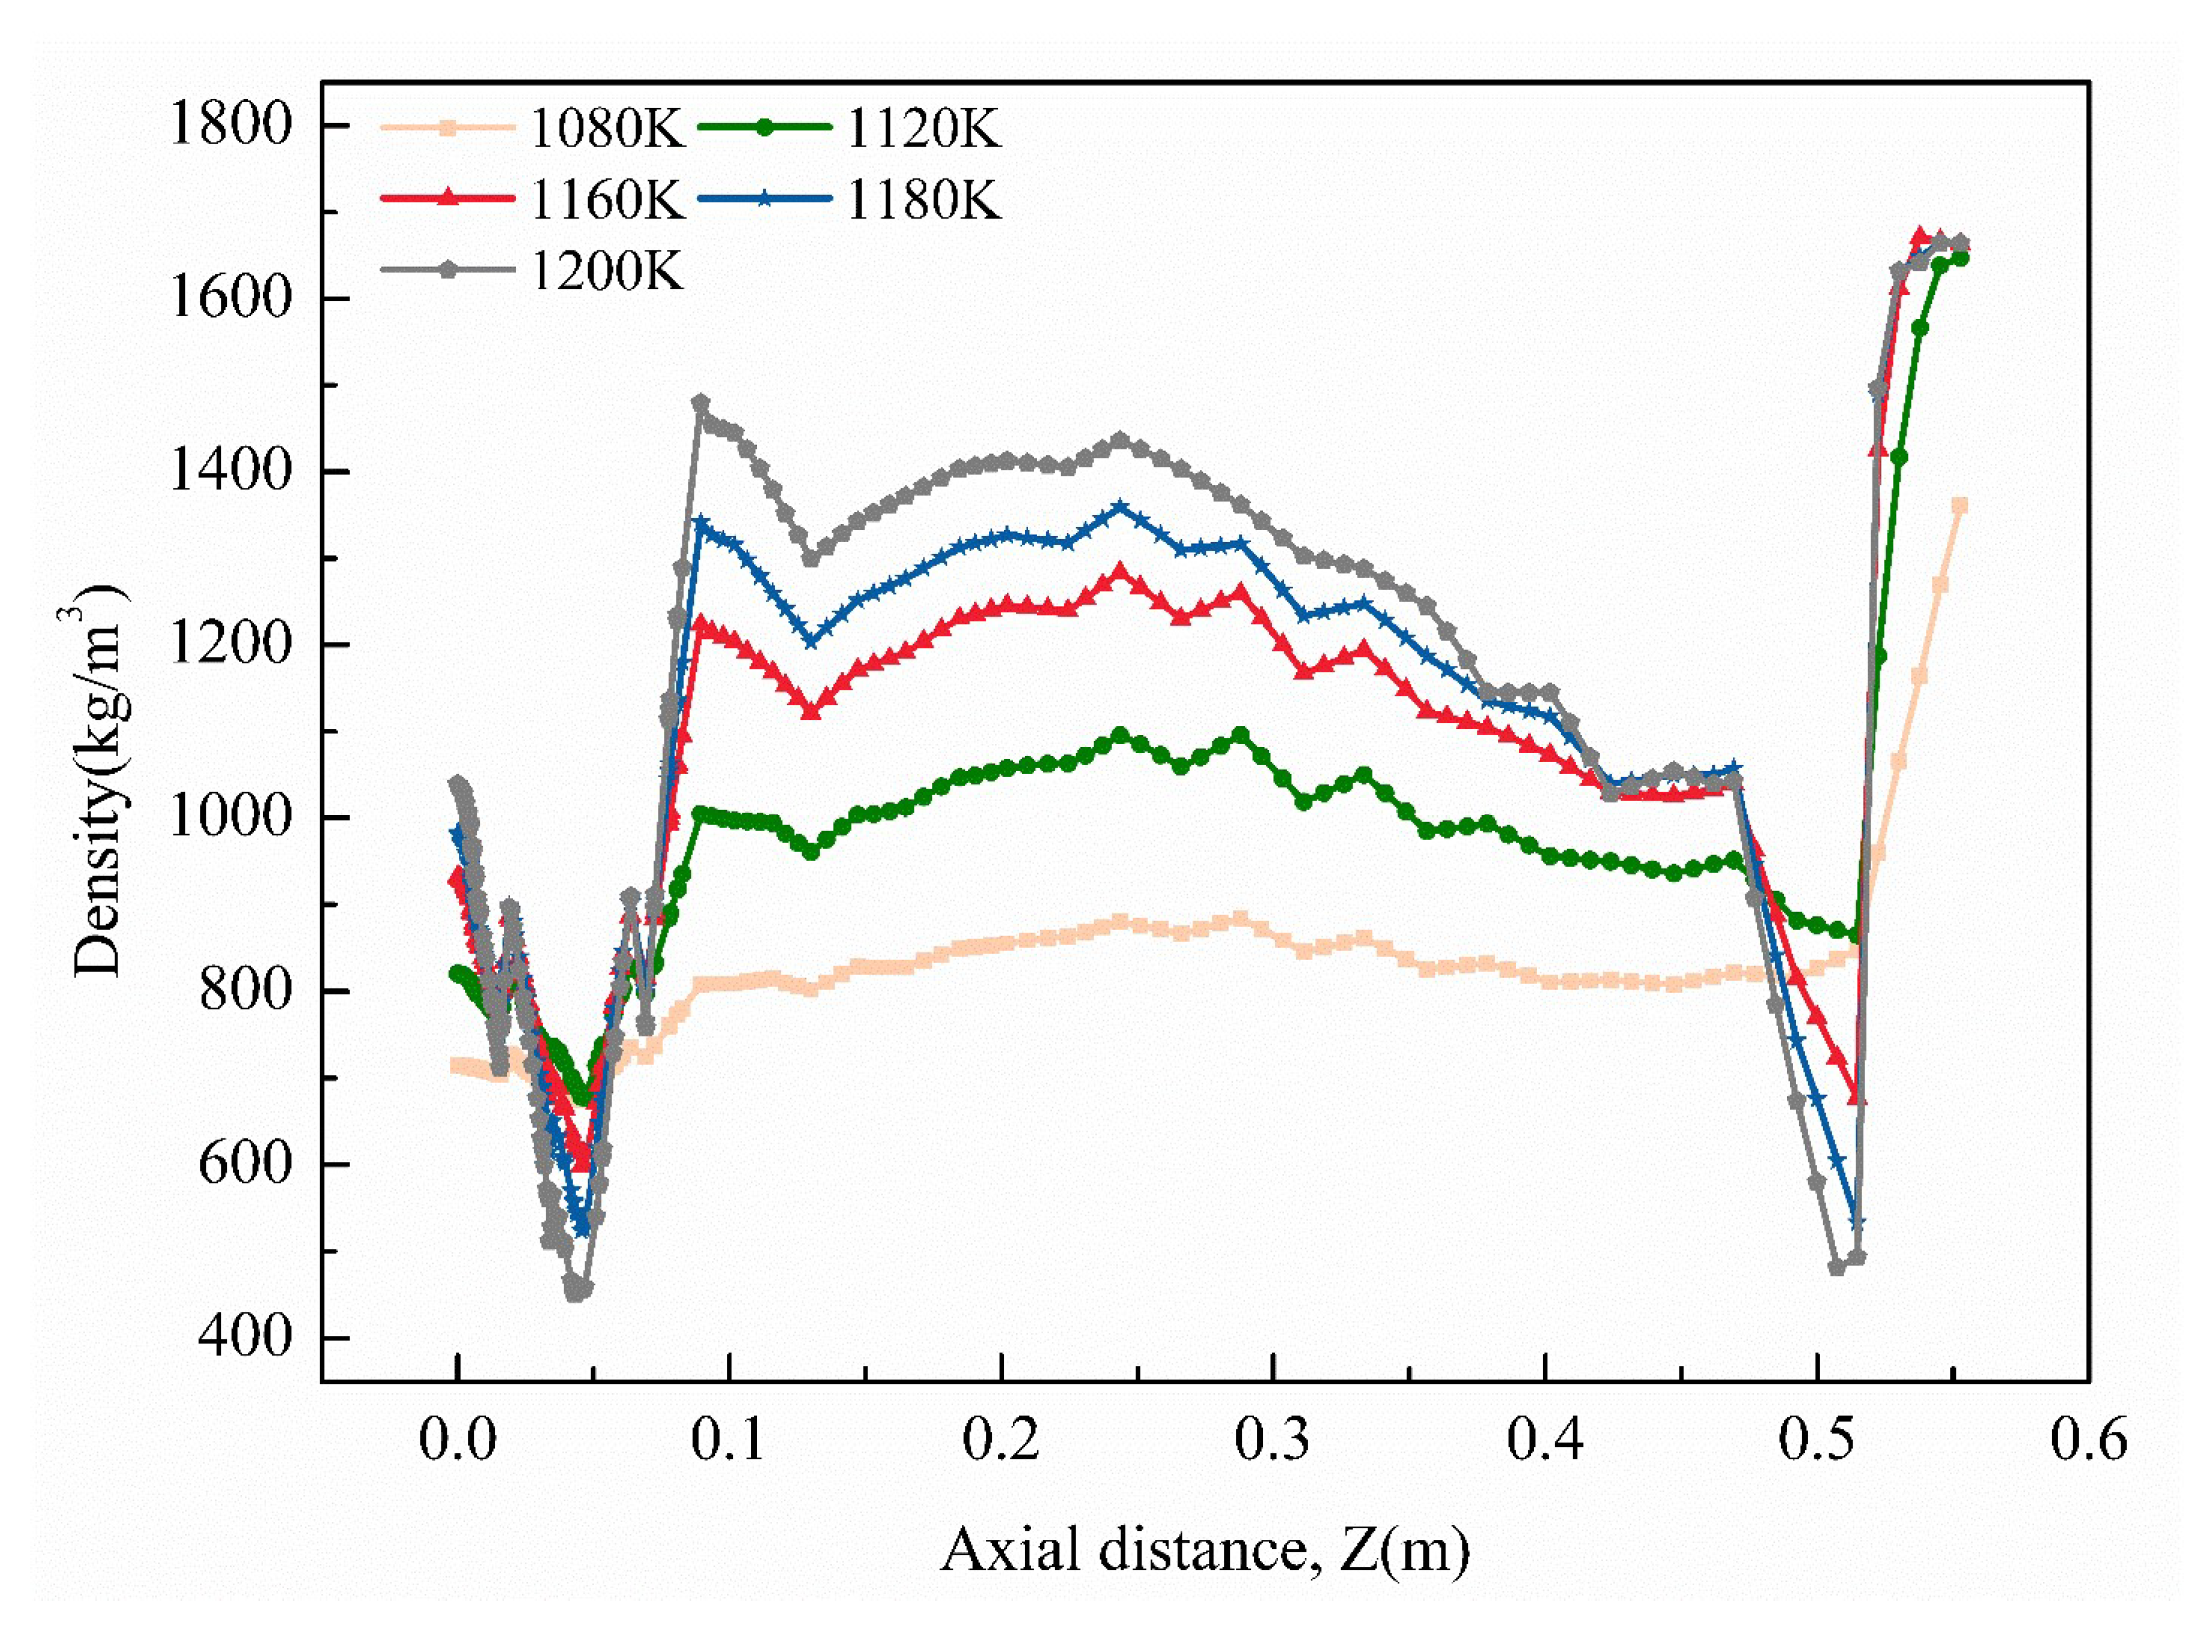
3.1. Determination of Deposition Temperature

The deposition temperature is the most sensitive process parameter in CVI densification. Temperature fluctuations alter molecular collision rates, thereby impacting chemical reaction rates. As temperature rises, densification increases obviously, with the density gradient becoming more significant. As shown in Figure 5, the temperature increases from 1080 K to 1200 K, the average density of the thermal insulation tube from 0.856 × 10³ kg·m−3 to 1.26 × 10³ kg·m−3, and the densification rate significantly increases from 1.30 × 10⁻³ kg·m−3·s−1 to 2.20 × 10⁻³ kg·m−3·s−1. At a deposition temperature of 1180 K, the densification rate of the thermal insulation tube is the highest, which is 2.35 × 10⁻³ kg·m−3·s−1; further increases in temperature result in a slight decline in the densification rate. This means that there is a need to keep the deposition temperature within a reasonable range, rather than pushing it to its upper limit. After densification for 100 h, the density changes at the monitoring site are evident, as depicted in Figure 6. As the deposition temperature rises, the density also increases. Specifically, the density significantly increases on the Z-axis (height direction) and ranges from 0.089 m to 0.47 m; this is accompanied by an increase in density non-uniformity. Therefore, suitable deposition temperatures should be reasonably selected for different densification steps. Excessively high temperatures can cause premature pore closure on the product’s surface, whereas overly low temperatures can extend fabrication time and increase costs.

3.2. Effect of Gas Pressure

Nitrogen pressure influences the diffusion coefficient of reaction gases during the densification process. Figure 7 illustrates the impact of gas pressure on the average density and densification rate. It could be observed that gas pressure has a lower effect on the average density of the thermal insulation tube, with the average density change ranging from 1.17 × 10³ kg·m−3 to 1.24 × 10³ kg·m−3 after 100 h of densification. The densification rate decreases with increasing pressure, ranging from 2.21 × 10⁻³ kg·m−3·s−1 to 2.39 × 10⁻³ kg·m−3·s−1. Pressure is inversely proportional to the diffusion coefficient.
As pressure decreases, the gas diffusion coefficient increases relatively, leading to an increase in the duration of gas diffusion into the thermal insulation tube, ultimately reducing the concentration gradient and density gradient inside the thermal insulation tube. Figure 8 depicts the density changes at the monitoring site, revealing that adjustments in gas pressure have a lower effect on the density inside the thermal insulation tube. At a gas pressure of 0.05 MPa, density uniformity is superior, benefiting subsequent process regulations.

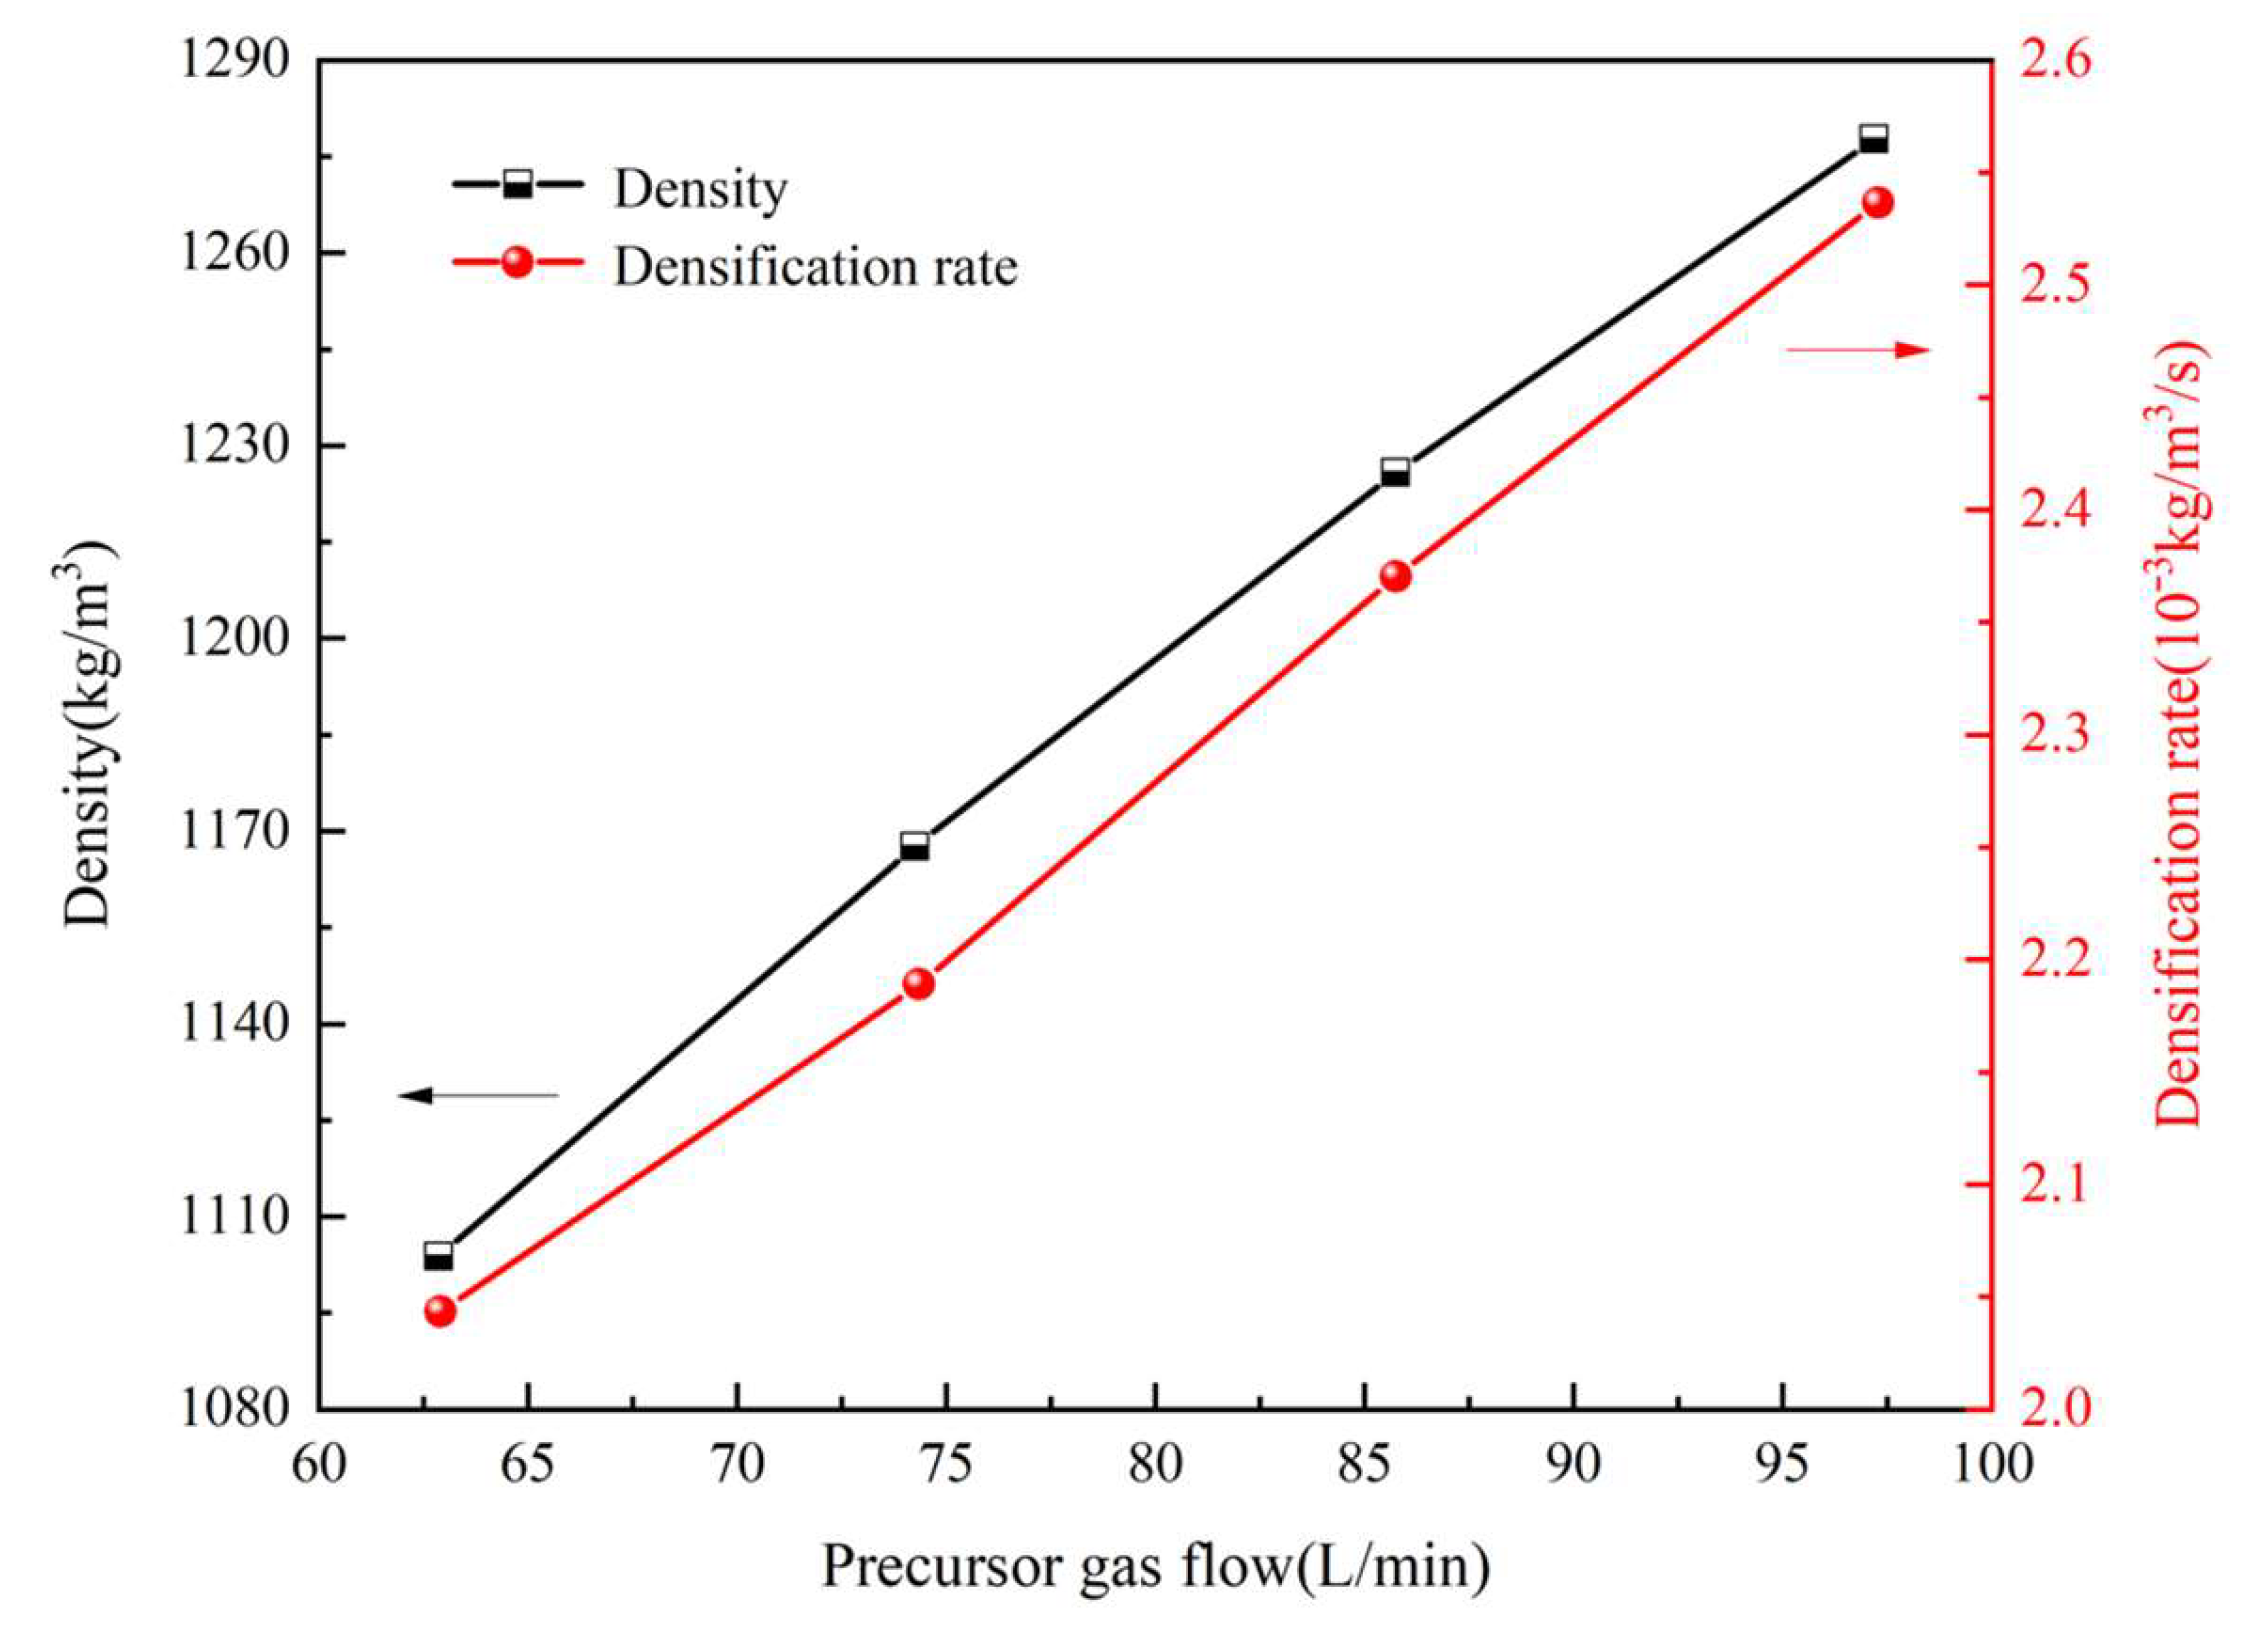
3.3. Influence of Precursor Gas Flow Rate

Methane was used as the precursor gas, and its flow rate variations significantly impacted the densification effect of the thermal insulation tube. With changes in the flow rate, the inlet flow rate also varied accordingly. As depicted in Figure 9, it could be observed that both the average density and densification rate of the thermal insulation tube rise with an increase in the precursor gas flow rate. While the average density experiences slight fluctuations, ranging from 1.103 × 10³ kg·m−3 to 1.277 × 10³ kg·m−3, the densification rate shows a notable increase, ranging from 1.99 × 10⁻³ kg·m−3·s−1 to 2.53 × 10⁻³ kg·m−3·s−1.
Uniform and dense C/C composite materials are a crucial target of the CVI process. Figure 10 illustrates the density variations at the monitoring site. It could be observed that as the flow rate was increased, the uniformity of density within the thermal insulation tube improved. At lower flow rates, the flow rate in the inlet region is small, with mass transfer primarily governed by diffusion. However, with further increments in the flow rate, both the convection mode and diffusion mode collectively regulate the mass transfer of precursor. As the flow rate rises, the flow velocity in the free-flow region increases, leading to a more obvious contribution of material transport using convection mode. Hence, there is a certain benefit when gas is consumed within the thermal insulation tube, when the flow rate is high.

3.4. Synergistic Adjustment and Optimization of the Process

The process parameters were synergistically adjusted within a deposition temperature ranging from 1120 K to 1180 K, gas pressure from 0.05 MPa to 0.1 MPa, and methane flow rates from 75 L·min−1 to 95 L·min−1. The optimized simulation data are shown in Table 2.
By integrating the three factors, which comprised average density, densification rate, and uniformity, the optimal process parameters are recommended to be used within the following ranges: a deposition temperature of 1160 K to 1180 K, gas pressure of 0.05 MPa to 0.1 MPa, and methane flow rate of 85 L·min−1 to 95 L·min−1.
After simulation optimization, the optimized objectives proposed in this article can be achieved within the optimal range of process parameters. Utilizing lower deposition temperatures and gas pressures poses a benefit to the uniformity of density inside the thermal insulation tube. While maintaining the average density and densification rate, the uniformity of the monitoring site in the Z-axis direction of the thermal insulation tube ranges between 87.9% and 92.5%, surpassing the 87.1% value of the baseline process.
To facilitate a comparison of the influence patterns on deposition density uniformity, the concept of uniformity α was introduced for the selected monitoring sites [31]:
α = ( 1 n max n min 2 n ave ) × 100 %
where n max , n min , and n ave represent the maximum density, minimum density, and average density at the monitoring site, respectively. For data analysis, effective data were collected within the range from Z = 0.089 m to Z = 0.47 m.

4. Conclusions

(1)
A multi-physics field coupling simulation model was established for the isothermal CVI process of a large-sized C/C composite thermal insulation tube, including parameters such as convection, heat conduction, diffusion, deposition reaction, and pore evolution. The densification behavior of the large-sized C/C composite during the CVI process was effectively predicted, and the process parameters were optimized.
(2)
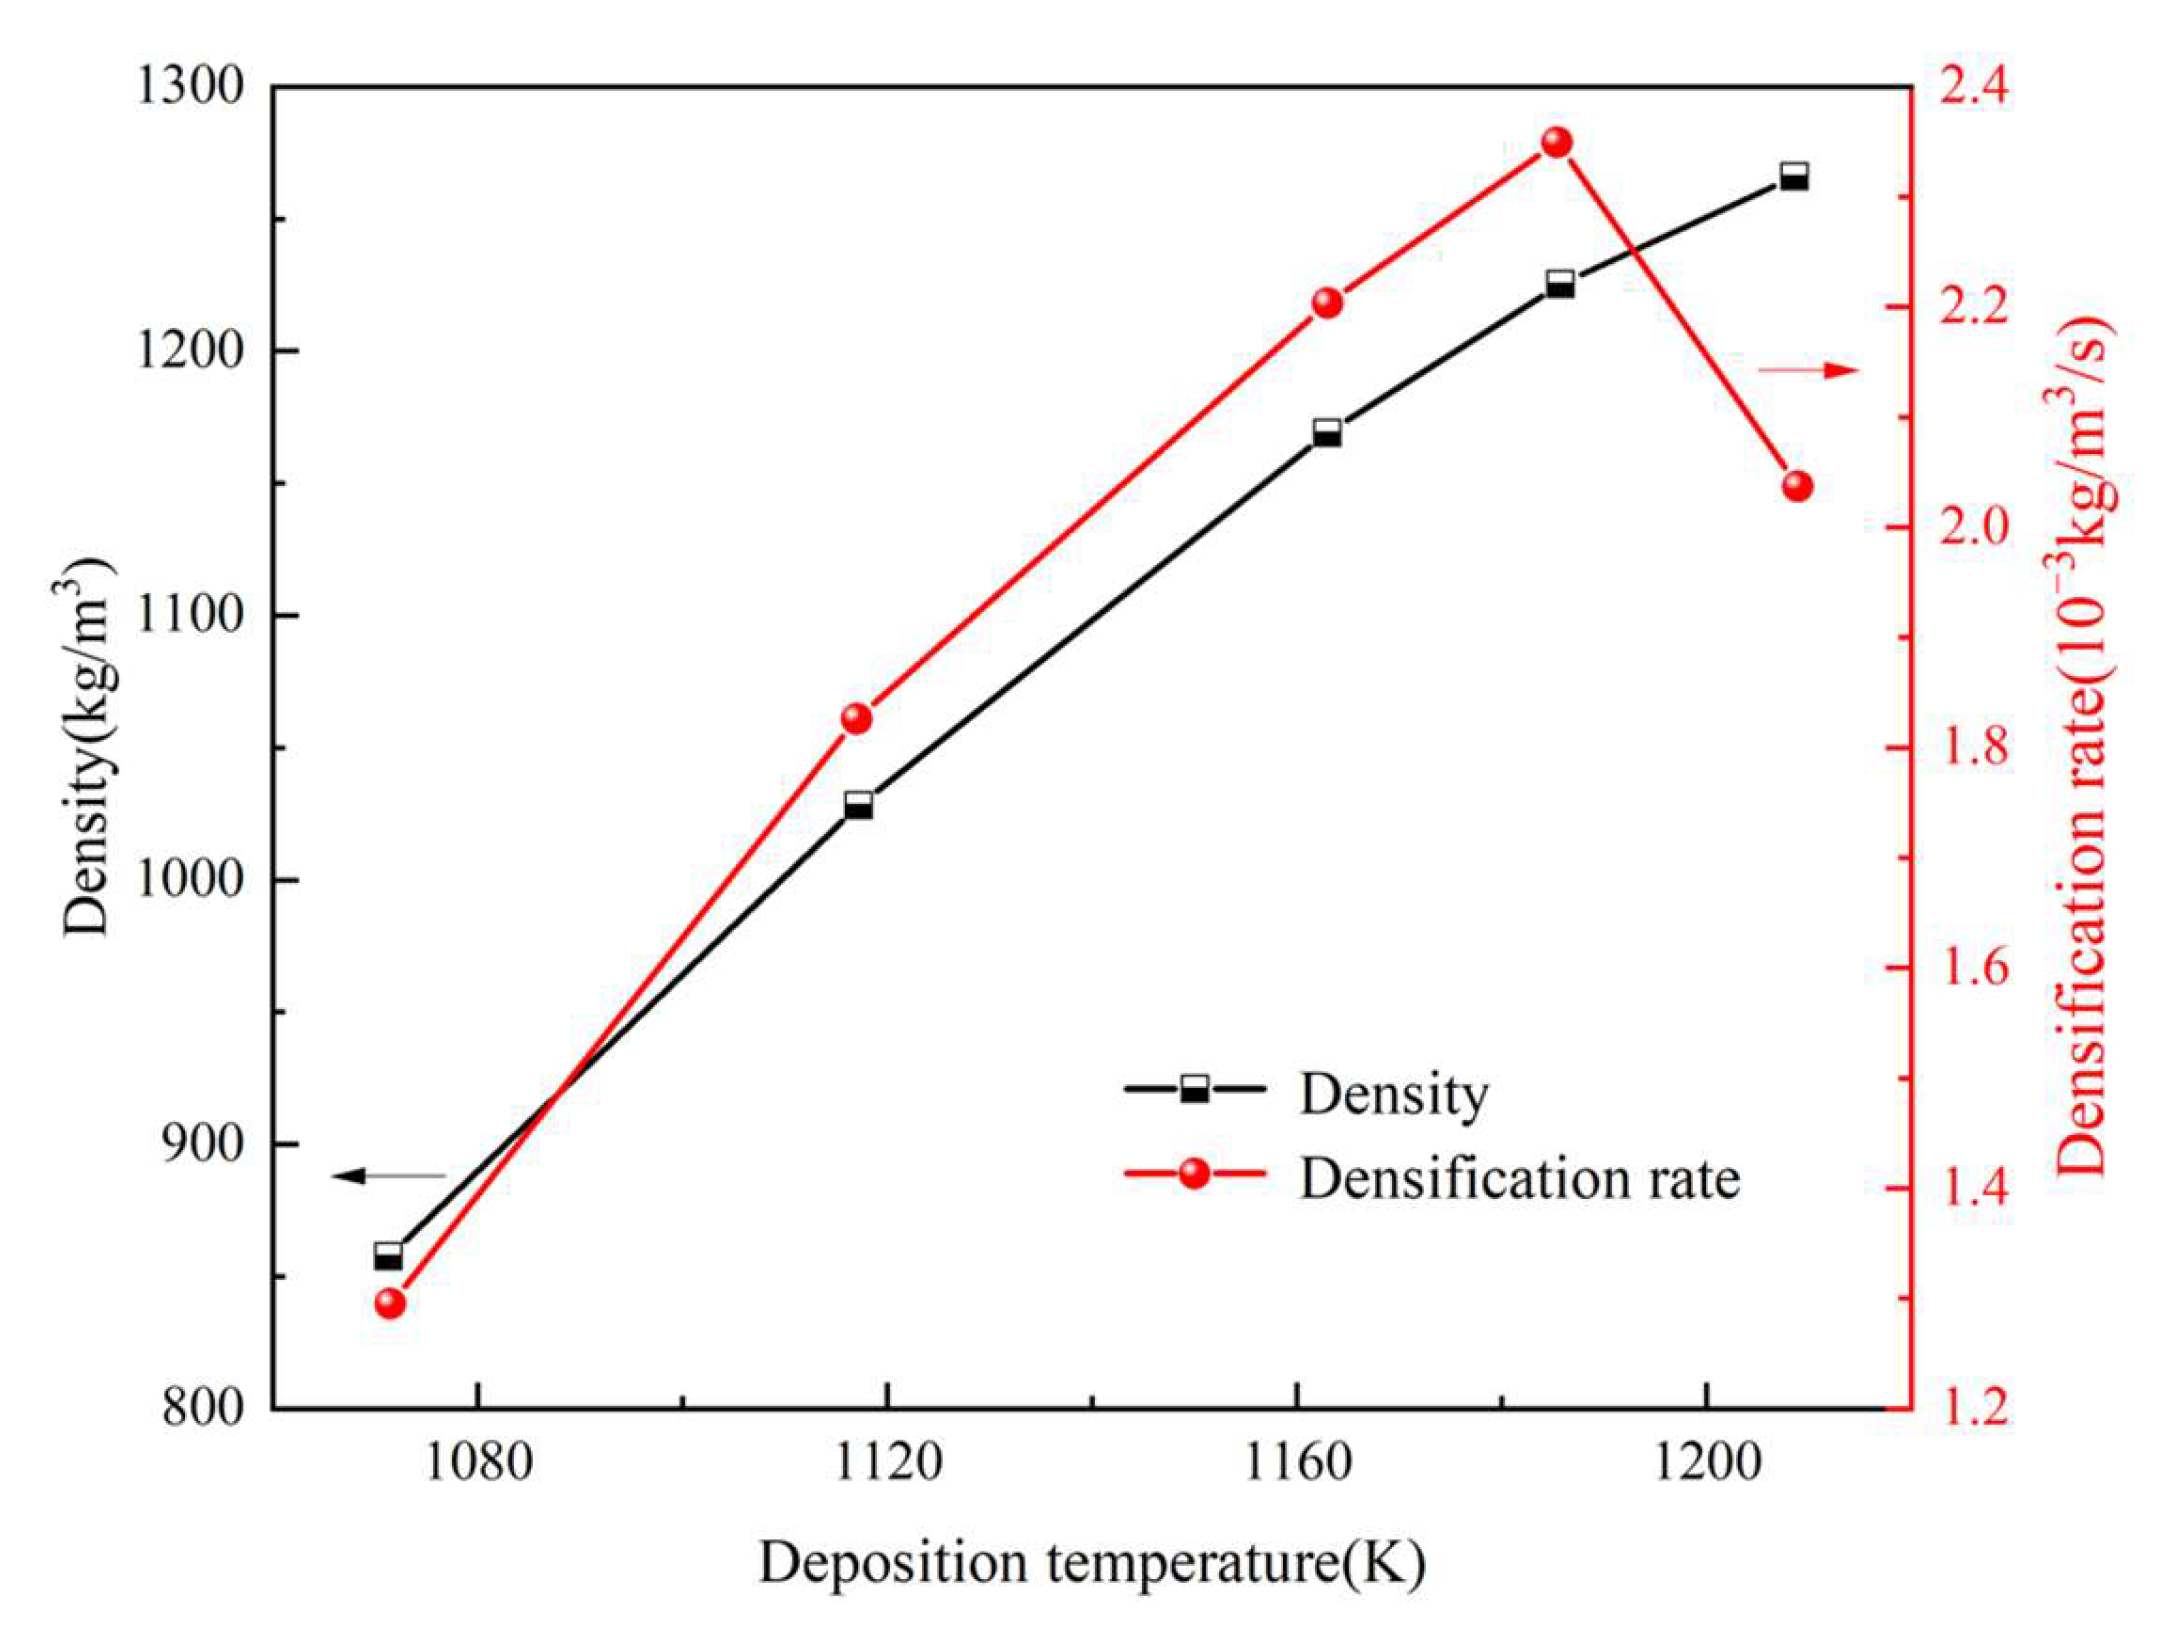
It could be observed that the deposition temperature, gas pressure, and precursor gas flow rate were the key factors influencing the densification of the thermal insulation tube. An increase in the deposition temperature was found to notably enhance the degree of densification; however, it can lead to premature pore closure and a decrease in the densification rate. An increase in gas pressure reduced both the average density and densification rate. Further, the increase in the precursor gas flow rate enhanced both the average density and densification rate.
(3)
Synergistic process optimization was achieved. It was found that at a temperature of 1160 K, a gas pressure of 0.05 MPa, and a methane flow rate of 95 L·min−1, the average density of the thermal insulation tube increased by 5.7% and the densification rate increased by 26.5%.

Author Contributions

Conceptualization, J.Z. (Jicheng Zhou); methodology, J.Z. (Jicheng Zhou) and B.Z.; software, H.L.; validation, H.L., J.Z. (Jicheng Zhou) and Y.G.; formal analysis, L.H.; investigation, J.Z. (Jicheng Zhou); resources, J.Z. (Jicheng Zhou); data curation, J.Z. (Jicheng Zhou); writing—original draft preparation, H.L.; writing—review and editing, J.Z. (Jicheng Zhou) and J.Z. (Jianyong Zhan); supervision, J.Z. (Jicheng Zhou); project administration, J.Z. (Jicheng Zhou); funding acquisition, J.Z. (Jicheng Zhou), T.Z. and B.J. All authors have read and agreed to the published version of the manuscript.

Funding

This work was supported by the Dongguan Science and Technology of Social Development Program (grant no. 20231800940252) and the Dongguan Electrochemical Energy Storage Devices Engineering and Technology Research Center (grant no. 20221600402072).

Institutional Review Board Statement

Not applicable.

Informed Consent Statement

Not applicable.

Data Availability Statement

Some or all data, models, or code that support the findings of this study can be made available from the corresponding author upon reasonable request.

Conflicts of Interest

The authors declare no conflicts of interest.

References

  1. Tang, B.; Wang, Y.; Hu, L.; Lin, L.; Ma, C.; Zhang, C.; Lu, Y.; Sun, K.; Wu, X. Preparation and properties of lightweight carbon/carbon fiber composite thermal field insulation materials for high-temperature furnace. J. Eng. Fibers Fabr. 2019, 14, 1558925019884691. [Google Scholar] [CrossRef]
  2. Beaumont, P.W.R.; Zweben, C.H. Ceramic and Carbon Matrix Composites—5.16 Applications of Carbon/Carbon Composites. In Comprehensive Composite Materials II; Elsevier: Amsterdam, The Netherlands, 2017; Volume 5, pp. 421–436. [Google Scholar]
  3. Albano, M.; Delfini, A.; Pastore, R.; Micheli, D.; Marchetti, M. A new technology for production of high thickness carbon/carbon composites for launchers application. Acta Astronaut. 2016, 128, 277–285. [Google Scholar] [CrossRef]
  4. Alghamdi, A.; Alharthi, H.; Alamoudi, A.; Alharthi, A.; Kensara, A.; Taylor, S. Effect of needling parameters and manufacturing porosities on the effective thermal conductivity of a 3D carbon–carbon composite. Materials 2019, 12, 3750. [Google Scholar] [CrossRef] [PubMed]
  5. Muruganantham, R.; Yang, C.W.; Wang, H.J.; Huang, C.H.; Liu, W.R. Industrial silicon-wafer-wastage-derived carbon-enfolded Si/Si-C/C nanocomposite anode material through plasma-assisted discharge process for rechargeable Li-ion storage. Nanomaterials 2022, 12, 659. [Google Scholar] [CrossRef] [PubMed]
  6. Tao, M. Inorganic photovoltaic solar cells: Silicon and beyond. Electrochem. Soc. Interface 2008, 17, 30–35. [Google Scholar] [CrossRef]
  7. Su, W.; Zuo, R.; Mazaev, K.; Kalaev, V. Optimization of crystal growth by changes of flow guide, radiation shield and sidewall insulation in Cz Si furnace. J. Cryst. Growth 2010, 312, 495–501. [Google Scholar] [CrossRef]
  8. Gruner, S.; Kranert, C.; Jauß, T.; Sorgenfrei, T.; Reimann, C.; Friedrich, J. Investigation of Facetted Growth in Heavily Doped Silicon Crystals Grown in Mirror Furnaces. Crystals 2022, 12, 1575. [Google Scholar] [CrossRef]
  9. Li, H.; Li, A.; Bai, R.; Li, K. Numerical simulation of chemical vapor infiltration of propylene into C/C composite materials with reduced multi-step kinetic models. Carbon 2005, 43, 2937–2950. [Google Scholar] [CrossRef]
  10. Vignole, G.L. Modeling of chemical vapor infiltration processes. In Advances in Composite materials Manufacturing and Process Design; Woodhead Publishing: Sawston, UK, 2015; pp. 415–458. [Google Scholar]
  11. Hou, X.; Li, H.; Chen, Y.; Li, K. Modeling of chemical vapor infiltration process for fabrication of carbon–carbon composite materials by finite difference methods. Carbon 1999, 37, 669–677. [Google Scholar] [CrossRef]
  12. McAllister, P.; Wolf, E. Simulation of a multiple substrate reactor for chemical vapor infiltration of pyrolytic carbon within carbon-carbon composite materials. AIChE J. 1993, 39, 1196–1209. [Google Scholar] [CrossRef]
  13. Ibrahim, J.; Paolucci, S. Transient solution of chemical vapor infiltration/deposition in a reactor. Carbon 2011, 49, 915–930. [Google Scholar] [CrossRef]
  14. Tang, Z.; Li, A.; Hatakeyama, T.; Shuto, H.; Hayashi, J.I.; Norinaga, K. Transient three-dimensional simulation of densification process of carbon fibre preforms via chemical vapor infiltration of carbon matrix from methane. Chem. Eng. Sci. 2018, 176, 107–115. [Google Scholar] [CrossRef]
  15. Kim, H.G.; Ji, W.; Kwon, H.J.; Yoon, S.; Kim, J.I.; Bae, S.; Cho, N.C. Full-scale multi-physics numerical analysis of an isothermal chemical vapor infiltration process for manufacturing C/C composite materials. Carbon 2021, 172, 174–188. [Google Scholar] [CrossRef]
  16. Albano, M.; Pastore, R.; Delfini, A.; Micheli, D.; Volpini, F.; Marchetti, M. Densification of high thickness C/C composite materials by chemical vapor infiltration. Procedia Eng. 2015, 19, 381–389. [Google Scholar] [CrossRef]
  17. Hu, Z.J.; Zhang, W.G.; Hüttinger, K.J.; Reznik, B.; Gerthsen, D. Influence of pressure, temperature and surface area/volume ratio on the texture of pyrolytic carbon deposited from methane. Carbon 2003, 41, 749–758. [Google Scholar] [CrossRef]
  18. Tang, Z.H.; Qu, D.N.; Xiong, J.; Zou, Z.Q. Effects of infiltration conditions on the densification behavior of C/C c-omposite materials prepared by a directional-flow thermal gradient CVI process. Carbon 2003, 41, 2703–2710. [Google Scholar] [CrossRef]
  19. Reuge, N.; Vignoles, G.L. Modeling of isobaric–isothermal chemical vapor infiltration: Effects of reactor control parameters on a densification. J. Mater. Process. Technol. 2005, 166, 15–29. [Google Scholar] [CrossRef]
  20. Mahoney, P.; Povitsky, A. Modeling of Chemical Vapor Infiltration for Fiber-Reinforced Silicon Carbide Composites Using Meshless Method of Fundamental Solutions. Math. Comput. Appl. 2024, 29, 27. [Google Scholar] [CrossRef]
  21. Steinbrueck, M.; Grosse, M.; Stegmaier, U.; Braun, J.; Lorrette, C. Oxidation of silicon carbide composites for nuclear applications at very high temperatures in steam. Coatings 2022, 12, 875. [Google Scholar] [CrossRef]
  22. Ye, C.; Huang, D.; Li, B.; Yang, P.; Liu, J.; Wu, H.; Yang, J.; Li, X. Ablation behavior of the SiC-coated three-dimensional highly thermal conductive mesophase-pitch-based carbon-fiber-reinforced carbon matrix composite under plasma flame. Materials 2019, 12, 2723. [Google Scholar] [CrossRef]
  23. Li, A.; Deutschmann, O. Transient modeling of chemical vapor infiltration of methane using multi-step reaction and deposition models. Chem. Eng. Sci. 2007, 62, 4976–4982. [Google Scholar] [CrossRef]
  24. Li, A.; Norinaga, K.; Zhang, W.; Deutschmann, O. Modeling and simulation of materials synthesis: Chemical vapor deposition and infiltration of pyrolytic carbon. Compos. Mater. Sci. Technol. 2008, 68, 1097–1104. [Google Scholar] [CrossRef]
  25. Masoodi, R.; Pillai, K.M. Darcy’s law-based model for wicking in paper-like swelling porous media. AIChE J. 2010, 56, 2257–2267. [Google Scholar] [CrossRef]
  26. COMSOL. CFD Module User’s Guide, COMSOL Multiphysics® v. 5.6; COMSOL: Burlington, MA, USA, 2020; pp. 591–605. [Google Scholar]
  27. Leutard, D.; Vignoles, G.L.; Lamouroux, F.; Bernard, B. Monitoring density and temperature in C/C composite materials processing by CVI with induction heating. J. Mater. Synth. Process. 2001, 9, 259–273. [Google Scholar] [CrossRef]
  28. Zhang, Y.; Zhou, Z.; Tan, Z. Compression shear properties of adhesively bonded single-lap joints of C/C composite materials at high temperatures. Symmetry 2019, 11, 1437. [Google Scholar] [CrossRef]
  29. Delfini, A.; Albano, M.; Vricella, A.; Santoni, F.; Rubini, G.; Pastore, R.; Marchetti, M. Advanced radar absorbing ceramic-based materials for multifunctional applications in space environment. Materials 2018, 11, 1730. [Google Scholar] [CrossRef]
  30. Yin, T.; Jiang, B.Y.; Su, Z.A.; Fan, Z.Q.; Huang, Q.Z. Numerical simulation of carrier gas effects on flow field, species concentration and deposition rate in the chemical vapor deposition of carbon. New Carbon Mater. 2018, 33, 357–363. [Google Scholar] [CrossRef]
  31. Vignoles, G.L.; Goyhénèche, J.M.; Sébastian, P.; Puiggali, J.R.; Lines, J.F.; Lachaud, J.; Trinquecoste, M. The film-boiling densification process for C/C composite fabrication: From local scale to overall optimization. Chem. Eng. Sci. 2006, 61, 5636–5653. [Google Scholar] [CrossRef]
Figure 1. Schematic diagram of industrial chemical vapor deposition furnace. The red box represents the actual sedimentation chamber (with furnace shells outside, only the actual sedimentation space is taken for modeling during simulation). The green line represents the opening and closing position of the sedimentation furnace. The blue line represents the direction of gas flow.
Coatings 14 00756 g001
Figure 2. Simplified deposition furnace structure. (a) is simplified 3D model; (b) is the geometry diagram for simulation.
Coatings 14 00756 g002
Figure 3. A simplified model of chemical reaction kinetics [23].
Coatings 14 00756 g003
Figure 4. Comparison of simulation results with experimental results in reference [14] (a) felt preform and (b) cloth preform.
Coatings 14 00756 g004
Figure 5. Effect of temperature adjustment on densification. The red arrow represents the right axial of densification rate, and the black arrow represents the left axial of density.
Coatings 14 00756 g005
Figure 6. Density changes along the monitoring line (r = 0.57875 m) with varying temperatures.
Coatings 14 00756 g006
Figure 7. Effect of pressure on densification results. The red arrow represents the right axial of densification rate, and the black arrow represents the left axial of density.
Coatings 14 00756 g007
Figure 8. Density variation with pressure adjustment.
Coatings 14 00756 g008
Figure 9. Effect of adjusting gas flow rate on densification. The red arrow represents the right axial of densification rate, and the black arrow represents the left axial of density.
Coatings 14 00756 g009
Figure 10. Density variation with reactant flow at the monitoring site.
Coatings 14 00756 g010
Table 1. Reaction rates of chemical species in different regions during the densification process [15,30].
Chemical SpeciesRi1 (m3/mol∙s)Ri2 (m3/mol∙s)
CH4, c1 - k 1 c 1 - k 1 c 1
C2H4, c2 + 1 2 k 1 c 1 k 2 c 2 + 1 2 k 1 c 1 k 2 c 2 S v K 2 c 2
C2H2, c3 + k 2 c 2 k 3 c 3 + k 2 c 2 k 3 c 3 S v K 3 c 3
C6H6, c4 + 1 3 k 3 c 3 + 1 3 k 3 c 3 S v K 4 c 4
H2, c5 + k 2 c 2 + k 3 c 3 + k 2 c 2 + k 3 c 3 + S v ( 2 K 2 c 2 + K 3 c 3 + 3 K 4 c 4 )
Table 2. The range of simulation experiment data for the synergistically adjusted process parameters.
ParametersParameter Value RangeAverage Density
(kg·m−3)
Densification Rate (kg·m−3·s−1)Uniformity α
(%)
Deposition
Temperature (K)
[1120–1180][1–1.29] × 103[1.73–2.59] × 10−3[85.1–92.5]
Pressure (MPa)[0.05–0.1]
Flow rate (L·min−1)[85.1–92.5]
Disclaimer/Publisher’s Note: The statements, opinions and data contained in all publications are solely those of the individual author(s) and contributor(s) and not of MDPI and/or the editor(s). MDPI and/or the editor(s) disclaim responsibility for any injury to people or property resulting from any ideas, methods, instructions or products referred to in the content.

