Article

Effect of Chain Orientation on Coupling of Optical and Mechanical Anisotropies of Polymer Films

by
Aref Samadi-Dooki
*,
Mark A. Lamontia
,
Juan David Londoño
,
Curtis Williamson
,
Heidi E. Burch
,
Mobin Yahyazadehfar
,
Leopoldo A. Carbajal
and
Kostantinos Kourtakis
DuPont Electronics and Industrial Experimental Station, 200 Powder Mill Road, Wilmington, DE 19803, USA
*
Author to whom correspondence should be addressed.
Coatings 2024, 14(6), 764; https://doi.org/10.3390/coatings14060764
Submission received: 25 May 2024 / Revised: 11 June 2024 / Accepted: 14 June 2024 / Published: 16 June 2024

Abstract

:
Polymer films have broad applications in different industries with specific requirements for their optical and mechanical properties. In mass production, processing conditions during film formation that apply forces and motions in various directions to the film tend to manifest preferred molecular chain orientation in the film microstructure, which unavoidably produces optical and mechanical anisotropies. In this paper, we investigate the effect of such macromolecular orientations on the optical and mechanical anisotropies of several polymer films, including polystyrene, poly(methyl methacrylate), poly(ethylene terephthalate), poly(ethylene naphthalate), poly(ether ether ketone), poly(ether sulfones), poly(ethylene chlorotrifluoroethylene), poly(phenylsulfone), and polycarbonate, at temperatures well below their respective glass transitions (Tg). The film mechanical responses, including elasticity, yielding, and post-yield behaviors, were obtained for the in- and out-of-plane directions utilizing tensile and nanoindentation testing methods, respectively. In addition, the net chain orientation within the films was evaluated by birefringence through analyzing the film optical refractive indices, which were verified and complemented by wide-angle X-ray scattering (WAXS) measurements. The results reveal a considerable quantitative correlation between the birefringence and the degree of elastic anisotropy and a qualitative correlation between the chain orientation and the film post-yield tensile instability (necking). These observations corroborate the interrelationship between the microstructure of polymer films and their optical and mechanical properties. In addition, they emphasize that process conditions can be selected to tune the optical and mechanical anisotropies to best serve the material performance in specific devices. We also propose an empirical equation to approximate the out-of-plane film stiffness based upon the optical and in-plane mechanical properties.

1. Introduction

Polymer films have broad applications in diverse industries, from food and medical packaging to electronic devices and electric motors, among others [1]. In most applications, these thin films are expected to meet certain mechanical strength requirements against different types of loads that they may experience during their life span. In addition, the broad application of polymer thin films in display technologies imposes strict requirements on their optical properties. Hence, a thorough understanding of the polymer thin film’s optical/mechanical properties is essential to the device design process. However, depending on their processing conditions, which include process temperature, heating and cooling rates, draw ratio, etc., polymer films can exhibit strong directionality in their mechanical responses; for instance, one in-plane direction may be stiffer than the other, or the film may exhibit different in-plane and out-of-plane mechanical responses. Accordingly, the words “machine direction” and “transverse or cross direction” are commonly used to report the characterization of film material properties [2,3,4].
Because organic polymers are composed of macromolecules, their long chain order and orientation play a significant role in the direction-dependent film’s physical properties and responses [5]. As stated before, chain alignment in polymer films significantly depends on the processing conditions that are characteristic of the fabrication method. Typical fabrication methods include, for example, drawdown that is used early in the material formulation of new films, slot die coating used in more advanced development and for better properties, and extrusion (often multilayer) and blowing as higher volume techniques. Film casting is usually combined with stretching in the machine direction by increasing the speed and tension of downstream rollers, or in both directions by laboratory techniques involving frames and grips, or with a production tenter frame that fosters the macromolecular chain orientation. For instance:
  • coating of polymer thin films via a slot die coater results in chain orientation in the coating direction [6];
  • unidirectional gripping of films during curing usually induces chain orientation in one direction;
  • biaxial fixation with tension can bring about a biaxial chain orientation [7].
The latter two fabrication processes produce effects similar to those observed in fiber-reinforced composites with fibers laying in one or two perpendicular directions, respectively.
Chain alignment is not necessarily a result of the existence of crystals, as crystallization in polymers is mostly a function of polymer macromolecular structure. In other words, not only crystalline polymers exhibit chain alignment, but fully amorphous polymers can also exhibit varying degrees of chain alignment induced during manufacturing or caused by external loadings, e.g., cold drawing [8,9,10]. Chain orientation in polymer amorphous or crystalline regions is, to some extent, responsible for the film’s mechanical properties and responses, e.g., elastic modulus, yield strength, post-yield necking, plastic hardening, toughness, stretchability, and fracture resistance [11,12,13]. Accordingly, chain alignment can be used to tune the mechanical properties that serve stiffness, durability, and/or strength. Generally, polymer films exhibit a more rigid and stronger behavior in the chain direction and a less strong but more ductile behavior along the direction perpendicular to the chains. These characteristics should be considered in designing parts and devices using polymer films with different degrees of chain orientation and anisotropy.
Chain orientation not only affects the mechanical properties of polymer thin films, but also alters their optical properties. Chain alignment creates preferential ordering within the polymer matrix and gives rise to a directional-dependent polarizability of the polymer. This polarizability dictates how light propagates through the material and, in turn, affects the refractive indices. Aromatic backbone polymers have a difference in their in- and out-of-plane polarizability, and aligning these molecular units (e.g., by stretching) creates anisotropy or directional-dependent properties of the bulk film [14]. Birefringence is the difference of the refractive indices in two or more mutually orthogonal directions and is typically observed in optically anisotropic materials. While many polymers, especially semicrystalline polymers, are opaque in bulk, dye-free polymer films (usually less than 100 μm thick) are often optically transparent or translucent, allowing measurement of some of their optical properties, including the refractive indices in orthogonal directions. An estimation of chain orientation in thin polymer films by analyzing the optical properties, including the birefringence, can provide valuable insight into the structure and properties of these materials [15,16].
Both optical and mechanical measures of anisotropy have been extensively studied as an indirect measurement of the molecular orientation in a few polymeric systems. Ward and coworkers [17,18,19] developed mathematical models to predict the optical birefringence and Young’s modulus vs. draw ratio for crystalline polymers and polymeric fibers. Bridle et al. [20] examined the yielding behavior of poly(ethylene terephthalate) with varying draw ratios and developed a modified von Mises criterion that considered the angle between the uniaxial loading direction and the draw orientation to predict the angle of the shear band. White and Spruiell [21] reviewed the specification of orientation in different macromolecular systems and presented quantitative predictions of orientation in parts manufactured through melt spinning (fibers), extrusion (films), and blow and injection molding. Wu [22] measured the birefringence of uniaxially oriented bisphenol-A polycarbonate samples stretched over a wide temperature range and concluded stretching below the glass transition always results in excess birefringence (higher anisotropy) and slightly higher density without crystallization. Zhang et al. [23] studied low-density polyethylene (LDPE), linear low-density polyethylene (LLDPE), and high-density polyethylene (HDPE) blown films at different draw ratios to investigate the relation between crystalline structure and mechanical anisotropy and showed the microstructure differences translate into different ratios of machine and transverse direction tear and tensile strengths. Campoy-Quiles et al. [24] analyzed the optical in- and out-of-plane anisotropy of spin-coated and oriented conjugated polymer thin films of poly(9,9-dihexyl fluorene), poly(9,9-dioctylfluorene), and poly(9,9- dioctylfluorene-co-benzothiadiazole) and developed models for the upper bound on different types of anisotropies. Ye et al. [25] used cold zone annealing-soft shear (CZA-SS) methods to induce various levels of chain alignment in polyester-block-polydimethylsiloxane and studied the effect of such alignment on thin film mechanical anisotropy. It was further shown that the process-induced molecular orientation in polymers can drastically affect strain localization in the post-yield deformation regime [26] and may even suppress the necking instability in the uniaxial response of these materials [27].
Despite the publication of a vast number of research articles on the mechanical and optical anisotropy of polymer films, a comprehensive study of the mechanical/optical anisotropy interrelationships in different polymeric systems is seldom presented in the literature. To date, there has been no prior study on the 3D characterization of polymer film mechanical and optical anisotropies.
In this study, the in- and out-of-plane mechanical properties of multiple polymer films were measured and compared with the optical orientation birefringence to investigate the interrelationships between the optical and mechanical anisotropies. Polymer films were tested in the as-received condition; quantitative mechanical characterization was performed in the elastic and plastic deformation ranges, but the comparison between the optical and mechanical properties was limited to the elastic properties to exclude the effect of any additional chain alignment during irreversible deformation. The post-yield necking instability was only qualitatively studied. The in-plane mechanical properties of polymer films were measured using the uniaxial tension test, and the out-of-plane properties were evaluated using the nanoindentation technique. The calculation of the mechanical anisotropy relies on the assumption of tension–compression response symmetry. This response symmetry is reasonably valid for infinitesimal deformations of polymers in the glassy state [28]. The refractive indices and orientation birefringence values were obtained by polarimetry. Although the main scope of this study was to investigate the interrelation between optical and mechanical anisotropies, we complemented our microstructure evaluation by performing wide-angle X-ray spectroscopy (WAXS) and X-ray diffraction (XRD) measurements.

2. Materials and Methods

2.1. Polymer Films

The following commercially available polymer films were investigated in this study:
  • 50 μm melt-casted polystyrene (PS)
  • 50 μm melt-casted poly(methyl methacrylate) (PMMA)
  • 50 μm melt-extruded poly(ethylene terephthalate) (PET)
  • 50 μm melt-extruded poly(ethylene naphthalate) (PEN)
  • 50 μm melt-extruded poly(ether ether ketone) (PEEK)
  • 50 μm extruded poly(ether sulfones) (PES)
  • 50 μm melt-extruded poly(ethylene chlorotrifluoroethylene) (ECTFE)
  • 60 μm melt-extruded poly(phenylsulfone) (PPSU)
  • and 36 and 50 μm melt-casted polycarbonate (PC)
Note that the thickness values reported herein are the nominal values. The actual thicknesses were measured using a micrometer for post-processing and calculation of properties.
The film’s in-plane directions are hereafter denoted by “x” and “y”, and the out-of-plane direction is designated by “z”. All tested films were optically transparent (smooth and free of scatterers) and had a thickness tolerance of less than 5%. The films were tested without any thermal treatment to avoid inducing a new chain orientation or free volume alteration [13,29,30].

2.2. Tension Test

Tensile tests were performed on a Criterion Model 42 universal mechanical testing frame equipped with a 500 N loadcell (MTS, Eden Prairie, MN, USA); and a laser extensometer (Electronic Instrument Research, Irwin, PA, USA) was used to accurately measure the specimen displacement and calculate the engineering strain. Rectangular tensile specimens with a gauge (grip-to-grip) aspect ratio of eight were cut along x and y directions and tested according to ASTM D638 [31]; at least five samples were tested in each direction for each film. Using a laser extensometer and laser tapes, the strain was measured within the specimen mid-length to exclude the stress and strain concentrations at the grips and eliminate the contribution of the frame compliance to the measured deformation. Each sample’s thickness was measured at three points in the middle half of the specimen; the average value was used to calculate the stress. The tensile modulus was obtained by measuring the tangent slope of the stress–strain curve within the linear small deformation response. Since not all the tested films exhibited a distinct yield point, the yield strain and strength were calculated using the 0.2% offset method for consistency (see ASTM D638 for details).

2.3. Nanoindentation Test

Performing a tension or compression test in the through-plane direction of thin films is virtually impossible, but the nanoindentation technique provides an alternate method for measuring the z-direction elastic and yielding properties. Accordingly, we used a Hysitron TI980 TriboIndenter (Bruker, Minneapolis, MN, USA) with a three-sided pyramidal Berkovich probe. Unlike uniaxial tension or compression, the indentation loading mode generates a complex, multiaxial, and non-uniform state of stress. Nevertheless, negligible tension–compression asymmetry in the response of unfilled thermoplastics at temperatures below their glass transitions allows for meaningful comparison of the response with that obtained from the in-plane tension. A basic nanoindentation method was utilized with a constant loading rate for the loading and unloading segments. A ten-second hold period between loading and unloading was utilized to accommodate material creep before unloading (see ref. [32] for details and justification of the hold duration). This method can be used to measure the z-direction indentation elastic modulus and hardness of the material of interest [33,34].
The indentation elastic modulus is obtained from the tangential stiffness at the onset of the unloading segment; accordingly, the slope of the indentation load–displacement curve at the onset of unloading ( S ) is measured and used to calculate the reduced modulus ( E r ) as:
E r = S 2 λ π A c
where λ is a constant equal to 1.034, and A c is the projected contact area of the indenter tip that is equal to 24.5 h c 2 for a perfect Berkovich tip with h c representing the contact depth. The reduced modulus represents the overall contact stiffness and can be used to obtain the elastic modulus of the material of interest using Equation (2):
E = 1 ν 2 1 E r 1 ν i 2 E i 1
where ν denotes the film Poisson’s ratio and E i and ν i represent the Young’s modulus and Poisson’s ratio of the diamond probe, equal to 1141 GPa and 0.07, respectively.
Hardness, H , is a measure of the material’s resistance to plastic deformation at its free surface and is correlated with the material’s yield strength through Tabor’s relation:
H = κ σ y
where σ y is the yield stress and κ is the Tabor factor, approximately 3.3 for polymers [30,35,36]. In a nanoindentation test, hardness is calculated by dividing the maximum load, P m a x , by the projected contact area, A c , at that load:
H = P m a x A c
As stated before, the projected contact area is proportional to the square of the contact depth for an ideal three-sided pyramidal probe (see ref [36] for AFM imaging of the Berkovich probe indentation impression on polymers). However, the actual tip geometry usually deviates from an ideal shape, especially at its apex, due to manufacturing constraints or bluntness induced by wear. Accordingly, the tip area function vs. the contact depth needs to be calibrated prior to running the indentation tests. This process is completed using a standard fused quartz specimen with known properties. The main advantage of using fused quartz is the absence of the indentation size effect (ISE) during indentation [37], such that hardness and modulus values remain unchanged and independent of the indentation depth during continuous stiffness measurement (CSM) or at different depths in a basic indentation test (see ref [38] for more details). As such, the modified contact area as a function of contact depth can be represented as:
A c = 24.5 h c 2 + C 1 h c 1 + C 2 h c 1 2 + C 3 h c 1 4 + + C 8 h c 1 128
in which C 1 C 8 are fitting coefficients. Depending on the expected indentation depth and level of accuracy needed at shallow depth, one can limit the number of coefficients to less than eight or limit the range of each coefficient to attain positive values only [39]. It is worth noting that all the mechanical test data were post-processed using MATLAB® and Kornucopia® ML [40].
To briefly investigate the polymer film time-dependent response, the increase in indentation depth during the ten-second hold time was normalized by the maximum depth and presented as the creep value. Although creep is often observed to be a combined short- and long-time phenomenon, the analysis of short-time creep reported herein furnishes valuable insight into the time-dependent viscoelastic film response.

2.4. Refractive Indices and Birefringence Measurements

The Mueller Matrix of the polymer films, a 16-element matrix that describes the change in light polarization interacting with a sample, was measured using an AxoScan Mapping SpectroPolarimeter (Axometrics Inc., Huntsville, AL, USA). The instrument was calibrated to air, whereby the diagonal and off-diagonal elements of the Mueller Matrix read 1 and 0, respectively. The samples were clamped to a tilt/rotation stage and measured in transmission mode (source and detector facing each other) at a 550 nm wavelength. To identify the refractive index n , we fit a model to the Mueller Matrix that describes the film optical constants. In anisotropic or birefringent materials, there is a directional dependence on the refractive index in which the x- and y-directions are in-plane and the z-direction lies out of the plane of the film. An in-plane birefringence is calculated by subtracting the refractive index along the y-axis from that along the x-axis ( n x n y ). The out-of-plane birefringence is calculated by subtracting the z-direction refractive index from the average in-plane refractive index, ( n x + n y 2 n z ).

2.5. X-ray Analysis

2D Wide Angle X-ray Spectroscopy (2D-WAXS): A Bruker D8 Venture single crystal diffractometer (Bruker, Minneapolis, MN, USA) was used to collect 2D-WAXS images. The X-ray source, consisting of a microfocus source and matched Helios optic, delivered a 0.1 mm bright Cu-K-alpha wavelength beam to the sample. The detector was a Photon II CMOS area detector capable of shutter-less data collection. A sample consisted of a small strip of about 200 μm in width and 1 cm in length. The strip was mounted on a goniometer at the sample position, and data were collected at two orientations of the strip relative to the beam. In one orientation, the incident beam was normal to the film surface (z-direction). In the second orientation, the beam struck the sample on the edge of the film (xy-plane). Images were analyzed to yield a measure of orientation by integration within an annulus. Generally, the annulus encompasses the scattering angle corresponding to the amorphous halo. The integration yielded a peak in a plot of intensity vs. azimuthal angle. The full-width-at-half-height of this peak was taken as a measure of orientation. For the beam-on-surface image, the orientation measured corresponded to a measure of in-plane orientation. For the beam-on-edge, the orientation measured corresponded to a measure of out-of-plane orientation.
X-ray Diffraction (XRD): A Panalytical X’Pert MPD Powder Diffractometer (Malvern Panalytical, Malvern, UK) was used to collect X-ray diffraction (XRD) data comprising crystallographic reflections and amorphous scattering. Samples were run in reflection geometry to probe the out-of-plane direction within the film. The X-ray radiation wavelength used was Cu K-a (1.54 Å), which was focused by an X-ray multilayer mirror. The beam was further conditioned on the incident side by a beam narrowing slit (1/16°) and a mask (20 mm) to reduce parasitic scattering. Circular film samples of ~1 in. diameter were mounted on a low-background silicon wafer. A strip detector (PIXcel1D from Panalytical, Malvern Panalytical, Malvern, UK) with an aperture of 3.5° in scattering angle was used.

3. Results

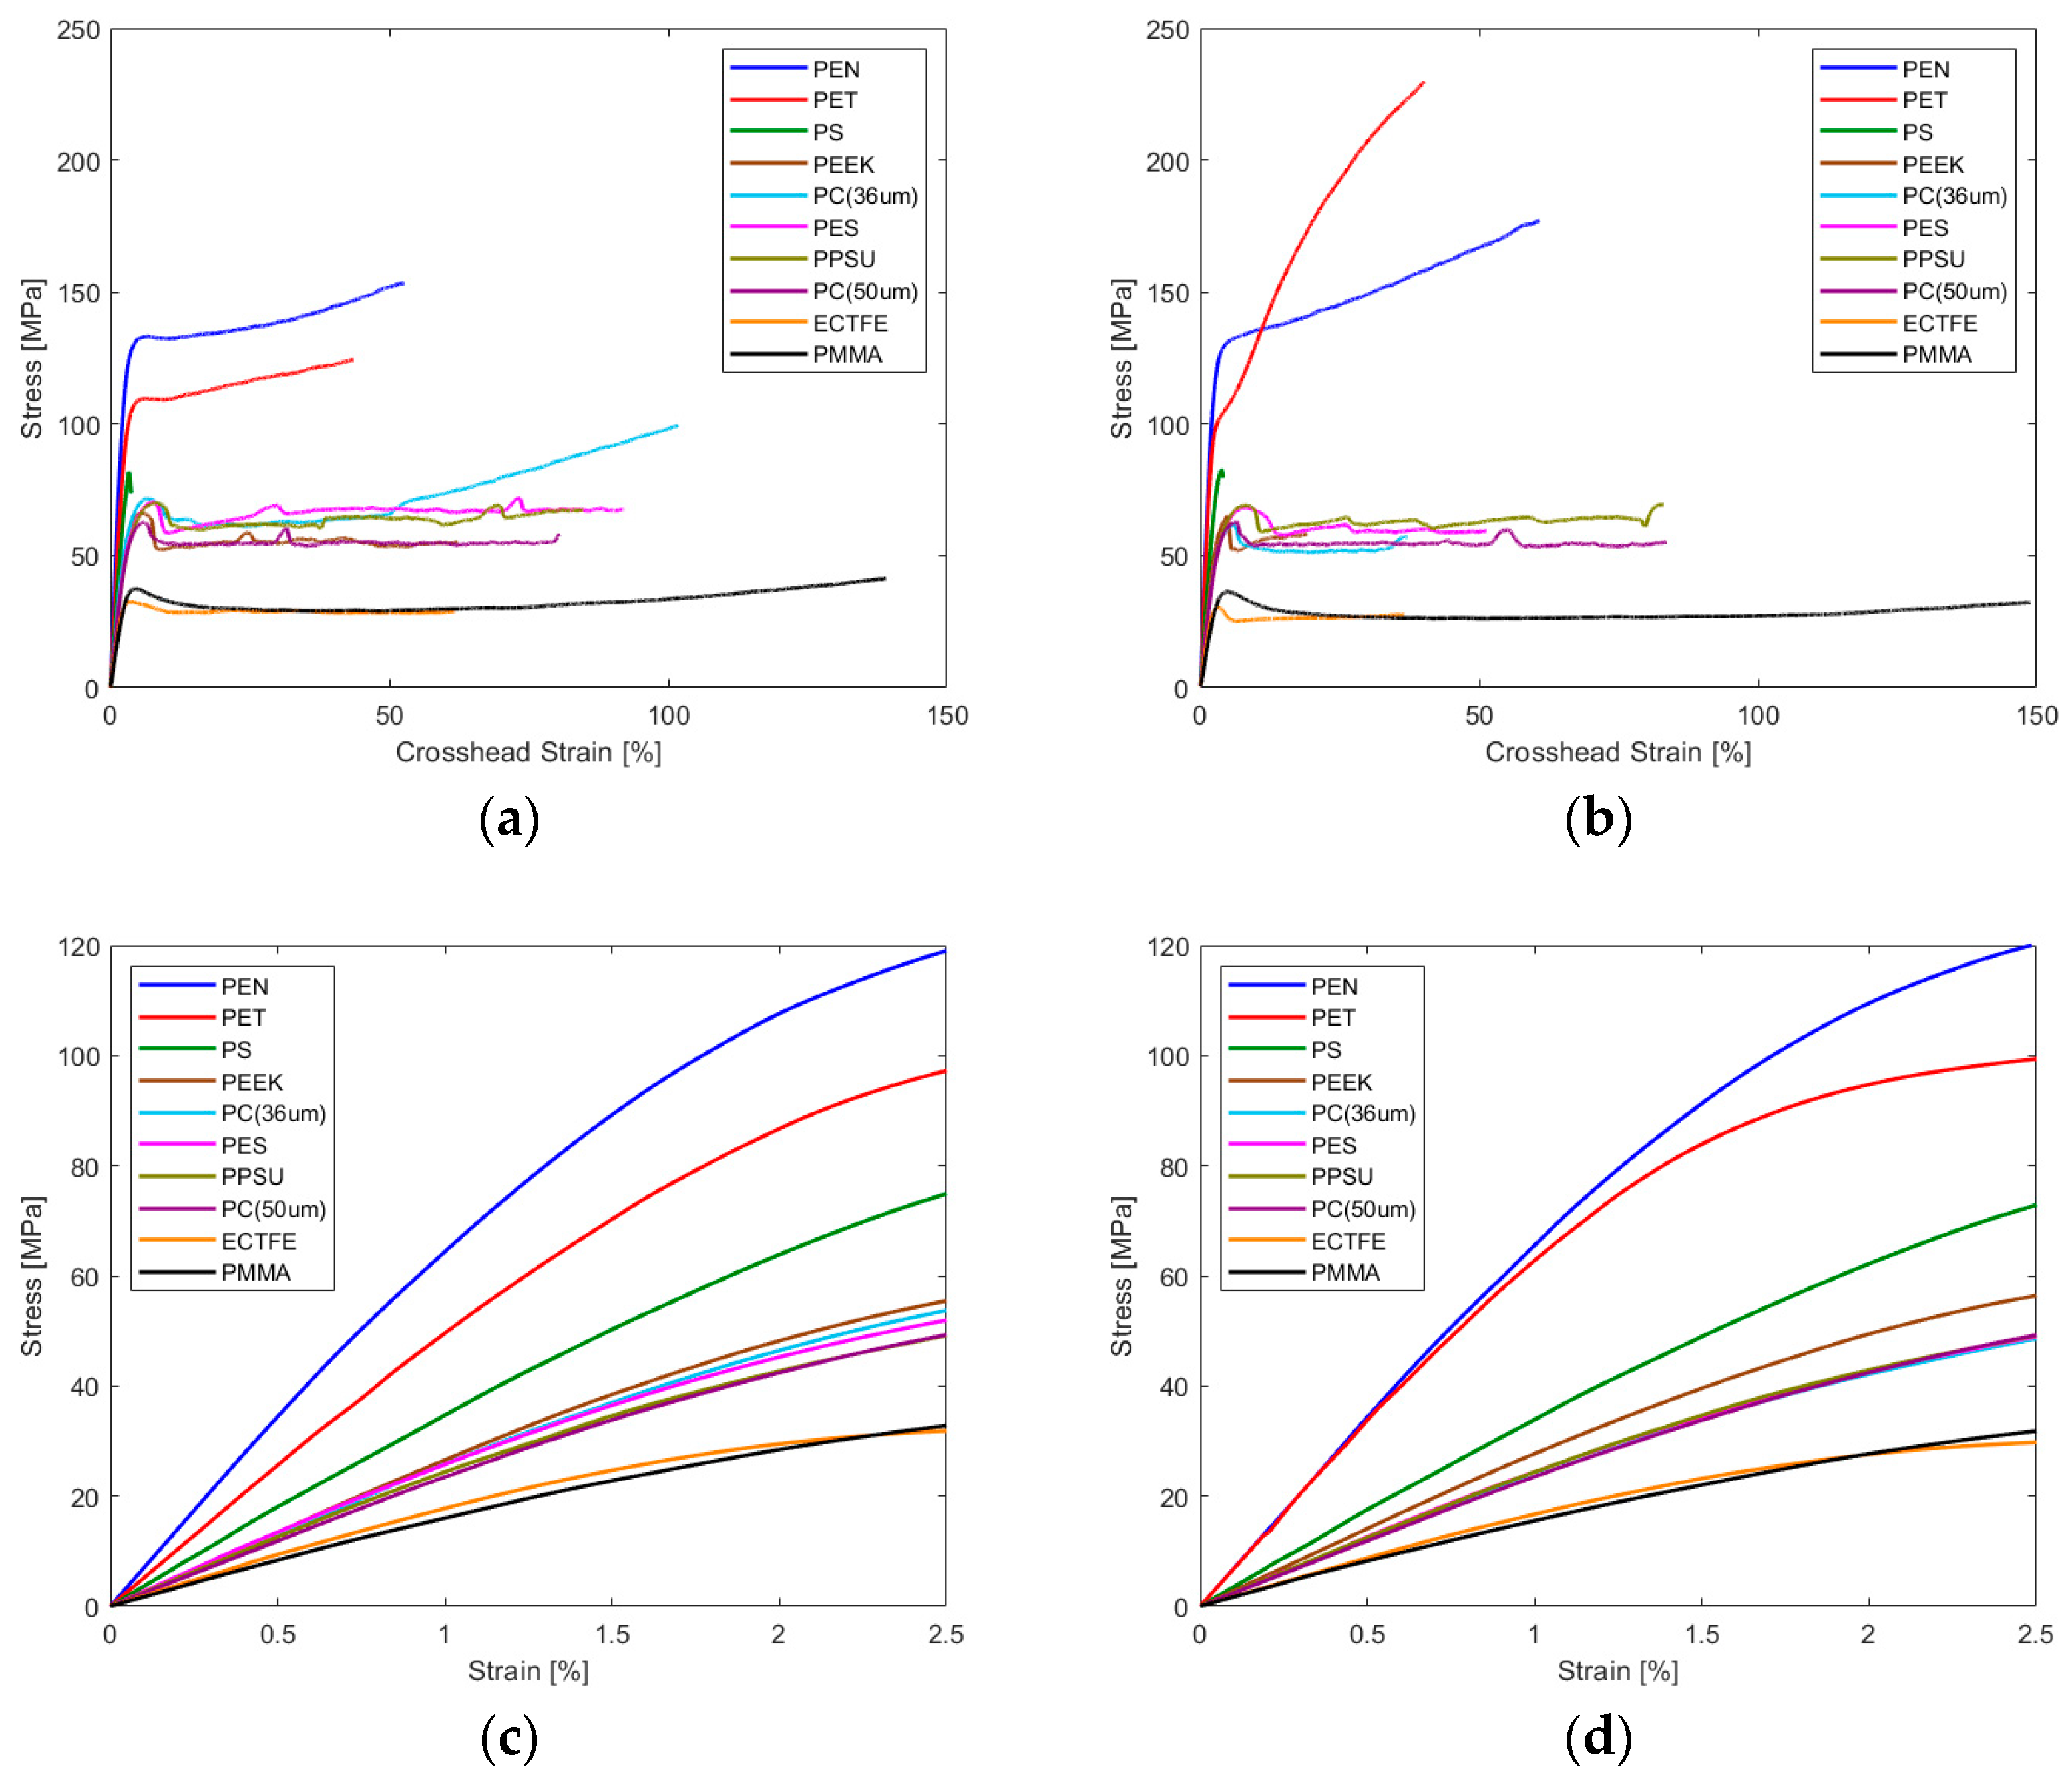
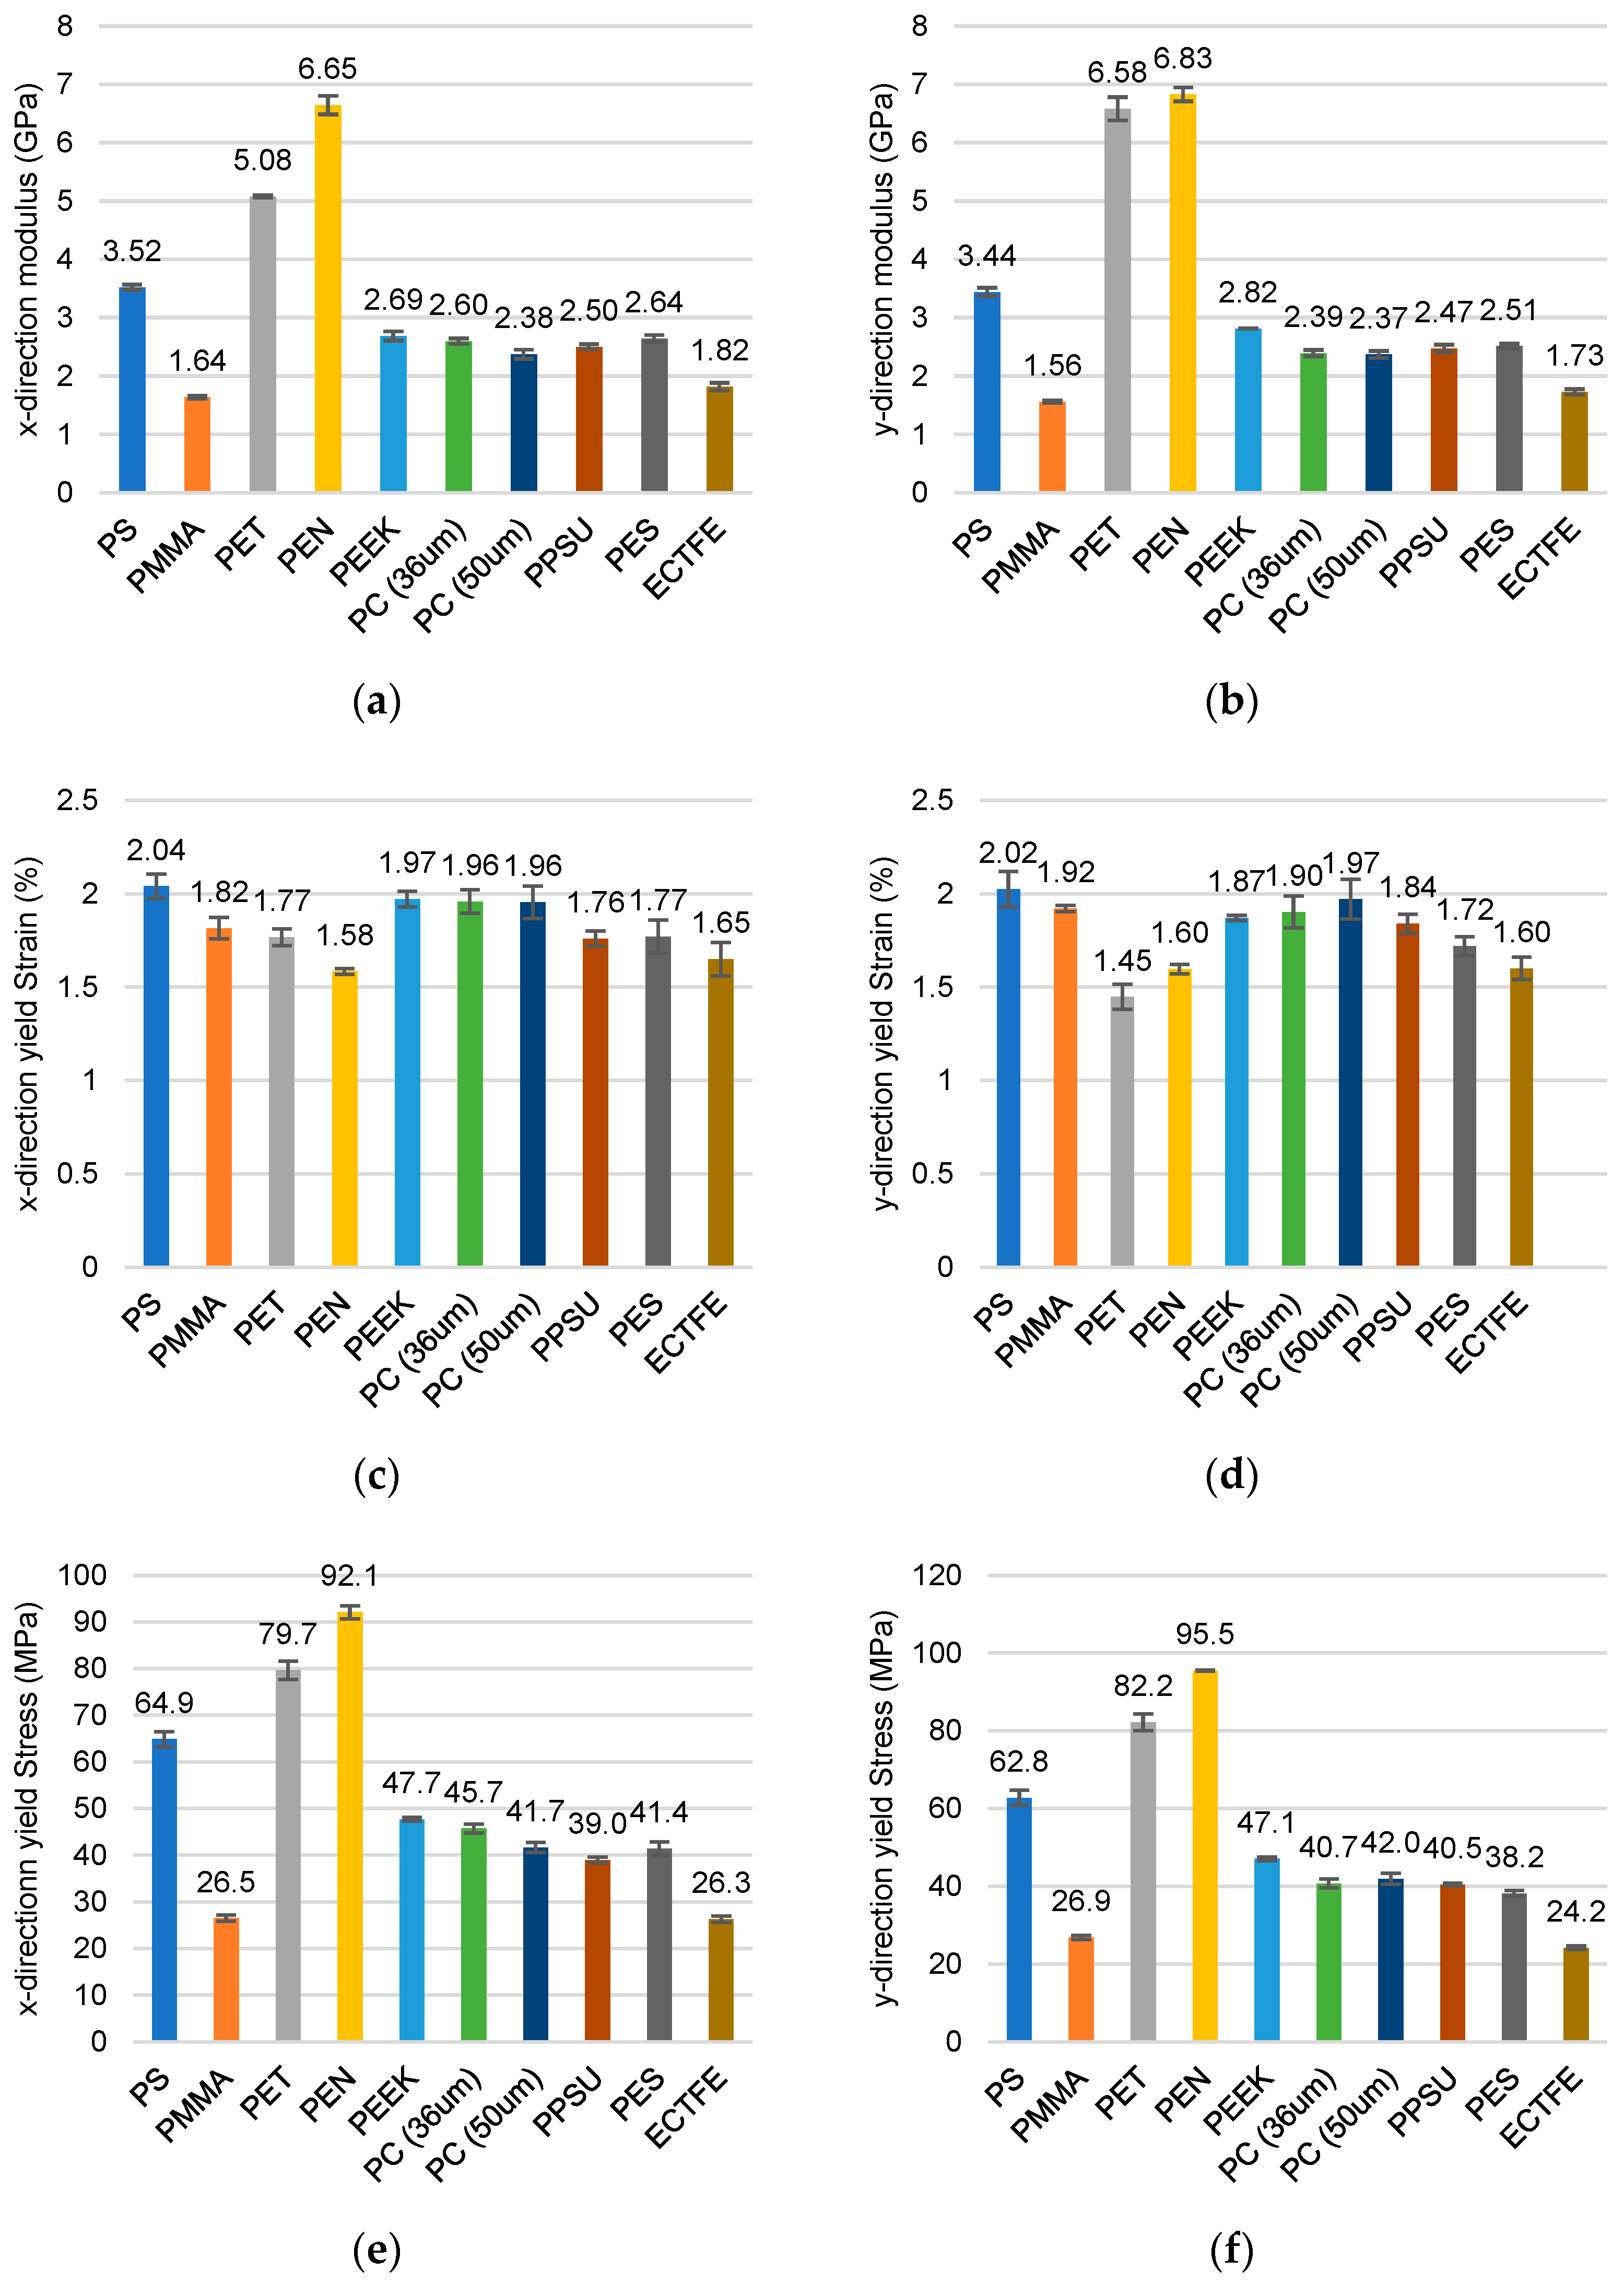
3.1. Film Response in Tension

Figure 1a,b show the full-range film tensile engineering stress vs. crosshead engineering strain response tested along the x and y directions, respectively. (Note that the crosshead strain is the strain measured based on the crosshead displacement divided by the original gauge length. Since most of the films undergo necking past the yield point and the necking can happen inside or outside of the laser tapes range, it is not possible to present the stress–strain curves based on the laser extensometer reading for the whole deformation range). Only PS exhibits a brittle response with a ~3.5% strain at its failure point. Other films show a ductile response, with PMMA exhibiting the highest elongation to break at ~150%. PEN and PET show a distinctly higher stiffness. For the full-range deformation, only PET shows considerable directionality, with the x and y directions exhibiting different responses at large deformations. In addition, PEEK, PC (both 36 and 50 µm thick films), PES, PPSU, and ECTFE exhibit a sudden post-yield drop in the stress associated with specimen necking. The neck-induced drop in stress is gradual for PMMA. On the other hand, PEN and PET do not show a post-yield stress drop, and their deformation is uniform without the formation of a neck in any of the specimens.
The film engineering stress vs. extensometer engineering strain response in the x and y directions is depicted in Figure 1c and Figure 1d, respectively, for up to a 2.5% engineering strain. These response curves were used to calculate the film’s elastic and yield properties, as shown in Figure 2. The elastic modulus values show a negligible directionality for all films except PET, which exhibits a stiffer response along the y-direction, consistent with the large deformation responses in Figure 1a,b. PEN is the stiffest, and PMMA is the most compliant among the tested films. The yield strain values span from 1.45% (for PET in the y-direction) to 2.04% (for PS in the x-direction), not a large range.

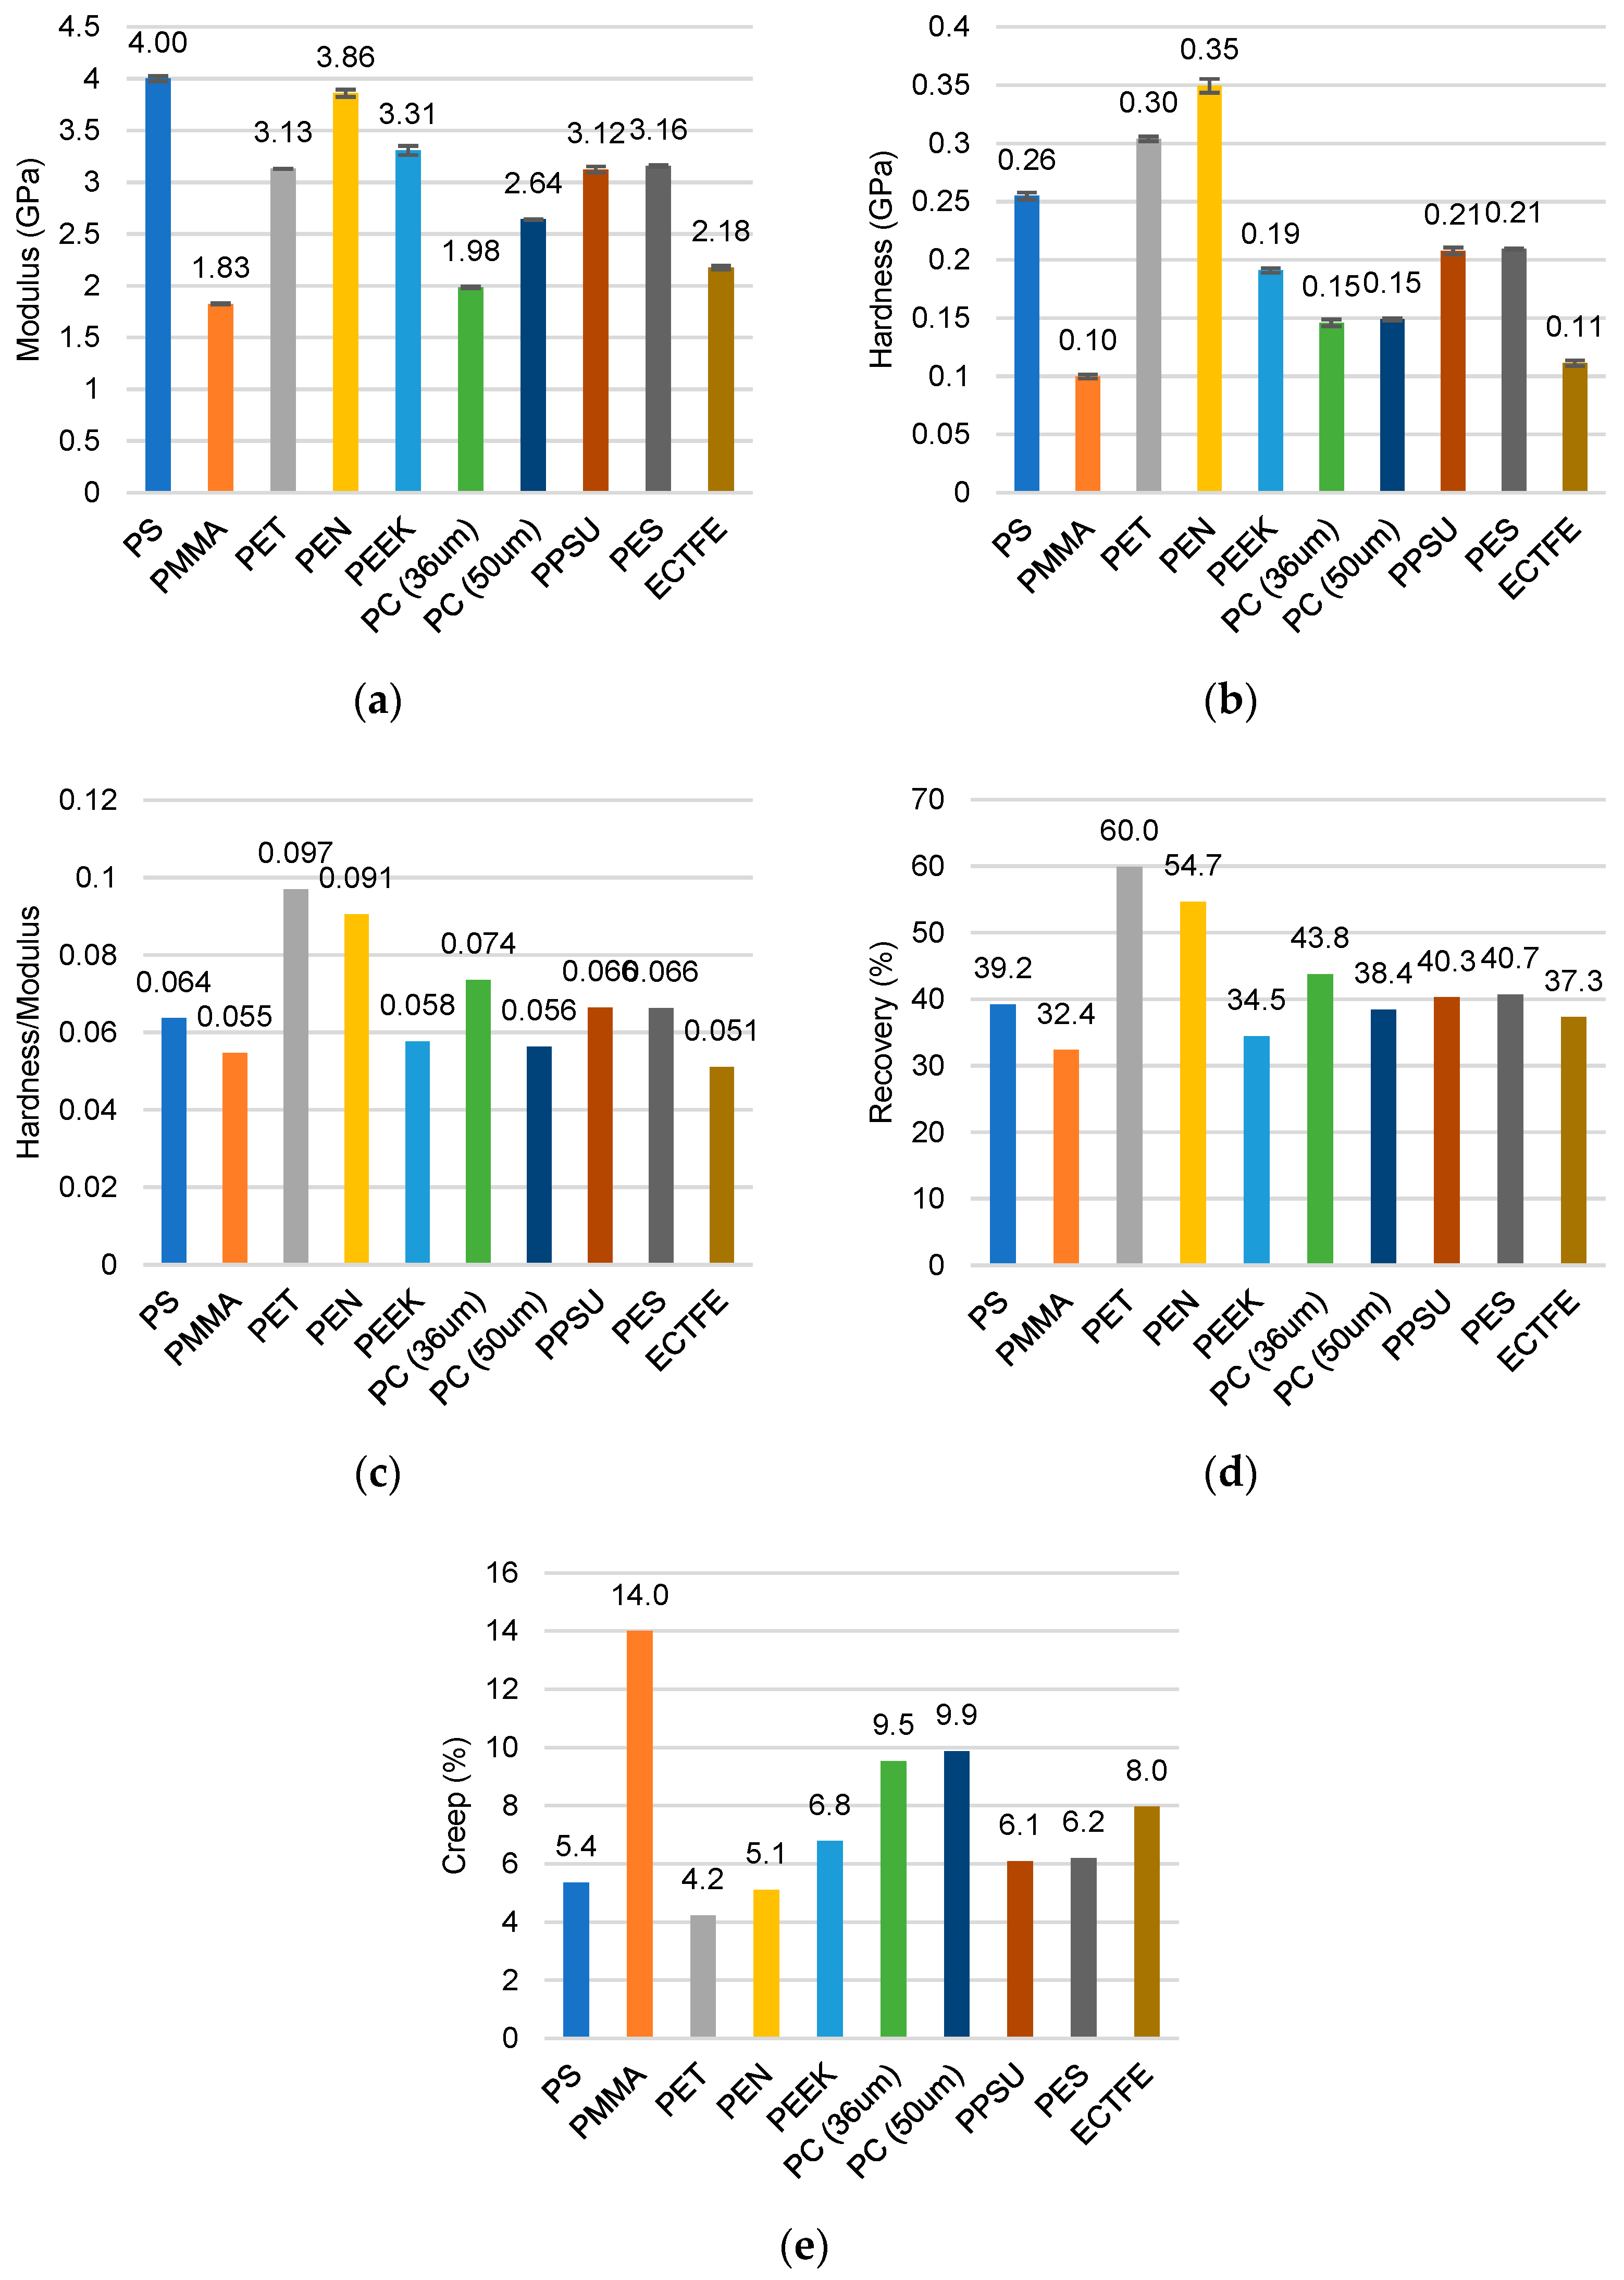
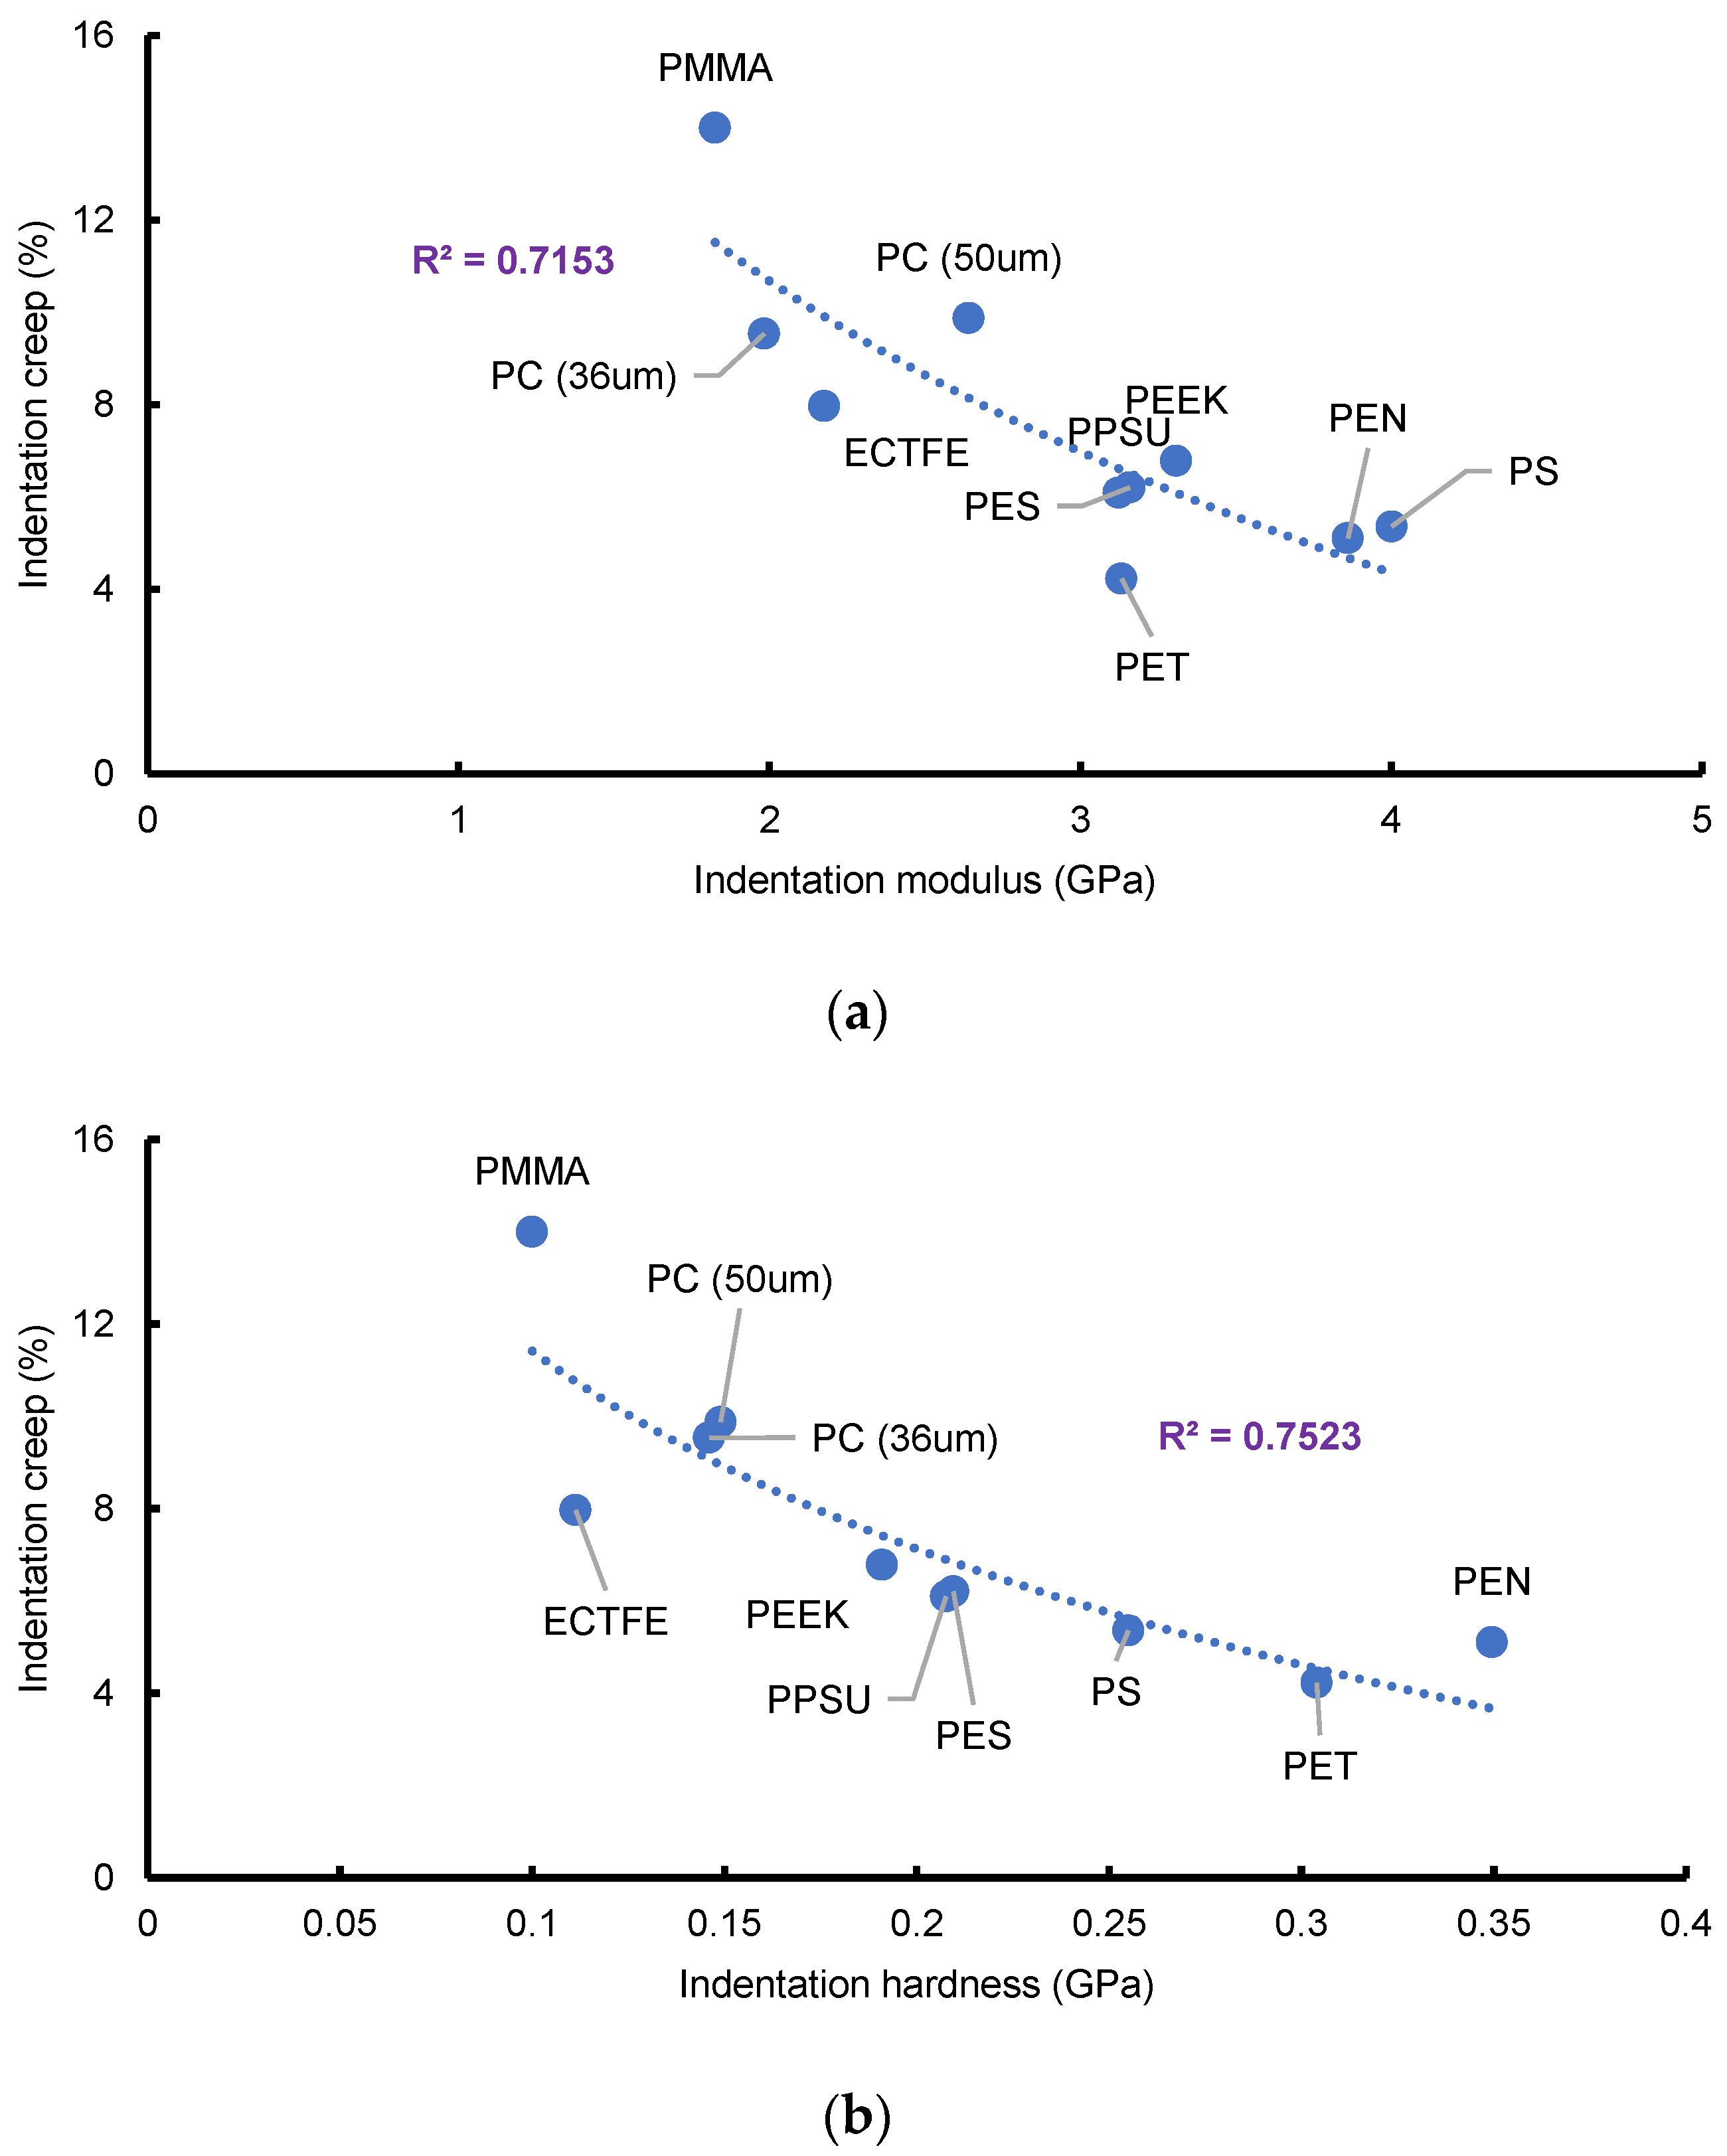
3.2. Z-direction Nanoindentation Response

The nanoindentation maximum load was adjusted for different films to limit the maximum indentation depth value to 1 to 1.5 µm: small enough to avoid any substrate contribution to the film stiffness, i.e., substrate effect [41], and large enough to avoid the indentation size effect (ISE) [38]. Figure 3 shows properties calculated from the indentation load–depth responses. In particular, Figure 3a shows the film elastic modulus in the z-direction. Although there is a significant amount of difference, the range of variation is smaller than for the film tensile moduli. Figure 3b shows the film hardness and hardness-to-modulus ratio, H E , also known as the elasticity index [42], as shown in Figure 3c. Figure 3d depicts the indentation recovery, the amount of the depth recovered during the unloading divided by the maximum depth, and Figure 3e shows the creep during the ten-second load hold time that is normalized by the maximum depth.

3.3. Optical Refractive Indices, Birefringence, and WAXS

Table 1 shows the results of the refractive index and birefringence measurements on the tested films (results exclude the measurements on PS due to the large range of variation due to defects in the as-received film). All films except PET exhibit a small or negligible in-plane birefringence that aligns with the in-plane tensile test results. Processing conditions (e.g., drawing, stretching, and heating) have a significant effect on the variability of the in-plane birefringence [14,43,44]. PET and PEN exhibit high out-of-plane birefringence values compared with the other films. This high out-of-plane anisotropy may relate to the degree of film crystallinity, as PET and PEN have a strong affinity to form crystalline or ordered domains [43,45,46], consistent with a degree crystallinity of 17%–25% for PET and 17%–23% for PEN as measured using XRD. The directional independence of PMMA and 50 µm PC refractive indices (negligible in-plane and out-of-plane birefringence) indicate these films are fully isotropic. The same films were investigated using WAXS to verify the orientation properties measured using the optical method. Table 2 shows the Herman’s orientation factor calculated based on the 2D-WAXS measurements [47]. It is observed that most films have an orientation factor close to zero, which indicates an isotropic structure with no preferred orientation. PET and PEN, however, have orientation factors larger than 0.5 that indicate a considerable preferred orientation direction (out-of-plane, in this case), consistent with the optical measurements. Overall, a good linear correlation between the Herman’s orientation factor and birefringence is observed. See Figure S11 and other data pertinent to X-ray analysis as reported in the Supplementary Material.

4. Discussion

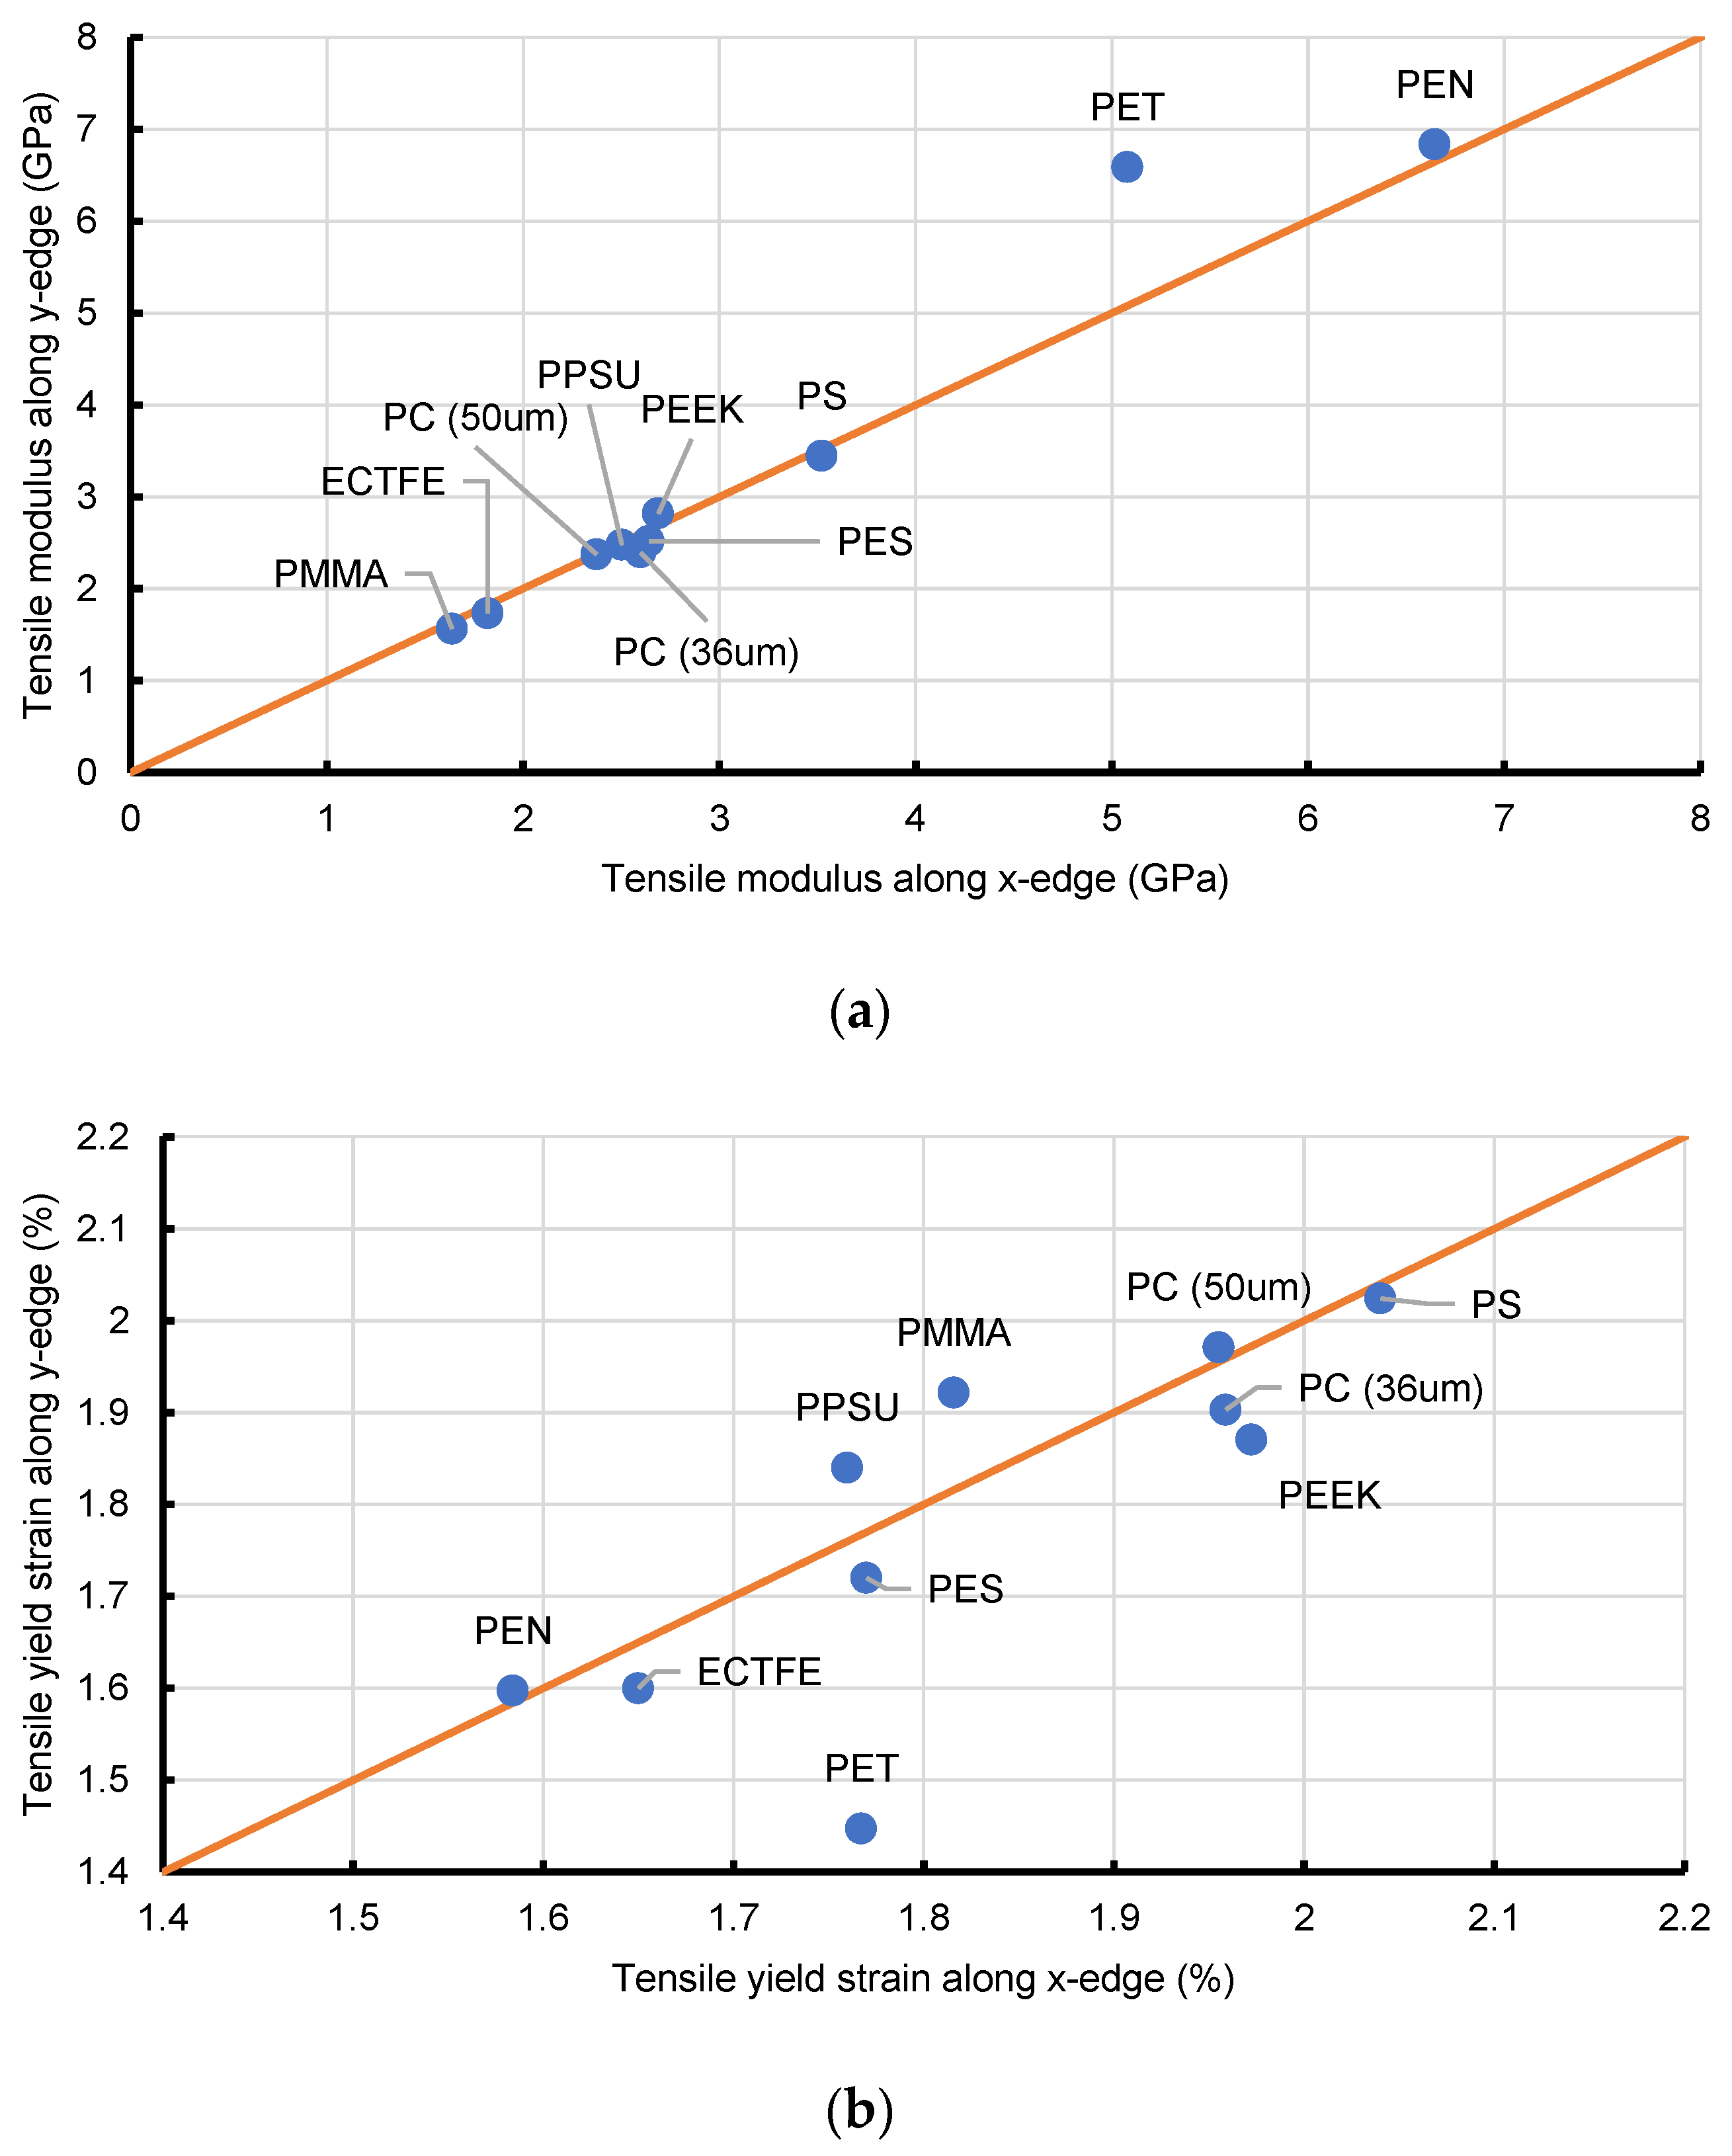
4.1. Elasticity and Yielding

The small-deformation film tensile responses are shown in Figure 1c,d. The slope of the initial linear portion was used to calculate each film’s elastic modulus in tension along the x and y axes, as depicted in Figure 2. The elastic moduli are independent of direction, except for PET. The same data points are plotted in Figure 4a along with the identity (y = x) line for better visualization. Apparently, all the data points are very close to the identity line, indicating an in-plane isotropic response, except for PET. PET film shows a unidirectional in-plane orientation that results in a higher elastic modulus along the y-axis. In addition, PET and PEN seem to have significantly higher elastic stiffness compared with other films. The films’ x- and y-direction tensile yield strains are shown in Figure 4b, along with the identity line. Most of the films exhibit a nearly isotropic yield strain except for PET; apparently, a higher stiffness of PET along the y-axis costs its elastic limit in this direction, the expected outcome. Combining a higher elastic modulus and lower yield strain along the y-direction, a less significant difference in the x- and y-direction yield stress of PET is observed, as shown in Figure 2e,f.
To further investigate the mechanical stiffness anisotropy, the in-plane average elastic modulus (average of x- and y-direction moduli) is compared with the indentation modulus along the z-axis as depicted in Figure 5, along with the identity line. PMMA, ECTFE, 50 µm PC, PPSU, PES, PEEK, and PS films exhibit almost similar in-plane and out-of-plane elastic moduli, indicating an isotropic mechanical response. Note that for PMMA, ECTFE, 50 µm PC, PPSU, PES, PEEK, and PS films, the z-direction indentation modulus is slightly higher than the average in-plane elastic modulus. This is probably because the indentation modulus is measured in a “confined” configuration of material and might be slightly higher than the unconfined configuration. The lower indentation modulus of the 36 µm PC is probably because the measured modulus for this thinner film was slightly affected by the substrate, which is an adhesive to bond the film to the stage and has a lower stiffness compared with the films (below 2 GPa). On the other hand, PET and PEN films exhibit a significantly lower out-of-plane elastic modulus compared with their average in-plane modulus. This indicates a highly anisotropic film behavior that is probably due to chain orientation. Considering Figure 4a and Figure 5, it is likely that PEN has a biaxial in-plane chain orientation, PET has a uniaxial in-plane chain orientation, and other tested films have a near-random orientation. This will be further studied in the forthcoming subsections by considering the film’s optical properties (birefringence).
Both indentation recovery and the elasticity index, h a r d n e s s m o d u l u s , can be used as a measure of film elastic response considering their one-to-one correlation (R2 = 0.94) as depicted in Figure 6a. Accordingly, we chose to use recovery herein to study the elastic limit in indentation. Figure 6b shows the in-plane tensile yield strain vs. the indentation recovery with an absence of any correlation between these two parameters for the isotropic films (PMMA, ECTFE, PC, PPSU, PES, PEEK, and PS), as the range of variation in indentation recovery is rather small. For the anisotropic films (PET and PEN), the variation in in-plane yield strain and the out-of-plane elastic recovery fall into a different regime. In Figure 6c, the indentation recovery is plotted against the degree of elastic anisotropy (average tensile modulus divided by indentation modulus). There is a good correlation between the two parameters, indicating a better indentation recovery of the films with enhanced in-plane macromolecular orientation.

4.2. Post-Yield Tensile Response

The full-range film tensile responses are shown in Figure 1a,b. Neglecting the elongation to break, the x- and y-direction finite deformation responses look virtually identical for all films except PET, which exhibits significantly different post-yield hardening behavior along the two perpendicular axes in consonance with its in-plane anisotropic elastic response (see Figure 4). In Figure 7a, the post-yield instantaneous film stiffness (the derivative of stress with respect to strain, d ( s t r e s s ) d ( s t r a i n ) , also known as the tangent stiffness) vs. crosshead strain is shown for PET. The initial film tangent stiffness is higher in the y-direction, which is consistent with the higher elastic modulus. In addition, the post-yield tangent stiffness is substantially greater in y-direction for a major part of the deformation but gradually approaches the x-direction response as the strain increases. This is an indication of the strong influence of chain orientation on the film’s mechanical response during elastic and plastic deformations. Nevertheless, with excessive deformation and additional chain alignment (cold drawing), the x- and y-direction film tangent moduli become more similar. This emphasizes that the large deformation not only erases the thermal history of the polymers (see ref. [11] for details), but also substantially affects the chain orientation, and a large biaxial cold drawing can induce in-plane isotropy. In Figure 7b, the post-yield tangent stiffness of PEN in x and y directions is shown; PEN represents the hardening response of all tested films (except for PET). Apparently, PEN exhibits an isotropic in-plane tangent stiffness that agrees with its elastic response.

4.3. Out-of-Plane Viscoelastic Response

In this section, we briefly discuss the film indentation creep response as a representative of film viscoelastic properties. The indentation creep was measured during the ten-second hold time of the loading cycle, as shown in Figure 3e. In Figure 8a,b, the variation in the indentation creep is shown vs. the indentation modulus and hardness, respectively. Both figures show a decaying trend (that is acceptably interpolated by a logarithmic function), indicating that a stiffer and harder polymer film behaves less time-dependently in the viscoelastic deformation regime.

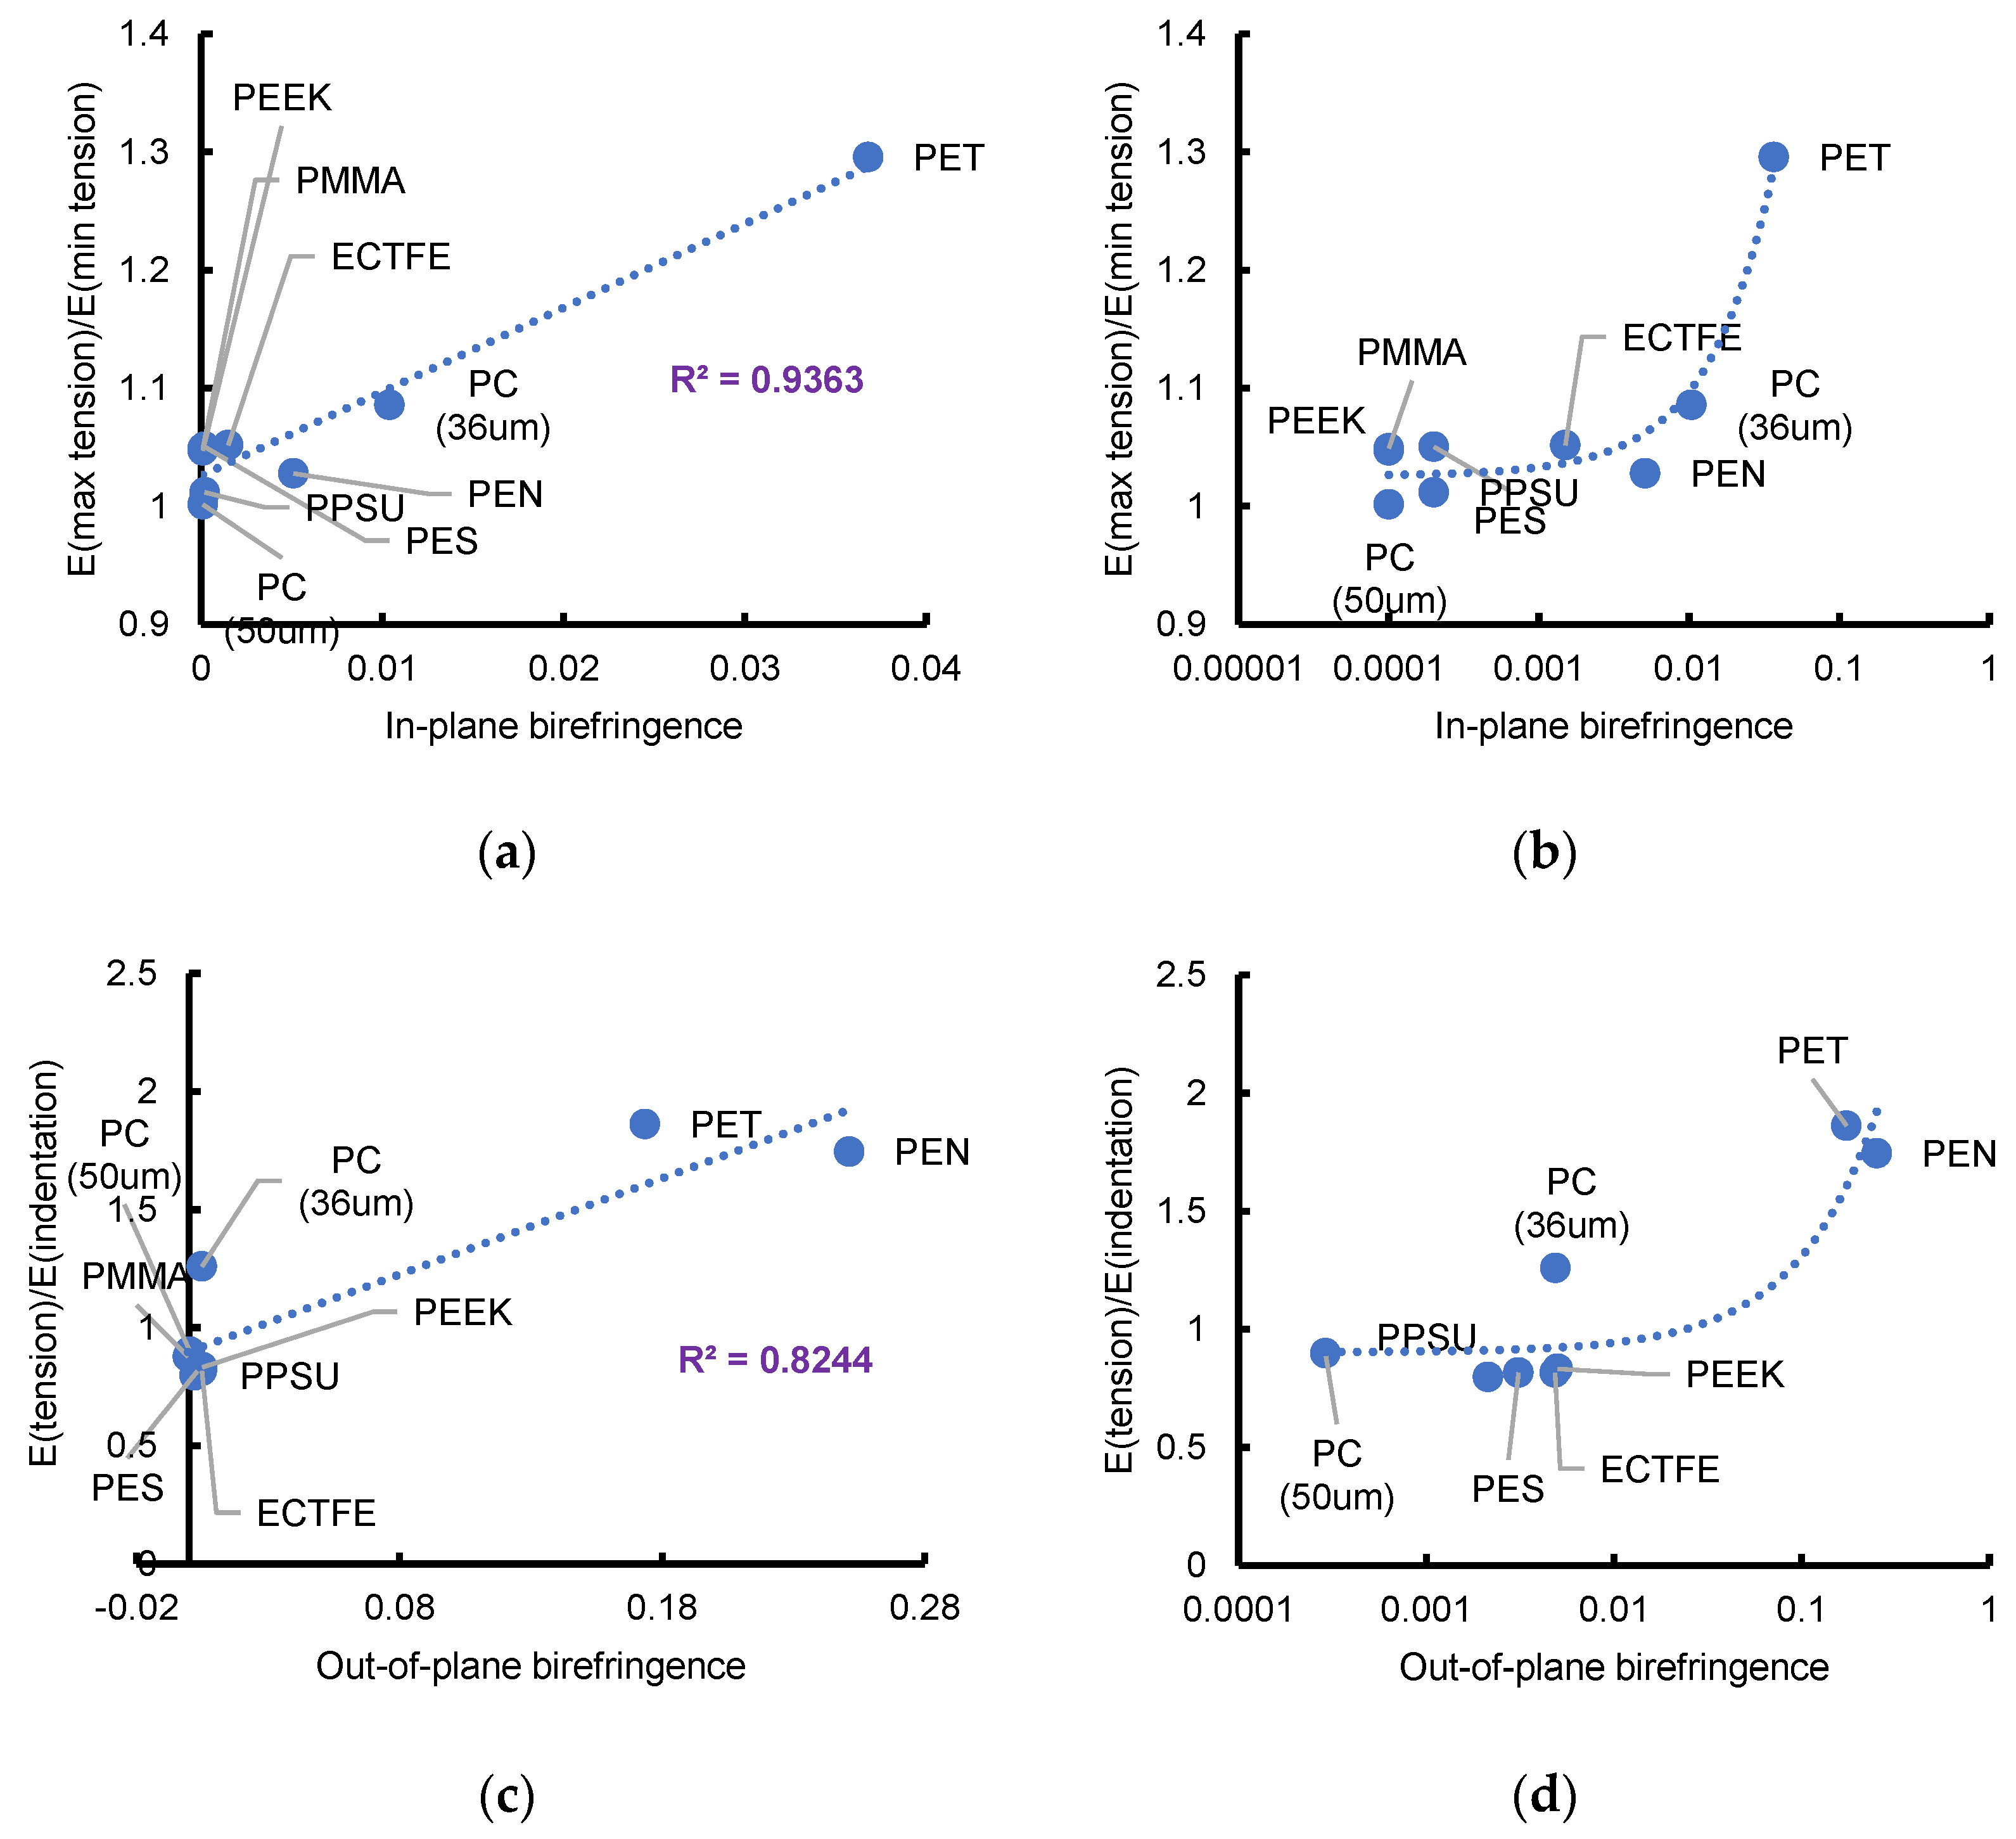
4.4. Coupling Optical and Mechanical Anisotropies

The mechanical and optical properties that are presented in Figure 2, Figure 3, and Table 1 were used to study the correlation between the mechanical and optical anisotropies. Figure 9a shows the variation in the in-plane degree of mechanical anisotropy (maximum in-plane elastic modulus divided by the minimum in-plane elastic modulus) vs. the in-plane optical anisotropy (birefringence). They depict a strong linear correlation. Figure 9c shows the variation in the out-of-plane degree of mechanical anisotropy (average in-plane elastic modulus divided by the out-of-plane elastic modulus) vs. the out-of-plane optical anisotropy (birefringence); they also exhibit a strong linear correlation (Figure 9b and Figure 9d are the same as Figure 9a and Figure 9c, respectively, except for being in a semi-log format for a better visualization of small values along the x-axis). Since the optical birefringence is an indication of the chain orientation and macromolecular alignment in the polymer films, the presented optical and mechanical data depict the importance of such alignments on the physical response of the polymer thin films. For the in-plane anisotropies depicted in Figure 9a,b, only PET has a non-negligible birefringence value and a significant mechanical anisotropy. This indicates a strong preferred chain orientation along the y-axis for this film. For the out-of-plane anisotropies depicted in Figure 9c,d, PET and PEN films both show a non-negligible birefringence value and a significant mechanical anisotropy. This suggests strong intermolecular stacking of polymer chains that yields ordered polymer domains in the film.
The optical refractive indices (birefringence) and in-plane tensile mechanical properties of the polymer films are rather simple properties to measure in a testing lab. Nevertheless, the through-thickness (z) direction mechanical properties are not easily measured since not all film characterization labs are equipped with nanomechanical testing equipment like a nanoindenter, especially at manufacturing sites. As such, and since the data presented in this study cover a wide range of transparent polymer films, it is helpful to develop a simple relationship between the out-of-plane elastic modulus and the in-plane elastic modulus and optical birefringence. Accordingly, one can draw the following empirical relationship based on the results shown in Figure 9c,d:
E z = E x + E y 4.28 ( n x + n y 2 n z ) + 1.84
where E and n represent the elastic modulus and refractive index, respectively, in the x, y, or z directions. In an ideal situation, one expects the z-direction modulus to be identical to the average in-plane modulus for a film with a zero out-of-plane birefringence; this means a constant equal to 2 in the denominator (y-intercept in Figure 9a). Nevertheless, the constant in Equation (6) is equal to 1.84, which is slightly smaller than 2, consistent with our previous explanation of the “confined” nature of nanoindentation modulus measurements (constrained compression) furnishing slightly higher moduli than with a tensile test. We should mention that the proposed equation was obtained for the nine polymer films investigated in this study, and any extrapolation should be limited to a qualitative assessment of the polymer of interest only.

4.5. Necking

The data presented in the previous sections indicate that PMMA, ECTFE, PC, PPSU, PES, PEEK, and PS films have nearly isotropic optical and mechanical responses, indicating a uniform distribution of chain orientation, whereas PET and PEN films show in-plane orientation with highly anisotropic optical and mechanical responses. Interestingly, Figure 1a,b indicate a necking instability in the tensile response of all films with an isotropic structure and mechanical behavior. On the other hand, PET and PEN both show steady hardening after yield and do not exhibit any necking instability during the in-plane tension test. Accordingly, an in-plane chain orientation improves the polymer film stability and can eliminate the necking. This observation is consistent with previous studies that showed suppression of necking instability in the uniaxial response of films with process-induced chain orientation [27].

5. Conclusions

In this study, we unraveled the presence of a strong correlation between the optical and mechanical anisotropies of polymers with different chemistries. Since the measurements were not limited to a single polymer, the findings in this study can be generalized to all other polymer films. In summary, we showed that some films have in- and/or out-of-plane mechanical anisotropies that are manifested as differences in mechanical properties measured along different directions. The same holds true for the light refraction that is manifested as non-zero birefringence values. In addition, the mechanical and optical anisotropies show a strong correlation for both in- and out-of-plane configuration, as they are strongly affected by chain orientation. While a mechanically isotropic film shows close-to-zero birefringence values, films with in- and/or out-of-plane mechanical anisotropies exhibit non-zero in- and/or out-of-plane birefringence. This consistency between the optical and mechanical anisotropies is because they both stem from the chain configuration in the polymer. In addition, we showed that anisotropic films with considerable in- and/or out-of-plane orientation do not show a necking instability in tension in contrast to those with a fully isotropic structure and optical and mechanical responses. Most of the chain orientations in the polymer films are process induced. Nevertheless, some polymers cannot undergo any chain alignment due to their chain structure, regardless of the manufacturing process.

Supplementary Materials

The following supporting information can be downloaded at: https://www.mdpi.com/article/10.3390/coatings14060764/s1, Figure S1: (a) in-plane, and (b) out of plane diffraction pattern of PS; Figure S2. (a) in-plane, and (b) out of plane diffraction pattern of PMMA; Figure S3. (a) in-plane, and (b) out of plane diffraction pattern of PET; Figure S4. (a) in-plane, and (b) out of plane diffraction pattern of PEN; Figure S5. (a) in-plane, and (b) out of plane diffraction pattern of PEEK; Figure S6. (a) in-plane, and (b) out of plane diffraction pattern of PES; Figure S7. (a) in-plane, and (b) out of plane diffraction pattern of ECTFE; Figure S8. (a) in-plane, and (b) out of plane diffraction pattern of PPSU; Figure S9. (a) in-plane, and (b) out of plane diffraction pattern of 50 µm PC; Figure S10. (a) in-plane, and (b) out of plane diffraction pattern of 36 µm PC; Figure S11. Herman’s orientation factor vs out-of-plane optical birefringence (the data point pertaining to PMMA was removed to enable a semi-log plot for a better visualization.).

Author Contributions

Conceptualization, A.S.-D., M.A.L., J.D.L. and H.E.B.; methodology, A.S.-D., J.D.L., C.W., M.Y., L.A.C. and K.K.; validation, A.S.-D., J.D.L., C.W., H.E.B., M.Y., L.A.C. and K.K.; formal analysis, A.S.-D., J.D.L., C.W., M.Y., L.A.C. and K.K.; investigation, A.S.-D., M.A.L., J.D.L. and H.E.B.; resources, A.S.-D. and H.E.B.; data curation, A.S.-D., J.D.L. and C.W.; writing—original draft preparation, A.S.-D., M.A.L., J.D.L., C.W. and H.E.B.; writing—review and editing, A.S.-D., M.A.L. and H.E.B.; supervision, A.S.-D.; project administration, A.S.-D. All authors have read and agreed to the published version of the manuscript.

Funding

This research received no external funding.

Institutional Review Board Statement

Not applicable.

Informed Consent Statement

Not applicable.

Data Availability Statement

Data are contained within the article and Supplementary Materials.

Acknowledgments

The authors would like to thank Jeffrey Meth, James Ryley, and Weiying Gao for technical discussions, Richard Seffrin, Rhonda Galloway, Gisela Vazquez, Jordan Wagner, Clark Scholl, and Gene Rossi for supporting the experiments, and David Belfiore and Meredith Dunbar for supporting this study at DuPont.

Conflicts of Interest

The authors declare no conflict of interest.

References

  1. White, M. Thin polymer films. Thin Solid Film. 1973, 18, 157–172. [Google Scholar] [CrossRef]
  2. Chatterjee, T.; Patel, R.; Garnett, I.V.J.; Paradkar, R.; Ge, S.; Liu, L.; Forziati Jr, K.T.; Shah, N. Machine direction orientation of high density polyethylene (HDPE): Barrier and optical properties. Polymer 2014, 55, 4102–4115. [Google Scholar] [CrossRef]
  3. Godshall, D.; Wilkes, G.; Krishnaswamy, R.K.; Sukhadia, A.M. Processing-structure-property investigation of blown HDPE films containing both machine and transverse direction oriented lamellar stacks. Polymer 2003, 44, 5397–5406. [Google Scholar] [CrossRef]
  4. Tabatabaei, S.H.; Parent, L.; Cigana, P.; Ajji, A.; Carreau, P.J. Effect of machine direction orientation conditions on properties of HDPE films. J. Plast. Film Sheeting 2009, 25, 235–249. [Google Scholar] [CrossRef]
  5. Kwon, O.H.; Ha, T.; Kim, D.-G.; Kim, B.G.; Kim, Y.S.; Shin, T.J.; Koh, W.-G.; Lim, H.S.; Yoo, Y. Anisotropy-driven high thermal conductivity in stretchable poly (vinyl alcohol)/hexagonal boron nitride nanohybrid films. ACS Appl. Mater. Interfaces 2018, 10, 34625–34633. [Google Scholar] [CrossRef]
  6. Prest, W., Jr.; Luca, D. The origin of the optical anisotropy of solvent cast polymeric films. J. Appl. Phys. 1979, 50, 6067–6071. [Google Scholar] [CrossRef]
  7. Kershah, T.; Anderson, P.D.; van Breemen, L.C. Uniaxial and Biaxial Response of Anisotropic Polypropylene. Macromol. Theory Simul. 2020, 29, 2000018. [Google Scholar] [CrossRef]
  8. Lee, C.S.; Caddell, R.M.; Yeh, G.S. Cold extrusion and cold drawing of polymeric rod: The influence on subsequent tensile and compressive mechanical properties. Mater. Sci. Eng. 1972, 10, 241–248. [Google Scholar] [CrossRef]
  9. López-Barrón, C.R.; Zeng, Y.; Schaefer, J.J.; Eberle, A.P.; Lodge, T.P.; Bates, F.S. Molecular alignment in polyethylene during cold drawing using in-situ SANS and Raman spectroscopy. Macromolecules 2017, 50, 3627–3636. [Google Scholar] [CrossRef]
  10. Robertson, R.E. On the cold-drawing of plastics. J. Appl. Polym. Sci. 1963, 7, 443–450. [Google Scholar] [CrossRef]
  11. Voyiadjis, G.Z.; Samadi-Dooki, A. Constitutive modeling of large inelastic deformation of amorphous polymers: Free volume and shear transformation zone dynamics. J. Appl. Phys. 2016, 119, 225104. [Google Scholar] [CrossRef]
  12. Boyce, M.C.; Parks, D.M.; Argon, A.S. Large inelastic deformation of glassy polymers. Part I: Rate dependent constitutive model. Mech. Mater. 1988, 7, 15–33. [Google Scholar] [CrossRef]
  13. Hasan, O.; Boyce, M.; Li, X.; Berko, S. An investigation of the yield and postyield behavior and corresponding structure of poly (methyl methacrylate). J. Polym. Sci. Part B Polym. Phys. 1993, 31, 185–197. [Google Scholar] [CrossRef]
  14. Yang, S.M.; Hong, S.; Kim, S.Y. Optical, mechanical, and photoelastic anisotropy of biaxially stretched polyethylene terephthalate films studied using transmission ellipsometer equipped with strain camera and stress gauge. J. Polym. Sci. Part B Polym. Phys. 2019, 57, 152–160. [Google Scholar] [CrossRef]
  15. Cimrova, V.; Neher, D.; Kostromine, S.; Bieringer, T. Optical anisotropy in films of photoaddressable polymers. Macromolecules 1999, 32, 8496–8503. [Google Scholar] [CrossRef]
  16. Ajji, A.; Zhang, X.; Elkoun, S. Biaxial orientation in HDPE films: Comparison of infrared spectroscopy, X-ray pole figures and birefringence techniques. Polymer 2005, 46, 3838–3846. [Google Scholar] [CrossRef]
  17. Pinnock, P.; Ward, I. Mechanical and optical anisotropy in polyethylene terephthalate fibres. Br. J. Appl. Phys. 1964, 15, 1559. [Google Scholar] [CrossRef]
  18. Ward, I. The influence of pre-orientation on the optical and mechanical anisotropy of drawn polymers. Br. J. Appl. Phys. 1967, 18, 1165. [Google Scholar] [CrossRef]
  19. Ward, I. Optical and mechanical anisotropy in crystalline polymers. Proc. Phys. Soc. 1962, 80, 1176. [Google Scholar] [CrossRef]
  20. Bridle, C.; Buckley, A.; Scanlan, J. Mechanical anisotropy of oriented polymers: Part 1 A yield criterion for uniaxially-drawn poly (ethylene terephthalate). J. Mater. Sci. 1968, 3, 622–628. [Google Scholar] [CrossRef]
  21. White, J.L.; Spruiell, J.E. The specification of orientation and its development in polymer processing. Polym. Eng. Sci. 1983, 23, 247–256. [Google Scholar] [CrossRef]
  22. Wu, M.S.S. Intrinsic birefringence of amorphous poly (bisphenol-A carbonate). J. Appl. Polym. Sci. 1986, 32, 3263–3275. [Google Scholar] [CrossRef]
  23. Zhang, X.; Elkoun, S.; Ajji, A.; Huneault, M. Oriented structure and anisotropy properties of polymer blown films: HDPE, LLDPE and LDPE. Polymer 2004, 45, 217–229. [Google Scholar] [CrossRef]
  24. Campoy-Quiles, M.; Etchegoin, P.; Bradley, D. On the optical anisotropy of conjugated polymer thin films. Phys. Rev. B 2005, 72, 045209. [Google Scholar] [CrossRef]
  25. Ye, C.; Singh, G.; Wadley, M.L.; Karim, A.; Cavicchi, K.A.; Vogt, B.D. Anisotropic mechanical properties of aligned polystyrene-block-polydimethylsiloxane thin films. Macromolecules 2013, 46, 8608–8615. [Google Scholar] [CrossRef]
  26. Li, H.; Buckley, C. Necking in glassy polymers: Effects of intrinsic anisotropy and structural evolution kinetics in their viscoplastic flow. Int. J. Plast. 2010, 26, 1726–1745. [Google Scholar] [CrossRef]
  27. Unwin, A.; Duckett, R.; Ward, I.M.; Collins, T.; Sweeney, J.; Coates, P.D. Suppression of necking in polyethylene. J. Appl. Polym. Sci. 2002, 86, 3135–3147. [Google Scholar] [CrossRef]
  28. Hossain, M.M.; Browning, R.; Minkwitz, R.; Sue, H.-J. Effect of asymmetric constitutive behavior on scratch-induced deformation of polymers. Tribol. Lett. 2012, 47, 113–122. [Google Scholar] [CrossRef]
  29. Hristov, H.; Bolan, B.; Yee, A.; Xie, L.; Gidley, D. Measurement of hole volume in amorphous polymers using positron spectroscopy. Macromolecules 1996, 29, 8507–8516. [Google Scholar] [CrossRef]
  30. Malekmotiei, L.; Voyiadjis, G.Z.; Samadi-Dooki, A.; Lu, F.; Zhou, J. Effect of annealing temperature on interrelation between the microstructural evolution and plastic deformation in polymers. J. Polym. Sci. Part B Polym. Phys. 2017, 55, 1286–1297. [Google Scholar] [CrossRef]
  31. ASTM D638-22; Standard Test Method for Tensile Properties of Plastics. ASTM: West Conshohocken, PA, USA, 2022.
  32. Briscoe, B.; Fiori, L.; Pelillo, E. Nano-indentation of polymeric surfaces. J. Phys. D Appl. Phys. 1998, 31, 2395. [Google Scholar] [CrossRef]
  33. Oliver, W.C.; Pharr, G.M. An improved technique for determining hardness and elastic modulus using load and displacement sensing indentation experiments. J. Mater. Res. 1992, 7, 1564–1583. [Google Scholar] [CrossRef]
  34. Voyiadjis, G.Z.; Samadi-Dooki, A.; Malekmotiei, L. Nanoindentation of high performance semicrystalline polymers: A case study on PEEK. Polym. Test. 2017, 61, 57–64. [Google Scholar] [CrossRef]
  35. Prasad, K.E.; Keryvin, V.; Ramamurty, U. Pressure sensitive flow and constraint factor in amorphous materials below glass transition. J. Mater. Res. 2009, 24, 890–897. [Google Scholar] [CrossRef]
  36. Samadi-Dooki, A.; Malekmotiei, L.; Voyiadjis, G.Z. Characterizing shear transformation zones in polycarbonate using nanoindentation. Polymer 2016, 82, 238–245. [Google Scholar] [CrossRef]
  37. Swadener, J.; George, E.; Pharr, G. The correlation of the indentation size effect measured with indenters of various shapes. J. Mech. Phys. Solids 2002, 50, 681–694. [Google Scholar] [CrossRef]
  38. Voyiadjis, G.Z.; Malekmotiei, L.; Samadi-Dooki, A. Indentation size effect in amorphous polymers based on shear transformation mediated plasticity. Polymer 2018, 137, 72–81. [Google Scholar] [CrossRef]
  39. Malekmotiei, L.; Samadi-Dooki, A.; Voyiadjis, G.Z. Nanoindentation study of yielding and plasticity of poly (methyl methacrylate). Macromolecules 2015, 48, 5348–5357. [Google Scholar] [CrossRef]
  40. Bodie Technology, Inc. Kornucopia® v4.0-05. Available online: www.BodieTech.com (accessed on 4 February 2023).
  41. Hay, J.; Crawford, B. Measuring substrate-independent modulus of thin films. J. Mater. Res. 2011, 26, 727–738. [Google Scholar] [CrossRef]
  42. Labonte, D.; Lenz, A.-K.; Oyen, M.L. On the relationship between indentation hardness and modulus, and the damage resistance of biological materials. Acta Biomater. 2017, 57, 373–383. [Google Scholar] [CrossRef]
  43. Haji, A.; Rahbar, R.S.; Kalantari, B. The effect of hot multistage drawing on molecular structure and optical properties of polyethylene terephthalate fibers. Mater. Res. 2012, 15, 554–560. [Google Scholar] [CrossRef]
  44. DeMeuse, M. Fundamentals of biaxial stretching and definitions of terms. In Biaxial Stretching of Film; Elsevier: Amsterdam, The Netherlands, 2011; pp. 3–13. [Google Scholar]
  45. Choi, M.-C.; Wakita, J.; Ha, C.-S.; Ando, S. Highly transparent and refractive polyimides with controlled molecular structure by chlorine side groups. Macromolecules 2009, 42, 5112–5120. [Google Scholar] [CrossRef]
  46. Kim, J.; Cakmak, M.; Zhou, X. Effect of composition on orientation, optical and mechanical properties of bi-axially drawn PEN and PEN/PEI blend films. Polymer 1998, 39, 4225–4234. [Google Scholar] [CrossRef]
  47. Gedde, U.W.; Hedenqvist, M.S. Fundamental Polymer Science; Springer: Cham, Switzerland, 2019; Volume 2. [Google Scholar]
Figure 1. (a,b): Full-range film tensile engineering stress vs. crosshead engineering strain response tested along x and y directions, respectively. (c,d): elastic regime film tensile engineering stress vs. extensometer engineering strain response tested along x and y directions, respectively.
Coatings 14 00764 g001
Figure 2. (a,b): Film tensile modulus along x and y directions, respectively; (c) and (d): film tensile yield strain along x and y directions, respectively; (e) and (f): film tensile yield stress along x and y directions, respectively.
Coatings 14 00764 g002
Figure 3. Indentation (a) modulus, (b) hardness, (c) hardness divided by modulus ratio (elasticity index), (d) recovery, and (e) creep for different films tested in the z-direction using the nanoindenter.
Coatings 14 00764 g003
Figure 4. Comparison of the (a) elastic modulus and (b) yield strain along the x and y directions for different films.
Coatings 14 00764 g004
Figure 5. Out-of-plane indentation modulus vs. average in-plane tensile elastic modulus.
Coatings 14 00764 g005
Figure 6. (a) Indentation recovery vs. indentation hardness divided by modulus ratio; (b) average in-plane yield strain vs. indentation recovery; (c) out-of-plane indentation recovery vs. the degree of elastic anisotropy (average tensile modulus divided by indentation modulus).
Coatings 14 00764 g006
Figure 7. The tangent modulus along the x and y directions for (a) PET and (b) PEN.
Coatings 14 00764 g007
Figure 8. Indentation creep vs. (a) indentation modulus and (b) indentation hardness.
Coatings 14 00764 g008
Figure 9. (a) Variation in the in-plane degree of mechanical anisotropy (maximum in-plane elastic modulus divided by the minimum in-plane elastic modulus) with the in-plane optical anisotropy (birefringence) and the linear interpolation. (b) Same as (a), but in a semi-log plot. (c) Variation in the out-of-plane degree of mechanical anisotropy (average in-plane elastic modulus divided by the out-of-plane elastic modulus) with the out-of-plane optical anisotropy (birefringence) and the linear interpolation. (d) Same as (c), but in a semi-log plot.
Coatings 14 00764 g009
Table 1. Results of the films’ refractive index and birefringence measurements.
Film n x n y n z In-Plane Birefringence
n x n y
Average Out-of-Plane Birefringence
n x + n y 2 n z
PMMA1.490861.490761.491240.00010−0.00043
PET1.689301.652481.497400.036820.17349
PEN1.768781.763661.514880.005120.25134
PEEK1.691901.691881.686880.000020.00501
PC (36 µm)1.595981.585621.585920.010360.00488
PC (50 µm)1.589421.589321.589080.000100.00029
PPSU1.682861.682641.680620.000220.00213
PES1.682561.682321.679360.000240.00308
ECTFE1.452281.450741.446660.001540.00485
Table 2. Herman’s orientation factor of the out-of-plane asymmetry based on the 2D-WAXS.
FilmHerman’s Orientation Factor
PS0.000972
PMMA−0.00599
PET0.8942
PEN0.9512
PEEK−0.0155
PC (36 µm)−0.00816
PC (50 µm)−0.0225
PPSU−0.0149
PES−0.0225
ECTFE−0.0791
Disclaimer/Publisher’s Note: The statements, opinions and data contained in all publications are solely those of the individual author(s) and contributor(s) and not of MDPI and/or the editor(s). MDPI and/or the editor(s) disclaim responsibility for any injury to people or property resulting from any ideas, methods, instructions or products referred to in the content.

