Article

Study on the Effects of GO on the Microstructure and Wear Resistance of CuCrZr Plasma Cladding Coatings

1
Department of 3, Shijiazhuang Campus of Army Engineering University, Shijiazhuang 050000, China
2
Department of Materials Engineering, Hebei Vocational University of Industry and Technology, Shijiazhuang 050000, China
3
Department of Electrical and Information Engineering, Hebei Jiaotong Vocational and Technical College, Shijiazhuang 050000, China
*
Authors to whom correspondence should be addressed.
Coatings 2024, 14(6), 763; https://doi.org/10.3390/coatings14060763
Submission received: 21 May 2024 / Revised: 12 June 2024 / Accepted: 13 June 2024 / Published: 16 June 2024
(This article belongs to the Section Plasma Coatings, Surfaces & Interfaces)

Abstract

:
This study investigates the enhancement of wear resistance in CuCrZr rails through the plasma cladding of CuCrZr-GO coatings with a varying graphene oxide (GO) content. The microstructure, phase composition, and mechanical properties of CuCrZr coatings containing 0%, 0.2%, 0.4%, 0.6%, and 0.8% GO were examined using scanning electron microscopy (SEM), X-ray diffraction (XRD), ESD surface scanning, friction and wear tests, and hardness analysis. The findings indicated that increasing the GO content from 0% to 0.6% results in a transition in the coating microstructure from columnar to equiaxed crystals, leading to an improved density. However, at 0.8% GO, numerous porosity defects were observed. The coating containing 0.6% graphene oxide (GO) exhibited a superior performance, with a hardness of 75, a friction coefficient of approximately 0.7, and a wear mass of 2.84 mg under a 10 N load. In comparison to the CuCrZr coating lacking GO, the hardness showed an increase of around 4.8%, the friction coefficient decreased by approximately 5.1%, and the wear mass diminished by 59.4%. These findings hold significant implications for extending the operational lifespan of electromagnetic railguns.

1. Introduction

The development trend of modern weaponry emphasizes attributes such as low cost, high precision, rapid response, and precision targeting [1]. Electromagnetic railguns represent an innovative kinetic energy weapon that utilizes electromagnetic energy to generate the Lorentz force, propelling the projectile to hypervelocity [2,3,4]. In comparison to traditional kinetic weapons, electromagnetic railguns offer advantages including high muzzle velocity, a long range, short response times, high kill power, and high security. As a revolutionary advancement, the electromagnetic railgun comprises essential components such as a pulsed power supply (PPS), two parallel fixed copper alloy rails, a current-carrying aluminum armature, an armature-driven projectile, and an insulating fixture. CuCrZr rails are currently prevalent in electromagnetic railgun tracks. This alloy offers superior strength, hardness, corrosion resistance, and wear resistance compared to pure Cu, while retaining 75% of the pure Cu’s conductivity, thus satisfying the demands of electromagnetic railgun tracks. When the armature slides at high speeds, phenomena such as friction and wear, transition and erosion, gouging, grooving, and the velocity skin effect (VSE) may occur at the armature/rail interface [5]. Currently, rails commonly employ a CuCrZr matrix material. Du Chuantong et al. [6] have explored surface coating applications for the armature/rail, and demonstrated the potential for mitigating the issues related to rail ablation, wear, and gouging through surface modifications of the rail material.
The incorporation of Gr into metal substrates has been demonstrated to enhance their overall mechanical properties [7,8]. Graphene, a two–dimensional material consisting of a single layer of carbon atoms, exhibits exceptional electrical and thermal conductivity, as well as outstanding wear resistance [9]. When added to alloy coatings, graphene can reduce the friction coefficient, increase the hardness, and improve the wear resistance. Plasma cladding technology [10,11,12,13,14,15], a metal-based coating preparation process, offers significant advantages in enhancing the surface properties, reducing the production costs, and improving the efficiency. It is difficult to incorporate graphene into CuCrZr powder due to substantial density differences and the poor material compatibility. Graphene oxide (GO), a derivative of graphene produced through oxidation, possesses a higher density and improved stability and machinability due to the introduction of oxygen atoms that form functional groups like carboxyl, hydroxyl, and epoxy groups. This modification facilitates the uniform dispersion of powders, enabling the preparation of alloy coatings with enhanced mechanical properties [16,17,18]. Graphene oxide (GO) possesses exceptional physical and chemical properties that can significantly enhance the mechanical strength, thermal and electrical conductivity, as well as corrosion resistance of materials. This study introduces GO as a novel modifying agent, applying various proportions of CuCrZr-GO coatings onto the surface of electromagnetic railgun rails through plasma cladding. The aim is to investigate the structural and performance variations of the coatings with differing GO concentrations, ultimately aiming to develop a high-performance CuCrZr-GO coating that can extend the lifespan of the rails and enhance the operational efficiency of electromagnetic railguns. This research holds significant implications for the advancement of electromagnetic railgun technology.

2. Materials and Methods

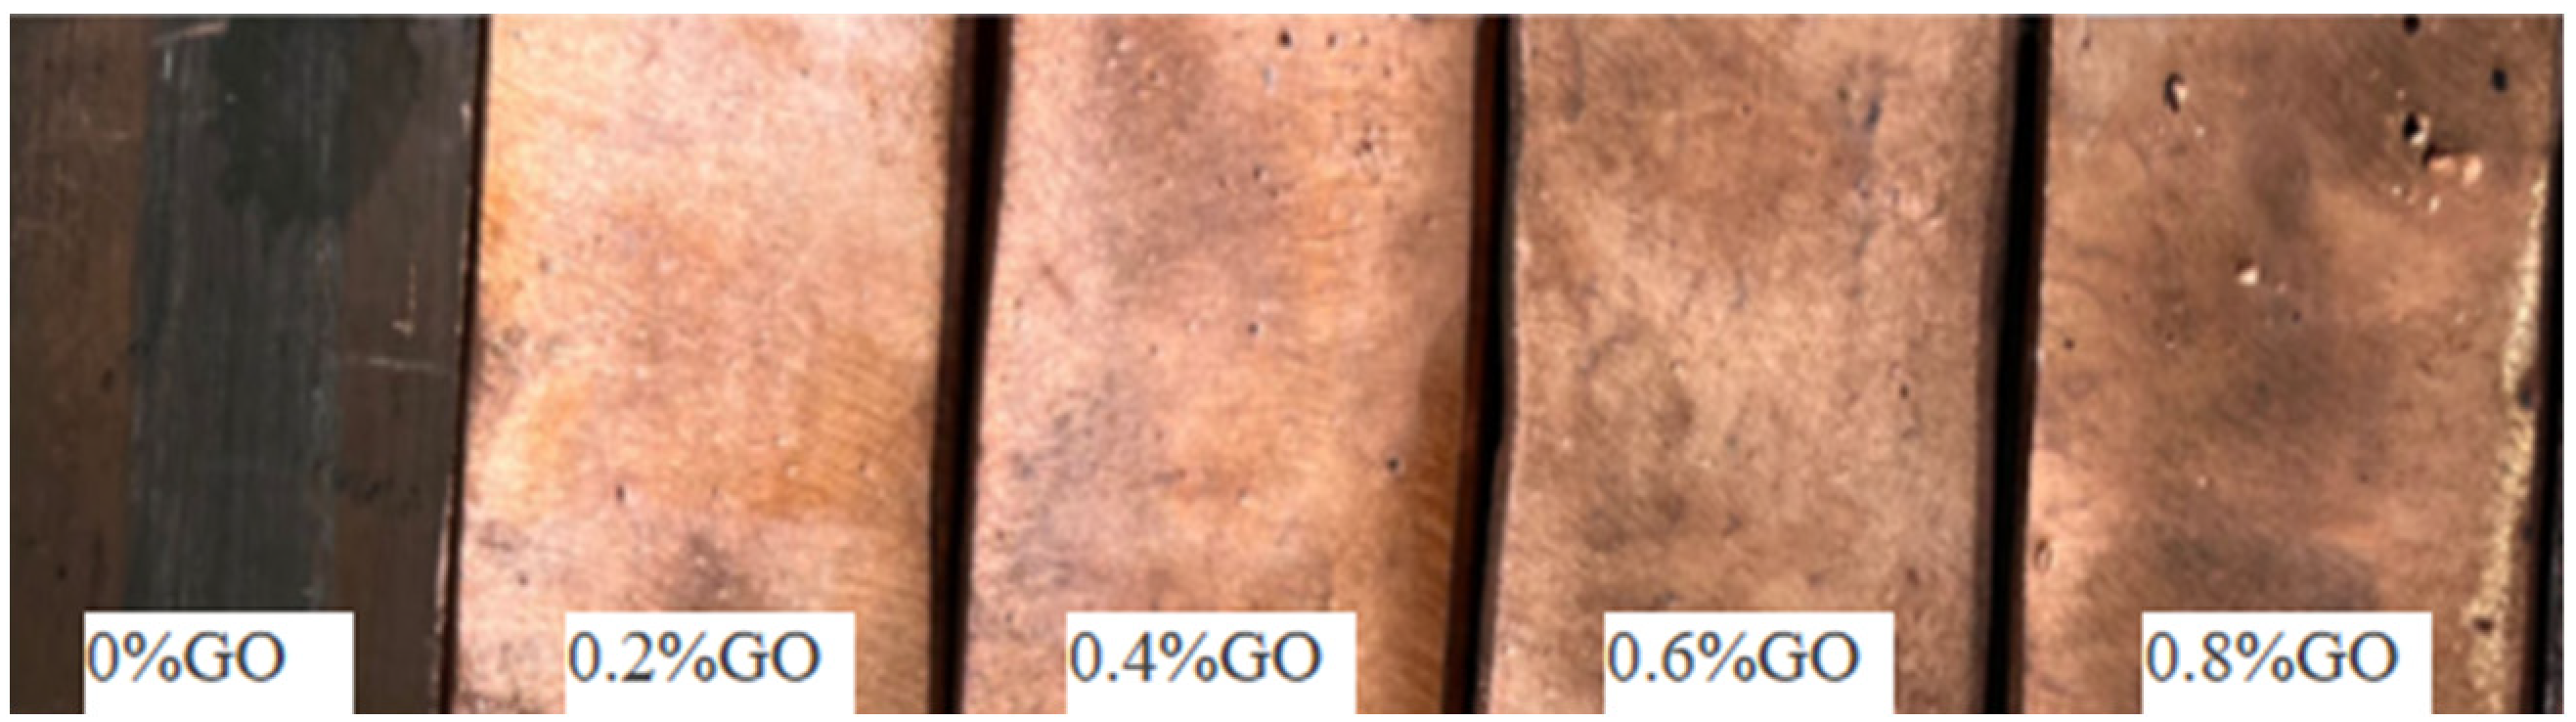
2.1. Coating Preparation

CuCrZr is widely used for rails in electromagnetic railguns, and its composition is detailed in Table 1.
The GO and CuCrZr powders were procured from Shijiazhuang Dongming New Material Technology Co., Ltd. (Shijiazhuang, China) GO is characterized by a black color, an average thickness of 1–3 nm, a diameter ranging from 3 to 5 μm, and consisting of 2–5 layers. On the other hand, CuCrZr powder appears dark yellow at the macroscopic level, displaying spherical micro-particles with an average size of 400–500 nm. The distribution and macroscopic morphology of the powder particles in terms of strength, quantity, and volume are illustrated in Figure 1. The particle size of the powder was measured using a laser particle-size analyzer (model: ZETASIZER NANO ZS90) at an ambient temperature. It was tested by the Beijing F0F Laboratory. As depicted in Figure 1, the particle size of the powder predominantly falls within the range of 400–500 nm. The composition of the powder is detailed in Table 2, with copper (Cu) being the primary component, accompanied by minor amounts of chromium (Cr) and zirconium (Zr) elements.
Different amounts of graphene oxide (GO) weighing 0.002 g, 0.004 g, 0.006 g, and 0.008 g were individually combined with 100 g of CuCrZr alloy powder via mechanical mixing for 30 min. This process yielded mixed powders containing GO concentrations of 0.2%, 0.4%, 0.6%, and 0.8%. Microscopic SEM images of the CuCrZr-GO mixed powders are presented in Figure 2a, revealing spherical particles. Figure 2b displays the mixture of CuCrZr and graphene, with the white arrows indicating the presence of GO. The GO appeared lamellar and was uniformly dispersed within the CuCrZr powder, without any noticeable agglomeration. Details of the powder composition can be found in Table 2.
The CuCrZr-GO coating was applied onto the CuCrZr track substrate using the plasma cladding equipment provided by Hebei Zhongni Technology Co., LTD (Shijiazhuang, China). The matrix dimensions were 25 mm × 25 mm × 25 mm. The matrix surface was sanded, ultrasonically cleaned for 1 h, and dried for 1 h prior to coating. The specific cladding parameters are detailed in Table 3. The substrate was preheated to 300 °C, and layer-by-layer welding was conducted at room temperature. The melting pool temperature was maintained at 1700 °C. The macroscopic morphology of the CuCrZr-GO coatings with varying GO contents is depicted in Figure 3. While the coatings generally exhibit a dense and smooth surface, the presence of numerous porosity defects becomes prominent when the GO content reaches 0.8%.

2.2. Characterization and Testing Methods

The microstructure and phase composition tests were performed by the Scientific Compass Testing Services. The tribological test was conducted using a reciprocating friction-testing machine (Bruker (CETR) UMT-2, Baoding, China) operating in the linear reciprocating motion mode. A GGr155 steel ball with a 6 mm diameter was utilized at an ambient temperature, with a friction duration of 30 min. The friction coefficient was directly recorded by the testing machine’s software. The wear rate (W) was calculated using the formula W = V/(FL), where W represents the wear rate in mm3/(N·m), V is the wear volume in mm3, F is the normal load in N, and L is the sliding distance in meters. Prior to the testing, the coating underwent polishing with 400#, 800#, 1500#, and 2000# diamond sandpaper to achieve a smooth surface. Subsequently, the coating was ultrasonically cleaned in anhydrous ethanol for 30 min to eliminate surface contaminants.
The friction and wear testing was performed by the Scientific Compass Testing Services. The coating surface microstructure was examined using a ZEISS metallography microscope (Carl Zeiss GMBH, Baoding, China, A1m), while the microstructure of the coating, friction, and wear marks was analyzed using a scanning electron microscope (ZEISS GeminiSEM 300, Baoding, China). The distribution of elements on the coating surface was observed using an ESD energy spectrometer (Smartedx, Baoding, China). The micromorphology of the powder was studied by using a scanning electron microscope (ZEISS GeminiSEM 300). The phase composition of the coating was determined using Empyrean, and the surface wear morphology was assessed with a Bruker Contour GT-K 3D profiler (Bruker, Baoding, China) to calculate the wear rate. The hardness of the coating was measured using a Wilson MicroVickers Hardness tester Wilson, Shijiazhuang, China, Tukon2500). The X-ray diffraction analysis was conducted by the Research Institute of Hebei Iron and Steel Group utilizing the Uranus X-ray diffractometer (PANalytical, Shijiazhuang, China), which scanned within the range of 10° to 80° at a speed of 2° per minute. Cobalt was the target material employed for the XRD analysis.

3. Results and Discussion

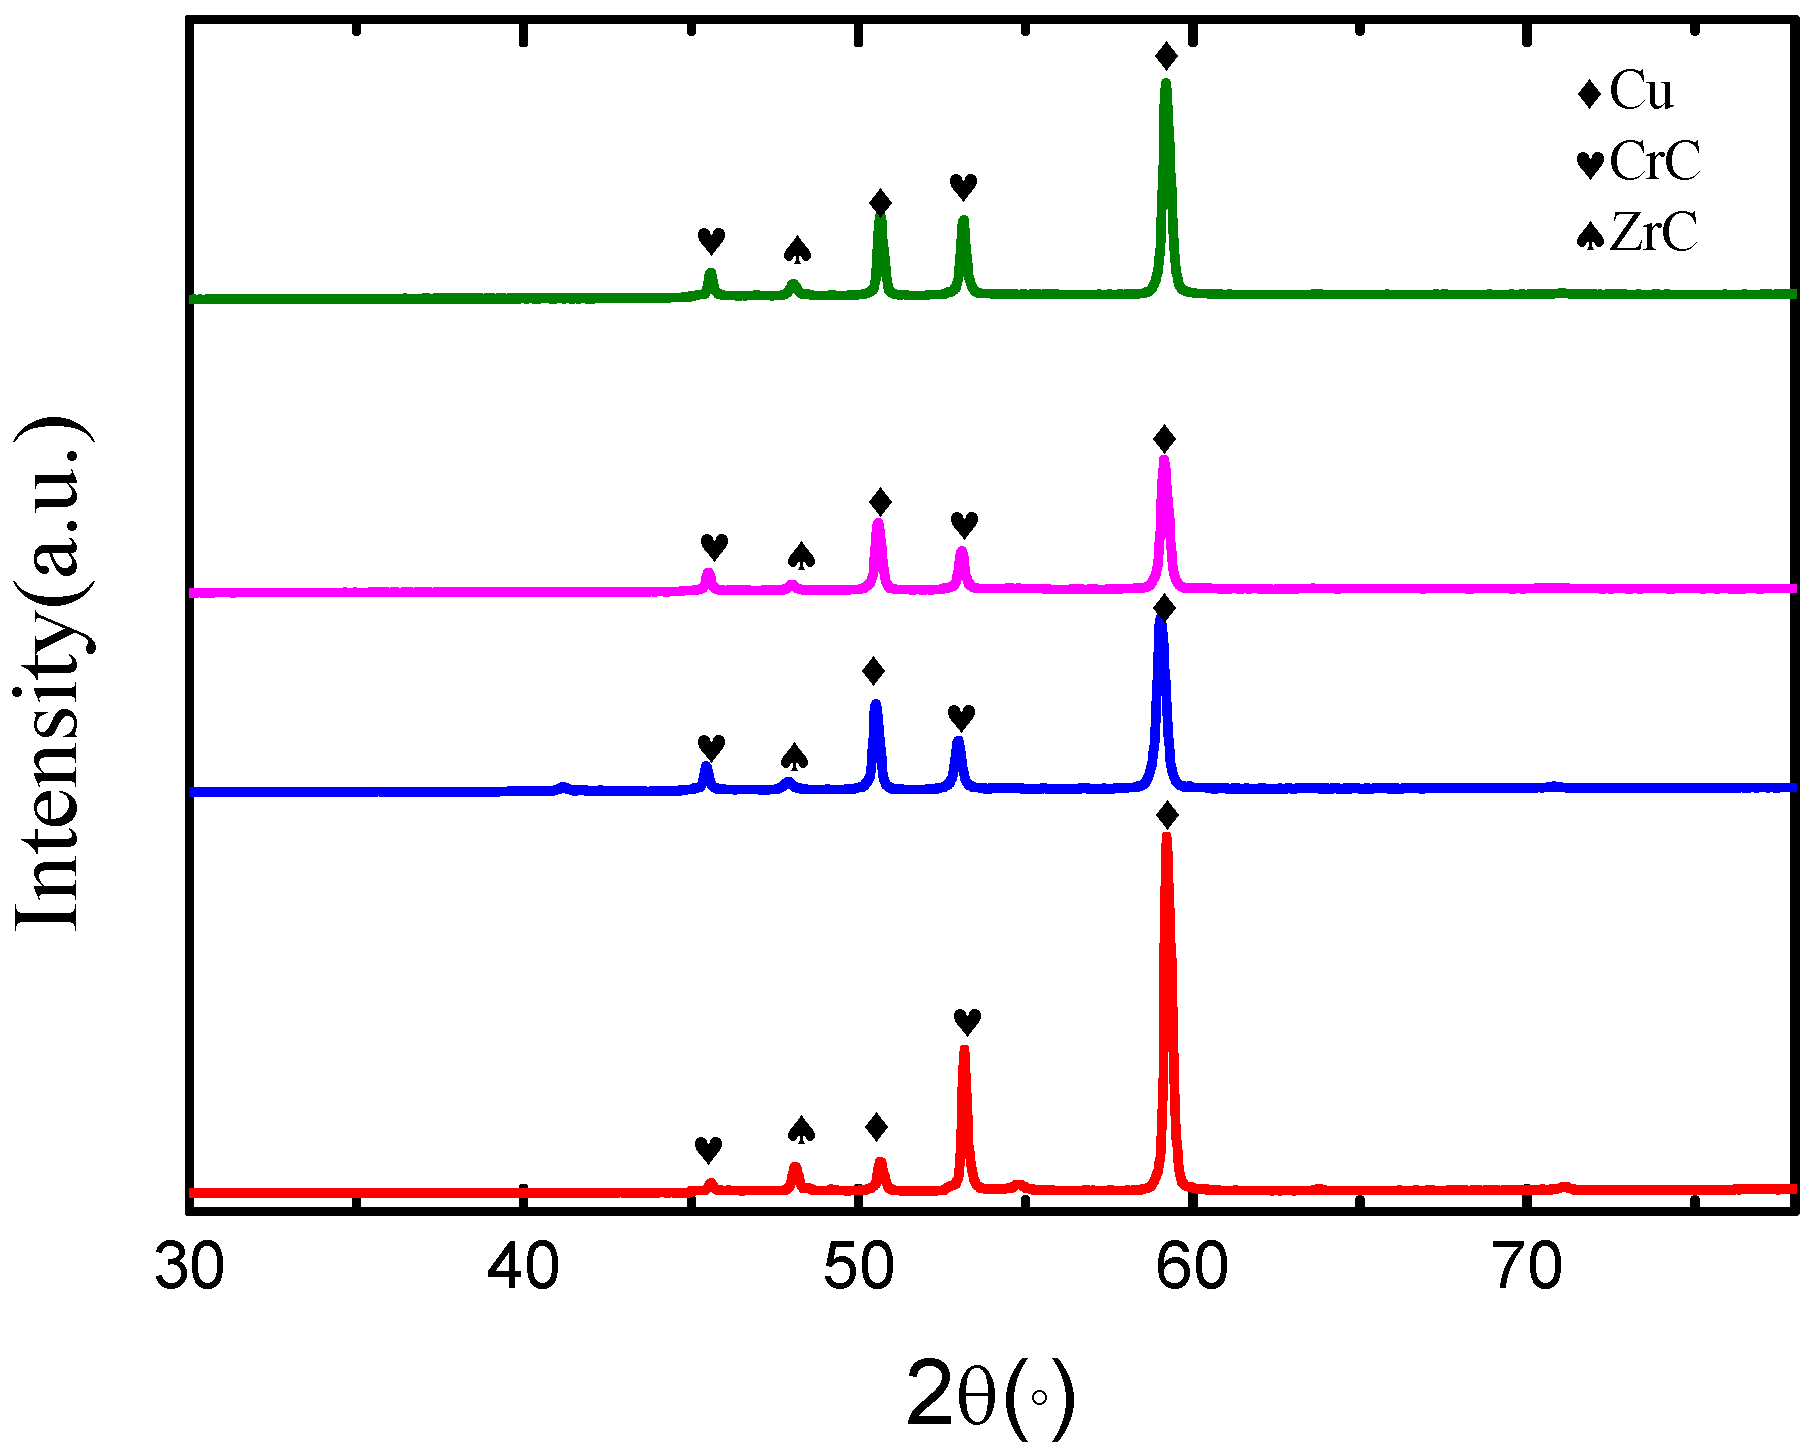
3.1. XRD Phase Analysis

The X-ray diffraction (XRD) patterns of the coatings containing 0.2%, 0.4%, 0.6%, and 0.8% graphene oxide (GO) are presented in Figure 4, revealing that the predominant phase remains copper (Cu). The introduction of GO during cladding results in the emergence of new phases, specifically chromium carbide (CrC) and zirconium carbide (ZrC), as evidenced by the XRD patterns. The carbonization of chromium and zirconium from the copper chromium zirconium powder with graphene leads to the formation of these carbides, influenced by the reaction conditions and mixing ratios. As the GO content increases, the intensity of the Cu peak diminishes gradually, accompanied by a rise in the relative proportions of other elements. It is possible that the quantity of the remaining carbon (C) elements is too minute for detection. Upon the addition of graphene oxide (GO) to the CuCrZr cladding coating, an oxidation reaction may occur, leading to the reduction of the oxygen in the graphene oxide and the production of ZrC. Simultaneously, the carbon elements in graphene oxide may chemically react with the elements in the CuCrZr alloy, resulting in the formation of new compounds. These reactions could involve the release or absorption of energy, causing changes in the enthalpy. To further investigate the impact of graphene oxide addition on the CuCrZr cladding coating, future experiments or simulation calculations could focus on quantifying the generation of ZrC and the enthalpy of formation.

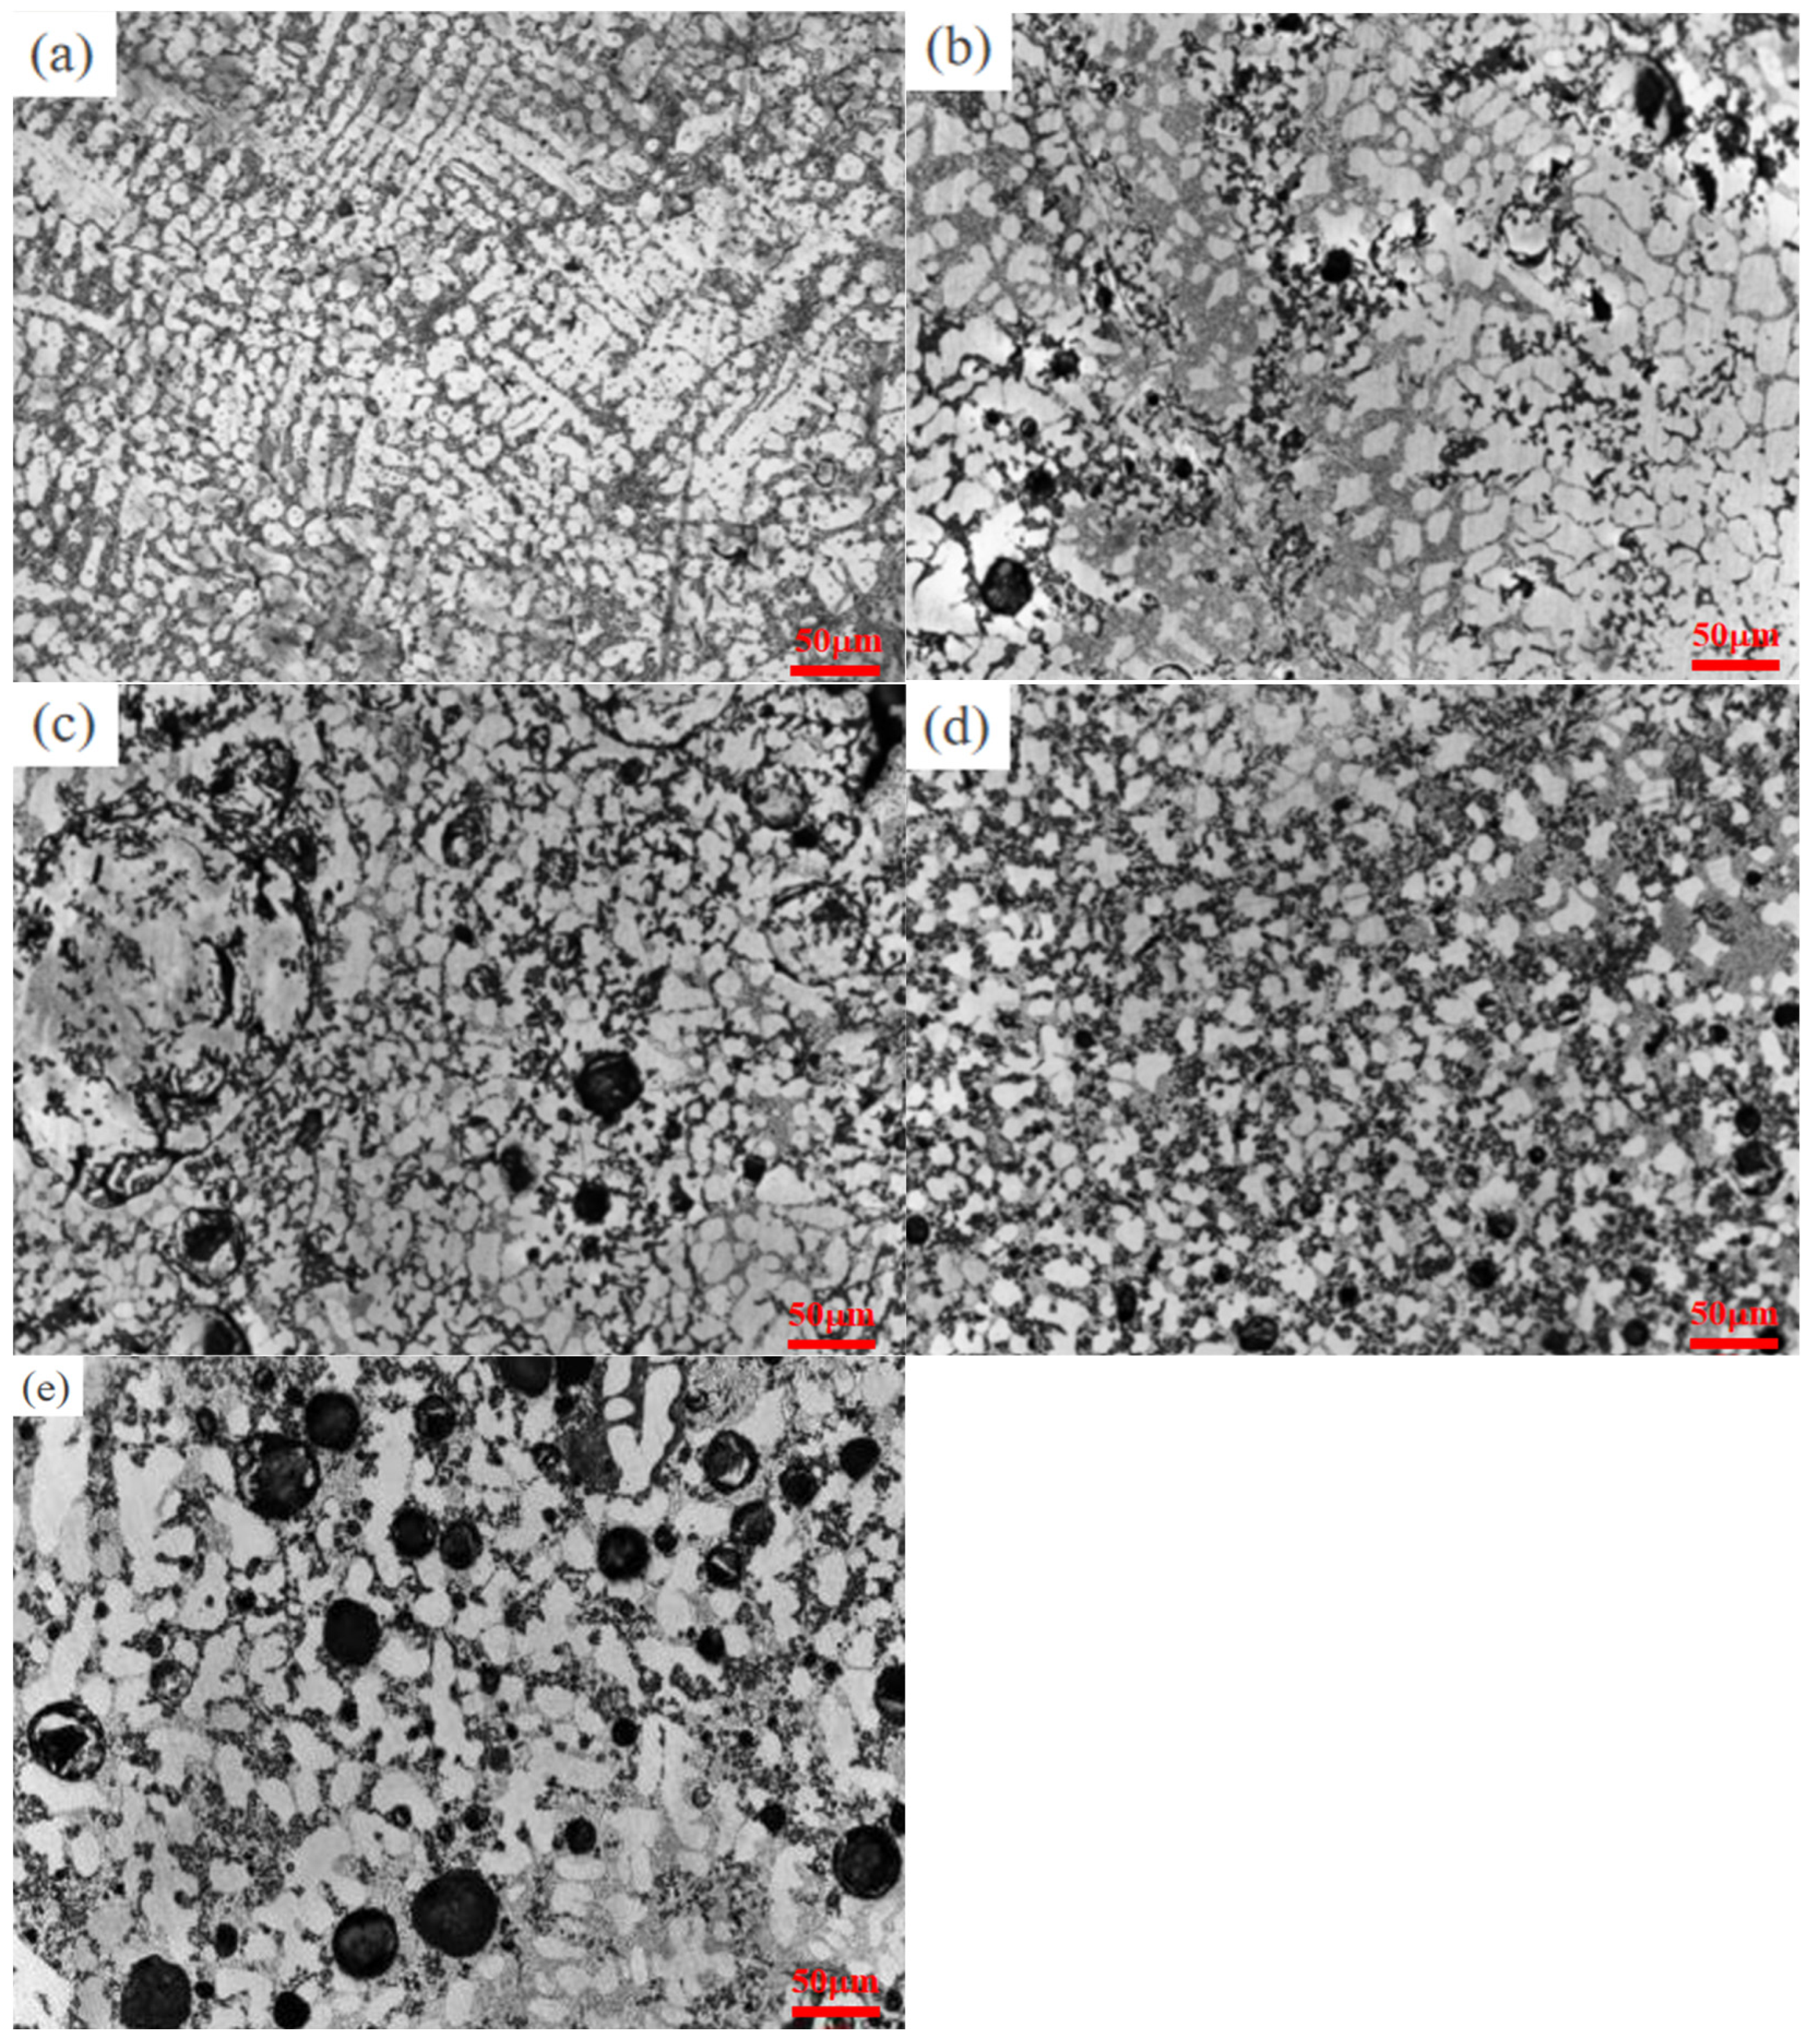
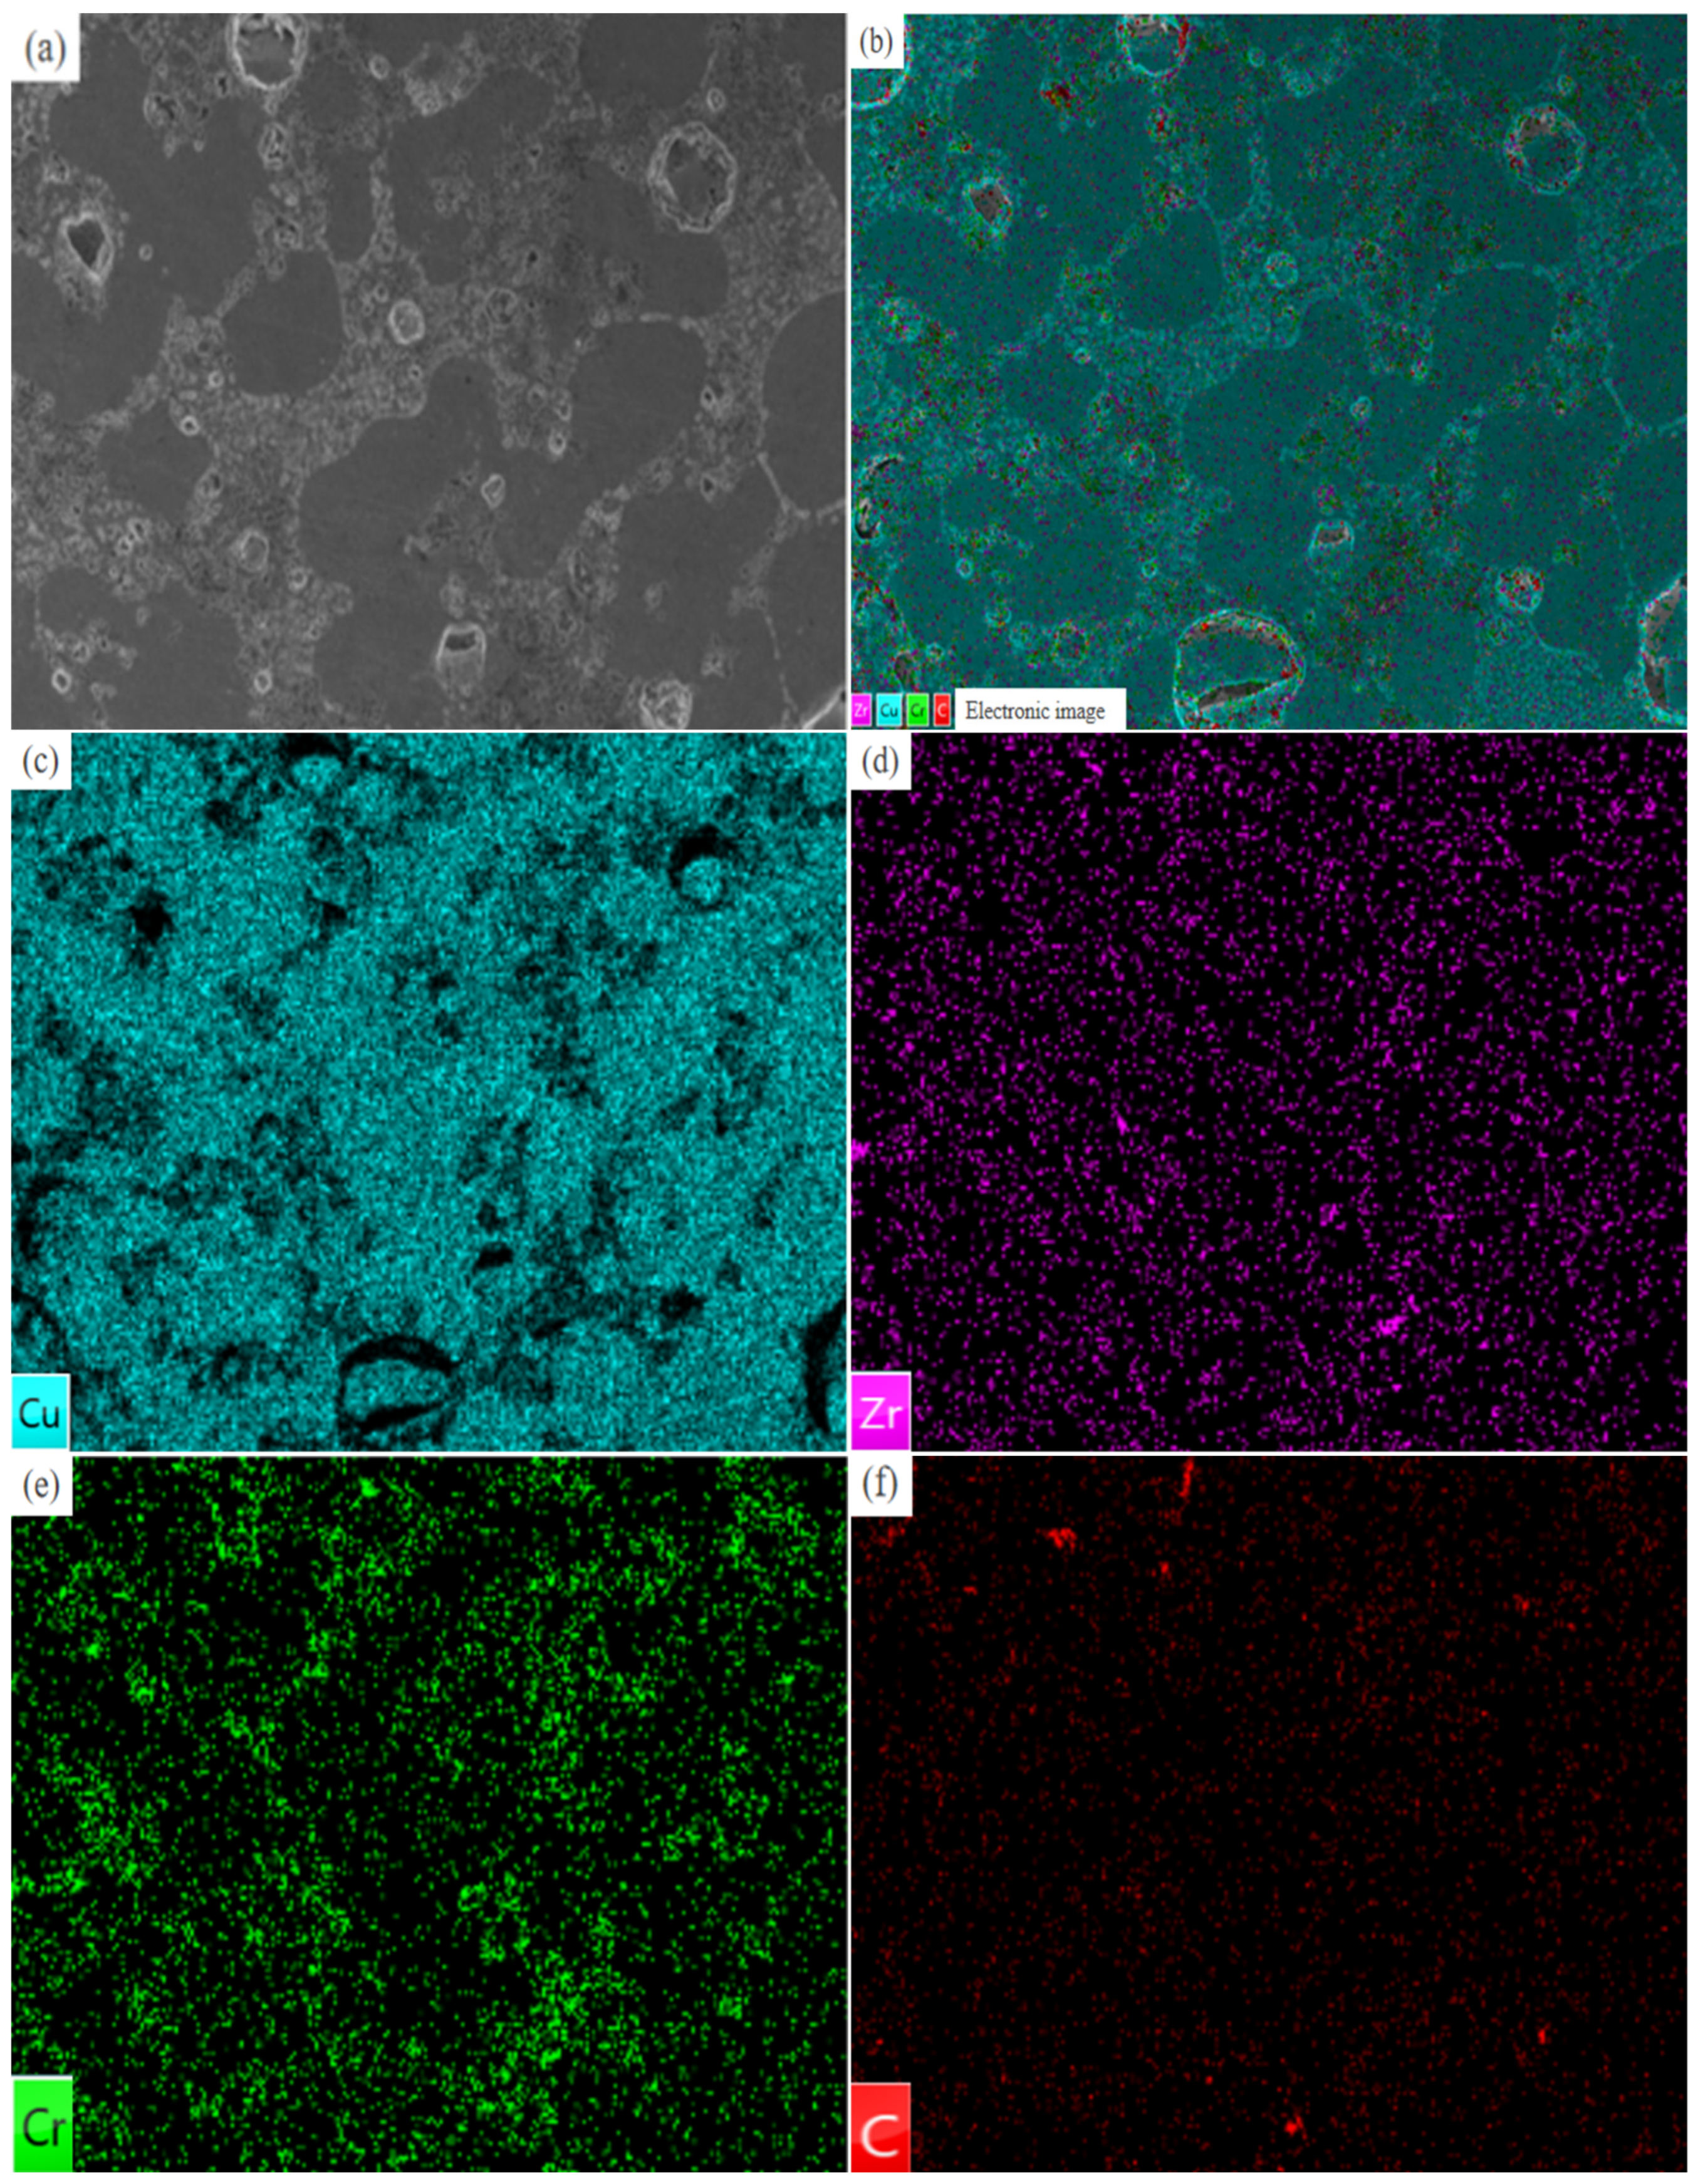
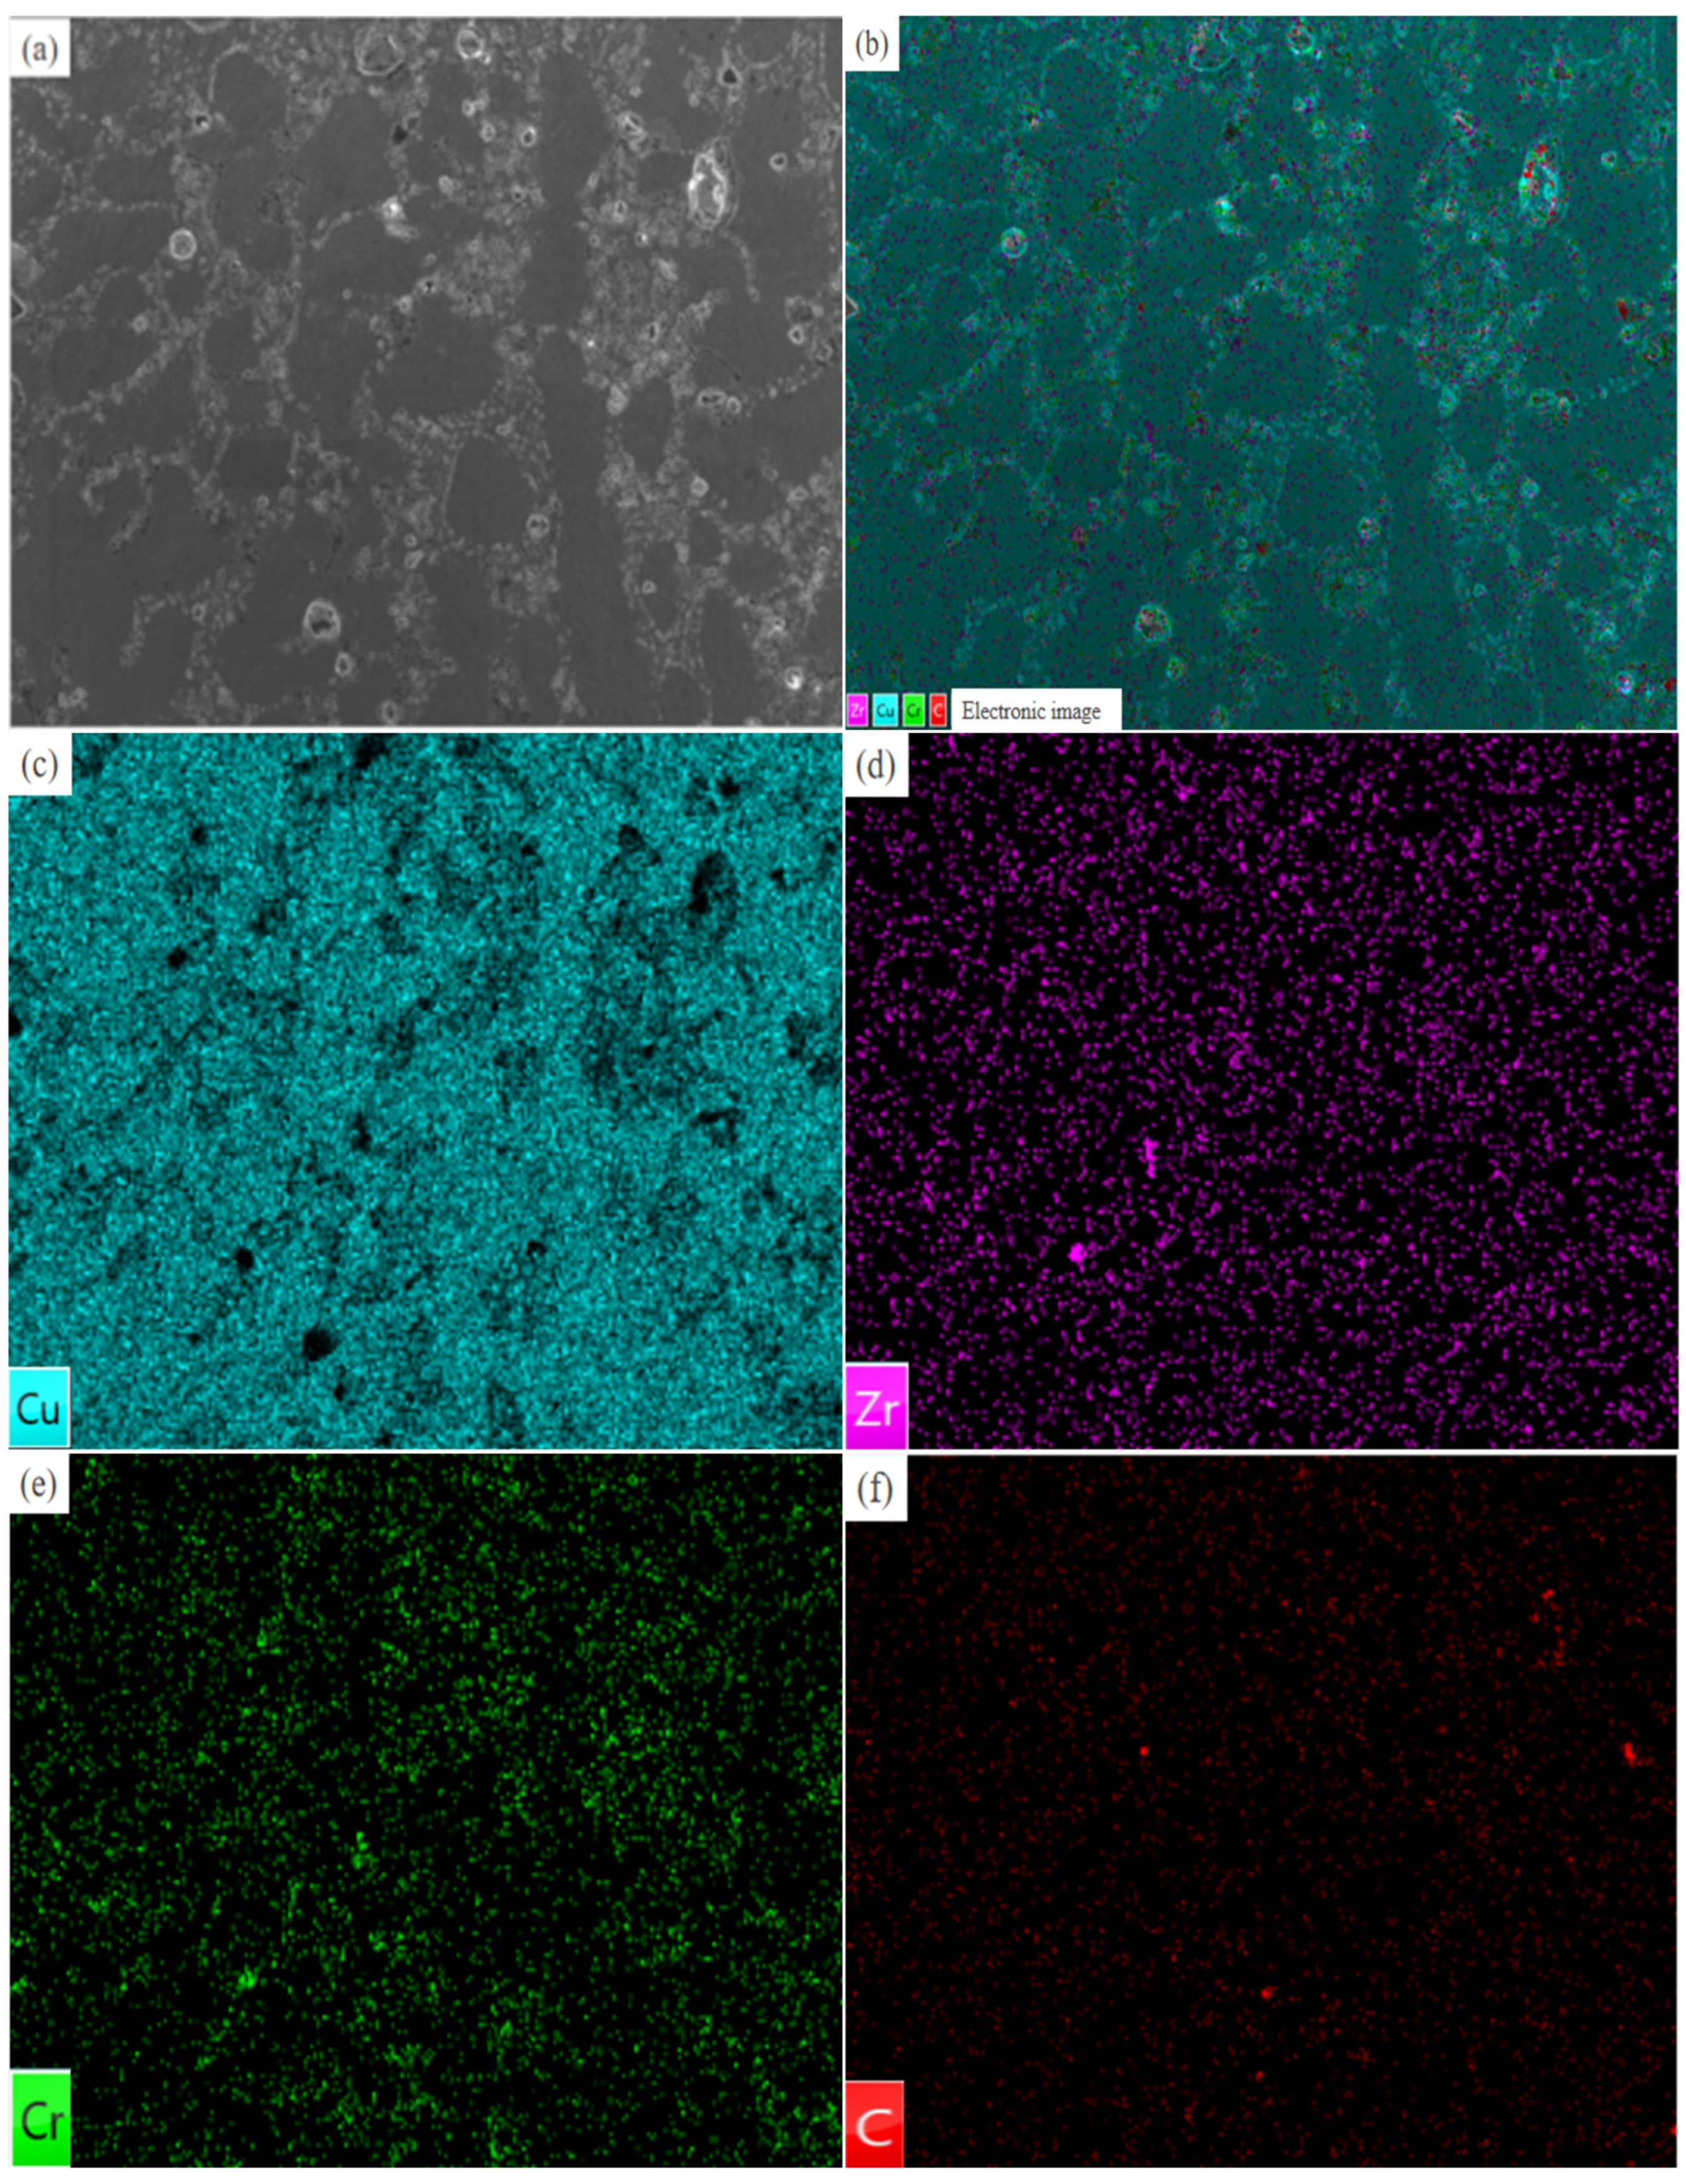
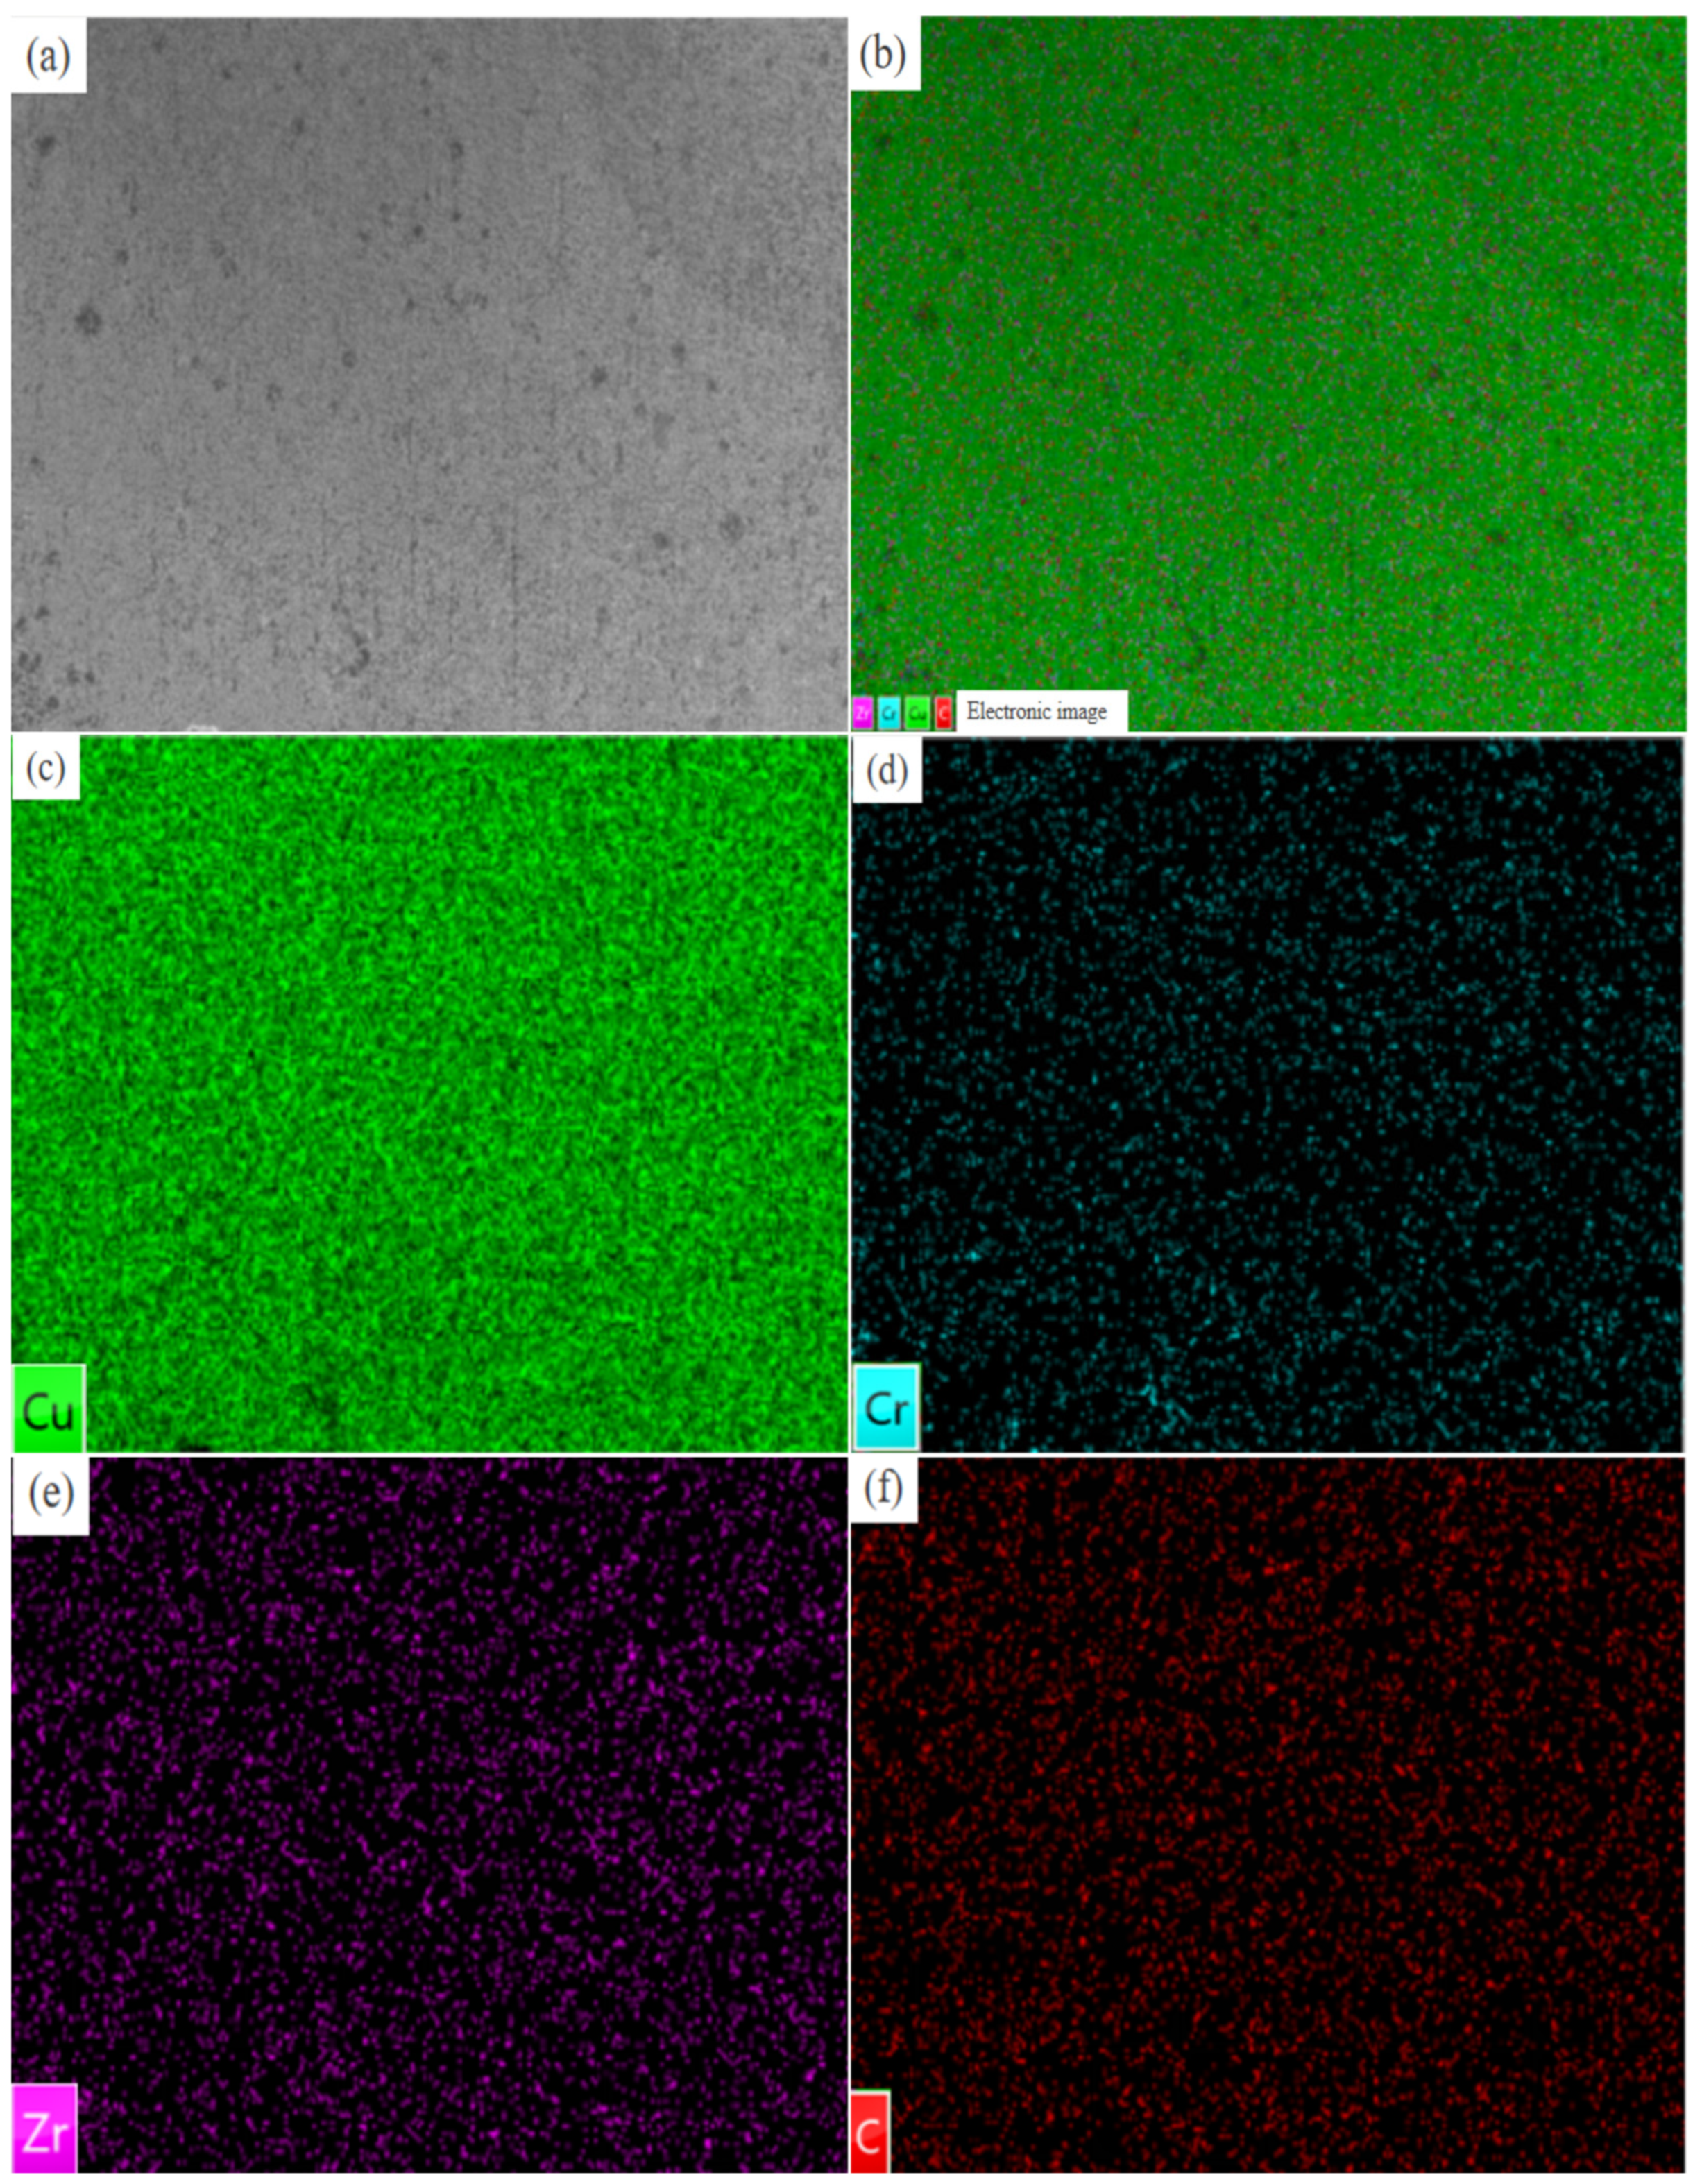
3.2. Microstructure and Element Distribution of Coatings

Firstly, the microstructure of the coating was analyzed. Figure 5a displays the surface images of a 0% graphene oxide (GO) plasma cladding coating, consisting mainly of cylindrical crystals with anisotropy, a copper matrix, and Cr and Zr phases dispersed within the matrix. Figure 5b–e depict the surface images of cladding coatings with 0.2%, 0.4%, 0.6%, and 0.8% GO additions, respectively. The images reveal significant changes in the grain morphology and size in response to varying amounts of GO. A 0.2% GO addition results in a smaller grain size compared to the 0% GO coating, transforming dendrites into equiaxial crystals, albeit with a non-uniform composition distribution and visible defects. With a 0.4% GO addition, the grain size tends towards uniformity, although some defects like holes and bubbles persist. A 0.6% GO addition yields fine and compact equiaxed grains, an improved composition distribution, and reduced surface defects. However, a 0.8% GO addition leads to a high occurrence of porosity defects in the coating. The study demonstrates that GO addition can impede columnar crystal growth, promote equiaxial crystal formation, and refine the grain size significantly. This effect is attributed to GO’s ability to regulate the alloy’s liquid surface tension, provide active sites, alter the flow properties, and enhance the grain and grain boundary recrystallization processes, thereby refining the grains [19]. When the graphene oxide (GO) content exceeds optimal levels, it causes graphene to aggregate within the coating, leading to agglomeration. This phenomenon hinders the dispersion of graphene particles, increases the voids between them, and results in porosity defects. Moreover, an excessive amount of GO also impairs the coating’s fluidity, hampering its ability to uniformly cover the substrate’s surface during the coating process, thereby exacerbating the occurrence of porosity defects.
To investigate the impact of varying graphene oxide (GO) concentrations on the element distribution within the coating, the distribution of elements in EDS surface scans was examined. Figure 6, Figure 7, Figure 8 and Figure 9 display the EDS surface scan element distributions for GO coatings containing 0.2%, 0.4%, 0.6%, and 0.8% GO, respectively. Analysis of the SEM images reveals that the Cu phase dominates the coating, with an increasing GO content leading to a gradual rise in the carbon (C) levels and the refinement of the coating structure. The distribution diagram reveals that Cu predominantly resides in the gray phase, while Cr is primarily located in the white phase. Zr, on the other hand, is evenly dispersed in both the Cu-rich and Cr-rich phases, exhibiting no aggregation phenomenon. At a GO concentration of 0.6%, the element distribution is the most uniform, whereas at 0.8% GO, the elements are evenly distributed but surface imperfections are evident. The XRD pattern indicates that carbon primarily exists in the form of chromium carbide (CrC), zirconium carbide (ZrC), and GO, with a relatively uniform overall distribution of carbon.

3.3. Mechanical Properties of Coating

The Vickers hardness values of the coatings are presented in Figure 10. The load scale is HV0.1. It is evident that the coating containing 0.6% graphene oxide (GO) exhibits the highest hardness at 75, followed by the coating with 0.4% GO at 73.5, the coating with 0.2 % GO at 72, and the coating with 0.8% GO at 73. The variations in the hardness are attributed to the phase composition and microstructure of the coatings. X-ray diffraction (XRD) analysis reveals the formation of CrC and ZrC phases in the coatings upon the addition of GO. These phases contribute to the enhancement of the hardness and wear resistance by generating hard particles within the base material, effectively mitigating the wear and surface scratches. Moreover, they elevate the material’s hardness, thereby augmenting its durability and wear resistance [20].

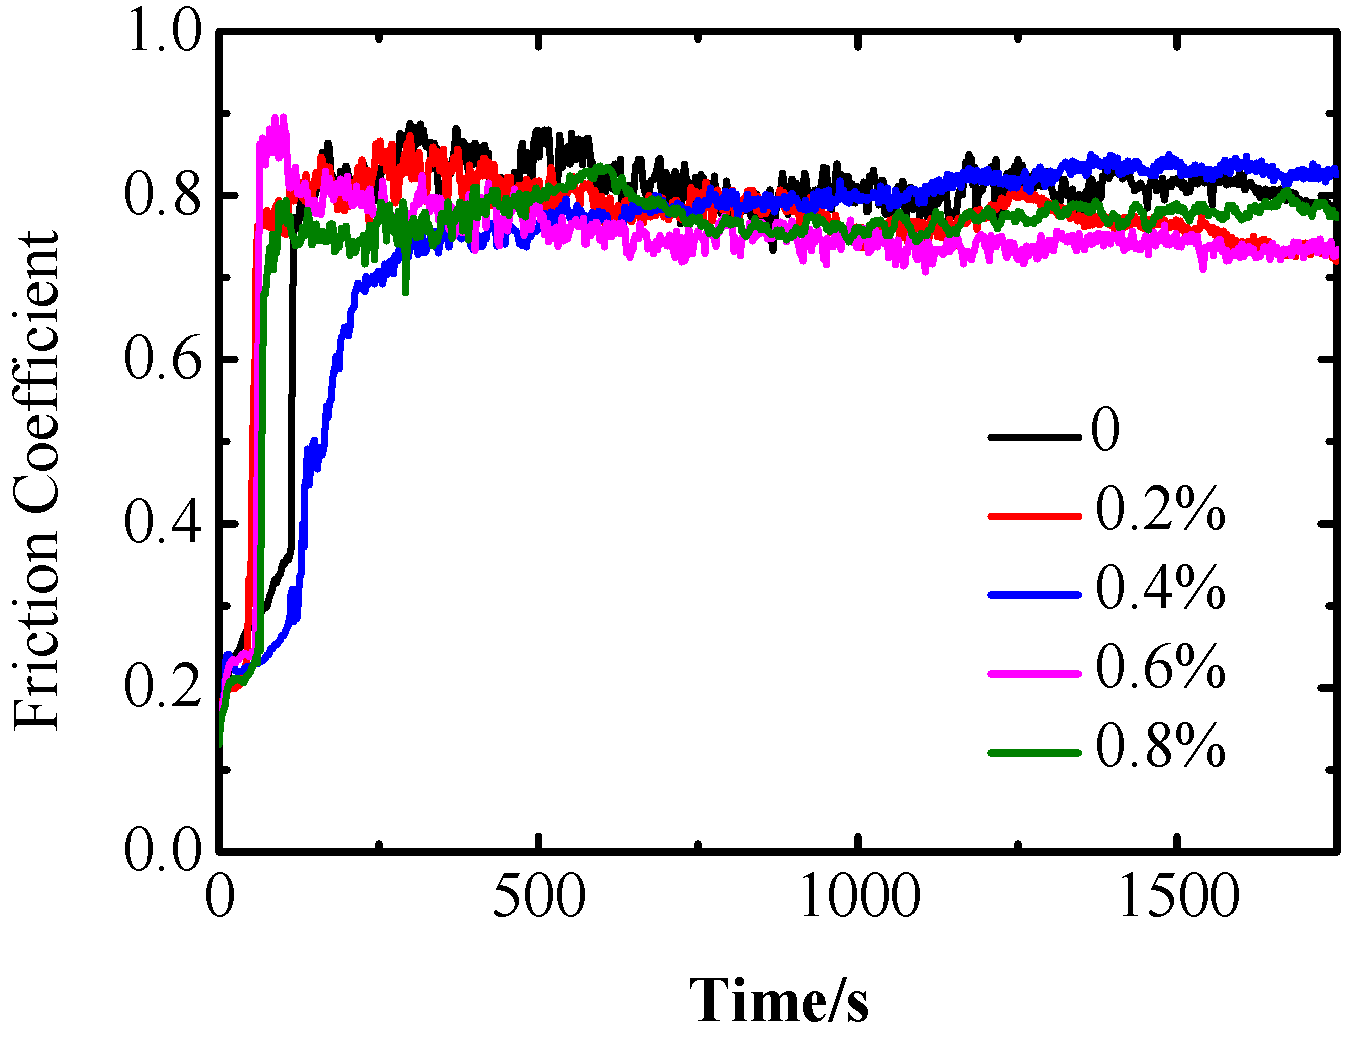
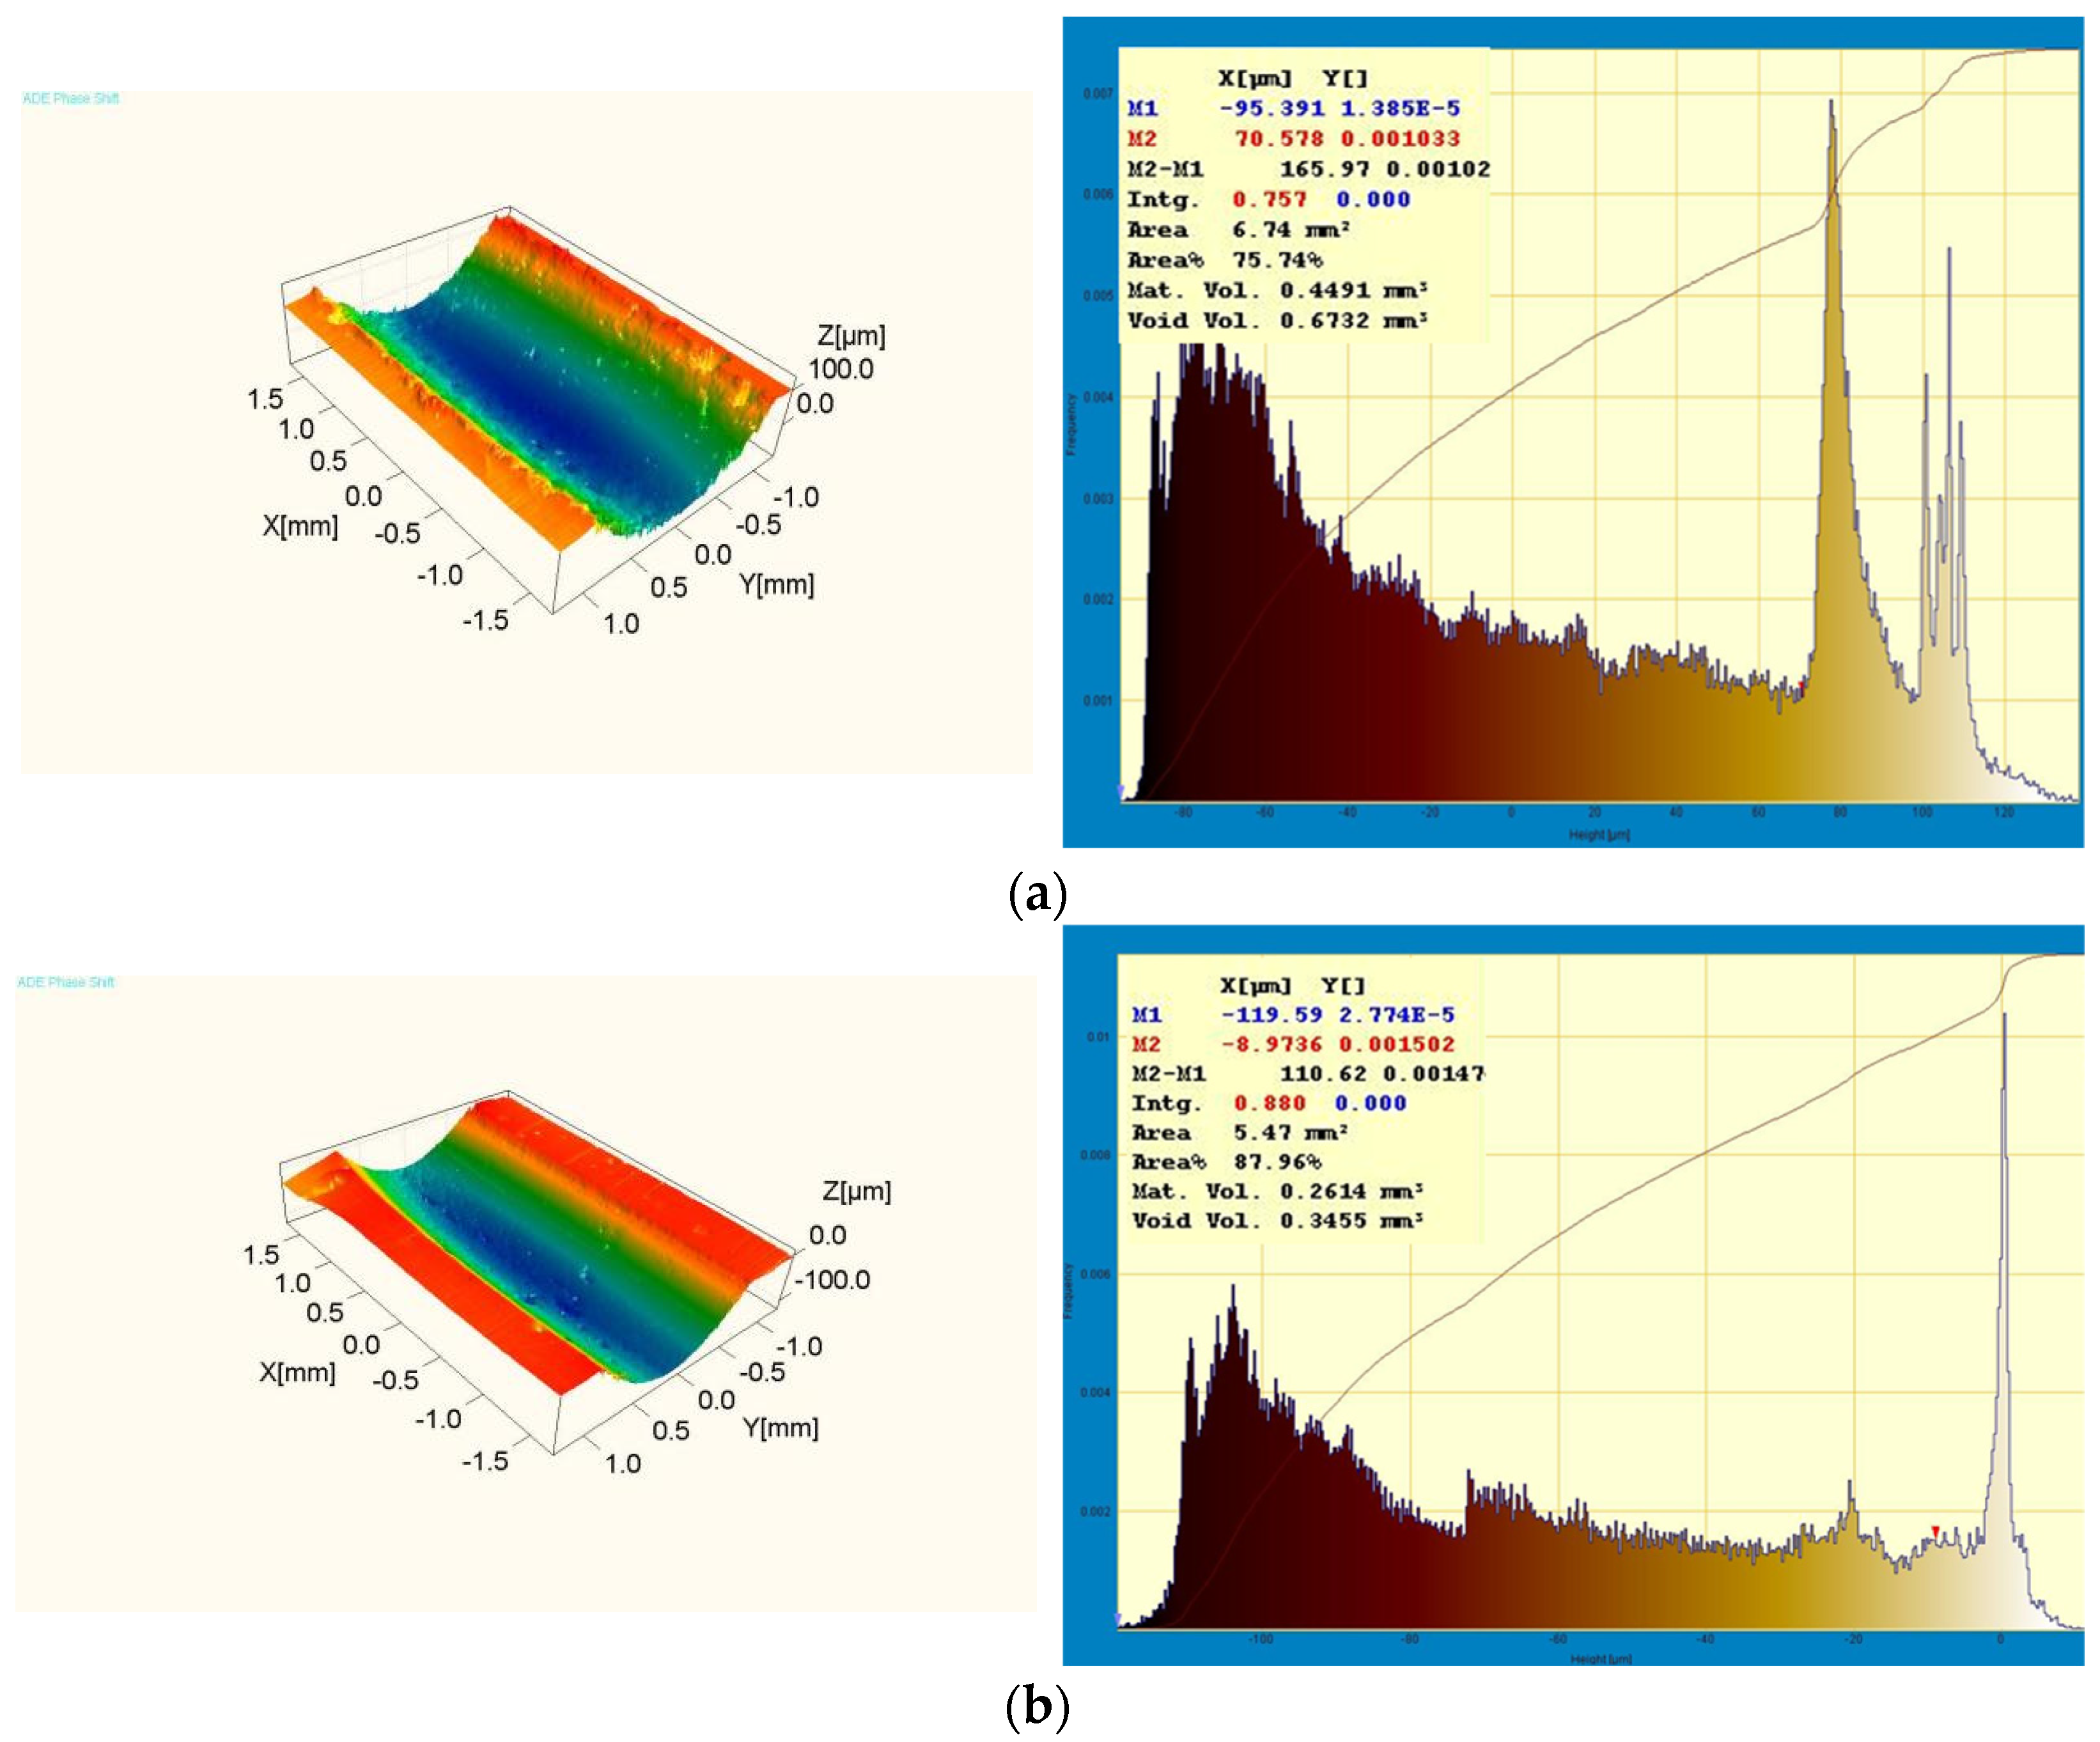
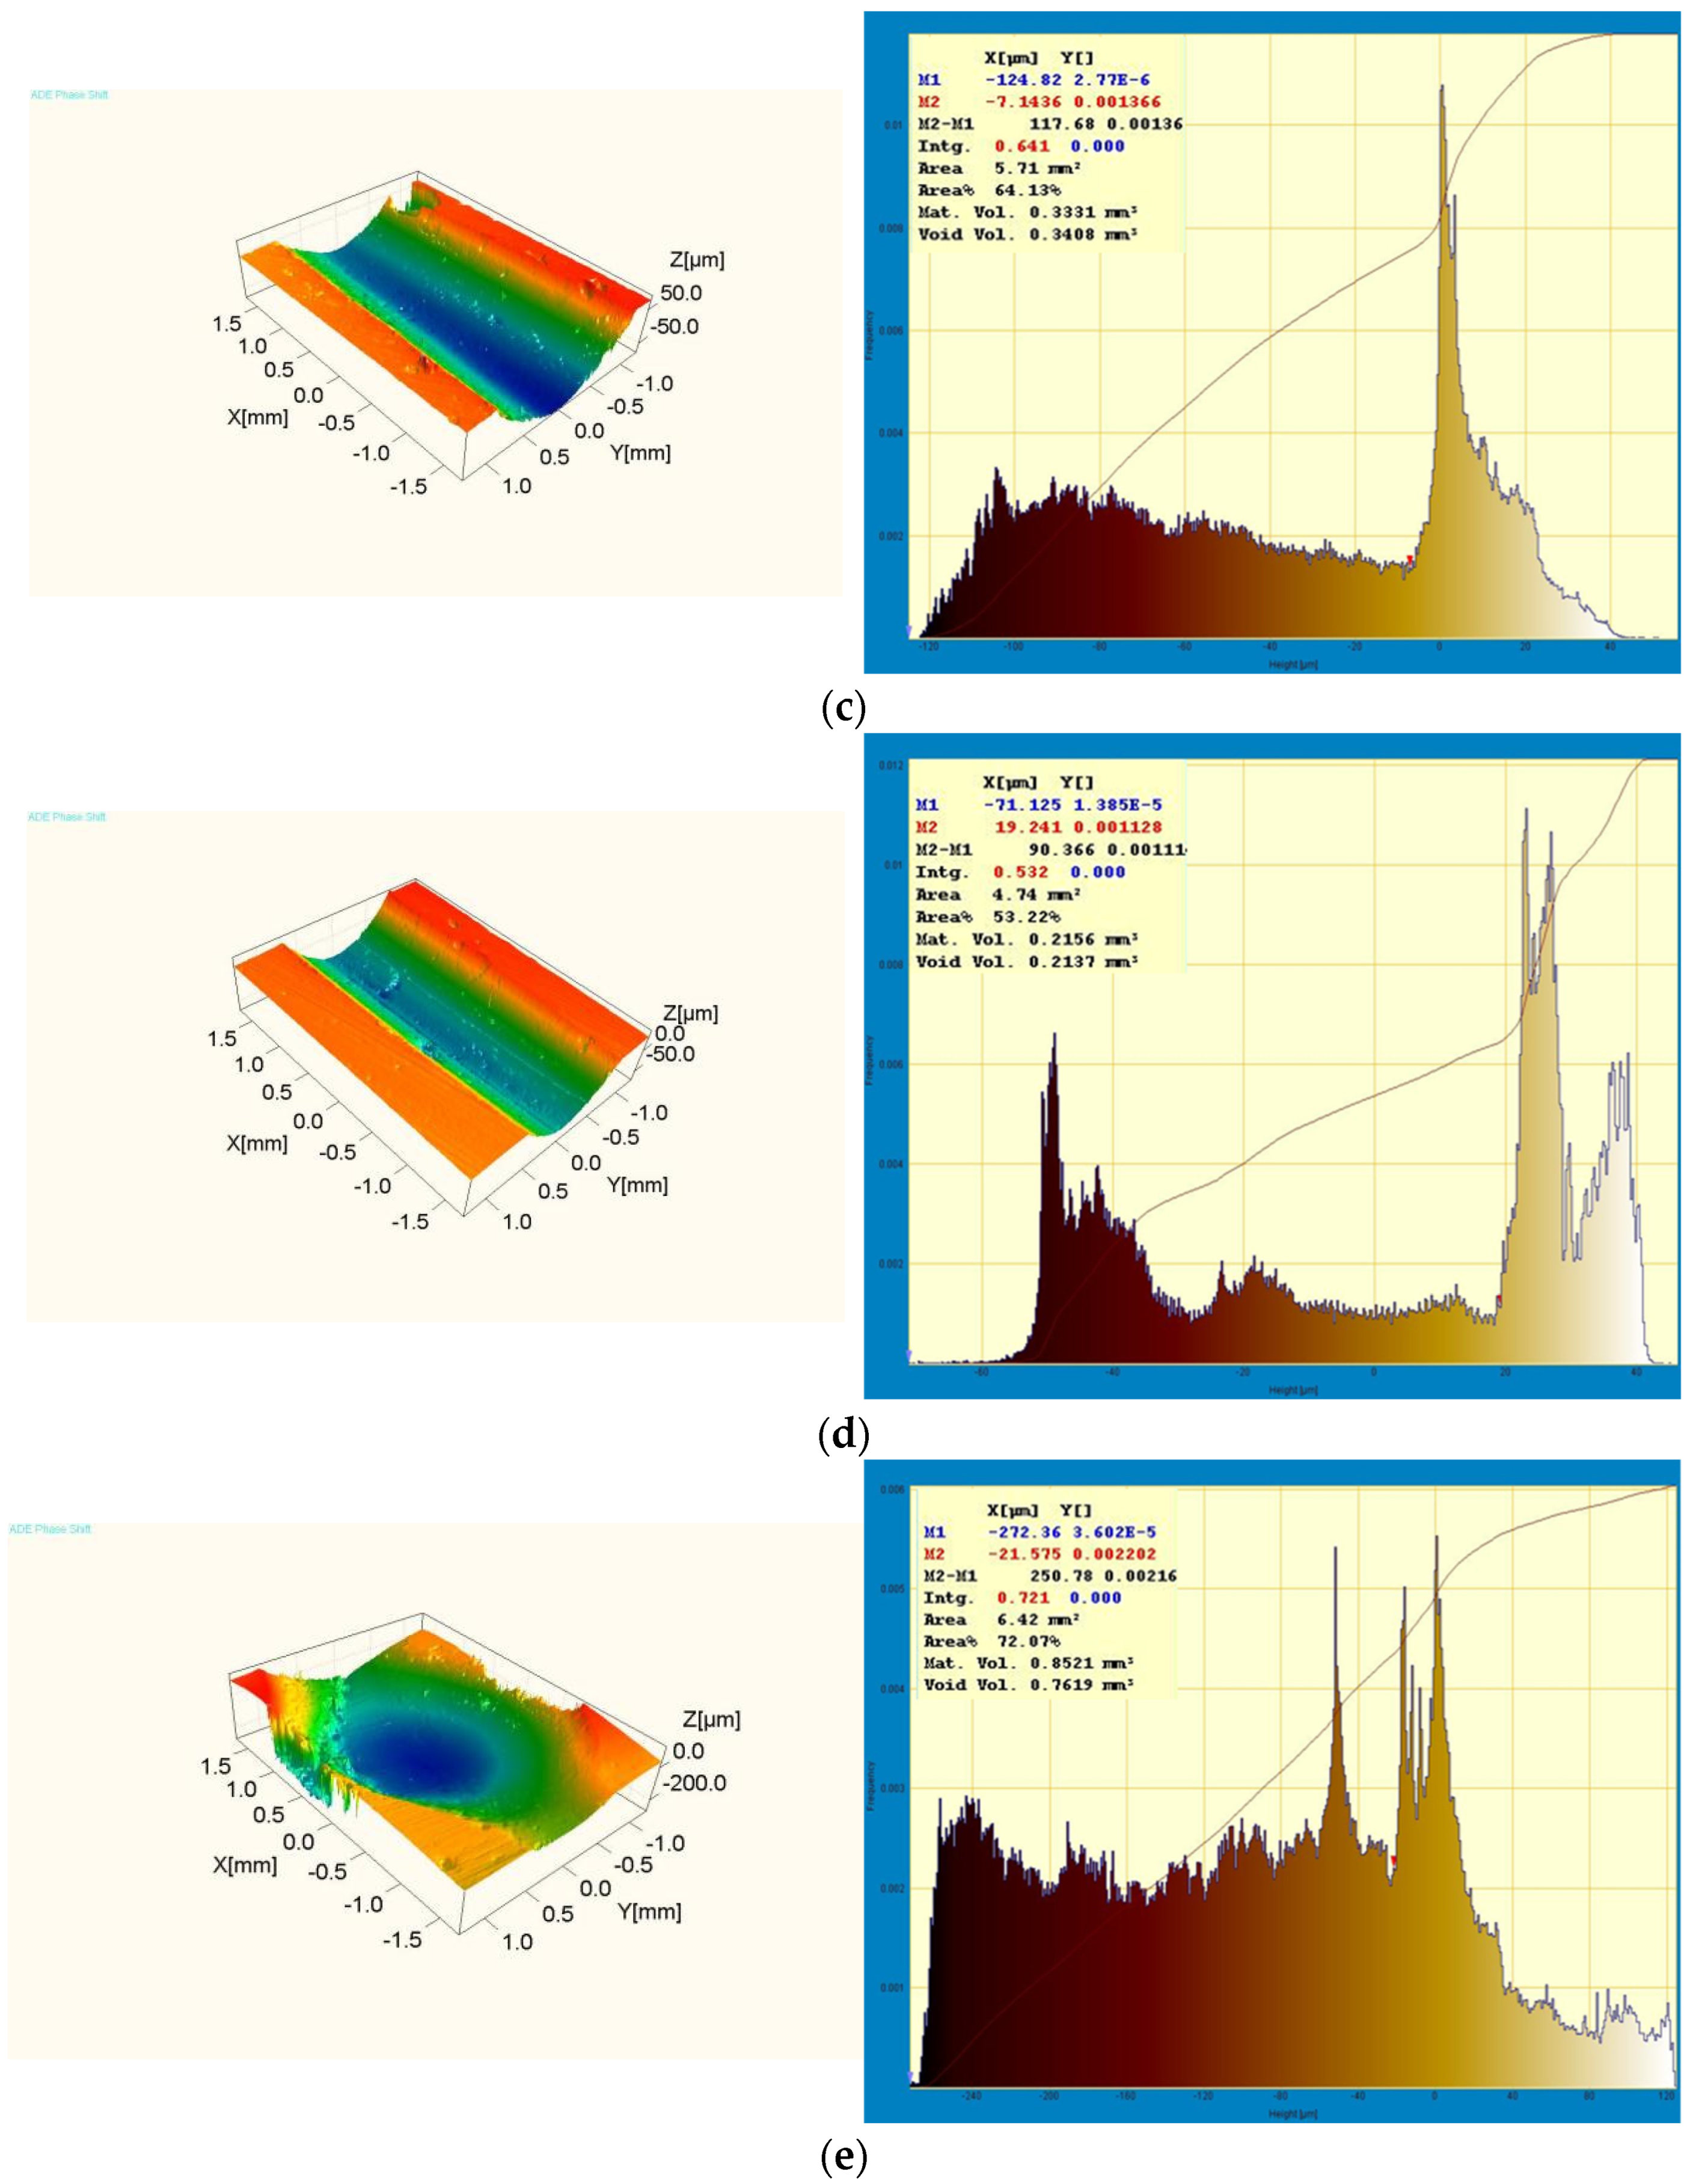
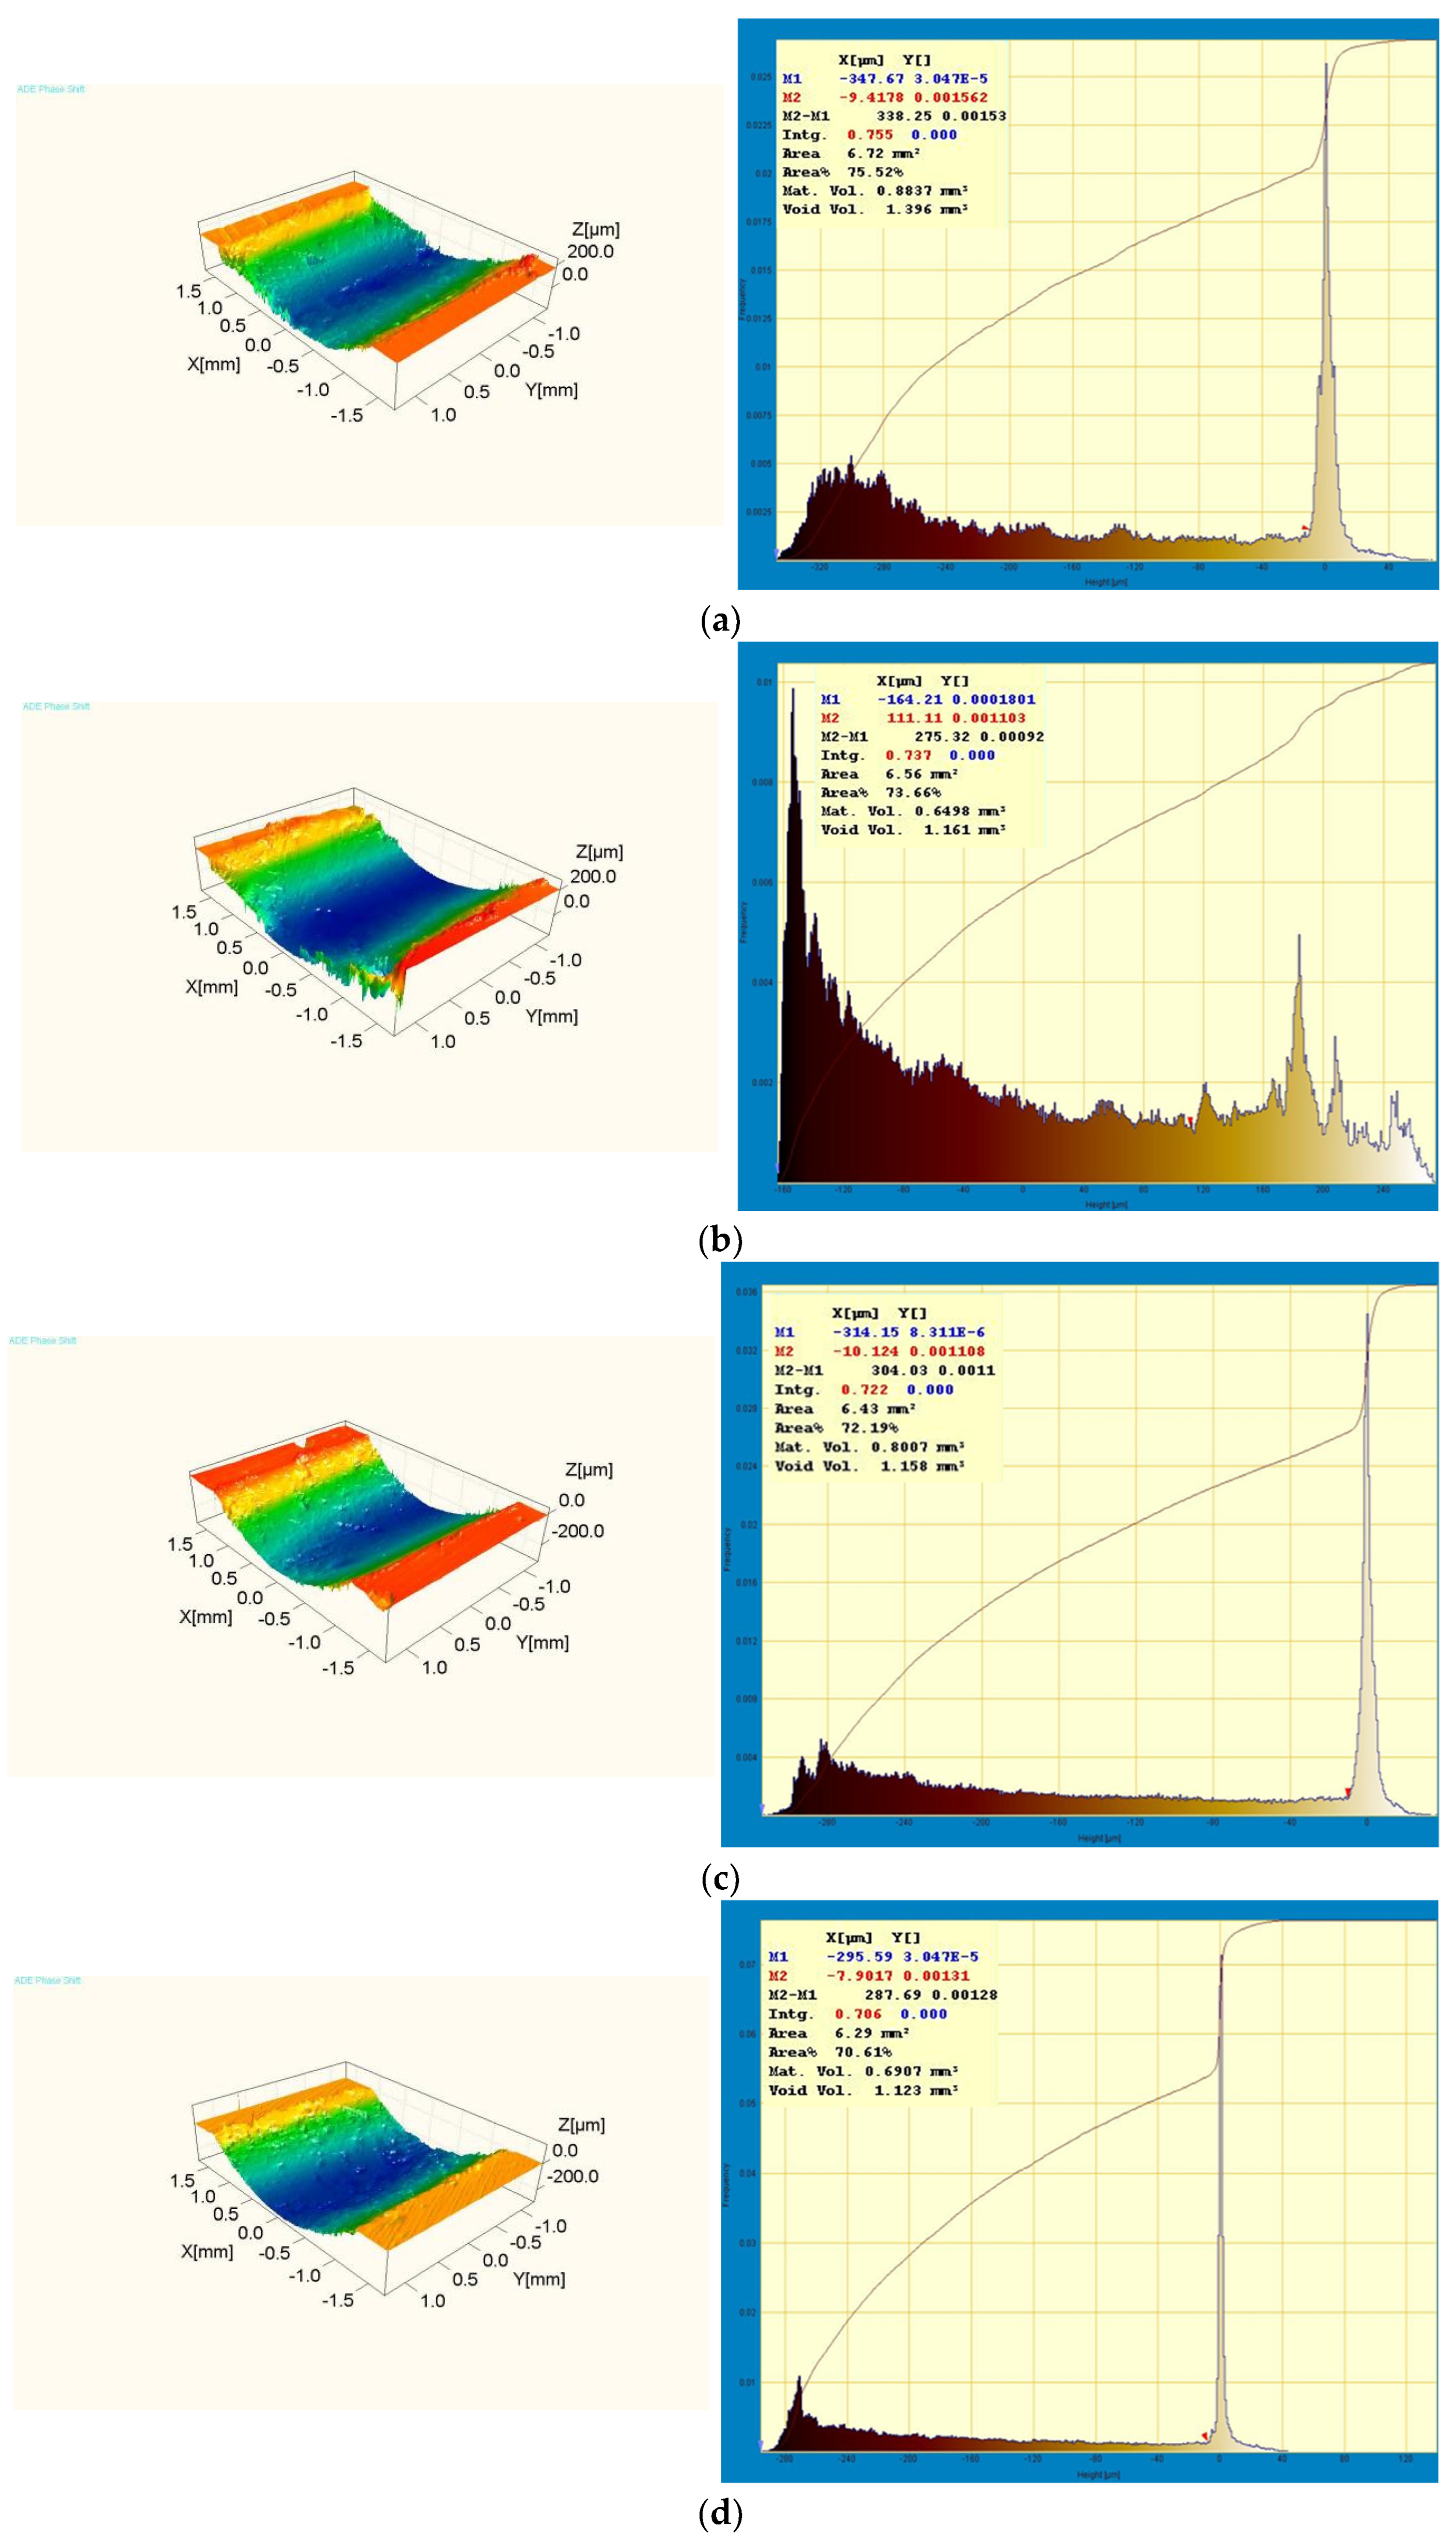
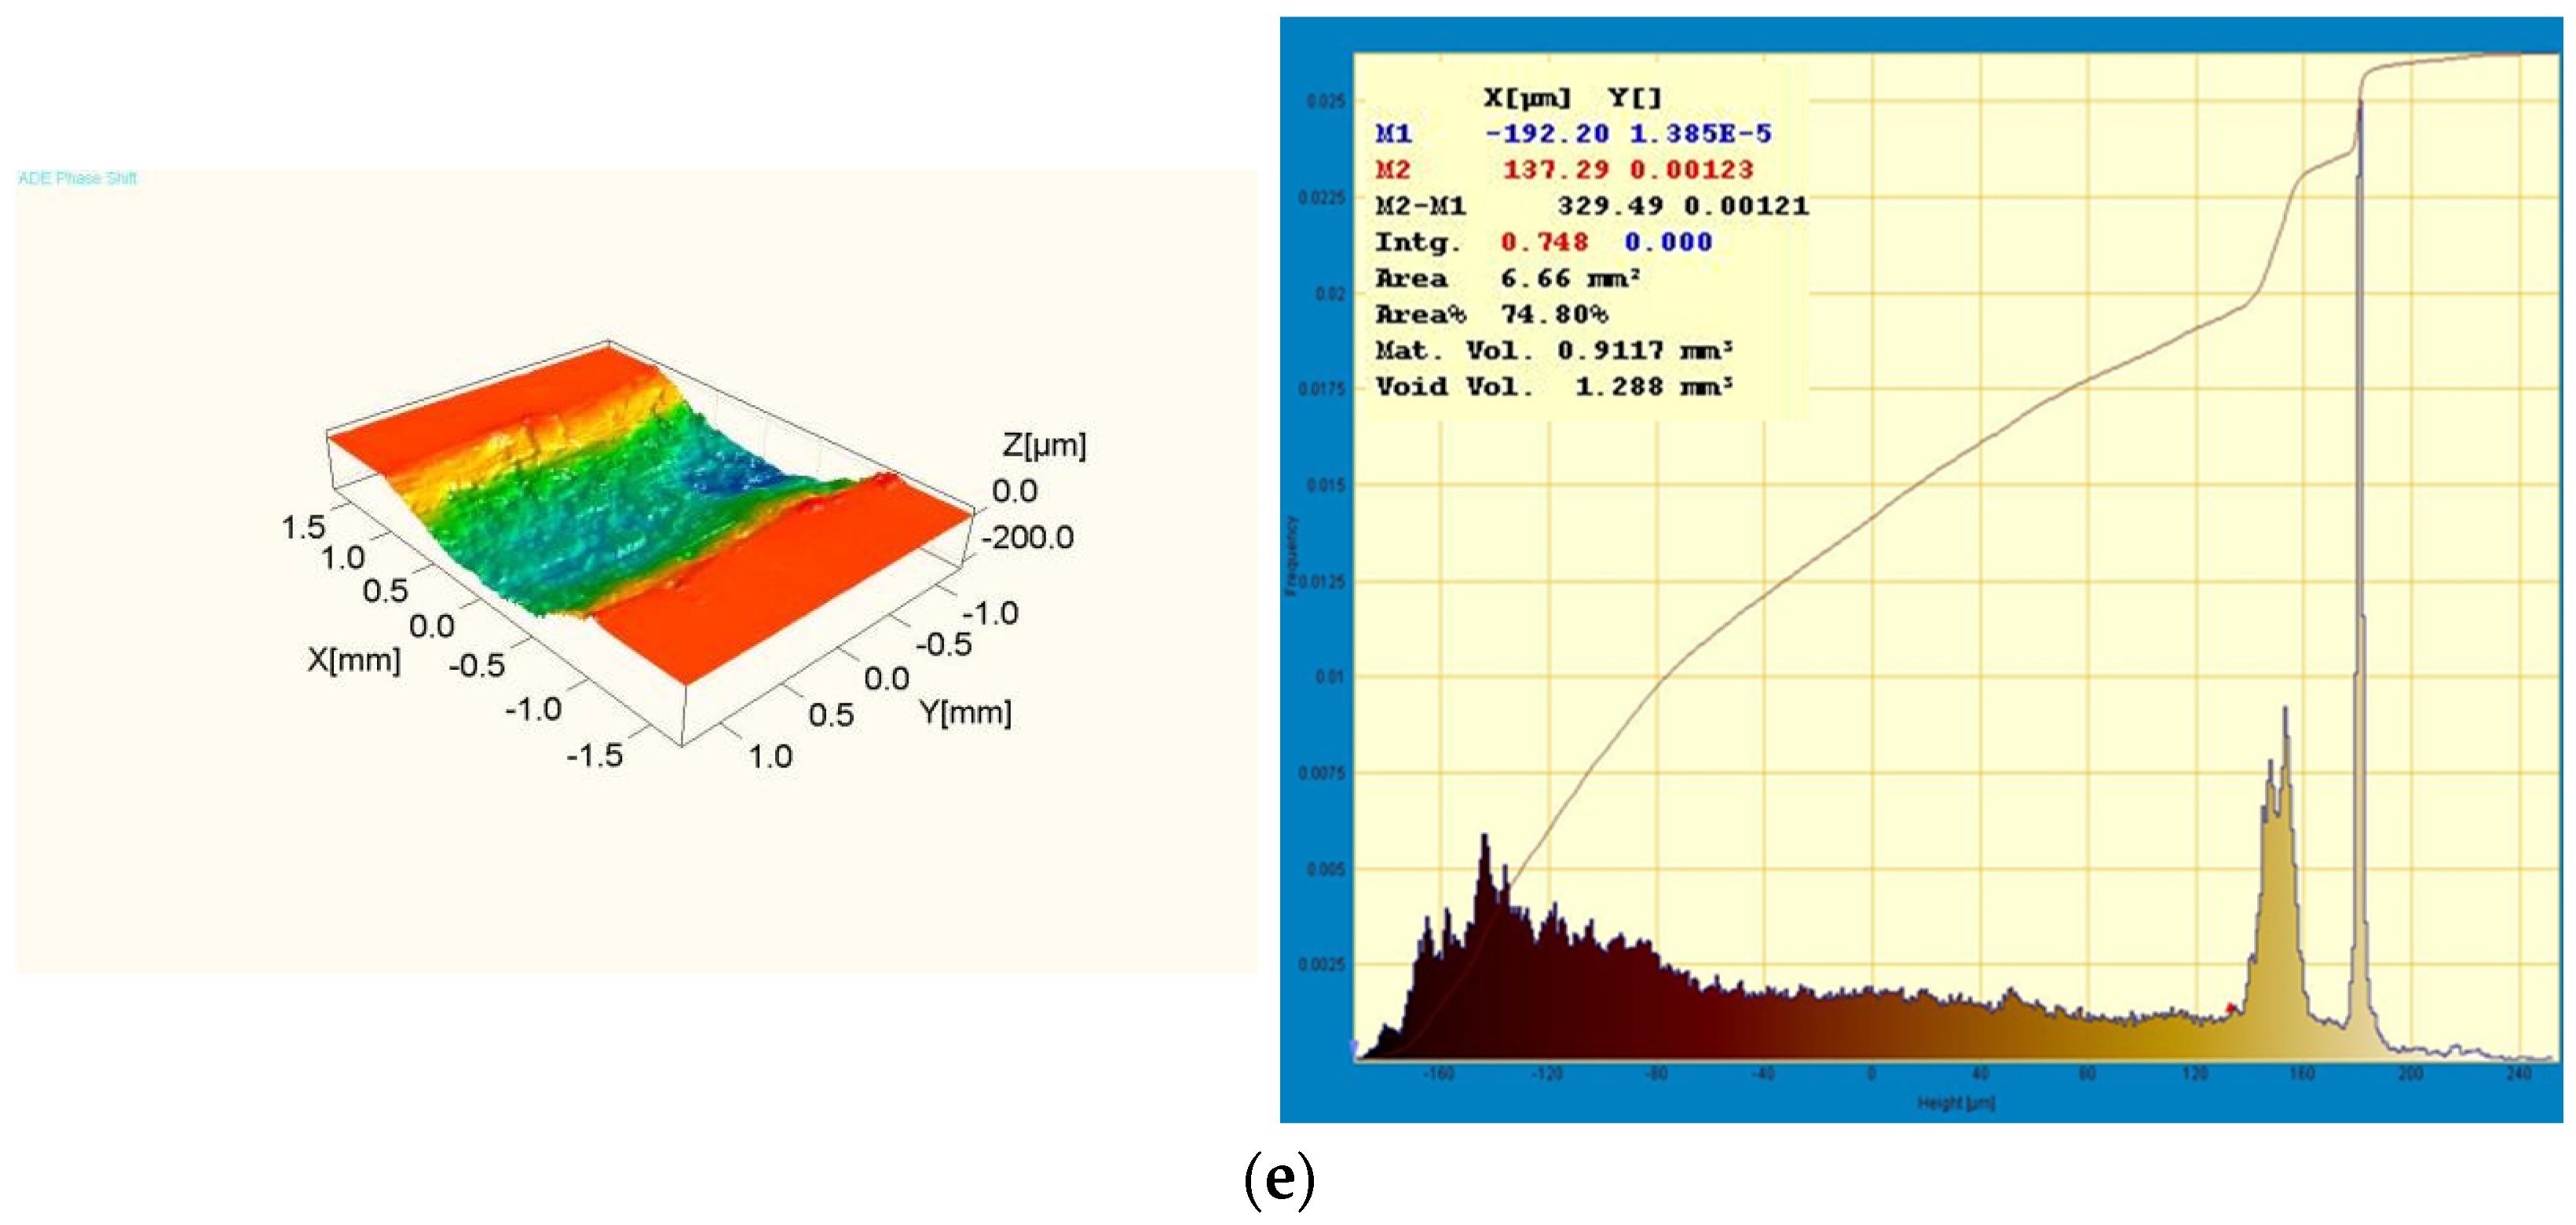
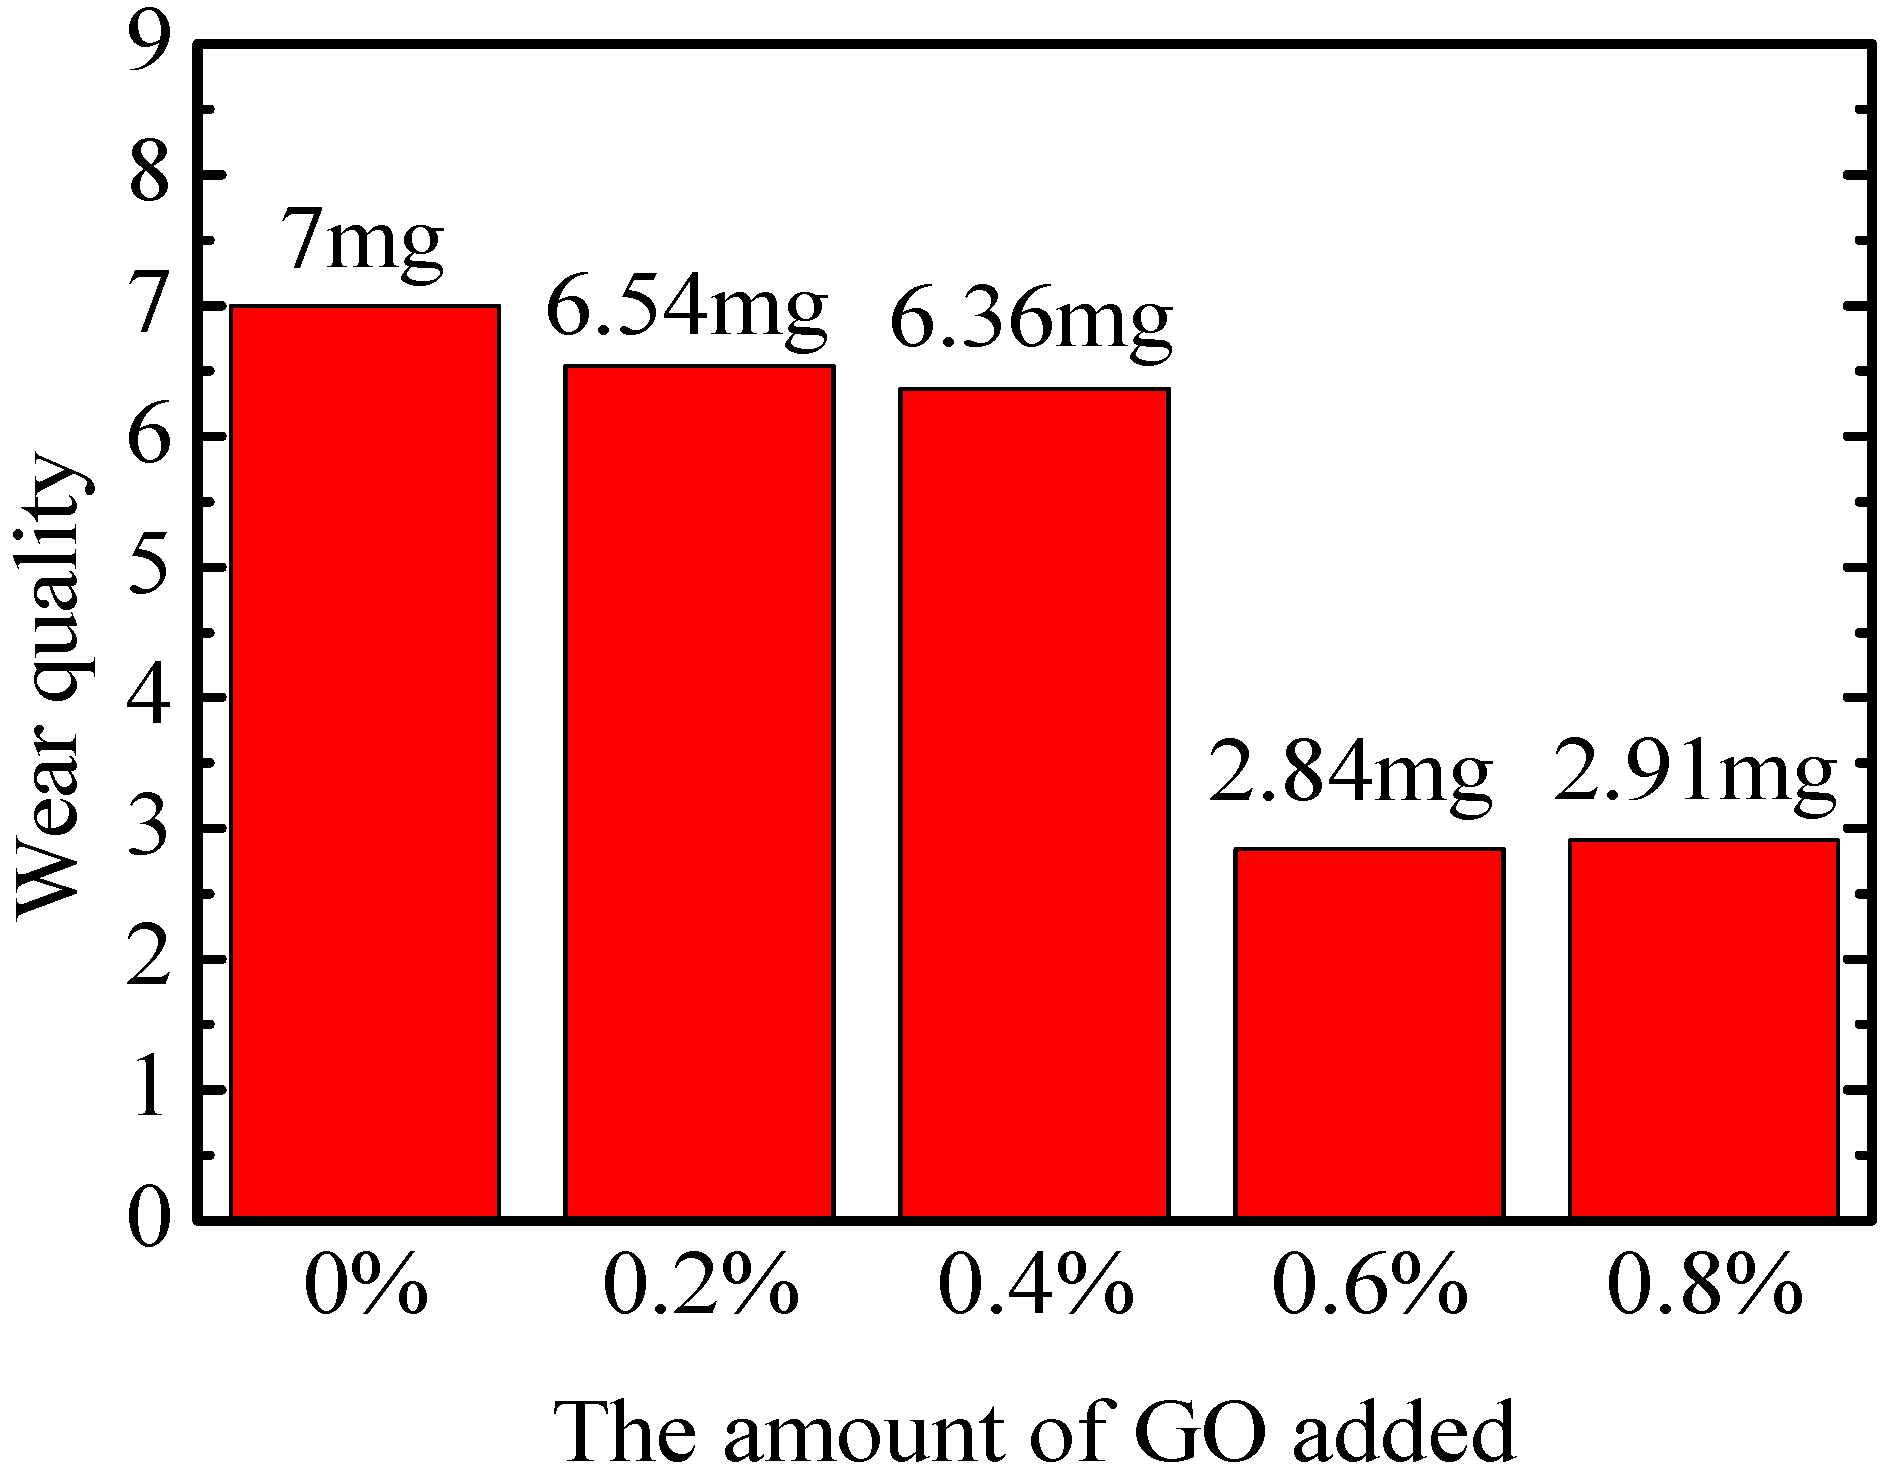
3.4. Coating Friction and Wear

Figure 11 and Figure 12 illustrate the behavior of the friction coefficients for coatings with varying graphene oxide (GO) additions under friction loads of 10 N and 15 N. Initially, there is a rapid increase followed by a gradual decrease until stability is reached. This phenomenon is attributed to the experimental setup being in the initial stages, characterized by a low GO content at the interface, hindering the formation of a stable lubricating layer. As the experiment progresses, a stable lubricating film is developed at the friction interface by the GO, leading to a consistent friction coefficient. Notably, the coating containing 0.6% GO demonstrates the highest stability, resulting in a 5.1% reduction in the friction coefficient compared to the uncoated surface. Similarly, under a 15 N load, the friction coefficients exhibit an initial decline due to insufficient lubrication by GO. However, with prolonged friction and wear, the GO eventually forms a durable, wear-resistant lubrication film near the coating substrate. Once again, the coating with 0.6% GO displays the most stable friction coefficient, showing a decrease of approximately 6.3% compared to the uncoated surface.
The profiler obtained the worn profile, as depicted in Figure 13, illustrating the profile shape of the central region of the 3 mm long wear mark under a 10 N friction load. The wear volume of this segment decreases sequentially to 0.6732 mm3, 0.3455 mm3, 0.3408 mm3, 0.2173 mm3, and 0.7619 mm3 with increasing quantities of GO. At a GO concentration of 0.6%, the wear volume reaches a minimum of 0.2173 mm3.
In Figure 14, the wear mark profile in the central section under a 15 N friction load, spanning 3 mm, is depicted. The wear volume in this region decreases progressively with the increasing addition of graphene oxide (GO): 1.396 mm3, 1.161 mm3, 1.158 mm3, 1.123 mm3, 1.288 mm3. Upon reaching a GO addition of 0.6%, the wear volume reaches a minimum of 1.123 mm3.
At a 10 N load, the wear loss quality is depicted in Figure 15. As the amount of graphene oxide (GO) increases, the wear loss quality decreases from 7 mg to 2.84 mg. Chromium carbide and zirconium carbide, both high-hardness materials, enhance the metal matrix’s performance. The dispersion of chromium carbide or zirconium carbide particles in the metal matrix improves the material’s hardness, wear resistance, and corrosion resistance. The rise of the GO content leads to a gradual increase in the levels of chromium carbide and zirconium carbide, thereby enhancing the coating’s wear resistance and reducing the wear loss quality. This technique is commonly utilized to fabricate high-performance metal matrix composites for the production of critical components and tools. Hence, chromium carbide and zirconium carbide effectively enhance the metal matrix’s performance.
The microscopic morphology of the wear marks post-friction test was analyzed, as depicted in Figure 16. It is evident that during dry friction and wear, the copper-based coating exhibited a propensity for plastic deformation, continuous tearing, and spalling due to its low hardness under the normal stress of the micro-convex body of the friction pair. Post-test observations revealed particles adhering to the sample’s surface, acting as wear particles that contributed to the formation of wear marks. Figure 16 illustrates a significant presence of attached particles, indicating that the wear mechanism of the copper coating involved a mixed mechanism, primarily characterized by adhesive wear and complemented by abrasive wear [21].

4. Conclusions

This study investigates the preparation of a CuCrZr-GO coating on CuCrZr rails using plasma cladding technology. On one hand, the C in the CuCrZr-GO coating plays a crucial role in inhibiting the formation of Al2O3 twins during the armature/rail temperature flash process, thereby mitigating the high-speed gouging induced by local stress. On the other hand, incorporating varying proportions of GO proves beneficial in reducing the friction coefficient of the CuCrZr-GO coating, enhancing its hardness, and improving the wear resistance of the rails. The specific conclusions reached from this study are as follows:
(1) The variation in the ratio of graphene oxide (GO) influences the microstructure of the CuCrZr-GO coating. As the GO content increases from 0% to 0.6%, the coating transitions from a columnar to an equiaxed microstructure, gradually achieving homogenization. This transformation is attributed to the alterations in hydroxyl and epoxy levels within the composite powder, which modify the grain boundary energy and structure of the CuCrZr alloy. Consequently, these changes impact the grain boundary movement and the recrystallization processes, ultimately influencing the grain size and morphology.
(2) In the range of 0% to 0.8% of GO content in the mixture, the optimal increase in the coating hardness occurs at 0.6% GO addition, resulting in a hardness value of 75. This represents a 4.8% enhancement compared to the hardness of the coating with 0% GO. This improvement is attributed to the inherent strength and hardness of GO in a two-dimensional plane. The introduction of GO coating leads to the formation of CrC and ZrC phases, known for their high hardness and strength properties.
(3) In the range of GO formulation ratios from 0% to 0.8%, the coating friction coefficient reaches its minimum at a GO addition level of 0.6%. Under loads of 10 to 15 N, the friction coefficient ranges from 0.7 to 0.85, representing a reduction of approximately 5.1% to 6.4%, compared to 0% GO coating. The incorporation of GO contributes to the friction coefficient reduction, potentially attributed to the enhanced coating density and hardness.
(4) In the range of GO formulation percentages from 0% to 0.8%, the optimal coating wear resistance is observed at 0.6% GO concentration, resulting in a wear amount of 2.84 mg. This represents a 59.4% decrease in wear compared to coatings without GO. The morphological analysis indicates that the wear mechanism involves a combination of adhesive and abrasive wear.

Author Contributions

Conceptualization, Y.W. and H.X.; methodology, Y.W. and G.C.; software, Q.-A.L.; validation, H.X., Z.Q. and X.Y.; formal analysis, Y.W.; investigation, J.Z.; resources, Q.-A.L.; data curation, C.L.; writing—original draft preparation, Y.W.; writing—review and editing, Y.W.; visualization, H.X.; supervision, H.X.; project administration, H.X.; funding acquisition, H.X. All authors have read and agreed to the published version of the manuscript.

Funding

This work was funded by the Youth Fund project of Hebei Provincial Education Department (QN2024248).

Institutional Review Board Statement

Not applicable.

Informed Consent Statement

Not applicable.

Data Availability Statement

Data are contained within the article.

Conflicts of Interest

The authors declare no conflict of interest.

References

  1. Xiang, H.J.; Qiao, Z.M.; Lv, Q.A. Principle and Technology of Electromagnetic Railgun; Beijing Institute of Technology Press: Beijing, China, 2022. [Google Scholar]
  2. Lu, J.Y.; Ma, W.M. Electromagnetic Orbital Launch Theory and Technology; Science Press: Beijing, China, 2020. [Google Scholar]
  3. Du, X.Y.; Liu, S.W.; Guan, J. Design and Performance Analysis of an Electromagnetic Railgun. J. Phys. Conf. Ser. 2022, 2378, 012008. [Google Scholar] [CrossRef]
  4. Liu, Z.Y. Preparation of Conductive Antifriction Coating for Electromagnetic Gun Armature and Study on Current-Carrying Friction Properties; Xiangtan University: Xiangtan, China, 2022. [Google Scholar]
  5. Lv, Q.A. Physical Principle and Relevant Restraining Methods About Velocity Skin Effect. IEEE Trans. Plasma Sci. 2015, 43, 1523–1530. [Google Scholar]
  6. Lei, B.; Du, C.T.; Lv, Q.A. Experimental study on the effect of graphene coating on the performance of electromagnetic railgun. High Volt. Technol. 2019, 45, 1929–1935. [Google Scholar]
  7. Wang, X.; Yao, P.P.; Zhou, H.B. Research Progress on Surface Damage and Protection Strategies of Armature–Rail Friction Pair Materials for Electromagnetic Rail Launch. Materials 2024, 17, 277. [Google Scholar] [CrossRef] [PubMed]
  8. Kosowska, K.; Korycka, P.; Jankowska-Snopkiewicz, K. Graphene Oxide (GO)-Based Bioink with Enhanced 3D Printability and Mechanical Properties for Tissue Engineering Applications. Nanomaterials 2024, 14, 760. [Google Scholar] [CrossRef]
  9. Ahmed, F.; Kumar Brajpuriya, R.; Handa, Y. Properties, Applications and Synthesis of Graphene. J. Res. Sci. Eng. 2021, 3, 1. [Google Scholar]
  10. Xie, Y.J.; Wen, X.; Yan, J.K. Microstructure and wear resistance of AlCoCrFeNiCuSnX high-entropy alloy coatings by plasma cladding. Vacuum 2023, 214, 112176. [Google Scholar] [CrossRef]
  11. Wen, F.J.; Long, Z.; Xing, Z.G. Effect of Mo Content on Microstructure and Fatigue Properties of Ni60 Coating Produced by Plasma Cladding. J. Therm. Spray Technol. 2023, 32, 1389–1405. [Google Scholar] [CrossRef]
  12. Xie, F.G.; He, Y.H.; Yuan, Z.R. Microstructure and high-temperature sliding wear performance of Fe-Co-Mo alloy coating fabricated by plasma cladding. Surf. Coat. Technol. 2022, 444, 128667. [Google Scholar] [CrossRef]
  13. Hu, R.; Wang, R.D.; Zhang, J. An in-situ synthesised TiC/Ni60A composite coating on copper by plasma cladding. Mater. Sci. Technol. 2023, 39, 729–735. [Google Scholar] [CrossRef]
  14. Peng, Y.B.; Zhang, W.; Li, T.C. Effect of WC content on microstructures and mechanical properties of FeCoCrNi high-entropy alloy/WC composite coatings by plasma cladding. Surf. Coat. Technol. 2020, 38, 125326–125327. [Google Scholar] [CrossRef]
  15. Cao, L.; Xia, Y.; Cui, H. Microstructural characteristics of TiBsub2/sub–TiC–NiAl composite coatings via Plasma Cladding Process. Surf. Eng. 2019, 35, 997–1002. [Google Scholar] [CrossRef]
  16. Sun, J.; Fan, Z.S.; Yang, Y. Tribological properties of aluminum alloy coated with graphene oxide/polyvinyl alcohol composites after micro-arc oxidation. Ind. Lubr. Tribol. 2024, 76, 500–512. [Google Scholar] [CrossRef]
  17. Broniszewski, K.; Woźniak, J.; Cygan, T.; Kostecki, M.; Moszczyńska, D.; Chmielewski, M.; Dydek, K.; Olszyna, A. Effect of Anisotropy of Reduced Graphene Oxide on Thermal and Electrical Properties in Silicon Carbide Matrix Composites. Nanomaterials 2024, 14, 555. [Google Scholar] [CrossRef] [PubMed]
  18. Wang, J.; Cao, Y.; Wan, J.; Zhang, M.; Li, Y.; Wang, Y.; Song, D.; Zhang, T.; Wang, J. pH-Responsive Graphene Oxide-Based 2D/3D Composite for Enhancing Anti-Corrosion Properties of Epoxy Coating. Nanomaterials 2024, 14, 323. [Google Scholar] [CrossRef] [PubMed]
  19. Bordbar-Khiabani, A.; Ebrahimi, S.; Yarmand, B. Highly corrosion protection properties of plasma electrolytic oxidized titanium using rGO nanosheets. Appl. Surf. Sci. 2019, 486, 153–165. [Google Scholar] [CrossRef]
  20. Chen, B.; Zhang, B.; Zhao, D.; Gao, P.; Naumov, A.; Li, Q.; Li, F.; Yang, Z.; Guo, Y.; Li, J.; et al. Microstructure and Properties of FeAlC-x(WC-Co) Composite Coating Prepared through Plasma Transfer Arc Cladding. Coatings 2024, 14, 128. [Google Scholar] [CrossRef]
  21. Zhang, H.; Zhuang, J.; Li, J. The Effect of Laser-Cladded Co6, T400, and Ni-Based 30WC Coatings on the Wear Resistance of H13 Steel. Coatings 2024, 14, 114. [Google Scholar] [CrossRef]
Figure 1. Particle size distribution of CuCrZr powder.
Coatings 14 00763 g001
Figure 2. (a) SEM photos of CuCrZr mixed powder. (b) SEM photos of CuCrZr-GO mixed powder.
Coatings 14 00763 g002
Figure 3. CuCrZr-GO coating comparison of real objects before and after cladding.
Coatings 14 00763 g003
Figure 4. XRD pattern of GO coatings with different contents.
Coatings 14 00763 g004
Figure 5. (a) 0% GO coating surface image. (b) 0.2% GO coating surface image. (c) 0.4% GO coating surface image. (d) 0.6% GO coating surface image. (e) 0.8% GO coating surface image.
Coatings 14 00763 g005
Figure 6. EDS surface sweep element distribution of 0.2% GO plasma cladding coating. (a) SEM image of coating; (b) Distribution image of different element; (c) Distribution image of Cu element; (d) Distribution image of Zr element; (e) Distribution image of Cr element; (f) Distribution image of C element.
Coatings 14 00763 g006
Figure 7. EDS surface sweep element distribution of 0.4% GO plasma cladding coating. (a) SEM image of coating; (b) Distribution image of different element; (c) Distribution image of Cu element; (d) Distribution image of Zr element; (e) Distribution image of Cr element; (f) Distribution image of C element.
Coatings 14 00763 g007
Figure 8. EDS surface sweep element distribution of 0.6% GO plasma cladding coating.(a) SEM image of coating; (b) Distribution image of different element; (c) Distribution image of Cu element; (d) Distribution image of Zr element; (e) Distribution image of Cr element; (f) Distribution image of C element.
Coatings 14 00763 g008
Figure 9. EDS surface sweep element distribution of 0.8% GO plasma cladding coating. (a) SEM image of coating; (b) Distribution image of different elements; (c) Distribution image of Cu element; (d) Distribution image of Zr element; (e) Distribution image of Cr element; (f) Distribution image of C element.
Coatings 14 00763 g009
Figure 10. Vickers hardness of five samples.
Coatings 14 00763 g010
Figure 11. Friction coefficients of 0%, 0.2%, 0.4%, 0.6%, and 0.8% for load 10 N and GO addition, respectively.
Coatings 14 00763 g011
Figure 12. Friction coefficients of 0%, 0.2%, 0.4%, 0.6%, and 0.8% for load 15 N and GO addition, respectively.
Coatings 14 00763 g012
Figure 13. Load 10 N wear profile and wear volume. (a) Add 0% GO coating wear profile; (b) Add 0.2% GO coating wear profile; (c) Add 0.4% GO coating wear profile; (d) Add 0.6% GO coating wear profile; (e) Add 0.8% GO coating wear profile.
Coatings 14 00763 g013aCoatings 14 00763 g013b
Figure 14. Load 15 N wear profile and wear volume. (a) Add 0% GO coating wear profile; (b) Add 0.2% GO coating wear profile; (c) Add 0.4% GO coating wear profile; (d) Add 0.6% GO coating wear profile; (e) Add 0.8% GO coating wear profile.
Coatings 14 00763 g014aCoatings 14 00763 g014b
Figure 15. Wear-loss quality of coatings with different content of GO.
Coatings 14 00763 g015
Figure 16. (a) 0% GO; (b) 0.2% GO; (c) 0.4% GO; (d) 0.6% GO; and (e) 0.8% GO SEM for friction and wear marks.
Coatings 14 00763 g016
Table 1. Chemical composition of CuCrZr rail (Wt%).
CuCrZr
Bal.0.79%0.12%
Table 2. Chemical components of CuCrZr powder (Wt%).
CuCrZr
Bal.0.7%–0.8%0.1%–0.25%
Table 3. Parameters of plasma cladding.
ParameterValue
Cladding typePlasma cladding
Cladding modeHand cladding
Powder feeding methodPneumatic powder feed
Protective gas typeHigh purity argon
Cladding currentMain arc current 143 (141–145)
Ionic gas2.5 L/min
Shielding gas velocity5 L/min
Speed of powder gas delivery2.8 L/min
The quantity of powder dispensed.280 g/min
Disclaimer/Publisher’s Note: The statements, opinions and data contained in all publications are solely those of the individual author(s) and contributor(s) and not of MDPI and/or the editor(s). MDPI and/or the editor(s) disclaim responsibility for any injury to people or property resulting from any ideas, methods, instructions or products referred to in the content.

