Abstract
Photochromic polycaprolactone (PCL) nanofibers were prepared through electrospinning. Various factors, including the solvent system, the concentration of PCL, the viscosity of the solution, and the electrical conductivity, influence the morphology of PCL nanofibers. A binary solvent system can dissolve PCL, control fiber structure and morphology, and allow solvent evaporation. The photochromic properties of electrospun membranes based on PCL and diethienylethene (DTE) were assessed using the CM-3610a spectrophotometer. The study showed that incorporating DTE into the membrane enables photochromic performance, with the photochromic reaction being reversible. The analysis of the color-change kinetics showed that the mechanism of photo cycling during colorization was linked to the amplitude of the fast and slow mechanisms, which depended on the formulation tested. The study showed that the photoreversion of the membrane under visible illumination occurs according to first-order kinetics. This work presented the design and manufacturing of photochromic membranes through electrospinning, which offers rapid color change rates, adjustable color fade times, superior reversibility, and reproducibility over at least 10 cycles. The thermochromic properties are proportional to the DTE concentration used, making it possible to obtain color variations with a delta E of 13 and 38 for concentrations ranging from 0.95 to 11.4 wt.%.
1. Introduction
Photochemistry has been studied for over two centuries, with Von Grothus and Draper formulating the first law of photochemistry [1]. This law explains that when a molecule absorbs light, it can produce photochemical changes in the molecule concerned, and this activity is unique to each chemical substance. Photochromism, a reversible color change induced by light, was first described by Hirshberg in 1950 [2], and it has since been the subject of in-depth studies in various fields, including chemistry, physics, optics, polymer science, materials science, and textiles [3]. The development of intelligent fibers that can respond to external stimuli, such as UV light, magnetism, and temperature, has become an essential part of developing smart textiles and wearable devices [4]. Photoreactive fibers that undergo reversible light-induced color changes are expected to have many applications [5], including rewritable optical data storage systems [6], visual environmental sensors [7], and information encryption [8]. As a result, many studies have been focused on developing color-changing fibers that can react to different stimuli [9,10,11]. Smart textile structures based on photochromic molecules have huge potential for applications for detecting and responding to external environmental conditions and stimuli, making them an exciting area of research [12], and the textile sector has contributed more than 3% of the scientific research activities devoted to photochromism over the past three years [13].
Photochromic molecules are generally classified according to the photo-induced chemical reactions involved. Thus, we distinguish quinolone-acetones with intramolecular hydrogen transfer, spironaphthoxazines with a dissociation process, fulgides and diarylethenes with pericyclic reactions, and azobenzenes with cis-trans isomerizations [14]. Diarylethenes (DAEs) and, more specifically, dithienylethenes (DTEs) have gained great popularity in photoactuator research due to their bistability (P-type group—photochemical reversibility); unlike AZOs (T-type group—thermal reversibility), they have good quantum yields, high fatigue resistance, and rapid photochromic response [15]. Photochromic dithienylethene (DTE) derivatives used as photochromic pigments are of interest, as these compounds are distinguished above all by their exceptional thermal stability, rapid photoresponse, and excellent fatigue resistance under light stimuli [16]. In addition to their responsiveness to light, the design and construction of efficient multi-stimulus switches have been the subject of numerous studies [17]. The functionalization of textile materials using these compounds must consider their intrinsic properties, such as their low affinity with the material, low solubility in water, and sensitivity to high temperatures. Thus, among the various possible routes, such as encapsulation [18,19,20,21], sol-gel treatment [22,23,24], and spinning, electrospinning is considered one of the most attractive ways of using photochromic compounds in textiles [25,26]. Due to their chemical structure, some photochromic molecules are affected by external conditions, such as pH, temperature, oxidation, and solvents, requiring them to be encapsulated before being applied to textile substrates using the screen-printing method [27]. This approach enables color changes to be controlled and allows surface functionalization formulations to be tailored to improve wash resistance [28], overcoming the problems encountered by Ker et al. [29]. The sol-gel process of designing an intelligent photochromic coating is simple and highly effective. As a result, the resulting coating exhibits a rapid kinetic response, improved resistance to abrasion and washing, and better color accumulation, even though the rigid silane-containing structure may affect the fabric’s handling properties. In addition, photochromic response is linked to the silica network’s chemistry and physical properties, such as the size, shape, and pore space [30]. Photochromic fibers can be developed through various methods, such as electrospinning, wet-spinning, and melt-spinning [31]. Kumbasar et al. reviewed the production of photochromic nanofibers using photochromic compounds and polymer matrices [32]. However, producing light-responsive textiles is still complex, as dyestuffs are sensitive to heat, limiting the maximum temperature in the melt-spinning processes. Therefore, the choice of polymer is usually limited to polyolefins [33]. PVDF photochromic fiber was developed via a wet-spinning process by Pinto et al. [34] and Fan et al. [35]. They found that these smart fibers possess remarkable photo-coloration kinetics and a reversible optical change when exposed to UV and visible light.
Electrospinning is a simple, cost-effective technology for incorporating functional additives into fibers to create functional materials [36]. Modifying the formulation of the polymer solution and the process parameters allows all of the desired properties of electrospun fibers and mats to be easily achieved. The fibers have a high surface-to-volume ratio, adjustable porosity, and good physico-mechanical properties, making them suitable for various applications. In addition, photochromic compounds have been successfully doped into various polymers with the electrospinning technique, and these fibers find applications ranging from biomedical devices to industrial fields [26]. The main advantages of using the electrospinning method to produce thermochromic fibers lie in the increase in the specific surface area, which improves sensitivity and reduces response time to UV radiation [37] while protecting the molecules from chemical, irradiative, and corrosive damage. In addition, the thermo-mechanical properties of selected matrices also enable the control of color-change kinetics [38]. Alidaei-Sharif et al. observed that thermomechanical properties (flexibility) and polarity affect molecular changes and, hence, the color-change kinetics [39]. Thus, greater flexibility in polymer chains reduces the rate of the mechanism responsible for photochromic behavior. Bucko et al. (2014) identified the importance of the free volume around the photochromic azobenzene molecule for its movement during the isomerization process [40]. Nevertheless, further research is needed to develop new nanofiber-based structures to better understand the role of nanofiber and polymer properties in color changes.
In this research, PCL-based nanofibers containing DTE were prepared through electrospinning. PCL was chosen because of its relatively low transition temperature (−60 °C) and mechanical properties, enabling formulations to be created at room temperature to avoid the degradation of temperature-sensitive photochromic dyes. First, the process and formulation parameters were optimized according to the nanofiber properties before the incorporation of DTE. Next, UV-Vis analysis was used to study the thermochromic properties of the samples and, in particular, the influence of the amount of thermochromic molecules incorporated. These textile materials were designed for their dynamic photochromic properties, and they can be used in various applications, including detecting light changes or eliminating counterfeiting.
2. Materials and Methods
2.1. Materials
Polycaprolactone (PCL) with an average molecular weight of 37,000 g.mol−1 was procured from Perstorp in Skåne County, Sweden. N, N-Dimethylformamide (DMF), obtained from CARLO ERBA (Val-de-Reuil, France), and chloroform (CHCl3), purchased from Sigma Aldrich (Dorset, UK), were used as solvents for PCL. The photochromic molecule used in this study was 1,2-bis(2,4-dimethyl-5-phenyl-3-thienyl)-3,3,4,4,5,5-hexafluoro-1-cyclopentene (DTE), purchased from TCI (Zwijndrecht, Belgium). All reagents were used as received without any further treatment.
2.2. Preparation of PCL Electrospraying Solutions
A series of PVDF electrospinning solutions were prepared at different concentrations (12, 15, 18, 21, and 30 w/v %) using a CHCl3/DMF mixture (100/0, 90/10, 80/20, 70/30, 60/40, 50/50 v/v (%)) at 50 °C under vigorous magnetic stirring (800 rpm) equipped with a water-jacketed reflux condenser for 1 h. Before adding DTE and electrospinning, each solution was cooled to room temperature (25 °C). DTE (0.95, 2.85, 5.7, and 11.4 wt.%) was introduced into a solution of PCL solubilized in a chloroform/DMF mixture. After stirring for 30 min at room temperature, the solution was left to stand for a few minutes to eliminate trapped air bubbles.
2.3. Production of PVDF Nanofibers
The electrospun nanofibers were fabricated using a facile electrospinning method. The experimental setup for producing a series of PCL nanofibers consisted of a CAT000002 electrospray starter kit from Spraybase® AVECATS (Kildare, Ireland), which comprised three main components: a 10 mL plastic syringe fitted with a 20-gauge needle and attached to a microinjection pump, a high-voltage power supply (generator), and a grounded collector. The voltage applied between the nozzle and the collector was 20 kV, while the microinjection pump was set to 0.7 mL/h in this study. An aluminum foil collector was placed 20 cm below the metal needle to collect the electrospun samples. Collection times were adjusted to 1 h. After collection, the samples were dried for a few minutes at room temperature. All electrospinning experiments were carried out under constant temperature and relative humidity conditions of 25 °C and 45%, respectively. The TCD (20 cm), voltage (20 kV), and feed rate (0.7 mL/h) were adjusted based on preliminary experiments based on Taylor cone stability.
2.4. Analytical Methods
2.4.1. Solution Properties
The electrical conductivities of the solutions (K, unit: µS/cm) were measured with a conductivity meter (type CDRV 62, Tacussel Electronique Instruments, Lyon, France). The surface tension of the PCL solution (γ, mN/m) was measured with Standard Wilhelmy’s plate method based on a tensiometer from GBX Instruments (Romans sur Isere, France). For each PCL solution, all sample surface tension measurements were repeated 5 times per sample, and each sample was prepared in triplicate. The average values and standard deviations were calculated. The temperature and humidity in the measurements were maintained at 25 °C and 45%, respectively.
The viscosity of the solutions was measured with a rotational viscosimeter (Rheomat RM 100, Lamy Rheology, Champagne-au-Mont-d’Or, France), with a shear rate ranging from 0.38 to 1420 s−1 at room temperature, corresponding to the range of shear rates at the top of the tip. According to studies by Higashi et al., the shear force undergone by the solution during the electrospinning process can be approximated with Equation (1) [41].
where γ˙, Q, and R are the shear rates at the needle wall (s−1), the flow rate (mL/h), and the radius of the needle (mm), respectively. The estimated shear rate in the shear stress region was 12.9 s−1 for a flow rate value of about 0.7 mL/h with a 20-gauge needle.
γ˙ = 4Q/πR3
2.4.2. Morphological Characterization of the Nanofibers
The morphology of the samples was characterized through scanning electron microscopy (SEM) (Hitachi S4700 instrument, Tokyo, Japan). The samples were mounted on a metal holder and coated with gold using a sputter coater for 30 s, followed by observation at an accelerating voltage of 5–15 kV. The Image J software (version 1.53k, National Institutes of Health, Bethesda, Rockville, MD, USA) with the macro tool General Image Fiber Tool (GIFT, version 20221) was used to determine the mean fiber diameter from the SEM images [42].
2.4.3. Wettability Measurements
The static contact angle was evaluated with the sessile drop method with a Digidrop apparatus (GBX Instruments), in which 10 water droplets (4 µL) were deposited on the membrane surface with a microsyringe. The contact angle was determined from the base diameter and height measurements of the tiny drop (spherical cap) placed on the sample surface. Each measurement was repeated 5 times for each sample to obtain the average value of the static contact angle.
2.4.4. Measurements of Photochromic Properties
The color parameters were obtained using a CM-3610a spectrophotometer (Konica Minolta, Tokyo, Japan) in the reflectance mode in the 360–740 nm wavelength range. Samples were exposed to two types of light radiation, i.e., (i) a UV flashlight (365 nm, 1 W) at a distance of 2 cm and (ii) a visible flashlight (593 nm, 3 W) at a distance of 3 cm, in a black box under 90° irradiation. The samples were then exposed to a UV light source (365 nm), and spectrophotometric measurements were taken every 10 s after the source was removed, varying the exposure time between 0, 10, 15, 30, 60, 120, 600, and 1200 s to analyze staining. The same procedure was used for decolorization under visible light.
To determine the rate of fatigue and discoloration of the photochromic membranes, the samples were first irradiated with a UV lamp for 20 min and then with a visible lamp for 20 min. After checking the bleaching of the photochromic samples, the samples were irradiated with a UV lamp for 60 s and a visible lamp for 600 s. The two irradiations were repeated 10 times. After each irradiation, the maximum absorption of the electrospun membrane was measured and compared with that of the bleached sample.
3. Results
3.1. Influence of the Formulation Parameters on the Morphology of the Electrospun PCL Membrane
The formation and structure of electrospun fibers depend on various physical and chemical properties of the working solutions. The solvent system, the concentration of PCL used, and the operating parameters play a key role in determining the morphology of electrospun PCL nanofibers. The physicochemical properties of the solutions, such as the solubility and volatility, influence the formation and shape of the Taylor cone, the break-up of the charged polymer solution, and the solvent evaporation during electrospinning. The initial entanglement of macromolecular PCL chains in the solution is intimately linked to the formation of electrospun fibers. The degree of entanglement significantly impacts the morphology and average diameter of the resulting material during the electrospinning process. Solvents with higher solubility for PCL and higher volatility are not recommended to ensure the formation of electrospun fibers. Using a binary solvent system can dissolve PCL to control the structure and morphology of the fibers and the solvent evaporation during the flight process. The viscosity of the solutions can be controlled by using different concentrations of PCL. The dissolution state of the polymer in the solution is divided into four different regimes depending on the concentration of PCL used. Electrospinning involves pumping the polymer solution through the nozzle and applying an electric field between the needle tip and the collector. The solvent evaporates during the flight process, forming nanofibers or microfibers. The mean fiber diameter can be controlled by adjusting the process and formulation parameters, such as the concentration or flow rate. The viscosity of the spinning solution is an important parameter that directly influences the formation of a continuous and uniform jet. The molecular weight and polymer concentration are directly related to the viscosity of the solution. The critical concentration marks the boundary between the dilute and semi-dilute regime. In the dilute regime, where the polymer chains are isolated, the Rayleigh instability will induce droplet formation, and only the particles will be collected. Fibers with beads are created in the semi-diluted regime, while uniform fibers are produced in the semi-diluted and entangled regime.
3.1.1. Influence of the Solvent System on the Electrospun Membrane Morphology
In a previous study, we investigated the influence of the process and formulation parameters on the characteristics of the electroatomization process of PCL. The selection of a solvent system based on Hansen’s solubility parameters ensures that PCL is soluble in all solvents. We found that the electrospinning process of the solution is mainly influenced by the applied voltage. The voltage must be adjusted while considering the electrical conductivity and viscosity of the solution, both of which depend on the polymer concentration.
Thus, obtaining a stable Taylor cone is more accessible and can be achieved when the viscosity is high and the surface tension is low. The average diameter of all PCL-based products decreases with increasing applied tension or decreasing solution flow rate, allowing the polymer jet to be stretched during flight. In addition, the study of different solvents led us to conclude that only ethyl acetate produced products similar to chloroform. Nevertheless, in this study, the primary solvent was chloroform to overcome the solubility problems of DTE.
The morphologies of electrospun PCL fibers produced with different solvent systems, chloroform/DMF, were observed via SEM (Figure 1). The addition of DMF resulted in smooth, uniform fibers, while beaded fibers were obtained with chloroform. For all formulations, the average diameter is between 200 and 400 nm. During the flight step, there is competition between solvent evaporation and polymer chain diffusion. For highly volatile solvents, the molecules evaporate from the surface of the jet before the polymer chains can rearrange themselves, resulting in a high concentration of polymers near the surface and, hence, the formation of a solid sheath with some defects. The addition of DMF reduces the volatility of the formulation, giving the polymer chains sufficient time to diffuse during the shrinkage of the jet. In these cases, smaller mean diameters were obtained even as the solution viscosity increased. Kheilbash et al. recently highlighted the role of the solvent in the electrospinning process [43]. They considered solvent evaporation a process-independent parameter, since it has little or no interaction with other parameters, such as the feed rate, voltage, and distance between the needle and collector. Therefore, it can be analyzed independently. The main problem with chloroform is its high vapor pressure, which leads to defects during fiber formation and a wide size distribution. A significant finding in our research is that adding DMF reduces the volatility of the solution, giving the polymer chains sufficient time to diffuse during the jet’s shrinkage.
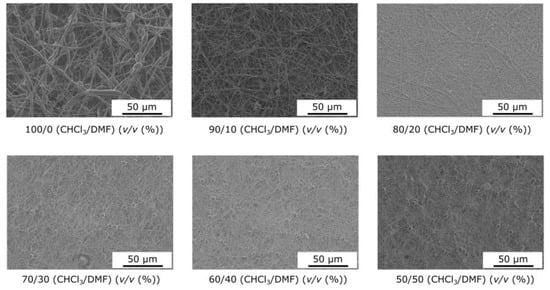
Figure 1.
Influence of the solvent composition on the nanofiber morphology.
For highly volatile solvents, the molecules evaporate from the surface of the jet before the polymer chains can be rearranged, resulting in a high concentration of polymers near the surface and, hence, forming a solid sheath with some defects. The vapor pressure of chloroform at room temperature (298 K) is estimated at 156 mmHg, i.e., around 68 times the vapor pressure of DMF, which is around 2.3 mmHg. Consequently, any solution containing DMF will travel a greater distance before solidifying. On the way from the nozzle to the collector, the polymer jet will undergo more stretching and bending, resulting in a reduction not only in the average diameter of the nanofibers but also in their size distribution. During this process, the slower evaporation of solvents will allow the reorganization and diffusion of macromolecular PCL chains in the polymer jet while limiting solidification.
Consequently, the greater the amount of DMF in the mixture, the lower the average fiber diameter and size distribution, which is correlated with a decrease in the vapor pressure value (Figure 2). The other point is that this phenomenon overcomes the effects of surface tension, polymer solution loading, and, above all, reduced viscoelastic forces, since the addition of DMF contributes to a decrease in solution viscosity. However, this technique is only effective when the morphology of the electrospun mat remains fibrous, i.e., when the PCL concentration is well above the entanglement concentration, i.e., in a concentration range where the solvent at low vapor pressure does not interfere with the formation of the fibrous morphology, i.e., in our case, 21 wt.%. Thus, adding DMF, a significant choice, resulted in smooth, uniform fibers, while beaded fibers were obtained with chloroform.
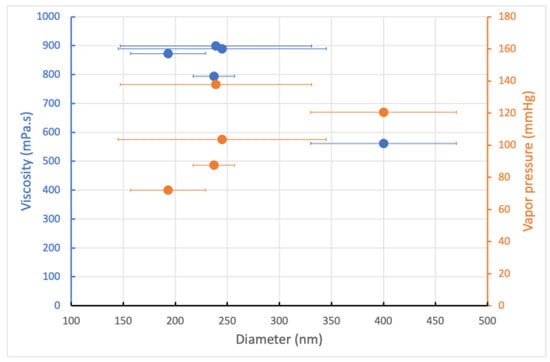
Figure 2.
The effect of the viscosity and vapor pressure on the mean diameter and size distribution of the electrospun PCL nanofibers.
3.1.2. Influence of the PCL Concentration on the Electrospun Membrane Morphology
The changes in the morphology of electrospun PCL fibers and the variations in the mean diameter with increasing polymer concentration are mainly related to the change in viscosity in the solution (Figure 3). Indeed, in our case, few variations in solution surface tension were observed (25 mN/m at 5 wt.% to 28 mN/m at 30 wt.%). As shown in Figure 4, the viscosity of polymer solutions increases with increasing concentration. Low polymer concentrations (c < c*) correspond to a dilute regime where polymer chains are isolated. The critical concentration, c* = 11 wt.%, marks the boundary between the dilute and semi-dilute regimes. This regime has no cohesion of polymer chains, as they are too far apart to interact. Rayleigh instability induces droplet formation, and only particles are collected. A semi-diluted, non-entangled regime is obtained when the concentration has a value between the critical concentration c* and the critical entanglement concentration ce (18 wt.%) (c* < c < ce). The polymer coils begin to fuse and interact, but the molecules are not entangled. In this electrospinning regime, fibers with beads are created. Thus, at concentrations of between 12 and 18% by weight, the average diameter of the fibers increases from 138 to 210 nm, with microparticles whose diameter decreases with increasing concentration, as well as a shift from spherical to spindle-shaped beads. In fact, during the electrospinning process, the low-viscosity solution has a weak viscoelastic force, which cannot overcome the electrostatic and Colombian repulsion forces that stretch the electrospinning jet. This can lead to partial rupture or stretching of the jet. In addition, under surface tension, the free solvent molecules in the solution tend to assemble into a spherical shape, forming beads or beaded fibers. Increasing the polymer concentration, a semi-diluted, entangled regime (c > ce, ce = 18 wt.%) is reached. Chain entanglement is sufficient to impart a higher viscosity to the spinning solution. Increased concentration is accompanied by increased viscosity, resulting in greater viscoelastic force and more entanglement of polymer chains. Solvent molecules can, thus, be distributed homogeneously in the solvent, forming smooth fibers with a more uniform diameter [44]. A stable electrospinning jet can be obtained, and uniform fibers are produced. As the concentration increases, the viscosity increases, but the conductivity of the solution decreases. For these formulations, the viscoelastic forces prevent the jet from being stretched due to a lack of charge density, resulting in a larger fiber diameter of up to 2 µm for the 30% sample.
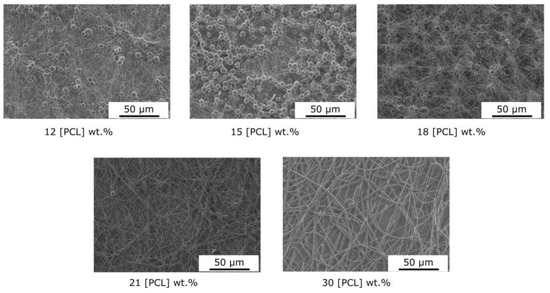
Figure 3.
Influence of the PCL concentration on the nanofiber morphology (solvent: CHCl3/DMF–9/1).
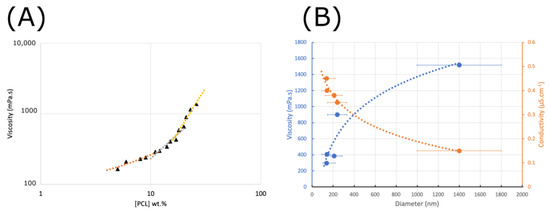
Figure 4.
Viscosity of PCL vs. PCL solution concentration (dilute—orange; semi-dilute—gray; semi-dilute and entangled—yellow) (A) and effect of the viscosity and electrical conductivity on the mean diameter and size distribution of the electrospun PCL nanofibers (B).
3.2. Influence of the DTE on the Morphology of the Electrospun PCL Membrane
Electrospun samples containing four different amounts of DTE (0.95, 2.85, 5.7, and 11.4 wt.%) were prepared by adjusting the process parameters for a 21 wt.% solution of PCL in a 9/1 binary CHCl3/DMF mixture. The presence of DTE has little impact on the physico-chemical properties of the solutions, except for the viscosity, i.e., (i) the electrical conductivity ranges from 0.28 to 0.33 µS·cm−1 due to π-conjugation, and (ii) the surface tensions were in the same range as that of the raw solution. The presence of DTE at low concentrations leads to a decrease in viscosity, which may be linked to the fact that at low concentrations, DTE limits interactions between PCL macromolecules. The higher viscosity observed as DTE concentration increases may be related to the fact that DTE provides a higher degree of entanglement of PCL macromolecules, making fluid movement more difficult when the solution is subjected to shear stress.
The diameters of the electrospun nanofibers vary as a function of DTE concentration. A bimodal diameter distribution was observed for the lowest concentration, with maximums at 400 nm and 1.6 µm. The samples with 2.85 and 5.7 wt.% DTE have a mean diameter of 410 ± 250 nm and 160 ± 80 nm, respectively. The order of magnitude of the diameters measured for the latter sample is similar to that of those without DTE produced under the same conditions. A bimodal dispersion is also observed for the sample with the highest DTE concentration, with peaks centered at 200 and 900 nm. These fibers also show surface defects.
Contact angle measurements confirmed that electrospun membranes are hydrophobic, as expected, with values of 106, 103, and 104° for the samples without DTE and with DTE at 0.95 and 2.85 wt.%, respectively (Figure 5). Thus, in this concentration range, DTE does not impact the membrane properties. For the other two samples with 5.7 and 11.4% by weight, the contact angle decreases to 96 and 85°, respectively. The wettability of the samples is related to the effect of the structure and the variations in fiber diameter and surface defects for the sample with 11.4 wt.% DTE, as well as to DTE/PCL interactions.
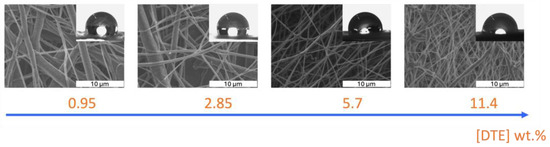
Figure 5.
SEM micrographs of electrospun PCL nanofibers with DTE concentrations of 0.95, 2.85, 5.7, and 11.4 (wt.%) and images of a water droplet on the membrane surface.
3.3. Photochromic Properties of the Electrospun PCL Membrane
The photochromic properties were studied with a CM-3610a spectrophotometer to elucidate the reversibility of color change. The membrane was excited by a UV lamp for 20 min and then by a visible lamp for 20 min. The color values (or color strength), K/S, were determined from the reflectance spectra using the Kubelka–Munk equation:
where K is the absorption coefficient, R is the reflectance, and S is the scattering coefficient of the sample. The color changes in the electrospun membranes were also evaluated using L* (brightness), a* (red), and b* (blue) in the CIE-Lab color space (Table 1).

Table 1.
Color properties of the electrospun membranes (membrane without DTE—L* = 93.9, a* = −0.2, b* = −0.5).
Figure 6 and the color data in Table 1 clearly show that the prepared photochromic electrospun membrane is white, while the color of the sample turns purple after UV irradiation. In addition, there are significant changes in the values of a* (colors corresponding to red and green), b* (colors corresponding to blue and yellow), and L* (value corresponding to brightness). These variations are linked to the DTE concentration. The a* value rises from −0.2 to 2.4–7.7, showing an increasing trend towards the red hue, while the b* value increases from −0.5 to −10.2–−25.6, showing a shift towards the blue hue. The evolution of the L* value from 93.93 to lower values illustrates a decrease in brightness. The absorption of the electrospun nanofibers can reach saturation after 20 min of UV irradiation, and prolonging the irradiation time hardly increases the nanofiber absorption. After 20 min of visible irradiation, the a*, b*, and L* values return to their initial points.
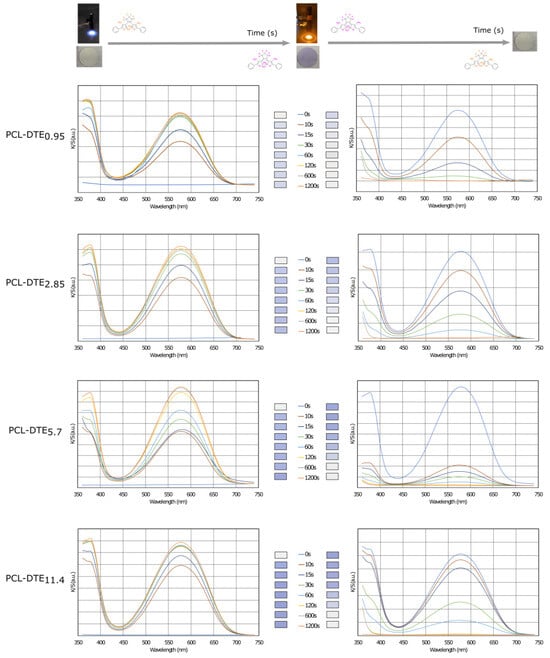
Figure 6.
Evolution of the color strength (K/S) during the coloration and bleaching processes of the photochromic electrospun membranes.
Initially, the membrane is white, which is attributed to its high reflectance for visible light. After being irradiated for 20 min, a new absorption band centered at 593 nm appears. This is the characteristic absorption peak in the blue region (Figure 6). The photochromic performance of the membrane is attributed to the incorporation of DTE. The open-form isomer (OF) is the most stable isomer. According to the electro-cyclization reaction of a 1,3,5-hexatriene unit, which involves six atoms and three double bonds (π pairs), the photochromic response—also known as photocyclization—consists of closing the OF ring to result in a closed form (CF). After irradiation with visible light, the photochromic mechanism is reversible, i.e., the light-induced opening of the ring is called photoreversion. For most DTEs, photocycling is induced by UV light, while photoreversion is caused by visible radiation.
The time required to reach saturation and return to the initial or uncolored state appears to be independent of the DTE concentration. For the four concentrations studied, saturation was achieved after 60 s. The discoloration was similar for all samples and was reached after 600 s. Based on these times, cycle stability or fatigue investigations were carried out.
3.4. Coloration and Discoloration Kinetics
Coloration and discoloration kinetics were determined from the K/S datasets and fitted to an extension of the first-order kinetic model (Figure 7). The mono-exponential model is generally used to describe the behavior of photochromic dyes in textile structures and correlates well with the fading mechanism. Nevertheless, a bi-exponential model has been used to describe the coloring process, highlighting that DTE photocyclization mechanisms are based on a fast and a slow process, which may be due to the aggregation of molecules in the PCL matrix (Table 2). Thus, k1 and k2 are the rate constants, and A1 and A2 are the amplitude values for the fast and slow mechanisms during the coloration step, respectively. K is the rate constant of the discoloration or photoreversion mechanism in response to visible light. All of the equations were fitted with high R2 values to establish the kinetic equation for the open-form <-> closed-form isomerization.
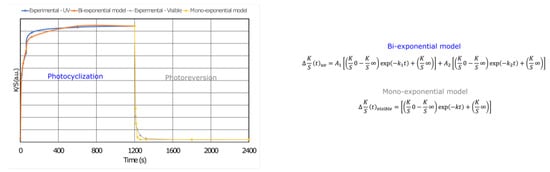
Figure 7.
Fitting of the experimental data of a photochromic membrane with 5.7 wt.% of DTE measured upon exposure to UV and visible light, wherein the equations for K/S0 and K/S∞ provide the initial and final (saturated) color intensity values, respectively, k is the rate constant, and t is the time of exposure.
Table 2.
Kinetic parameters of the coloration and discoloration processes of the photochromic electrospun membranes.
The photocyclization process of the DTE in the electrospun membrane followed a second-order equation. Table 2 compares the kinetics. The rate of photocyclization and the amplitude of the fast and slow mechanisms depend on the formulation. Thus, for 5.7 wt.% DTE, the two mechanisms are of the same order of magnitude, with a higher rate constant for the fast mechanism. For the other three formulations, the velocity constants are of the same order of magnitude, but the contribution of each of the two mechanisms varies. While the contributions for the lowest DTE concentration are almost identical, the fast mechanism prevails over the slow one for the other two formulations. A sufficient free volume around the molecules is required for the isomerization of DTE groups in the polymer matrix. In our case, the phenomena occur at a temperature higher than the Tg value of PCL, which contains a rubber-like amorphous phase with negligible influence of the DTE on the crystallinity index (43%).
The photoreversion of the membrane under visible illumination occurs following first-order kinetics. Thus, it was found that k and t1/2 reflect the role of the amount of DTE in the membrane. The higher the DTE content, the higher the fading rate, accompanied by a decrease in t1/2. The half-life (t1/2) was used to illustrate the rate of color change during the dyeing/fading mechanism and is a standard measure for expressing the rate of color change in photochromic materials or the half-life of the photochromic reaction. In the various models chosen to express this, the initial coloring and fading rates are faster than those at the end of the mechanism. t1/2 represents the time needed to reach half of the total photochromic response when exposed to UV or visible irradiation, i.e., the time needed to return to half of the developed color (K/S∞) [24]. The results obtained and presented in Table 2 indicate that the higher the DTE content in the membrane, the higher the relative staining and fading rates of the samples, expressed as lower fading rates. These results are expected and consistent with findings from the literature on other photochromic dyes applied to textile fabrics, whether via suction dyeing or screen-printing methods [28,39,45].
3.5. Fatigue Resistance of the Photochromic Membrane
Fatigue resistance, i.e., the reversibility of color changes, is an essential criterion for characterizing photochromic materials, as it determines their service life. This resistance was evaluated for all samples and was similar. The results presented in Figure 8 correspond to those obtained for the membrane with 5.7 wt.% DTE during 10 cycles on a repetitive basis for illustration purposes. The test results show that throughout the 10 cycles, the K/S value is always between 0.40 and 0.45 and, at the end of the test, is similar to that of the original membrane. These results mean that the cycle stability is better than that in many textile materials described in the literature, including those reported in the study by Fan et al. [46].
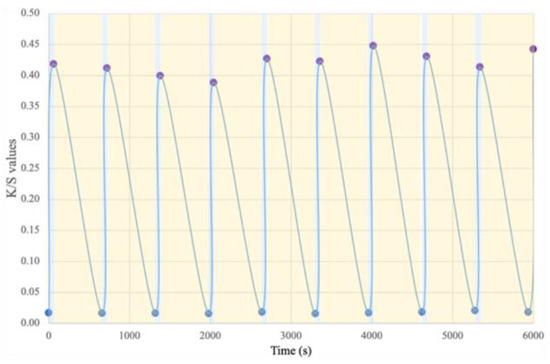
Figure 8.
Fatigue resistance and color-changing cycle stability of the photochromic electrospun membrane.
3.6. Influence of Exposure to UV and Visible Light on the Membrane Morphology
During a brief period of UV irradiation (1 min), the structure of the membrane and the mean diameter of the nanofibers remained unchanged (Figure 9). However, prolonged exposure caused the fibers to start merging and the surface of the sample to become rougher. Even after 10 cycles of UV–visible light exposure, the morphology was the same. Additionally, storing the sample at room temperature and in the dark did not change its surface state. Furthermore, the initial morphological changes due to UV exposure did not affect the ability of the membrane to change color in response to light. After 6 months of storage, the color change was still reversible, indicating that the changes in the surface and morphology did not impact the photochromic response of the sample under these test and storage conditions.
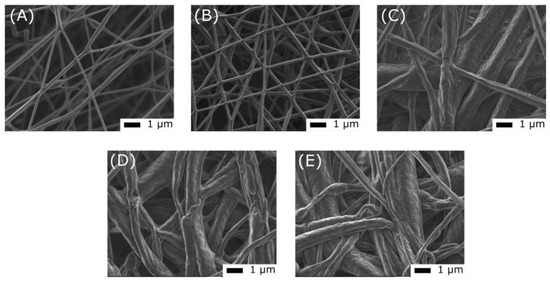
Figure 9.
Scanning electron microscopy images of an electrospun PCL—DTE5.7 membrane before UV exposure (A), after 1 min of UV exposure (B), after 20 min of UV exposure (C), after 10 cycles of irradiation under a UV lamp for 60 s and under a visible lamp for 600 s (D), and (E) after 6 months of storage at room temperature in dark conditions.
4. Conclusions
This work describes the influences of process and formulation parameters on the production of nonwoven PCL-based webs. The morphology of electrospun PCL nanofibers is influenced by the formulation of PCL-based solutions and their physico-chemical properties, such as the solvent system, the concentration of PCL used, the viscosity of the solution, the electrical conductivity, and the optimization of parameters to obtain a Taylor cone. Solvents with a higher solubility for PCL and higher volatility are not recommended to ensure the formation of electrospun fibers. A binary solvent system can dissolve PCL and control the fiber structure and morphology, as well as solvent evaporation. The viscosity of solutions can be controlled using different PCL concentrations. The addition of DMF reduces the volatility of the formulation, giving polymer chains sufficient time to diffuse during jet contraction, resulting in smaller mean diameters, even as the solution viscosity increases. The photochromic properties of electrospun membranes based on PCL and DTE were assessed using a CM-3610a spectrophotometer. The reversible color change in the membrane was studied by exciting it with UV and visible lamps for 20 min and determining the color values using the Kubelka–Munk equation. The study showed that incorporating DTE into the membrane enables photochromic performance, with the photochromic reaction being reversible. Analysis of the color-change kinetics showed that the mechanism of photocycling during coloration was linked to the amplitude of the fast and slow mechanisms, which depended on the formulation tested. Finally, the study showed that the photoreversion of the membrane under visible illumination occurs according to first-order kinetics. In summary, we have described the design and manufacture of photochromic membranes using electrospinning, offering rapid color-change rates, adjustable color fade times, superior reversibility, and reproducibility over at least 10 cycles. In addition, the thermochromic properties are proportional to the DTE concentration used, making it possible to obtain color variations with delta E values of 13 and 38 for concentrations ranging from 0.95 to 11.4 wt.%.
Author Contributions
Conceptualization, F.S., M.B.A. and F.R.; methodology, M.B.A. and F.S.; validation, F.R. and F.S.; formal analysis, M.B.A. and F.S.; writing—original draft preparation, M.B.A.; writing—review and editing, F.S. and F.R.; supervision, F.S. and F.R.; funding acquisition, F.S. All authors have read and agreed to the published version of the manuscript.
Funding
This research was funded by the French National Research Agency (grant number ANR, ANR-19-CE06-0022) and the region Hauts-de-France.
Institutional Review Board Statement
Not applicable.
Informed Consent Statement
Not applicable.
Data Availability Statement
Data is contained within the article.
Conflicts of Interest
The authors declare no conflicts of interest. The funders had no role in the design of the study, in the collection, analyses, or interpretation of data, in the writing of the manuscript, or in the decision to publish the results.
References
- Albini, A. Some remarks on the first law of photochemistry. Photochem Photobiol Sci 2016, 15, 319–324. [Google Scholar] [CrossRef]
- Fischer, E.Y.Y. Hirshberg—In memoriam. J. Chem. Educ. 1963, 40, 112. [Google Scholar] [CrossRef]
- De Sousa, F.B.; Alexis, F.; Giordani, S. Editorial: Photochromic Materials: Design and Applications. Front. Mater. 2021, 8, 720172. [Google Scholar] [CrossRef]
- Yan, W.; Page, A.; Nguyen-Dang, T.; Qu, Y.; Sordo, F.; Wei, L.; Sorin, F. Advanced Multimaterial Electronic and Optoelectronic Fibers and Textiles. Adv. Mater. 2019, 31, e1802348. [Google Scholar] [CrossRef]
- Smith, A.T.; Ding, H.; Gorski, A.; Zhang, M.; Gitman, P.A.; Park, C.; Hao, Z.; Jiang, Y.; Williams, B.L.; Zeng, S.; et al. Multi-color Reversible Photochromisms via Tunable Light-Dependent Responses. Matter 2020, 2, 680–696. [Google Scholar] [CrossRef]
- Hu, Z.; Huang, X.; Yang, Z.; Qiu, J.; Song, Z.; Zhang, J.; Dong, G. Reversible 3D optical data storage and information encryption in photo-modulated transparent glass medium. Light. Sci. Appl. 2021, 10, 140. [Google Scholar] [CrossRef]
- Qin, M.; Huang, Y.; Li, F.; Song, Y. Photochromic sensors: A versatile approach for recognition and discrimination. J. Mater. Chem. C 2015, 3, 9265–9275. [Google Scholar] [CrossRef]
- Zhu, J.; Yang, Y.; He, J.; Hu, L.; Wu, W.; Gao, Y.; Wei, Y. Dynamic Information Encryption Technology by Combining Photochromic Spiropyrans and Carbon Dots. ACS Appl. Opt. Mater. 2023, 1, 1312–1319. [Google Scholar] [CrossRef]
- Shen, X.; Hu, Q.; Ge, M. Fabrication and characterization of multi stimuli-responsive fibers via wet-spinning process. Spectrochim. Acta Part A Mol. Biomol. Spectrosc. 2021, 250, 119245. [Google Scholar] [CrossRef]
- Shen, X.; Akbarzadeh, A.; Shi, C.; Pang, Z.; Jin, Y.; Ge, M. Preparation and characterization of photo-stimuli-responsive fibers based on lanthanide-activated phosphors and spiropyran dye. J. Mater. Res. Technol. 2021, 13, 1374–1387. [Google Scholar] [CrossRef]
- Isapour, G.; Lattuada, M. Bioinspired Stimuli-Responsive Color-Changing Systems. Adv. Mater. 2018, 30, e1707069. [Google Scholar] [CrossRef]
- Tao, Y.; Zhang, S.; Xu, M.; Shu, Q.; Gao, S.; Liu, Y.; Wang, P.; Cheng, R. Preparation and application of profiled luminescent polyester fiber with reversible photochromism materials. E-Polymers 2024, 24, 20230121. [Google Scholar] [CrossRef]
- Aden, M.B.; Rault, F.; Salaün, F. PCL photo-responsive electrospun membrane based on photochromic molecule. In Proceedings of the XVI International İzmir Textile & Apparel Symposium IITAS 2023, Izmir, Türkiye, 25–27 October 2023; pp. 14–19. [Google Scholar]
- Irie, M.; Kungwatchakun, D. Photoresponsive polymers. Mechanochemistry of polyacrylamide gels having triphenylmethane leuco derivatives. Die Makromol. Chem. Rapid Commun. 2003, 5, 829–832. [Google Scholar] [CrossRef]
- Li, Z.; Zhang, J.R.; Tian, X.K.; Yang, S.; Chen, S.; Zhou, H.; Yang, X.G. Green-/NIR-light-controlled rapid photochromism featuring reversible thermally activated delayed fluorescence and photoelectronic switching. Chem. Sci. 2022, 13, 9381–9386. [Google Scholar] [CrossRef]
- Irie, M.; Fukaminato, T.; Matsuda, K.; Kobatake, S. Photochromism of diarylethene molecules and crystals: Memories, switches, and actuators. Chem. Rev. 2014, 114, 12174–12277. [Google Scholar] [CrossRef]
- Yan, Q.; Qiao, Z.; Xu, J.; Ren, J.; Wang, S. All-visible-light triggered photochromic fluorescent dithienylethene-phenanthroimidazole dyads: Synthesis, crystal structure, multiple switching behavior and information storage. Dye. Pigment. 2022, 202, 110298. [Google Scholar] [CrossRef]
- He, Z.; Wang, W.; Fan, J.; Bao, B.; Qin, X.; Yu, D. Photochromic microcapsules anchored on cotton fabric by layer-by-layer self-assembly method with erasable property. React. Funct. Polym. 2020, 157, 104762. [Google Scholar] [CrossRef]
- He, Z.; Bao, B.; Fan, J.; Wang, W.; Yu, D. Photochromic cotton fabric based on microcapsule technology with anti-fouling properties. Colloids Surf. A Physicochem. Eng. Asp. 2020, 594, 124661. [Google Scholar] [CrossRef]
- Zhou, Y.; Yan, Y.; Du, Y.; Chen, J.; Hou, X.; Meng, J. Preparation and application of melamine-formaldehyde photochromic microcapsules. Sens. Actuators B Chem. 2013, 188, 502–512. [Google Scholar] [CrossRef]
- Topbas, O.; Sariisik, A.M.; Erkan, G.; Ek, O. Photochromic microcapsules by coacervation and in situ polymerization methods for product-marking applications. Iran. Polym. J. 2020, 29, 117–132. [Google Scholar] [CrossRef]
- Periyasamy, A.P.; Venkataraman, M.; Kremenakova, D.; Militky, J.; Zhou, Y. Progress in Sol-Gel Technology for the Coatings of Fabrics. Materials 2020, 13, 1838. [Google Scholar] [CrossRef]
- Periyasamy, A.P.; Vikova, M.; Vik, M. Spectral and physical properties organo-silica coated photochromic poly-ethylene terephthalate (PET) fabrics. J. Text. Inst. 2019, 111, 808–820. [Google Scholar] [CrossRef]
- Cheng, T.; Lin, T.; Brady, R.; Wang, X. Fast response photochromic textiles from hybrid silica surface coating. Fibers Polym. 2008, 9, 301–306. [Google Scholar] [CrossRef]
- Mogharbel, A.T.; Alzahrani, S.O.; Abualnaja, M.M.; Al-bonayan, A.M.; Almotairy, A.R.Z.; Abumelha, H.M.; El-Metwaly, N.M. Preparation of dual mode encoding photochromic electrospun glass nanofibers for anticounterfeiting applications. Ceram. Int. 2023, 49, 27060–27068. [Google Scholar] [CrossRef]
- Khatri, A.; Ali, S.; Kim, S.H.; Javeed, A. Colouration of polymeric electrospun nanofibrous mats—A mini review. J. Text. Inst. 2019, 111, 765–774. [Google Scholar] [CrossRef]
- Wu, S.; Fan, J.; Wang, W.; Yu, D. Smart screen-printed photochromic fabrics with fast color switching performance and high fatigue resistance for energy storage applications. Colloids Surf. A Physicochem. Eng. Asp. 2022, 632, 127760. [Google Scholar] [CrossRef]
- Wang, X.; Ma, X.; Cui, S.; Pu, S. Preparation of a photochromic diarylethene microcapsule with high fatigue resistant and printed on cotton fabric. Mater. Lett. 2023, 346, 134530. [Google Scholar] [CrossRef]
- Kert, M.; Krkoc, V.; Gorjanc, M. Influence of Optical Brightening Agent Concentration on Properties of Cotton Fabric Coated with Photochromic Microcapsules Using a Pad-Dry-Cure Process. Polymers 2019, 11, 1919. [Google Scholar] [CrossRef]
- Pardo, R.; Zayat, M.; Levy, D. Effect of the chemical environment on the light-induced degradation of a photochromic dye in ormosil thin films. J. Photochem. Photobiol. A Chem. 2008, 198, 232–236. [Google Scholar] [CrossRef]
- Parhizkar, M.; Zhao, Y.; Lin, T. Photochromic Fibers and Fabrics. In Handbook of Smart Textiles; Tao, X., Ed.; Springer: Singapore, 2014; pp. 1–23. [Google Scholar]
- Kumbasar, E.P.A.; Morsunbul, S.; Alır, S. Photochromic Nanofibers. In Novel Aspects of Nanofibers; Lin, T., Ed.; InTech: London, UK, 2018. [Google Scholar]
- Little, A.F.; Christie, R.M. Textile applications of commercial photochromic dyes. Part 6: Photochromic polypropylene fibres. Color. Technol. 2016, 132, 304–309. [Google Scholar] [CrossRef]
- Pinto, T.V.; Cardoso, N.; Costa, P.; Sousa, C.M.; Durães, N.; Silva, C.; Coelho, P.J.; Pereira, C.; Freire, C. Light driven PVDF fibers based on photochromic nanosilica@naphthopyran fabricated by wet spinning. Appl. Surf. Sci. 2019, 470, 951–958. [Google Scholar] [CrossRef]
- Fan, S.; Lam, Y.; Yang, J.; Bian, X.; Xin, J.H. Development of photochromic poly(azobenzene)/PVDF fibers by wet spinning for intelligent textile engineering. Surf. Interfaces 2022, 34, 102383. [Google Scholar] [CrossRef]
- He, Z.; Mohsenzadeh, E.; Rault, F.; Lewandowski, M.; Salaün, F. Energy Harvesting Solutions Based on Piezoelectric Textiles Structures from Macro Nano Approach. In Electrospun Nanofibers: Principles, Technology and Novel Applications; Vaseashta, A., Bölgen, N., Eds.; Springer Nature: Cham, Switzerland, 2022; pp. 391–415. [Google Scholar]
- Li, X.; Lin, L.; Kanjwal, M.A.; Chronakis, I.S.; Liu, S.; Chen, Y. Preparing photochromic nanofibers and animal cells using a photochromic compound of 1’,3’,3’-trimethyl-6-nitrospiro (2H-1-benzopyran-2,2’-indoline). Colloids Surf. B Biointerfaces 2012, 89, 67–72. [Google Scholar] [CrossRef]
- Wang, M.; Vail, S.A.; Keirstead, A.E.; Marquez, M.; Gust, D.; Garcia, A.A. Preparation of photochromic poly(vinylidene fluoride-co-hexafluoropropylene) fibers by electrospinning. Polymer 2009, 50, 3974–3980. [Google Scholar] [CrossRef]
- Alidaei-Sharif, H.; Babazadeh-Mamaqani, M.; Roghani-Mamaqani, H.; Salami Kalajahi, M. Dynamic anticounterfeiting polymeric inks for multipurpose time-dependent encryption with a high level of security. Eur. Polym. J. 2023, 197, 112339. [Google Scholar] [CrossRef]
- Bućko, A.; Zielińska, S.; Ortyl, E.; Larkowska, M.; Barille, R. Synthesis of organic–inorganic hybrid azobenzene materials for the preparation of nanofibers by electrospinning. Opt. Mater. 2014, 38, 179–187. [Google Scholar] [CrossRef][Green Version]
- Higashi, S.; Hirai, T.; Matsubara, M.; Yoshida, H.; Beniya, A. Dynamic viscosity recovery of electrospinning solution for stabilizing elongated ultrafine polymer nanofiber by TEMPO-CNF. Sci. Rep. 2020, 10, 13427. [Google Scholar] [CrossRef]
- Huling, J.; Gotz, A.; Grabow, N.; Illner, S. GIFT: An ImageJ macro for automated fiber diameter quantification. PLoS ONE 2022, 17, e0275528. [Google Scholar] [CrossRef]
- Kheilbash, M.; Pirsalami, S.; Malayeri, M.R.; Zebarjad, S.M.; Riazi, M. Use of mixed low/high vapor pressure solvent as a novel solvent design strategy for tuning fiber diameter in electrospun mats. J. Polym. Res. 2024, 31, 94. [Google Scholar] [CrossRef]
- Mit-uppatham, C.; Nithitanakul, M.; Supaphol, P. Ultrafine Electrospun Polyamide-6 Fibers: Effect of Solution Conditions on Morphology and Average Fiber Diameter. Macromol. Chem. Phys. 2004, 205, 2327–2338. [Google Scholar] [CrossRef]
- Abate, M.T.; Seipel, S.; Yu, J.; Viková, M.; Vik, M.; Ferri, A.; Guan, J.; Chen, G.; Nierstrasz, V. Supercritical CO2 dyeing of polyester fabric with photochromic dyes to fabricate UV sensing smart textiles. Dyes Pigments 2020, 183, 108671. [Google Scholar] [CrossRef]
- Fan, J.; Bao, B.; Wang, Z.; Li, H.; Wang, Y.; Chen, Y.; Wang, W.; Yu, D. Flexible, switchable and wearable image storage device based on light responsive textiles. Chem. Eng. J. 2021, 404, 126488. [Google Scholar] [CrossRef]


Disclaimer/Publisher’s Note: The statements, opinions and data contained in all publications are solely those of the individual author(s) and contributor(s) and not of MDPI and/or the editor(s). MDPI and/or the editor(s) disclaim responsibility for any injury to people or property resulting from any ideas, methods, instructions or products referred to in the content. |
© 2024 by the authors. Licensee MDPI, Basel, Switzerland. This article is an open access article distributed under the terms and conditions of the Creative Commons Attribution (CC BY) license (https://creativecommons.org/licenses/by/4.0/).