Article

Enhancing Tribological Performance of Micro-Arc Oxidation Coatings on 6061 Aluminum Alloy with h-BN Incorporation

by
Xia Zhao
1,
Jingfu Song
2,
Jingyi Lin
1,
Guoqing Wang
1 and
Gai Zhao
1,*
1
State Key Laboratory of Mechanics and Control of Mechanical Structures, Nanjing University of Aeronautics and Astronautics, Nanjing 210016, China
2
School of Naval Architecture & Ocean Engineering, Jiangsu Maritime Institute, Nanjing 211170, China
*
Author to whom correspondence should be addressed.
Coatings 2024, 14(6), 771; https://doi.org/10.3390/coatings14060771
Submission received: 16 May 2024 / Revised: 15 June 2024 / Accepted: 17 June 2024 / Published: 19 June 2024

Abstract

:
Micro-arc oxidation (MAO) coatings of aluminum alloy have great potential applications due to their high hardness and wear resistance. However, the micro-pores and defects formed in the discharge channels during the MAO process limit its application in the corrosion field. This study delves into the impact of h-BN nanoparticles into MAO coatings on their structure, corrosion resistance, phase composition, and tribological properties. The results show that the incorporation of h-BN particles reduces the porosity and surface roughness of the coating while enhancing its hardness and wear resistance. The best corrosion resistance is obtained at a concentration of 2 g/L h-BN. An analysis of worn surface morphology, corrosion resistance, and friction coefficient change was conducted to evaluate the performance of this coating. This method provides a new approach to enhance the surface hardness and wear resistance of aluminum alloys, which is significant for expanding the application of aluminum alloys in corrosion environments.

1. Introduction

The main alloying elements in 6061 aluminum alloy are magnesium and silicon, which offer medium strength, good corrosion resistance, weldability, and good anti-oxidation performance. It is widely used in aerospace, automotive manufacturing, construction, electronic equipment, and sports equipment [1]. However, the inherent hardness and wear resistance of 6061 aluminum alloy limit its use in various service environments, especially in extremely harsh conditions [2]. Therefore, preparing protective coatings on the surface of aluminum alloys is crucial for improving their hardness and wear resistance.
Micro-arc oxidation (MAO), also known as plasma electrolytic oxidation (PEO), is a new type of surface treatment technology that is simple, efficient, and pollution-free. By applying a high pulse voltage to the valve’s metal surface, the surface gas is ionized, producing high temperature and pressure under plasma electrolytic oxidation, thus obtaining a dense, high-hardness, and strong adhesion ceramic oxidation coating. The micro-arc oxidation process involves complex comprehensive action of electrochemistry, thermochemistry, physics, and plasma chemistry [3,4].
However, during the micro-arc oxidation process, due to the formation of discharge channels on the coating surface by local spark discharge, many micro-pores affect the surface roughness and friction coefficient of the aluminum alloy [5,6,7,8,9]. Now, the incorporation of inert nanoparticles into the coating has become a research hotspot, which can reduce porosity and improve the surface performance of the coating [10]. For example, hard nanoparticles such as TiO2 [11], ZrO2 [12], and lubricating particles like MoS2 [13], graphene [14], and graphene oxide (GO) [15]. Hakimizad et al. [10] studied the influence of a pulse waveform on the morphology, composition, and corrosion behavior of Al2O3 and Al2O3/TiO2 composite MAO coatings on 7075 aluminum alloy, indicating that pore plugging is an effective repair mechanism that can improve the corrosion resistance of MAO coatings. Liu et al. [14] studied the influence of graphene on the structure and corrosion resistance of D16T aluminum alloy MAO coatings, finding that the incorporation of graphene improved the coating’s density, hardness, and corrosion resistance. Li et al. [15] studied the influence of GO on the morphology and tribological properties of MAO coatings on the surface of 2A12 aluminum alloy, finding that the incorporation of C elements at the interface of the film layer during the electrolytic oxidation process made the Al2O3/GO composite film layer dense and smooth, with a significant reduction in friction coefficient and improved wear resistance.
Inert inorganic nanoparticles with graphite-like crystal structures have excellent lubricating effects [16] and are widely used in the micro-arc oxidation process. Hexagonal boron nitride (h-BN) is a hexagonal crystal structure composed of stacked plate-like structures, and known for its excellent lubricating effect [17,18]. h-BN has certain chemical inertness and stability, is insoluble in cold water, and has excellent stability in most acids and bases, not reacting with weak acids and strong bases at room temperature [19]. In addition, h-BN has good electrical insulation properties with a high breakdown voltage [20,21].
Therefore, this study will investigate the influence of h-BN nanoparticles on the mechanical, tribological, and corrosion performance of micro-arc oxidation coatings of aluminum alloy, and it aims to explore their modification mechanism of these particles.

2. Materials and Methods

2.1. Materials for Micro-Arc Oxidation Coatings

The main components of test material for GB/T 3191-2010 national standard [22] 6061 aluminum alloy with hardness (100 Hv) by T6 heat treatment, and with size specifications of a 50 mm × 20 mm × 3 mm rectangle, are shown in Table 1. The basic information of experimental drugs is shown in Table 2.

2.2. Preparation Process

MAO coatings were prepared on the surface of 6061 aluminum alloy. The main components of the alloy are shown in Table 1. The base material was polished with SiC sandpaper and buffed to remove the surface oxide coating. The polished samples were cleaned in an ultrasonic cleaner with alcohol and then dried for later use. A solution containing 1.25 g/L NaOH, 5 g/L Na2SiO3, and 40 g/L(NaPO3)6 was prepared in deionized water, which was used as the electrolyte. h-BN nanoparticles with a particle size of 20 nm were mixed into the electrolyte at different concentrations of 0 g/L, 1 g/L, 2 g/L, and 3 g/L. Before the MAO process, the electrolyte was stirred for 20 min and sonicated for 10 min to ensure uniform dispersion of h-BN nanoparticles in the solution.
Using a micro-arc oxidation device (MAO-WH30A-T, Lantu Intelligent Technology Co., Nanjing, China), the sample served as the anode, and the stainless steel in the electrolysis tank served as the cathode. The power supplied outputs of a constant current with a density of 6 A/dm2, a frequency of 500 Hz, and a duty cycle of 10%. Each sample underwent a micro-arc oxidation process for 20 min.

2.3. Structural and Morphology Characterization

The surface morphology, structure, and elemental distribution of the coating were examined using a scanning electron microscope (SEM, TESCAN, Brno, Czech Republic) and an energy-dispersive X-ray spectrometer (EDS). The thickness of the coating was measured using an eddy current thickness gauge (TimelC, TL260, Beijing, China) in five random areas to calculate the average thickness. The cross-sectional morphology of the coating was observed using an optical microscope (Keyence, VHX-2000, Tokyo, Japan). The phase composition of the coating was studied using a grazing incidence X-ray diffraction (XRD) in a scanning angle range of 20° to 90°.

2.4. Hardness Tests

The hardness of the coating was measured using a manual-loading HVS-1000 micro-Vickers hardness tester with an experimental load of 300 g. After testing the hardness at five locations on the coating’s surface, the average value was taken as the hardness of the coating.

2.5. Porosity and Roughness Measurements

The pore area was calculated using the software ImageJ (ij154-win-java8) with the area of the entire picture as the basis. The porosity of the sample was obtained by calculating the ratio of the pore area to the total area. The surface roughness of the coating was measured five times in different areas using the white light interference method, and the average value was taken as the roughness of the coating.

2.6. Friction Tests

The friction coefficient (COF) of the MAO coating was measured using an RTEC (MFT-5000, RTEC Instrument Technology Co., Ltd., San Jose, CA, USA) friction tester. All wear tests were conducted under dry friction conditions, using GCr15-type steel balls as the counter material. The constant load of the friction tester was 2 N, the rotating diameter was 4 mm, and the rotation speed was 300 r/min. The test time for each sample was 30 min.
The wear morphology of the coating was observed using an optical microscope (Keyence, VHX-2000, Japan), and the width of the wear track was measured. The wear rate was calculated using the width of the wear track on the wear trajectory. The formula for calculating the wear rate is shown in (1) [23]. In the formula, W represents the wear rate, V represents the wear volume (mm3), P represents the applied load, and S represents the slide distance.
W = V P · S ,

2.7. Corrosion Tests

Electrochemical tests were performed on an Interface 1010E electrochemical workstation. In the standard three-electrode system, a graphite electrode is used as the working electrode and a calomel electrode as the reference electrode. The samples were immersed in a 3.5 wt.% NaCl solution for 30 min. This provided a stable electrochemical environment [24].
The open-circuit potential (OCP) test was continued for 10 min. After the potential fluctuation was stabilized within 10 mV, the electrochemical impedance (EIS) data were recorded under an AC sinusoidal perturbation signal with a frequency range of 0.1–1 × 10⁵ Hz and an amplitude of 20 mV [25,26]. The EIS data were fitted numerically using Zview electrochemical test and analysis software. OCP and EIS electrochemical tests were performed three times to ensure reproducibility and the data were averaged.

3. Results

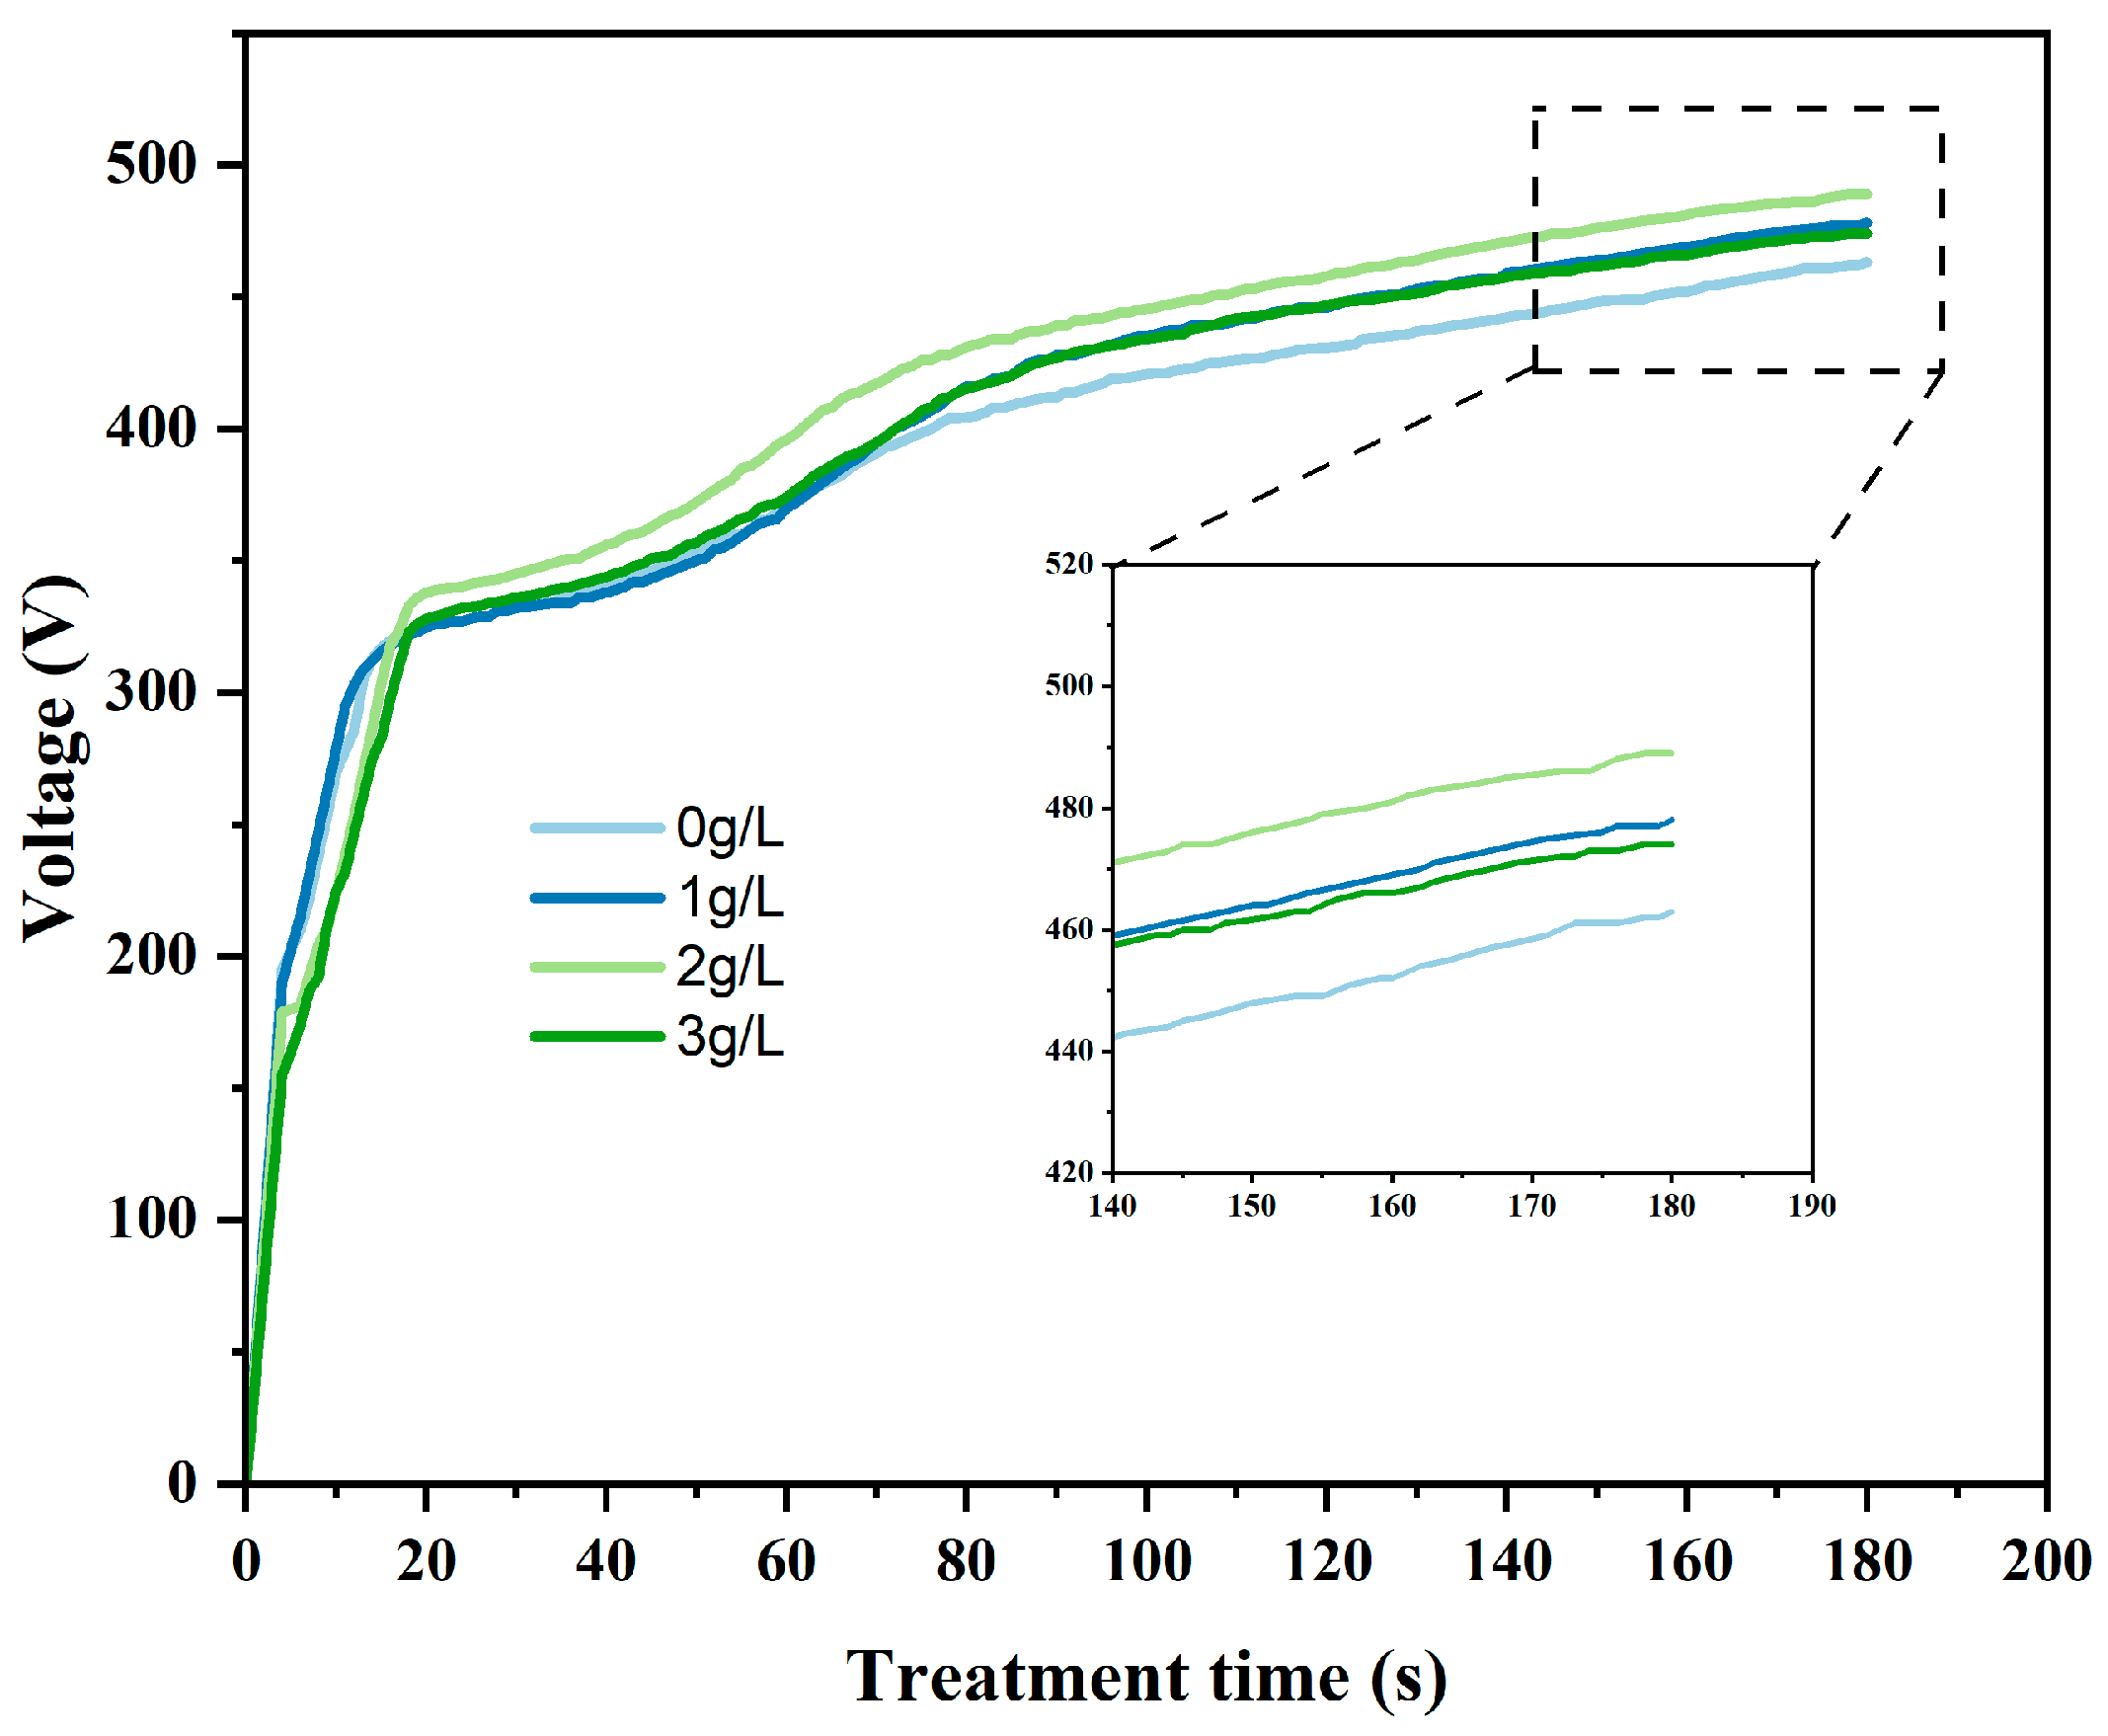
3.1. Voltage–Time Response

The response of voltage over time during the initial stages of micro-arc oxidation is shown in Figure 1. It is observed from the figure that the change in voltage is primarily divided into two stages. During the first 20 s, the voltage increased rapidly to about 320 V. At this stage, no electric sparks appeared on the sample surface, a large number of bubbles were formed, the sample surface lost its metallic luster, and a passivated layer formed on the surface. This corresponds to the anodic oxidation stage of the aluminum alloy. After 20 s, the voltage increased more slowly than during the first stage. As the reaction progressed, electrical sparks began to appear on the surface of the sample, with a less–more trend in the area and number of sparks.
The barrier effect of the passivation coating causes the voltage applied to the substrate to increase until the coating finally breaks down. Since the breakdown voltage of a coating is a function of the conductivity of the coating, the breakdown voltage decreases as the conductivity increases [27]. During the reaction process, the h-BN nanoparticles adsorb onto the surface of the coating, resulting in an increase in the electrical resistance of the coating. Therefore, the electrolyte solution with added nanoparticles of h-BN has a higher terminal voltage than the solution without particles. The 2 g/L electrolyte had the highest terminal voltage, followed by the 1 g/L and 3 g/L electrolytes. The terminal voltage of the solution with a concentration of 3 g/L was lower than that of solutions with concentrations of 1 g/L and 2 g/L. This may be because the high concentration of nanoparticles easily leads to agglomeration on the coating surface, and the puncture voltage of h-BN particles is high [28,29], which hinders the progress of the micro-arc oxidation reaction. As a result, the voltage cannot increase rapidly enough in a short time to reach the puncture voltage required for h-BN particles, making it difficult for the coating to be punctured.

3.2. Analysis of Electrochemical Corrosion Test Results

Figure 2a–c depict the electrochemical impedance spectroscopy (EIS) results of the samples, which are presented as Bode and Nyquist plots, respectively, following the samples’ immersion in a 3.5% wt.% NaCl solution for 30 min. As illustrated in Figure 2c of the Nyquist diagram, when the concentration of h-BN nanoparticles is 1 g/L, the difference in the diameter of the capacitance ring with 0 g/L is not significant, indicating that the electrochemical impedance is minimally affected. The capacitance ring with a concentration of 2 g/L exhibits the greatest diameter, which is considerably larger than that of the 0 g/L sample. This indicates that the 2 g/L sample exhibits enhanced corrosion resistance. The capacitance ring with a concentration of 3 g/L exhibited a lower capacitance value than that of the 0 g/L control, indicating that the addition of h-BN particles at 3 g/L resulted in a reduction in the corrosion resistance of the coating. The Nyquist diagram of electrochemical impedance depicts the high-frequency region on the left and the low-frequency region on the right [30]. The capacitive loops observed in the high-frequency region are typically attributed to thin-film effects and electron-transfer processes. In contrast, those observed in the low-frequency region may originate from matter-transfer processes [31].
In order to evaluate the overall corrosion resistance of the coating, the low-frequency impedance (|Z|0.1Hz) presented in Figure 2a is employed [32,33]. The |Z|0.1Hz of the sample with a 2 g/L concentration is the largest, the difference between a 1 g/L and 0 g/L concentration is not significant, and the sample with a 3 g/L concentration is the smallest, which is consistent with the results of Figure 2c. This suggests that the corrosion resistance of the sample with a concentration of 2 g/L is the most favorable.
The EIS data results were fitted using the equivalent circuit [34] (depicted in Figure 2), where the constant phase element (CPE) is employed to represent the non-ideal capacitance [35], and the conductance is represented by the following equation:
Y = Y 0 j ω n ,
where Y0 and n are the conductivity constant and empirical index, respectively. The present study is based on previous research in this field, and an equivalent circuit (Rs(CPEf(Rpore(CPEdlRct)(CPEdiffRdiff)))) [36] was constructed to align with the EIS data of samples exhibiting varying concentrations. In this circuit, Rs represents the solution resistance, CPEdl and Rct represent the capacitance of the bilayer in the low-frequency region and the charge-transfer resistance in the Faraday process, respectively. In turn, CPEdiff and Rdiff represent the diffusion-related capacitance and the associated resistance, CPEf represents the capacitance of the membrane effect, and Rpore represents the total resistance of the pores on the membrane.
The data obtained from the equivalent circuit fitting are presented in Table 3. Polarization resistance (Rp) is a metric utilized to assess corrosion resistance. This index is calculated as the sum of Rpore, Rct, and Rdiff [37]. The results demonstrated that the highest Rp was observed for the 2 g/L concentration. However, the Rp for the 1 g/L and 3 g/L concentrations was found to be lower than that for 0 g/L. This indicates that the addition of h-BN nanoparticles improves corrosion resistance, but if the concentration is not sufficient or if the agglomeration effect of the particles is caused by too high a concentration, it tends to decrease the corrosion resistance of the sample coating.

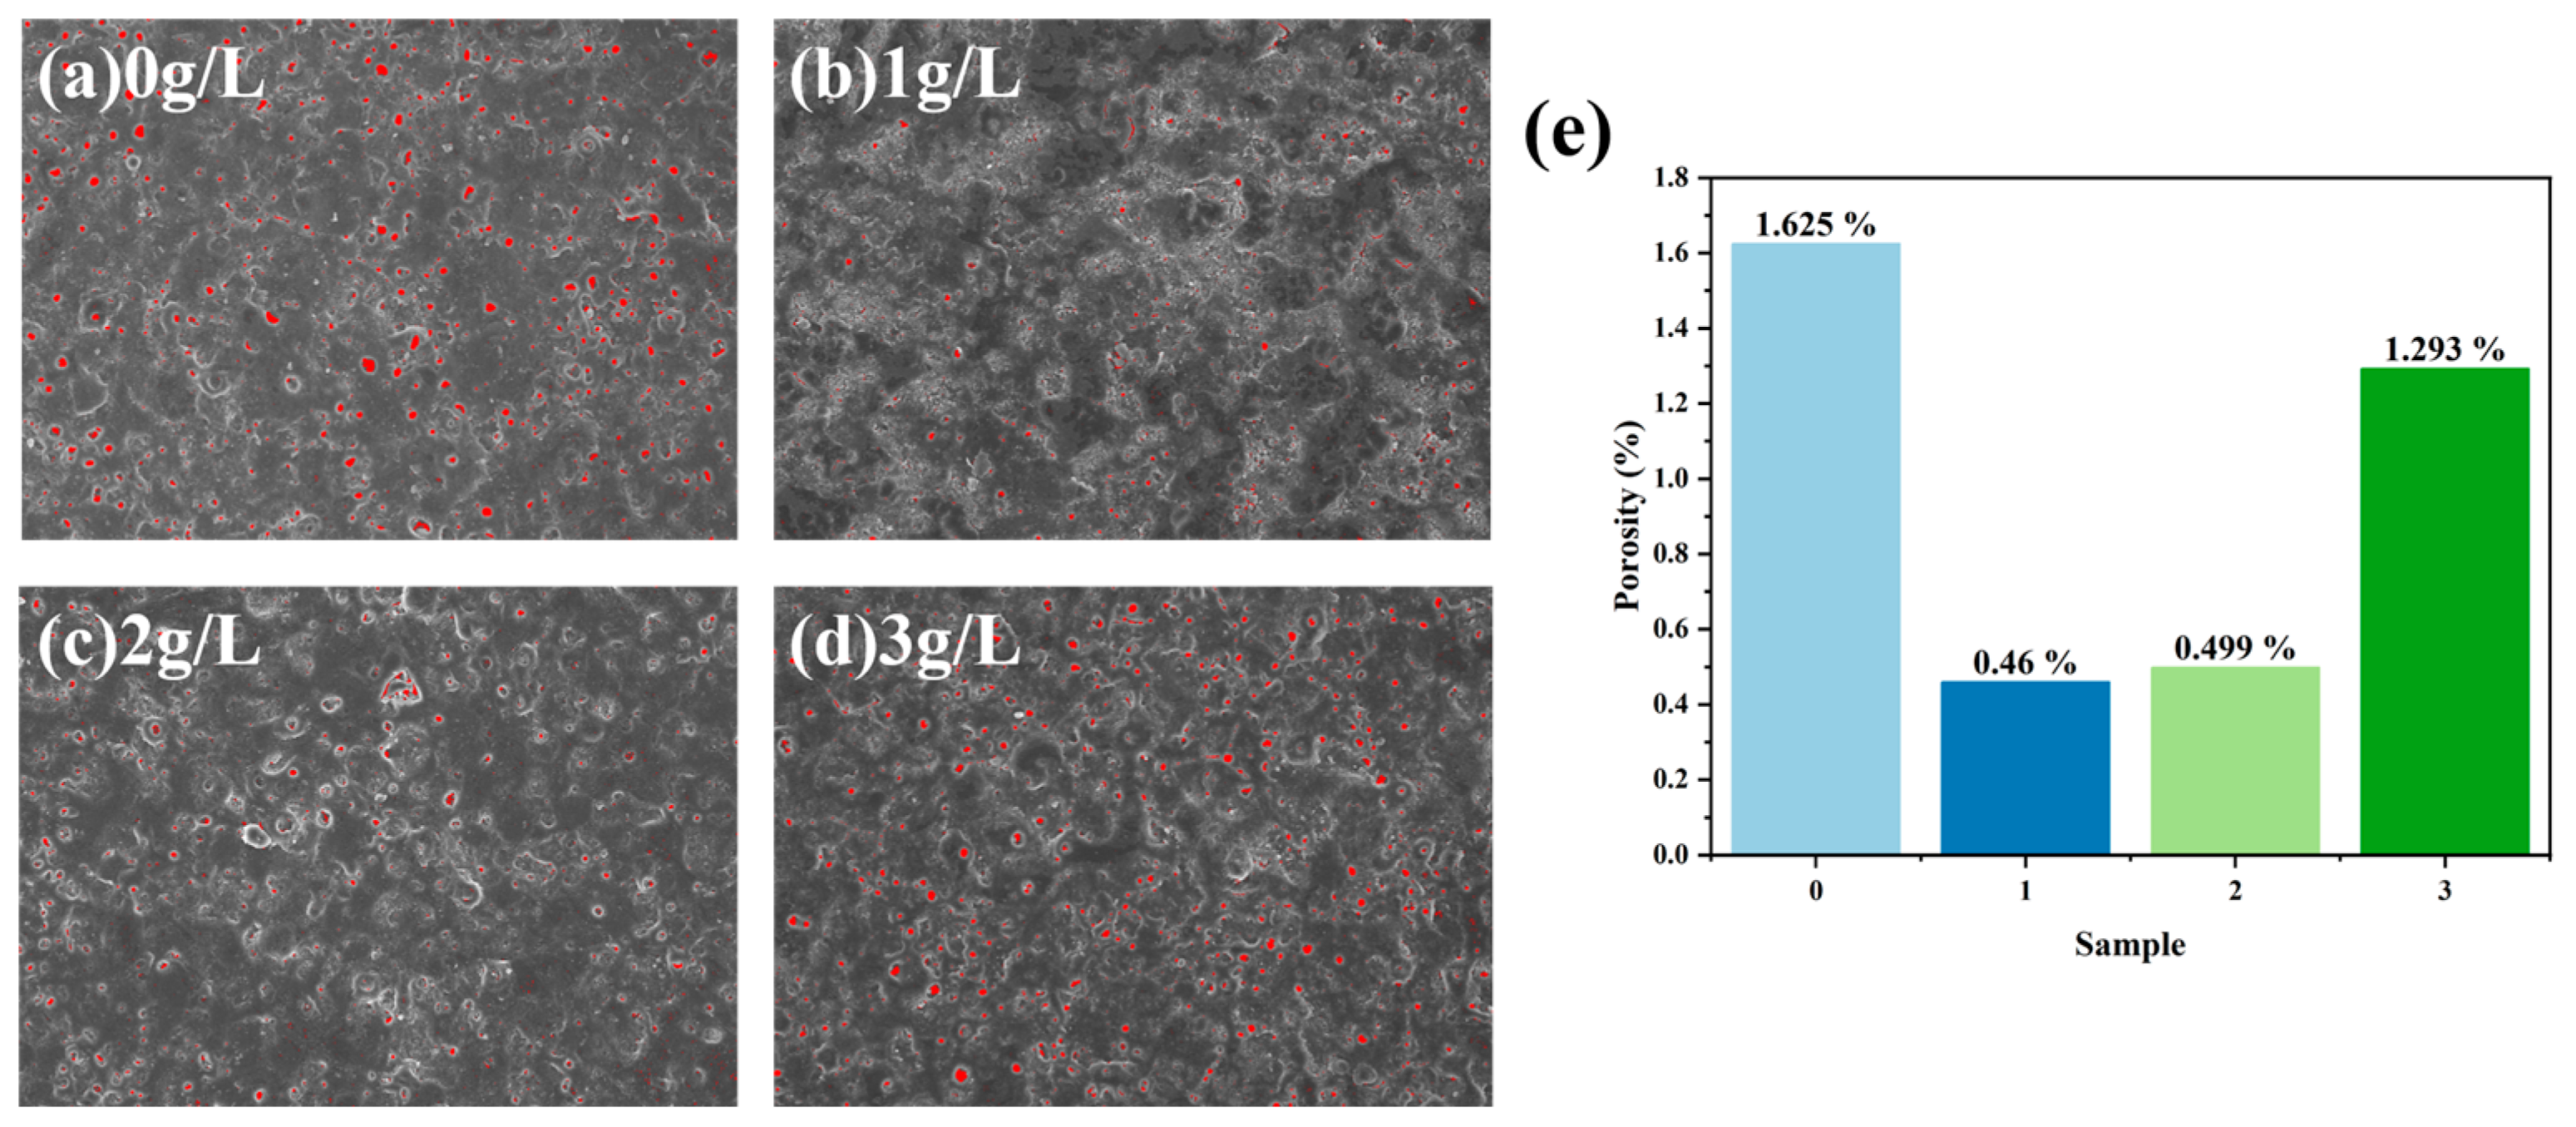
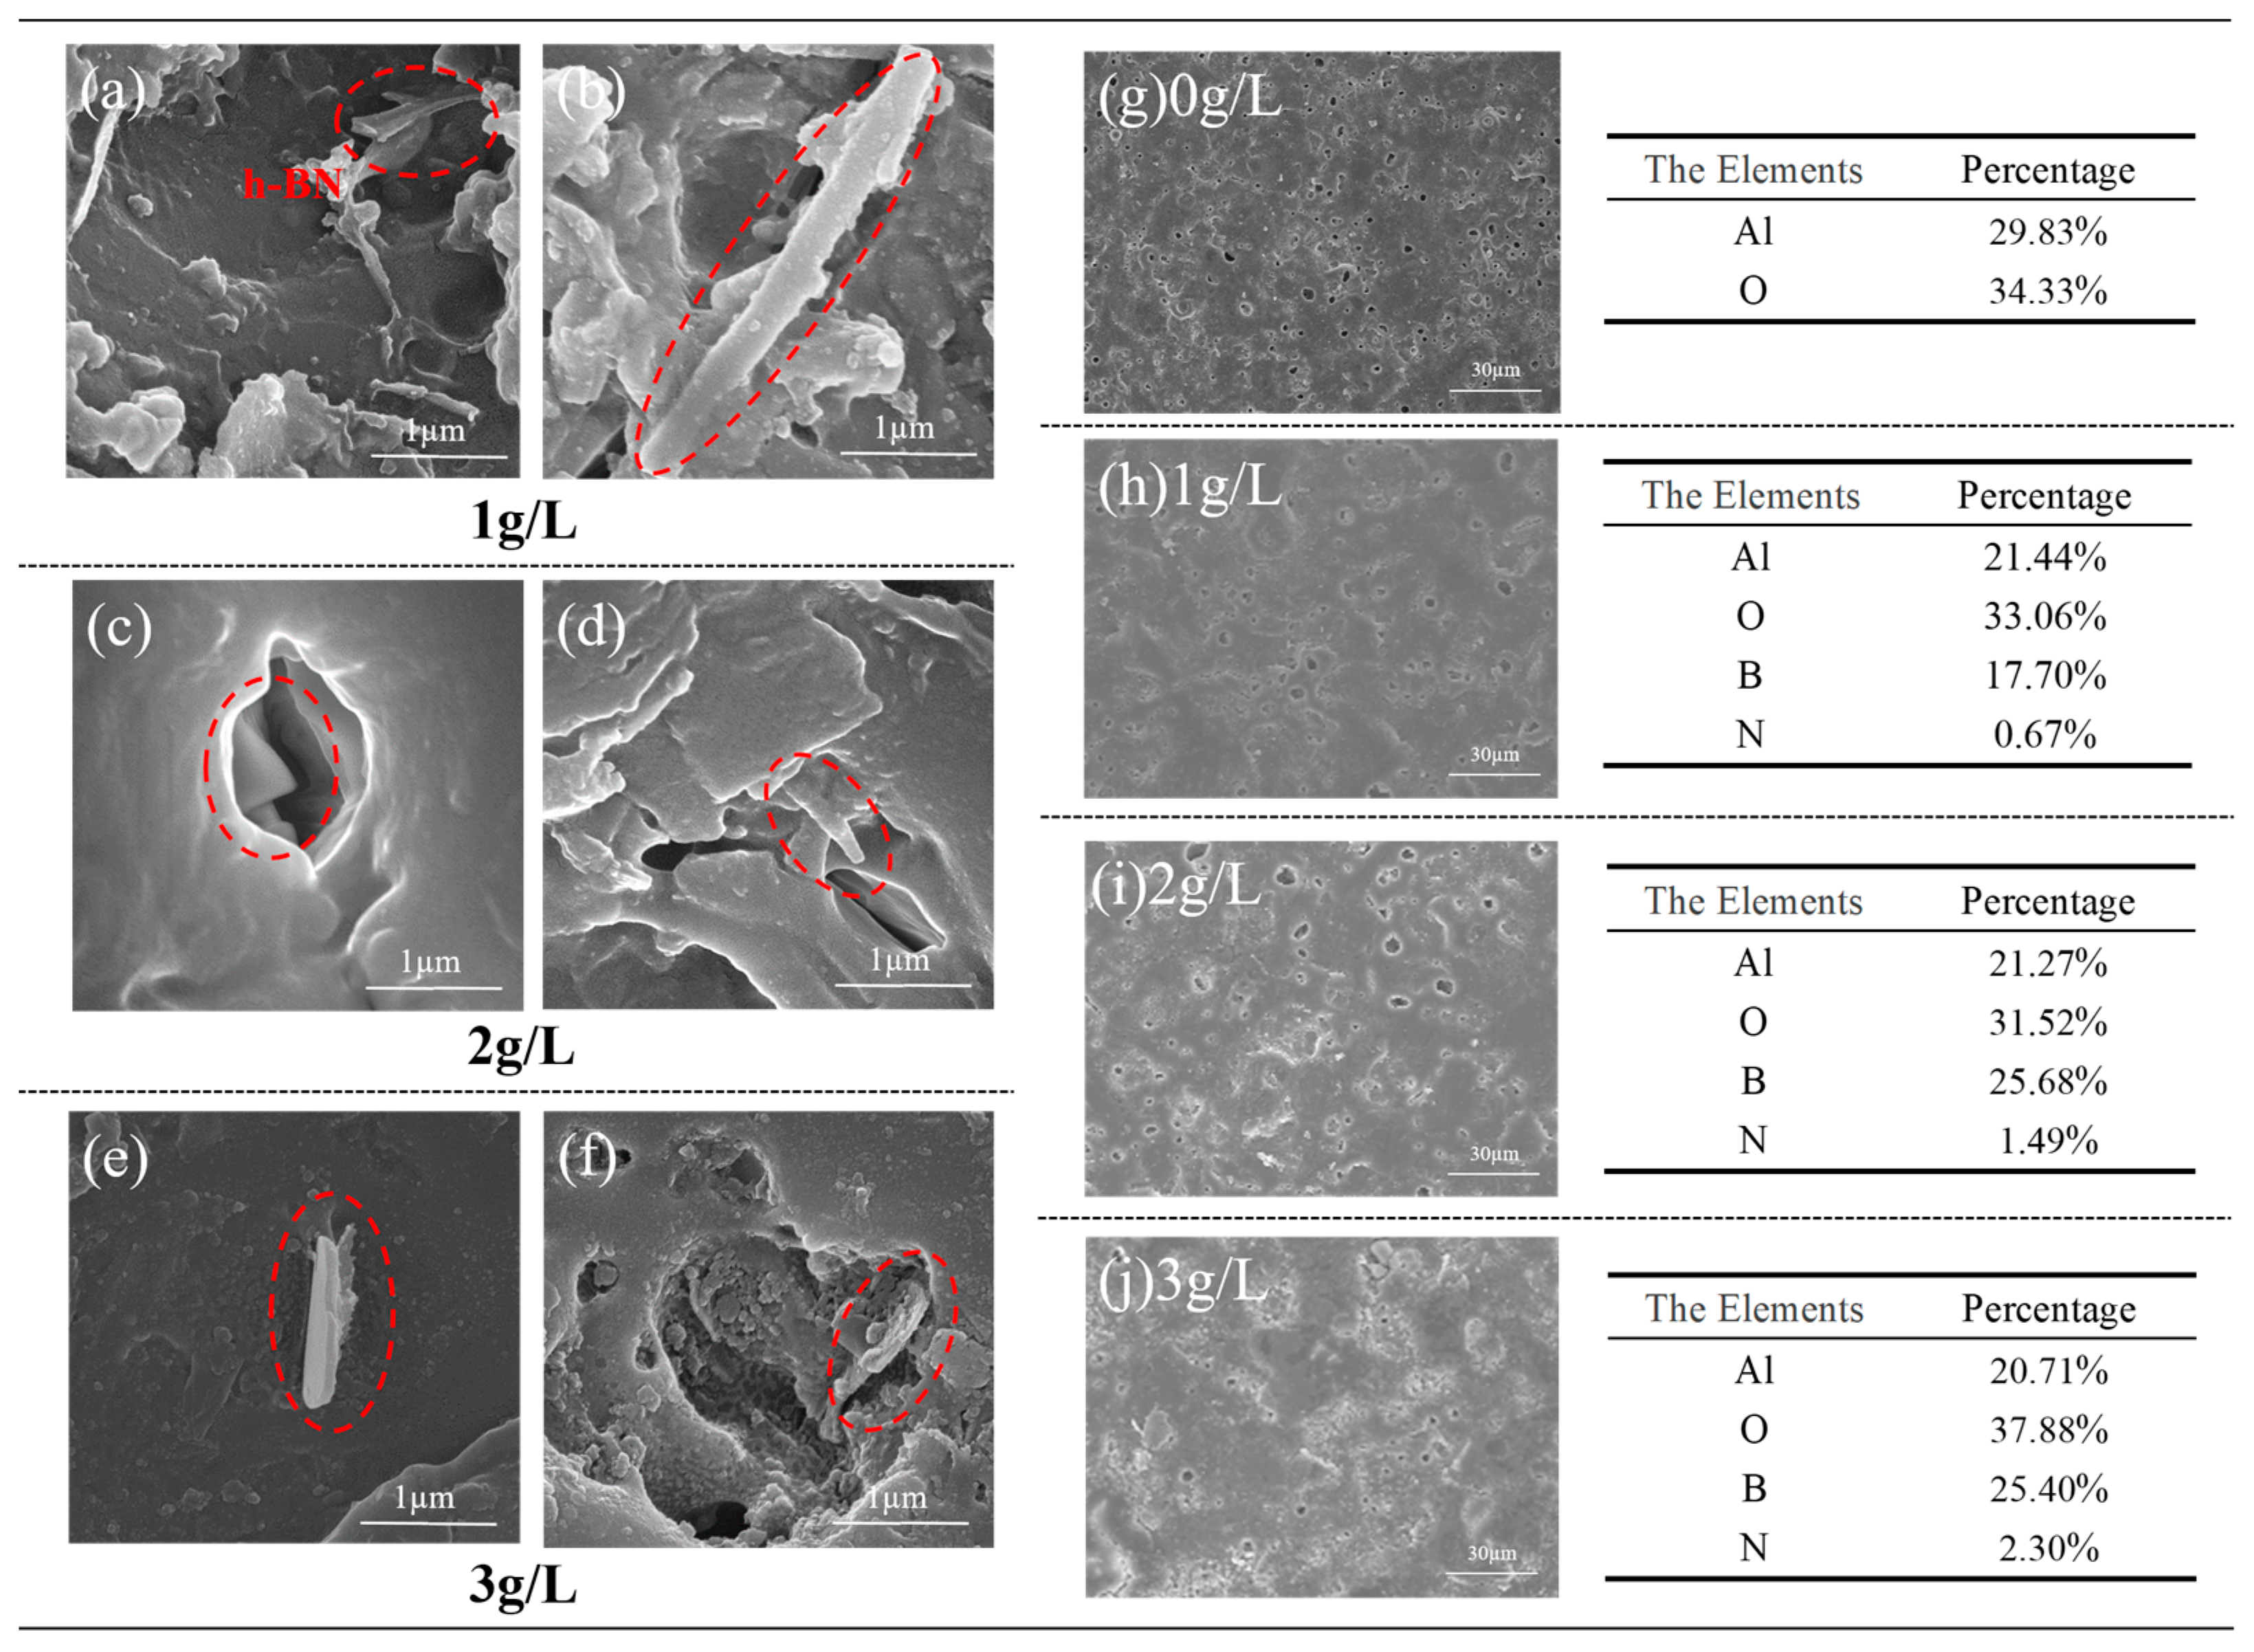
3.3. Surface Morphology and Composition Analysis of Micro-Arc Oxidation Coating

Figure 3 shows the initial surface morphology of the samples at different concentrations. All samples exhibit a typical crater-like terrain on their surfaces. The extremely high temperatures generated during the discharge process cause the aluminum oxide and the aluminum metal substrate to melt or even vaporize; they are then expelled outwards through the discharge channels. Under the influence of a significant temperature gradient, the molten mixture rapidly cools upon contact with the electrolyte and solidifies on the surface into a shape resembling a meteor crater.
Figure 4 illustrates the SEM surface morphology results obtained through ImageJ software processing for MAO coatings with different h-BN content. The red areas in Figure 4 indicate pores. It can be observed from the figure that the samples with added h-BN particles have a lower porosity rate compared to the 0 g/L samples, and the pore size-distribution is more uniform due to the filling effect of h-BN. Table 4 provides the surface roughness of samples with different concentrations. The surface roughness of the samples with the addition of h-BN particles was found to be reduced in comparison to the samples with no h-BN particles added. This indicates that the addition of h-BN particles was effective in improving the surface defects of the samples. With the increase in concentration, the surface porosity and roughness of the samples were observed to increase.
Figure 5g–j illustrate the percentage of EDS elements on the surface of the samples with varying concentrations. Samples with a concentration of 0 g/L did not contain B and N elements on the surface. However, these two elements were observed on the surface of the coatings prepared by adding nanoparticles of h-BN. This observation, in conjunction with Figure 5a–f, suggests that the nanoparticles penetrated the pores of the surface of the coatings efficiently, reducing the number of micro-pores and improving the densification of the coatings. The combined effect of mechanical diffusion, adsorption, and electrophoresis resulted in the attachment of h-BN nanoparticles to the coating surface, forming bumps that affected the smoothness and roughness of the coating surface. Furthermore, additional analysis of the surface morphology and EDS indicated that the nanoparticles were coated by the oxide in the molten state and subsequently infiltrated the coating. The addition of h-BN to the coating resulted in a reduction in the roughness of the coating surface due to its lubrication effect.
Figure 6 illustrates the thickness and hardness of the sample coatings at different h-BN concentrations. As the concentration of h-BN particles in the coating increases, the discharge intensity also increases. This leads to an overall increase in the coating thickness. The hardness of the sample coatings was found to be significantly increased by two to three times when h-BN particles were added, in comparison to the MAO coatings without the addition of h-BN particles. This phenomenon can be attributed to the incorporation of h-BN particles into the coating, which effectively fills the pores of the coating and makes the coating surface denser. At an h-BN particle concentration of 2 g/L, the hardness of the sample coating is at its maximum, reaching 562.5 HV. According to Figure 6, this coating exhibits a reduction in surface porosity, lower porosity, and a denser and smoother structure. However, the hardness of the coating decreases when the concentration of h-BN particles reaches 3 g/L. The surface roughness of this coating increases, with more pores and a higher porosity rate. Moreover, due to the poor dispersion of h-BN nanoparticles in the solution [36], agglomeration is more likely to occur at higher concentrations. The contact interface between the clustered h-BN particles and the coating increases, resulting in the alumina formed in the coating being affected by the doped particles. This, in turn, affects the bonding between the layers, which in turn affects the overall hardness of the coating.

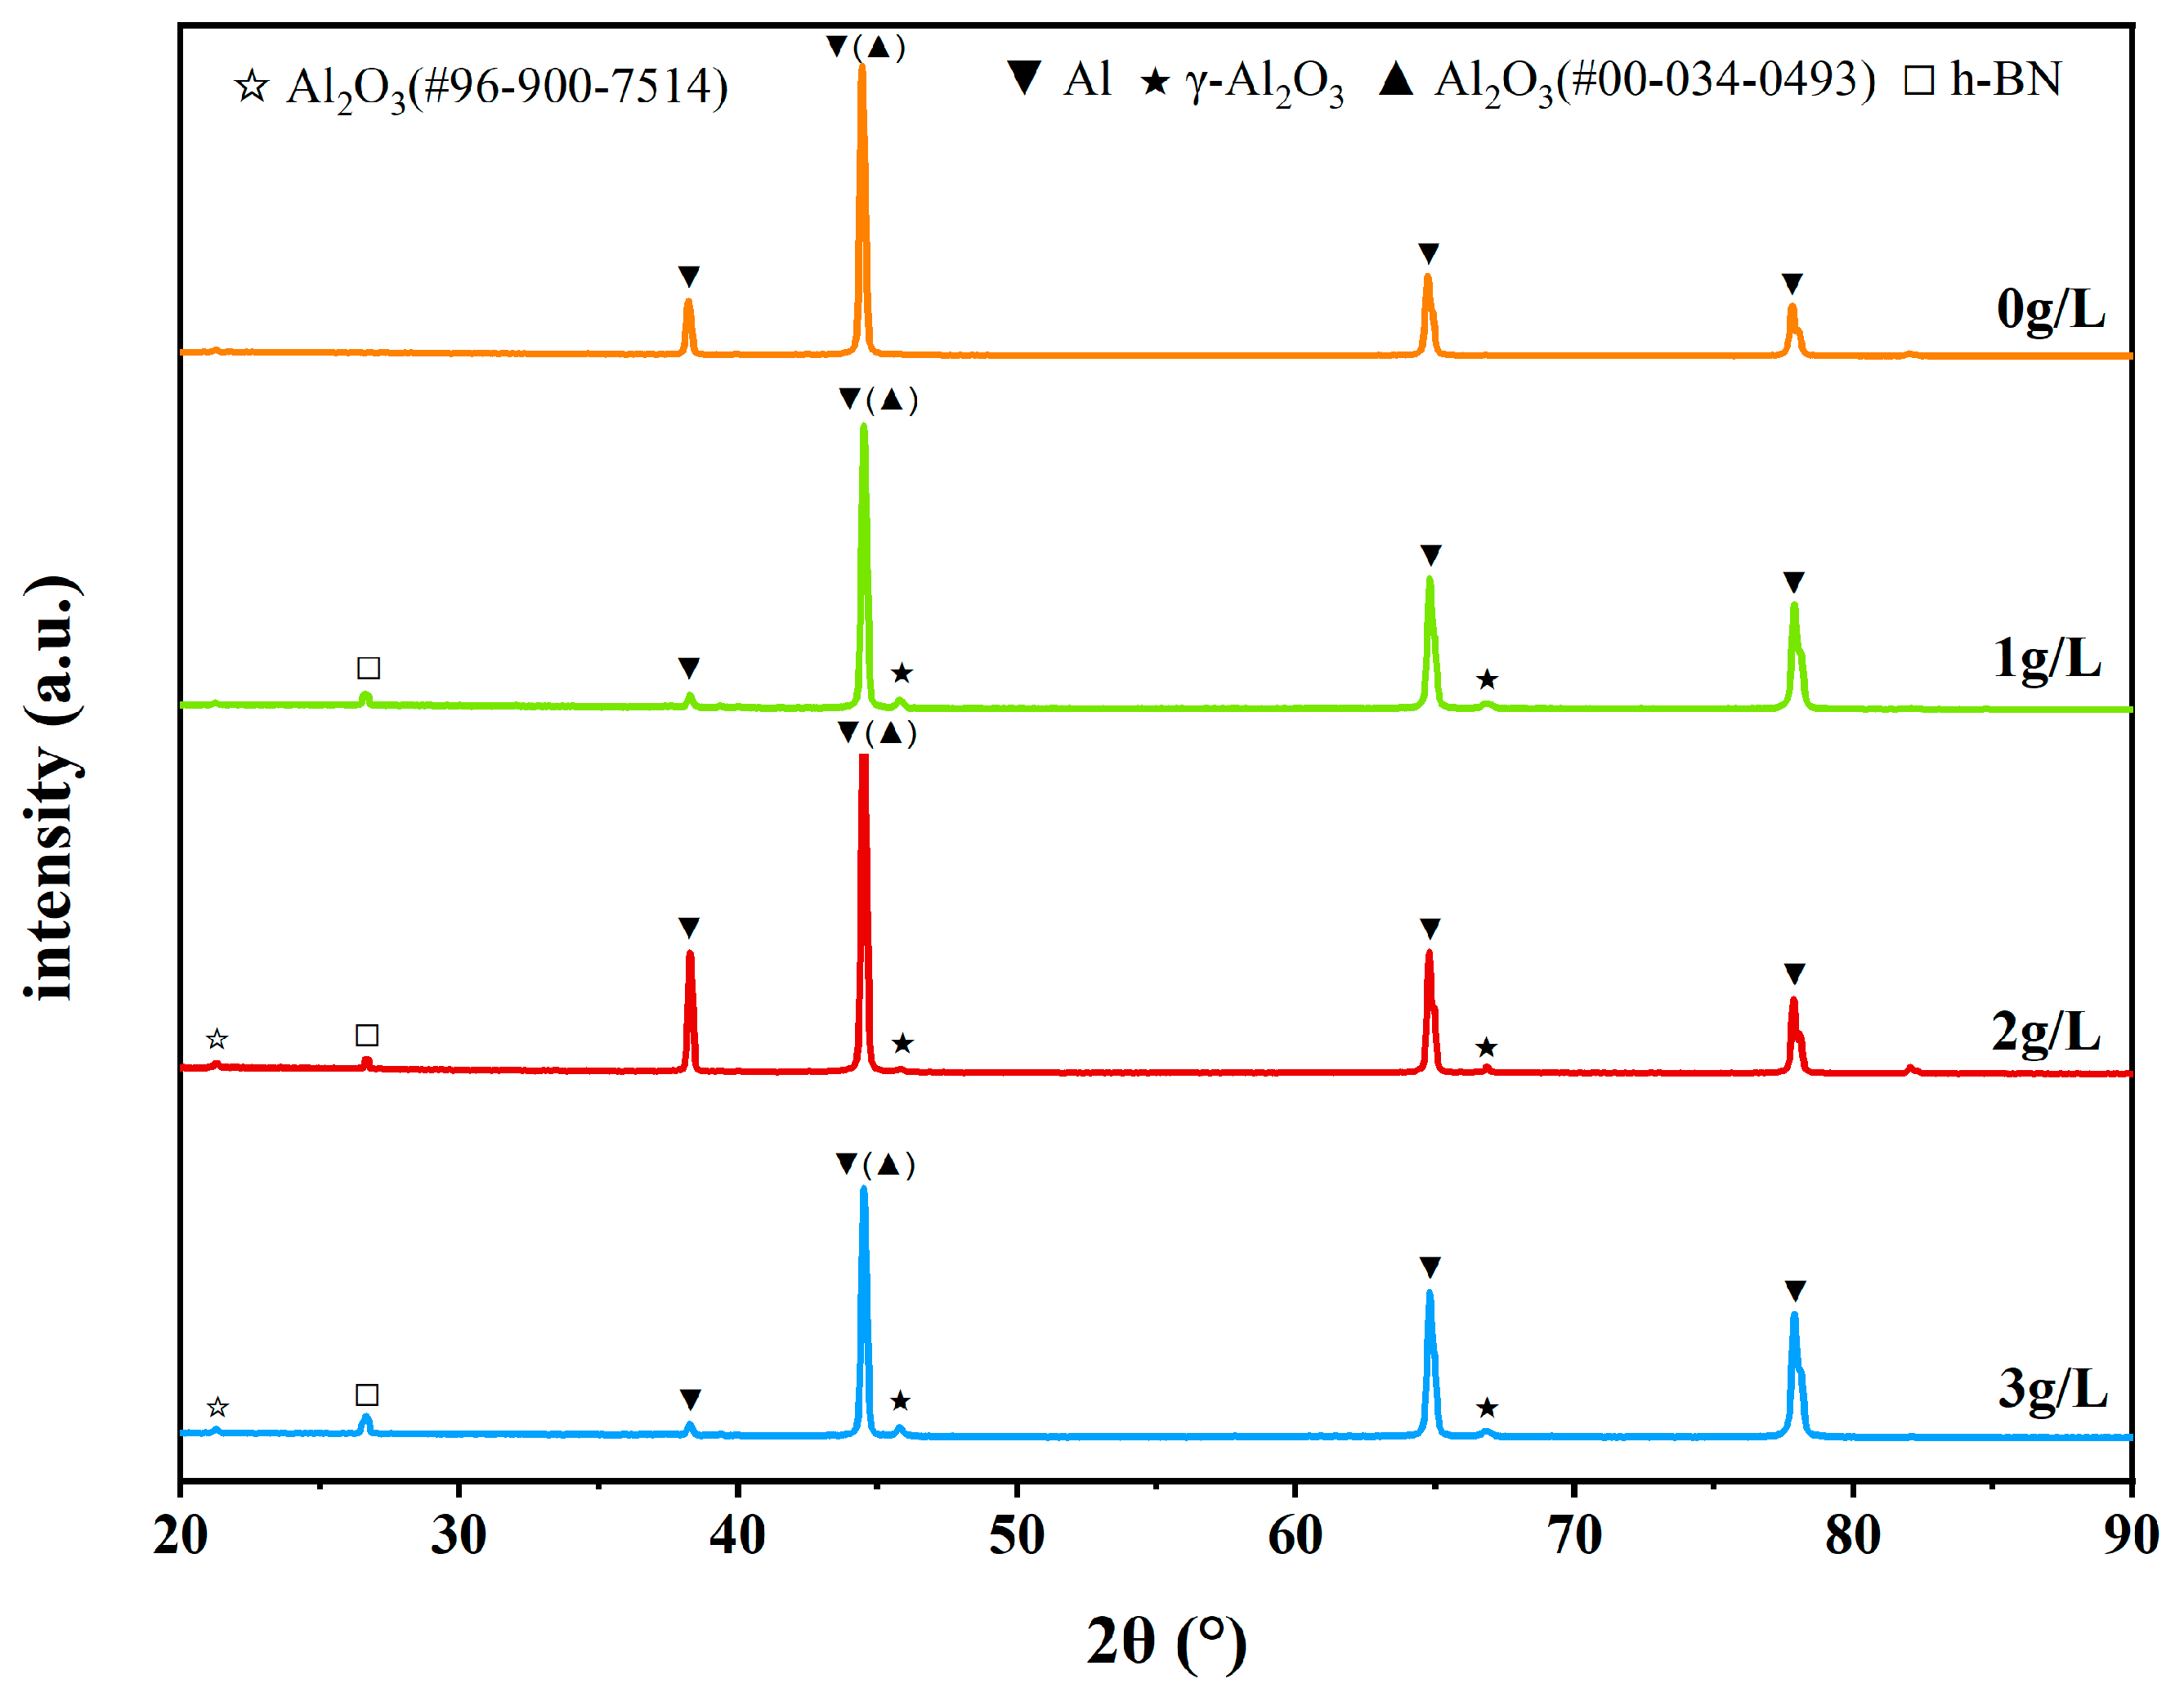
3.4. Analysis of the Phase Structure of Micro-Arc Oxidation Coating

Figure 7 presents the analysis results of XRD performed using HighScore. The MAO coating prepared without the addition of h-BN nanoparticle solution mainly consisted of Al and Al2O3. The MAO coating prepared with the addition of nanoparticles also included h-BN particles and γ-Al2O3. The presence of a characteristic peak of h-BN at 26.66° in the XRD pattern indicates that h-BN nanoparticles were successfully incorporated into the MAO coating. As the concentration of h-BN in the solution increased, the intensity of the h-BN characteristic peak gradually strengthened, suggesting an increase in the content of h-BN in the sample’s MAO coating. In conjunction with Figure 7, the incorporation of h-BN nanoparticles, due to the higher hardness of γ-Al2O3, significantly enhanced the hardness of the sample.

3.5. Wear Morphology Analysis of Micro-Arc Oxidation Coating

Figure 8a illustrates the trend of the COF over time at different concentrations. The COF at 0 g/L is initially affected by the uneven surface and higher roughness of the coating [38], resulting in a larger fluctuation range in the curve’s amplitude, which eventually stabilizes around 0.4. At 1 g/L, the amplitude fluctuation of the friction coefficient curve decreases, and the curve ultimately fails to stabilize due to the influence of the testing friction time. When the concentration increases to 2 g/L, the curve stabilizes the fastest with a COF value of approximately 0.1. However, when the concentration rises to 3 g/L, the overall trend of the curve exhibits significant fluctuations. In conjunction with the wear morphology of the 3 g/L sample observed under SEM in Figure 8f, it is evident that the MAO coating has been worn through, exposing the aluminum alloy substrate. The rough surface of the aluminum alloy substrate causes a sudden change in roughness from the MAO coating to the substrate surface, leading to a sudden increase in amplitude fluctuation around 1700 s, where the curve was gradually stabilizing. Figure 8c–f display the wear morphologies of the coatings under SEM at different concentrations. The darker areas indicate wear tracks. Compared to the 0 g/L wear tracks, the 1 g/L tracks are more pronounced and show a tendency to flake off [39]. The wear tracks at 2 g/L are almost invisible, with the MAO coating surface showing minimal wear. Figure 8b analyzes the wear rates at different concentrations. The wear rate at 2 g/L is the lowest, being 0.29% of that at 0 g/L and 3.96% of that at 3 g/L. This indicates that the incorporation of h-BN particles with certain lubricating properties within the coating, filling micro-pores and micro-cracks on the coating’s surface, enhances the density of the coating’s surface, effectively reduces the coating’s friction coefficient, and provides a certain degree of wear resistance [40]. When the concentration of h-BN particles increases, agglomeration of the particles occurs, leading to a decrease in the binding force between the oxide layers and an increase in the coating’s surface friction coefficient. This is the reason why the coating of the 3 g/L sample was worn through.

4. Discussion

This study investigated the impact of h-BN nanoparticle incorporation on the structure and tribological properties of micro-arc oxidation (MAO) coatings on 6061 aluminum alloy. By comparing the surface morphology, composition, phase structure, and wear characteristics of the MAO coatings with and without the addition of h-BN nanoparticles, the paper explored the mechanisms by which h-BN improves the performance of the coatings. The main findings of the study were as follows:
(1)
Porosity and surface roughness are directly proportional to the concentration of h-BN nanoparticles. Compared to MAO coatings without h-BN, the porosity of coatings with 1 g/L decreased by 30%.
(2)
The incorporation of h-BN significantly increased the hardness and thickness of the coatings. Due to the high hardness of h-BN nanoparticles, the MAO coating at a concentration of 2 g/L had the highest hardness, which was 2.5 times greater than that of the coating at 0 g/L. The best corrosion resistance of the coating was also obtained for the 2 g/L sample.
(3)
The addition of h-BN nanoparticles effectively reduced the COF of the MAO coatings. h-BN provided a certain level of lubrication; the coating at 2 g/L showed the most stable friction coefficient curve with the lowest COF. With the lubricating effect of h-BN particles, the wear resistance of the 2 g/L h-BN/Al2O3 coating had a friction coefficient of about 25% compared to the coating without h-BN.

Author Contributions

Conceptualization, X.Z. and G.Z.; methodology, J.S.; data curation, X.Z. and J.L.; writing—original draft preparation, X.Z.; writing—review and editing, X.Z., G.W. and G.Z.; investigation, J.L.; supervision, G.Z.; funding acquisition, G.Z. All authors have read and agreed to the published version of the manuscript.

Funding

This project was financially supported by the NSFC (52075247, U2037603), Natural Science Foundation of Jiangsu Province (BK20210300), and the Priority Academic Program Development of Jiangsu Higher Education Institutions (PAPD).

Institutional Review Board Statement

Not applicable.

Informed Consent Statement

Not applicable.

Data Availability Statement

The datasets used and/or analyzed during the current study are available from the corresponding author upon reasonable request.

Conflicts of Interest

The authors declare that they have no conflicts of interest related to this work.

References

  1. Kammer, C. Aluminum and Aluminum Alloys. In Springer Handbook of Materials Data; Springer: Berlin/Heidelberg, Germany, 2018; pp. 161–197. [Google Scholar]
  2. Li, K.; Gong, H.H.; Zhang, C.C.; Sha, H.J. Influence of Shot Peening Treatment on the Corrosion Resistance of 6061 Aluminum Alloy. J. Hunan Univ. Arts Sci. (Nat. Sci. Ed.) 2024, 36, 27–31. [Google Scholar]
  3. Zhang, G.H.; Huang, G.Q.; Xv, P.; Yu, M.Z. Research progress in surface treatment of aluminum alloys. J. China Inst. Metrol. 2010, 21, 174–178. [Google Scholar]
  4. Yuting, D.; Zhiyang, L.; Guofeng, M. The research progress on micro-arc oxidation of aluminum alloy. IOP Conf. Ser. Mater. Sci. Eng. 2020, 729, 012055. [Google Scholar] [CrossRef]
  5. Chen, Q.; Jiang, Z.; Tang, S.; Dong, W.; Tong, Q.; Li, W. Influence of graphene particles on the micro-arc oxidation behaviors of 6063 aluminum alloy and the coating properties. Appl. Surf. Sci. 2017, 423, 939–950. [Google Scholar] [CrossRef]
  6. Huang, Q.; Wu, Z.; Wu, H.; Ji, S.; Ma, Z.; Wu, Z.; Chen, P.; Zhu, J.; Fu, R.K.Y.; Lin, H.; et al. Corrosion behavior of ZnO-reinforced coating on aluminum alloy prepared by plasma electrolytic oxidation. Surf. Coat. Technol. 2019, 374, 1015–1023. [Google Scholar] [CrossRef]
  7. Lu, X.; Blawert, C.; Huang, Y.; Ovri, H.; Zheludkevich, M.L.; Kainer, K.U. Plasma electrolytic oxidation coatings on Mg alloy with addition of SiO2 particles. Electrochim. Acta 2016, 187, 20–33. [Google Scholar] [CrossRef]
  8. Xu, R.; Li, Y.; Fan, B.; Weng, Y.; Zhou, Y.; Yan, F. One-step preparation of molybdate-stannate-tungstate composite conversion coating on magnesium alloy AZ91D and its microstructure and corrosion resistance. Int. J. Electrochem. Sci. 2023, 18, 100398. [Google Scholar] [CrossRef]
  9. Yürektürk, Y.; Muhaffel, F.; Baydoğan, M. Characterization of micro arc oxidized 6082 aluminum alloy in an electrolyte containing carbon nanotubes. Surf. Coat. Technol. 2015, 269, 83–90. [Google Scholar] [CrossRef]
  10. Nimura, K.; Sugawara, T.; Jibiki, T.; Ito, S.; Shima, M. Surface modification of aluminum alloy to improve fretting wear properties. Tribol. Int. 2016, 93, 702–708. [Google Scholar] [CrossRef]
  11. Hakimizad, A.; Raeissi, K.; Golozar, M.A.; Lu, X.; Blawert, C.; Zheludkevich, M.L. The effect of pulse waveforms on surface morphology, composition and corrosion behavior of Al2O3 and Al2O3/TiO2 nano-composite PEO coatings on 7075 aluminum alloy. Surf. Coat. Technol. 2017, 324, 208–221. [Google Scholar] [CrossRef]
  12. Samanipour, F.; Bayati, M.R.; Golestani-Fard, F.; Zargar, H.R.; Mirhabibi, A.R.; Shoaei-Rad, V.; Abbasi, S. Innovative fabrication of ZrO2–HAp–TiO2 nano/micro-structured composites through MAO/EPD combined method. Mater. Lett. 2011, 65, 926–928. [Google Scholar] [CrossRef]
  13. Roostaei, M.; Aghajani, H.; Abbasi, M.; Abasht, B. Formation of Al2O3/MoS2 nanocomposite coatings by the use of electro spark deposition and oxidation. Ceram. Int. 2021, 47, 11644–11653. [Google Scholar] [CrossRef]
  14. Liu, W.; Liu, Y.; Lin, Y.; Zhang, Z.; Feng, S.; Talha, M.; Shi, Y.; Shi, T. Effects of graphene on structure and corrosion resistance of plasma electrolytic oxidation coatings formed on D16T Al alloy. Appl. Surf. Sci. 2019, 475, 645–659. [Google Scholar] [CrossRef]
  15. Li, X.; Ding, Q.; Zhao, G.; Hu, Q. Effects of Graphene Oxide on the Mechanical and Tribological Properties of Micro-Arc Oxidation Coatings on Aluminum Alloy. Mater. Prot. 2023, 56, 1–9. [Google Scholar]
  16. Wang, Y.W.; Xiao, W.Q.; Zhou, H.J.; Zhou, X.H. Preparation, Modification, and Application of Hexagonal Boron Nitride. Chem. New Mater. 2022, 50, 32–37. [Google Scholar]
  17. Cui, S.; Kan, H.; Zhang, N.; Ru, H.Q. Preparation, application and research progress of hexagonal boron nitride. J. Funct. Mater. 2020, 51, 8072–8077. [Google Scholar]
  18. Yang, M.Y.; Zhang, B.; Zhang, X.; Zhou, T.G. Research on the Geometric Structure, Electronic Structure, Magnetism, and Edge Characteristics of Graphene and Hexagonal Boron Nitride Nanosheets. J. At. Mol. Phys. 2018, 35, 673–680. [Google Scholar]
  19. Chen, T.; Wang, X.; Liu, Z.; Deng, C.J.; Yu, C.; Ding, J.; Zhu, H.X. Effect of h-BN on Microstructure and Properties of Al2O3-C Refractories at Different Nitriding Temperatures. J. Chin. Ceram. Soc. 2022, 50, 3305–3313. [Google Scholar]
  20. Wu, C.; Wang, Y.; Li, J.F.; Zhu, Z.J.; You, Z.Y.; Tu, Z.Y. Advances in the Preparation and Thermal Conductivity Properties of Hexagonal and Cubic Boron Nitride. Foundry Technol. 2023, 44, 1–8. [Google Scholar]
  21. Tang, K.; Ni, Z.Y.; Liu, Q.H.; Quhe, R.G.; Zheng, Q.Y.; Zheng, J.X.; Fei, R.X.; Gao, Z.X.; Lu, J. Electronic and transport properties of a biased multilayer hexagonal boron nitride. Eur. Phys. J. B 2012, 85, 301. [Google Scholar] [CrossRef]
  22. GB/T 3191-2010; Aluminium and Aluminium Alloys Extruded Bars, Rods, Wire, Profiles, and Tubes. Standardization Administration of China: Beijing, China, 2011.
  23. Li, Z.; Di, S. The Microstructure and Wear Resistance of Microarc Oxidation Composite Coatings Containing Nano-Hexagonal Boron Nitride (HBN) Particles. J. Mater. Eng. Perform. 2017, 26, 1551–1561. [Google Scholar] [CrossRef]
  24. Wang, G.; Guo, L.; Ruan, Y.; Zhao, G.; Zhang, X.; Liu, Y.; Kim, D.-E. Improved wear and corrosion resistance of alumina alloy by MAO and PECVD. Surf. Coat. Technol. 2024, 479, 130556. [Google Scholar] [CrossRef]
  25. Wu, H.; Shi, Z.; Zhang, X.; Qasim, A.M.; Xiao, S.; Zhang, F.; Wu, Z.; Wu, G.; Ding, K.; Chu, P.K. Achieving an acid resistant surface on magnesium alloy via bio-inspired design. Appl. Surf. Sci. 2019, 478, 150–161. [Google Scholar] [CrossRef]
  26. Tran, Q.-P.; Chin, T.-S.; Kuo, Y.-C.; Jin, C.-X.; Trung, T.; Tuan, C.V.; Dang, D.Q. Diamond powder incorporated oxide layers formed on 6061 Al alloy by plasma electrolytic oxidation. J. Alloys Compd. 2018, 751, 289–298. [Google Scholar] [CrossRef]
  27. Li, X. Theoretical Study on the Conductivity Differences between Graphene and Hexagonal Boron Nitride. Univ. Chem. 2024, 39, 364–368. [Google Scholar] [CrossRef]
  28. Lü, C.; Wang, C.; Gu, J. First-principles study of structural, elastic, thermodynamic, electronic and optical properties of cubic boron nitride and hexagonal boron nitride at high temperature and high pressure. Acta Phys. Sin. 2019, 68, 077102. [Google Scholar] [CrossRef]
  29. Kim, S.M.; Hsu, A.; Park, M.H.; Chae, S.H.; Yun, S.J.; Lee, J.S.; Cho, D.-H.; Fang, W.; Lee, C.; Palacios, T.; et al. Synthesis of large-area multilayer hexagonal boron nitride for high material performance. Nat. Commun. 2015, 6, 8662. [Google Scholar] [CrossRef]
  30. Xu, B.; Sun, J.; Han, J.; Yang, Z.; Zhou, H.; Xiao, L.; Xu, S.; Han, Y.; Ma, A.; Wu, G. Effect of hierarchical precipitates on corrosion behavior of fine-grain magnesium-gadolinium-silver alloy. Corros. Sci. 2022, 194, 109924. [Google Scholar] [CrossRef]
  31. Xi, K.; Wu, H.; Zhou, C.; Qi, Z.; Yang, K.; Fu, R.K.Y.; Xiao, S.; Wu, G.; Ding, K.; Chen, G.; et al. Improved corrosion and wear resistance of micro-arc oxidation coatings on the 2024 aluminum alloy by incorporation of quasi-two-dimensional sericite microplates. Appl. Surf. Sci. 2022, 585, 152693. [Google Scholar] [CrossRef]
  32. Gao, Y.; Xiao, S.; Wu, H.; Wu, C.; Chen, G.; Yin, Y.; Chu, P.K. Effect of h-BN nanoparticles incorporation on the anti-corrosion and anti-wear properties of micro-arc oxidation coatings on 2024 aluminum alloy. Ceram. Int. 2023, 49, 37475–37485. [Google Scholar] [CrossRef]
  33. Liu, C.; Bi, Q.; Leyland, A.; Matthews, A. An electrochemical impedance spectroscopy study of the corrosion behaviour of PVD coated steels in 0.5 N NaCl aqueous solution: Part II. EIS interpretation of corrosion behaviour. Corros. Sci. 2023, 45, 1257–1273. [Google Scholar] [CrossRef]
  34. Peng, Z.; Xu, H.; Liu, S.; Qi, Y.; Liang, J. Wear and Corrosion Resistance of Plasma Electrolytic Oxidation Coatings on 6061 Al Alloy in Electrolytes with Aluminate and Phosphate. Materials 2021, 14, 4037. [Google Scholar] [CrossRef]
  35. Letyagin, N.V.; Akopyan, T.K.; Sokorev, A.A.; Sviridova, T.A.; Cherkasov, S.O.; Mansurov, Y.N. The Characterization of Coatings Formed on As-Cast Al, Al–Si, and Al–Ca Aluminum Substrates by Plasma Electrolytic Oxidation. Metals 2023, 13, 1509. [Google Scholar] [CrossRef]
  36. Wen, L.; Wang, Y.; Zhou, Y.; Guo, L.; Ouyang, J.-H. Microstructure and corrosion resistance of modified 2024 Al alloy using surface mechanical attrition treatment combined with microarc oxidation process. Corros. Sci. 2011, 53, 473–480. [Google Scholar] [CrossRef]
  37. Zhu, X.; Fu, J.; Ma, D.; Ma, C.; Fu, Y.; Zhang, Z. Effect of nano h-BN particles on growth regularity and tribological behavior of PEO composite ceramic coating of ZL109 alloy. Sci. Rep. 2022, 12, 995. [Google Scholar] [CrossRef]
  38. Ye, Y.; Zhang, D.; Li, J.; Liu, T.; Pu, J.; Zhao, H.; Wang, L. One-step synthesis of superhydrophobic polyhedral oligomeric silsesquioxane-graphene oxide and its application in anti-corrosion and anti-wear fields. Corros. Sci. 2019, 147, 9–21. [Google Scholar] [CrossRef]
  39. Xue, W.; Du, J.; Wu, X.; Lai, Y. Tribological Behavior of Microarc Oxidation Coatings on Aluminum Alloy. ISIJ Int. 2016, 46, 287–291. [Google Scholar] [CrossRef]
  40. Ao, N.; Liu, D.; Wang, S.; Zhao, Q.; Zhang, X.; Zhang, M. Microstructure and Tribological Behavior of a TiO2/hBN Composite Ceramic Coating Formed via Micro-arc Oxidation of Ti–6Al–4V Alloy. J. Mater. Sci. Technol. 2016, 32, 1071–1076. [Google Scholar] [CrossRef]
Figure 1. Voltage–time response curve of MAO coatings incorporated with varying amounts of h-BN.
Coatings 14 00771 g001
Figure 2. (a,b) Bode plots of EIS impedance; (c) electrochemical impedance.
Coatings 14 00771 g002
Figure 3. Initial surface morphology of samples with different concentrations.
Coatings 14 00771 g003
Figure 4. (ad) Pore distribution on the sample surface; (e) sample porosity.
Coatings 14 00771 g004
Figure 5. (af) present the SEM morphologies of samples at various concentrations; (gj) show the corresponding EDS elemental composition ratios for the different concentrations.
Coatings 14 00771 g005
Figure 6. Thickness and hardness of MAO coatings at different concentrations.
Coatings 14 00771 g006
Figure 7. XRD spectra of sample MAO coatings at various concentrations.
Coatings 14 00771 g007
Figure 8. (a) Trend of COF over time at various concentrations; (b) wear rate of the wear tracks at different concentrations; (cf) wear morphologies of the coating surfaces on the samples at different concentrations.
Coatings 14 00771 g008
Table 1. The components of 6061 aluminum alloy.
ElementCuMnMgZnCrTiSiFeAl
Content (wt.%)0.15~0.40.150.8~1.20.250.04~0.350.150.4~0.80.7Base
Table 2. A brief overview of the fundamental characteristics of experimental drugs.
Name of the DrugFinenessManufacturer
NaOHAnalytical purityShanghai Aladdin Biochemical Technology Co., Ltd. (Shanghai, China)
Na2SiO3
(NaPO3)6
h-BN
Table 3. The results of the EIS tests were obtained by fitting the equivalent circuit model.
Sample0 g/L1 g/L2 g/L3 g/L
Equivalent CircuitR(Q(R(QR)(QR)))
RS (Ohm⋅cm2)4.443.613.664.40
Yf (Ohm−2·cm−2·s−n)9.56 × 10−42.52 × 10−64.01 × 10−53.47 × 10−5
nf0.640.880.690.88
Rpore (Ohm⋅cm2)1.261.61 × 10−71.15 × 10−71.10
Ydl (Ohm−2·cm−2·s−n)4.98 × 10−43.40 × 10−47.21 × 10−44.72 × 10−4
ndl0.981.000.930.93
Rct (Ohm⋅cm2)586.80472.701218359.90
Ydiff (Ohm−2·cm−2·s−n)1.28 × 10−22.31 × 10−27.43 × 10−31.31 × 10−3
ndiff0.430.360.330.72
Rdiff (Ohm⋅cm2)493.8012.3715.357.59
Table 4. Sample surface roughness.
Sample0 g/L1 g/L2 g/L3 g/L
Roughness (µm)2.5051.1381.6541.704
Disclaimer/Publisher’s Note: The statements, opinions and data contained in all publications are solely those of the individual author(s) and contributor(s) and not of MDPI and/or the editor(s). MDPI and/or the editor(s) disclaim responsibility for any injury to people or property resulting from any ideas, methods, instructions or products referred to in the content.

