Article

Characterization of Materials Used in the Concrete Industry, from the Point of View of Corrosion Behavior

Mechanical Engineering Department, Petroleum-Gas University of Ploiești, 100680 Ploiesti, Romania
*
Author to whom correspondence should be addressed.
Coatings 2024, 14(7), 800; https://doi.org/10.3390/coatings14070800
Submission received: 23 May 2024 / Revised: 19 June 2024 / Accepted: 24 June 2024 / Published: 27 June 2024

Abstract

:
Industrial applications in the concrete industry face significant challenges in selecting appropriate metallic materials, as these choices can enhance equipment lifespan and reduce costs. This study examines the corrosion behavior of various metallic materials, offering valuable insights for their selection in corrosive environments. The findings indicate that material testing can provide cost-effective solutions for concrete industry equipment. Notably, replacing cast iron used in concrete mixing blades with specific steels is advantageous for corrective or accidental maintenance, lowering spare parts costs, and short-term use, steels P265GH and AISI 4140 exhibiting corrosion resistance similar to cast iron. Additionally, for mineral aggregate dryers, selecting adequate steel can significantly reduce operating and maintenance costs while increasing equipment durability. The results show that substituting steel S235 with steel P265GH can decrease the corrosion rate by nearly 65%.

1. Introduction

The equipment utilized in large-scale concrete production is designed to withstand significant operational stresses, primarily arising from the abrasive impact of mineral aggregates (such as sand and variously sized stones) and the corrosive effects of the water-cement dust blend [1]. In the realm of the concrete industry, where efficiency, reliability, and durability are paramount, corrosion is posing significant challenges to the integrity and performance of essential equipment such as rotary dryers and concrete mixers. These industrial equipment, vital for the production and processing of materials from the concrete composition, confronts corrosion-induced degradation that compromises operational efficiency and safety.
Rotary dryers, revered for their efficiency in drying mineral aggregates, and concrete mixers, indispensable for homogenizing concrete mixtures, both struggle with corrosion-induced deterioration that compromises their functionality and longevity. Understanding the nuanced interplay between corrosion and materials within these equipment types is essential for devising prevention measures.
The flight assembly of rotary dryers, serving in material transport and heat transfer [2], faces corrosive attack from moisture, abrasive particles, and chemical contaminants inherent in mineral aggregates. Conversely, the mixing blades of concrete mixers, tasked with blending cement, aggregates, water, and additives, endure corrosive exposure to alkaline environments, chloride ingress, carbonation, and aggressive chemicals present in concrete mixtures.
At the base of corrosion lies an electrochemical process wherein metallic surfaces interact with their environment, initiating chemical reactions determining the degradation of material over time. In both rotary dryers and concrete mixers, this process is compounded by intrinsic factors such as material composition, design intricacies, and operational parameters, as well as extrinsic factors including environmental conditions, maintenance practices, and exposure duration.
In case of rotary dryer, many studies [3,4,5,6,7,8] concentrated on identifying the factors that influence their performance of rotary dryers, by reference to the distribution of the particles inside the drum. Only the study [1] investigated the tribological behavior of materials used in rotary dryer blades, focusing on abrasive and abrasive-erosive wear, using the Baroid tester. The results identified abrasive erosion as the primary cause of blade damage and outlined the conditions that exacerbate specific wear phenomena.
In case of concrete mixers, some studies [9,10,11] analyzed stress states in the arms and blades of mixers, using these stress states as key indicators to evaluate abrasive wear caused by impact and friction with aggregates. The wear characteristics of concrete mixers resistance was investigated in the referenced literature [12,13,14,15,16]. The study [17] focused on the concrete industry, comparing the abrasion-corrosion resistance of A36 carbon steel, advanced high-strength steels (AHSSs), and ASTM 410 ferritic stainless steels. Laboratory and field tests, including rubber wheel and microabrasion tests, were conducted using adapted concrete mixers and actual mixing equipment. Analysis revealed that ferritic stainless steel, despite lower hardness, outperformed AHSSs and significantly extended equipment lifespan.
In the previous work of the authors [16], three types of chromium-alloyed cast iron were tested under accelerated wear conditions simulating a real working environment (mix of mineral aggregate, sand, cement, and water) using a Baroid tribometer. The tests revealed that cast iron with the highest chromium content showed the best wear resistance overall. However, the study found that wear resistance did not consistently increase with chromium content. Specifically, cast iron with around 4% chromium performed better than those with about 9% chromium when the chromium content was below 25%. The investigation was extended in the paper [18] where the same types of chromium-alloyed cast irons used in mixing blades were used, focusing on their wear resistance in a working environment of crushed mineral aggregates (4–8 mm), using a special designed experimental stand that replicated a half-scale double-axis horizontal mixer that allowed for adjustment of the mixing blade attack angles to 30, 45, and 60 degrees. The results demonstrated a correlation between the blade material type and wear rate and showed that increasing the blade’s inclination angle relative to the shaft axis significantly reduced cumulative mass loss by 43% to 55.83%, depending on the blade material quality.
Analyzing the existent literature in the field, can be find many works related to the corrosion analysis of different materials in concrete environment [19,20,21,22,23,24,25,26,27,28,29,30,31,32,33,34,35]. The laboratory study [19] assessed the corrosion activity of reinforcing steel in ordinary and high-performance concrete using various measurement methods. The findings revealed that Tafel plot, linear polarization resistance, half-cell potential, and chloride content methods predicted the same corrosion activity level for only 24% of the specimens.
Garcia et al. [20] investigated how embedded steel reinforcement corrodes under anoxic conditions with varying chloride concentrations. Three electrochemical techniques were used to measure corrosion rates: linear polarization resistance, electrochemical impedance spectroscopy, and chronopotentiometry. The maximum observed current density was 0.98 μA/cm2, regardless of chloride content. Using an Evans diagram, researchers estimated the cathodic Tafel constant to be 180 mV dec−1, with a limit current density of 0.98 μA/cm2. The corrosion potential likely ranged from −900 mVAg/AgCl to −1000 mVAg/AgCl, with the most probable corrosion current density between 0.22 μA/cm2 and 0.61 μA/cm2. The rapid galvanostatic pulse technique was implemented [21] on-site across numerous measurement points, covering a spectrum of reinforcement conditions from severe corrosion to passivity.
Field investigations were conducted in [36] to assess the corrosion of reinforcements in underground metro tunnels built between 1980 and 2006. On-site measurements included carbonation depth, half-cell potential, and concrete resistivity, while the chloride profile of cored concrete specimens was analyzed in the laboratory. The analysis revealed the relationship between corrosion potential (half-cell potential) and corrosion rate. The study also examined the impact of galvanic coupling on localized and macrocell corrosion. The findings showed that a drop in half-cell potential near NaCl crystallization indicates chloride-induced corrosion.
The present study presents a thorough investigation into electrochemical parameters influencing corrosion behaviors in materials widely used in the concrete industry, focusing on rotary dryers (Figure 1a) and concrete mixers (Figure 1b). By examining polarization curves and Tafel plots from tests on cast iron and steel specimens, the research uncovers unexpected findings. The research offers practical implications for selecting corrosion-resistant materials for equipment like rotary dryers and concrete mixers. Certain steel samples, designated as suitable for mixer equipment, and others recommended for dryers, show promise in withstanding corrosive environments. Overall, the findings provide strategic recommendations for optimizing equipment durability and performance in the concrete industry, highlighting the essential role of electrochemical analysis in addressing corrosion phenomena.

2. Materials and Methods

2.1. Equipment Used for the Electrochemical Corrosion Testing

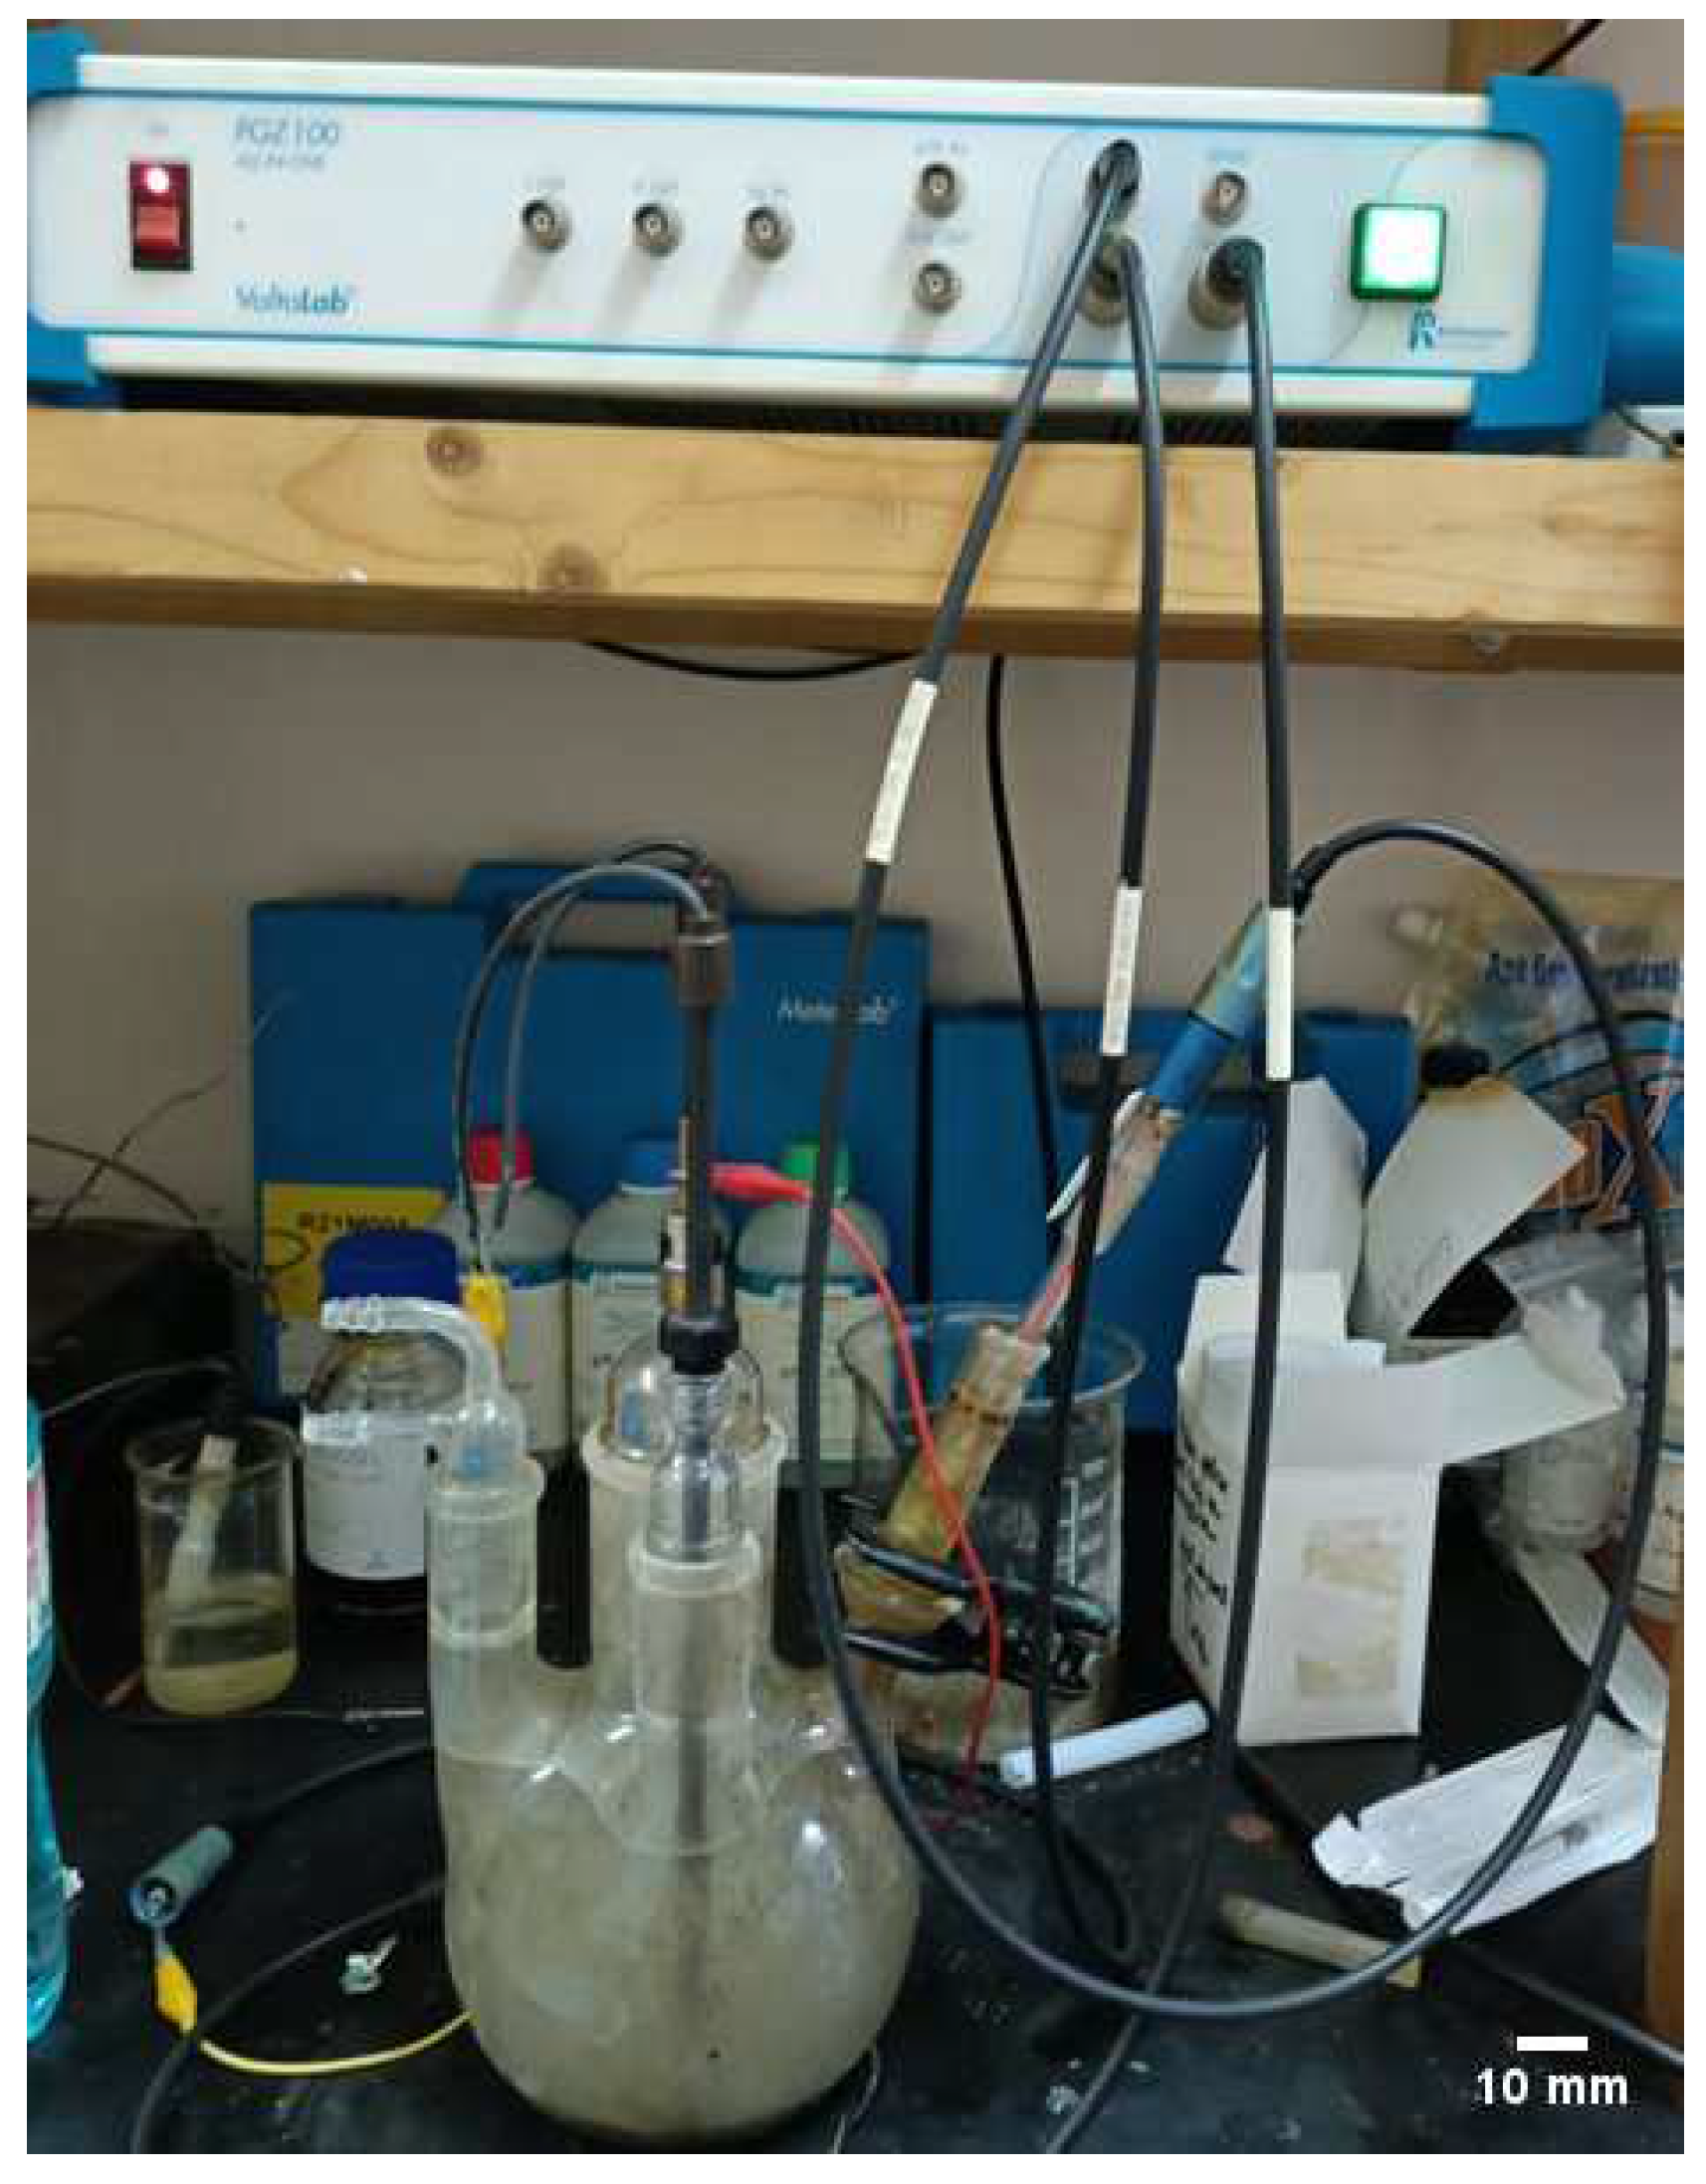
In order to perform the tests to determine the parameters characterizing the corrosion behavior of commonly used materials, a VoltaLab (Tacussel-Radiometer PGZ 100, Hatch Company, Mississauga, ON, Canada) potentiostat was used and the software was VoltaMaster 4.
To determine the electrochemical parameters of the tested materials, the Tafel technique was chosen, which focuses on the problems that accurately determine the corrosion rate of the material. With this technique, a controlled scanned potential is applied to the specimen, starting at an assumed corrosion potential, and then being extended in both anodic and cathodic directions by several hundred millivolts.
It should be noted that the “polarization resistance” technique is even faster than the Tafel technique, sometimes being complementary to it, due to the much smaller scanned area. Corrosion cell (Figure 2) works with a saturated calomel reference electrode and specimen holder exposes 1 cm2 of the specimen to the test solution. Electrochemical tests were made according to ASTM G5-94 [37], and ASTM G1-90 [38].
When beginning the work sequence, the analysis technique is selected, and the parameters for the test cell are set. These parameters include the potential of the calomel reference electrode, its surface area, the surface area of the counter-graphite electrodes, and the surface area of the working electrode, which is 1 cm2. Additionally, the atomic mass of iron (Fe) is considered to be 55.85, and the ion valence is set to 2. The potential sweep range is defined from −1 V to +1 V, with possible limits extending from −3 V to +3 V, and the sweep rate is set to 1 mV/s.

2.2. Sample Selection and Preparation

The disk samples used for the test were taken from sheet-type semi-finished products, in the case of steels, and cast solids, in the case of cast irons.
The selection of cast iron and steel types was made based on experience in concrete manufacturing plants (cement concrete and asphalt concrete) considering the place of use and the working environment [1,18]. The selected cast irons are specific to the mixing blade materials of concrete mixers. Also, some of the selected steels were proposed to replace—within the maintenance interventions—the cast irons when making the mixing blades of the mixers. The use of steels instead of cast irons can be justified by the lower price of materials and the accessible technology of obtaining semi-finished products. Several types of steels have been selected for specific applications of dryers (with rotary drum) in asphalt concrete production plants. Table 1 and Table 2 present the chemical composition and the corresponding microstructure of cast irons samples, and in Table 3 is indicated the chemical composition of steel samples. The three types of cast iron and steels proposed for use in concrete mixers were tested in aqueous cement environment (cement paste, Table 4) and steels with applications in rotary dryers were tested in water (Table 4).
The results of the microstructure analysis for the three types of materials and the hardness measurements can be seen in Table 2. The microstructure of the three samples is specific to white hypoeutectic cast irons, presenting hard constituents in different forms, depending on the Cr content.
The chemical composition was determined using Genius 5000 X-ray Fluorescence Spectrometer (Skyray Instruments, Dallas, Texas, USA) using Positive Material Identification (PMI) principle.
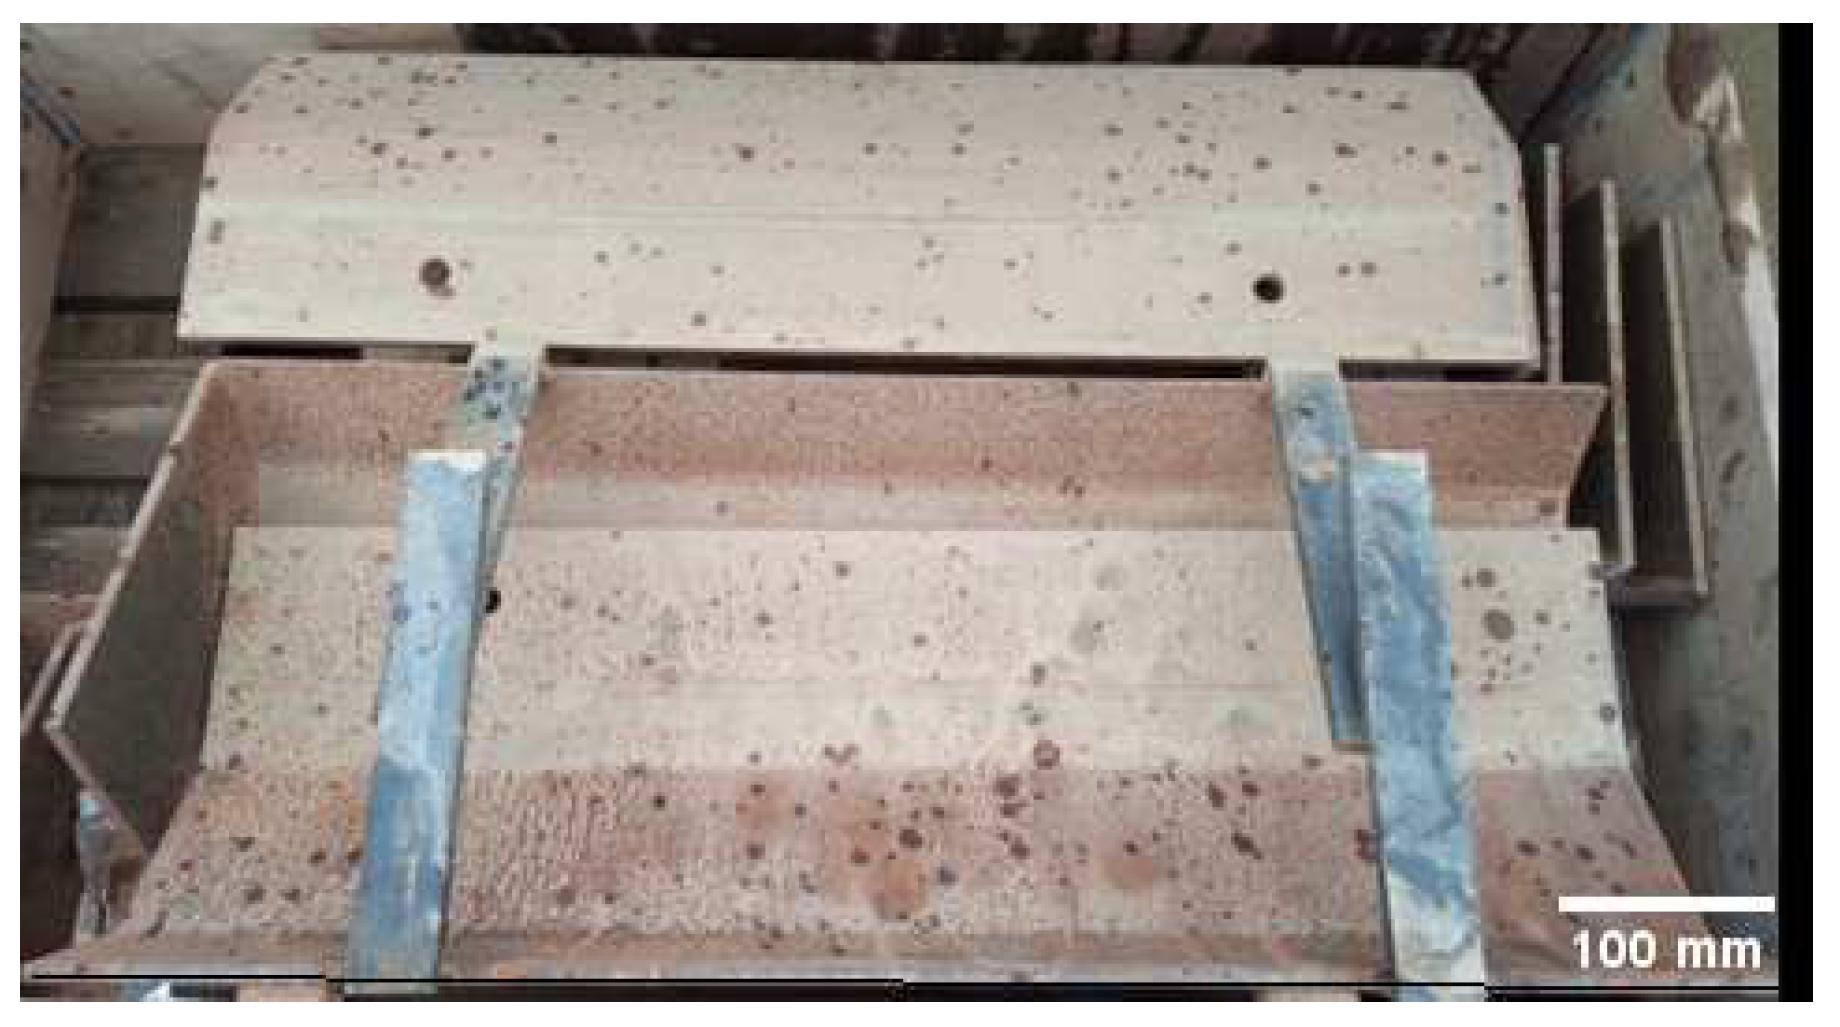
It was also tested in the working environment (water), the steel (denoted as S) from the flights of rotary dryer used to dry the mineral aggregates, as seen in Figure 3.
The testing environment had the following characteristics:
A cement paste mixture composed of cement dust and water in a ratio of approximately 1 part cement dust to 2.75 parts water.
The density of this mixture, as measured in the laboratory, was about 1170 kg/m3.
The use of cement paste was intended to prevent solidification during the testing process.
The average pH of the mixture was 11.84, at the ambient temperature of 25.5 °C. The water used had a pH of 7.54.
The tests were conducted in the resulting aqueous solution after the coarse components had settled out. Therefore, the tests were performed in an environment with the described characteristics (pH 11.84, temperature 25.5 °C).
The samples were mechanically processed in the form of discs with 16 mm diameter and 2~4 mm thickness.
The mechanical processing was carried out with low cutting rates using cooling liquids, in order not to introduce mechanical or thermal stresses in the processed material and thereby maintain the structure and initial physico-chemical qualities of the materials.
One of the surfaces of the disc samples, the one that will come into contact with the work environment, was sanded wet on abrasive paper, initially with the 250 Mesh grit size and then with the 600 Mesh grit size.
Before the specimens were mounted in the fixture for testing, they were placed in boiling benzene for 5 min. Specimens not tested immediately were stored in a silica gel desiccator. The surface exposed to the work environment was 1 cm2.

2.3. Theoretical Considerations

According to the mixed potential theory [45], any electrochemical reaction can be divided into two or more oxidation and reduction reactions, without accumulating electric charges during the reactions. In a corrodible system, oxidation of the metal (corrosion) and reduction of certain elements in the solution occurs at the same rate and the net current measured is zero [46,47,48].
imeas = irediox = 0
imeas is the measured net current,
ired is the reduction current (rate at which electrons are gained by elements in the solution),
iox is the oxidation current (rate at which electrons are lost by the metal).
When a metal or alloy is placed in contact with a solution, the metal will assume a potential that is dependent on the nature of the material and the nature of the solution. This open circuit potential, without the application of any potential from outside the cell, is the corrosion potential Ecor.
Many of the modern corrosion techniques are based on the theoretical analysis of the shapes of the Stern and Geary polarization curves.
If a potential is imposed on the material from an external source and the reaction rate is controlled, it results:
i r e d   =   i e x ( r e d ) e η / β 1
and
i o x   =   i e x ( o x ) e η / β 2
where: iex(red) is the exchange reduction current, iex(ox) is the exchange oxidation current, η is the overvoltage, being equal to the difference between the potential imposed from the material outside, Eapl and corrosion potential, Ecor;
β1 and β2—Tafel constants.
By logarithming the Equations (2) and (3), we obtain the equations of J. Tafel:
η = β C log i r e d i e x η = β A log i r e d i e x
where βC = 2.3·β1 and βA = 2.3·β2 being called Tafel’s constants, cathodic and anodic respectively [21].
Once the potential Ecor and the corrosion current icor are determined, the corrosion rate can be calculated.
According to Faraday’s law:
Q = nFW/M
where Q—Coulomb;
n—the number of electrons involved in electrochemical reactions;
F—Faraday’s constant, 96,487 Coulombs;
W—the lost weight of the material.
M—the atomic mass of the material.
It can be written:
W/t = icor(E.W.)/F
where W/t = C.R.—corrosion rate in g/s;
E.W. = M/n—equivalent weight, n—the number of electrons involved in the reaction.
Because C.R. it is usually expressed in units of length/time (mm/year or milliinches/year- mpy) we have [49]:
C.R. = 0.13 icor (E.W.)/ρ, [mpy]
where, ρ is material density, g/cm3;
icor—corrosion current density, μA/cm2.

3. Results and Discussion

3.1. Testing of Materials Used for Mixing Blades (in Cement Paste)

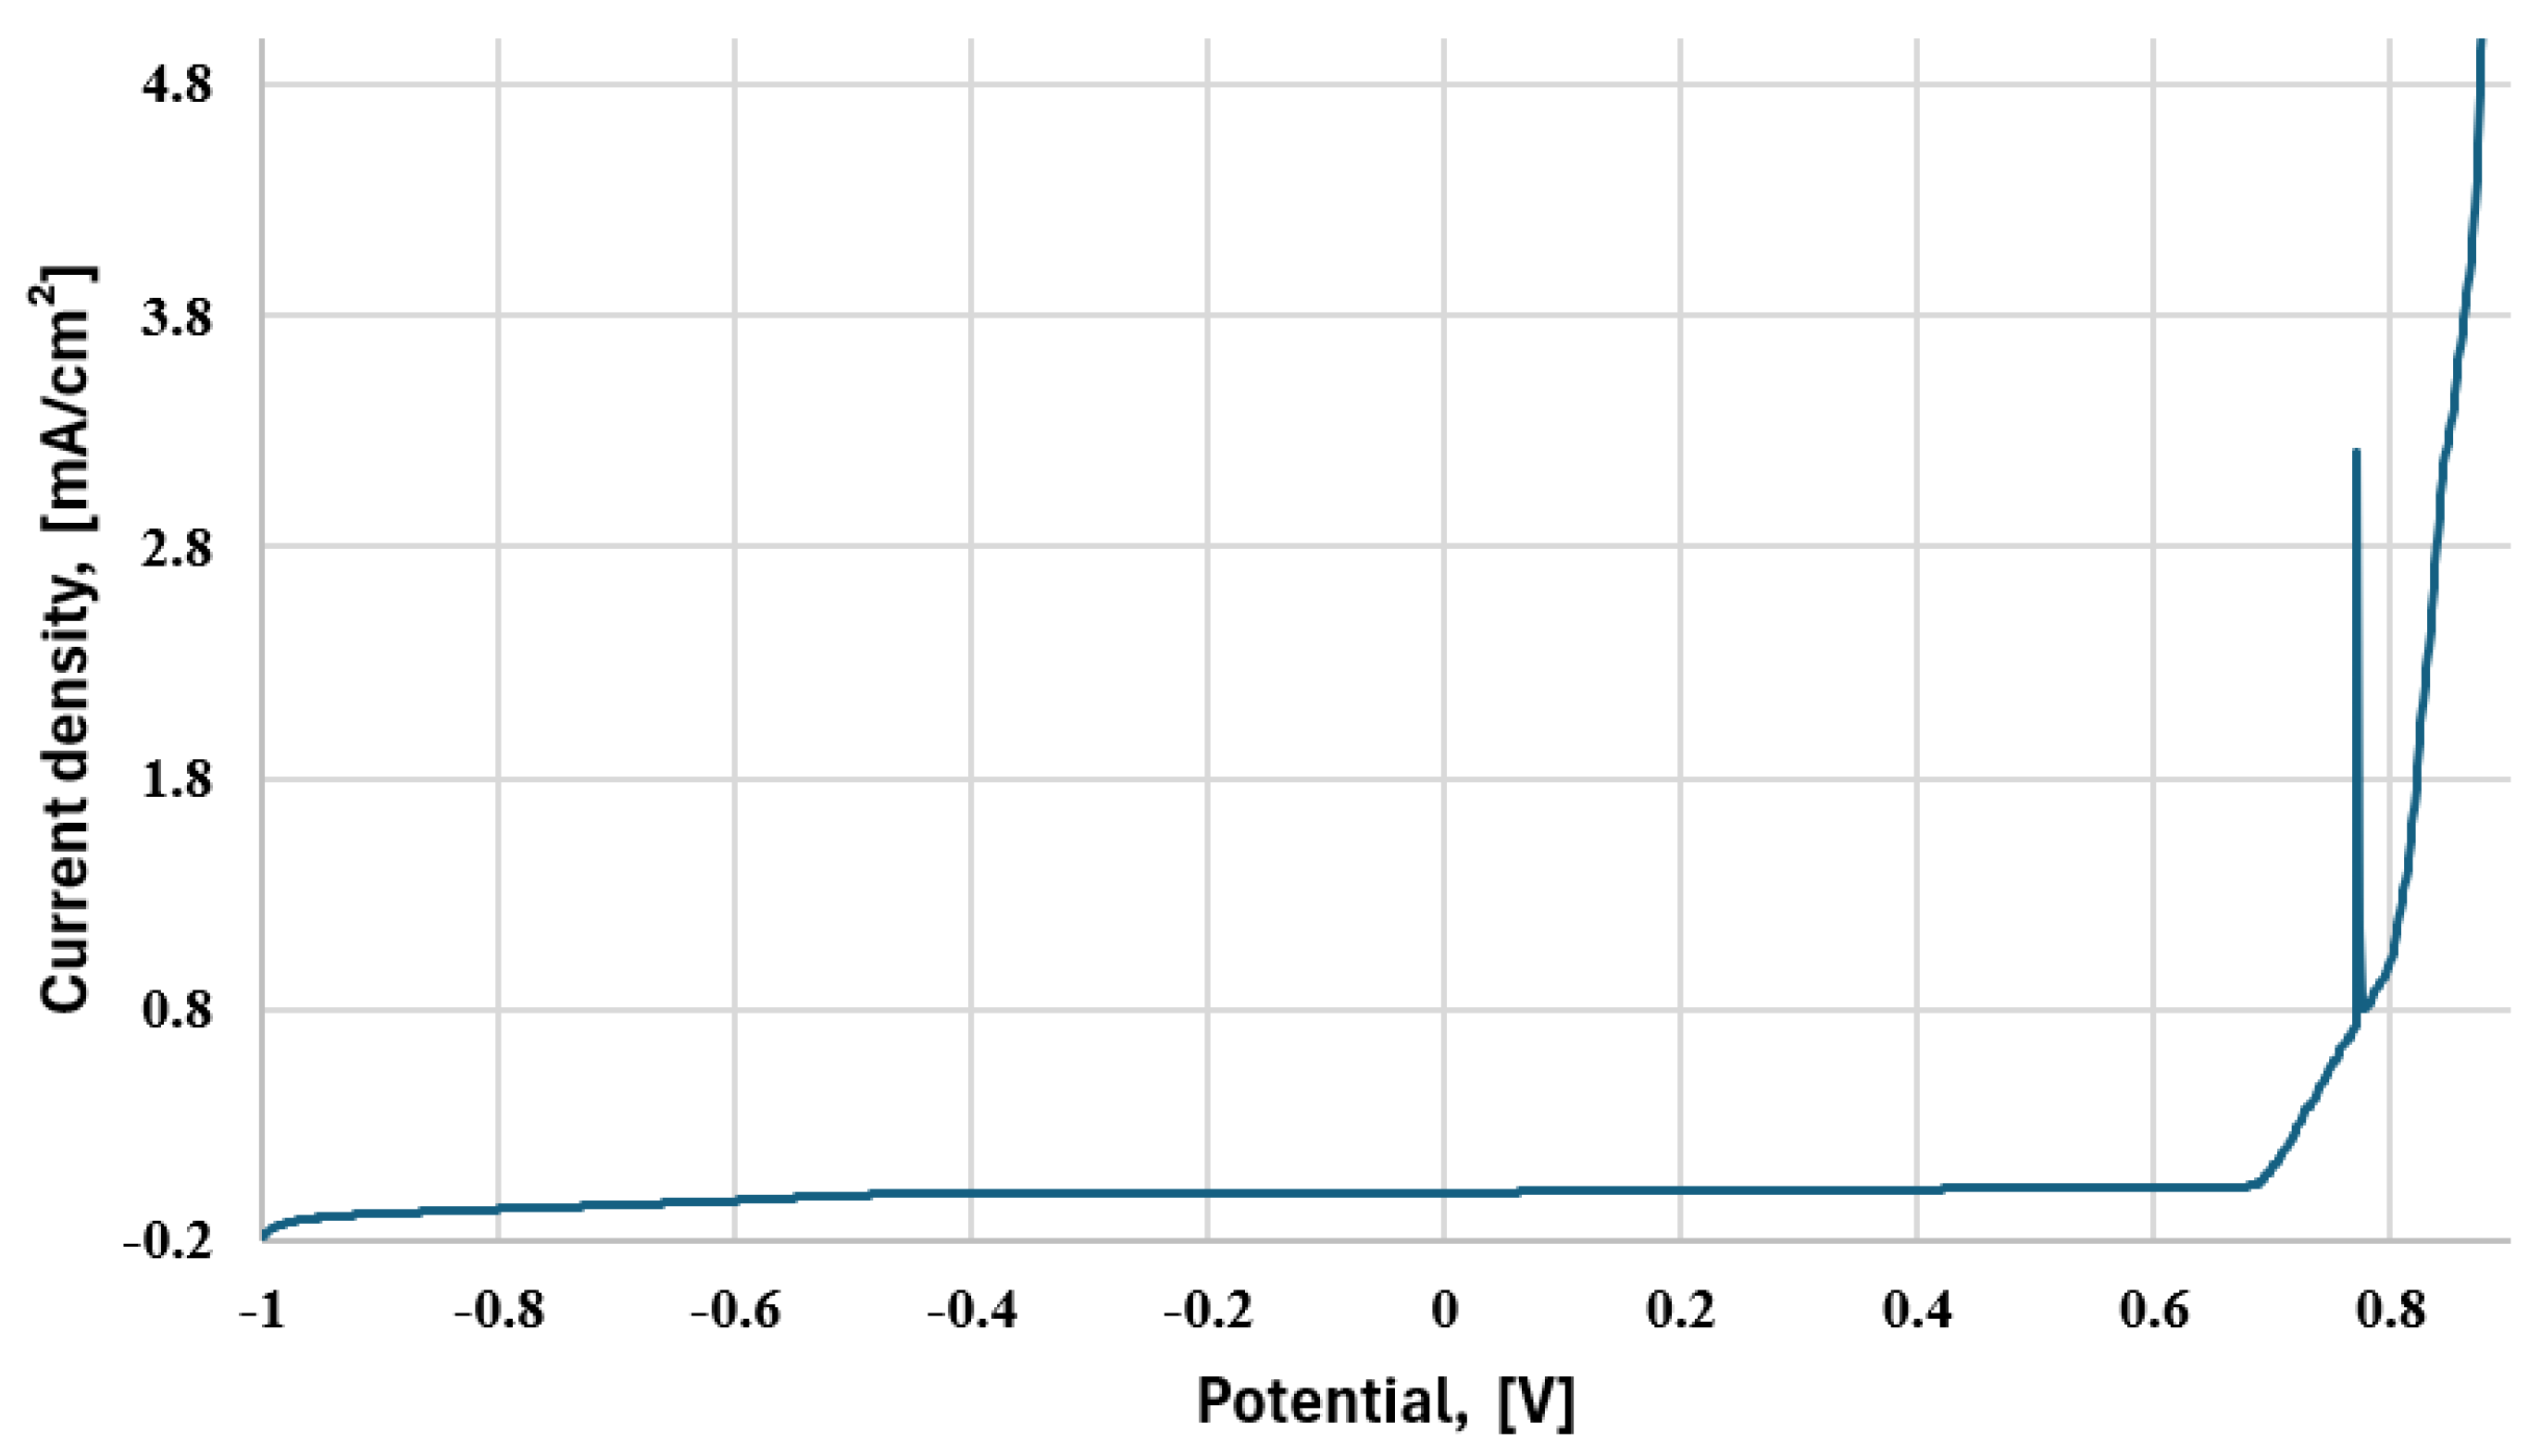
Figure 4 shows for exemplification the polarization curve for F1 material and Figure 5 shows the Tafel curves obtained after testing the samples made of cast-iron materials.
The determined parameters for the samples tested in cement paste are presented in Table 5, and the comparison between corrosion rates in Figure 6.
The corrosion current density icorr represents the rate at which corrosion occurs. Higher values indicate a higher rate of corrosion. The corrosion potential Ecor represents the thermodynamic tendency for corrosion to occur. More negative values indicate a higher tendency for corrosion. F3 has the most negative corrosion potential, suggesting it is the most susceptible to corrosion among the three samples. The anodic Tafel slope βA reflects the rate of anodic dissolution during corrosion. Higher values suggest a higher rate of anodic dissolution. F3 shows the highest value, indicating a potentially higher rate of anodic dissolution compared to F1 and F2. The cathodic Tafel slope βC reflects the rate of cathodic reduction during corrosion. F2 shows the most negative value, suggesting potentially faster cathodic reduction compared to F1 and F3. This observation can be correlated with the values of corrosion rate, observing that F3 present the highest corrosion rate, 3.2 and 3.6 times greater than F1 and F2 respectively. This conclusion is in accordance with the previous work of the authors [16] where the same materials were used for tribological tests in different environments (mixture of mineral aggregate, sand, cement, and water), using Baroid tribometer and it was found tha the cast iron with 9% Cr had the lowest abrasive wear resistance in all testing environments. Also, in another investigation performed by the authors [18] it was concluded that blade made of F2 material had the smallest corrosion rate compared to blades made from F1 and F3 cast iron, and therefore the best wear resistance for all values of blade inclination angle.
Among the steel samples, sample C shows the lowest corrosion rate (3.99 µm/year), indicating that it has the best corrosion resistance in cement paste, while sample A has the highest corrosion rate (16.04 µm/year).
Generally, steel samples exhibit a wide range of corrosion rates [50] (from 3.99 µm/year to 16.04 µm/year), with some (B′, C and D) performing better than cast iron.

3.2. Testing of Materials Used for Rotary Dryers (in Water)

In Table 6 are presented the parameters obtained from the experimental tests (in water environment) for the steels used in manufacturing of rotary dryers.
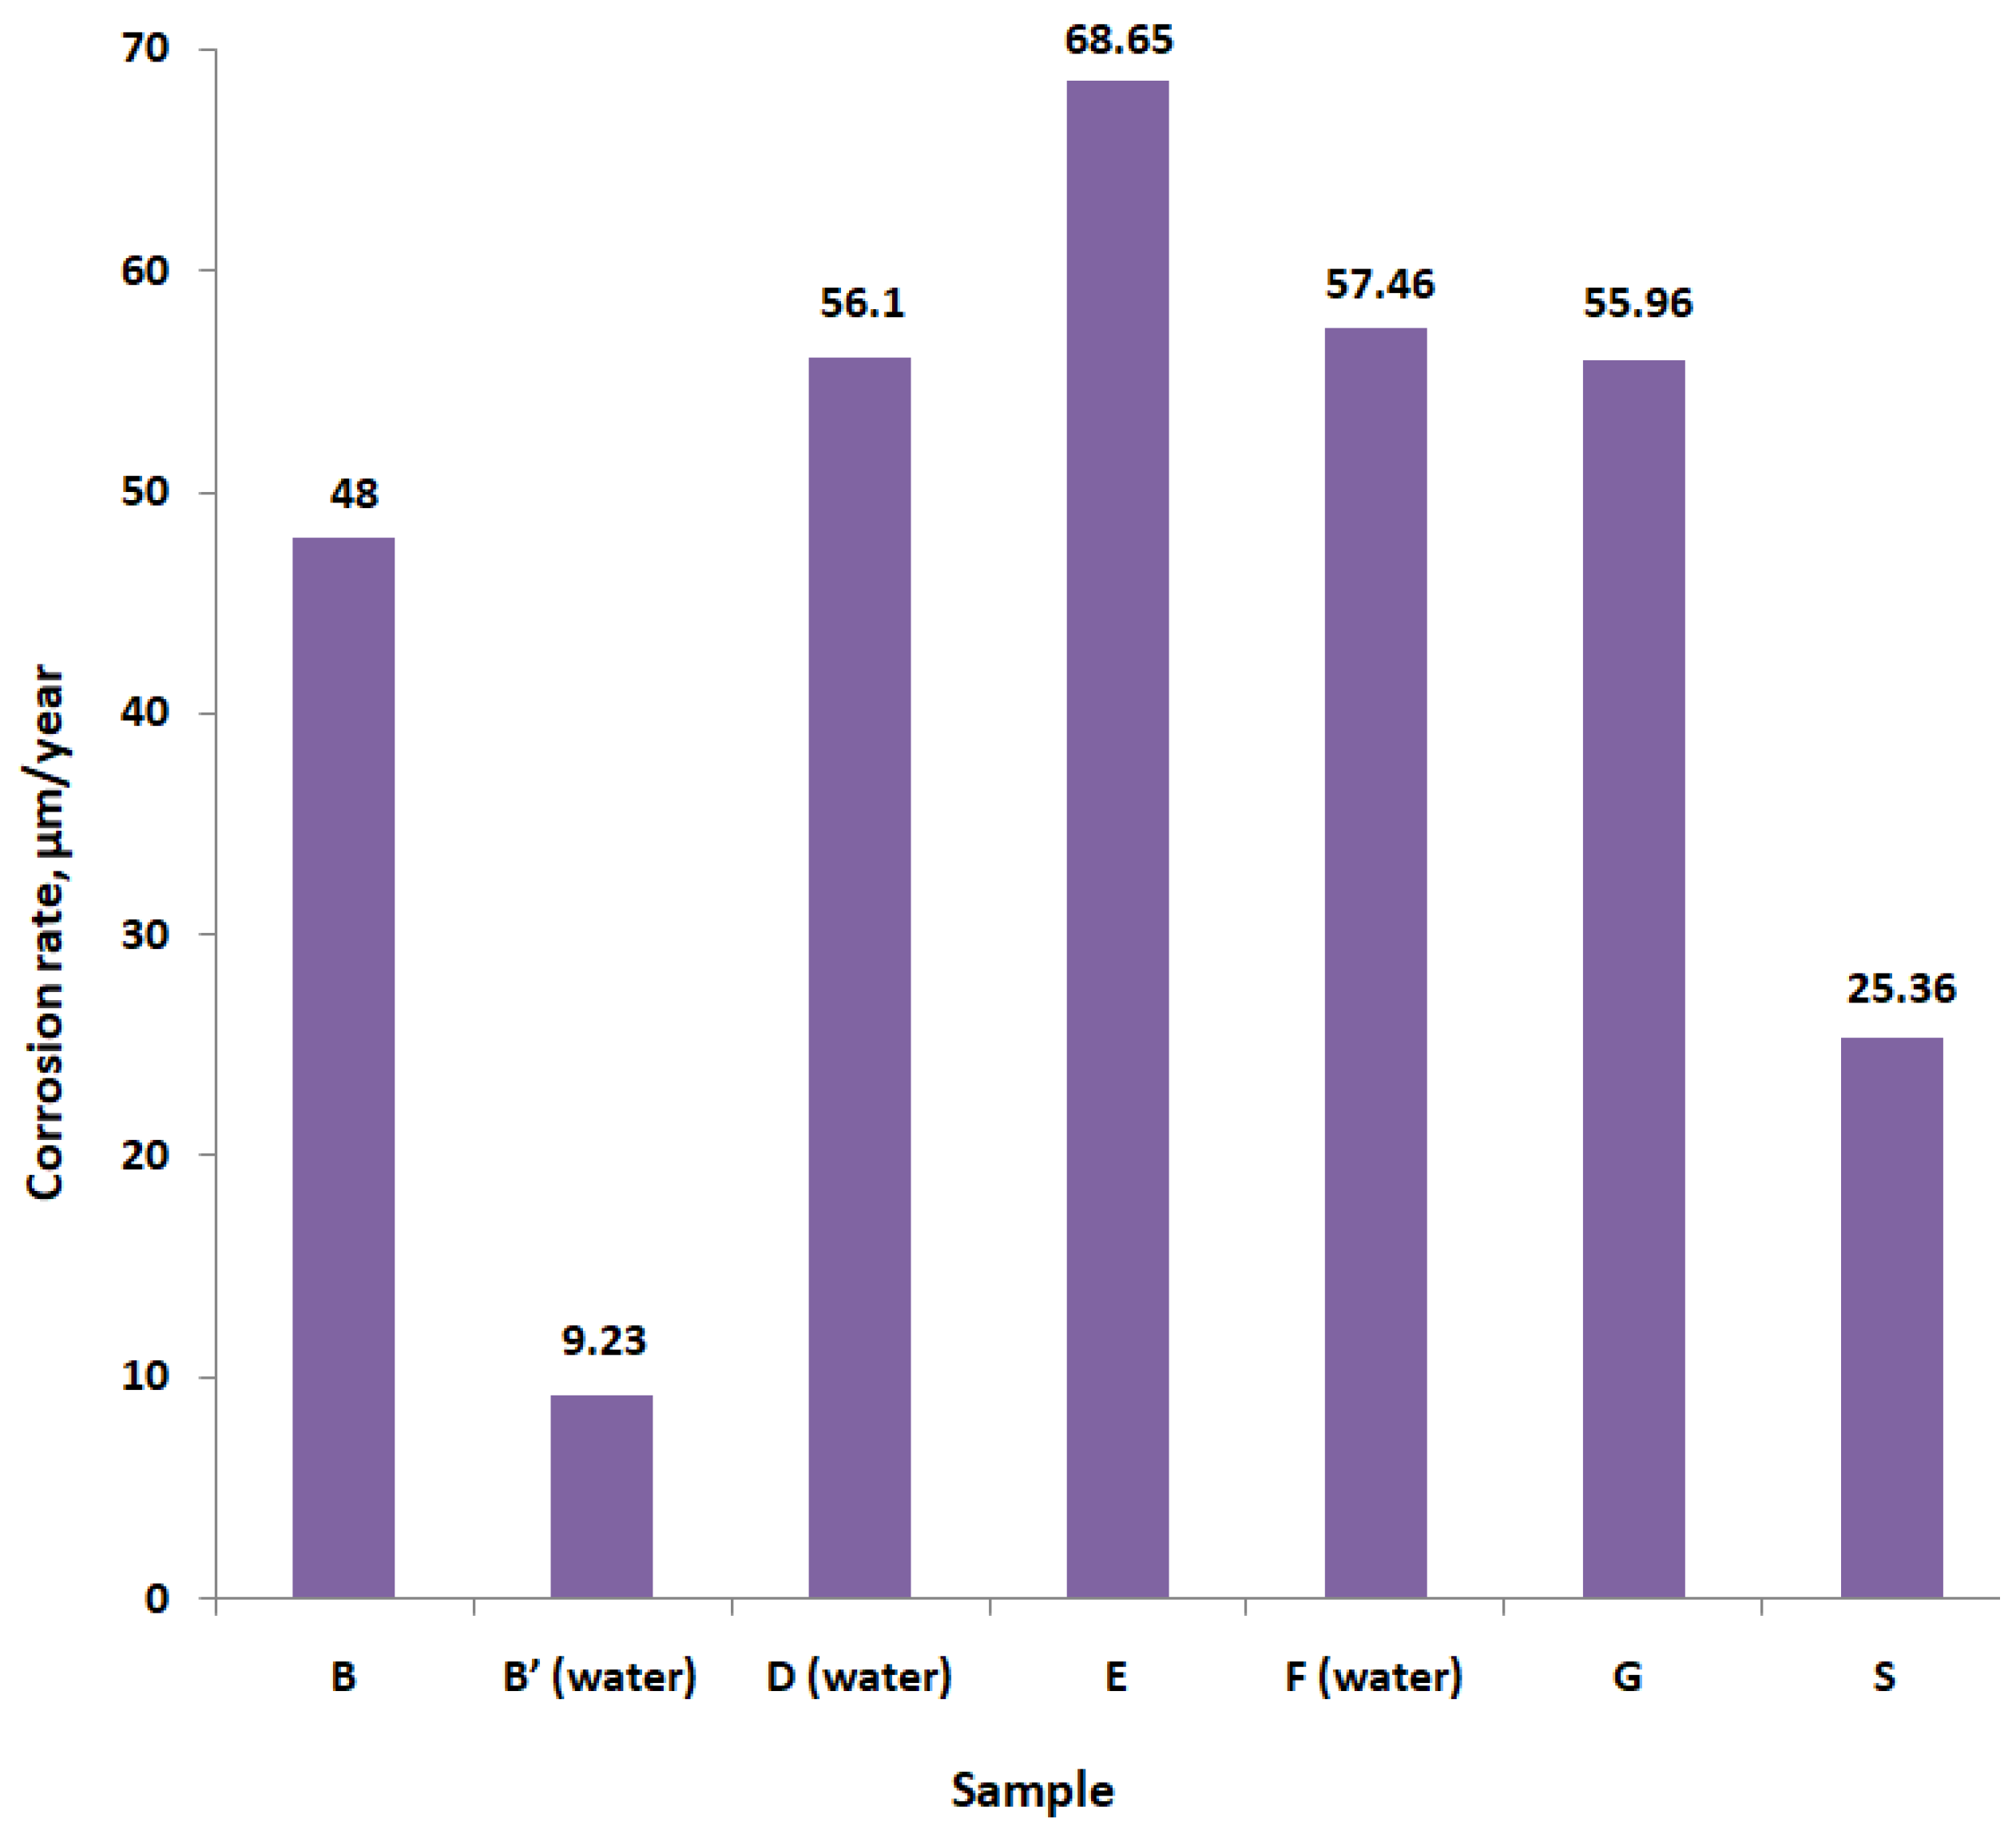
The corrosion rates vary significantly across different materials (see Figure 7). For example, sample E exhibits the highest corrosion rate (68.65 μm/year), while sample B′ shows the lowest corrosion rates (9.23 μm/year). Therefore, for the flights of rotary dryers used to dry mineral aggregates, sample B′ is the most suitable due to its good corrosion resistance. Samples E, D, F, and G are not recommended due to their high corrosion rates, while samples B and S offer moderate performance. Also, it was found that substituting steel S (S235) with steel B′ (P265GH) can decrease the corrosion rate by nearly 65% due to several key differences in their chemical compositions. P265GH has a significantly lower carbon content (0.072% vs. 0.171%), which reduces carbide formation that can deplete protective chromium. It also has lower manganese (0.51% vs. 1.37%), minimizing the formation of less protective manganese oxides. Additionally, P265GH contains higher levels of chromium (0.12% vs. 0.0279%), nickel (0.09% vs. 0.0205%), and copper (0.08% vs. negligible), which enhance the formation and stability of a protective oxide film on the steel surface. This oxide film acts as a barrier against corrosive elements in water, significantly improving corrosion resistance. Thus, the optimized alloying elements in P265GH result in a much lower corrosion rate compared to S235 when exposed to water.
Comparing the data from Figure 6 and Figure 7, it can be observed that corrosion rates also vary depending on the testing environment. Materials tested in water generally exhibit higher corrosion rates compared to those tested in cement paste. For instance, material B shows a corrosion rate of 48 μm/year in water, significantly higher (5.41 times) than its corrosion rate of 8.87 μm/year in cement paste. Steel B′ revealed 1.43 times higher corrosion rate in water compared with cement paste, while steel F presents very big differences between water and cement paste environment (corrosion rate is 6.9 times greater in water).
This observation highlights the importance of considering the environment in which materials will be used, as different environments can accelerate corrosion processes.

4. Conclusions

Industrial applications specific to concrete industry present challenges in the choice of metallic materials. The appropriate choice of materials leads to an increase in the operating life of equipment and cost reduction.
The corrosion rate data provides valuable guidance for material selection in various applications. Materials with lower corrosion rates are preferable for environments where corrosion is a concern, as they offer greater durability and longer service life. Understanding the corrosion behavior of different materials in specific environments allows engineers and designers to make informed decisions when selecting materials for construction, infrastructure, and industrial applications.
The research results presented in this paper demonstrate that, in some applications, material testing can provide economical solutions for equipment components in the concrete industry. Proposals to replace cast irons, used in the manufacture of concrete mixing blades, with steels are justified in specific situations: corrective/accidental maintenance works; situations involving the reduction of spare parts costs; use the equipment for a short time. It is observed that, in such cases, steels of type B′ and C offer—from the point of view of corrosion resistance—similar results to cast iron.
Similarly, for use in mineral aggregate driers, judicious choice of steels can lead to considerable reductions in operating costs (including maintenance) and increased equipment durability. The results obtained by the authors show that it is beneficial to replace steel S with steel B′, reducing the corrosion rate by almost 65%.
For a correct decision, the results of corrosion tests (as presented in this article) must be combined with the results of wear tests [1,18], specific to the operation of the studied equipment. In this way, pertinent and complete conclusions can be drawn regarding the choice of technological solutions.
Further research could explore the underlying factors contributing to the observed differences in corrosion rates across materials and environments.
Investigating the microstructure, composition, and surface characteristics of the materials could provide insights into their corrosion resistance mechanisms and help optimize material properties for enhanced performance.

Author Contributions

Conceptualization, R.G.R. and M.G.P.; methodology, R.G.R. and M.G.P.; validation, R.G.R. and M.G.P.; formal analysis, M.G.P.; investigation, R.G.R., M.G.P., E.L., M.T., A.N. and A.B.; resources, A.N. and A.B.; writing—original draft preparation, E.L. and M.T.; writing—review and editing, M.T.; visualization R.G.R. and M.G.P.; supervision, M.G.P. All authors have read and agreed to the published version of the manuscript.

Funding

This research received no external funding.

Institutional Review Board Statement

Not applicable.

Informed Consent Statement

Not applicable.

Data Availability Statement

Data are contained within the article.

Conflicts of Interest

The authors declare no conflicts of interest.

References

  1. Burlacu, A.; Gabriel Petrescu, M.; George Rîpeanu, R.; Dumitru, T.; Victor Laudacescu, E.; Naim Ramadana, I.; Niță, A. Experimental Investigations on Wear Phenomena Specific to Rotary Dryer Flights (Blades). Tribol. Ind. 2024, 46, 56–65. [Google Scholar] [CrossRef]
  2. Revol, D.; Briens, C.L.; Chabagno, J.M. The Design of Flights in Rotary Dryers. Powder Technol. 2001, 121, 230–238. [Google Scholar] [CrossRef]
  3. Ghasemi, A.; Hasankhoei, A.; Parsapour, G.; Razi, E.; Banisi, S. A Combined Physical and DEM Modelling Approach to Improve Performance of Rotary Dryers by Modifying Flights Design. Dry. Technol. 2021, 39, 548–565. [Google Scholar] [CrossRef]
  4. Karali, M.A.; Specht, E.; Herz, F.; Mellmann, J.; Refaey, H.A. Unloading Characteristics of Flights in a Flighted Rotary Drum Operated at Optimum Loading. Powder Technol. 2018, 333, 347–352. [Google Scholar] [CrossRef]
  5. Nascimento, S.M.; Santos, D.A.; Barrozo, M.A.S.; Duarte, C.R. Solids Holdup in Flighted Rotating Drums: An Experimental and Simulation Study. Powder Technol. 2015, 280, 18–25. [Google Scholar] [CrossRef]
  6. Karali, M.A.; Sunkara, K.R.; Herz, F.; Specht, E. Experimental Analysis of a Flighted Rotary Drum to Assess the Optimum Loading. Chem. Eng. Sci. 2015, 138, 772–779. [Google Scholar] [CrossRef]
  7. Silveira, J.C.; Lima, R.M.; Brandao, R.J.; Duarte, C.R.; Barrozo, M.A.S. A Study of the Design and Arrangement of Flights in a Rotary Drum. Powder Technol. 2022, 395, 195–206. [Google Scholar] [CrossRef]
  8. Ilhan, E.; Findik, F.; Aslanlar, S. An Investigation of the Factors Affecting the Design of Drum Dryers. Mater. Des. 2003, 24, 503–507. [Google Scholar] [CrossRef]
  9. Fasano, J.; Janz, E.E.; Myers, K. Design Mixers to Minimize Effects of Erosion and Corrosion Erosion. Int. J. Chem. Eng. 2012, 2012, 1–8. [Google Scholar] [CrossRef]
  10. Yao, Z.; Yang, R.; Yuan, W.; An, H. Mechanical analysis and optimal design of mixing paddlesforcsam Mixers. Acad. J. Manuf. Eng. 2019, 17, 80–86. [Google Scholar]
  11. Khidir, T.C. Designing, Remodeling and Analyzing the Blades of Portable Concrete Mixture. Int. J. Mech. Eng. Robot. Res. 2018, 7, 674–678. [Google Scholar] [CrossRef]
  12. Jungedal, M. Mild Impact Wear in a Concrete Mixer, an Evaluation of Wet Abrasive Wear. Master’s Thesis, Royal Institute of Technology Department of Material Science and Engineering SE–100 44, Stockholm, Sweden, 2012. [Google Scholar]
  13. Zhang, H.; Feng, P.; Ying, W. Abrasive Wear and Optimal Installation Angle of Concrete Double-Horizontal Shaft Mixer Stirring Blades. SN Appl. Sci. 2020, 2, 1067. [Google Scholar] [CrossRef]
  14. Valigi, M.C.; Logozzo, S.; Rinchi, M. Wear Resistance of Blades in Planetary Concrete Mixers. Part II: 3D Validation of a New Mixing Blade Design and Efficiency Evaluation. Tribol. Int. 2016, 103, 37–44. [Google Scholar] [CrossRef]
  15. Valigi, M.C.; Logozzo, S.; Rinchi, M. Wear Resistance of Blades in Planetary Concrete Mixers. Design of a New Improved Blade Shape and 2D Validation. Tribol. Int. 2016, 96, 191–201. [Google Scholar] [CrossRef]
  16. Niță, A.; Petrescu, M.G.; Dumitru, T.; Burlacu, A.; Tănase, M.; Laudacescu, E.; Ramadan, I. Experimental Research on the Wear Behavior of Materials Used in the Manufacture of Components for Cement Concrete Mixers. Materials 2023, 16, 2326. [Google Scholar] [CrossRef]
  17. Labiapari, W.S.; Gonçalves, R.J.; De Alcântara, C.M.; Pagani, V.; Di Cunto, J.C.; De Mello, J.D.B. Understanding Abrasion-Corrosion to Improve Concrete Mixer Drum Performance: A Laboratory and Field Approach. Wear 2021, 477, 203830. [Google Scholar] [CrossRef]
  18. Niță, A.; Laudacescu, E.; Petrescu, M.G.; Dumitru, T.; Burlacu, A.; Bădoiu, D.G.; Tănase, M. Experimental Research Regarding the Effect of Mineral Aggregates on the Wear of Mixing Blades of Concrete Mixers. Materials 2023, 16, 5047. [Google Scholar] [CrossRef] [PubMed]
  19. Soleymani, H.R.; Ismail, M.E. Comparing Corrosion Measurement Methods to Assess the Corrosion Activity of Laboratory OPC and HPC Concrete Specimens. Cem. Concr. Res. 2004, 34, 2037–2044. [Google Scholar] [CrossRef]
  20. Garcia, E.; Torres, J.; Rebolledo, N.; Arrabal, R.; Sanchez, J. Corrosion of Steel Rebars in Anoxic Environments. Part I: Electrochemical Measurements. Materials 2021, 14, 2491. [Google Scholar] [CrossRef]
  21. Elsener, B. Corrosion Rate of Steel in Concrete—Measurements beyond the Tafel Law. Corros. Sci. 2005, 47, 3019–3033. [Google Scholar] [CrossRef]
  22. Sanusi, M.S.; Shamsudin, S.R.; Rahmat, A.; Wardan, R. Electrochemical Corrosion Behaviours of AISI 304 Austenitic Stainless Steel in NaCl Solutions at Different pH; AIP Publishing: Ho Chi Minh, Vietnam, 2018; p. 020116. [Google Scholar]
  23. Fahim, A.; Dean, A.E.; Thomas, M.D.A.; Moffatt, E.G. Corrosion Resistance of Chromium-steel and Stainless Steel Reinforcement in Concrete. Mater. Corros. 2019, 70, 328–344. [Google Scholar] [CrossRef]
  24. Andrade, C.; Alonso, C. Test Methods for On-Site Corrosion Rate Measurement of Steel Reinforcement in Concrete by Means of the Polarization Resistance Method. Mat. Struct. 2004, 37, 623–643. [Google Scholar] [CrossRef]
  25. Dubuc, B.; Ebrahimkhanlou, A.; Salamone, S. Corrosion Monitoring of Prestressed Concrete Structures by Using Topological Analysis of Acoustic Emission Data. Smart Mater. Struct. 2019, 28, 055001. [Google Scholar] [CrossRef]
  26. Ming, J.; Shi, J. Distribution of Corrosion Products at the Steel-Concrete Interface: Influence of Mill Scale Properties, Reinforcing Steel Type and Corrosion Inducing Method. Constr. Build. Mater. 2019, 229, 116854. [Google Scholar] [CrossRef]
  27. Chang, Z.-T.; Cherry, B.; Marosszeky, M. Polarisation Behaviour of Steel Bar Samples in Concrete in Seawater. Part 2: A Polarisation Model for Corrosion Evaluation of Steel in Concrete. Corros. Sci. 2008, 50, 3078–3086. [Google Scholar] [CrossRef]
  28. Otieno, M.; Ikotun, J.; Ballim, Y. Experimental Investigations on the Influence of Cover Depth and Concrete Quality on Time to Cover Cracking Due to Carbonation-Induced Corrosion of Steel in RC Structures in an Urban, Inland Environment. Constr. Build. Mater. 2019, 198, 172–181. [Google Scholar] [CrossRef]
  29. Lambert, P.; Page, C.L.; Vassie, P.R.W. Investigations of Reinforcement Corrosion. 2. Electrochemical Monitoring of Steel in Chloride-Contaminated Concrete. Mater. Struct. 1991, 24, 351–358. [Google Scholar] [CrossRef]
  30. González, J.A.; Miranda, J.M.; Feliu, S. Considerations on Reproducibility of Potential and Corrosion Rate Measurements in Reinforced Concrete. Corros. Sci. 2004, 46, 2467–2485. [Google Scholar] [CrossRef]
  31. Meng, D.; Lin, S.; Azari, H. Nondestructive Corrosion Evaluation of Reinforced Concrete Bridge Decks with Overlays: An Experimental Study. J. Test. Eval. 2020, 48, 516–537. [Google Scholar] [CrossRef]
  32. Gulikers, J. Statistical Interpretation of Results of Potential Mapping on Reinforced Concrete Structures. Eur. J. Environ. Civ. Eng. 2010, 14, 441–466. [Google Scholar] [CrossRef]
  33. Valipour, M.; Shekarchi, M.; Ghods, P. Comparative Studies of Experimental and Numerical Techniques in Measurement of Corrosion Rate and Time-to-Corrosion-Initiation of Rebar in Concrete in Marine Environments. Cem. Concr. Compos. 2014, 48, 98–107. [Google Scholar] [CrossRef]
  34. Ghods, P.; Isgor, O.B.; Pour-Ghaz, M. A Practical Method for Calculating the Corrosion Rate of Uniformly Depassivated Reinforcing Bars in Concrete. Mater. Corros. 2007, 58, 265–272. [Google Scholar] [CrossRef]
  35. Zou, Z.H.; Wu, J.; Wang, Z.; Wang, Z. Relationship between Half-Cell Potential and Corrosion Level of Rebar in Concrete. Corros. Eng. Sci. Technol. 2016, 51, 588–595. [Google Scholar] [CrossRef]
  36. Li, C.; Chen, Q.; Wang, R.; Wu, M.; Jiang, Z. Corrosion Assessment of Reinforced Concrete Structures Exposed to Chloride Environments in Underground Tunnels: Theoretical Insights and Practical Data Interpretations. Cem. Concr. Compos. 2020, 112, 103652. [Google Scholar] [CrossRef]
  37. ASTM G5-94; Standard Reference Test Method for Making Potentiostatic and Potentiodynamic Anodic Polarization Measurements. ASTM International: West Conshohocken, PA, USA, 2011.
  38. ASTM G1-90; Standard Practice for Preparing, Cleaning, and Evaluating Corrosion Test Specimens. ASTM: West Conshohocken, PA, USA, 1999.
  39. EN 10028-2:2003; Flat Products Made of Steels for Pressure Purposes—Part 2: Non-Alloy and Alloy Steels with Specified Elevated Temperature Properties. European Committee for Standardization: Brussels, Belgium, 2003.
  40. ASME SA-516; Specification for Pressure Vessel Plates, Carbon Steel, for Moderate- and Lower Temperature Service. ASTM International: New York, NY, USA, 2017.
  41. EN 10088-2:2005; Stainless Steels—Part 2: Technical Delivery Conditions for Sheet/Plate and Strip of Corrosion Resisting Steels for General Purposes. European Committee for Standardization: Brussels, Belgium, 2005.
  42. ASTM A29/A29M-23; Standard Specification for General Requirements for Steel Bars, Carbon and Alloy, Hot-Wrought. ASTM International: West Conshohocken, PA, USA, 2023.
  43. EN 10083; Steels for Quenching and Tempering. European Committee for Standardization: Brussels, Belgium, 2006.
  44. EN 10025; Hot Rolled Products of Structural Steels. European Committee for Standardization: Brussels, Belgium, 2019.
  45. Mansfeld, F. Simultaneous Determination of Instantaneous Corrosion Rates and Tafel Slopes from Polarization Resistance Measurements. J. Electrochem. Soc. 1973, 120, 515. [Google Scholar] [CrossRef]
  46. von Baeckmann, W.; Schwenk, W.; Prinz, W.; von Baeckmann, W. (Eds.) Handbook of Cathodic Corrosion Protection: Theory and Practice of Electrochemical Protection Processes, 3rd ed.; Gulf Professional Publishing: Houston, TX, USA, 1997; ISBN 978-0-88415-056-5. [Google Scholar]
  47. Ripeanu, R.G.; Ispas, V.; Ispas, D. Austenitic Stainless Steel Type AISI 316L Corrosive Behavior in Hair Shampoo Medium. J. Balk. Tribol. Assoc. 2012, 18, 36–43. [Google Scholar]
  48. Dudu, C.; Drumeanu, A.C.; Ripeanu, R.G.; Dinita, A. Some Considerations Regarding the Influence of Working Conditions on the Corrosion Wear of the Injection Water Treatment Plant Equipment. IOP Conf. Ser. Mater. Sci. Eng. 2020, 724, 012033. [Google Scholar] [CrossRef]
  49. Eškinja, M.; Moshtaghi, M.; Hönig, S.; Zehethofer, G.; Mori, G. Investigation of the Effects of Temperature and Exposure Time on the Corrosion Behavior of a Ferritic Steel in CO2 Environment Using the Optimized Linear Polarization Resistance Method. Results Mater. 2022, 14, 100282. [Google Scholar] [CrossRef]
  50. Ahlström, J. Corrosion of Steel in Concrete at Various Moisture and Chloride Levels. Ph.D. Thesis, Division of Building Materials. LTH, Lund University, Lund, Sweden, 2014. [Google Scholar]
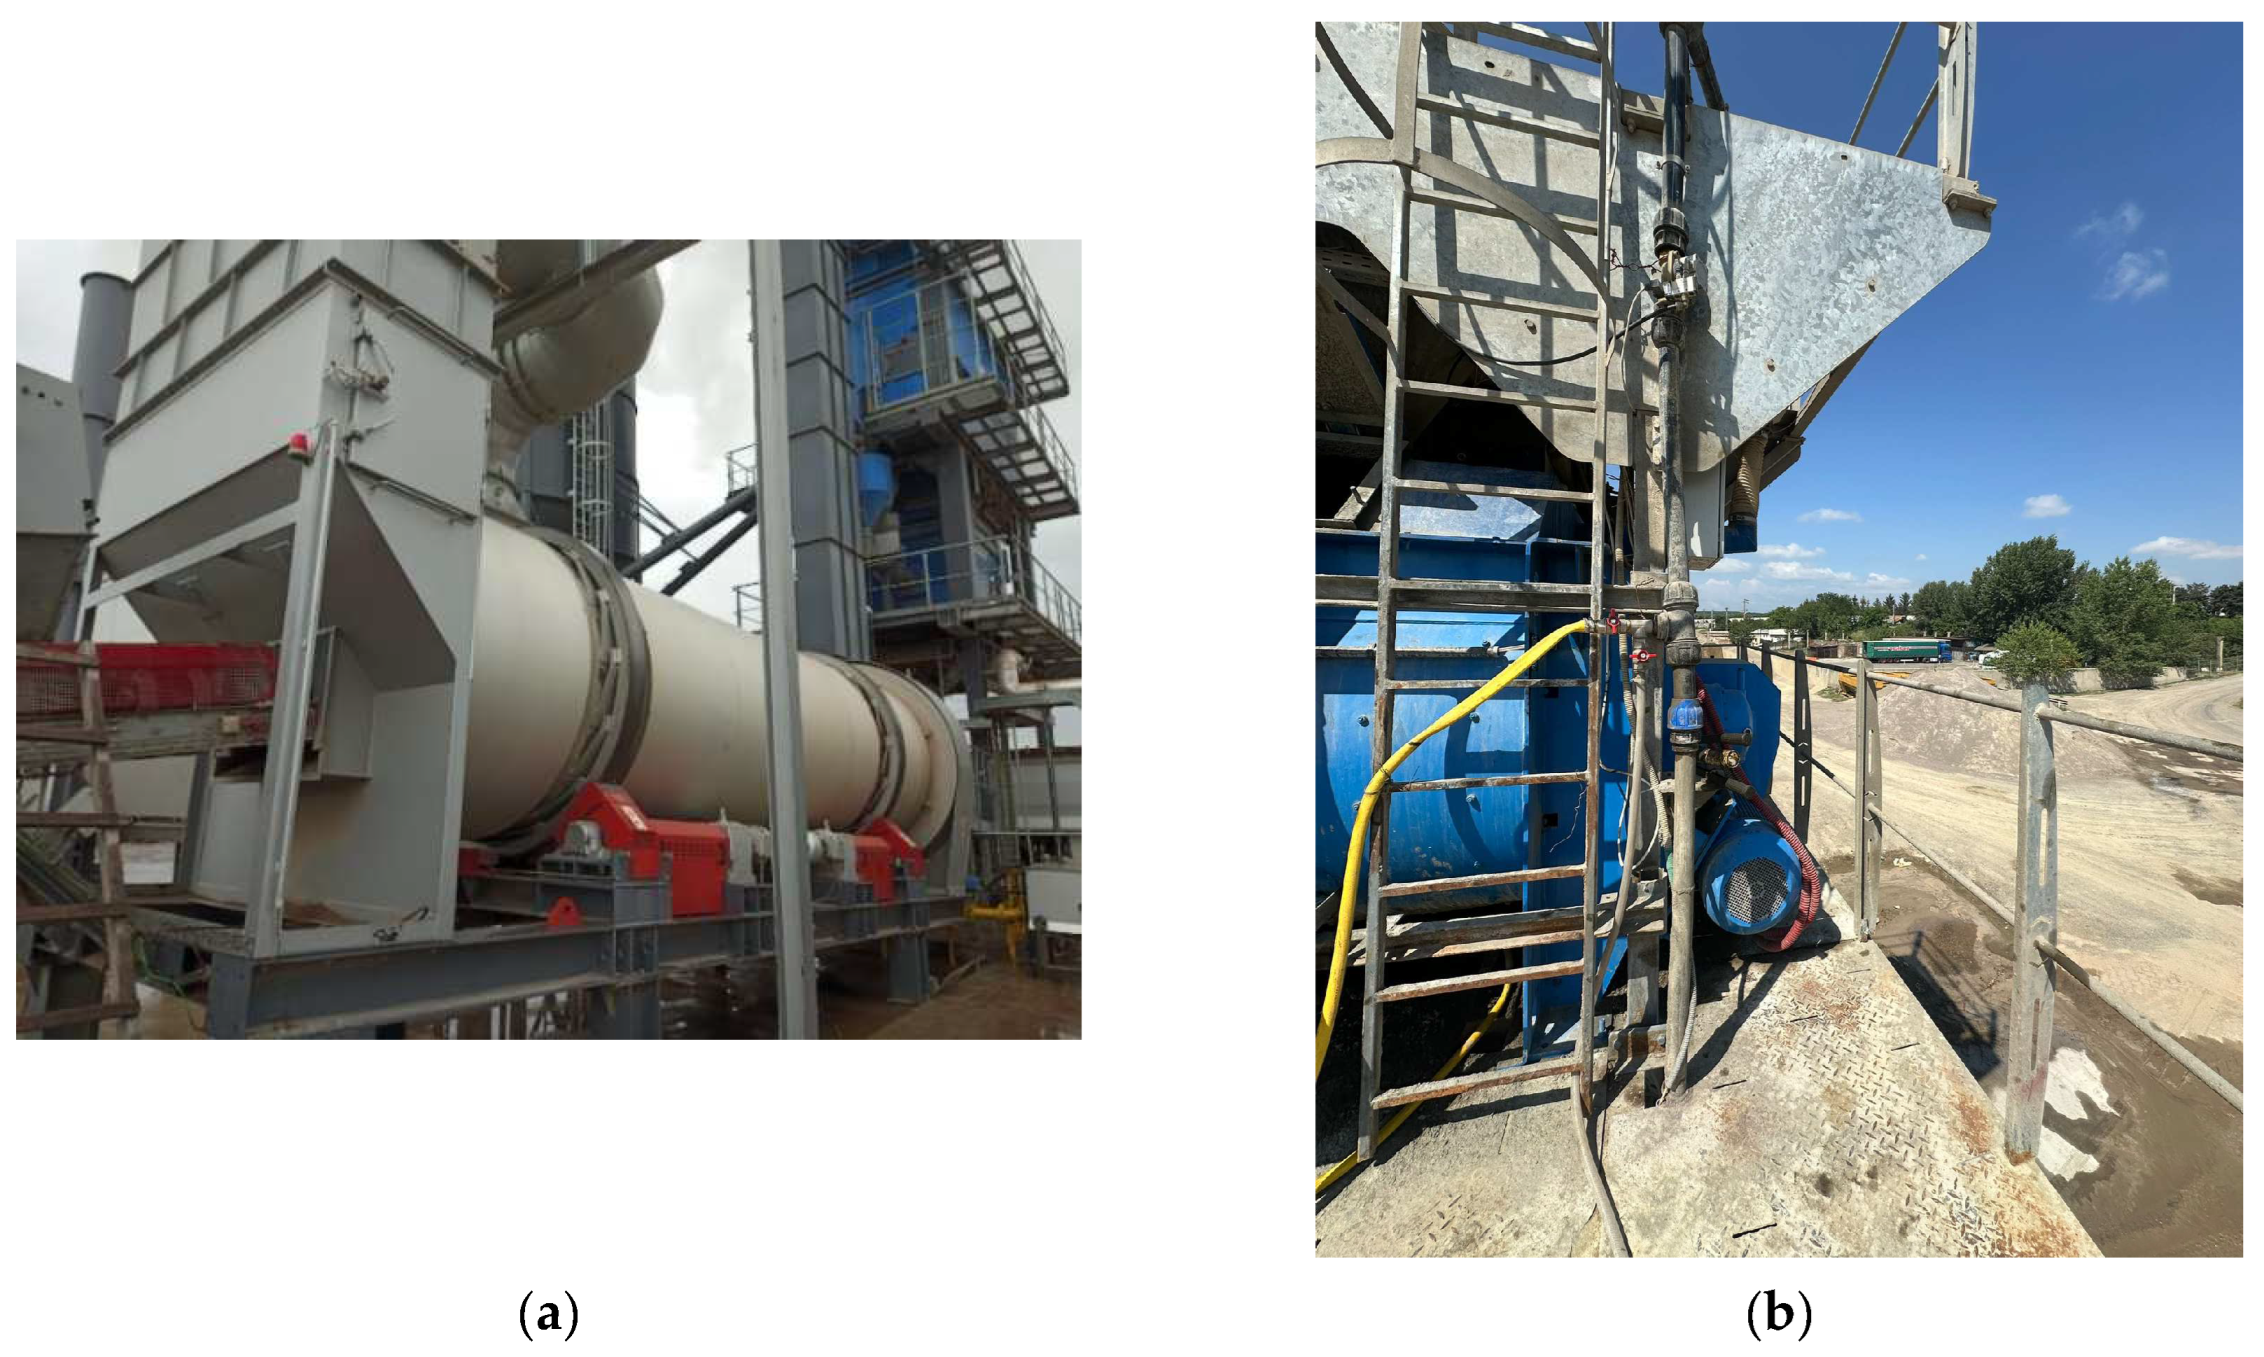
Figure 1. Concrete industry equipment: (a) rotary dryer; (b) concrete mixer.
Coatings 14 00800 g001
Figure 2. Corrosion cell.
Coatings 14 00800 g002
Figure 3. The flights of rotary dryer.
Coatings 14 00800 g003
Figure 4. Polarization curve for F1 cast iron.
Coatings 14 00800 g004
Figure 5. Tafel plots for cast iron samples.
Coatings 14 00800 g005
Figure 6. Corrosion rate determined for the samples tested in cement paste.
Coatings 14 00800 g006
Figure 7. The values of corrosion rate determined for the samples tested in water.
Coatings 14 00800 g007
Table 1. The chemical composition of the cast iron samples [18].
SampleChemical Composition, wt.%
CSiPSCrMnFeNiMo
F13.280.760.070.033.831.1089.860.890.20
F23.720.740.020.0425.650.8768.190.0400.35
F33.080.960.040.039.771.1484.120.350.49
Table 2. The microstructures and hardness values for the cast iron samples [16].
SampleSample MicrostructureHardness HV0.2
(Average of Three Measurements)
Occupied Surface by the Hard Constituents, %Hardness HV0.2, (Weighted Average)
MatrixCarbide
1Coatings 14 00800 i001
Low cast iron alloyed with Cr (4%),
pearlite, ledeburites, and secondary cementites
31864444.986464.654
2Coatings 14 00800 i002
High cast iron alloyed with Cr (25%), austenitic structure with carbides
718163255.8541228.505
3Coatings 14 00800 i003
Medium cast iron alloyed with Cr (9%),
pearlite, secondary cementite, and ledeburite
46279950.739632.990
Table 3. Chemical composition of steel samples.
Steel Chemical Composition, wt.%
FeCSiMnPSCrMoNiAlCoCuNbTiVW
A
P355GH: EN10028 [39] (ASME SA 516 GRADE 70 [40])
97.3840.2640.1751.2290.0130.0050.3620.0400.1810.0200.0100.2560.0020.0440.0050.010
B
X5CrNi18-10 (1.4301): EN 10088 [41] (AISI 304)
72.1510.080.1101.2600.0060.00318.0100.0208.030-0.1300.0900.0100.0900.010-
B′
P265GH (1.0425): EN 10028 [39]
98.6590.0720.0980.510.0070.0040.120.030.09-0.140.080.010.120.06-
C
(AISI 4140 ASTM A29 [42]/42Cr4Mo2 EN 10083 [43]; rolled semi-finished product, thickness s = 4 mm
98.2910.2890.2520.4680.0110.0030.3400.0200.0300.0350.0070.0260.0400.1100.0580.020
D
AISI 4140 ASTM A29 [42]/42Cr4Mo2 EN 10083 [43];
rolled semi-finished product, thickness s = 3 mm)
97.7750.1740.0341.3900.0100.0030.070.00170.060.021-0.230.00040.140.09-
E
(S275 EN 10025 [44]; laminated semi-finished product, thickness s = 2 mm)
98.7210.0750.0040.2680.0210.0110.1700.0400.130-0.100--0.3800.0500.030
F
(S185 EN 10025 [44]; laminated semi-finished product, thickness s = 2 mm)
98.4030.0510.0050.3000.0180.0130.2000.0600.270-0.340--0.2200.1100.010
G
G (S355 JR SR EN 10025 [44] laminated semi-finished product, thickness s = 4 mm
98.3900.0900.0400.7600.0140.0110.1300.0400.1400.0150.1000.1000.0100.0500.1000.010
S -flight material
(S235 EN 10025 [44]; Rolled semi-finished products, thickness s = 4 mm)
98.3800.17100.03201.3700.01060.00320.02790.00170.0.0205---0.0005-0.0029-
Table 4. The environments used for testing the steel samples.
Steel
Sample
ABB′CDEFGS
EnvironmentCement pasteCement paste/waterCement paste/waterCement pasteWaterWaterWater/
Cement paste
waterwater
Table 5. The parameters determined for samples tested in cement paste.
SampleParameter
icor,
μA/cm2
Ecor,
mV
βA,
mV
βC,
mV
CR,
μm/year
F10.685−383.155.7−56.87.96
F20.603−249.657.2−63.47.00
F32.198−43962.1−6025.55
A1.3804−449.357.3−65.316.04
B 0.7639−46885−388.87
B′ (cement paste)0.5525−565.718.3−41.96.42
C 0.3442−325.743.3−37.93.99
D (cement paste)0.6121−504.225.3−867.11
F (cement paste)0.7167−50058.3−558.32
Table 6. The parameters determined for samples tested in water.
SampleParameter
icor,
μA/cm2
Ecor,
mV
βA,
mV
βC,
mV
CR,
μm/Year
B4.1307−111.148.4−96.848.00
B′ (water)0.7942−378.358.7−539.23
D (water)4.8271−521.145.4−5956.1
E5.9076−527.536.6−58.368.65
F (water)4.9443−567.340.4−55.757.46
G 4.8157−576.443.5−64.455.96
S 2.1827−205.945.5−58.925.36
Disclaimer/Publisher’s Note: The statements, opinions and data contained in all publications are solely those of the individual author(s) and contributor(s) and not of MDPI and/or the editor(s). MDPI and/or the editor(s) disclaim responsibility for any injury to people or property resulting from any ideas, methods, instructions or products referred to in the content.